Kentucky’s - Southern Research · 2 Jeffery A. Turner is a Forester with the Forest Inventory and...
123
United States Department of Agriculture Forest Service Southern Research Station Resource Bulletin SRS–129 Kentucky’s Forests, 2004 Jeffery A. Turner, Christopher M. Oswalt, James L. Chamberlain, Roger C. Conner, Tony G. Johnson, Sonja N. Oswalt, and Kadonna C. Randolph
Transcript of Kentucky’s - Southern Research · 2 Jeffery A. Turner is a Forester with the Forest Inventory and...

United StatesDepartment of Agriculture
Forest Service
SouthernResearch Station
Resource BulletinSRS–129
Kentucky’s
Forests, 2004Jeffery A. Turner, Christopher M. Oswalt, James L. Chamberlain, Roger C. Conner,
Tony G. Johnson, Sonja N. Oswalt, and Kadonna C. Randolph

2
Jeffery A. Turner is a Forester with the Forest Inventory and Analysis Research Work Unit, Southern Research Station, Forest Service, U.S. Department of Agriculture, Knoxville, TN 37919.
Christopher M. Oswalt is a Forester with the Forest Inventory and Analysis Research Work Unit, Southern Research Station, Forest Service, U.S. Department of Agriculture, Knoxville, TN 37919.
James L. Chamberlain is a Research Forest Products Technologist with the Forest Products Conservation Work Unit, Southern Research Station, Forest Service, U.S. Department of Agriculture, Blacksburg, VA 24060.
Roger C. Conner is a Research Forester with the Forest Inventory and Analysis Research Work Unit, Southern Research Station, Forest Service, U.S. Department of Agriculture, Knoxville, TN 37919.
Tony G. Johnson is a Supervisory Forester with the Forest Inventory and Analysis Research Work Unit, Southern Research Station, Forest Service, U.S. Department of Agriculture, Knoxville, TN 37919.
Sonja N. Oswalt is a Forester with the Forest Inventory and Analysis Research Work Unit, Southern Research Station, Forest Service, U.S. Department of Agriculture, Knoxville, TN 37919.
Kadonna C. Randolph is a Mathematical Statistician with the Forest Inventory and Analysis Research Work Unit, Southern Research Station, Forest Service, U.S. Department of Agriculture, Knoxville, TN 37919.
Firepink is a common wildflower in Kentucky. (photo by John J. Cox)
Front cover: top left, Cumberland Falls in Cumberland Falls State Resort Park (photo by John J. Cox); top right, fall foliage, Pine Mountain (photo by Tom Barnes); bottom, jack in the pulpit (courtesy of Kentucky Division of Forestry). Back cover: top left, mature mixed hardwood forest (photo by Ray D.Campbell); top right, Cumberland Falls in Cumberland Falls State Resort Park (photo by John J. Cox); bottom, bull elk in eastern Kentucky (photo by John J. Cox).
About the Authors

i
Cumberland Falls in Cumberland Falls State Resort
Park. (photo by John J. Cox)
Kentucky’s
Forests, 2004Jeffery A. Turner, Christopher M. Oswalt, James L. Chamberlain, Roger C. Conner,
Tony G. Johnson, Sonja N. Oswalt, and Kadonna C. Randolph

ii
Leah W. MacSwords
Peter J. Roussopoulos
Leah W. MacSwordsKentucky State Forester and Director, Kentucky Division of Forestry
The Commonwealth of Kentucky celebrates a rich history rooted in its natural environment and a forest resource that is diverse and productive. The citizens of Kentucky receive multiple benefits from Kentucky’s extensive forest land, including timber and nontimber forest products, recreational opportunities, e.g. hiking, hunting, and camping, and clean air and water. With so much at stake and because the general public, policymakers, and managers need information that documents changes taking place in our forests, it is important to have the means for assessing the extent and condition of our forest resources. Since the 1930s, the Forest Service, U.S. Department of Agriculture has provided these means through the Forest Inventory and Analysis Program (FIA), which conducts inventories of public and private land, nationwide, at regular time intervals.
Over the last 10 years, FIA has approached this inventory work in an exciting new manner by forming partnerships with State forestry organizations. The working partnership between the Kentucky Division of Forestry and the Forest Service Southern Research Station FIA has strengthened and improved Kentucky’s forest inventory. The quality of this resource bulletin is a direct result of that sustained cooperation.
This bulletin contains information on the forest lands of the Commonwealth of Kentucky that can be used by decisionmakers, foresters, students, and researchers involved in forestry and forestry-related fields. Because forest resources are much more than just tree volume and numbers of trees, this bulletin includes information on forest health, ecological values, and socioeconomic benefits, and includes an evaluation of the goals and objectives of Kentucky forest landowners.
It is with great pride that we present this information about the forests of Kentucky. It is our goal that the partnership between our two organizations and the cooperative nature of this effort will continue to deliver the best information on the forests of Kentucky now and in the future.
Peter J. RoussopoulosDirector, Southern Research Station, Forest Service
Welcome...

iii
This resource bulletin consolidates data from the fifth survey of Kentucky’s forest resources by the Forest Service, U.S. Department of Agriculture. Data on the extent, condition, and classification of forest land and associated timber volumes, and on growth, removals, and mortality rates are described and interpreted. Data on forest health and the characteristics of forest landowners are evaluated also.
The fifth survey of Kentucky’s forests marks a shift in design, intensity, and timeliness of data collection. The Agricultural Research Extension and Education Reform Act of 1998 (Farm Bill) mandated annual surveys of U.S. forests. The annual surveys feature: (1) a nationally consistent, fixed-radius, four-point plot configuration; (2) a systematic national sampling design consisting of a base grid of about 6,000-acre hexagons; (3) integration of the forest inventory and forest health monitoring sample designs; (4) annual measurement of a fixed proportion of permanent plots; (5) reporting of data or data summaries within 6 months after yearly sampling; (6) a default 5-year moving average estimator, with provisions for optional estimators based on techniques for updating information; and (7) a summary report every 5 years. Additional information about annual surveys is available at http://www.fia.fs.fed.us.
In 1999, the Forest Inventory and Analysis Research Work Unit (FIA) of the Southern Research Station and the Kentucky Division of Forestry began implementing the new annual survey strategy in Kentucky. The strategy involves rotating measurements of five systematic samples (or panels), each of which represents about 20 percent of all plots in the Commonwealth. A panel may take more than or less than 1 year to complete. For Kentucky, data collection for all five panels was completed in 6 years. Four previous periodic inventories, completed in 1949, 1963, 1975, and 1988, provide statistics that can be used to
measure changes and trends over the past 55 years. This analysis focuses primarily on changes and trends in recent years and their implications for Kentucky’s forests.
Tabular data included in FIA reports are designed to provide a comprehensive array of forest resources statistics, but additional data are available to those who require more specialized information. The Forest Inventory and Analysis Database (FIADB) for the United States can be accessed directly via the Internet at http://www.ncrs2.fs.fed.us/4801/fiadb. Additional forest resource information on the Southern States is available on the Internet at http://www.srsfia2.fs.fed.us.
Information about any aspect of this survey may be obtained from:
Forest ServiceU.S. Department of AgricultureSouthern Research StationForest Inventory and Analysis4700 Old Kingston PikeKnoxville, TN 37919Phone: 865-862-2000
Acknowledgments
The Southern Research Station thanks the Kentucky Division of Forestry for its invaluable cooperation and assistance in conducting the survey. The station also thanks the other public agencies and private landowners who provided access to measurement plots.
The authors are grateful to Chris Woodall and Teague Prichard for their assistance with data compilation and processing of the forest health indicator variables. In addition the authors thank Richard Harper, Dr. James Rosson, and Dr. Jeff Stringer for their helpful reviews of earlier drafts of this bulletin.
The following people were responsible for collecting field data:
Kentucky Division of Forestry StaffJohn AndersonPeter BarberDevin BlackRaymond CampbellAmy CarmicleLynn ChaneyJosh FrazierBrandon HowardWilliam KnottKenyetta LindseyAdam McGuireCharles NobleJason PowellStephen RogersAmy SiewertTimothy SheehanRobert SloneBelinda SmithNicholas ValentineRobert WarwickAlan WattsMark WeidewitschJohn WilliamsKathleen WilliamsDoug WiremanConnie Woodcock
FIA StaffLinda BurkeTyler CamfieldRobert ClarkEric ClarkSarah CombsDavid CooneyDavid CrawfordJohanna D’ArcyLyndell DavidsonAndrew EdwardsMichael EhmenWilliam EllisDeborah FergusonChristopher FurrAnthony GadberryTrenton GirardPaul GuarnacciaDaniel HubbardDee HubbardKevin HughesKristen JohnsonBenjamin KoontzDavid LambertKarlis LazdaMike MakiChristopher MateJason McHanSharie McKibbenPaul NatiellaMike NorrisJarrod OglesbyKevin PackardRobert PointdexterMatthew PowellBrian SlagleBradley Totten
About Forest Inventory and Analysis Inventory Reports

iv
About Forest Inventory and Analysis Inventory Reports ...................................... iii
Acknowledgments .................................................................................................. iii
List of Figures ......................................................................................................... vi
List of Tables ........................................................................................................... viii
Highlights from the 2004 Report on Kentucky’s Forests ...................................... xiii
Forest Features ...................................................................................................... xiii
Tree Volume .......................................................................................................... xiii
Growth and Removals ........................................................................................... xiv
A Growing Population ........................................................................................... xiv
Kentucky’s Forest Landowners ............................................................................... xv
The Economic Impact of Kentucky’s Forests ............................................................ xv
Features of the Forest Land Base .......................................................................... 1
The Extent of Kentucky’s Forests ............................................................................. 1
Kentucky Land Classifications ................................................................................. 2
Forest Composition ............................................................................................... 3
Kentucky Forest Types ........................................................................................... 4
Natural and Planted Stands ................................................................................... 5
Stand Size ............................................................................................................. 7
Stand Age ............................................................................................................. 8
Tree Volume on Forest Land and Timberland ........................................................ 9
All Live-Tree Volume Dominated by Hardwoods ..................................................... 9
Growing-Stock Tree Volume ................................................................................... 10
Sawtimber Volume ................................................................................................ 12
Hardwood Sawtimber Volume Distribution by Tree Grade ...................................... 13
Net Annual Growth, Removals, and Mortality on Timberland ............................. 15
Influences of a Growing Population ...................................................................... 19
Population and Future Land Use Change ............................................................. 22
The Owners of Kentucky’s Forest Land and Timberland ....................................... 24
Landowner Characteristics and Possible Influences on Kentucky Forests ........... 27
The National Woodland Owner Survey .................................................................. 27
Parcel Size Influences Harvesting Decisions ............................................................ 27
Landowner Values and Attitudes: Reasons for Owning Forest Land ....................... 27
Recent Forestry Activity: Timber Harvest and Recreation Are Prominent .................. 28
Few Landowners Develop a Management Plan or Seek Professional Advice ........... 30
Page
Contents

v
Page
Timber Products and the Economy ........................................................................ 31
Timber Products Output and Removals ................................................................. 32
Nontimber Forest Products ..................................................................................... 34
Forest Health Indicators in Kentucky ..................................................................... 40
Introduction .......................................................................................................... 40
Methodology ........................................................................................................ 40
Deadwood on Kentucky Forest Land ..................................................................... 41
Ozone and Kentucky’s Forests ................................................................................ 45
Crown Condition ................................................................................................... 47
Soil Characteristics ................................................................................................. 50
Literature Cited ....................................................................................................... 52
Glossary ................................................................................................................... 55
Appendix A—Inventory Methods ........................................................................... 65
Appendix B—Reliability of the Data ....................................................................... 71
Appendix C—Species List ........................................................................................ 73
Appendix D—Supplemental Tables ........................................................................ 75
Jack in the pulpit. (courtesy of Kentucky
Division of Forestry)
v
Contents

vi
Text Figures
Figure 1—Percentage of land in forest by county, Kentucky, 2004 ............................. 1
Figure 2—Top 12 tree species in terms of number of live trees occurring on Kentucky’s forest land, 2004 ....................................................................................... 3
Figure 3—Top 12 tree species in terms of total volume of live trees occurring on Kentucky’s forest land, 2004 .................................................................................. 3
Figure 4—Top 12 tree species in terms of total volume of growing stock on Kentucky’s timberland, 2004 ....................................................................................... 4
Figure 5—Area of timberland by forest-type group, Kentucky, 2004 ........................... 5
Figure 6—Area of timberland by stand-size class, Kentucky, 1975, 1988, and 2004..... 7
Figure 7—Timberland area by stand-age class, Kentucky, 2004 (Note: no stand age was given for 6.44 thousand acres of timberland.) ................................................ 8
Figure 8—Total forest land area in Kentucky, 1949 to 2004 ....................................... 8
Figure 9—Growing-stock volume on timberland by diameter class, Kentucky, 2004 .......................................................................................................... 11
Figure 10—(A) Percentage of 1988 hardwood sawtimber board-foot volume on timberland by tree grade; and (B) percentage of 2004 hardwood sawtimber board-foot volume on timberland by tree grade .......................................................... 14
Figure 11—Average annual gross growth, removals, mortality, and net change of growing-stock trees on timberland, Kentucky, 1964 to 2004 ................................... 15
Figure 12—Average annual removals of growing stock vs. total growing-stock volume on timberland, Kentucky, 1975, 1988, and 2004 ........................................... 17
Figure 13—Growth-to-removals ratio, percent of total sawtimber inventory removed, and total inventory of sawtimber on Kentucky timberland, 1949 to 2004 .... 18
Figure 14—Forest population density, Kentucky, 1988 ............................................... 20
Figure 15—Forest population density, Kentucky, 2004 ............................................... 20
Figure 16—Predicted percent change in forest land, Kentucky, 1992 to 2020 ............ 22
Figure 17—Predicted percent change in urban land, Kentucky, 1992 to 2020 ........... 22
Figure 18—Predicted percent change in agriculture land, Kentucky, 1992 to 2020 .... 23
Figure 19—Ownership of timberland, Kentucky, 2004 .............................................. 25
Figure 20—Primary wood-using mills by region, Kentucky, 2003 ............................... 31
Figure 21—Average annual output of timber products by product and species group, Kentucky, 1948 to 2003 .................................................................................. 32
Figure 22—Distribution of State ginseng harvests, 1995 to 2004 ............................... 36
Figure 23—American ginseng average harvest by U.S. county, 1999 to 2000 ............ 37
Figure 24—Distribution of ginseng harvest by county, Kentucky, 2003 ...................... 37
Figure 25—Kentucky ginseng harvest history, 1981 to 2004 ..................................... 38
Page
List of Figures

vii
Page
Figure 26—Number of standing dead trees on forest land by major species group and FIA reporting unit, Kentucky ...................................................................... 42
Figure 27—Predictive map of snags per acre by FIA reporting unit using inverse distance weighting, Kentucky, nonforest areas have been removed ................. 43
Figure 28—Proportion of coarse woody materials by decay class, Kentucky ............... 43
Figure 29—Kriged predictive map of down woody material by FIA reporting unit, Kentucky, nonforest areas have been removed ................................................... 44
Figure 30—Five-year average of nationwide ozone exposures ................................... 47
Figure 31—Crown density frequency for all live trees > 4.9 inches d.b.h. by species group, Kentucky, 2000 to 2002 ...................................................................... 48
Figure 32—Crown dieback frequency for all live trees > 4.9 inches d.b.h. by species group, Kentucky, 2000 to 2002 ...................................................................... 49
Figure 33—Foliage transparency frequency for all live trees > 4.9 inches d.b.h. by species group, Kentucky, 2000 to 2002 ................................................................. 49
Figure 34—Soil orders of Kentucky. Data from STATSGO. http://soildatamart.nrcs.usda.gov ............................................................................................................ 50
Appendix Figures
Figure A.1—Pattern of five-point prism plot used in Kentucky .................................... 66
Figure A.2—Layout of fixed-radius plot ...................................................................... 67
Oak-hickory forests are the dominant forests in Kentucky. (photo courtesy of Kentucky Division of Forestry)
List of Figures

viii
Text Tables
Table 1—Area by land class, Kentucky ....................................................................... 2
Table 2—Area by State and stand origin .................................................................... 5
Table 3—Net volume of all live trees on forest land by forest land status ..................... 9
Table 4—Volume of live hardwood trees by species on forest land, Kentucky, 2004 .......................................................................................................... 10
Table 5—Volume of live softwood trees by species on forest land, Kentucky, 2004 .......................................................................................................... 11
Table 6—Volume of hardwood sawtimber trees by species on timberland, Kentucky, 2004 .......................................................................................................... 12
Table 7—Volume of softwood sawtimber trees by species on timberland, Kentucky, 2004 .......................................................................................................... 13
Table 8—Volume of hardwood sawtimber by tree grade, Kentucky, 1988 and 2004 .......................................................................................................... 14
Page
Dave Maehr radio collaring a sedated black bear. The population, on its own, has recolonized Kentucky in the last 25 years. (photo by John J. Cox)
List of Tables

ix
Page
Table 9—Growth-to-removals ratio of growing stock by species .................................. 18
Table 10—Area of timberland by survey unit and ownership class, Kentucky, 2004 .... 25
Table 11—Area of timberland by forest-type group and ownership class, Kentucky, 2004 .......................................................................................................... 26
Table 12—Area of timberland by stand-age class and ownership class, Kentucky, 2004 .......................................................................................................... 26
Table 13—Area and number of family-owned forests in Kentucky by size of forest landholdings, 2004, according to respondents to the National Woodland Owner Survey ............................................................................................................ 27
Table 14—Area and number of family-owned forests in Kentucky by reason for owning forest land, 2004, according to respondents to the National Woodland Owner Survey. Numbers include landowners who ranked each objective as (1) very important or (2) important on a seven-point Likert scale .............. 28
Table 15—Area and number of family-owned forests in Kentucky by recent (past 5 years) forestry activity, 2004, according to respondents to the National Woodland Owner Survey ........................................................................................... 29
Table 16—Number of family-owned forests along with associated area in Kentucky by reported timber harvesting activities, 2004, according to respondents to the National Woodland Owner Survey ................................................................... 29
Table 17—Area and number of family-owned forests in Kentucky by management plan, advice sought, and advice source, 2004, according to respondents to the National Woodland Owner Survey ....................................................................... 30
Table 18—Bureau of the Census statistics for forest and forest products industries in Kentucky, 1997 to 2003 ......................................................................................... 31
Table 19—Volume of timber removals by removals class, species group, and source, Kentucky, 1988 to 2003 ................................................................................. 33
Table 20—Distribution of nontimber forest product enterprises by State and type of enterprise, 2003 .................................................................................................... 34
Table 21—List of bioindicators for Kentucky ............................................................... 46
Table 22—Summary of biosite data, Kentucky, 2000 through 2002 ........................... 46
Table 23—Mean crown dieback and other statistics for all live trees > 4.9 inches d.b.h. by species, Kentucky, 2000 to 2002 ................................................................. 48
Table 24—Soil macronutrients collected by FIA and implications for vegetation .......... 51
List of Tables

x
Appendix Tables
Table A.1—Land area by survey unit and land class, Kentucky, 2004 ......................... 75
Table A. 2—Area of timberland by survey unit and ownership class, Kentucky, 2004 .......................................................................................................... 75
Table A. 3—Area of timberland by survey unit and forest-type group, Kentucky, 2004 .......................................................................................................... 76
Table A. 4—Area of timberland by survey unit and stand-size class, Kentucky, 2004 .......................................................................................................... 76
Table A. 5—Area of timberland by forest-type group, stand origin, and ownership class, Kentucky, 2004 ................................................................................ 77
Table A. 6—Number of live trees on timberland by species group and diameter class, Kentucky, 2004 ................................................................................................. 78
Table A.7—Number of growing-stock trees on timberland by species group and diameter class, Kentucky, 2004 ................................................................................... 79
Table A.8—Volume of live trees on timberland by species group and diameter class, Kentucky, 2004 ................................................................................................. 80
Table A.9—Volume of growing-stock trees on timberland by species group and diameter class, Kentucky, 2004 ................................................................................... 80
Table A.10—Volume of sawtimber on timberland by species group and diameter class, Kentucky, 2004 ................................................................................................. 81
Table A.11—Volume of live trees on timberland by survey unit and species group, Kentucky, 2004 ............................................................................................... 81
Table A.12—Volume of growing stock on timberland by survey unit and species group, Kentucky, 2004 ............................................................................................... 82
Table A.13—Volume of sawtimber on timberland by survey unit and species group, Kentucky, 2004 ............................................................................................... 82
Table A.14—Volume of live trees and growing stock on timberland by ownership class and species group, Kentucky, 2004 .................................................................... 83
Table A.15—Volume of sawtimber on timberland by ownership class and species group, Kentucky, 2004 ............................................................................................... 83
Table A.16—Volume of growing stock on timberland by forest-type group, stand origin, and species group, Kentucky, 2004 ................................................................. 84
Table A.17—Average net annual growth of live trees on timberland by survey unit and species group, Kentucky, 1988 to 2003 ........................................................ 85
Page
List of Tables

xi
Page
Table A.18—Average net annual growth of growing stock on timberland by survey unit and species group, Kentucky, 1988 to 2003 ............................................. 85
Table A.19—Average net annual growth of sawtimber on timberland by survey unit and species group, Kentucky, 1988 to 2003 ........................................................ 86
Table A.20—Average annual removals of live trees on timberland by survey unit and species group, Kentucky, 1988 to 2003 ............................................................... 86
Table A.21—Average annual removals of growing stock on timberland by survey unit and species group, Kentucky, 1988 to 2003 ........................................................ 87
Table A.22—Average annual removals of sawtimber on timberland by survey unit and species group, Kentucky, 1988 to 2003 ............................................................... 87
Table A.23—Average net annual growth and average annual removals of live trees, growing stock, and sawtimber on timberland by species group, Kentucky, 1988 to 2003 ............................................................................................................ 88
Table A.24—Average annual mortality of live trees, growing stock, and sawtimber on timberland by species group, Kentucky, 1988 to 2003 ........................................... 88
Table A.25—Average net annual growth and average annual removals of live trees on timberland by ownership class and species group, Kentucky, 1988 to 2003 ..................................................................................................................... 89
Table A.26—Average net annual growth and average annual removals of growing stock on timberland by ownership class and species group, Kentucky, 1988 to 2003 ............................................................................................................ 90
Mixed hardwood forest along a western Kentucky creek. (photo by Larry Lowe)
List of Tables

xii
Table A.27—Average net annual growth and average annual removals of sawtimber on timberland by ownership class and species group, Kentucky, 1988 to 2003 ......................................................................................................... 90
Table A.28—Average net annual growth of growing stock on timberland by forest-type group, stand origin, and species group, Kentucky, 1988 to 2003 ............ 91
Table A.29—Average annual removals of growing stock on timberland by forest-type group, stand origin, and species group, Kentucky, 1988 to 2003 ............ 92
Table A.30—Area of timberland treated or disturbed annually and retained in timberland by treatment or disturbance and ownership class, Kentucky, 1988 to 2003 ......................................................................................................... 93
Table A.31—Average annual output of timber products by product, species group, and type of material, Kentucky, 1988 to 2003 .................................. 94
Table A.32—Average annual output of roundwood products by product, species group, and source of material, Kentucky, 1988 to 2003 ............................... 95
Table A.33—Average annual timber removals from growing stock on timberland by item, softwood, and hardwood, Kentucky, 1988 to 2003 .................. 96
Table A.34—Disposal of average annual volume of residue at primary wood- using plants by product, species group, and type of residue, Kentucky, 1988 to 2003 ......................................................................................................... 96
Table A.35—Carbon estimates and coarse woody material attributes by forest-type group, size class, and decay class, Kentucky ............................................ 97
Table A.36—Down woody material attributes by forest-type group and fuel type, Kentucky ........................................................................................................ 98
Table A.37—Soil physical properties averaged by soil layer and reporting unit, Kentucky ......................................................................................................... 98
Table A.38—Soil chemical properties averaged by soil layer and reporting unit, Kentucky ......................................................................................................... 99
Table A.39—Mean crown density and other statistics for all live trees > 4.9 inches d.b.h. by species, Kentucky, 2000 to 2002 ........................................... 100
Table A.40—Mean foliage transparency and other statistics for all live trees > 4.9 inches d.b.h. by species, Kentucky, 2000 to 2002 ........................................... 101
Page
List of Tables

xiii
Tree Volume
•Thelive-treevolumeonforestland was estimated to be 21.9 billion cubic feet in 2004.
•Volumeofalllivetreesontimberlandtotaled 21.2 billion cubic feet in 2004, an increase of 4.6 billion cubic feet, or 28 percent, since 1988.
•Hardwoodlive-treevolumeontimberlandincreased 28 percent, to 19.7 billion cubic feet. Softwood live-tree volume increased 17 percent, to 1.4 billion cubic feet.
•Yellow-poplar(2.6billioncubicfeet) and white oak (2.5 billion cubic feet) are the most abundant species by volume on forest land.
Yellow-poplar is one of the most numerous trees in Kentucky. (U.S. Forest Service photo)
Forest Features
•Since1988,Kentucky’sforestlandareahas decreased an estimated 729,000 acres (6 percent), to about 11.97 million acres. Forests occupy 47 percent of Kentucky’s total land area.
•Timberlandoccupies11.6millionacres(97 percent of the total forest land area). The remaining 3 percent of forest land area is either public reserved forest land—removal of timber from such land is prohibited by law—or considered to be unproductive.
•Overall,115individualtreespecieswererecorded during the recent forest inventory. Red maple is the most common species in terms of number of individual stems recorded on forest land, and yellow-poplar is the species with the greatest amount of timber volume. Today, yellow-poplar represents an estimated 13 percent of total volume on Kentucky’s timberland.
•Hardwoodforesttypesotherthanoak-pine occupy 9.9 million acres, or 85 percent of timberland in the Commonwealth. Oak-hickory is the predominant forest-type group in Kentucky, occupying 8.4 million acres. Oak-pine is second in extent at 1.1 million acres (a 26-percent increase since 1988). Softwood forest-type groups totaled 571,300 acres (a 16-percent decrease since 1988).
•Sawtimberisthepredominantstand-size class, occupying 7.6 million acres (65 percent of the timberland area), a 7-percent increase since 1988. Poletimber, the second most extensive stand-size class, occupies 2.8 million acres.
Highlights from the 2004 Report on Kentucky’s Forests

xiv
Forest products ready to be put to use. (photo by Rodney Kindlund)
xiv
•In2004,almostthree-quarters(73percent) of the growing-stock volume on timberland was in trees in the 12-inch or greater diameter classes.
•Sawtimbervolumeontimberlandincreased by 32 percent between 1988 and 2004, to 60.4 billion cubic feet.
•Thevolumeofsawtimbertreesthatare 15.0 inches d.b.h. or larger (39.4 billion board feet) is 65 percent of the total sawtimber volume. The amount of hardwood sawtimber volume in the higher quality tree grades (grades 1 and 2) increased from 16.1 to 23.1 billion board feet (adjusted).
Growth and Removals
•Netannualgrowthofalllivetreeson timberland averaged 565.0 million cubic feet between 1988 and 2003. Total removals of all live trees averaged 319.5 million cubic feet per year during that period. The great majority of growth (525.2 million cubic feet) was in hardwoods.
•Between1988and2004,netannualgrowth of sawtimber trees increased 43 percent, to 2.2 billion board feet, while annual removals of sawtimber volume averaged 1.2 billion board feet. The ratio of growth to removals for sawtimber on Kentucky timberland fluctuated between 1.6 and 2.7 between 1949 and 2004.
•Netchangeintheinventoryofalllive-tree volume on timberland was a positive 245.5 million cubic feet per year. Net change in the inventory of sawtimber volume was a positive 1.0 billion board feet per year.
A Growing Population
• In2004,12countiesaveragedatleast1,000 people per square mile of forest land. Of those 12 counties, only Campbell, Kenton, and Boone remained at least 30 percent forested in 2004.
Highlights from the 2004 Report on Kentucky’s Forests

xv
Kentucky’s Forest Landowners
•Privateindividualsown78percentof the timberland in Kentucky. Nine percent is publicly administered by local, Commonwealth, or Federal agencies.
•Eighty-eightpercentofthefamilyforestlandowners surveyed by the National Woodland Owner Survey stated they had no written management plan, and only 17 percent had sought advice on managing their forested acreage.
•Forestindustryownsabout2percentofthe timberland in Kentucky.
•Federal,Commonwealth,andlocalgovernment agencies manage 1.03 million acres, or 11 percent, of the forest land in Kentucky. The Forest Service manages 590,300 acres, or 56 percent, of the public forest land. Other public agencies own and manage about 439,700 acres of forest land in Kentucky.
The Economic Impact of Kentucky’s Forests
• In2003,morethan21,500individualswere directly employed at wood-processing mills. The total annual payroll in 2003 was $714 million.
• In2003,thetotalvalueofwoodproductsmanufactured in the Commonwealth was more than $5.8 billion. The total direct, indirect, and induced effects of the forest products industry were nearly $8.7 billion.
•Sawlogsaretheprimarywoodproductproduced by mills in Kentucky. Saw-log production increased from 117 million cubic feet in 1986 to 160 million cubic feet in 2003. Pulpwood production increased from 35 million cubic feet in 1986 to 53 million cubic feet in 2003.
•Kentuckyrankssecondinthe South, behind North Carolina, in total number of nontimber forest product (NTFP) enterprises.
•ManyspeciesofmedicinalplantsgrowinKentucky’s forests, and 54 percent of the 4,921 NTFP enterprises in Kentucky depend on medicinal plants.
•Since1995,> 212,000 pounds of ginseng have been harvested from Kentucky forests, and harvesters have received in excess of $63 million in direct payments for this ginseng. Kentucky has been the number one supplier of wild-harvested ginseng for the last 10 years.
•The2002censusrevealedthatKentuckyhad 230 Christmas tree farms, of which 123 were harvesting trees.
• In2002,38maplesyrupfarmshadatotalof 4,142 active taps. These farms produced about 416 gallons of syrup, representing about 9 percent of total maple syrup production in the South.
Black cohosh growing in the understory of a mixed hardwood stand. (photo by David Stephens, bugwood.org)
Highlights from the 2004 Report on Kentucky’s Forests

xvi
Pink lady’s slipper (Cypripedium acaule). (photo by John J. Cox)

1
Features of the Forest Land Base
Data from the phase 1 (P1) aerial photopoints were used to determine the area of forest land in the Commonwealth. The large number of photo sample points ensures a high level of precision in the estimates of forest land area at the unit (multicounty) or Commonwealth level. However, the number of photopoints per county is limited, so users should be cautious when interpreting or using data for individual counties.
Data from the phase 2 (P2) ground plots were used to describe forest characteristics. P2 data provide estimates of stand size, forest type, ownership, reserved status, stand origin, site productivity, stand age, stocking levels, and other stand variables. The area estimates are presented in acres. Equivalent estimates in hectares are available on the FIADB Web site.
The data collected on the P2 ground plots are not valid at the county level. Users should also be aware that, due to changes in inventory design, not all of the ground plots sampled in 2004 are the same as the ones that were established in 1988. Differences between the previous and current plot design are discussed in the “Inventory Methods” section of the appendix.
The Extent of Kentucky’s Forests
Forests covered 11.97 million acres or 47 percent of Kentucky’s total land area. This was 729,000 acres less than the area of forest land reported in 1988 (Alerich 1990). The Cumberland Plateau and the Appalachians in the eastern portion of Kentucky were the most heavily forested (fig. 1). The central and western portions of the Commonwealth, although less densely forested, accounted for 50 percent of the total forest land area. Figure 1—Percentage of land in forest by county, Kentucky, 2004.
Fall foliage, Pine Mountain. (photo by Tom Barnes)
Forests covered 11.97 million acres or 47 percent of Kentucky’s total land area. This was 729,000 acres less than the area of forest land reported in 1988.
Features of the Forest Land Base

2
Table 1—Area by land class, Kentucky
Land class 1963 1975 1988 2004
million acres
Timberland 11.7 11.9 12.3 11.6Other/reserved 0.1 0.3 0.4 0.3
Total forest area 11.9 12.2 12.7 12.0
Agricultural land a 11.6 11.3 10.1 10.0Other nonforest land b 2.1 2.0 2.6 3.5
Total nonforest land 13.7 13.3 12.7 13.5
Total land area c 25.5 25.5 25.4 25.4
percent
Forested 46 48 50 47Agricultural 45 44 40 39Other nonforest 8 8 10 14
Totals may not sum due to rounding.Total land area estimates changed slightly over time due to improvements in measurement techniques and refinements in classification of small bodies of water and streams. a Source: USDA, National Agriculture Statistics Service, Census of Agriculture. b Includes urban and other land not considered agricultural land or forest land, including some areas considered water by FIA but not by Bureau of the Census.c Source: U.S. Department of Commerce, Bureau of the Census.
Publicly owned forest land that has been withdrawn from timber production by legal statute or administrative regulation is termed reserved forest land, regardless of its productivity class. Reserved forest land does not include private land that has been placed in conservation easements or is controlled by other private contracts that limit or exclude timber harvesting.
The vast majority of Kentucky’s total forest land area in 2004 was considered available for timber production (11.6 million acres or 97 percent of the total forest land area) (table 1). The amount of reserved forest land area sampled on P2 ground plots in the 2004 inventory represented 284,709 acres. Over one-half of the reserved land was located in designated wilderness areas on the Daniel Boone National Forest and the Land Between the Lakes National Recreation Area. About 20 percent of the reserved forest land was administered by the National Park Service, and another 15 percent was managed by other Federal Agencies. Nearly 10 percent of the reserved forest land was owned by the Commonwealth of Kentucky.
The 1988 inventory reported over 300,000 acres of reserved forest land. The relatively small difference between the two estimates is most likely due to changes in how reserved forest land was measured between the two surveys rather than any real change in the amount of reserved forest land (see the discussion on inventory methods in the “Inventory Methods” section of the appendix).
While this report does include data on all forest land areas, it primarily focuses on timberland—the portion of the forest land area that is available for timber production. Users who compare data from different inventories are cautioned to be sure that the data have the same basis—either total forest land or timberland. In most previous inventory reports, the only data presented have been based on the timberland component.
Kentucky Land Classifications
FIA classifies forest land area into two broad classes: (1) timberland and (2) other forest land. Timberland is forested land that is capable of producing at least 20 cubic feet of wood volume per acre per year. Other forest land, referred to as woodland or unproductive in previous FIA reports, does not meet this minimum productivity standard. Other forest land is generally characterized by sterile soils, poor drainage, high elevation, rockiness, or steep slopes. At the time of the 2004 inventory, the area of unproductive forest land was 37,847 acres (included in “Other/reserved” in table 1). This figure was basically unchanged from the 1988 inventory estimate of 36,500 acres. Although some forest land is not considered productive for timber purposes, all forest land provides benefits unrelated to timber harvesting, including ecological, aesthetic, and recreational value.
Features of the Forest Land Base

3
Forest Composition
The species composition of a forested stand defines that stand’s character, likely future development, ecosystem function, and dynamics, and provides insight into its historical evolution. As such, analysis of current and past species composition aids in understanding the existing forest character and potential developmental paths.
A wide variety of tree species are found in Kentucky. These include hardwoods such as yellow-poplar, oak, hickory, maple, beech, birch, and black locust and softwoods such as shortleaf pine, Virginia pine, loblolly pine, eastern redcedar, and cypress. Overall, 115 individual species were recorded during the recent forest inventory. Red maple is the most common species in terms of number of individual stems recorded on forest land (fig. 2) and the species with the greatest amount of volume is yellow-poplar (fig. 3).
No one tree species dominates Kentucky’s forest land both in terms of numbers of live trees and in terms of volume. The statistics more or less reflect the ecological niche and silvical characteristics of the common species. Species such as yellow-poplar, white oak, and many red oaks appear to be larger and the dominant canopy species in much of the forest. Some species, such as red maple, flowering dogwood, and eastern redbud, are more numerous but smaller in diameter and typically occupy midstory and understory positions.
There does appear to be a shift in species dominance in Kentucky’s forests since the late 1940s and early 1950s. For instance, yellow-poplar, the species currently representing the greatest growing-stock volume on Kentucky timberland, has experienced significant gains in dominance. In 1952, yellow-poplar accounted for an estimated 6 percent of the total volume on commercial forest area (now defined as timberland). Today, yellow-poplar represents an estimated 13 percent of the total volume on timberland (fig. 4). Red
Figure 2—Top 12 tree species in terms of number of live trees occurring on Kentucky’s forest land, 2004.
Figure 3—Top 12 tree species in terms of total volume of live trees occurring on Kentucky’s forest land, 2004.
No one tree species dominates Kentucky’s forest land both in terms of numbers of live trees and in terms of volume. The statistics more or less reflect the ecological niche and silvical characteristics of the common species.
Features of the Forest Land Base

4
maple accounted for 2 percent of volume on commercial forest area in 1952 and now accounts for 5 percent of volume on timberland, while sugar maple made up 3 percent of volume on commercial forest area in 1952 and now makes up 5 percent of volume on timberland. Relative volumes of individual species in the red oak group have generally declined since 1952. For example, black oak accounted for 15 percent of total wood volume on timberland in 1952 but only 5 percent in 2004 (fig. 4).
Kentucky Forest Types
The forest type is a classification derived from the species that make up the plurality of the live trees sampled within a stand. Utilizing forest types allows for stand level information to be analyzed across wide geographical areas and results in more meaningful and less complicated conclusions. Forest-type nomenclature is derived from those dominant species. Examples include detailed types such as red oak/white oak/hickory, and yellow-poplar/white oak/northern red oak. The detailed forest types are grouped into broad forest-type groups composed of ecologically similar types, such as maple-beech-birch or oak-hickory. FIA commonly reports the broad forest-type groups instead of detailed forest types.
Two methods are used to determine the forest-type classification. The first method uses field crews’ evaluations based on the majority of species on the acre surrounding and including the plot. The second method involves a computer algorithm that evaluates only the tree data collected within the boundary of the plot area. The forest-type data in this bulletin was based solely on the field crews’ evaluations.
Kentucky Division of Forestry crew collecting forest resource information. (photo by Ray D. Campbell)
Figure 4—Top 12 tree species in terms of total volume of growing stock on Kentucky’s timberland, 2004.
Features of the Forest Land Base

5
Table 2—Area by State and stand origin
State YearTotal
timberland
Stand origin
Natural stands
Planted stands
- - - - - - - - - - - - acres - - - - - - - - - - - -
Alabama 2000 22,925,815 17,138,176 5,787,639Arkansas 1995 18,392,130 15,975,255 2,416,875Florida 1995 14,650,660 9,705,626 4,945,034Georgia 2004 24,151,017 16,732,336 7,069,000Kentucky 2004 11,647,891 11,563,840 84,051Louisiana 1991 13,783,023 11,137,253 2,645,770Mississippi 1994 18,587,406 14,476,679 4,110,727North Carolina 2002 17,684,407 14,860,603 2,823,804Oklahoma 1993 6,233,573 5,598,047 635,526South Carolina 2001 12,221,404 9,076,138 3,145,266Tennessee 1999 13,965,050 13,366,364 598,687Texas 2003 11,884,780 8,961,090 2,923,690Virginia 2001 15,467,010 13,348,965 2,118,046
Total 201,594,167 161,940,371 39,653,796
Algorithm results were not available for this bulletin, although the previous forest-type information was generated by an algorithm. Please refer to the FIA field guide for complete descriptions of each detailed forest type.
Hardwood types dominate Kentucky’s forests. Oak-hickory was the predominant forest-type group in the Commonwealth, occupying 8.4 million acres of timberland (72 percent) (fig. 5). This group is composed of upland forest types containing oak-hickory, yellow-poplar, and other upland hardwoods commonly found in the central hardwood region of the United States. Upland stands composed of a mixture of oak and pine covered 9 percent of the timberland area. Maple-beech-birch and aspen-birch upland forests combined covered 7 percent of the timberland area. Two lowland hardwood forest-type groups—oak-gum-cypress and elm-ash-cottonwood—combined covered 6 percent of the timberland area. Softwood forest types including white pine, hemlock, southern yellow pines, and eastern redcedar together occupied 5 percent of timberland area.
Natural and Planted Stands
Stand origin is a classification that describes how the sampled forest originated—either naturally or by being planted. Planted forests in Kentucky account for an estimated 84,051 acres of timberland in 2004, <1 percent of the total timberland area (table 2). Loblolly pine accounted
Figure 5—Area of timberland by forest-type group, Kentucky, 2004.
Features of the Forest Land Base

6
for about 40 percent of the planted area. White pine, Virginia pine, and shortleaf pine combined were also planted on about 40 percent of the planted timberland area. The remainder was planted in black locust or black walnut, in addition to very small amounts of cottonwood and cypress.
In order to quantify planting activity between inventories, we have annualized the acreage of planted stands <16 years of age for the 16-year period between the 1988 and current inventories. About 34,100 planted acres of Kentucky timberland are 16 years old or less. Thus, we estimate that according to FIA estimates an average of approximately 2,130 acres of timberland were planted each year since the last inventory.
By comparison, an average of 21,700 acres of timberland was planted annually in Tennessee from 1989 to 1999 (Schweitzer 2000). In 1999, Tennessee had a total of nearly 600,000 planted acres (table 2), which was 4 percent of the timberland area in that State (13.965 million acres). In North Carolina, 100,500 acres were planted annually from 1990 to 2002, and planted timberland in that State totaled about 2.8 million acres (or 16 percent of the timberland area) in 2002 (Brown 2004). The vast majority of the planted acreage in the other Southern States, such as North Carolina, is being planted in conifer species, particularly loblolly pine. Kentucky, much like Tennessee, is primarily a hardwood State. Artificial regeneration of hardwood stands is less common and less widespread
Planted oak stand. (photo by Christopher M. Oswalt)
Features of the Forest Land Base

7
harvested but where new tree growth has not regenerated to an adequate level of stocking at the time of the field inventory.
An estimated 7.6 million acres of timberland, or 65 percent of the timberland in Kentucky, is in sawtimber-size stands.
The number of acres in sawtimber increased from 1975 to 1988 and from 1988 to 2004 (fig. 6). An estimated 7.6 million acres of timberland, or 65 percent of the timberland in Kentucky, is in sawtimber-size stands. Since 1988, there has been a 7-percent increase in the number of acres of sawtimber-size stands on Kentucky’s timberland. Since 1975 timberland acreage has been aging as stems have been recruited from small stand-size classes into larger classes. As a result, the area in poletimber stands has declined by 12 percent since 1988. Also the total area in the sapling-seedling stand-size class decreased from an estimated 3.75 million acres in 1975 to about 1.2 million acres in 2004, a decrease of 68 percent. Essentially, this represents a decrease in early successional habitat and a loss of habitat available to early successional fauna as the Kentucky forest ages. This aging is also apparent in observed changes in species composition over time (see discussion of species composition).
than artificial regeneration of conifer stands. In addition, Kentucky is outside the natural range of loblolly pine and this heavily influences the number of acres planted to pine each year.
Due to the scale of the FIA data collection effort, smaller planted stands, unlike the larger pine plantations of many of the other Southern States, may be underrepresented in the estimate. According to the “Database of Tree Planting in the U.S.” (Tree Planters Notes 2006) an average of 12,216 acres were planted annually in Kentucky during the period of 1988 to 1999 (the period for which data were readily available). This supports the idea that planted stands in Kentucky may be underestimated by FIA. Regardless, the amount of planted pine in Kentucky is minimal by either measure.
Stand Size
It is important to know the size of the trees that make up our forests. Armed with this knowledge we are able to better understand the structure of the forested stands in Kentucky and the habitat that exists on the landscape. In addition, trend analysis of stand size (a classification based on the diameter of the majority of the live trees in a stand) facilitates understanding of the successional status and potential future development of the forest and the populations of its inhabitants.
The stand-size classes utilized by FIA are sapling-seedling, poletimber, sawtimber, and nonstocked. Sapling-seedling stands are forested areas where the majority of the trees are < 5.0 inches d.b.h. Poletimber stands are at least 5.0 inches d.b.h. but are not large enough to be sawtimber. In order to be sawtimber size, a softwood species must be 9.0 inches or larger, while hardwood species must be 11.0 inches or larger. Nonstocked means that although the land is considered forested, there are not enough trees on it to categorize it into stand-size category. These generally are forested areas that have recently been Figure 6—Area of timberland by stand-size class, Kentucky,
1975, 1988, and 2004.
Features of the Forest Land Base

8
Stand Age
Stand age is the average age of the majority of live trees in the predominant stand-size class. The FIA data from the P2 plots indicate that stand ages are not evenly distributed. Across Kentucky, 68 percent of thetimberlandwas>40yearsoldin2004(fig. 7). The estimates signify that the total
acreage of stands 41 to 50 years of age is greater than the total acreage of stands in any other 10-year age class. As such, a large number of stands in Kentucky appear to have initiated between the years of 1945 to 1963. This corresponds to the increase in forest land area in Kentucky that appeared in FIA surveys in the late 1940s and continued to the late 1980s (fig. 8).
Figure 7—Timberland area by stand-age class, Kentucky, 2004. (Note: no stand age was given for 6.44 thousand acres of timberland.)
Figure 8—Total forest land area in Kentucky, 1949 to 2004.
Features of the Forest Land Base

9
Table 3—Net volume of all live trees on forest land by forest land status
Unreserved forests Reserved forestsAll
forest landTimberland Unproductive Total Productive Unproductive Total
million cubic feet
21,187.9 6.3 21,194.2 719.4 0.0 719.4 21,913.6
Tree Volume on Forest Land and Timberland
Tree data from the P2 ground plots provide volume estimates by species, diameter class, quality, and other individual tree attributes. The volume data can also be evaluated by stand attributes like ownership, stand size, forest type, and other stand variables. The volume estimates are presented in cubic feet and board feet for this resource bulletin.
Previous FIA reports primarily focused only on tree volume located on timberland. While this bulletin discusses wood volume on all forest land area, the tables in the appendix include only the volume located on timberland. Users should be aware of the differences between timberland and forest land, and take care to ensure comparisons between findings from different surveys are valid. Differences between the previous and current plot design are discussed in the “Inventory Methods” section of the appendix.
The volume of wood in each live tree meeting minimum standards is determined by measuring the tree’s diameter at breast height (dbh) at 4.5 feet above the ground and the tree’s total height (h), and then applying the following formula:
where
V = volume and = parameters
dbh = diameter at breast height
Ht = height
= error
The coefficients correct for species-specific growth differences such as taper, and have been derived from numerous years of FIA wood-utilization studies. The volume equations currently used by FIA in the
Southern States represent some of the best equations available for many southern tree species.
All Live-Tree Volume Dominated by Hardwoods
Live-tree volume on forest land in 2004 totaled 21.9 billion cubic feet (table 3). Over 97 percent (21.2 billion cubic feet) of live-tree volume was on timberland, and live-tree volume on timberland was up 28 percent since 1988. Hardwoods, which are predominant in Kentucky, accounted for 93 percent of the 21.9 billion cubic feet of all live-tree volume (20.3 billion cubic feet) on forest land, and an equal percentage of live-tree volume on timberland (19.7 billion cubic feet). The latter is a 28-percent
Peeler logs stacked and ready for processing. (photo by L. David Dwinell)
Tree Volume on Forest Land and Timberland

10
Table 4—Volume of live hardwood trees by species on forest land, Kentucky, 2004
Volume
Species Cubic feetCumulative
total %Cumulative
percent
Yellow-poplar 2,615,100,381 2,615,100,381 13 13White oak 2,532,328,964 5,147,429,345 12 25Chestnut oak 1,544,389,660 6,691,819,005 8 33Sugar maple 1,234,256,115 7,926,075,120 6 39Red maple 1,151,007,295 9,077,082,415 6 45Pignut hickory 1,012,999,649 10,090,082,064 5 49American beech 1,003,953,617 11,094,035,681 5 54Black oak 978,609,509 12,072,645,190 5 59Northern red oak 871,857,316 12,944,502,506 4 63Scarlet oak 788,422,351 13,732,924,857 4 67White ash 562,028,904 14,294,953,761 3 70Mockernut hickory 522,770,914 14,817,724,675 3 73Sycamore 379,758,869 15,197,483,544 2 75Green ash 338,527,410 15,536,010,954 2 76Sweetgum 326,858,549 15,862,869,503 2 78Shagbark hickory 315,123,587 16,177,993,090 2 79Blackgum 308,563,952 16,486,557,042 2 81Chinkapin oak 292,913,458 16,779,470,500 1 82Bitternut hickory 236,059,544 17,015,530,044 1 83Black walnut 214,118,380 17,229,648,424 1 85Post oak 211,277,801 17,440,926,225 1 86American basswood 201,425,566 17,642,351,791 1 87Black cherry 200,060,585 17,842,412,376 1 88Southern red oak 198,175,885 18,040,588,261 1 88Sassafras 181,211,234 18,221,799,495 1 89Silver maple 144,853,158 18,366,652,653 1 90American elm 144,322,402 18,510,975,055 1 91Black locust 128,320,087 18,639,295,142 1 91Slippery elm 128,145,394 18,767,440,536 1 92Hackberry 127,439,831 18,894,880,367 1 93Shellbark hickory 126,633,809 19,021,514,176 1 93Sweet birch 125,879,550 19,147,393,726 1 94Sourwood 125,076,263 19,272,469,989 1 95Boxelder 110,259,317 19,382,729,306 1 95
increase over the 15.4 billion cubic feet of hardwood volume on timberland reported in 1988.
The most abundant hardwood species on forest land with respect to live volume was yellow-poplar at 2.6 billion cubic feet (table 4). The second most abundant species was white oak with 2.5 billion cubic feet. Together these two species accounted for
one-quarter of live hardwood volume on forest land. Another 48 percent of live hardwood volume was accounted for by chestnut oak, sugar maple, red maple, pignut hickory, American beech, black oak, northern red oak, scarlet oak, white ash, and mockernut hickory combined. The remaining 27 percent of live hardwood volume consisted of over 80 species, with nosinglespeciescontributing> 2 percent and the majority contributing less than one-half of 1 percent.
Softwood live volume on forest land totaled just 1.5 billion cubic feet (table 5). Virginia pine (0.5 billion cubic feet) and eastern redcedar (0.4 billion cubic feet) together accounted for 57 percent of softwood live volume. Eastern hemlock and shortleaf pine accounted for 0.2 billion cubic feet each (22 percent combined), while Eastern white pine, pitch pine, and baldcypress accounted for < 0.1 billion cubic feet individually (17 percent combined). With respect to volume, the least abundant softwood species was loblolly pine, accounting for 4 percent of live softwood volume on forest land. The species composition and distribution of live volume are essentially the same for timberland and for forest land.
Growing-Stock Tree Volume
Trees on the P2 ground plots that are suitable for producing sawtimber, now or in the future, are termed growing stock. Growing-stock trees have at least one 12-foot log or two 8-foot logs, and at least one-third of the total board-foot volume in the tree must be utilizable. Trees that meet minimum diameter standards to be classified as sawtimber (9.0 inches d.b.h. and greater for softwoods, and 11.0 inches d.b.h. and greater for hardwoods) are evaluated based on their current form. Trees smaller than sawtimber size are evaluated based on their potential to become growing stock when they do reach the minimum diameter threshold. Trees that do not meet the growing-stock standard are designated as either rough (due to poor form) or rotten cull trees.
Tree Volume on Forest Land and Timberland

11
Table 5—Volume of live softwood trees by species on forest land, Kentucky, 2004
Volume
Species Cubic feetCumulative
total %Cumulative
percent
Virginia pine 471,422,992 471,422,992 31 31Eastern redcedar 390,933,420 862,356,412 26 57Eastern hemlock 173,602,769 1,035,959,181 11 68Shortleaf pine 170,004,103 1,205,963,284 11 79Eastern white pine 91,475,367 1,297,438,651 6 85Pitch pine 88,226,787 1,385,665,438 6 91Baldcypress 80,218,996 1,465,884,434 5 96Loblolly pine 58,389,427 1,524,273,861 4 100
It is important to note that the growing-stock classification is based solely on the FIA definition of what is acceptable, a standard that has not significantly changed over time. However, some portion of the cull volume reported by FIA is undoubtedly utilized in modern pulpmills and sawmills due to substantial advances in mill technology (Spelter and Alderman 2005).
In 2004, there was 18.9 billion cubic feet of growing-stock volume on Kentucky’s forest land (86 percent of the live-tree volume), including the 18.2 billion cubic feet on timberland. The volume on timberland has increased by 14 percent since 1988.
Hardwood species accounted for 93 percent of growing-stock volume and 93 percent of live-tree volume on forest land and on timberland. The species composition of growing-stock volume on timberland was essentially the same as the species composition of growing-stock volume on forest land (tables 4 through 7).
The overall increase in volume is highlighted by a substantial rise in volume among the 12-inch and greater diameter classes. Kingsley and Powell (1978) estimate that trees in the 12-inch or greater diameter classes accounted for 59 percent of the growing-stock volume on timberland in 1975. Alerich (1990) estimated that such trees accounted for 65 percent of growing-stock volume on timberland by 1988. In 2004, almost three-quarters (73 percent) of the growing-stock volume on timberland was in trees in the 12-inch or greater diameter classes (fig. 9).
Figure 9—Growing-stock volume on timberland by diameter class, Kentucky, 2004.
In 2004, there was 18.9 billion cubic feet of growing-stock volume on Kentucky’s forest land (86 percent of the live tree volume), including the 18.2 billion cubic feet on timberland. The volume on timberland has increased by 14 percent since 1988.
Tree Volume on Forest Land and Timberland

12
Table 6—Volume of hardwood sawtimber trees by species on timberland, Kentucky, 2004
Volume
Species Board feet aCumulative
total %Cumulative
percent
Yellow-poplar 9,214,263,622 9,214,263,622 16 16White oak 8,258,002,442 17,472,266,064 15 31Chestnut oak 4,693,591,763 22,165,857,827 8 40Black oak 3,461,198,400 25,627,056,227 6 46Northern red oak 3,002,859,542 28,629,915,769 5 51Pignut hickory 2,857,903,610 31,487,819,379 5 56Scarlet oak 2,545,859,814 34,033,679,193 5 61Sugar maple 2,388,592,063 36,422,271,256 4 65American beech 2,114,064,293 38,536,335,549 4 69Red maple 1,850,676,258 40,387,011,807 3 72White ash 1,427,877,599 41,814,889,406 3 75Mockernut hickory 1,244,040,955 43,058,930,361 2 77Sycamore 1,203,066,806 44,261,997,167 2 79Sweetgum 939,971,293 45,201,968,460 2 81Green ash 882,856,040 46,084,824,500 2 82Shagbark hickory 781,394,298 46,866,218,798 1 84Chinkapin oak 697,702,916 47,563,921,714 1 85Southern red oak 676,407,642 48,240,329,356 1 86Post oak 643,516,992 48,883,846,348 1 87Blackgum 629,415,593 49,513,261,941 1 88American basswood 616,623,898 50,129,885,839 1 89Bitternut hickory 596,059,440 50,725,945,279 1 91Eastern cottonwood 510,223,219 51,236,168,498 1 92a The amount of board-foot volume was calculated for all sawtimber-size, growing-stock trees. One board foot is equivalent to a board 1-foot square by 1-inch thick. FIA used the International ¼-inch rule to determine board-foot volume.
Sawtimber Volume
In 2004, sawtimber volume on timberland was 60.4 billion board feet, up 32 percent since 1988. Hardwood species accounted for 56.0 billion board feet, or 93 percent, ofsawtimbervolume.Yellow-poplarand white oak are the most abundant hardwood species in terms of sawtimber volume on timberland (17.5 billion board feet or 31 percent combined) (table 6).
Chestnut oak, black oak, northern red oak, pignut hickory, scarlet oak, sugar maple, American beech, red maple, white ash, and mockernut hickory ranked next in sawtimber volume. Together they accounted for 46 percent of the sawtimber volume on timberland (25.6 billion board feet).
In 2004, sawtimber volume on timberland was 60.4 billion board feet, up 32 percent since 1988. Hardwood species accounted for 56.0 billion board feet, or 93 percent, of sawtimber volume.
Virginia pine accounted for most of the softwood sawtimber volume on timberland (1.3 billion board feet or 30 percent of the total) (table 7). However, shortleaf pine and eastern hemlock had more sawtimber volume than eastern redcedar, which ranked second in growing-stock volume on timberland. Baldcypress accounts for an estimated 10 percent of the softwood sawtimber inventory on timberland, but only 5 percent of the growing-stock volume on timberland.
Recently harvested logs. (photo by L. David Dwinell)
Tree Volume on Forest Land and Timberland

13
Table 7—Volume of softwood sawtimber trees by species on timberland, Kentucky, 2004
Volume
Species Board feet aCumulative
total %Cumulative
percent
Virginia pine 1,306,795,284 1,306,795,284 30 30 Shortleaf pine 736,175,588 2,042,970,872 17 47 Eastern hemlock 552,063,744 2,595,034,616 13 60 Eastern redcedar 466,934,685 3,061,969,301 11 71 Baldcypress 445,931,688 3,507,900,989 10 81 Eastern white pine 331,414,460 3,839,315,449 8 89 Pitch pine 285,501,723 4,124,817,172 7 95 Loblolly pine 213,384,084 4,338,201,256 5 100 a The amount of board-foot volume was calculated for all sawtimber-size, gowing-stock trees. One board foot is equivalent to a board 1-foot square by 1-inch thick. FIA used the International ¼-inch rule to determine board-foot volume.
Hardwood Sawtimber Volume Distribution by Tree Grade
Tree grade is a classification that indicates the suitability of individual sawtimber size trees to yield factory grade lumber or construction strength timbers. Factory grade lumber is used in furniture, flooring, pallets, and other products. Unlike log grade, tree grade applies to the whole tree and is generally evaluated before the tree is felled. FIA adapted the hardwood tree grading system devised by Hanks (1976). The FIA system is based on the amount and distribution of surface defects, the amount of rotten wood, and the location of the utilizable log or logs within the tree.
Each sawtimber-size, growing-stock hardwood tree was assigned a tree grade of 1 to 5. Trees suitable for factory lumber were graded 1 to 3, with 1 being the best and grade 3 the lowest quality. Grade 4 trees have too many defects to yield factory lumber but can yield construction timbers or railroad ties. Tree grade 5 indicates that the utilizable material is in the upper stem, too high above the ground for evaluation by field crews. While most of the tree data collected by FIA are quantitative measurements, e.g. diameter and tree height, tree grade is qualitative and somewhat subjective in nature.
Forests provide resources that fuel our growing world. (U.S. Forest Service photo)
Forest products are an important part of the Kentucky economy. (U.S. Forest Service photo)
Tree Volume on Forest Land and Timberland

14
Table 8—Volume of hardwood sawtimber by tree grade, Kentucky, 1988 and 2004
Tree grade
Volume a
1988Unadjusted
2004 Adjusted b
2004
million board feet
1 5,115 11,267 7,4972 10,976 15,805 15,5853 15,412 20,682 21,3294 7,045 5,144 8,7555 4,470 3,146 2,879
Total 43,018 56,044 56,045
percent
1 12 20 132 26 28 283 36 37 384 16 9 165 10 6 5
Total 100 100 100
Total unadjusted and adjusted volume differ due to rounding.a The amount of board-foot volume was calculated for all sawtimber-size, growing-stock trees. One board foot is equivalent to a board 1-foot square by 1-inch thick. FIA used the International ¼-inch rule to determine board-foot volume.b Adjusted volume from Zarnoch and Turner (2005).
Prior to completion of the inventory, an investigation of the quality assurance data revealed that field crews overestimated tree grade 1 and underestimated tree grade 4 classifications in Kentucky. Field crews did not significantly overestimate or underestimate other tree grade classifications. Two methods of rectifying the tree grade distribution were outlined in Zarnoch and Turner (2005). The results of that publication were only based on 80 percent of the collected plots. This bulletin relies on analyses that were conducted on 100 percent of the FIA tree grade data collected in Kentucky, and tree grade distributions were adjusted according to the methods of Zarnoch and Turner (2005).
Due to the overall increase in sawtimber volume and increases in the larger diameter classes, the total amount of hardwood sawtimber volume in factory lumber grades 1 to 3 increased (table 8). Grade 1 increased from 5.1 to 7.5 billion board feet (by 47 percent). Grade 2 increased from 11.0 to 15.6 billion board feet (by 42 percent). Grade 3 increased from 15.4 billion to 21.3 billion board feet (by 38 percent). While the total volume in these grades increased, the percentage-wise distribution of volume among the grades did not change much since 1988 (fig. 10).
Figure 10—(A) Percentage of 1988 hardwood sawtimber board-foot volume on timberland by tree grade; and (B) percentage of 2004 hardwood sawtimber board-foot volume on timberland by tree grade.
Tree Volume on Forest Land and Timberland

15
the period 1976 to 1988 (fig. 11). Mortality averaged 182.7 million cubic feet, more than double the 88.6 million cubic feet of mortality reported in the previous survey. As a result, the net growth rate averaged 470.0 million cubic feet annually between 1988 and 2004. It is noteworthy that in spite of the increased mortality, the current net growth rate is 23 percent greater than that reported in 1988. More than 98 percent of the total net annual growth was on land that was timberland in 1988 and was still timberland at remeasurement. The remaining 2 percent (8.1 million cubic feet) of net annual growth was on land that was previously nonforest but has reverted to timberland since 1988.
Timber removals averaged an estimated 311.8 million cubic feet per year during the most recent survey period. Although this is a 72-percent increase over the 181.0 million cubic feet of removals reported in 1988, this presents little cause for concern. The latest removals rate is about 66 percent of the average net annual growth of growing-stock volume on Kentucky’s timberland. That is, on average each year it is estimated that an additional 158.2 million cubic feet annually in volume is added to Kentucky’s growing-stock inventory on timberland (fig. 11).
Net Annual Growth, Removals, and Mortality on Timberland
Gross growth of wood volume is the amount of wood that grew onto the inventory since the last survey. Mortality is the amount of wood volume that died due to natural causes, by means other than human activity, over this same period. Net growth is gross growth minus mortality. Positive net growth indicates that more wood grew on timberland than was lost to mortality. At times, negative net growth is estimated and indicates that the volume lost to mortality between inventories was greater than any growth achieved during that same period. Removals volume is wood volume that is removed by human activities such as tree harvesting or other forest management practices, plus the volume of wood on forested areas that were converted to nonforest uses such as land clearing or urbanization.
Average annual rates of net growth, removals, and mortality on Kentucky’s timberland were calculated for the years since the previous inventory. Data from the remeasurement of P2 plots established in 1988 were used to calculate these rates of change for all live, growing-stock, and sawtimber volume on timberland (see “Inventory Methods” section in the appendix for detailed explanation). Growth, removals, and mortality were not estimated for reserved and other forest land. Annual rates of change for all live volume and growing-stock volume did not differ greatly. Therefore, discussion in this bulletin focuses on rates of change rates for volume of growing-stock and sawtimber on timberland.
Growth, removals, and mortality for timberland are detailed in tables A.17 through A.29. Gross growth of growing-stock volume on timberland averaged 652.7 million cubic feet annually from 1989 to 2004, a 38-percent increase since
Figure 11—Average annual gross growth, removals, mortality, and net change of growing-stock trees on timberland, Kentucky, 1964 to 2004.
The latest removals rate is about 66 percent of the average net annual growth of growing-stock volume on Kentucky’s timberland. That is, on average each year it is estimated that an additional 158.2 million cubic feet annually in volume is added to Kentucky’s growing-stock inventory on timberland.
Net Annual Growth, Removals, and Mortality on Timberland

16
As mentioned previously, removals can arise from two sources: (1) timber management activities and (2) land use change. Land use change is an important land management issue because of its potential effect on the future availability of forest resources. This is particularly true of conversion to an urban use, which typically results in a permanent loss of forest land from the timber base. An estimate of removals volume attributed to land use change is one way of quantifying this loss.
During the most recent survey, conversion of timberland to nonforest land uses accounted for an estimated 68.2 million cubic feet of the annual growing-stock removals. Conversion to agriculture and urban development accounted for nearly equal shares of annual removals volume on land converted from timberland to nonforest uses, of which 87 percent (59.2 million cubic feet annually) was on timberland owned by private individuals in 1988. The removals volume attributed to land use change was 22 percent of Kentucky’s total growing-stock removals, and was more than eight times the volume gained through reversion of land from nonforest to timberland. It appears that conversions from forest to nonforest
contribute considerably to the amount of volume in annual removals and far outpace any reversions to a forested condition.
Removals volume, in the case of land use change, can include live trees physically cut and removed from the site as well as live trees that are left standing on the acreage that is converted to a nonforest use. For the 2004 survey of Kentucky, the majority of the removals volume that resulted from land use change is a result of tree harvesting. However, one-quarter of that volume (17.3 million cubic feet annually) was in trees that were left standing after the land use change to a nonforest condition.
Net change in inventory volume is calculated by subtracting removals volume from net growth. If the net change is positive, then wood is being added to the inventory. Such is the case for Kentucky according to the 2004 survey results. Net change in growing-stock volume on Kentucky’s timberland averaged 158.2 million cubic feet each year since the previous survey. While that is a substantial annual increase in volume, it is a 22-percent decline from the 202.5 million cubic feet of annual gain in inventory reported in the 1988 survey.
A useful indicator of the status and condition of the timber resource is the net annual growth-to-removals ratio. A ratio >1indicatesthatmorewoodisbeingaddedto the inventory than is being removed, which is a desirable and sustainable condition with regard to timber resource management. Conversely, if the growth-to-removals ratio is <1, then the amount of wood being removed by human activity exceeds growth. While this is a less desirable situation, historically it has been short-lived, and becomes a concern only if it becomes a long-term continuing condition. Occasionally, this can occur due to large-scale natural events such as fire, hurricanes, and/or insect and disease epidemics.In the wildland-urban interface, an area undergoing slow development
may see a gradual shift from rural to developed uses; an area undergoing rapid development may see a sudden conversion, with little or no intermediate shift in uses. (photo by Hans Riekerk)
Net Annual Growth, Removals, and Mortality on Timberland

17
The current growth-to-removals ratio for growing-stock volume on timberland is 1.5 (470.0 million cubic feet of growth to 311.8 million cubic feet of removals volume) (tables A.18 and A.21). This means that since 1988, Kentucky’s timberland grew 1.5 cubic feet of growing-stock volume for every cubic foot of growing stock removed by timber harvesting or land use change. That is a 29-percent decline from the estimated 2:1 growth-to-removals ratio for growing-stock volume on timberland for the period between 1975 and 1988.
Gross growth of sawtimber volume on timberland averaged 2.7 billion board feet annually since the previous inventory. This is a 54-percent increase over the estimated 1.7 billion board feet of annual gross growth for the period 1974 to 1987. Annual mortality averaged 0.5 billion board feet during 1988 to 2003, more than double the annual sawtimber mortality rate of 0.2 billion board feet for 1974 to 1987. Subtracting current mortality from gross growth results in a net annual growth rate of 2.2 billion board feet as of 2004, a 43-percent increase over the 1988 estimate of 1.5 billion board feet.
Sawtimber removals averaged 1.2 billion board feet each year since the previous inventory. While that is twice as much as the 0.6 billion board feet reported in 1988, it is < 2 percent of the entire 2004 sawtimber inventory (60.4 billion board feet). Similarly, average annual removals of growing stock account for < 2 percent of the total growing-stock inventory in 2004 (fig. 12). After removals volume is accounted for, the average annual net gain of sawtimber volume on Kentucky’s timberland was approximately 1.0 billion board feet as of 2004. This is a 9-percent increase over the average annual net change in sawtimber volume reported for 1974 to 1987.
Sawtimber removals averaged 1.2 billion board feet each year since the previous inventory. While that is twice as much as the 0.6 billion board feet reported in 1988, it is < 2 percent of the entire 2004 sawtimber inventory (60.4 billion board feet).
The current growth-to-removals ratio for sawtimber volume on timberland is 1.8 (2.2 billion board feet of growth to 1.2 billion board feet of removals volume), meaning that nearly 2 board feet of sawtimber grew on timberland for each board foot of sawtimber volume removed. The growth-to-removals ratio for sawtimber volume on timberland has declined from the estimated 2.6 reported for 1974 to 1987. In addition, average annual sawtimber removals from timberland represent about 1.9 percent of the total sawtimber inventory on timberland in Kentucky.
The growth-to-removals rates for individual species generally reflected the overall positive growth rate for Kentucky as a whole, with a range of variation among species. Virginia pine was the only major
Figure 12—Average annual removals of growing stock vs. total growing-stock volume on timberland, Kentucky, 1975, 1988, and 2004.
Net Annual Growth, Removals, and Mortality on Timberland

18
Table 9—Growth-to-removals ratio of growing stock by species
SpeciesGrowth-to-removals
ratio of growing stock
Yellow-poplar 1.8White oak 1.5Chestnut oak 1.8Sugar maple 1.7Pignut hickory 3.3Red maple 2.5Black oak 0.9Northern red oak 1.1Scarlet oak 1.3American beech 1.4White ash 1.6Mockernut hickory 2.6Virginia pine 0.3Sycamore 1.6Green ash 3.6Shagbark hickory 3.4Sweetgum 2.8Blackgum 3.8Chinkapin oak 2.1Eastern redcedar 1.0Bitternut hickory 6.4American basswood 2.6Southern red oak 1.1Post oak 0.8Shortleaf pine 2.0Black walnut 1.1Black cherry 0.8Eastern hemlock 4.8
species for which growth was significantly lower than removals, with a calculated growth-to-removals ratio of 0.3. This excess of removals over growth was primarily due to relatively high mortality attributable to the southern pine beetle outbreak that occurred across the Southern region between 2000 and 2001. The net growth-to-removals ratios for the most abundant species, in terms of growing-stock volume on timberland, are listed in table 9.
The growth-to-removals ratio for sawtimber on Kentucky timberland has fluctuated between 1.6 and 2.7 between 1949 and 2004 (fig. 13). The estimated growth-to-removals ratio was largest for the 1963 inventory and smallest for the 1949 inventory. This is consistent with the finding that a large portion of Kentucky’s present-day timberland was regenerated around the late 1940s. The percentage of the total inventory removed annually has increased slightly since the 1988 estimate. However, for the majority of the last 50 years of the FIA survey, the percentage of Kentucky’s total sawtimber inventory that was removed has been declining. This trend corresponds to the significant increase in the standing inventory of sawtimber volume since 1949.
Figure 13—Growth-to-removals ratio, percent of total sawtimber inventory removed, and total inventory of sawtimber on Kentucky timberland, 1949 to 2004.
Net Annual Growth, Removals, and Mortality on Timberland

19
Influences of a Growing Population
For any parcel of forest land, numerous factors influence forest-related values and certain criteria must be considered before investments are made in commercial forestry. High or increasing forest population density (FPD) can indicate areas where increased population may critically affect decisions about forest resource use and forest management.
FPD at the county level is defined as the number of people in the county divided by the county’s area of forest land in square miles (Wear 2002). The resulting FPD, in people per square mile (ppsm) of forest land, provides an index that may be used to assess the relative availability of forest benefits to the residents in each county. Low FPD identifies counties that are considered more rural and where forest amenities are more readily available and easily accessed. As a county’s FPD increases the county transitions from rural to urban, a shift that generally results in increased pressures on available forest resources while decreasing the diversity of forest benefits.
More importantly perhaps, threshold FPD values can be identified to help determine the likelihood that commercial forestry will be practiced in a given area of forest. For instance, Wear (2002) found that at an FPD of 20 ppsm there is a 75 percent chance that commercial forestry would be practiced (Wear and others 1999). At just 45 ppsm, there is only a 50-percent chance that forest management is likely to occur. The probability of forest management approaches zero at an FPD of 150 ppsm. These threshold FPD values were used at the county level to identify areas in
Kentucky where human influences may affect forest land management activities or rates of land use change. At this scale, the FPD functions as a general indicator of potential effects of changes in population, but does not necessarily represent every forest acre in the county.
The 1988 and 2004 FPD estimates for Kentucky counties are shown in figures 14 and 15. The 1988 FPD values in figure 14 were derived by dividing the county population estimates from the 1980 census (U.S. Bureau of the Census 2002) by the county forest land estimates taken from the 1988 FIA survey report (Alerich 1990). The 2004 values in figure 15 are based on the 2000 census (U.S. Bureau of the Census 2002) county population estimates divided by the forest land area as estimated by the 2004 survey of Kentucky. Wear considered an FPD of 1,000 ppsm of forest an indication of a “saturated” condition (Wear 2002), and, therefore, limited the FPD estimates to that maximum value. That cap on FPD was used here, as well.
The results of a growing population. (photo by Larry Kohrnak)
Influences of a Growing Population

20
The 1988 FPD index values for Kentucky counties ranged from a rural condition with as few as 29 ppsm (Menifee County) to the maximum 1,000 in 4 sparsely forested, densely urbanized counties (Campbell, Fayette, Jefferson, and Kenton) (fig. 14).
Expectedly, the counties with high FPD values were near urban centers. Just 19 (16 percent) of Kentucky’s 120 counties could be considered rural in character in 1988 (having 50 or fewer ppsm of forest land). Most of the rural counties were in
Figure 14—Forest population density, Kentucky, 1988.
Figure 15—Forest population density, Kentucky, 2004.
Influences of a Growing Population

21
the heavily forested eastern third of the Commonwealth. A total of 68 counties had an FPD of 100 or more, including the 4 with the maximum value. As noted above, research has shown that the probability for long-term forest management decreases as FPD decreases to 150 ppsm. Although most people would still classify most of Kentucky as rural in nature, the Commonwealth’s increasing population will continue to influence forest resources.
Kentucky, like most Southern States, has experienced a general increase in population since 1980. This increase is reflected in the change in FPD as the number of ppsm of forest land has increased for nearly all counties. The minimum county FPD increased to 32 ppsm of forest (Owsley County). The number of counties averaging 50 or fewer ppsm of forest declined to 14, while counties with an FPD of 100 ppsm or more increased to 78 (fig. 15). As of 2004, 12 counties averaged at least 1,000 ppsm of forest land. Of those 12 counties, only Campbell, Kenton, and Boone remained at least 30 percent forested in 2004. The statewide average FPD for 2004 had increased to 216 ppsm, as Kentucky’s population rose to more than 4.0 million and total forest land declined to 18,704 square miles.
Tracking influences of population change on forest-related benefits can be particularly important in those heavily forested counties relied on for a large portion of Kentucky’s timber production. As of 2004, 43 of Kentucky’s counties were at least 50 percent forested, and the majority of these were in the eastern third of the Commonwealth
(fig. 1). Because of the high proportion of forest land in these counties, the recent increase in population had less effect on FPD. However, FPDs in many of these counties are approaching the thresholds used by Wear to help determine the potential for forest management activity. Thirty-one counties have an FPD of <100 ppsm, but only 10 of these counties have FPDs of 45 ppsm or less, the threshold where the odds of commercial forest activity approach 50:50. The remaining 12 counties haveaFPD>100ppsm,butonlyBoyd,Bullitt,andLaurelCountieshadFPDs>150ppsm, the threshold where long-term forest management is unlikely to occur.
At present, the potential for forest-related benefits and forest management activities in most of Kentucky’s counties remains relatively high. As population levels increase, however, forest benefits become scarce and the potential for commercial forest activity declines. Monitoring future changes in FPD values can help identify areas where forest management activities may be limited as counties transition from rural to urban.
At present, the potential for forest-related benefits and forest management activities in most of Kentucky’s counties remains relatively high. As population levels increase, however, forest benefits become scarce and the potential for commercial forest activity declines.
Influences of a Growing Population

22
Population and Future Land Use Change
Changes in population not only affect the availability of forest benefits but also can have a major influence on land use change. More people typically results in an increase in urbanization and a decline in rural land uses. Factors influencing the distribution of land between rural and urban uses include population density,
personal income, and housing values (Wear 2002). The distribution of rural land between agricultural and forest uses is determined by factors such as agricultural costs, land quality, and timber prices. Using these and other factors in an econometric model, Wear (2002) forecasts change in the allocation of land among forest, urban, and agricultural uses for Southern States from 1992 to 2020. The results for Kentucky are shown in figures 16, 17, and 18.
Figure 16—Predicted percent change in forest land, Kentucky, 1992 to 2020.
Figure 17—Predicted percent change in urban land, Kentucky, 1992 to 2020.
Population and Future Land Use Change

23
Figure 18—Predicted percent change in agriculture land, Kentucky, 1992 to 2020.
Forest land is not forecast to increase by more than 2 percent by 2020 in any Kentucky county (fig. 16). About one-fourth (31 counties) are forecast to lose forest area, with losses mostly falling in the 1 to 5 percent range (fig. 16). The few countiesprojectedtolose> 5 percent of their forest land (Boone, Bullitt, Campbell, Kenton, and Oldham) are close to existing major urban centers. Moreover, these counties had a small percentage of their land area in forest land to begin with, so small absolute declines can lead to large percentage changes. In real terms, the actual loss is likely to be minimal relative to total forest area for the Commonwealth.
Figure 17 shows the projected change in urban land use in Kentucky counties. All counties are predicted to have greater urban land use by 2020, although most are forecast to see increases of 5 percent or less
in urbanized area. The greater increases (>10percent)inurbanlanduseareforecastfor 17 Kentucky counties that already contain or are near large urban centers, including those in adjacent States.
When forest and/or urban land use within a county increases it usually does so at the expense of agricultural land use. All counties in Kentucky are forecast to lose agricultural land by 2020 (fig. 18). Urban land use is predicted to increase in every county, and urbanization rather than conversion to forest will probably account for most of the predicted decline in the State’s agricultural land area. The range of loss is expected to be similar to that for forest land; most counties will lose from 1 to 5 percent of their agricultural land base. Thosecountiesforecasttolose>10percentof their agricultural land are near expanding population centers.
Population and Future Land Use Change

24
The Owners of Kentucky’s Forest Land and Timberland
FIA collects information about who owns the forested land in each State or Commonwealth. Ownership information is collected in two ways. First, field crews collect ownership information on each forested P2 ground plot from publicly available data at local county offices. This ownership information is used to display area, density, and volume estimates by ownership classes such as nonindustrial private forest (NIPF) landowners or various public entities like the Forest Service. In addition, information is collected on land ownership by forest industry, defined as forest landowners who also own a
wood-processing facility. Secondly, the nonindustrial private landowners are sent a survey, known as the National Woodland Owner Survey (NWOS) that requests more detailed information about their objectives as owners of forest land.
Note: Federal law requires that private ownership information for FIA plots shall not be made available for public distribution. For this reason, ownership information is presented only as summaries across broad ownership classes and broad spatial scales.
Private individuals own 78 percent of the timberland in Kentucky (fig. 19). Nine percent is publicly administered
Multiple use property, common in Kentucky. (photo by Christopher M. Oswalt)
The Owners of Kentucky’s Forest Land and Timberland

25
Table 10—Area of timberland by survey unit and ownership class, Kentucky, 2004
Survey unit
Ownership class
All classes
National forest
Other public
Forest industry
Nonindustrial private
thousand acres
Eastern 1,794.6 71.3 39.5 24.6 1,659.2 Northern Cumberland 1,884.6 127.3 83.8 56.5 1,616.9 Southern Cumberland 2,063.2 319.5 43.8 49.3 1,650.6 Bluegrass 1,550.5 16.8 36.8 15.9 1,481.0 Pennyroyal 2,041.6 23.8 75.4 52.5 1,890.0 Western Coalfield 1,644.5 — 77.9 23.0 1,543.7 Western 668.9 31.5 82.7 57.0 497.7
Total 11,647.9 590.3 439.7 278.8 10,339.1
Numbers in rows and columns may not sum to totals due to rounding.— = no sample for the cell.
by local, Commonwealth, or Federal agencies. Slightly more than one-half of the public timberland is managed by the Forest Service. Forest industry owns about 2 percent of the timberland and other corporations own the remaining 11 percent (fig. 19).
About 76 percent of the timberland owned and administered by the Forest Service is within the Northern and Southern Cumberland survey units and makes up
Figure 19—Ownership of timberland, Kentucky, 2004.
the Daniel Boone National Forest. Other ownership patterns are similar across all survey units and mimic the overall averages for Kentucky as a whole (table 10).
Timberland owned and administered by the Daniel Boone National Forest, which is the only national forest in Kentucky, is in only five forest-type groups: (1) white-red-jack pine, (2) loblolly-shortleaf pine, (3) oak-pine, (4) oak-hickory, and (5) maple-
Private individuals own 78 percent of the timberland in Kentucky. Nine percent is publicly administered by local, Commonwealth, or Federal agencies. Forest industry owns about 2 percent of the timberland and other corporations own the remaining 11 percent.
The Owners of Kentucky’s Forest Land and Timberland

26
Table 11—Area of timberland by forest-type group and ownership class, Kentucky, 2004
Forest-type groupAll
classes
Ownership class
National forest
Other public
Forest industry
Nonindustrial private
thousand acres
White-red-jack pine 156.8 32.7 3.5 — 120.7Loblolly-shortleaf pine 244.2 13.5 1.7 2.3 226.7Pinyon-juniper 170.3 — 9.8 — 160.5Oak-pine 1,078.7 46.5 60.0 12.5 959.7Oak-hickory 8,436.3 481.4 292.4 216.9 7,445.7Oak-gum-cypress 80.0 — 14.4 17.3 48.2Elm-ash-cottonwood 645.4 — 38.2 5.6 601.6Maple-beech-birch 769.3 16.3 15.1 24.1 713.8Aspen-birch 4.1 — — — 4.1Nonstocked 62.8 — 4.6 — 58.2
Total 11,647.9 590.3 439.7 278.8 10,339.1
Numbers in rows and columns may not sum due to rounding.— = no sample for the cell.
Table 12—Area of timberland by stand-age class and ownership class, Kentucky, 2004
Stand-age class
All classes
Ownership class
National forest
Other public
Forest industry
Nonindustrial private
thousand acres
0–10 534.8 16.9 10.9 31.5 475.511–20 447.5 30.1 21.4 11.9 384.121–30 867.6 20.6 26.6 34.6 785.831–40 1,818.4 37.4 37.2 28.0 1,715.841–50 2,421.1 97.7 43.0 20.0 2,260.451–60 2,280.1 80.5 117.2 66.9 2,015.661–70 1,731.3 144.7 71.2 13.8 1,501.571–80 858.5 79.6 61.7 39.6 677.681–90 394.3 35.1 27.7 28.2 303.391–100 231.0 47.6 15.2 4.4 163.7101–110 14.5 — — — 14.5111–120 25.6 — 7.7 — 17.9121–130 4.5 — — — 4.5131–140 — — — — —141–150 3.9 — — — 3.9> 150 8.4 — — — 8.4
Total 11,647.9 590.3 439.7 278.8 10,339.1
Numbers in rows and columns may not sum to totals due to rounding.No stand age was given for 6.44 thousand acres of timberland.— = no sample for the cell.
beech-birch (table 11). The majority of the national forest timberland is in the oak-hickory forest-type group. NIPF timberland forests represent nine different forest- type groups.
A large percentage of Kentucky’s timberland areaisoccupiedbystands> 41 to 50 years of age (see “Stand Age” section). The majorityofthetimberlandinstands>100years of age is located on NIPF owned land (table 12). FIA estimates that forest industry currently has the greatest percentage (38 percent) of timberland in the younger (<40 years) age classes. The national forest has the lowest percentage of timberland in the younger age classes (18 percent), perhaps because timber harvesting on national forests in the South has been reduced over the last decade.
Young mixed hardwood forest. (photo courtesy of Kentucky Department of Forestry)
The Owners of Kentucky’s Forest Land and Timberland

27
Table 13—Area and number of family-owned forests in Kentucky by size of forest landholdings, 2004, according to respondents to the National Woodland Owner Survey
Size of forest landholdings
Area Ownerships
Survey respondentsAcres
Standard error Percent Number
Standard error Percent
acres - - - thousand - - - - - - thousand - - - count
1–9 702 140 7.7 263 66 62.3 26 10–49 2,241 218 24.7 107 12 25.3 83 50–99 2,052 212 22.6 32 3 7.6 76 100–499 3,159 240 34.8 19 2 4.5 117 500–999 513 123 5.7 1 < 1 0.2 19 1,000–4,999 378 109 4.2 < 1 < 1 < 0.1 14 5,000+ 27 52 0.3 < 1 < 1 < 0.1 1
Total 9,073 45 100.0 423 65 100.0 336
Landowner Characteristics and Possible Influences on Kentucky Forests
The National Woodland Owner Survey
The majority of Kentucky’s forest land is in private hands. Data from the latest NWOS (Butler and others 2005) suggest that there are about 423,000 private forest landowners in Kentucky (table 13) and that privately owned forest land area totals approximately 9.1 million acres or 76 percent of the forest land in the Commonwealth. The likelihood that a given tract of private forest land is managed depends on many factors, including the number of acres owned and the reasons for owning the land. (It should be noted that estimates based on the NWOS can vary slightly from those based on data from the FIA P2 plots due to definitional, methodological, and analytical differences between the two programs. When the results from both programs are viewed in tandem, as here, a clearer picture of forest ownership within Kentucky can emerge. However, readers must bear in mind that the number of survey respondents is relatively small in the case of the NWOS in Kentucky and that this can affect the accuracy of estimates based on NWOS data.)
area increase as the size of landholdings declines. Large landholdings (5,000+ acres) can reasonably be assumed to be available for timber harvesting, but only 27,000 acres of Kentucky’s 9.1 million acres of private forest land fall in this size category. Opportunities to conduct commercial forestry activities are generally considered not to exist where the size of forested parcels is below a given size threshold. In the case of Kentucky, the approximately 702,000 acres of family-owned forest in parcels smaller than 10 acres is assumed to be unavailable for sustained timber production.
Landowner Values and Attitudes: Reasons for Owning Forest Land
The widely varied values and attitudes of family forest landowners are reflected in the reasons they give for owning forest land. A plurality of landowners (243,000) selected the production of NTFPs as their most important reason for owning forest land (table 14). Other commonly selected reasons were aesthetics (221,000 landowners), privacy (209,000), and nature protection (176,000) (table 14). Land investment was ranked high (125,000 family forest landowners representing 4.1 million acres) (table 14). Timber production seemingly took a backseat in importance,
Parcel Size Influences Harvesting Decisions
Most private forest landowners in Kentucky have relatively small holdings. In fact, we estimate that 90 percent of the family-owned forest land in Kentucky is estimated to be in parcels of < 500 acres (table 13). As a rule, harvesting costs per unit
Landowner Characteristics and Possible Influences on Kentucky Forests

28
Table 14—Area and number of family-owned forests in Kentucky by reason for owning forest land, 2004, according to respondents to the National Woodland Owner Survey. Numbers include landowners who ranked each objective as (1) very important or (2) important on a seven-point Likert scale
Reason a
Area Ownerships
Survey respondentsAcres
Standard error Percent Number
Standard error Percent
- - - thousand - - - - - - thousand - - - count
Aesthetics 5,914 240 65.2 221 43 52.2 219 Nature protection 4,861 251 53.6 176 34 41.6 180 Land investment 4,051 250 44.6 125 30 29.6 150 Part of farm, home, or cabin b 3,646 247 40.2 150 42 35.5 135 Privacy 4,883 298 53.8 209 62 49.4 127 Family legacy 5,023 250 55.4 157 31 37.1 186 Nontimber forest products 5,860 241 64.6 243 45 57.4 217 Firewood production 1,134 170 12.5 64 29 15.1 42 Timber production 1,404 185 15.5 122 43 28.8 52 Hunting or fishing 2,187 217 24.1 39 10 9.2 81 Other recreation 3,808 249 42.0 125 33 29.6 141 No answer 2,808 233 30.9 158 49 37.4 104 a Categories are not exclusive.b Includes primary and secondary residences.
although 122,000 owners with 1.4 million acres did indicate that this was an important reason for forest land ownership. However, these categories are not exclusive, so those who list aesthetics as their most important reason for ownership are not necessarily averse to timber harvesting. In fact, many owners list timber harvest or other forestry activity as a recent event on their land.
Recent Forestry Activity: Timber Harvest and Recreation Are Prominent
According to the NWOS, timber harvest occurred on nearly 5.7 million acres of Kentucky’s family forest land, with almost
3.0 million acres harvested within the past 5 years (tables 15 and 16). These acreages are estimated to be on about 170,000 and 84,000 different ownerships, respectively. Other activities related to timber management occurring in the past 5 years include tree planting by an estimated 24,000 ownerships, and the application of chemicals by 38,000 ownerships. Recent efforts to reduce fire hazards occurred on about 837,000 acres. Private recreation was another major forestry activity. Some 135,000 family forest owners with 4.7 million acres listed this as an activity occurring in the past 5 years on their forest land. Public recreation occurred on 1.2 million acres of family-owned forest land.
Landowner Characteristics and Possible Influences on Kentucky Forests

29
Table 16—Number of family-owned forests along with associated area in Kentucky by reported timber harvesting activities, 2004, according to respondents to the National Woodland Owner Survey
Activity
Area Ownerships
Survey respondentsAcres
Standard error Percent Number
Standard error Percent
- - - thousand - - - - - - thousand - - - count
Timber harvestYes 5,698 244 62.8 170 33 40.2 211 No 3,213 241 35.4 216 52 51.1 119 No answer 162 79 1.8 36 28 8.5 6
Products harvested a
Saw logs 4,078 251 44.9 100 29 23.6 151 Pulpwood 729 142 8.0 14 7 3.3 27 Firewood 1,836 204 20.2 40 9 9.5 68 Other 1,647 196 18.2 38 12 9.0 61
Received professional consultation 1,161 171 12.8 19 5 4.5 43
Recent harvest (within 5 years) 2,950 277 32.5 84 19 19.9 79 a Categories are not exclusive.
Table 15—Area and number of family-owned forests in Kentucky by recent (past 5 years) forestry activity, 2004, according to respondents to the National Woodland Owner Survey
Activity a
Area Ownerships
Survey respondentsAcres
Standard error Percent Number
Standard error Percent
- - - thousand - - - - - - thousand - - - count
Timber harvest 2,950 277 32.5 84 19 19.9 79 Collection of NTFPs 1,531 223 16.9 86 39 20.3 41 Site preparation 189 84 2.1 8 7 1.9 7 Tree planting 891 154 9.8 24 9 5.7 33 Fire hazard reduction 837 150 9.2 53 28 12.5 31 Application of chemicals 486 120 5.4 38 27 9.0 18 Road/trail maintenance 2,349 222 25.9 59 27 13.9 87 Wildlife habitat improvement 1,323 181 14.6 46 27 10.9 49 Posting land 3,076 284 33.9 43 10 10.2 80 Private recreation 4,729 299 52.1 135 41 31.9 123 Public recreation 1,153 202 12.7 14 4 3.3 30 Cost share 135 75 1.5 1 1 0.2 5 Conservation easement b 81 47 0.9 2 1 0.5 3 Green certification b 162 79 1.8 3 3 0.7 6
NTFPs = nontimber forest products.a Categories are not exclusive.b Not limited to past 5 years.
Landowner Characteristics and Possible Influences on Kentucky Forests

30
Table 17—Area and number of family-owned forests in Kentucky by management plan, advice sought, and advice source, 2004, according to respondents to the National Woodland Owner Survey
Activity
Area Ownerships
Survey respondentsAcres
Standard error Percent Number
Standard error Percent
- - - thousand - - - - - - thousand - - - count
Written management planYes 675 137 7.4 6 2 1.4 25No 7,966 168 87.8 380 60 89.8 295No answer 432 115 4.8 36 27 8.5 16
Sought adviceYes 1,539 191 17.0 49 28 11.6 57No 7,372 199 81.3 343 54 81.1 273No answer 162 79 1.8 31 27 7.3 6
Advice source a
State forestry agency 1,053 165 11.6 14 4 3.3 39Extension 270 95 3.0 5 3 1.2 10Other State agency 81 64 0.9 1 1 0.2 3Federal agency 243 92 2.7 4 2 0.9 9Private consultant 297 99 3.3 4 3 0.9 11Forest industry forester 27 52 0.3 0 0 0.0 1Logger 351 105 3.9 2 1 0.5 13Other landowner 162 79 1.8 28 27 6.6 6
a Categories are not exclusive.
Few Landowners Develop a Management Plan or Seek Professional Advice
The reasons family forest landowners have for owning forest land may also influence these landowners’ decision about whether to develop a management plan or seek advice in managing their land for timber production, or other forest-related amenities. Only 1 percent of the 423,000 private landowners have a written management plan to help guide their land use decisions (table 17). These owners control about 7 percent or 675,000 acres of Kentucky’s 9.1 million acres of family-owned forest land (table 17). Although few have a written plan, some 49,000 family forest landowners (12 percent) at least sought advice about managing their land. Of those, nearly one-half (24,000) consulted with experts from Commonwealth forestry agencies or other State agencies such as extension services, or from a Federal agency. Twenty-eight thousand family
forest owners sought advice from other landowners.
These findings indicate that Kentucky’s forestry community should encourage more forest landowners to take advantage of professional forest management expertise. Professional opinion is that the best forest management occurs when landowners develop a written plan based on the appropriate scientific and technical expertise that only a forestry professional can provide. It has been demonstrated that the advantages of professionally guided forest land management include producing timber in greater quantity and of higher quality, improvement in wildlife habitat and environmental quality, and improved benefits from other forest related resources [Kentucky Legislative Research Commission (LRC) 2003]. The LRC study proposed ways to foster active forest management through lower tax burdens, increased awareness of existing financial assistance opportunities such as the Forest Stewardship Program, and other incentives.
Landowner Characteristics and Possible Influences on Kentucky Forests

31
Table 18—Bureau of the Census statistics for forest and forest products industries in Kentucky, 1997 to 2003
Year Employees PayrollValue of
shipments
number - - thousand dollars - -
2003 21,514 714,148 5,809,9122002 22,728 737,401 5,945,0862001 22,808 689,564 5,441,2622000 23,257 692,033 2,707,1691999 22,388 660,320 4,963,7561998 22,492 620,620 4,551,6761997 21,635 590,756 4,223,931
Timber Products and the Economy
Kentucky’s forests are a major asset and are critical to the economic, social, and ecological well-being of the Commonwealth. Kentucky’s forest products industry is an important component of the Commonwealth’s economy. According to IMpact Analysis for PLANning (Abt 2002), a model generated by the Forest Service, the total economic importance of Kentucky’s forests is nearly $8.7 billion annually. The $8.7 billion includes all direct, indirect, and induced effects resulting from forest industry operations.
In 2003, about 297 sawmills, pulpwood mills, and other primary wood-processing plants distributed across Kentucky (fig. 20) directly employed more than 21,500 individuals, with an annual payroll of $714 million (table 18). In 2003, the value of shipments in Kentucky’s wood products manufacturing sector totaled more than $5.8 billion (U.S. Bureau of the Census 2003). Nontimber benefits of the forest such as specialty forest products, recreation, water, wildlife habitat, and aesthetic values also contribute greatly to Kentucky’s economy and the well-being of the general population. In 2004, about the same number of sawmills that operated in 2003 directly employed more than 22,500 individuals and had an annual payroll of $788 million (U.S. Bureau of the Census 2004). In 2004, the value of shipments in Kentucky’s wood products manufacturing sector totaled more than $6.3 billion (U.S. Bureau of the Census
In 2003, about 297 sawmills, pulpwood mills, and other primary wood-processing plants distributed across Kentucky directly employed more than 21,500 individuals, with an annual payroll of $714 million.
Figure 20—Primary wood-using mills by region, Kentucky, 2003.
Timber Products and the Economy

32
2004), up 8 percent since the previous year, which represents a significant contribution to Kentucky’s economy.
This section presents estimates of average annual roundwood product output and timber removals for the period 1988 through 2003. Estimates of timber product output (TPO) and plant residues were obtained from canvasses (questionnaires) sent to all primary wood-using mills in the State. The canvasses are used to determine the types and amount of roundwood, i.e. saw logs, pulpwood, poles, etc., received by each mill, the county of origin of the wood, the species used, and how the mills dispose of the bark and wood residues produced. The canvasses are conducted every 2 years by personnel from the Kentucky Division of Forestry and the Southern Research Station. These data are used to augment FIA’s annual inventory of timber removals by providing the product proportions for the part of removals that is used for products. Individual studies are necessary to track trends and changes in product output levels. Total product output, averaged over the survey period, is the sum of the volume of roundwood products from all sources (growing stock and other sources) and the volume of plant byproducts, or the mill residues.
Total output of timber products, which includes domestic fuelwood and plant byproducts, averaged nearly 287 million cubic feet per year between 1988 and 2003, a 36-percent increase since the period between 1975 and 1987 (see table A.31). Roundwood products made up 74 percent of the total output and plant byproducts made up the remainder. Hardwood species accounted for 273 million cubic feet (95 percent) of total product output volume. Softwoods accounted for 14 million cubic feet (5 percent) of total product output volume.
With the exception of fuelwood, the distribution of total volume among products has changed little over the past four survey periods. Saw logs have been and remain the most important wood product produced by Kentucky’s mills. Production of saw logs, which are used mainly in the manufacture of dimensional lumber, increased to 160 million cubic feet, up nearly 38 percent since 1986. Saw-log output accounted for 56 percent of the total TPO volume between 1988 and 2003, compared with 55 percent between 1975 and 1987, 54 percent between 1963 and 1974, 53 percent between 1949 and 1962, and 42 percent between 1939 and 1948 (fig. 21).
Figure 21—Average annual output of timber products by product and species group, Kentucky, 1948 to 2003.
Total output of timber products, which includes domestic fuelwood and plant byproducts, averaged nearly 287 million cubic feet per year between 1988 and 2003, a 36-percent increase since the period between 1975 and 1987.
Timber Products Output and Removals

33
Table 19—Volume of timber removals by removals class, species group, and source, Kentucky, 1988 to 2003
Source
Removals class and species group
All sources
Growing stock
Nongrowing stock
million board feet a
Roundwood products Softwood 10.6 10.0 0.6 Hardwood 202.9 176.1 26.8
Total 213.5 186.0 27.5
Logging residues Softwood 4.8 1.6 3.2 Hardwood 106.9 44.4 62.5
Total 111.7 46.0 65.7
Other removals Softwood 11.7 11.1 0.6 Hardwood 76.1 68.6 7.5
Total 87.8 79.7 8.1
Total removals Softwood 27.1 22.7 4.4 Hardwood 385.9 289.1 96.8
Total 413.0 311.8 101.2
Numbers in rows and columns may not sum to totals due to rounding.a International ¼-inch rule.
(unused portions of trees left in the woods), and other removals (removals attributed to land clearing or land use changes) from growing-stock and nongrowing-stock sources. Removals from all sources, for softwoods and hardwoods combined, totaled 413 million cubic feet (table 19). Hardwoods accounted for 93 percent of total removals. Volume used for roundwood products totaled 213 million cubic feet, or 52 percent of total removals. Logging residues and other removals amounted to 112 million cubic feet (27 percent) and 88 million cubic feet (21 percent), respectively.
Pulpwood production increased from 35 million cubic feet in 1986 to 53 million cubic feet. Pulpwood output increased 52 percent, and accounted for 18 percent of the total output volume, about the same proportion as during the past two survey periods. Other industrial products accounted for 45 million cubic feet, or 16 percent, of total product output. Veneer and composite panel production amounted to 6 million cubic feet each and together accounted for 4 percent of total output. Fuelwood output declined 30 percent to 17 million cubic feet, but still accounted for 6 percent of total product output.
Annual output of roundwood products (including fuelwood) averaged 214 million cubic feet between 1986 and 2003, up 32 percent since the previous survey period. Eighty-seven percent of the roundwood products volume came from growing-stock trees (table A.32). Of the roundwood products volume obtained from growing-stock trees, 89 percent came from sawtimber trees and 11 percent from poletimber trees (table A.32). The volume obtained from other sources, which include cull trees, salvable dead trees, and stumps and tops of harvested trees, was 28 million cubic feet, down from 69 million cubic feet since the previous survey period.
Total timber removals, averaged over the time period, are the sum of the volume of roundwood products, logging residues
Timber Products Output and Removals

34
Table 20—Distribution of nontimber forest product enterprises by State and type of enterprise, 2003
State EdibleSpecialty
woodFloral and decorative Landscape Medicinal Total
number
Alabama 221 377 378 377 58 1,411Arkansas 224 257 208 120 251 1,060Florida 216 127 182 837 50 1,412Georgia 250 186 384 1,086 68 1,974Kentucky 49 826 562 373 2,670 4,921Louisiana 249 119 94 81 8 551Mississippi 234 252 207 192 15 900North Carolina 526 452 3,283 1,326 770 6,357Oklahoma 275 148 75 65 14 577South Carolina 89 81 145 216 25 556Tennessee 390 794 481 593 314 2,572Texas 438 210 200 196 27 1,071Virginia 239 370 698 376 262 1,945
Total 3,841 4,199 6,897 5,838 4,532 25,307
Percent 15 17 27 23 18 100
Nontimber Forest Products
Kentucky has been a major producer of NTFPs since the earliest European settlers moved into the region. These products originate from fungi, moss, lichen, herbs, vines, shrubs, or trees. They may include roots, tubers, leaves, bark, twigs, branches, fruit, sap, and wood that is gathered but not cut from timber. The products are not commonly listed as outputs of the forest products industry, but they are important in the herbal medicine, culinary, crafts, and floral industries. They range from edible products such as fruits, nuts, mushrooms, ramps, and maple syrup to medicinal type products such as ginseng and bloodroot, to ornamental products such as galax, pine tips for garlands, and grapevines, to landscape products such as native plants, and to specialty woods such as burl and crotch wood for fine crafts.
Chamberlain and Predny (2004) estimated, on the basis of a survey of county extension agents, that Kentucky had 4,921 NTFP firms as of April 2003. Within the region, the Commonwealth ranked second behind North Carolina in total number of NTFP enterprises, accounting for 19 percent of the total (table 20). Kentucky
Locally harvested ramps are an important plant in Kentucky and other States in the Appalachian Mountain Region. (photo by James L. Chamberlain)
Nontimber Forest Products

35
ranked number one in the South in firms specializing in medicinal plant products, with 2,670 such firms (59 percent of the regional total). The Commonwealth ranked number one for specialty wood products firms (826 firms or 20 percent of the regional total of all specialty wood NTFP enterprises), and second for firms specializing in edible forest products (490 firms or 13 percent of the regional total). Kentucky ranked third in firms that make floral and decorative products from wild-harvested materials (562 firms or 8 percent of the regional total), and seventh in the region for firms that use native plants and plants collected from the wild for landscaping (373 firms or 6 percent of the total).
According to county extension agents, Kentucky has a vast diversity of enterprises that use nontimber forests resources to manufacture products (table 20). Fifty-four percent of the 4,921 NTFP enterprises in Kentucky deal with medicinal plants. Seventeen percent of the NTFP firms in the Commonwealth manufacture specialty wood products, and 10 percent manufacture culinary items from forest harvested
resources. Floral and decorative enterprises account for 11 percent of Kentucky’s NTFP industry, and landscaping firms that use native plants or plants collected from the wild account for about 8 percent.
According to county extension agents, Kentucky has a vast diversity of enterprises that use nontimber forests resources to manufacture products.
A great variety of medicinal plants grow in the forests of Kentucky. Many are harvested for the burgeoning herbal medicinal industry. Chamberlain (2006) estimated that the Appalachian forests, which are some of the most productive temperate hardwood forests in the world, are the principal source of>50commonlymarketedmedicinalplant species. Some of the more popular medicinal plants in the markets today include black cohosh, bloodroot, goldenseal, false unicorn, and slippery elm. Very little information about the market value of these plants is available, but that which is gives us valuable insight.
Goldenseal is one of many plants in Kentucky with medicinal uses. (photo courtesy of Kentucky Department of Forestry)
Nontimber Forest Products

36
Kentucky is one of six to eight States or Commonwealths in which black cohosh and goldenseal are harvested from the forests (table 20). Evidence suggests that overall demand for black cohosh roots grewfrom183,000poundsin1999to>
500,000poundsin2002,anincreaseof>
170 percent (Predny and Chamberlain, in press). In 2001, about 420,000 pounds of black cohosh with an estimated market value of about $2.25 million were harvested from forests of the Eastern United States. About 250,000 pounds of goldenseal was purchased in 2000, and demand was increasing steadily at that time (Predny and Chamberlain 2005). Unfortunately, it is not possible at this time to determine the portion of these harvests that originates from Kentucky’s forests. However, if the market dynamics for these and other medicinal plants mirror those for American ginseng, these plants are significant contributors to rural economies.
American ginseng has been collected from eastern hardwood forests since the mid-1700s, and Kentucky has been a major producer for much of the last 300 years. Since1995,> 212,000 pounds of ginseng have been harvested from Kentucky forests, generating in excess of $63 million in direct payments to harvesters. The Commonwealth has been ranked the number one supplier of wild-harvested ginseng for the last 10 years. Over the past 10 years, Kentucky supplied about 25 percent of the total amount of ginseng wild-harvested in the United States (fig. 22). In 2004, Kentucky ginseng accounted for 28 percent of the total harvest of wild ginseng in the United States.
Kentucky has more counties producing larger volumes of wild-harvested ginseng than any other State or Commonwealth (fig.23).Twenty-eightcountiessupplied>
501 pounds of wild-harvested ginseng each in 1999 and 2000, and 3 of the counties supplied>1,000poundsineachofthose2years. At an average of $300 per pound paid to harvesters, estimated direct payments to these rural counties during this period ranged from $120,000 to $300,000. The total contribution to Kentucky’s economy far exceeds these values.
Almost every county in Kentucky reported the harvest of wild ginseng in 2003 (fig. 24). Most of the counties producing large quantities of wild-harvested ginseng are located in the eastern portion of the Commonwealth. Five counties (Knox, Harlan, Bell, Pike, and Perry) each produced>1,100poundsofwildginsengand accounted for about 4.2 percent of Kentucky’s total harvest. Of these, Knox County supplied the most—about 1,600
Figure 22—Distribution of State ginseng harvests, 1995 to 2004.
Nontimber Forest Products

37
Figure 23—American ginseng average harvest by U.S. county, 1999 to 2000.
Figure 24—Distribution of ginseng harvest by county, Kentucky, 2003.
Nontimber Forest Products

38
pounds of wild-harvested ginseng. Four other counties (Casey, Clay, Wayne, and Leslie) supplied about 2 percent of the total 2003 ginseng harvest. Fifty-four percent of the counties produce < 60 pounds of wild-harvested ginseng each. About 27 percent supply between 60 and 305 pounds each, while about 19 percent of the counties supplied>305poundseach.
From 1981 through 2004, rural residents of Kentuckydugandsold>465,000poundsofwild-harvested ginseng (fig. 25). Over these 24 years, Kentucky supplied on average about 21,200 pounds each year. Based on a price paid to diggers of $300 per pound, about $6.4 million is added to the State’s economy each year from the sale of wild-harvested ginseng.
The Daniel Boone National Forest in Kentucky is a source for many nontimber products. The national forests can generate revenue by selling permits that allow people to collect these products. In 2004, national forests in Region 8 (the Southern Region) generated about $169,000 from such permit sales. The Daniel Boone National Forest
generated $4,269 from permit sales, and Kentucky ranked eighth in the region. This revenue came from the sale of permits to collect various NTFPs—including fuelwood, Christmas trees, roots, moss, herbs, and vines. Fuelwood permit sales accounted for 58 percent of the total. The collection of roots, perhaps for medicinal use, generated about 30 percent of the total revenue. The sale of permits for moss, herbs, vines, and Christmas trees generated about 12 percent of the NTFP revenues. The general perception among NTFP experts is that revenues from the sale of permits represent about 10 percent of actual market value. This suggests that permitted removal of NTFPs from the Daniel Boone National Forest potentially had a market value of>$42,000,whichisprobablyaveryconservative estimate. Market valuation for most NTFPs is not fully developed and there is no way of knowing how much is taken off the forest without permits.
Floral and decorative products include Christmas trees, vines, foliage, moss, needles, limbs, boughs, and cones. Unfortunately, data for most of these is
Figure 25—Kentucky ginseng harvest history, 1981 to 2004.
Nontimber Forest Products

39
lacking. Christmas trees are the only floral and decorative product for which data are readily available. The 2002 census revealed that Kentucky had 230 Christmas tree farms, of which 123 were harvesting trees. The remaining 107 farms will begin harvesting over the next several years. More than 2,000 acres of productive farmland is dedicated to Christmas tree production. In 2002, Kentucky produced about 1.5 percent (56,473) of the total number of Christmas trees harvested in the South. Conners (2003) estimated the value of Kentucky’s Christmas tree industry at $500,000 to $750,000 annually.
Edible forest products include berries, wild onions (ramps), nuts, and sap. In Kentucky, sales of hulled black walnuts total $400,000 to $700,000 each year (Conners 2003). In 2002, about 3,200,000 pounds of black walnuts were collected from forests in Kentucky and sold by hullers, who received about $432,000 for them (Conners 2003). In that same year, pickers made about
$320,000 from the sale of black walnuts. In 2002, one Mercer County huller sold 257,000 pounds of hulled black walnuts, with an estimated value of $34,695. The total value of Kentucky’s 2002 walnut crop was estimated at $2,096,000, which consisted of nut meat ($1,344,000), shells ($320,000), and price to pickers and hullers ($432,000). Kentucky is one of two States or Commonwealths in the South that have maple syrup farms for which statistics are available. In 2002, 38 maple syrup farms in Kentucky had a total of 4,142 active taps. These farms produced about 416 gallons of syrup, representing about 9 percent of total maple syrup production in the Southern Region (Chamberlain and Predny 2004).
The NTFPs discussed here are only some of those on which Kentucky’s NTFP industry is based. The available data show that the NTFP industry is a significant contributor to Kentucky’s rural economy. Thus, the collection and sale of NTFPs may benefit tens of thousands of Kentucky residents.
Black walnut is an important tree species in Kentucky. (photo by Paul Wray, Iowa State University, bugwood.org)
Nontimber Forest Products

40
Forest Health Indicators in Kentucky
With the development of the Healthy Forest Initiative and the Forest Service Chief’s identification of Four Threats to American Forests in the 21st Century, forest health has become a topic of great interest to the scientific and lay community. The Forest Service currently monitors forest health by measuring a combination of indicators much as a doctor would monitor a patient through a combination of discrete measurements like temperature, blood pressure, and weight (McCune 2000). Forest health indicators measured by FIA include crown structure, down woody material (DWM), soil characteristics, vegetation structure and diversity, lichen communities, and ozone damage. Through analysis of each of these variables at statewide, regional, and national levels, scientists are able to identify potential problems and pinpoint areas of concern for intensified research programs. Additionally, trends may be detected and changes tracked over time. Analyses of vegetation structure and diversity and lichen communities are not included in this bulletin.
The Forest Service currently monitors forest health by measuring a combination of indicators much as a doctor would monitor a patient through a combination of discrete measurements like temperature, blood pressure, and weight.
The forest health information presented here reflects monitoring conducted by two programs that were merged in 2000:
Forest Health Monitoring (FHM) and FIA. FHM initially developed and implemented procedures for collecting data related to forest health. After the merger with FIA, data collection has been implemented in every State resulting in the development of the FIA “phase 3” (forest health) subset of FIA data collection plots (Stolte 2001). In Kentucky, forest health data for variables related to crown structure, DWM, soil characteristics, and ozone damage were collected. Vegetation structure and diversity and lichen community sampling will be added in the future.
Methodology
FIA collects data on forest health variables on a subset of P2 sample plots. The subset is about 1/16th of the P2 dataset and is called phase 3 (P3) of the forest inventory. The data collected on one P3 plot represents conditions on about 96,000 ground acres. Therefore, P3 data are coarse descriptions and are meant to be used as general indicators of overall forest health over a large geographic area. Analyses of P3 data are inappropriate at levels below multiple county aggregates.
FIA collects P3 data for variables related to tree crown health, DWM, ozone damage, lichen diversity, soil composition, and, in some regions, nonwoody understory vegetation and diversity. Tree crown health, DWM, soil composition, and nonwoody understory vegetation and diversity measurements are collected using the same plot structure used during P2 data collection, while lichen data are collected within a 120-foot radius circle centered on subplot 1 of each FIA P3 field plot.
Forest Health Indicators in Kentucky

41
Ideally, data for 20 percent of P3 plots are collected annually (one “panel”), and a data cycle is complete in 5 years. Five years of P3 data present the most accurate statistical representation of the forest land surveyed. Currently, most States have < 5 years’ worth of continuously collected forest health data on permanent P3 plots, so reporting is restricted to the available data. Sometimes, restricted sample sizes may result in the exclusion of a variable from analysis until a complete cycle of data has been collected. Future reports will incorporate analysis of data for the full suite of P3 plots. Additional details related to P3 of FIA, including field data collection manuals, can be found by following the “FIA Library” link from our Web site at http://fia.fs.fed.us/.
Deadwood on Kentucky Forest Land
Deadwood plays a range of critical roles in forest ecosystems, from serving as nurse logs for the growth of plants and moss to providing wildlife habitat and functioning as a fuel (Bate and others 2004, Waddell 2002). A multitude of organisms rely on DWM to provide structural or thermal protection, or both, foraging sites, or travel corridors (Bate and others 2004). For example, Mannan and others (1996) describe 13 small mammal species that depend on coarse woody material for all 3 of their life-history requirements: food, shelter, and reproduction. Where too much deadwood is present, however, it can sustain damaging wildfires. Therefore, forest managers must strike a balance between maintaining enough deadwood to sustain wildlife, insect, and plant communities and avoiding dangerously high fuel accumulations.
Forest managers must strike a balance between maintaining enough deadwood to sustain wildlife, insect, and plant communities and avoiding dangerously high fuel accumulations.
Despite the importance of deadwood to a variety of organisms and ecosystem functions, little attention has been given to the distribution of woody material on the landscape until relatively recently (Waddell 2002). FIA quantifies the amount and extent of fine and coarse woody debris on the forested landscape, and the number of snags present in the forest.
Deadwood as habitat—Snags, hollow logs, and brush piles provide important habitat for vertebrate communities. Decaying material, litter, and duff provide important habitat for micro- and macroinvertebrates, all of which play important roles in detritus recycling and, therefore, the ecology of forested systems. Many types of vegetation rely on decaying plant material as a growth substrate. Deadwood is not distributed evenly across the landscape, nor is it equally important to wildlife in every forest. For example, live deciduous trees in eastern forests often contain cavities that provide habitat for cavity-nesting animals, decreasing the number of standing dead trees necessary to provide quality nest sites (Mannan and others 1996). In contrast, cavity-nesting animals living in the coniferous forests of the Southeastern United States and the Western United States may be more dependent on standing dead trees as appropriate habitat, increasing the number necessary to provide optimum
Forest Health Indicators in Kentucky

42
habitat (Mannan and others 1996). The size and stage of decay of a snag also influence the type and numbers of animals that can use the tree. Generally, trees >14.0 inches d.b.h. are preferred for nesting, though snags of any size or decay class can provide food resources for multiple animals (Mannan and others 1996). The optimal number of snags to retain for wildlife on each acre of forest land depends on multiple conditions, including the management goals for the forest, the wildlife species present or desired, and the size, age, and species of trees present.
FIA collects data on snags on all P2 sample plots in Kentucky. There are about 129 million standing dead trees on Kentucky’s forest land today. In Kentucky, hardwoods provide more snags than do softwoods, but the ratio of softwood snags to hardwood snags was higher in the Southern Cumberland and Northern Cumberland regions, areas heavily impacted by the southern pine beetle (fig. 26). Small snags (5.0 to 13.9 inches d.b.h.) outnumber large snags(>14.0inchesd.b.h.)by8to1.Thereare, on average, 11 snags per acre of forest
land in Kentucky. The number of snags per acre varies across the Commonwealth, with the lowest per-acre concentrations in the Western and Western Coalfield regions, and the highest ones in the Bluegrass and Southern Cumberland regions (fig. 27).
Hollow logs and other types of coarse woody material also provide shelter or food for many species during at least some part of their life. Information on coarse woody debris was collected on 62 forest health plots across Kentucky from 2001 to 2003. Measurements of the size and determination of the decay class of individual pieces of debris provide information about the suitability of logs for use by wildlife and the accumulation of new dead material onto the forest floor. Most of the coarse debris sampled in 2001 to 2003 was moderately decayed (decay classes 2 and 3) (fig. 28), and fell into the smaller diameter classes (table A.36). The largest quantity of coarse woody debris occurred in the loblolly-shortleaf pine, oak-pine, and oak-hickory forest-type groups. Per-acre concentrations of down deadwood (fine and coarse material combined) were greater in
Figure 26—Number of standing dead trees on forest land by major species group and FIA reporting unit, Kentucky.
Forest Health Indicators in Kentucky

43
Figure 27—Predictive map of snags per acre by FIA reporting unit using inverse distance weighting, Kentucky, nonforest areas have been removed.
Figure 28—Proportion of coarse woody materials by decay class, Kentucky.
Forest Health Indicators in Kentucky

44
the Northern and Southern Cumberland regions, and in small areas of the Western Coalfield region, than elsewhere in Kentucky (fig. 29).
Deadwood as fuel—Fire plays an important role in shaping landscape communities. As a natural event and a silvicultural tool, fire influences every aspect of forest ecology, including soil chemistry, wildlife habitat, biomass storage, and plant composition (Barnes and others 1998). Some tree species are dependent on forest fires to complete portions of their life cycles. For example, some conifers have evolved serotinous cones that require heat from fire to open. Other species have developed thick leaves and bark that resist fire damage, or seeds that require heat for germination (Barnes and others 1998). Conditions created by forest fires are also favorable for many wildlife species. Forest fires stimulate plant growth that benefits some small and large game in southern forests. Fires also promote the development of live-tree cavities suitable for black bears (Mannan and others 1996).
Forest fires are not always beneficial, however. Federal spending on wildfire suppression and prevention reaches as
much as $500 million a year (Butry and others 2001) and continues to climb. Beyond economic losses, catastrophic fires increase air pollution through the emission of carbon monoxide, hydrocarbons, and volatile organic compounds (McMahon 1983). Additionally, intense wildfires can increase the rate of erosion on steep sites as soils are exposed (Barnes and others 1998).
To ignite and burn, a fire requires three primary ingredients: (1) an ignition source, (2) oxygen, and (3) fuel. Surface fuels include the duff (partially decomposed organic matter) and litter (leaves, twigs, and other small pieces of organic matter) layers of the forest floor, fine woody debris and slash piles, and finally, coarse woody debris (McMahon 1983). The accumulation of large amounts of surface fuels, particularly fine woody debris and slash, increases the risk of catastrophic wildfire given the appropriate weather conditions and an ignition source. Small (1-hour and 10-hour) fuels tend to dry out rapidly and ignite quickly, while large (100-hour and coarse debris) fuels tend to retain moisture and smolder rather than ignite (Schulz 2003). Statewide, Kentucky averaged 0.1 tons per acre of 1-hour, 0.8 tons per acre of 10-hour,
Figure 29—Kriged predictive map of down woody material by FIA reporting unit, Kentucky, nonforest areas have been removed.
Forest Health Indicators in Kentucky

45
and 2.8 tons per acre of 100-hour fine woody fuels on forest land from 2001 to 2003. Although the 2001 to 2003 dataset is small, predictive maps suggest that the Northern and Southern Cumberland regions contain more DWM (tons per acre) than other regions within the State (fig. 29). This trend is to be expected, given the greater total wood volume in those regions, but high levels of DWM may result in increased fire risk.
Ozone and Kentucky’s Forests
Ozone (O3) is a chemical compound that
occurs naturally in the Earth’s atmosphere. Ozone in the upper atmosphere performs an essential function, protecting the Earth’s surface from intense ultraviolet rays coming from the sun. In the troposphere, however, ozone becomes a secondary pollutant, contributing to permanent damage to human respiratory systems. Tropospheric ozone also affects the growth and development of forest vegetation (Skelly 2000).
Tropospheric ozone affects the growth and development of forest vegetation.
Nitrogen oxides (NOx) are byproducts
of organic fuel combustion, and concentrations of them may be especially high near industrial areas. Volatile organic compounds (VOC) are emitted from many natural sources, including trees. VOCs and NO
x combine in the presence of sunlight
to form tropospheric ozone. Tropospheric ozone concentrations fluctuate naturally in response to weather events and other changes in the chemistry of the air. Hot, cloudless summer days are the perfect weather conditions for the chemical reactions that combine NO
x and VOCs
into harmful ozone.
Pollution due to high concentrations of tropospheric ozone affects forest vegetation growth and directly injures the foliage of sensitive species (Coulston and others
Forest management sometimes includes reintroducing fire back in forested systems. (photo by Ray D. Campbell)
Forest Health Indicators in Kentucky
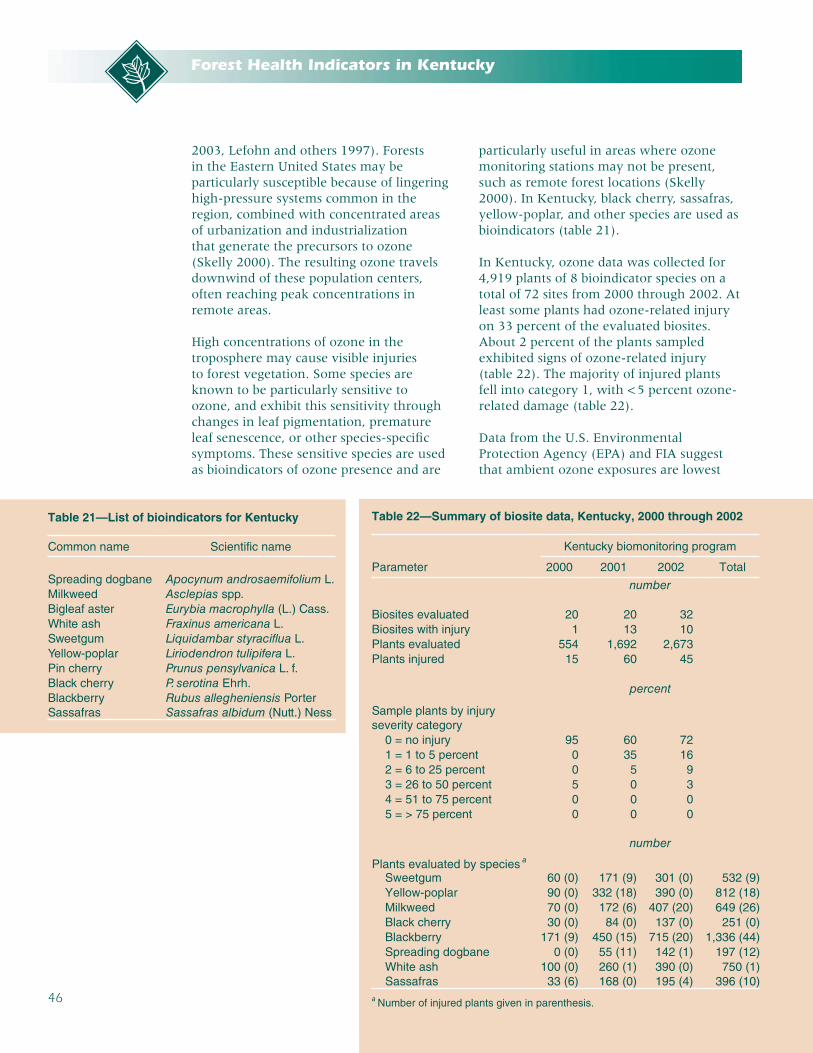
46
Table 21—List of bioindicators for Kentucky
Common name Scientific name
Spreading dogbane Apocynum androsaemifolium L.Milkweed Asclepias spp.Bigleaf aster Eurybia macrophylla (L.) Cass.White ash Fraxinus americana L.Sweetgum Liquidambar styraciflua L.Yellow-poplar Liriodendron tulipifera L.Pin cherry Prunus pensylvanica L. f.Black cherry P. serotina Ehrh.Blackberry Rubus allegheniensis PorterSassafras Sassafras albidum (Nutt.) Ness
Table 22—Summary of biosite data, Kentucky, 2000 through 2002
Parameter
Kentucky biomonitoring program
2000 2001 2002 Total
number
Biosites evaluated 20 20 32Biosites with injury 1 13 10Plants evaluated 554 1,692 2,673Plants injured 15 60 45
percent
Sample plants by injury severity category 0 = no injury 95 60 72 1 = 1 to 5 percent 0 35 16 2 = 6 to 25 percent 0 5 9 3 = 26 to 50 percent 5 0 3 4 = 51 to 75 percent 0 0 0 5 = > 75 percent 0 0 0
number
Plants evaluated by species a
Sweetgum 60 (0) 171 (9) 301 (0) 532 (9) Yellow-poplar 90 (0) 332 (18) 390 (0) 812 (18) Milkweed 70 (0) 172 (6) 407 (20) 649 (26) Black cherry 30 (0) 84 (0) 137 (0) 251 (0) Blackberry 171 (9) 450 (15) 715 (20) 1,336 (44) Spreading dogbane 0 (0) 55 (11) 142 (1) 197 (12) White ash 100 (0) 260 (1) 390 (0) 750 (1) Sassafras 33 (6) 168 (0) 195 (4) 396 (10)a Number of injured plants given in parenthesis.
2003, Lefohn and others 1997). Forests in the Eastern United States may be particularly susceptible because of lingering high-pressure systems common in the region, combined with concentrated areas of urbanization and industrialization that generate the precursors to ozone (Skelly 2000). The resulting ozone travels downwind of these population centers, often reaching peak concentrations in remote areas.
High concentrations of ozone in the troposphere may cause visible injuries to forest vegetation. Some species are known to be particularly sensitive to ozone, and exhibit this sensitivity through changes in leaf pigmentation, premature leaf senescence, or other species-specific symptoms. These sensitive species are used as bioindicators of ozone presence and are
particularly useful in areas where ozone monitoring stations may not be present, such as remote forest locations (Skelly 2000). In Kentucky, black cherry, sassafras, yellow-poplar, and other species are used as bioindicators (table 21).
In Kentucky, ozone data was collected for 4,919 plants of 8 bioindicator species on a total of 72 sites from 2000 through 2002. At least some plants had ozone-related injury on 33 percent of the evaluated biosites. About 2 percent of the plants sampled exhibited signs of ozone-related injury (table 22). The majority of injured plants fell into category 1, with < 5 percent ozone-related damage (table 22).
Data from the U.S. Environmental Protection Agency (EPA) and FIA suggest that ambient ozone exposures are lowest
Forest Health Indicators in Kentucky

47
where forested acreage is highest, while heavily populated areas like Lexington, KY,haverelativelyhighambientozonelevels (fig. 30). FIA data and EPA air quality data indicate that the air quality in heavily forested eastern Kentucky may be slightly above the average for the Southeastern United States, while air quality in the moderately forested Western region is comparable to that in other Southeastern States.
Crown Condition
FIA conducts visual assessments of individual tree crown condition on the P3 plots. Tree crown condition can be used to track forest health because a tree undergoing stress reacts by slowing growth and shedding parts of its crowns (Millers and others 1989). When a tree sheds foliage and fine twigs it alters its
rate of photosynthesis and carbohydrate production. Thus, poor crown condition can be a signal of declining growth rates and degraded forest health.
FIA annually collects information on crown density, crown dieback, and foliage transparency in order to identify localities or species with potential forest health problems. Crown density and foliage transparency describe the amount of foliage present on the tree while crown dieback describes the amount of dead twigs and branches. Vigorous trees typically have high crown density, low foliage transparency, and minimal crown dieback.
Individual tree crown density, crown dieback, and foliage transparency were assessed on 72 plots between 2000 and 2002. Overall, crown density ranged
Figure 30—Five-year average of nationwide ozone exposures.
Forest Health Indicators in Kentucky

48
Table 23—Mean crown dieback and other statistics a for all live trees > 4.9 inches d.b.h. by species, Kentucky, 2000 to 2002
Species Plots Trees Mean SE b Minimum Median Maximum
- - number - - - - - - - - - - percent - - - - - - - -
Softwoods Eastern redcedar 8 59 1 1 0 0 5 Shortleaf pine 1 1 0 — 0 0 0 Loblolly pine 1 1 0 — 0 0 0 Virginia pine 7 18 4 — 0 0 15 Other softwoods 3 6 5 — 0 5 10
All softwoods 18 85 2 1 0 0 15
Hardwoods White oaks 50 235 2 0 0 0 40 Red oaks 41 120 2 1 0 0 60 Maple 51 247 2 0 0 0 55 Yellow-poplar 28 86 4 2 0 0 80 Blackgum 26 42 1 1 0 0 40 Hickory 43 133 1 0 0 0 15 Ash 26 53 2 1 0 0 10 Elm 17 26 4 1 0 3 20 Other hardwoods 62 282 2 1 0 0 50
All hardwoods 72 1,224 2 0 0 0 80
All trees 72 1,309 2 0 0 0 80
SE = standard error; — = no sample for the cell; 0.0 = a value of > 0.0 but < 0.05 for the cell.a The mean, SE, and median calculations consider the clustering of trees on plots.b SEs are not presented for species groups with n trees < 20.
from 5 to 80 percent with means of 50.4 percent for softwoods and 41.5 percent for hardwoods (fig. 31). Crown dieback ranged from 0 to 80 percent (table 23), with the majority of trees having <10 percent dieback (fig. 32). Average crown dieback was 1.6 percent for softwoods and 2.1 percent for hardwoods (table 23).
Foliage transparency ranged from 0 to 85 percent and averaged 17.6 percent for softwoods and 21.2 percent for hardwoods (fig. 33). Overall, average crown conditions in Kentucky are not outside the expected range for trees in the South (Randolph 2006) and may be considered representative of healthy and productive trees.
Figure 31—Crown density frequency for all live trees > 4.9 inches d.b.h. by species group, Kentucky, 2000 to 2002.
Overall, average crown conditions in Kentucky are not outside the expected range for trees in the South and may be considered representative of healthy and productive trees.
Forest Health Indicators in Kentucky

49
Figure 32—Crown dieback frequency for all live trees > 4.9 inches d.b.h. by species group, Kentucky, 2000 to 2002.
Figure 33—Foliage transparency frequency for all live trees > 4.9 inches d.b.h. by species group, Kentucky, 2000 to 2002.
Forest Health Indicators in Kentucky

50
Soil Characteristics
Forest soils in southern and eastern Kentucky are primarily classified as Ultisols, while soils in the north and west are primarily classified as Alfisols (fig. 34). Formed on geologically old, unglaciated landscapes in temperate, humid areas, Ultisols are highly leached and lower in nutrients than some younger soil orders (Buol and others 1997). Ultisols are often too nutrient-poor to sustain agricultural production, but are well suited for forestry because this soil type relies on nutrient input through leaf litter and woody detritus for continued soil fertility (Buol and others 1997). Alfisols are highly fertile, naturally forested soils formed on stable landscapes in temperate and subtropical climate zones (Buol and others 1997). Alfisols are often cultivated for agriculture but also support broadleaf deciduous and mixed evergreen forests.
Soil characteristics substantially influence the productivity of forest land in a given region. Tree growth and development is partially dependent on the amount of water and nutrients available to the tree in the surrounding soil matrix. FIA collects soil data on P3 plots to assess erosion potential,
soil compaction, the availability of water and nutrients to plant species, the amount of carbon present in soil organic matter, pollution, and acidification.
FIA collects soil data to assess erosion potential, soil compaction, the availability of water and nutrients to plant species, the amount of carbon present in soil organic matter, pollution, and acidification.
FIA assesses the chemical properties of the soils of Kentucky’s forest lands by collecting and testing soil samples in the 0- to 10-cm and 10- to 20-cm soil horizons. Chemical properties of soils are best portrayed either spatially, or in conjunction with other forest characteristics, as the chemical properties of soils can vary widely within one soil type depending on vegetation cover, terrain, and local climate. FIA began collecting soil information only in 2001. For this reason soil chemical analyses are available only for 2001 to 2003 and sample sizes are very small. The data that are presented here describe conditions on a very broad scale.
Figure 34—Soil orders of Kentucky. Data from STATSGO. http://soildatamart.nrcs.usda.gov.
Forest Health Indicators in Kentucky

51
Table 24—Soil macronutrients collected by FIA and implications for vegetation
Soil attribute Implications for vegetation a
Aluminum Toxic to plants in high doses, stunts growthCalcium Aids in root, leaf, cell wall developmentCarbon Increases the water holding capacity of the soilCation exchange capacity Index of the ability of soil to hold nutrientsMagnesium Aids in photosynthesis, metabolism, respirationNitrogen Aids in leaf development and plant metabolismPhosphorus Aids in metabolic processes and cell developmentPotassium Facilitates gas exchange, disease resistance, drought protectionSodium May be detrimental in high concentrationsSulfur Aids in protein formation but toxic at high levelsa Amacher and others (2007).
A fuller range of information will be available for analysis when a complete 5-year cycle of data has been collected.
Bulk density—The bulk density (mass per unit volume) of soil is an indication of the pore space available in the soil for the transport of air and water. High bulk densities may interfere with root growth and exchange of water and air. Lower bulk densities allow for easier root penetration and more efficient air and water exchange. Soil bulk density tends to increase with soil depth as organic matter content decreases and coarse particulates such as rocks increase. For 2001 to 2003 the mean bulk density of Kentucky soils in the 0- to 10-cm horizon was 1.12 g/cm3 (table A.38), with a median value of 1.15 and a range of 0.54 to 1.54, suggesting that most soils sampled were fairly compacted. Mean bulk density of soils in the 10- to 20-cm horizon was higher at 1.46 (table A.38), with a median value of 1.49 and a range of 1.00 to 1.82.
Total carbon and macronutrients—Soil carbon is of importance for its contribution to global carbon sequestration—a topic of concern in forest and global environmental health. FIA measures total, inorganic, and organic soil carbon values on P3 plots across the United States. In Kentucky, organic soil
carbon values in the 0- to 10-cm mineral soil layer averaged 2.6 percent (±0.2) (table A.39), with a median value of 2.4 percent. Organic carbon values in the 10- to 20-cm mineral soil layer averaged 1.08 percent (±0.1) (table A.39), with a median value of 0.86 percent.
Information about the chemical composition of soils allows managers to better understand potential limitations to growth, and to identify potential problems like soil acidification. The roles of key nutrients in plant growth and development are stated in table 24. Effective cation exchange capacity (ECEC) tended to be highest in the nutrient-rich soils of the Bluegrass and Pennyroyal regions and lowest in the Western and Western Coalfield regions. Similarly, extractable cation content tended to be higher in the Bluegrass region than in others, while extractable cation content tended to be lowest in the Western region (table A.39). Readers are cautioned against applying these lab results until they have been confirmed by local testing, because sample sizes were small and because soil nutrient levels tend to fluctuate widely in response to local precipitation events and other local influences.
Forest Health Indicators in Kentucky

52
Abt, K.L.; Winter, S.A.; Wuggestt, R.J., Jr. 2002. Local economic impacts of forests. In: Wear, D.N.; Greis, J.G., eds. Southern forest resource assessment. Gen. Tech. Rep. SRS–53. Asheville, NC: U.S. Department of Agriculture Forest Service, Southern Research Station: 239–267.
Alerich, C.L. 1990. Forest statistics for Kentucky—1975 and 1988. Resour. Bull. NE–117. Radnor, PA: U.S. Department of Agriculture Forest Service, Northeastern Forest Experiment Station. 295 p.
Amacher, Michael C.; O’Neill, Katherine P.; Perry, Charles H. 2007. Soil vital signs: A new soil quality index (SQI) for assessing forest soil health. Res. Pap. RMRS-RP-65WWW. Fort Collins, CO: U.S. Department of Agriculture Forest Service, Rocky Mountain Research Station. 12 p.
Barnes, B.V.; Zak, D.R.; Denton, S.R.; Spurr, S.H. 1998. Forest ecology. 4th ed. New York:JohnWiley.774p.
Bate, L.J.; Torgersen, T.R.; Wisdom, M.J. [and others]. 2004. Performance of sampling methods to estimate log characteristics for wildlife. Forest Ecology and Management. 199(1): 83–102.
Bechtold, W.A.; Patterson, P.L., eds. 2005. The enhanced forest inventory and analysis program—national sampling design and estimation procedures. Gen. Tech. Rep. SRS–80. Asheville, NC: U.S. Department of Agriculture Forest Service, Southern Research Station. 85 p.
Brown, M.J. 2004. Forest statistics for North Carolina, 2002. Resour. Bull. SRS–88. Asheville, NC: U.S. Department of Agriculture Forest Service, Southern Research Station. 78 p.
Buol, S.W.; Hole, F.D.; McCracken, R.J.; Southard, R.J. 1997. Soil genesis and classification. 4th ed. Ames, IA: Iowa State University Press. 527 p.
Butler, B.J.; Leatherberry, E.C.; Williams, M.S. 2005. Design, implementation, and analysis methods for the National Woodland Owner Survey. Gen. Tech. Rep. NE–336. Newtown Square, PA: U.S. Department of Agriculture Forest Service, Northeastern Forest Experiment Station. 43 p.
Butry, D.T.; Mercer, D.E.; Prestemon, J.P. [and others]. 2001. What is the price of catastrophic wildfire? Journal of Forestry. 2001: 9–17.
Chamberlain, J. 2006. Conserving the Appalachian medicinal plant industry. In: Morales, M.; Foster, J., eds. Appalachian opportunities: medicinal and aromatic plants: 4th symposium on medicinal and aromatic plants: producing, using and marketing herbs and nontimber forest products. Beckley, WV: Mountain State University: 5–15.
Chamberlain, J.L.; Predny, M. 2004. Nontimber forest products enterprises in the South: perceived distribution and implications for sustainable forest management. In: Proceedings, 1st national symposium on sustainable natural resource-based alternative enterprises. Starkville, MS: Mississippi State University: 20.
Conners, T. 2003. Outlook for forestry & forest products 2003+ [PowerPoint presentation]. www.uky.edu/Ag/AgEcon/pubs/esm/esm_29/forestry.ppt. [Date accessed: February 10, 2006].
Coulston, J.W.; Smith, G.C.; Smith, W.D. 2003. Regional assessment of ozone sensitive tree species using bioindicator plants. Environmental Monitoring and Assessment. 83: 113–127.
Hanks, L.F. 1976. Hardwood tree grades for factory lumber. Res. Pap. NE–333. Upper Darby, PA: U.S. Department of Agriculture Forest Service, Northeastern Forest Experiment Station. 81 p.
Literature Cited

53
Kentucky Legislative Research Commission. 2003. Tax and related incentives for forest management. Pierce, L, prep. Res. Rep. 307.Frankfort,KY.37p.
Kingsley, N.P.; Powell, D.S. 1978. The forest resources of Kentucky. Resour. Bull. NE–54. Broomall, PA: U.S. Department of Agriculture Forest Service, Northeastern Forest Experiment Station. 97 p.
Lefohn, A.S.; Jackson, W.; Shadwick, D.S.; Knudsen, H.P. 1997. Effect of surface ozone exposures on vegetation grown in the Southern Appalachian Mountains: identification of possible areas of concern. Atmospheric Environments. 31(11): 1695–1708.
Little, E.L., Jr. 1979. Checklist of United States trees (native and naturalized). Agric. Handb. 541. Washington, DC: U.S. Department of Agriculture. 375 p.
Mannan, R.W.; Conner, R.N.; Marcot, B.; Peek, J.M. 1996. Managing forest lands for wildlife. In: Bookhout, T.A., ed. Research and management techniques for wildlife and habitats. Bethesda, MD: The Wildlife Society: 689–721.
McCune, B. 2000. Lichen communities as indicators of forest health. The Bryologist. 103(2): 353–356.
McMahon, C.K. 1983. Characteristics of forest fuels, fires and emissions. In: 76th annual meeting of air pollution control association. Paper No. 83-45.1. Atlanta. 24 p.
Millers, I.; Shriner, D.; Rizzo, D. 1989. History of hardwood decline in the Eastern United States. Gen. Tech. Rep. NE–126. Radnor, PA: U.S. Department of Agriculture Forest Service, Northeastern Forest Experiment Station. 75 p.
Predny, M.; Chamberlain, J. [In press]. Black cohosh (Actaea racemosa): an annotated bibliography. Gen. Tech. Rep. Asheville, NC: U.S. Department of Agriculture Forest Service, Southern Research Station.
Predny, M.L.; Chamberlain, J.L. 2005. Goldenseal (Hydrastis canadensis): an annotated bibliography. Gen. Tech. Rep. SRS–88. Asheville, NC: U.S. Department of Agriculture Forest Service, Southern Research Station. 67 p.
Randolph, K. 2006. Descriptive statistics of tree crown condition in the Southern United States and impacts on data analysis and interpretation. Gen. Tech. Rep. SRS–94 Asheville, NC: U.S. Department of Agriculture Forest Service, Southern Research Station. 17 p.
Schulz, B. 2003. Changes in downed and dead woody material following a spruce beetle outbreak on the Kenai Peninsula, Alaska. Res. Pap. PNW–RP–559. Portland, OR: U.S. Department of Agriculture Forest Service, Pacific Northwest Research Station. 9 p.
Schweitzer, C.J. 2000. Forest statistics for Tennessee, 1999. Resour. Bull. SRS–52. Asheville, NC: U.S. Department of Agriculture Forest Service, Southern Research Station. 78 p.
Scott, C.T. 1979. Northeastern forest survey board-foot volume equations. Res. Note NE–271. Broomall, PA: U.S. Department of Agriculture Forest Service, Northeastern Forest Experiment Station. 3 p.
Scott, C.T. 1981. Northeastern forest survey revised cubic-foot volume equations. Res. Note NE–304. Broomall, PA: U.S. Department of Agriculture Forest Service, Northeastern Forest Experiment Station. 3 p.
Literature Cited

54
Skelly, J.M. 2000. Tropospheric ozone and its importance to forests and natural plant communities of the Northeastern United States. Northeastern Naturalist. 7(3): 221–236.
Smith, G.C.; Smith, W.D.; Coulston, J.W. [In press]. Ozone bioindicator sampling and estimation. Gen. Tech. Rep. Minneapolis/St. Paul, MN: U.S. Department of Agriculture Forest Service, Northern Research Station.
Spelter, H.; Alderman, M. 2005. Profile 2005: softwood sawmills in the United States and Canada. Res. Pap. FPL–RP–630. Madison, WI: U.S. Department of Agriculture Forest Service, Forest Products Laboratory. 85 p.
Stolte, K.W. 2001. Forest health monitoring and forest inventory analysis programs monitor climate change effect in forest ecosystems. Human and Ecological Risk Assessment. 7(5): 1297–1316.
Tree Planters Notes. 2006. Database of tree planting in the U.S. http://www.rngr.net/Applications/tpus. [Date accessed: July 25, 2007].
U.S. Department of Agriculture. 1987. Field instructions for the fourth inventory of Kentucky 1986–1987. Unpublished report. On file with: Southern Research Station, Forest Inventory and Analysis, 4700 Old Kingston Pike, Knoxville, TN 37919.
U.S. Department of Commerce, Bureau of the Census. 2002. The 2000 decennial census. Unpublished report. On file with: Southern Research Station, Forest Inventory and Analysis, 4700 Old Kingston Pike, Knoxville, TN 37919.
U.S. Department of Commerce, Bureau of the Census. 2003. 2003 annual survey of manufactures. 2003 summary tables. http://factfinder.census.gov. [Date accessed: June 2007].
U.S. Department of Commerce, Bureau of the Census. 2004. Annual survey of manufactures. 2004 summary tables. http://factfinder.census.gov. [Date accessed: June 2007].
Waddell, K.L. 2002. Sampling coarse woody debris for multiple attributes in extensive resource inventories. Ecological Indicators. 1(2002): 139–153.
Wear, D.N. 2002. Land use. In: Wear, D.N.; Greis, J.G., eds. Southern forest resource assessment. Gen. Tech. Rep. SRS–53. Asheville, NC: U.S. Department of Agriculture Forest Service, Southern Research Station: 153-173. Chapter 6.
Wear, D.N.; Liu, R.; Foreman, J.M.; Sheffield, R.M. 1999. The effects of population growth on timber management and inventories in Virginia. Forest Ecology and Management. 118: 107–115.
Zarnoch, S.J.; Turner, J.A. 2005. Adjustments to forest inventory and analysis estimates of 2001 saw-log volumes for Kentucky. Res. Pap. SRS–38. Asheville, NC: U.S. Department of Agriculture Forest Service, Southern Research Station. 4 p.
Literature Cited

55
Afforestation. Area of land previously classified as nonforest that is converted to forest by planting of trees or by natural reversion to forest.
Average annual mortality. Average annual volume of trees 5.0 inches d.b.h. and larger that died from natural causes during the intersurvey period.
Average annual removals. Average annual volume of trees 5.0 inches d.b.h. and larger removed from the inventory by harvesting, cultural operations (such as timber stand improvement), land clearing, or changes in land use during the intersurvey period.
Average net annual growth. Average annual net change in volume of trees 5.0 inches d.b.h. and larger in the absence of cutting (gross growth minus mortality) during the intersurvey period.
Basal area. The area in square feet of the cross section at breast height of a single tree or of all the trees in a stand, usually expressed in square feet per acre.
Bioindicator species. A tree, woody shrub, or nonwoody herb species that responds to ambient levels of ozone pollution with distinctive visible foliar symptoms.
Biomass. The aboveground fresh weight of solid wood and bark in live trees 1.0 inch d.b.h. and larger from the ground to the tip of the tree. All foliage is excluded. The weight of wood and bark in lateral limbs, secondary limbs, and twigs under 0.5 inch in diameter at the point of occurrence on sapling-size trees is included but is excluded on poletimber and sawtimber-size trees.
Blind check. A reinstallation done by a qualified inspection crew without production crew data on hand; a full reinstallation of the plot is recommended for the purpose of obtaining a measure of data quality. If a full plot reinstallation
is not possible, then it is strongly recommended that at least two full subplots be completely remeasured along with all the plot level information. The two datasets are maintained separately. Discrepancies between the two sets of data are not reconciled. Blind checks are done on production plots only. This procedure provides a quality assessment and evaluation function. The statistics band recommends a random subset of plots be chosen for remeasurement.
Bole. That portion of a tree between a 1-foot stump and a 4-inch top d.o.b. in trees 5.0 inches d.b.h. and larger.
Census water. Streams, sloughs, estuaries, canals, and other moving bodies of water 200 feet wide and greater, and lakes, reservoirs, ponds, and other permanent bodies of water 4.5 acres in area and greater.
Coarse woody debris or coarse woody material. Down pieces of wood leaning more than 45 degrees from vertical with a diameter of at least 3.0 inches and a length of at least 3.0 feet (decay classes 1 through 4). Decay class 5 pieces must be at least 5.0 inches in diameter, at least 5.0 inches high from the ground, and at least 3.0 feet in length.
Cold check. An inspection done either as part of the training process, or as part of the ongoing QC program. Normally the installation crew is not present at the time of inspection. The inspector has the completed data in-hand at the time of inspection. The inspection can include the whole plot or a subset of the plot. Data errors are corrected. Cold checks are done on production plots only. This type of QC measurement is a “blind” measurement in that the crews do not know when or which of their plots will be remeasured by the inspection crew and cannot, therefore, alter their performance because of knowledge that the plot is a QA plot.
Glossary

56
Compacted area. Type of compaction measured as part of the soil indicator. Examples include the junction areas of skid trails, landing areas, work areas, etc.
Condition class. The combination of discrete landscape and forest attributes that identify and define, and stratify the area associated with a plot. Examples of such attributes include condition status, forest type, stand origin, stand size, owner group, reserve status, and stand density.
Crown. The part of a tree or woody plant bearing live branches or foliage.
Crown density. The amount of crown stem, branches, twigs, shoots, buds, foliage, and reproductive structures that block light penetration through the visible crown. Dead branches and dead tops are part of the crown. Live and dead branches below the live crown base are excluded. Broken or missing tops are visually reconstructed when forming this crown outline by comparing outlines of adjacent healthy trees of the same species and d.b.h./drc.
Crown dieback. This is recent mortality of branches with fine twigs, which begins at the terminal portion of a branch and proceeds toward the trunk. Dieback is only considered when it occurs in the upper and outer portions of the tree. When whole branches are dead in the upper crown, without obvious signs of damage such as breaks or animal injury, assume that the branches died from the terminal portion of the branch. Dead branches in the lower portion of the live crown are assumed to have died from competition and shading. Dead branches in the lower live crown are not considered as part of crown dieback, unless there is continuous dieback from the upper and outer crown down to those branches.
D.b.h. Tree diameter in inches (outside bark) at breast height (4.5 feet aboveground).
Decay class. Qualitative assessment of stage of decay (five classes) of coarse woody debris based on visual assessments of color of wood, presence/absence of twigs and branches, texture of rotten portions, and structural integrity.
Diameter class. A classification of trees based on tree d.b.h. Two-inch diameter classes are commonly used by FIA, with the even inch as the approximate midpoint for a class. For example, the 6-inch class includes trees 5.0 through 6.9 inches d.b.h.
D.o.b. (diameter outside bark). Stem diameter including bark.
Down woody material (DWM). Woody pieces of trees and shrubs that have been uprooted (no longer supporting growth) or severed from their root system, not self-supporting, and are lying on the ground. Previously named down woody debris (DWD).
Duff. A soil layer dominated by organic material derived from the decomposition of plant and animal litter and deposited on either an organic or a mineral surface. This layer is distinguished from the litter layer in that the original organic material has undergone sufficient decomposition that the source of this material, e.g., individual plant parts, can no longer be identified.
Effective cation exchange capacity (ECEC). The sum of cations that a soil can adsorb in its natural pH. Expressed in units of centimoles of positive charge per kilogram of soil.
Erosion. The wearing away of the land surface by running water, wind, ice, or other geological agents.
Fine woody debris or fine woody material. Down pieces of wood with a diameter <3.0 inches, not including foliage or bark fragments.
Glossary

57
Foliage transparency. The amount of skylight visible through microholes in the live portion of the crown, i.e., where you see foliage, normal or damaged, or remnants of its recent presence. Recently defoliated branches are included in foliage transparency measurements. Macroholes are excluded unless they are the result of recent defoliation. Dieback and dead branches are always excluded from the estimate. Foliage transparency is different from crown density because it emphasizes foliage and ignores stems, branches, fruits, and holes in the crown.
Forest floor. The entire thickness of organic material overlying the mineral soil, consisting of the litter and the duff (humus).
Forest land. Land at least 10 percent stocked by forest trees of any size, or formerly having had such tree cover, and not currently developed for nonforest use. The minimum area considered for classification is 1 acre. Forested strips must be at least 120 feet wide.
Forest management type. A classification of timberland based on forest type and stand origin.
Pine plantation. Stands that (1) have been artificially regenerated by planting or direct seeding, (2) are classed as a pine or other softwood forest type, and (3) have at least 10 percent stocking.
Natural pine. Stands that (1) have not been artificially regenerated, (2) are classed as a pine or other softwood forest type, and (3) have at least 10 percent stocking.
Oak-pine. Stands that have at least 10 percent stocking and classed as a forest type of oak-pine.
Upland hardwood. Stands that have at least 10 percent stocking and classed as an oak-hickory or maple-beech-birch forest type.
Lowland hardwood. Stands that have at least 10 percent stocking with a forest type of oak-gum-cypress, elm-ash-cottonwood, palm, or other tropical.
Nonstocked stands. Stands <10 percent stocked with live trees.
Forest type. A classification of forest land based on the species forming a plurality of live-tree stocking. Major eastern forest-type groups are:
White-red-jack pine. Forests in which eastern white pine, red pine, or jack pine, singly or in combination, constitute a plurality of the stocking. (Common associates include hemlock, birch, and maple.)
Spruce-fir. Forests in which spruce or true firs, singly or in combination, constitute a plurality of the stocking. (Common associates include maple, birch, and hemlock.)
Longleaf-slash pine. Forests in which longleaf or slash pine, singly or in combination, constitute a plurality of the stocking. (Common associates include oak, hickory, and gum.)
Loblolly-shortleaf pine. Forests in which loblolly pine, shortleaf pine, or other southern yellow pines, except longleaf or slash pine, singly or in combination, constitute a plurality of the stocking. (Common associates include oak, hickory, and gum.)
Oak-pine. Forests in which hardwoods (usually upland oaks) constitute a plurality of the stocking but in which pines account for 25 to 50 percent of the stocking. (Common associates include gum, hickory, and yellow-poplar.)
Glossary

58
Oak-hickory. Forests in which upland oaks or hickory, singly or in combination, constitute a plurality of the stocking, except where pines account for 25 to 50 percent, in which case the stand would be classified oak-pine. (Common associates include yellow-poplar, elm, maple, and black walnut.)
Oak-gum-cypress. Bottomland forests in which tupelo, blackgum, sweetgum, oaks, or southern cypress, singly or in combination, constitute a plurality of the stocking, except where pines account for 25 to 50 percent of stocking, in which case the stand would be classified as oak-pine. (Common associates include cottonwood, willow, ash, elm, hackberry, and maple.)
Elm-ash-cottonwood. Forests in which elm, ash, or cottonwood, singly or in combination, constitute a plurality of the stocking. (Common associates include willow, sycamore, beech, and maple.)
Maple-beech-birch. Forests in which maple, beech, or yellow birch, singly or in combination, constitute a plurality of the stocking. (Common associates include hemlock, elm, basswood, and white pine.)
Nonstocked stands. Stands <10 percent stocked with live trees.
Forested tract size. The area of forest within the contiguous tract containing each FIA sample plot.
Fresh weight. Mass of tree component at time of cutting.
Fuel bed. Accumulated mass of all DWM components above the top of the duff layer. The fuel bed does not include live shrubs or herbs.
Fuel hour classes. Fuel classes defined by the approximate amount of time it takes for moisture conditions to fluctuate. Larger coarse woody material will take longer to dry out than smaller fine woody pieces (small = 1-hour, medium = 10-hour, large = 100-hour, coarse woody material = 1,000-hour).
Gross growth. Annual increase in volume of trees 5.0 inches d.b.h. and larger in the absence of cutting and mortality. (Gross growth includes survivor growth, ingrowth, growth on ingrowth, growth on removals before removal, and growth on mortality before death.)
Growing-stock trees. Living trees of commercial species classified as sawtimber, poletimber, saplings, and seedlings. Trees must contain at least one 12-foot or two 8-foot logs in the saw-log portion, currently or potentially (if too small to qualify), to be classed as growing stock. The log(s) must meet dimension and merchantability standards to qualify. Trees must also have, currently or potentially, one-third of the gross board-foot volume in sound wood.
Growing-stock volume. The cubic-foot volume of sound wood in growing-stock trees at least 5.0 inches d.b.h. from a 1-foot stump to a minimum 4.0-inch top d.o.b. of the central stem.
Hardwoods. Dicotyledonous trees, usually broadleaf and deciduous.
Soft hardwoods. Hardwood species with an average specific gravity of 0.50 or less, such as gums, yellow-poplar, cottonwoods, red maple, basswoods, and willows.
Hard hardwoods. Hardwood species with anaveragespecificgravity>0.50suchasoaks, hard maples, hickories, and beech.
Glossary

59
Hexagonal grid (Hex). A hexagonal grid formed from equilateral triangles for the purpose of tessellating the FIA inventory sample. Each hexagon in the base grid has an area of 5,937 acres (2,403.6 ha) and contains one inventory plot. The base grid can be subdivided into smaller hexagons to intensify the sample.
Humus. A soil layer dominated by organic material derived from the decomposition of plant and animal litter and deposited on either an organic or a mineral surface. This layer is distinguished from the litter layer in that the original organic material has undergone sufficient decomposition that the source of this material, e.g., individual plant parts, can no longer be identified.
Land area. The area of dry land and land temporarily or partly covered by water, such as marshes, swamps, and river floodplains (omitting tidal flats below mean high tide), streams, sloughs, estuaries, and canals <200 feet wide, and lakes, reservoirs, and ponds <4.5 acres in area.
Lichen. An organism generally appearing to be a single small leafy, tufted or crustlike plant that consists of a fungus and an alga or cyanobacterium living in symbiotic association.
Lichen community indicator. The set of macrolichen species collected on a FIA lichen plot using standard protocols, which serves as an indicator of ecological condition, e.g., air quality or climate of the plot.
Lichen plot. The FIA lichen plot is a circular area, total 0.935 acre (0.4 ha), with a 120-foot (36.6-m) radius centered on subplot 1, and excluding the four subplots.
Litter. Undecomposed or only partially decomposed organic material that can be readily identified, e.g., plant leaves, twigs, etc.
Live trees. All living trees. All size classes, all tree classes, and both commercial and noncommercial species are included.
Measurement quality objective (MQO). A data user’s estimate of the precision, bias, and completeness of data necessary to satisfy a prescribed application, e.g., Resource Planning Act, assessments by State foresters, forest planning, forest health analyses. Describes the acceptable tolerance for each data element. MQOs consist of two parts: (1) a statement of the tolerance and (2) a percentage of time when the collected data are required to be within tolerance. MQOs can only be assigned where standard methods of sampling or field measurements exist, or where experience has established upper or lower bounds on precision or bias. MQOs can be set for measured data elements, observed data elements, and derived data elements.
Mineral soil. A soil consisting predominantly of products derived from the weathering of rocks, e.g., sands, silts, and clays.
Net annual change. Increase or decrease in volume of live trees at least 5.0 inches d.b.h. Net annual change is equal to net annual growth minus average annual removals.
Noncommercial species. Tree species of typically small size, poor form, or inferior quality that normally do not develop into trees suitable for industrial wood products.
Nonforest land. Land that has never supported forests and land formerly forested where timber production is precluded by development for other uses.
Nonstocked stands. Stands <10 percent stocked with live trees.
Glossary

60
Other forest land. Forest land other than timberland and productive reserved forest land. It includes available and reserved forest land which is incapable of producing annually 20 cubic feet per acre of industrial wood under natural conditions, because of adverse site conditions such as sterile soils, dry climate, poor drainage, high elevation, steepness, or rockiness.
Other removals. The growing-stock volume of trees removed from the inventory by cultural operations such as timber stand improvement, land clearing, and other changes in land use, resulting in the removal of the trees from timberland.
Ownership. The property owned by one ownership unit, including all parcels of land in the United States.
National forest land. Federal land that has been legally designated as national forests or purchase units, and other land under the administration of the Forest Service, including experimental areas and Bankhead-Jones Title III land.
Forest industry land. Land owned by companies or individuals operating primary wood-using plants.
Nonindustrial private forest land. Privately owned land excluding forest industry land.
Corporate. Owned by corporations, including incorporated farm ownerships.
Individual. All lands owned by individuals, including farm operators.
Other public. An ownership class that includes all public lands except national forests.
Miscellaneous Federal land. Federal land other than national forests.
State, county, and municipal land. Land owned by States, counties, and local public agencies or municipalities or land leased to these governmental units for 50 years or more.
Ozone (O3). A regional, gaseous air pollutant produced primarily through sunlight-driven chemical reactions of NO
2
and hydrocarbons in the atmosphere and causing foliar injury to deciduous trees, conifers, shrubs, and herbaceous species.
Ozone bioindicator site. An open area in which ozone injury to ozone-sensitive species is evaluated. The area must meet certain site selection guidelines regarding size, condition, and plant counts to be used for ozone injury evaluations in FIA.
Phase 1 (P1). FIA activities related to remote sensing, the primary purpose of which is to label plots and obtain stratum weights for population estimates.
Phase 2 (P2). FIA activities conducted on the network of ground plots. The primary purpose is to obtain field data that enable classification and summarization of area, tree, and other attributes associated with forest land uses.
Phase 3 (P3). FIA activities conducted on a subset of P2 plots. Additional attributes related to forest health are measured on P3 plots.
Poletimber-size trees. Softwoods 5.0 to 8.9 inches d.b.h. and hardwoods 5.0 to 10.9 inches d.b.h.
Productive-reserved forest land. Forest land sufficiently productive to qualify as timberland but withdrawn from timber utilization through statute or administrative regulation.
Glossary

61
Quality assurance (QA). The total integrated program for ensuring that the uncertainties inherent in FIA data are known and do not exceed acceptable magnitudes, within a stated level of confidence. QA encompasses the plans, specifications, and policies affecting the collection, processing, and reporting of data. It is the system of activities designed to provide program managers and project leaders with independent assurance that total system QC is being effectively implemented.
Quality control (QC). The routine application of prescribed field and laboratory procedures, e.g., random check cruising, periodic calibration, instrument maintenance, use of certified standards, etc., in order to reduce random and systematic errors and ensure that data are generated within known and acceptable performance limits. QC also ensures the use of qualified personnel, reliable equipment and supplies, training of personnel, good field and laboratory practices, and strict adherence to standard operating procedures.
Reforestation. Area of land previously classified as forest that is regenerated by tree planting or natural regeneration.
Rotten trees. Live trees of commercial species not containing at least one 12-foot saw log, or two noncontiguous saw logs, each 8 feet or longer, now or prospectively, primarily because of rot or missing sections, and with less than one-third of the gross board-foot tree volume in sound material.
Rough trees. Live trees of commercial species not containing at least one 12-foot saw log, or two noncontiguous saw logs, each 8 feet or longer, now or prospectively, primarily because of roughness, poor form, splits, and cracks, and with less than one-third of the gross board-foot tree volume in sound material; and live trees of noncommercial species.
Sapling. Live trees 1.0 to 4.9 inches (2.5 to 12.5 cm) in diameter (d.b.h.).
Saw log. A log meeting minimum standards of diameter, length, and defect, including logs at least 8 feet long, sound and straight, with a minimum diameter inside bark for softwoods of 6 inches (8 inches for hardwoods).
Saw-log portion. The part of the bole of sawtimber trees between a 1-foot stump and the saw-log top.
Saw-log top. The point on the bole of sawtimber trees above which a conventional saw log cannot be produced. The minimum saw-log top is 7.0 inches d.o.b. for softwoods and 9.0 inches d.o.b. for hardwoods.
Sawtimber-size trees. Softwoods 9.0 inches d.b.h. and larger and hardwoods 11.0 inches d.b.h. and larger.
Sawtimber volume. Growing-stock volume in the saw-log portion of sawtimber-size trees in board feet (International ¼-inch rule).
Seedlings. Trees<1.0inchd.b.h.and>1foottallforhardwoods,>6inchestallforsoftwoods,and>0.5inchindiameteratground level for longleaf pine.
Select red oaks. A group of several red oak species composed of cherrybark, Shumard, and northern red oaks. Other red oak species are included in the “other red oaks” group.
Select white oaks. A group of several white oak species composed of white, swamp chestnut, swamp white, chinkapin, Durand, and bur oaks. Other white oak species are included in the “other white oaks” group.
Site class. A classification of forest land in terms of potential capacity to grow crops of industrial wood based on fully stocked natural stands.
Glossary

62
Softwoods. Coniferous trees, usually evergreen, having leaves that are needles or scalelike.
Yellow pines. Loblolly, longleaf, slash, pond, shortleaf, pitch, Virginia, sand, spruce, and Table Mountain pines.
Other softwoods. Cypress, eastern redcedar, white-cedar, eastern white pine, eastern hemlock, spruce, and fir.
Soil bulk density. The mass of soil per unit volume. A measure of the ratio of pore space to solid materials in a given soil. Expressed in grams per cubic centimeter of oven dry soil.
Soil compaction. A reduction in soil pore space caused by heavy equipment or by repeated passes of light equipment that compress the soil and break down s oil aggregates. Compaction disturbs the soil structure and can cause decreased tree growth, increased water runoff, and soil erosion.
Soil texture. The relative proportions of sand, silt, and clay in a soil.
Stand age. The average age of dominant and codominant trees in the stand.
Stand origin. A classification of forest stands describing their means of origin.
Planted. Planted or artificially seeded.
Natural. No evidence of artificial regeneration.
Stand-size class. A classification of forest land based on the diameter class distribution of live trees in the stand.
Sawtimber stands. Stands at least 10 percent stocked with live trees, with half or more of total stocking in sawtimber and poletimber trees, and with sawtimber stocking at least equal to poletimber stocking.
Poletimber stands. Stands at least 10 percent stocked with live trees, with half or more of total stocking in poletimber and sawtimber trees, and with poletimber stocking exceeding sawtimber stocking.
Sapling-seedling stands. Stands at least 10 percent stocked with live trees, in which saplings and seedlings account for more than half of total stocking.
Nonstocked stands. Stands <10 percent stocked with live trees.
Stocking. The degree of occupancy of land by trees, measured by basal area or the number of trees in a stand and spacing in the stand, compared with a minimum standard, depending on tree size, required to fully utilize the growth potential of the land.
Density of trees and basal area per acre required for full stocking
Trees per acre Basal areaD.b.h. for full (square feetclass stocking per acre)
Seedlings 600 —2 560 —4 460 —6 340 678 240 8410 155 8512 115 9014 90 9616 72 10118 60 10620 51 111
— = not applicable.
Timberland. Forest land capable of producing 20 cubic feet of industrial wood per acre per year and not withdrawn from timber utilization.
Transect diameter. Diameter of a coarse woody piece at the point of intersection with a sampling plane.
Glossary

63
Tree. Woody plant having one erect perennial stem or trunk at least 3 inches d.b.h., a more or less definitely formed crown of foliage, and a height of at least 13 feet (at maturity).
Tree grade. A classification of the saw-log portion of sawtimber trees based on: (1) the grade of the butt log or (2) the ability to produce at least one 12-foot or two 8-foot logs in the upper section of the saw-log portion. Tree grade is an indicator of quality; grade 1 is the best quality.
Upper-stem portion. The part of the main stem or fork of sawtimber trees above the saw-log top to a minimum top diameter of 4.0 inches outside bark or to the point where the main stem or fork breaks into limbs.
Vigor class. A visual assessment of the apparent crown vigor of saplings. The purpose is to separate excellent saplings with superior crowns from stressed individuals with poor crowns.
Volume of live trees. The cubic-foot volume of sound wood in live trees at least 5.0 inches d.b.h. from a 1-foot stump to a minimum 4.0-inch top d.o.b. of the central stem.
Volume of saw-log portion of sawtimber trees. The cubic-foot volume of sound wood in the saw-log portion of sawtimber trees. Volume is the net result after deductions for rot, sweep, and other defects that affect use for lumber.
Oak plantation. (photo by Christopher M. Oswalt)
Glossary


65
The current inventory is a three-phase sample design conducted on an annual basis. Phase 1 (P1) provides the forest land area estimates for the inventory. Phase 2 (P2) involves on-the-ground measurements of sample plots by field personnel. Phase 3 (P3) is a subset of the P2 plot system where additional measurements are made by field personnel to assess forest health indicators. The three phases of the current sampling method are based on a hexagonal-grid design (Bechtold and Patterson 2005). There are 25 P1 points for every P2 plot. There are 16 P2 plots for every P3 plot. P1 points and P2 and P3 plots represent about 236 acres, 6,000 acres, and 96,000 acres each, respectively.
The inventory design and methodology used to collect and process the information needed to derive the current forest resource estimates for the 2004 survey of Kentucky have undergone substantial change since the previous survey conducted in 1988. The current survey’s sample design has changed in three major ways from the previous inventory of Kentucky [see Bechtold and Patterson (2005) for a detailed discussion of
the FIA design]. The first change was in the method of collecting forest area estimation based on aerial photos. The second was switching from a five-point cluster ground plot that was a mixture of fixed- and variable-radius points to a four-point fixed-radius ground sample. The third was switching from periodic to annual collection of ground samples. There are also changes in volume equations, variable definitions, processing methodology, and algorithms. While all of these changes alone or in combination weaken comparisons among surveys, they are necessary to improve survey accuracy and allow comparisons with other surveys throughout the region.
Sample Design Phases
Previous P1: forest area estimates—The previous forest area estimate was based on a grid of 16 points placed over the center of each aerial photo. In the previous inventory, over 69,500 points were classified into forest and nonforest land uses, with each point representing about 360 acres. Forested points were further classified into eight different volume classes. The number of points that fell into each volume class was used to stratify the forested P2 ground plots at the county level. However, forest area estimates were only developed for eachcountythathad>60,000acresoftimberland. Counties that did not meet that criterion were grouped with a neighboring county or counties to form a larger sampling base.
Current P1: forest area estimates—For the 2004 inventory of Kentucky the P1 forest area estimate was based on a grid of 25 points that was placed over the quadrant of an aerial photo where a P2 sample plot
Data is collected by Kentucky Division of Forestry foresters in forests across the Commonwealth. (photo by Ray D. Campbell)
Appendix A—Inventory Methods

66
was located. There were over 105,000 points, and these represented about 236 acres each. A photointerpreter classified each point as forest or nonforest and a percentage for each class was derived for each county. The forest area for each county was then determined by multiplying the percentage of forested points by the U.S. Census Bureau’s estimate of all land for each respective county (U.S. Bureau of the Census 2002). Ground truths were done at each P2 sample location and one additional location by field personnel. Where a classification was found to be incorrect, a correction factor was calculated and the forest percentage that was derived from the original P1 dot count estimate was adjusted. These correction factors adjust for possible misinterpretation of aerial photos and for real changes which may have occurred since the date of the aerial photography. Plot-level expansion factors were determined by dividing the number of forested plots into the total forest land.
The increase in the number of photopoints classified increased the precision of the forest land area estimate from ±0.8 percent to ±0.4 percent at the State level.
Expansion factors were derived only from the classifications of P1 points into forest and nonforest categories and did not apply to volume estimation. Furthermore, forest land area is estimated for each county in the 2004 inventory. Counties with < 60,000 acres of timberland were not grouped with an adjacent county or counties. However, users should be aware that individual county estimates have unacceptably larger error percentages than unit and State level estimates. County data are provided in the Forest Inventory and Analysis Database (FIADB) so that users can group counties into their own defined areas of interest, but they are not valid for county level analysis.
Previous P2: forest inventory—The previous plot design was a five-point cluster design (fig. A.1) with one center point and four satellite points located 98.4 feet north, east, south, and west. The center point consisted of four concentric fixed-radius plots: (1) a reproduction plot, (2) a vegetation plot, (3) a poletimber plot, and (4) a sawtimber plot. Trees 1.0 to 4.9 inches in d.b.h. and seedlings (trees <1.0 inches in d.b.h.) were measured on the reproduction plot, which had a 3.7-foot radius and an
Figure A.1—Pattern of five-point prism plot used in Kentucky.
Appendix A—Inventory Methods

67
area of about 1/1000 of an acre. Vegetation characteristics were measured within a plot with a radius of 16.4 feet and an area of about 1/50 of an acre. Trees ≥ 5.0 inches d.b.h. were measured on the poletimber plot, which had a radius of 37.2 feet and an area of about 1/10 of an acre. Softwood tree species ≥ 9.0 inches d.b.h. and hardwood tree species ≥ 11.0 inches d.b.h. were measured on the sawtimber plot, which had a radius of 52.7 feet and an area of about 1/5 of an acre. The four satellite points served as centers of variable radius plots; at each of these points, a 37.5-basal-area-factor prism was used to select trees with d.b.h. ≥ 5.0 inches. The reproduction and vegetation plots were also located at all four satellite points. Finally, the entire sawtimber plot and the four satellite points were relocated in some cases so that they all were in the same land use (U.S. Department of Agriculture 1987).
The ground samples established in 1988 were located independently from the plots that were established in the 1975 inventory and from those established in the 2004 inventory. Data from the remeasured plots were collected from 1999 to 2002 and are only used to calculate growth, removals, and mortality volume estimates for the Commonwealth.
Current P2: forest inventory—The current plot design employs a fixed plot composed of four subplots spaced 120 feet apart (fig. A.2). The sample area of these four subplots totals approximately 1/6 of an acre, while the footprint of the cluster is about 1 acre. Trees ≥ 5.0 inches in d.b.h. are measured on each subplot, which has a 24-foot radius and an area of about 1/24 of an acre. Trees
1.0 to 4.9 inches in d.b.h. and seedlings (trees <1.0 inch in d.b.h.) are measured on a microplot, which has a radius of 6.8 feet and an area of 1/300 acre, in each of the four subplots.
Because the plots are placed on the ground without bias, i.e., systematically but at a scale large enough so that their placement can be considered random, there is a probability that the plot cluster will straddle more than one type of land use or forest condition. Furthermore, the four subplots are not relocated into the same land use. When a plot straddled multiple land uses or forest conditions the crew identified and mapped the differences encountered on the plot. There were two steps in the mapping process. The first step involved identifying forest and nonforest areas on the plot and establishing a boundary line on the plot if both were present. The second step involved identifying and mapping differing conditions
Figure A.2—Layout of fixed-radius plot.
Appendix A—Inventory Methods

68
in the forested portion of the plot based on six factors: (1) forest type, (2) stand size, (3) ownership, (4) stand density, (5) regeneration status, and (6) reserved status.
The new subplots were not installed in the same places where the remeasured plots were established. All of the current forest land area characteristics, e.g., stand size, ownership, forest type, stand age, and volume, are derived from data from the new subplots.
P3: forest health—Forest health data (P3 data) were collected on about 1/16th of the P2 sample plots. P3 data are coarse descriptions and are meant to be used as general indicators of overall forest health over large geographic areas. This data was not collected in Kentucky until 2000 so there is no previous methodology to compare and contrast.
P3 data include data related to tree crown health, dead woody material (DWM), foliar ozone injury, lichen diversity, and soil composition. Tree crown health, DWM, and soil composition measurements were collected using the same plot design used during P2 data collection, while lichen data were collected within a 120-foot radius circle centered on subplot 1 of each FIA P3 field plot (fig. A.2).
Biomonitoring sites for ozone data collection were located based on specific criteria and were located independently of the FIA grid. Sites chosen were 1-acre fields or similar open areas adjacent to or surrounded by forest land, and contained a minimum number of plants of at least two identified bioindicator species (Smith and others, in press). Plants were evaluated for ozone injury, and voucher specimens were submitted to a regional expert for verification of ozone-induced foliar injury.
Annual Versus Periodic
Previous surveys of Kentucky were done in a periodic fashion; all of the plots were measured in 1 to 2 years, and the remeasurement interval averaged 13 years. The current annual inventory design was implemented to provide more up-to-date information about forest resources. The goal of the annual inventory system is to measure 20 percent (referred to as a panel or subcycle) of the total plots in the Commonwealth each year so that all plots are measured within a 5-year period (one cycle). Each year’s panel of plots is selected on a subgrid that is slightly offset from the previous year’s plots, so each year covers essentially the same sample area (both spatially and in intensity) as the prior year. In the sixth year the plots that were measured in the first panel are remeasured. This marks the beginning of the next cycle of data collection. In actuality, the 2004 cycle took 6 years to complete.
After field measurements are completed, a cycle of data (consisting of the data for five panels of plots) is then available for discussion in a 5-year report. This dataset consists of data of differing collection dates and ages: 20 percent of the data would be <1yearold,20percent>1but< 2 years old, and so on.
One major effect of the switch to the annual inventory design is that the length of the data collection period, which used to be 1 or 2 years, has increased to 5 years. Data collected over a longer period of time has a higher probability of sampling a specific event, e.g., a hurricane or fire, but only in a small proportion of the sample. However, data collected over a shorter time span may miss an event entirely until the next periodic measurement takes place, at which time all of the sample plots reflect the event.
Appendix A—Inventory Methods

69
Moreover, the elapsed time between an event and plot remeasurement may erase significant evidence that the event occurred.
Volume Estimation
Nonlinear regression was used to estimate tree volumes in the previous inventory (Scott 1979, 1981). Tree volumes in the 2004 Kentucky inventory were computed using a simple linear regression model of the form:
where
V = volume and = parameters
dbh = diameter at breast height
Ht = height
= error
This equation estimated gross cubic-foot volume from a 1-foot stump to a 4-inch upper diameter for each sample tree. Separate equation coefficients for 77 species or species groupings were used. Net cubic-foot volume was derived by subtracting the estimate of rotten or missing wood for each sample tree. Volume of the saw-log portion (expressed in International ¼-inch board feet) of sample trees was derived by using board foot-to-cubic foot ratio equations. All equations and coefficients were developed from standing and felled tree volume studies conducted across several Southern States.
Growth, Removals, and Mortality Estimation
Previous—Estimates of growth, removals, and mortality in the 1988 inventory were based on data obtained by remeasuring 1,283 sample plots that were established in 1975. BAF 37.5 prisms were used to remeasure the 10-point variable-radius prism plots.
Current—Estimates of growth, removals, and mortality for the 2004 inventory were determined on the basis of remeasurement data for 1,751 sample plots established in the 1988 inventory. This was accomplished by remeasuring the trees on the poletimber and sawtimber plots at point center of the previous plot design. The reproduction plots at point center and the four satellite points were not remeasured. Differences between the volume equations used in this inventory and those used previously have already been described, and these differences affected growth, removal, and mortality volume estimates.
Changes in Methods Used to Assess Attributes
The methods used to assess various attributes have changed in some cases and this may affect trend analysis. In 1988, field personnel evaluated the forested area of the plot as a single stand, using the plurality of stocking as the basis of assessing most of the stand variables. The current procedures required mapping of divergent forest conditions across the plot, and then recording the differences in stand characteristics. Thus, the size and homogeneity of the assessment areas changed from one inventory to the next. There are also some differences between the 1988 algorithms employed by the Northeastern Research Station and the current algorithms used to compute stocking, stand size, and forest type. However, the forest-type data for the 2004 inventory reflect only the field crew’s forest-type determination; no forest-type algorithm was employed. As FIA standardizes these algorithms nationally, region-to-region differences in methodology will diminish.
Appendix A—Inventory Methods

70
Change in Assessing Area of National Forest and Reserved Lands
Previous—In the 1988 Kentucky inventory, all national forest and public agency forest lands (timberland and reserved) plus forest industry timberland in each county were enumerated. The enumerated or known acreages were taken from public agency reports and other public domain documents at the Commonwealth and county levels. For each county, the known forest area in each enumerated ownership class was divided by the number of sample locations for that ownership class to produce an expansion factor. Also for each county, the total known forest area in enumerated ownership classes was subtracted from the county’s total forest area (obtained from P1), and the result was divided by the number of sample locations on land that was not in enumerated ownership classes. The latter operations yielded expansion factors for the nonenumerated ownerships. In addition, supplemental plots were installed to account for small parcels of land where a FIA plot did not fall.
Current—Estimates of area for all lands and ownership classes were based on the probability of selection of P2 plot locations. Information about the area of land in various ownership classes was not used to determine area and plot expansion factors. As a result, known forest land area will not always agree closely with area estimates derived by means of probability of selection for all ownerships. For example, the known acreage of national forests, published by the National Forest System, will not agree exactly with FIA’s statistically derived estimates of national forest land area. These numbers could differ substantially when areas are smaller, as at the county level.
Privacy Laws
It is important that forest land owners and FIA data users be aware that Federal law requires that private ownership information collected by FIA shall not be made available for public distribution. Federal law also requires that the exact locations of FIA plots shall not be made public, as this information could be used to determine who owns the land on which plots are sited. This resource bulletin summarizes FIA data by ownership class at the multicounty unit and State levels. FIA reports characterize ownership at the county level only as public or private, and FIA does not make more detailed county-level ownership information available, even on the FIADB Web site.
Summary
Users who wish to make rigorous comparisons between data from different surveys should be aware that plot designs and methods for assessing variables have changed over time. If there is no bias in plot selection or maintenance of plot integrity, the most valuable and powerful trend information is produced when the same plots are visited from one survey to the next and measured in the same way. This is also the only method that yields reliable components of change estimation (growth, removals, and mortality). This approach reduces the data noise that is present in natural forest stands and makes for a higher level of confidence in assessing trends. However, if sample designs change, there can never be a high level of certainty whether the trends in the data are real or due to procedural changes. Even though both designs may be judged statistically valid, the naturally occurring noise in the data hinders confident and rigorous assessments of trend over time. Data produced by different sample designs can have different degrees of strength in trend, depending on what is being compared. Defining the confidence and strength of trend over time is difficult or impossible when sample methodology differs.
Appendix A—Inventory Methods

71
Sample estimate and SamplingItem confidence interval error
percent Timberland (1,000 acres) 11,647.9 ± 46.1 0.40 All live (million cubic feet) Inventory 21,187.9 ± 304.9 1.44 Net annual growth 565.0 ± 13.3 2.35 Annual removals 319.5 ± 25.4 7.96 Annual mortality 204.1 ± 13.9 6.80 Growing stock (million cubic feet) Inventory 18,217.4 ± 294.2 1.61 Net annual growth 470.0 ± 13.8 2.93 Annual removals 311.8 ± 25.1 8.04 Annual mortality 182.7 ± 12.0 6.58 Sawtimber (million board feeta) Inventory 60,382.8 ± 1,358.8 2.25 Net annual growth 2,181.4 ± 81.4 3.73 Annual removals 1,166.3 ± 103.2 8.85 Annual mortality 478.2 ± 55.0 11.5
a International ¼-inch rule.
A measure of reliability of inventory statistics is provided by sampling errors. Sampling errors (in percent) and confidence intervals for estimates of timberland area and inventory volumes are presented in the following tabulation. For each estimate in this tabulation, there is a two-out-of-three chance that the true population value is within the confidence interval indicated.
Sampling error (in percent) is calculated by dividing the square root of an estimate’s variance by the estimate and multiplying the result by 100. The relative sizes of
sampling errors (in percent) associated with estimates of different items indicate the relative reliability of those estimates.
FIA inventories supported by the full complement of sample plots are designed to achieve reliable statistics at the survey unit and State levels. Sampling error increases as the area or volume considered decreases in magnitude. Sampling errors and associated confidence intervals are often unacceptably high for small components of the total resource. Statistical confidence may be
Appendix B—Reliability of the Data

72
computed for any subdivision of State totals using the following formula.
where
SES = sampling error for subdivision
of State total
SEt = sampling error for State total
XS = sum of values for the variable
of interest (area or volume) for subdivision of State
Xt = total area or volume for State
Sampling errors obtained by this method are only approximations of reliability because this process assumes constant variance across all subdivisions of totals.
For example, the number of acres of timberland owned by forestry industry is estimated at 278.8 thousand acres. The estimate of sampling error for this example is computed as:
Thus, the sampling error is 2.59 percent, and the resulting confidence interval of one standard error (two times out of three) for area of timberland owned by forest industry is 278.8±7.2 thousand acres. To achieve the 95-percent confidence interval, the standard error is multiplied by 1.96 or 278.8±14.1 thousand acres.
Precautions
The accuracy of small subsets of population totals is highly variable. Therefore, it is strongly recommended that users who are summarizing statistics from the FIADB avoid using data for any subdivision below the survey unit level. All published FIA reports include a chapter that explains sampling errors and provides cautions about the reliability of statistics for subpopulations, such as county-level statistics. Users should familiarize themselves with the procedures for computing sampling error, which are outlined above.
Appendix B—Reliability of the Data

73
Softwoods Eastern redcedar Juniperus virginiana L.Shortleaf pine Pinus echinata Mill.Table Mt. pine P. pungens Lamb.Eastern white pine P. strobus L.Loblolly pine P. taeda L.Virginia pine P. virginiana Mill.Baldcypress Taxodium distichum (L.) Rich.Eastern hemlock Tsuga canadensis (L.) Carr.
Hardwoods Boxelder Acer negundo L.Red maple A. rubrum L.Silver maple A. saccharinum L.Sugar maple A. saccharum Marsh.Buckeye Aesculus spp. L.Ohio buckeye A. glabra Willd.Ailanthus Ailanthus altissima (Mill.) SwingleServiceberry Amelanchier spp. Medic.Yellow birch Betula alleghaniensis BrittonRiver birch Betula nigra L.American hornbeam Carpinus caroliniana Walt.Hickory Carya spp. Nutt.Water hickory C. aquatica (Michx. f.) Nutt.Bitternut hickory C. cordiformis (Wangenh.) K. KochPignut hickory C. glabra (Mill.) SweetPecan C. illinoensis (Wangenh.) K. KochShellbark hickory C. laciniosa (Michx. f.) Loud.Nutmeg hickory C. myristiciformis (Mich. f.) Nutt.Shagbark hickory C. ovata (Mill.) K. KochBlack hickory C. texana Buckl.Mockernut hickory C. tomentosa (Poir.) Nutt.Allegheny chinkapin Castanea pumila Mill.Chinkapin Castanopsis (D. Don) SpachCatalpa Catalpa spp. Scop.Sugarberry Celtis laevigata Willd.Hackberry C. occidentalis L.Eastern redbud Cercis canadensis L.Flowering dogwood Cornus florida L.Hawthorn Crataegus spp. L.Common persimmon Diospyros virginiana L.American beech Fagus grandifolia Ehrh.White ash Fraxinus americana L. Pumpkin ash F. profunda (Bush) BushBlue ash F. quadrangulata Michx.Waterlocust Gleditsia aquatica Marsh.Honeylocust G. triacanthos L.Kentucky coffeetree Gymnocladus dioicus (L.) K. KochAmerican holly Ilex opaca Ait.
a Common and scientific names of tree species > 1.0 inch d.b.h. occurring in the FIA sample.b Little (1979).
Hardwoods (continued)Black walnut Juglans nigra L.Sweetgum Liquidambar styraciflua L.Yellow-poplar Liriodendron tulipifera L.Osage-orange Maclura pomifera (Raf.) Schneid.Cucumbertree Magnolia acuminata L.Southern magnolia M. grandiflora L.Bigleaf magnolia M. macrophylla Michx.Apple Malus spp. Mill.Chinaberry Melia azedarach L.White mulberry Morus alba L.Red mulberry M. rubra L.Water tupelo Nyssa aquatica L.Blackgum N. sylvatica Marsh.Swamp tupelo N. sylvatica var. biflora (Walt.) Sarg.Eastern hophornbeam Ostrya virginiana (Mill.) K. KochSourwood Oxydendrum arboreum (L.) DC.American sycamore Platanus occidentalis L.Cottonwood Populus spp. L.Black cherry Prunus serotina Ehrh.White oak Quercus alba L.Scarlet oak Q. coccinea Muenchh.Durand oak Q. durandii Buckl.Southern red oak Q. falcata Michx.Cherrybark oak Q. falcata var. pagodifolia Ell.Overcup oak Q. lyrata Walt.Swamp chestnut oak Q. michauxii Nutt.Chinkapin oak Q. muehlenbergii Engelm.Water oak Q. nigra L.Nuttall oak Q. nuttallii PalmerPin oak Q. palustris Muenchh.Willow oak Q. phellos L.Chestnut oak Q. prinus L.Northern red oak Q. rubra L.Shumard oak Q. shumardii Buckl.Post oak Q. stellata Wangenh.Black oak Q. velutina Lam.Black locust Robinia pseudoacacia L.Willow Salix spp. L.Sassafras Sassafras albidum (Nutt.) NeesAmerican basswood Tilia americana L.White basswood T. heterophylla Vent.Winged elm Ulmus alata Michx.American elm U. americana L.Cedar elm U. crassifolia Nutt.Slippery elm U. rubra Muhl. September elm U. serotina Sarg.Rock elm U. thomasii Sarg.
Species Lista
Common name Common nameScientific nameb Scientific nameb
Appendix C—Species List


75
Table A.1—Land area by survey unit and land class, Kentucky, 2004
Forest land
Survey unitTotal land
area aTotal forest
Timber- land
Productive reserved Other
Other land b
thousand acres
Eastern 2,123.1 1,838.8 1,794.6 32.0 12.1 284.2Northern Cumberland 2,492.1 1,909.6 1,884.6 21.9 3.1 582.6Southern Cumberland 2,780.1 2,197.2 2,063.2 127.4 6.7 582.8Bluegrass 5,617.2 1,559.2 1,550.5 8.7 — 4,058.0Pennyroyal 4,818.1 2,080.2 2,041.6 33.1 5.4 2,737.9Western Coalfield 5,438.8 1,686.8 1,644.5 31.8 10.5 3,752.0Western 2,156.6 698.6 668.9 29.7 — 1,458.0
All units 25,425.9 11,970.4 11,647.9 284.7 37.8 13,455.5
— = no sample for the cell. Numbers in rows and columns may not sum to totals due to rounding.a From the U.S. Bureau of the Census (2000).b Includes 138.84 thousand acres classified as land by the Bureau of the Census and as water by Forest Inventory and Analysis.
Table A.2—Area of timberland by survey unit and ownership class, Kentucky, 2004
Ownership class
Survey unitAll
classesNational
forestOther public
Forest industry
Nonindustrial private
thousand acres
Eastern 1,794.6 71.3 39.5 24.6 1,659.2 Northern Cumberland 1,884.6 127.3 83.8 56.5 1,616.9 Southern Cumberland 2,063.2 319.5 43.8 49.3 1,650.6 Bluegrass 1,550.5 16.8 36.8 15.9 1,481.0 Pennyroyal 2,041.6 23.7 75.4 52.5 1,890.0 Western Coalfield 1,644.5 — 77.9 23.0 1,543.7 Western 668.9 31.5 82.7 57.0 497.7
All units 11,647.9 590.3 439.7 278.8 10,339.1
— = no sample for the cell. Numbers in rows and columns may not sum to totals due to rounding.
Appendix D—Supplemental Tables

76
Tab
le A
.3—
Are
a o
f ti
mb
erla
nd
by
surv
ey u
nit
an
d f
ore
st-t
ype
gro
up
, Ken
tuck
y, 2
004
Sur
vey
unit
All
grou
ps
For
est-
type
gro
up
Whi
te-r
ed-
jack
pin
eLo
blol
ly-
shor
tleaf
Pin
yon-
juni
per a
Oak
-pi
neO
ak-
hick
ory
Oak
-gum
-cy
pres
sE
lm-a
sh-
cotto
nwoo
dM
aple
-be
ech-
birc
hA
spen
-bi
rch
Non
-st
ocke
d
thou
sand
acr
es
Eas
tern
1,79
4.6
37.5
16
.3
—29
.31,
407.
3—
34.5
26
3.2
—6.
6
Nor
ther
n C
umbe
rland
1,88
4.6
68.6
37
.1
10.3
10
9.1
1,58
5.7
—10
.7
57.6
4.1
1.
5
Sou
ther
n C
umbe
rland
2,06
3.2
44.7
11
4.9
—
112.
61,
659.
31.
629
.2
96.0
—4.
9
Blu
egra
ss1,
550.
5—
7.0
85
.5
360.
675
3.0
—20
2.5
12
6.8
—15
.0
Pen
nyro
yal
2,04
1.6
5.9
42
.5
54.5
28
4.6
1,40
8.6
—84
.9
150.
7
—
9.9
W
este
rn C
oalfi
eld
1,64
4.5
—20
.0
20.1
15
1.9
1,17
3.2
21.8
171.
7
64.8
—21
.2
Wes
tern
668.
9—
6.5
—
30.6
449.
356
.611
1.9
10
.2
—
3.7
A
ll un
its11
,647
.915
6.8
24
4.2
17
0.3
1,
078.
78,
436.
380
.064
5.4
76
9.3
4.1
62
.8
— =
no
sam
ple
for
the
cell.
N
umbe
rs in
row
s an
d co
lum
ns m
ay n
ot s
um to
tota
ls d
ue to
rou
ndin
g.F
ores
t-ty
pe g
roup
s ar
e ba
sed
on fi
eld
estim
ates
.a In
clud
es e
aste
rn r
edce
dar
fore
st ty
pe.
Tab
le A
.4—
Are
a o
f ti
mb
erla
nd
by
surv
ey u
nit
an
d s
tan
d-s
ize
clas
s,
Ken
tuck
y, 2
004
Sur
vey
unit
All
clas
ses
Sta
nd-s
ize
clas
s
Saw
-tim
ber
Pol
e-tim
ber
Sap
ling-
seed
ling
Non
-st
ocke
d
thou
sand
acr
es
Eas
tern
1,79
4.6
1,37
4.5
270.
814
2.7
6.6
N
orth
ern
Cum
berla
nd1,
884.
61,
301.
341
1.1
170.
6 1.
5
Sou
ther
n C
umbe
rland
2,06
3.2
1,42
4.6
400.
423
3.4
4.9
B
lueg
rass
1,55
0.5
786.
155
8.8
190.
6 15
.0
Pen
nyro
yal
2,04
1.6
1,31
2.8
501.
621
7.4
9.9
W
este
rn C
oalfi
eld
1,64
4.5
1,00
2.7
486.
713
3.9
21.2
W
este
rn66
8.9
403.
519
2.2
69.4
3.
7
A
ll un
its11
,647
.97,
605.
42,
821.
61,
158.
0 62
.8
Num
bers
in r
ows
and
colu
mns
may
not
sum
to to
tals
due
to r
ound
ing.
Appendix D—Supplemental Tables

77
Table A.5—Area of timberland by forest-type group, stand origin, and ownership class, Kentucky, 2004
Forest-type group and stand origin
All classes
Ownership class
National forest
Other public
Forest industry
Nonindustrial private
thousand acres
Softwood types White-red-jack pine Planted 16.7 9.0 — — 7.7 Natural 140.1 23.7 3.5 — 112.9
Total 156.8 32.7 3.5 — 120.6
Loblolly-shortleaf Planted 31.2 — — 2.3 28.9 Natural 213.0 13.4 1.7 — 197.8
Total 244.2 13.4 1.7 2.3 226.7
Pinyon-juniper a 170.3 — 9.8 — 160.5
Total softwoods 571.3 46.1 15.0 2.3 507.8
Hardwood types Oak-pine Planted 21.3 — 9.5 6.0 5.8 Natural 1,057.3 46.5 50.5 6.5 953.9
Total 1,078.7 46.5 60.0 12.5 959.7
Oak-hickory 8,436.3 481.4 292.4 216.9 7,445.7 Oak-gum-cypress 80.0 — 14.4 17.3 48.2 Elm-ash-cottonwood 645.4 — 38.2 5.6 601.6 Maple-beech-birch 769.3 16.3 15.1 24.1 713.8 Aspen-birch 4.1 — — — 4.1
Total hardwoods 11,013.8 544.1 420.1 276.5 9,773.1
Nonstocked 62.8 — 4.6 — 58.2
All groups 11,647.9 590.3 439.7 278.8 10,339.1
— = no sample for the cell. Numbers in rows and columns may not sum to totals due to rounding.Forest-type groups are based on field estimates.a Includes eastern redcedar forest type.
Appendix D—Supplemental Tables

78
Tab
le A
.6—
Nu
mb
er o
f liv
e tr
ees
on
tim
ber
lan
d b
y sp
ecie
s g
rou
p a
nd
dia
met
er c
lass
, Ken
tuck
y, 2
004
Spe
cies
gro
upA
ll
clas
ses
Dia
met
er c
lass
(in
ches
at b
reas
t hei
ght
)
1.0–
2.9
3.0–
4.9
5.0–
6.9
7.0–
8.9
9.0–
10
.9
11.0
– 12
.9
13.0
– 14
.9
15.0
– 16
.9
17.0
– 18
.9
19.0
– 20
.9
21.0
– 28
.9
29.0
and
la
rger
thou
sand
tree
s
Sof
twoo
d
Yel
low
pin
e17
2,31
073
,967
32,6
2320
,492
15,9
7711
,981
8,20
84,
548
2,84
589
146
731
0—
O
ther
sof
twoo
ds39
6,09
619
9,16
610
7,74
446
,569
22,8
9610
,093
4,34
12,
241
1,00
773
341
981
274
All
softw
oods
568,
406
273,
133
140,
367
67,0
6138
,874
22,0
7412
,550
6,78
93,
852
1,62
488
61,
122
74
Har
dwoo
d
Sof
t har
dwoo
d2,
588,
641
1,64
2,03
044
6,92
919
5,69
911
4,20
568
,985
46,7
5330
,900
19,9
0510
,681
5,15
36,
378
1,02
2
H
ard
hard
woo
d3,
312,
096
1,87
6,40
655
8,72
426
7,59
618
1,79
213
6,21
310
0,17
674
,693
48,5
4429
,822
16,4
0519
,444
2,28
2
All
hard
woo
ds5,
900,
736
3,51
8,43
61,
005,
653
463,
295
295,
996
205,
198
146,
929
105,
594
68,4
5040
,503
21,5
5825
,822
3,30
4
All
spec
ies
6,46
9,14
23,
791,
569
1,14
6,02
053
0,35
533
4,87
022
7,27
215
9,47
911
2,38
272
,302
42,1
2722
,444
26,9
443,
378
— =
no
sam
ple
for
the
cell.
N
umbe
rs in
row
s an
d co
lum
ns m
ay n
ot s
um to
tota
ls d
ue to
rou
ndin
g.
Appendix D—Supplemental Tables

79
Tab
le A
.7—
Nu
mb
er o
f g
row
ing
-sto
ck t
rees
on
tim
ber
lan
d b
y sp
ecie
s g
rou
p a
nd
dia
met
er c
lass
, Ken
tuck
y, 2
004
Spe
cies
gro
upA
ll cl
asse
s
Dia
met
er c
lass
(in
ches
at b
reas
t hei
ght
)
1.0–
2.
9 3.
0–
4.9
5.0–
6.
9 7.
0–
8.9
9.0–
10.9
11
.0–
12.9
13
.0–
14.9
15
.0–
16.9
17
.0–
18.9
19
.0–
20.9
21
.0–
28.9
29
.0 a
nd
larg
er
thou
sand
tree
sS
oftw
ood
Y
ello
w p
ine
90,2
1515
,541
17,1
7917
,633
13,7
9110
,703
7,58
73,
957
2,45
976
332
527
7—
O
ther
sof
twoo
ds14
9,15
854
,034
42,0
0026
,607
14,6
175,
576
2,53
11,
482
602
618
246
772
74
All
softw
oods
239,
373
69,5
7659
,178
44,2
3928
,408
16,2
8010
,118
5,43
93,
062
1,38
157
11,
048
74
Har
dwoo
d
Sof
t har
dwoo
d86
3,32
229
3,25
519
7,03
513
0,53
484
,850
55,3
3038
,669
26,6
1017
,531
9,13
04,
542
5,21
462
2
Har
d ha
rdw
ood
1,13
2,12
424
8,78
820
1,26
017
5,14
914
1,60
311
4,87
286
,018
65,7
3842
,714
26,2
3414
,175
14,4
851,
086
All
hard
woo
ds1,
995,
446
542,
043
398,
295
305,
683
226,
454
170,
202
124,
687
92,3
4860
,244
35,3
6418
,718
19,7
001,
708
All
spec
ies
2,23
4,81
961
1,61
945
7,47
334
9,92
225
4,86
118
6,48
213
4,80
597
,786
63,3
0636
,745
19,2
8920
,748
1,78
2
— =
no
sam
ple
for
the
cell.
N
umbe
rs in
row
s an
d co
lum
ns m
ay n
ot s
um to
tota
ls d
ue to
rou
ndin
g.
Appendix D—Supplemental Tables

80
Table A.8—Volume of live trees on timberland by species group and diameter class, Kentucky, 2004
Species groupAll
classes
Diameter class (inches at breast height)
5.0– 6.9
7.0– 8.9
9.0– 10.9
11.0– 12.9
13.0– 14.9
15.0– 16.9
17.0– 18.9
19.0– 20.9
21.0– 28.9
29.0 and larger
million cubic feet
Softwood Yellow pine 852.0 59.5 110.8 150.8 167.6 135.3 122.6 49.2 31.8 24.5 — Other softwoods 597.9 98.8 112.5 89.3 61.8 49.5 29.0 32.5 22.5 84.9 17.0
All softwoods 1,449.9 158.3 223.2 240.1 229.4 184.9 151.6 81.7 54.3 109.3 17.0
Hardwood Soft hardwood 6,248.5 535.2 717.8 803.6 873.5 865.8 772.0 533.7 340.7 602.4 203.9 Hard hardwood 13,489.6 718.4 1,131.3 1,576.9 1,845.4 2,007.1 1,810.3 1,432.1 987.4 1,624.9 355.8
All hardwoods 19,738.1 1,253.5 1,849.1 2,380.5 2,718.9 2,872.9 2,582.3 1,965.8 1,328.1 2,227.2 559.7
All species 21,187.9 1,411.8 2,072.3 2,620.7 2,948.2 3,057.8 2,733.9 2,047.5 1,382.4 2,336.6 576.7
— = no sample for the cell. Numbers in rows and columns may not sum to totals due to rounding.
Table A.9—Volume of growing-stock trees on timberland by species group and diameter class, Kentucky, 2004
Species groupAll
classes
Diameter class (inches at breast height)
5.0– 6.9
7.0– 8.9
9.0– 10.9
11.0– 12.9
13.0– 14.9
15.0– 16.9
17.0– 18.9
19.0– 20.9
21.0– 28.9
29.0 and larger
million cubic feet
Softwood Yellow pine 763.4 53.7 99.0 138.1 156.6 119.4 106.7 43.5 24.1 22.3 — Other softwoods 419.0 60.4 75.8 51.0 38.1 34.8 17.9 28.8 13.8 81.5 17.0
All softwoods 1,182.4 114.1 174.8 189.1 194.7 154.2 124.6 72.3 37.9 103.7 17.0
Hardwood Soft hardwood 5,355.0 386.6 571.2 679.4 762.6 775.7 709.3 483.1 310.1 525.8 151.2 Hard hardwood 11,680.0 511.6 929.4 1,382.8 1,646.4 1,814.3 1,648.8 1,312.2 889.5 1,335.4 209.5
All hardwoods 17,035.0 898.2 1,500.6 2,062.2 2,409.0 2,590.0 2,358.1 1,795.4 1,199.6 1,861.2 360.7
All species 18,217.4 1,012.3 1,675.4 2,251.3 2,603.7 2,744.1 2,482.7 1,867.7 1,237.5 1,964.9 377.7
— = no sample for the cell. Numbers in rows and columns may not sum to totals due to rounding.
Appendix D—Supplemental Tables

81
Table A.10—Volume of sawtimber on timberland by species group and diameter class, Kentucky, 2004
Species groupAll
classes
Diameter class (inches at breast height)
9.0– 10.9
11.0– 12.9
13.0– 14.9
15.0– 16.9
17.0– 18.9
19.0– 20.9
21.0– 28.9
29.0 and larger
million board feet a
Softwood Yellow pine 2,873.3 502.3 686.4 585.4 572.0 248.0 141.6 137.6 — Other softwoods 1,464.9 199.9 171.0 172.0 95.7 156.2 77.9 483.7 108.6
All softwoods 4,338.2 702.2 857.4 757.3 667.7 404.2 219.4 621.3 108.6
Hardwood Soft hardwood 17,391.7 — 2,635.1 3,205.9 3,333.9 2,450.4 1,671.8 3,086.7 1,007.8 Hard hardwood 38,653.0 — 5,674.0 7,191.0 7,197.2 6,117.6 4,328.1 6,967.9 1,177.2
All hardwoods 56,044.6 — 8,309.1 10,396.9 10,531.1 8,568.1 5,999.9 10,054.6 2,184.9
All species 60,382.8 702.2 9,166.6 11,154.3 11,198.9 8,972.3 6,219.3 10,675.8 2,293.6
— = no sample for the cell. Numbers in rows and columns may not sum to totals due to rounding.a International ¼-inch rule.
Table A.11—Volume of live trees on timberland by survey unit and species group, Kentucky, 2004
Survey unitAll
species
Softwoods Hardwoods
All softwood
Yellow pine
Other softwood
All hardwood
Soft hardwood
Hard hardwood
million cubic feet
Eastern 3,627.5 117.6 74.7 42.9 3,509.9 1,365.6 2,144.3Northern Cumberland 3,519.3 267.4 205.5 61.9 3,251.9 870.3 2,381.6Southern Cumberland 3,936.1 318.7 260.8 57.9 3,617.4 1,195.5 2,421.9Bluegrass 2,299.2 197.5 21.6 176.0 2,101.6 583.2 1,518.4Pennyroyal 3,654.9 284.9 170.5 114.4 3,370.0 888.5 2,481.5Western Coalfield 2,878.1 155.6 99.2 56.5 2,722.5 905.7 1,816.8Western 1,272.8 108.0 19.7 88.3 1,164.8 439.6 725.2
All units 21,187.9 1,449.9 852.0 597.9 19,738.1 6,248.5 13,489.6
Numbers in rows and columns may not sum to totals due to rounding.
Appendix D—Supplemental Tables

82
Table A.12—Volume of growing stock on timberland by survey unit and species group, Kentucky, 2004
Survey unitAll
species
Softwoods Hardwoods
All softwood
Yellow pine
Other softwood
All hardwood
Soft hardwood
Hard hardwood
million cubic feet
Eastern 3,054.3 98.3 68.6 29.7 2,956.0 1,205.9 1,750.2Northern Cumberland 3,176.3 248.4 189.6 58.8 2,927.9 775.6 2,152.3Southern Cumberland 3,483.3 288.5 239.9 48.6 3,194.8 1,052.4 2,142.4Bluegrass 1,791.6 123.3 18.9 104.4 1,668.3 440.2 1,228.1Pennyroyal 3,142.3 208.9 145.7 63.1 2,933.4 734.6 2,198.8Western Coalfield 2,443.8 111.8 81.7 30.0 2,332.1 771.2 1,560.9Western 1,125.7 103.3 18.9 84.4 1,022.4 375.1 647.3
All units 18,217.4 1,182.4 763.4 419.0 17,035.0 5,355.0 11,680.0
Numbers in rows and columns may not sum to totals due to rounding.
Table A.13—Volume of sawtimber on timberland by survey unit and species group, Kentucky, 2004
Survey unitAll
species
Softwoods Hardwoods
All softwood
Yellow pine
Other softwood
Allhardwood
Soft hardwood
Hard hardwood
million board feet a
Eastern 10,428.2 421.3 294.7 126.7 10,006.9 4,039.8 5,967.1Northern Cumberland 10,145.4 975.0 702.7 272.3 9,170.4 2,208.4 6,962.0Southern Cumberland 11,594.5 1,054.4 872.9 181.4 10,540.1 3,219.6 7,320.5Bluegrass 5,646.7 292.0 62.5 229.5 5,354.7 1,512.2 3,842.5Pennyroyal 10,210.0 653.1 530.8 122.3 9,556.8 2,349.6 7,207.2Western Coalfield 8,054.8 437.3 367.7 69.6 7,617.5 2,455.4 5,162.1Western 4,303.3 505.0 41.9 463.1 3,798.3 1,606.8 2,191.5
All units 60,382.8 4,338.2 2,873.3 1,464.9 56,044.6 17,391.7 38,653.0
Numbers in rows and columns may not sum to totals due to rounding.a International ¼-inch rule.
Appendix D—Supplemental Tables
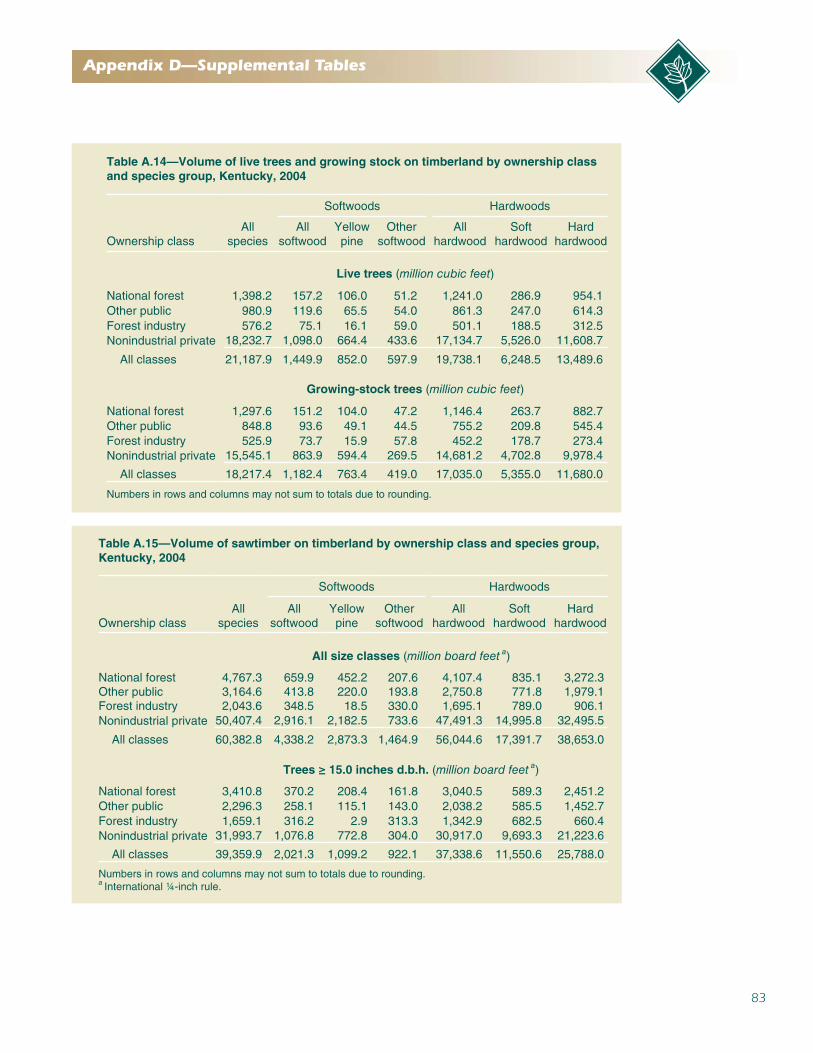
83
Table A.14—Volume of live trees and growing stock on timberland by ownership class and species group, Kentucky, 2004
Ownership classAll
species
Softwoods Hardwoods
All softwood
Yellow pine
Other softwood
All hardwood
Soft hardwood
Hard hardwood
Live trees (million cubic feet)
National forest 1,398.2 157.2 106.0 51.2 1,241.0 286.9 954.1Other public 980.9 119.6 65.5 54.0 861.3 247.0 614.3Forest industry 576.2 75.1 16.1 59.0 501.1 188.5 312.5Nonindustrial private 18,232.7 1,098.0 664.4 433.6 17,134.7 5,526.0 11,608.7
All classes 21,187.9 1,449.9 852.0 597.9 19,738.1 6,248.5 13,489.6
Growing-stock trees (million cubic feet)
National forest 1,297.6 151.2 104.0 47.2 1,146.4 263.7 882.7Other public 848.8 93.6 49.1 44.5 755.2 209.8 545.4Forest industry 525.9 73.7 15.9 57.8 452.2 178.7 273.4Nonindustrial private 15,545.1 863.9 594.4 269.5 14,681.2 4,702.8 9,978.4
All classes 18,217.4 1,182.4 763.4 419.0 17,035.0 5,355.0 11,680.0
Numbers in rows and columns may not sum to totals due to rounding.
Table A.15—Volume of sawtimber on timberland by ownership class and species group, Kentucky, 2004
Ownership classAll
species
Softwoods Hardwoods
All softwood
Yellow pine
Other softwood
All hardwood
Soft hardwood
Hard hardwood
All size classes (million board feet a)
National forest 4,767.3 659.9 452.2 207.6 4,107.4 835.1 3,272.3Other public 3,164.6 413.8 220.0 193.8 2,750.8 771.8 1,979.1Forest industry 2,043.6 348.5 18.5 330.0 1,695.1 789.0 906.1Nonindustrial private 50,407.4 2,916.1 2,182.5 733.6 47,491.3 14,995.8 32,495.5
All classes 60,382.8 4,338.2 2,873.3 1,464.9 56,044.6 17,391.7 38,653.0
Trees ≥ 15.0 inches d.b.h. (million board feet a)
National forest 3,410.8 370.2 208.4 161.8 3,040.5 589.3 2,451.2Other public 2,296.3 258.1 115.1 143.0 2,038.2 585.5 1,452.7Forest industry 1,659.1 316.2 2.9 313.3 1,342.9 682.5 660.4Nonindustrial private 31,993.7 1,076.8 772.8 304.0 30,917.0 9,693.3 21,223.6
All classes 39,359.9 2,021.3 1,099.2 922.1 37,338.6 11,550.6 25,788.0
Numbers in rows and columns may not sum to totals due to rounding.a International ¼-inch rule.
Appendix D—Supplemental Tables

84
Table A.16—Volume of growing stock on timberland by forest-type group, stand origin, and species group, Kentucky, 2004
Forest-type group and stand origin
All species
Softwoods Hardwoods
All softwood
Yellow pine
Other softwood
All hardwood
Soft hardwood
Hard hardwood
million cubic feet
Softwood types White-red-jack pine Planted 33.3 31.0 30.9 0.1 2.3 1.4 1.0 Natural 249.3 97.4 20.5 76.9 151.9 60.6 91.3
Total 282.7 128.4 51.5 76.9 154.3 62.0 92.3
Loblolly-shortleaf Planted 54.0 50.2 50.1 0.1 3.9 2.4 1.5 Natural 251.2 158.0 154.6 3.4 93.2 36.0 57.2
Total 305.3 208.2 204.7 3.5 97.1 38.4 58.7
Pinyon-juniper a 65.5 36.9 6.8 30.0 28.7 8.6 20.1
Total softwoods 653.5 373.4 263.0 110.4 280.1 109.0 171.1
Hardwood types Oak-pine Planted 19.1 16.7 16.7 — 2.5 2.1 0.4 Natural 1,009.9 348.5 220.5 128.1 661.4 197.0 464.4
Total 1,029.0 365.2 237.1 128.1 663.8 199.1 464.7
Oak-hickory 14,190.0 352.0 261.1 90.9 13,838.0 3,964.1 9,874.0 Oak-gum-cypress 289.2 80.1 — 80.1 209.1 121.3 87.8 Elm-ash-cottonwood 868.0 2.5 0.0 2.5 865.5 532.1 333.5 Maple-beech-birch 1,186.3 9.2 2.2 7.1 1,177.0 428.2 748.8
Total hardwoods 17,562.5 809.0 500.4 308.6 16,753.5 5,244.8 11,508.8
Nonstocked 1.4 — — — 1.4 1.2 0.1
All groups 18,217.4 1,182.4 763.4 419.0 17,035.0 5,355.0 11,680.0
— = no sample for the cell; 0.0 = a value of > 0.0 but < 0.05 for the cell. Numbers in rows and columns may not sum to totals due to rounding.Forest-type groups are based on field estimates.a Includes eastern redcedar forest type.
Appendix D—Supplemental Tables

85
Table A.17—Average net annual growth of live trees on timberland by survey unit and species group, Kentucky, 1988 to 2003
Survey unitAll
species
Softwoods Hardwoods
All softwood
Yellow pine
Other softwood
All hardwood
Soft hardwood
Hard hardwood
million cubic feet
Eastern 74.9 3.6 2.8 0.8 71.3 30.2 41.1Northern Cumberland 80.0 2.6 1.7 0.9 77.3 26.3 51.1Southern Cumberland 100.4 8.9 6.0 2.9 91.5 39.6 51.9Bluegrass 63.1 7.8 0.0 7.8 55.3 12.9 42.4Pennyroyal 109.8 8.9 3.9 5.0 100.9 35.1 65.8Western Coalfield 94.6 6.0 4.0 2.0 88.7 34.1 54.6Western 42.1 1.9 1.7 0.3 40.2 15.0 25.2
All units 565.0 39.8 20.2 19.6 525.2 193.2 332.0
Numbers in rows and columns may not sum to totals due to rounding.0.0 = a value of > 0.0 but < 0.05 for the cell.
Table A.18—Average net annual growth of growing stock on timberland by survey unit and species group, Kentucky, 1988 to 2003
Survey unitAll
species
Softwoods Hardwoods
Allsoftwood
Yellow pine
Other softwood
All hardwood
Soft hardwood
Hard hardwood
million cubic feet
Eastern 62.2 3.3 2.5 0.8 58.9 25.2 33.7Northern Cumberland 70.9 2.2 1.4 0.9 68.7 23.0 45.7Southern Cumberland 87.8 7.0 4.5 2.5 80.8 34.6 46.2Bluegrass 43.6 5.4 0.2 5.2 38.2 8.4 29.8Pennyroyal 93.2 5.1 2.5 2.6 88.1 29.8 58.3Western Coalfield 75.4 3.1 2.7 0.3 72.4 26.9 45.5Western 36.8 1.4 1.4 -0.0 35.4 12.7 22.7
All units 470.0 27.5 15.2 12.2 442.5 160.7 281.8
Numbers in rows and columns may not sum to totals due to rounding.-0.0 = a value of < 0.0 but > -0.5 for the cell.
Appendix D—Supplemental Tables

86
Table A.19—Average net annual growth of sawtimber on timberland by survey unit and species group, Kentucky, 1988 to 2003
Survey unitAll
species
Softwoods Hardwoods
All softwood
Yellow pine
Other softwood
All hardwood
Soft hardwood
Hard hardwood
million board feet a
Eastern 290.8 16.3 12.0 4.3 274.5 105.8 168.7Northern Cumberland 333.5 23.6 20.0 3.7 309.8 104.7 205.1Southern Cumberland 423.5 54.3 43.2 11.1 369.2 145.4 223.8Bluegrass 171.2 14.2 0.7 13.5 157.0 36.0 121.0Pennyroyal 455.9 25.0 17.9 7.2 430.9 145.0 286.0Western Coalfield 331.6 17.5 15.6 1.9 314.1 112.0 202.1Western 174.9 5.9 6.5 -0.6 169.0 61.8 107.2
All units 2,181.4 156.8 115.8 41.0 2,024.6 710.6 1,314.0
Numbers in rows and columns may not sum to totals due to rounding.a International ¼-inch rule.
Table A.20—Average annual removals of live trees on timberland by survey unit and species group, Kentucky, 1988 to 2003
Survey unitAll
species
Softwoods Hardwoods
All softwood
Yellow pine
Other softwood
All hardwood
Soft hardwood
Hard hardwood
million cubic feet
Eastern 42.1 1.0 0.4 0.6 41.1 13.9 27.2Northern Cumberland 49.1 0.7 0.7 — 48.4 12.5 35.9Southern Cumberland 39.2 5.0 4.8 0.2 34.2 14.4 19.8Bluegrass 30.8 6.1 0.1 6.0 24.7 9.8 14.9Pennyroyal 66.9 9.7 7.2 2.4 57.2 17.7 39.5Western Coalfield 63.2 0.6 0.3 0.3 62.6 17.0 45.6Western 28.1 0.2 0.0 0.1 28.0 11.0 17.0
All units 319.5 23.3 13.6 9.7 296.3 96.4 199.9
Numbers in rows and columns may not sum to totals due to rounding.— = no sample for the cell; 0.0 = a value of > 0.0 but < 0.05 for the cell.
Appendix D—Supplemental Tables

87
Table A.21—Average annual removals of growing stock on timberland by survey unit and species group, Kentucky, 1988 to 2003
Softwoods Hardwoods
Survey unitAll
speciesAll
softwoodYellow pine
Other softwood
All hardwood
Soft hardwood
Hard hardwood
million cubic feet
Eastern 40.6 1.0 0.4 0.6 39.6 13.1 26.5Northern Cumberland 48.6 0.7 0.7 — 47.9 12.3 35.6Southern Cumberland 38.4 5.0 4.8 0.2 33.4 13.8 19.6Bluegrass 29.2 5.9 0.1 5.7 23.3 9.4 13.9Pennyroyal 65.7 9.5 7.2 2.2 56.3 17.1 39.2Western Coalfield 62.7 0.6 0.3 0.3 62.1 16.7 45.4Western 26.6 0.2 0.0 0.1 26.5 10.2 16.3
All units 311.8 22.7 13.6 9.1 289.0 92.6 196.4
Numbers in rows and columns may not sum to totals due to rounding.— = no sample for the cell; 0.0 = a value of > 0.0 but < 0.05 for the cell.
Table A.22—Average annual removals of sawtimber on timberland by survey unit and species group, Kentucky, 1988 to 2003
Survey unitAll
species
Softwoods Hardwoods
All softwood
Yellow pine
Other softwood
Allhardwood
Softhardwood
Hard hardwood
million board feet a
Eastern 163.2 4.8 1.9 2.9 158.5 55.2 103.3Northern Cumberland 181.8 2.8 2.8 — 179.0 52.9 126.1Southern Cumberland 157.7 16.2 15.5 0.7 141.5 61.3 80.2Bluegrass 88.7 12.2 0.5 11.7 76.5 35.9 40.6Pennyroyal 261.8 41.3 34.6 6.7 220.5 74.5 146.0Western Coalfield 232.1 0.6 — 0.6 231.6 58.5 173.1Western 80.9 0.5 0.0 0.5 80.4 18.2 62.2
All units 1,166.3 78.3 55.3 23.1 1,088.0 356.5 731.5
Numbers in rows and columns may not sum to totals due to rounding.— = no sample for the cell; 0.0 = a value of > 0.0 but < 0.05 for the cell.a International ¼-inch rule.
Appendix D—Supplemental Tables

88
Table A.23—Average net annual growth and average annual removals of live trees, growing stock, and sawtimber on timberland by species group, Kentucky, 1988 to 2003
Species group
Live trees Growing stock Sawtimber
Net annual growth
Annual removals
Net annual growth
Annual removals
Net annual growth
Annual removals
- - - - - - - - million cubic feet - - - - - - - - million board feet a
Softwood Yellow pine 20.2 13.6 15.2 13.6 115.8 55.3 Other softwoods 19.6 9.7 12.2 9.1 41.0 23.1
All softwoods 39.8 23.3 27.5 22.7 156.8 78.3
Hardwood Soft hardwood 193.2 96.4 160.7 92.6 710.6 356.5 Hard hardwood 332.0 199.9 281.8 196.4 1,314.0 731.5
All hardwoods 525.2 296.3 442.5 289.0 2,024.6 1,088.0
All species 565.0 319.5 470.0 311.8 2,181.4 1,166.3
Numbers in rows and columns may not sum to totals due to rounding.a International ¼-inch rule.
Table A.24—Average annual mortality of live trees, growing stock, and sawtimber on timber-land by species group, Kentucky, 1988 to 2003
Species groupLive trees
Growing stock
Saw-timber
million cubic feet mmbf a
Softwood Yellow pine 24.3 24.0 67.4 Other softwoods 3.2 3.1 4.3
All softwoods 27.5 27.0 71.7
Hardwood Soft hardwood 54.6 48.9 109.1 Hard hardwood 122.1 106.7 297.4
All hardwoods 176.6 155.7 406.5
All species 204.1 182.7 478.2
Numbers in columns may not sum to totals due to rounding.a International ¼-inch rule.
Appendix D—Supplemental Tables

89
Table A.25—Average net annual growth and average annual removals of live trees on timberland by ownership class and species group, Kentucky, 1988 to 2003
Ownership classAll
species
Softwoods Hardwoods
All softwood
Yellow pine
Other softwood
All hardwood
Softhardwood
Hard hardwood
Average net annual growth (million cubic feet)
National forest 27.7 3.4 1.5 1.9 24.3 9.0 15.2Other public 23.5 1.9 1.0 0.9 21.6 9.2 12.3Forest industry 10.1 0.9 0.8 0.1 9.2 3.7 5.5Nonindustrial private 503.7 33.6 16.9 16.7 470.1 171.2 298.9
All classes 565.0 39.8 20.2 19.6 525.2 193.2 332.0
Average annual removals (million cubic feet)
National forest 4.3 0.2 0.2 — 4.1 1.3 2.8Other public 3.0 0.0 0.0 — 2.9 0.7 2.3Forest industry 6.6 0.2 0.2 — 6.4 1.9 4.6Nonindustrial private 305.6 22.8 13.1 9.7 282.8 92.6 190.2
All classes 319.5 23.3 13.6 9.7 296.3 96.4 199.9
Numbers in rows and columns may not sum to totals due to rounding.— = no sample for the cell; 0.0 = a value of > 0.0 but < 0.05 for the cell.
Appendix D—Supplemental Tables

90
Table A.26—Average net annual growth and average annual removals of growing stock on timberland by ownership class and species group, Kentucky, 1988 to 2003
Ownership classAll
species
Softwoods Hardwoods
All softwood
Yellow pine
Other softwood
All hardwood
Soft hardwood
Hard hardwood
Average net annual growth (million cubic feet)
National forest 24.4 3.3 1.4 1.8 21.2 7.6 13.5Other public 18.8 -0.4 -0.6 0.2 19.2 8.0 11.2Forest industry 9.1 0.6 0.6 — 8.5 3.2 5.3Nonindustrial private 417.7 24.0 13.8 10.2 393.7 141.9 251.8
All classes 470.0 27.5 15.2 12.2 442.5 160.7 281.8
Average annual removals (million cubic feet)
National forest 4.3 0.2 0.2 — 4.1 1.3 2.8Other public 2.8 0.0 0.0 — 2.8 0.6 2.2Forest industry 6.3 0.2 0.2 — 6.1 1.6 4.5Nonindustrial private 298.3 22.3 13.1 9.1 276.0 89.2 186.8
All classes 311.8 22.7 13.6 9.1 289.0 92.6 196.4
Numbers in rows and columns may not sum to totals due to rounding.— = no sample for the cell; 0.0 = a value of > 0.0 but < 0.05 for the cell.
Table A.27—Average net annual growth and average annual removals of sawtimber on timberland by ownership class and species group, Kentucky, 1988 to 2003
Ownership classAll
species
Softwoods Hardwoods
All softwood
Yellow pine
Other softwood
All hardwood
Soft hardwood
Hard hardwood
Average net annual growth (million board feet a)
National forest 127.4 20.8 12.6 8.2 106.6 34.0 72.6Other public 99.7 4.4 3.9 0.5 95.3 32.9 62.4Forest industry 33.1 -0.0 -0.0 — 33.1 6.7 26.4Nonindustrial private 1,921.3 131.6 99.3 32.3 1,789.6 637.0 1,152.6
All classes 2,181.4 156.8 115.8 41.0 2,024.6 710.6 1,314.0
Average annual removals (million board feet a)
National forest 12.2 — — — 12.2 3.0 9.2Other public 10.1 — — — 10.1 1.6 8.5Forest industry 29.4 1.0 1.0 — 28.4 8.8 19.6Nonindustrial private 1,114.6 77.3 54.2 23.1 1,037.3 343.1 694.2
All classes 1,166.3 78.3 55.3 23.1 1,088.0 356.5 731.5
Numbers in rows and columns may not sum to totals due to rounding.— = no sample for the cell; -0.0 = a value of < 0.0 but > -0.5 for the cell; 0.0 = a value of > 0.0 but < 0.05 for the cell.a International ¼-inch rule.
Appendix D—Supplemental Tables

91
List of Species
Table A.28—Average net annual growth of growing stock on timberland by forest-type group, stand origin, and species group, Kentucky, 1988 to 2003
Forest-type group a
and stand origin bAll
species
Softwoods Hardwoods
All softwood
Yellow pine
Other softwood
All hardwood
Soft hardwood
Hard hardwood
million cubic feet
Softwood types White-red-jack pine Planted — — — — — — — Natural 2.2 1.7 0.8 0.8 0.5 0.6 -0.1
Total 2.2 1.7 0.8 0.8 0.5 0.6 -0.1
Loblolly-shortleaf pine Planted 2.2 1.8 1.8 — 0.4 0.3 0.1 Natural 17.4 9.8 9.2 0.6 7.6 3.7 3.8
Total 19.6 11.6 11.0 0.6 7.9 4.0 3.9
Pinyon-juniper c 5.9 3.1 0.3 2.8 2.7 0.6 2.1
Total softwoods 27.7 16.4 12.1 4.2 11.1 5.2 5.9
Hardwood types Oak-pine Planted — — — — — — — Natural 26.6 3.3 0.4 2.9 23.2 10.0 13.2
Total 26.6 3.3 0.4 2.9 23.2 10.0 13.2
Oak-hickory 366.1 7.1 2.6 4.5 358.9 120.7 238.3 Oak-gum-cypress 1.8 0.0 — 0.0 1.8 0.5 1.3 Elm-ash-cottonwood 23.4 0.3 — 0.3 23.1 17.0 6.1 Maple-beech-birch 24.5 0.2 0.1 0.2 24.2 7.3 17.0 Aspen-birch — — — — — — —
Total hardwoods 442.4 10.9 3.1 7.9 431.2 155.5 275.9
Nonstocked — — — — — — —
All groups 470.0 27.5 15.2 12.1 442.5 160.7 281.8
Numbers in rows and columns may not sum to totals due to rounding.— = no sample for the cell; 0.0 = a value of > 0.0 but < 0.05 for the cell.a Forest-type groups are based on field estimates. Forest types calculated by an algorithm from the tree tally are not yet available.b Classification at the beginning of the remeasurement period.c Includes eastern redcedar forest type.
Appendix D—Supplemental Tables

92
Table A.29—Average annual removals of growing stock on timberland by forest-type group, stand origin, and species group, Kentucky, 1988 to 2003
Forest-type group a and stand origin b
All species
Softwoods Hardwoods
All softwood
Yellow pine
Other softwood
All hardwood
Soft hardwood
Hard hardwood
million cubic feet
Softwood types White-red-jack pine Planted — — — — — — — Natural 0.4 0.4 — 0.4 0.1 — 0.1
Total 0.4 0.4 — 0.4 0.1 — 0.1
Loblolly-shortleaf pine Planted 0.3 0.3 0.3 — — — — Natural 11.4 10.3 10.0 0.3 1.1 0.7 0.4
Total 11.7 10.6 10.3 0.3 1.1 0.7 0.4
Pinyon-juniper c 2.0 2.0 — 2.0 — — —
Total softwoods 14.1 13.0 10.3 2.7 1.2 0.7 0.5
Hardwood types Oak-pine Planted — — — — — — — Natural 9.8 6.1 2.0 4.1 3.6 1.4 2.3
Total 9.8 6.1 2.0 4.1 3.6 1.4 2.3
Oak-hickory 245.9 2.8 1.4 1.5 243.1 72.9 170.1 Oak-gum-cypress 1.7 0.0 — 0.0 1.6 0.2 1.5 Elm-ash-cottonwood 13.1 0.8 — 0.8 12.3 11.0 1.3 Maple-beech-birch 27.2 0.0 — 0.0 27.2 6.4 20.8 Aspen-birch — — — — — — —
Total hardwoods 297.7 9.8 3.4 6.4 287.9 91.9 196.0
Nonstocked — — — — — — —
All groups 311.8 22.7 13.7 9.1 289.0 92.6 196.5
Numbers in rows and columns may not sum to totals due to rounding.— = no sample for the cell; 0.0 = a value of > 0.0 but < 0.05 for the cell.a Forest-type groups are based on field estimates. Forest types calculated by an algorithm from the tree tally are not yet available.b Classification at the beginning of the remeasurement period.c Includes eastern redcedar forest type.
Appendix D—Supplemental Tables

93
Table A.30—Area of timberland treated or disturbed annually and retained in timberland by treatment or disturbance and ownership class, Kentucky, 1988 to 2003
Treatment or disturbance aAll
classes
Ownership class
PublicForest
industry Private
thousand acres
Final harvest 28.1 1.3 4.1 22.7Partial harvest b 282.0 7.4 11.2 263.4Seed tree/shelterwood 9.5 0.3 1.2 8.1Commercial thinning 9.4 0.3 3.7 5.4Other stand improvement 4.5 2.6 — 2.0Site preparation 4.1 — — 4.1Artificial regeneration c 0.3 0.0 0.0 0.3Natural regeneration c 79.1 6.0 5.4 67.8Other cutting — — — —Natural disturbance Insects 29.0 7.4 1.4 20.2 Disease 3.1 — — 3.1Weather Ice 14.8 4.7 — 10.1 Wind 7.3 1.3 — 6.0 Flood 34.1 3.1 3.8 27.2 Drought — — — — Weather - other 64.4 14.8 2.9 46.6
Total 120.6 23.8 6.8 90.0
Fire Ground 37.3 5.0 1.2 31.1 Crown — — — — Fire - other 53.2 7.0 — 46.2
Total 90.5 12.0 1.2 77.3
Animals Beaver 5.2 — 1.4 3.8 Porcupine — — — — Deer/ungulate 2.3 1.2 — 1.1 Bear — — — — Rabbit — — — — Animals - other 6.9 0.9 1.0 5.0
Total 14.4 2.1 2.4 9.8
Other disturbances Grazing 84.5 — — 84.5 Other human-caused disturbance 101.6 4.5 2.8 94.3 Other naturally caused disturbance 8.1 1.0 — 7.2
Since some acres experience more than one treatment or disturbance, there are no column totals.Numbers in rows and columns may not sum to totals due to rounding.— = no sample for the cell; 0.0 = a value of > 0.0 but < 0.05 for the cell.a Previous established plots record treatment and disturbance since last inventory. New plots record treatment and disturbance only if it occurred within the last 5 years.b Includes high-grading and some selective cutting.c Includes establishment of trees for timber production on forest and nonforest land.
Appendix D—Supplemental Tables

94
Table A.31—Average annual output of timber products by product, species group, and type of material, Kentucky, 1988 to 2003
Product and species group
Total output
Round-wood
productsPlant
byproducts
million cubic feet
Saw logs Softwood 5.6 5.6 — Hardwood 155.0 154.9 0.1
Total 160.6 160.5 0.1
Veneer logs Softwood 0.1 0.1 — Hardwood 5.5 5.5 —
Total 5.5 5.5 —
Pulpwood a
Softwood 2.8 2.4 0.4 Hardwood 49.8 16.6 33.2
Total 52.6 19.0 33.6
Composite panels Softwood 0.5 0.5 0.0 Hardwood 5.6 4.2 1.4
Total 6.1 4.7 1.5
Other industrial b
Softwood 4.3 1.9 2.5 Hardwood 40.4 5.0 35.4
Total 44.8 6.9 37.9
Total industrial products Softwood 13.4 10.5 2.9 Hardwood 256.3 186.1 70.2
Total 269.7 196.6 73.1
Fuelwood c
Softwood 0.1 0.1 0.0 Hardwood 17.1 16.8 0.3
Total 17.2 16.9 0.3
All products Softwood 13.5 10.6 2.9 Hardwood 273.3 202.9 70.4
Total 286.8 213.5 73.4
Numbers in rows and columns may not sum to totals due to rounding.— = no sample for the cell; 0.0 = a value of > 0.0 but < 0.05 for the cell.a Roundwood figures include an estimated 1.43 million cubic feet of roundwood chipped at other primary wood-using plants.b Includes litter, mulch, particleboard, charcoal, and other specialty products.c Excludes approximately 18.3 million cubic feet of wood residues and 7.3 million cubic feet of bark used for industrial fuel.
Appendix D—Supplemental Tables

95
Table A.32—Average annual output of roundwood products by product, species group, and source of material, Kentucky, 1988 to 2003
Growing-stock trees a
Product and species group
Allsources Total
Saw-timber
Pole-timber
Other sources b
million cubic feet
Saw logs Softwood 5.6 5.4 5.3 0.1 0.2 Hardwood 154.9 131.3 126.7 4.6 23.5
Total 160.5 136.7 132.1 4.7 23.7
Veneer logs Softwood 0.1 0.1 0.1 0.0 0.0 Hardwood 5.5 5.3 5.1 0.1 0.2
Total 5.5 5.3 5.2 0.1 0.2
Pulpwood Softwood 2.4 2.2 1.5 0.7 0.2 Hardwood 16.6 15.5 5.5 9.9 1.2
Total 19.0 17.7 7.0 10.6 1.4
Composite panels Softwood 0.5 0.5 0.3 0.1 0.0 Hardwood 4.2 3.9 1.4 2.5 0.2
Total 4.7 4.4 1.7 2.7 0.3
Other industrial Softwood 1.9 1.7 1.2 0.5 0.1 Hardwood 5.0 4.8 2.6 2.1 0.2
Total 6.9 6.5 3.9 2.6 0.4
Total industrial products Softwood 10.5 9.9 8.4 1.4 0.6 Hardwood 186.1 160.8 141.4 19.3 25.4
Total 196.6 170.6 149.9 20.8 25.9
Fuelwood Softwood 0.1 0.1 0.1 0.0 0.0 Hardwood 16.8 15.3 15.1 0.2 1.5
Total 16.9 15.4 15.2 0.2 1.5
All products Softwood 10.6 10.0 8.5 1.4 0.6 Hardwood 202.9 176.1 156.6 19.5 26.8
Total 213.5 186.0 165.1 20.9 27.5
Numbers in rows and columns may not sum to totals due to rounding.— = no sample for the cell; 0.0 = a value of > 0.0 but < 0.05 for the cell.a On timberland.b Includes trees < 5.0 inches in diameter, tree tops and limbs from timber-land, or material from other forest land or nonforest land such as fence rows or suburban areas.
Appendix D—Supplemental Tables

96
Table A.33—Average annual timber removals from growing stock on timberland by item, soft-wood, and hardwood, Kentucky, 1988 to 2003
ItemAll
speciesSoft- wood
Hard- wood
million cubic feet
Roundwood products Saw logs 136.7 5.4 131.3 Veneer logs and bolts 5.3 0.1 5.3 Pulpwood 17.7 2.2 15.5 Composite panels 4.4 0.5 3.9 Other 6.5 1.7 4.8 Fuelwood 15.4 0.1 15.3
All products 186.0 10.0 176.1
Logging residues 46.0 1.6 44.4
Other removals 79.7 11.1 68.6
Total removals 311.8 22.7 289.1
Numbers in rows and columns may not sum to totals due to rounding.
Table A.34—Disposal of average annual volume of residue at primary wood-using plants by product, species group, and type of residue, Kentucky, 1988 to 2003
Product and species group
All types Bark Coarse a Fine b
million cubic feet
Fiber products Softwood 0.4 — 0.4 0.0 Hardwood 33.2 0.1 32.4 0.7
Total 33.6 0.1 32.8 0.7
Particleboard Softwood 0.0 0.0 0.0 0.0 Hardwood 1.4 0.1 1.1 0.3
Total 1.5 0.1 1.1 0.3
Sawn products Softwood — — — — Hardwood 0.1 — 0.1 —
Total 0.1 — 0.1 —
Industrial fuel Softwood 0.6 0.4 0.1 0.1 Hardwood 25.3 6.9 3.1 15.3
Total 25.9 7.3 3.2 15.4
Charcoal Softwood 0.2 0.0 0.0 0.1 Hardwood 8.4 0.4 1.7 6.3
Total 8.6 0.4 1.7 6.4
Miscellaneous Softwood 2.3 0.5 1.1 0.8 Hardwood 27.0 14.2 3.8 9.0
Total 29.4 14.7 4.9 9.8
Not used Softwood 0.4 0.1 0.2 0.2 Hardwood 5.0 1.3 1.7 1.9
Total 5.4 1.4 1.9 2.0
All products Softwood 3.9 0.9 1.9 1.2 Hardwood 100.4 23.0 43.9 33.5
Total 104.3 23.9 45.7 34.7
Numbers in rows and columns may not sum to totals due to rounding.— = no sample for the cell; 0.0 = a value of > 0.0 but < 0.05 for the cell.a Material such as slabs and edgings.b Material such as sawdust and shavings.
Appendix D—Supplemental Tables

97
Tab
le A
.35—
Car
bo
n e
stim
ates
an
d c
oar
se w
oo
dy
mat
eria
l att
rib
ute
s b
y fo
rest
-typ
e g
rou
p, s
ize
clas
s, a
nd
dec
ay c
lass
, Ken
tuck
y
Siz
e cl
ass a
(inc
hes)
Dec
ay c
lass
b
For
est-
type
gro
up
or n
onst
ocke
dS
ampl
e si
zeF
ine
woo
dy
debr
is c
arbo
nC
oars
e w
oody
de
bris
car
bon
Coa
rse
woo
dy
debr
is3.
0– 7.9
8.0–
12
.913
.0–
17.9
18.0
and
la
rger
12
34
5
num
ber
- -
- -
- -
- -
mg
/ha
- -
- -
- -
- -
ft 3/a
c-
- -
- -
- -
- -
- -
- -
- -
- -
- -
- p
iece
s p
er a
cre
- -
- -
- -
- -
- -
- -
- -
- -
- -
- -
Lobl
olly
-sho
rtle
af2
8.98
2.23
252.
0651
.36
3.03
2.02
——
—47
.32
9.08
—O
ak-p
ine
62.
873.
0627
2.31
70.3
68.
82—
—4.
1137
.40
33.9
72.
671.
04O
ak-h
icko
ry59
4.32
2.47
230.
0269
.94
10.1
70.
80—
1.76
24.1
246
.84
8.08
0.12
Elm
-ash
-cot
tonw
ood
73.
871.
4815
5.78
55.2
110
.36
——
——
62.4
53.
12—
Map
le-b
eech
-birc
h1
2.36
0.96
113.
653.
466.
91—
——
—10
.37
——
Non
stoc
ked
17.
810.
9087
.12
162.
33—
——
——
162.
33—
—
— =
no
sam
ple
for
the
cell.
a D
iam
eter
s co
llect
ed a
t tra
nsec
t cro
ssin
g.b
1 =
sou
nd, f
resh
ly fa
llen,
inta
ct lo
gs; 2
= s
ound
; 3 =
hea
rtw
ood
soun
d; p
iece
sup
port
s its
ow
n w
eigh
t; 4
= h
eart
woo
d ro
tten;
pie
ce d
oes
not s
uppo
rt it
s ow
n w
eigh
t, bu
t m
aint
ains
its
shap
e; 5
= n
one,
pie
ce n
o lo
nger
mai
ntai
ns it
s sh
ape,
it s
prea
ds o
ut o
n gr
ound
.
Appendix D—Supplemental Tables

98
Table A.36—Down woody material attributes by forest-type group and fuel type, Kentucky
Forest-type group or nonstocked Samples
Fuel type
1-hr 10-hr 100-hr 1,000-hr Duff LitterAll
fuels
number - - - - - - - - - - - - - - - - tons per acre - - - - - - - - - - - - - - - -
Loblolly-shortleaf 2 0.11 1.55 6.27 1.97 7.84 4.23 21.96Oak-pine 6 0.16 0.98 1.39 2.70 6.34 1.02 12.58Oak-hickory 59 0.12 0.83 2.85 2.18 5.47 1.96 13.41Elm-ash-cottonwood 7 0.15 0.63 2.64 1.30 2.38 0.53 7.62Maple-beech-birch 1 0.17 0.36 1.55 0.84 11.47 3.32 17.71Nonstocked 1 0.14 2.71 4.05 0.79 3.76 1.97 13.42
All estimates are tons per acre unless otherwise indicated.
Table A.37—Soil physical properties averaged by soil layer and reporting unit, Kentucky
Soil layer Reporting unit SamplesMoisture content
Coarse fragments
Bulk density
number ovendry weight
percent g/cm3
Mineral soil Eastern 8 213.69 25.86 1.21(0 to 10 cm) Northern Cumberland 9 202.80 22.95 1.12
Southern Cumberland 19 187.76 16.60 1.07Bluegrass 12 202.88 11.50 1.12Pennyroyal 13 206.29 10.03 1.14Western Coalfield 8 209.78 9.17 1.16Western 7 201.33 9.86 1.12
All units 76 201.40 15.00 1.12
Mineral soil Eastern 8 254.68 25.16 1.38(10 to 20 cm) Northern Cumberland 9 268.80 20.75 1.49
Southern Cumberland 19 269.24 14.87 1.50Bluegrass 12 254.26 9.77 1.41Pennyroyal 13 263.07 19.31 1.45Western Coalfield 8 261.45 14.36 1.45Western 7 271.23 12.71 1.50
All units 76 263.60 16.35 1.46
Appendix D—Supplemental Tables

99
Tab
le A
.38—
So
il ch
emic
al p
rop
erti
es a
vera
ged
by
soil
laye
r an
d r
epo
rtin
g u
nit
, Ken
tuck
y
Soi
l lay
erR
epor
ting
unit
Sam
ples
pHO
rgan
ic
carb
onIn
orga
nic
carb
onT
otal
ni
trog
enE
xtra
ctab
le
phos
phor
us
Ext
ract
able
cat
ions
H20
CaC
l 2N
aK
Mg
Ca
Al
EC
EC
num
ber
- -
- -
- -
- p
erce
nt -
- -
- -
- -
m
g/k
g-
- -
- -
- -
- -
- -
- -
- cm
olc/
kg -
- -
- -
- -
- -
- -
- -
-
Min
eral
soi
lE
aste
rn8
5.35
4.99
2.61
0.00
0.20
4.93
2.50
150.
8118
3.71
931.
9176
.66
7.41
(0 to
10
cm)
Nor
ther
n C
umbe
rland
95.
294.
842.
500.
010.
174.
875.
1495
.95
99.6
611
32.5
112
3.77
8.12
Sou
ther
n C
umbe
rland
195.
064.
502.
810.
010.
174.
344.
3411
3.85
165.
3268
4.60
147.
446.
73B
lueg
rass
126.
075.
513.
350.
000.
2411
.92
7.36
155.
3032
4.75
2891
.86
104.
6918
.69
Pen
nyro
yal
135.
004.
292.
810.
010.
1610
.28
5.01
97.1
913
7.11
1221
.24
129.
058.
93W
este
rn C
oalfi
eld
85.
154.
641.
900.
010.
145.
685.
7984
.14
120.
2472
6.78
50.4
65.
42W
este
rn7
4.99
4.45
1.75
0.00
0.11
8.09
12.7
768
.29
103.
7645
6.88
120.
084.
70
A
ll un
its76
5.27
4.74
2.64
0.01
0.17
7.03
5.76
111.
9916
9.41
1187
.45
114.
568.
90
Min
eral
soi
lE
aste
rn8
5.23
4.81
1.71
0.00
0.11
3.19
2.50
87.8
112
1.66
549.
2592
.78
5.01
(10
to 2
0 cm
)N
orth
ern
Cum
berla
nd9
5.30
4.74
0.89
0.00
0.05
2.31
5.30
67.3
857
.09
886.
3613
6.11
6.60
Sou
ther
n C
umbe
rland
194.
984.
441.
150.
000.
092.
733.
1068
.66
83.3
824
9.08
141.
513.
69B
lueg
rass
126.
085.
661.
170.
050.
085.
958.
1210
4.37
304.
5424
82.3
415
5.47
16.9
2P
enny
roya
l13
5.04
4.44
1.09
0.01
0.14
6.67
5.94
74.5
610
4.06
870.
0017
5.27
7.36
Wes
tern
Coa
lfiel
d8
4.85
4.28
0.71
0.01
0.05
2.00
6.80
54.3
381
.60
169.
3312
5.76
3.08
Wes
tern
74.
854.
280.
630.
000.
055.
8712
.94
53.8
614
1.46
233.
1223
3.43
5.12
A
ll un
its76
5.20
4.68
1.08
0.01
0.09
4.02
5.86
74.5
712
8.53
813.
5815
0.86
7.01
EC
EC
= e
xtra
ctab
le c
atio
n ex
chan
ge c
apac
ity.
Appendix D—Supplemental Tables

100
Table A.39—Mean crown density and other statistics a for all live trees > 4.9 inches d.b.h. by species, Kentucky, 2000 to 2002
Species Plots Trees Mean SE b Minimum Median Maximum
- - number - - - - - - - - - - percent - - - - - - - -
Softwoods Eastern redcedar 8 59 54 4 5 60 80 Shortleaf pine 1 1 10 — 10 10 10 Loblolly pine 1 1 60 — 60 60 60 Virginia pine 7 18 43 — 30 40 70 Other softwoods 3 6 47 — 30 48 65
All softwoods 18 85 50 3 5 50 80
Hardwoods White oaks 50 235 42 1 20 40 65 Red oaks 41 120 40 1 10 40 65 Maple 51 247 42 1 15 40 75 Yellow-poplar 28 86 42 1 10 40 60 Blackgum 26 42 41 1 25 40 60 Hickory 43 133 43 1 20 40 65 Ash 26 53 41 2 20 40 65 Elm 17 26 40 2 20 40 65 Other hardwoods 62 282 41 1 10 40 70
All hardwoods 72 1,224 42 0 10 40 75
All trees 72 1,309 42 1 5 40 80
SE = standard error; — = no sample for the cell; 0.0 = a value of > 0.0 but < 0.05 for the cell.a The mean, SE, and median calculations consider the clustering of trees on plots.b SEs are not presented for species groups with n trees < 20.
Appendix D—Supplemental Tables
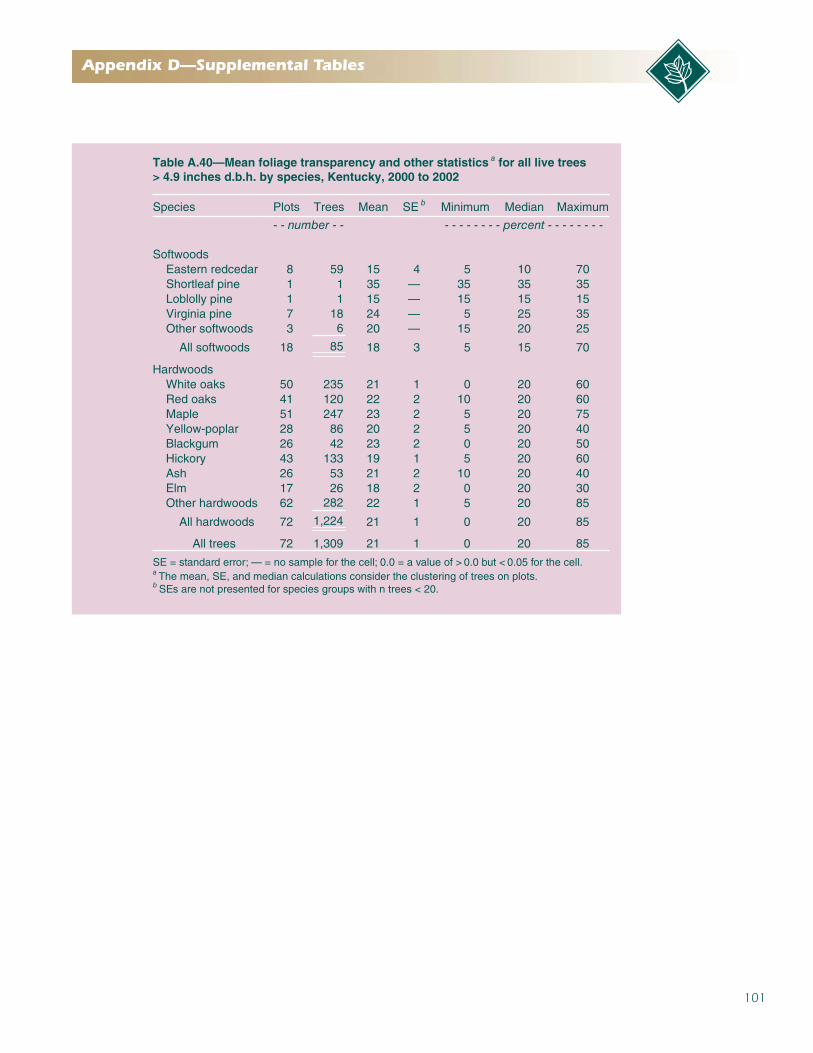
101
Table A.40—Mean foliage transparency and other statistics a for all live trees > 4.9 inches d.b.h. by species, Kentucky, 2000 to 2002
Species Plots Trees Mean SE b Minimum Median Maximum
- - number - - - - - - - - - - percent - - - - - - - -
Softwoods Eastern redcedar 8 59 15 4 5 10 70 Shortleaf pine 1 1 35 — 35 35 35 Loblolly pine 1 1 15 — 15 15 15 Virginia pine 7 18 24 — 5 25 35 Other softwoods 3 6 20 — 15 20 25
All softwoods 18 85 18 3 5 15 70
Hardwoods White oaks 50 235 21 1 0 20 60 Red oaks 41 120 22 2 10 20 60 Maple 51 247 23 2 5 20 75 Yellow-poplar 28 86 20 2 5 20 40 Blackgum 26 42 23 2 0 20 50 Hickory 43 133 19 1 5 20 60 Ash 26 53 21 2 10 20 40 Elm 17 26 18 2 0 20 30 Other hardwoods 62 282 22 1 5 20 85
All hardwoods 72 1,224 21 1 0 20 85
All trees 72 1,309 21 1 0 20 85
SE = standard error; — = no sample for the cell; 0.0 = a value of > 0.0 but < 0.05 for the cell.a The mean, SE, and median calculations consider the clustering of trees on plots.b SEs are not presented for species groups with n trees < 20.
Appendix D—Supplemental Tables

102
The Forest Service, U.S. Department of Agriculture (USDA), is dedicated to the principle of multiple use management of the Nation’s forest resources for sustained yields of wood, water, forage, wildlife, and recreation. Through forestry research, cooperation with the States and private forest owners, and management of the National Forests and National Grasslands, it strives—as directed by Congress—to provide increasingly greater service to a growing Nation.
The USDA prohibits discrimination in all its programs and activities on the basis of race, color, national origin, age, disability, and where applicable, sex, marital status, familial status, parental status, religion, sexual orientation, genetic information, political beliefs, reprisal, or because all or part of an individual’s income is derived from any public assistance program. (Not all prohibited bases apply to all programs.) Persons with disabilities who require alternative means for communication of program information (Braille, large print, audiotape, etc.) should contact USDA’s TARGET Center at (202) 720-2600 (voice and TDD).
To file a complaint of discrimination, write to USDA, Director, Office of Civil Rights, 1400 Independence Avenue, SW, Washington, DC 20250–9410 or call (800) 795-3272 (voice) or (202) 720-6382 (TDD). USDA is an equal opportunity provider and employer.
January 2008
Southern Research Station200 W.T. Weaver Blvd.Asheville, NC 28804
Turner, Jeffery A.; Oswalt, Christopher M.; Chamberlain, James L. [and others]. 2008. Kentucky’s Forests, 2004. Resour. Bull. SRS–129. Asheville, NC: U.S. Department of Agriculture Forest Service, Southern Research Station. 101 p.
Forest land area in the Commonwealth of Kentucky amounted to 11.97 million acres, including 11.6 million acres of timberland. Over 110 different species, mostly hardwoods, account for an estimated 21.2 billion cubic feet of all live tree volume. Hardwood forest types occupy 85 percent of Kentucky’s timberland, and oak-hickory is the dominant forest-type group accounting for about 8.4 million acres. About 78 percent of timberland in Kentucky is owned by nonindustrial private forest land owners. Forest industry owns about 2 percent of the timberland in the Commonwealth, while Federal, State, and local government agencies manage about 11 percent or 1.03 million acres. In 2003 more than 21,500 individuals were directly employed at wood-processing mills with a total annual payroll of over 700 million dollars. Many nontimber forest products are harvested in Kentucky, which ranks second in the Southern region in terms of the number of nontimber forest product enterprises.
Keywords: Annual inventory, FIA, forest health indicators, forest ownership, nontimber forest products, timber product output.

103
Commonwealth of Kentucky State Facts
Capital City: Frankfort
Location: 38.19077 N, 084.86520 W
Population: 3,908,124; 24th - 7-97
Geology: Land Area: 39,674 sq. mi.; 37th
Highest Point: Black Mtn.; 4145 feet Inland Water: 740 sq. mi. Largest City: Louisville Lowest Point: Mississippi River; 257 feet
Border States: Illinois, Indiana, Missouri, Ohio, Tennessee, Virginia, West Virginia
Constitution: 15th State
Statehood: June 1, 1792
Bird: Cardinal—The pleasant melodies of this red-crested song bird are heard year round in Kentucky. The male boasts a vivid red plumage; the female is light brown with red highlights.
Industry: Transportation equipment, chemical products, electric equipment, machinery, food processing, tobacco products, coal, tourism.
Agriculture: Agriculture: horses, cattle, tobacco, dairy products, hogs, soybeans, corn.
Natural Resources: The numerous rivers and water impoundments provide 1,100 commercially navigable miles (1,770 km). Kentucky ranks third among hardwood producing States. The main species of trees are white oak, red oak, walnut, yellow poplar, beech, sugar maple, white ash and hickory. Principal minerals and by products produced in order of value are coal, crushed stone, natural gas and petroleum.
Flag: The State seal imprinted on a field of navy blue was approved by the General Assembly in 1928. The original flag is displayed in Frankfort at the Kentucky History Museum.
Tree: Sometimes called the tulip poplar, this tree is not a poplar at all, but a member of the magnolia family. It can grow to 145 feet and live for 200 years. It blossoms in May with yellow-green flowers resembling tulips.
Nickname: Bluegrass State—Bluegrass is not really blue—it’s green—but in the spring, bluegrass produces bluish-purple buds that when seen in large fields give a rich blue cast to the grass. Early pioneers found bluegrass growing on Kentucky’s rich limestone soil, and traders began asking for the seed of the “blue grass from Kentucky.” The name stuck and today Kentucky is known as the Bluegrass State.
Song: “My Old Kentucky Home” by Stephen Collins Foster—1853
The sun shines bright on my old Kentucky home, ‘Tis summer, the people are gay; The corn top’s ripe and the meadow’s in the bloom, While the birds make music all the day.
The young folks roll on the little cabin floor, All merry, all happy and bright; By ’n by hard times comes a-knockin’ at the door, Then my old Kentucky home, good-night!
Weep no more, my lady! Oh weep no more today. We will sing one song for my old Kentucky home, For my old Kentucky home, far away.
Flower: Goldenrod, Solidago altissima—The golden plumes of this wildflower line Kentucky’s roadsides in the fall. Native to all of Kentucky, 30 of nearly 100 species of this herb are found here.
Presidental Birthplace: Abraham Lincoln, 16th President of the United States (March 4, 1861 to April 15, 1865)Nicknames: “Honest Abe”; “Illinois rail-splitter” Born: February 12, 1809, in Hardin (now Larue) County,KYDied: April 15, 1865, at Petersen’s boarding house in Washington, DC.
Motto: United we stand, divided we fall.
Origin of Commonwealth: Commonwealth of Kentucky—Kentucky is one of four States to call itself a “commonwealth.” In 1792 when Kentucky became the 15th State—the first on the western frontier—both “commonwealth” and “State” were used. Commonwealth, meaning government based on the common consent of the people, dates to the time of Oliver Cromwell’s England in the mid-1600s. The other U.S. commonwealths, Massachusetts, Pennsylvania, and Virginia, were originally British colonies. Kentucky, once part of Virginia, chose to remain a commonwealth when it separated from Virginia.
Information courtesy of The World Factbook, www.cia.gov/library/publications/the-world-factbook; www.travel.ky.gov/about/facts/facts.
Commonwealth of Kentucky State Facts


United StatesDepartment of Agriculture
Forest Service
SouthernResearch Station
Resource BulletinSRS–129
Kentucky’s
Forests, 2004Jeffery A. Turner, Christopher M. Oswalt, James L. Chamberlain, Roger C. Conner,
Tony G. Johnson, Sonja N. Oswalt, and Kadonna C. Randolph
Ken
tucky’s Fo
rests, 20
04
Jan
uary 2
00
8