Kentucky Retirement Systems Studies/KRS... · We wish to thank the KRS staff for their assistance...
103
Kentucky Retirement Systems 2018 Actuarial Experience Study for the Period Ending June 30, 2018
Transcript of Kentucky Retirement Systems Studies/KRS... · We wish to thank the KRS staff for their assistance...
Kentucky Retirement Systems 2018 Actuarial Experience Study for the Period Ending June 30, 2018
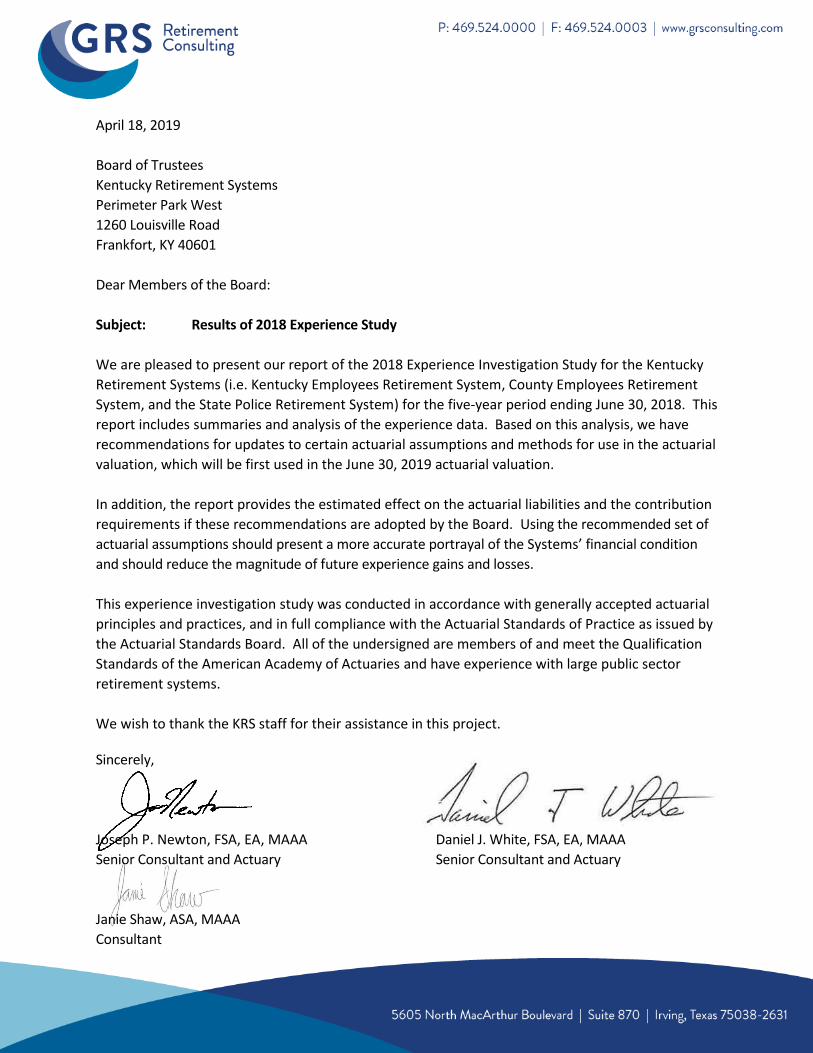
April 18, 2019
Board of Trustees
Kentucky Retirement Systems
Perimeter Park West
1260 Louisville Road
Frankfort, KY 40601
Dear Members of the Board:
Subject: Results of 2018 Experience Study
We are pleased to present our report of the 2018 Experience Investigation Study for the Kentucky
Retirement Systems (i.e. Kentucky Employees Retirement System, County Employees Retirement
System, and the State Police Retirement System) for the five-year period ending June 30, 2018. This
report includes summaries and analysis of the experience data. Based on this analysis, we have
recommendations for updates to certain actuarial assumptions and methods for use in the actuarial
valuation, which will be first used in the June 30, 2019 actuarial valuation.
In addition, the report provides the estimated effect on the actuarial liabilities and the contribution
requirements if these recommendations are adopted by the Board. Using the recommended set of
actuarial assumptions should present a more accurate portrayal of the Systems’ financial condition
and should reduce the magnitude of future experience gains and losses.
This experience investigation study was conducted in accordance with generally accepted actuarial
principles and practices, and in full compliance with the Actuarial Standards of Practice as issued by
the Actuarial Standards Board. All of the undersigned are members of and meet the Qualification
Standards of the American Academy of Actuaries and have experience with large public sector
retirement systems.
We wish to thank the KRS staff for their assistance in this project.
Sincerely,
Joseph P. Newton, FSA, EA, MAAA Daniel J. White, FSA, EA, MAAA
Senior Consultant and Actuary Senior Consultant and Actuary
Janie Shaw, ASA, MAAA
Consultant
Kentucky Retirement Systems
Table of Contents
Page
Cover Letter
Summary of Process
Section I Introduction .................................................................................................................. 1
Section II Summary of Recommendations and Fiscal Impacts ..................................................... 4
Section III Analysis of Experience and Recommendations ............................................................ 9
Section IV Actuarial Impact of Recommendations ......................................................................... 35
Section V Summary of New Assumptions (KERS) ........................................................................... 40
Section VI Summary of New Assumptions (CERS) .......................................................................... 51
Section VII Summary of New Assumptions (SPRS) ........................................................................... 62
Section VIII Summary of Data and Experience .................................................................................. 73
Kentucky Retirement Systems
Summary of Process
A periodic review and selection of the actuarial assumptions is one of many important components of understanding and managing the financial aspects of the Kentucky Retirement Systems. Use of outdated or inappropriate assumptions can result in understated costs which will lead to higher future contribution requirements or perhaps an inability to pay benefits when due. Also, a single set of assumptions is typically not expected to be suitable forever. As the actual experience of the plan changes, the assumptions should be reviewed and adjusted accordingly. It is important to recognize that the impact from various outcomes and the ability to adjust from experience deviating from the assumption are not symmetric. Due to compounding economic forces, legal limitations, and moral obligations, outcomes from underestimating future liabilities are much more difficult to manage than outcomes of overestimates, and that un-symmetric risk should be considered when the assumption set, investment policy, and funding policy are created. As such, the assumption set used in the valuation process needs to represent the best estimate of the future experience of the System and be at least as likely, if not more than likely, to overestimate the future liabilities versus underestimate them. Changes in certain assumptions and methods are suggested upon this comparison to remove any bias that may exist, except to perhaps include some margin for future adverse experience where appropriate. Next, the assumption set as a whole was analyzed for consistency and to ensure that the projection of liabilities was reasonable and consistent. The following report provides our recommended changes to the current actuarial assumptions.

0
SECTION I
INTRODUCTION
Kentucky Retirement Systems
Section I - Introduction
1
Introduction
In determining liabilities, contribution rates and funding periods for retirement plans, actuaries must make assumptions about the future. Among the assumptions that must be made are:
Investment return rate
Salary increase rates
Inflation rate
Mortality rates
Retirement rates
Termination rates
Disability rates For some of these assumptions, such as the mortality rates, past experience provides important evidence about the future. For other assumptions, such as the investment return rate, the link between past and future results is much weaker. In either case, though, actuaries should review their assumptions periodically and determine whether these assumptions are consistent with actual past experience and with anticipated future experience. In conducting experience studies, actuaries generally use data over a period of several years. This is necessary in order to gather enough data so that the results are statistically significant. In addition, if the study period is too short, the impact of the current economic conditions may lead to misleading results. It is known, for example, that the health of the general economy can impact salary increase rates and termination rates. Using results gathered during a short-term boom or bust will not be representative of the long-term trends in these assumptions. Also, the adoption of legislation, plan improvements or changes in salary schedules will sometimes cause a short-term distortion in the experience. For example, if an early retirement window was opened during the study period, we would usually see a short-term spike in the number of retirements. Using a longer period prevents giving too much weight to such short-term effects. On the other hand, using a much longer period increases the difficulty of identifying changes in behavior that may be occurring, such as mortality improvement or a change in the ages at which members retire. In our view, using a five-year period ending June 30, 2018 is generally reasonable. In the review of the demographic assumptions, we first determine the number of deaths, retirements, etc. that occurred during the period. Then we determine the number expected to occur, based on the current actuarial assumptions. The number “expected” is determined by multiplying the probability of the occurrence at the given age, by the “exposures” at that same age. For example, let’s assume there is a rate of retirement of 15% at age 55. The number of exposures can only be those members who are age 55 and eligible for retirement at that time. Thus they are considered “exposed” to that assumption. Finally, we calculate the A/E ratio, where "A" is the actual number (of retirements, for example) and "E" is the expected number. If the current assumptions were "perfect", the A/E ratio would be 100%. When it varies significantly from this figure, it is a sign that a new assumption may be needed. (However, in some cases we prefer to set our assumptions to produce an A/E ratio a little above or below 100%, in order to introduce some conservatism.) Of course we not only look at the assumptions as a whole, but we also review how well they fit the actual results by gender, by age, and by service.
Kentucky Retirement Systems
Section I - Introduction
2
In some instances we will compare the actual and expected experience based on headcount. However, there are other instances it is more appropriate to “weigh” the experience by benefit amount, liability, or salary, with the intention that our review and recommendations provide a better fit to the actual experience on a benefit basis which should result in smaller liability gains and losses prospectively. Finally, if the data leads the actuary to conclude that new tables are needed, we will take into consideration the statistical credibility of the assumption as well as "graduate" or smooth the recommended assumption in instances where the experience has material variation age to age or from service year to service year. Please bear in mind that, while the recommended assumption set represents our best estimate, there are other reasonable assumption sets that could be supported. Some reasonable assumption sets would show higher or lower liabilities or costs.
O R G A N I Z A T I O N O F R E P O R T Section II of this report summarizes our recommended changes and the fiscal impact if those assumptions are adopted. Section III contains our findings and a more detailed analysis of our recommendation for each actuarial assumption. The fiscal impact of adopting our recommendations on liabilities and contribution rates is shown in Section IV. Sections V through VII show a summary of the recommended assumptions for each System. Finally, Section VIII presents detailed summaries of the data and comparisons of the A/E ratios.
S E C T I O N V I I I E X H I B I T S The exhibits in Section VIII should generally be self-explanatory. For example, on page 83, we show the exhibit analyzing the service-based termination rates. The second column shows the total number of members who terminated during the study period. This excludes members who became disabled or retired. Column (3) shows the total exposures. This is the number of members who could have terminated during any of the years. In this exhibit, the exposures exclude anyone eligible for retirement. A member is counted in each year they could have terminated, so the total shown is the total exposures for the study period. Column (4) shows the probability of termination based on the raw data. That is, it is the result of dividing the actual number of terminations (col. 2) by the number exposed (col. 3). Column (5) shows the current termination rate and column (6) shows the new recommended termination rate. Columns (7) and (8) show the expected numbers of terminations based on the current and proposed termination assumptions. Columns (9) and (10) show the Actual-to-Expected ratios under the current and proposed termination assumptions.

SECTION II
SUMMARY OF RECOMMENDATIONS AND FISCAL IMPACTS
Kentucky Retirement Systems
Section II – Summary of Recommendations
4
Summary of Recommendations KRS
Our recommendations to the actuarial assumptions used the actuarial valuation for KRS may be summarized
as follows:
Economic Assumptions
1. Inflation Assumption: Recommend continued use of a 2.30% price inflation assumption.
2. Investment Return Assumption: Recommend continued use of a 5.25% investment return assumption
for the KERS Non-Hazardous Retirement System and the State Police Retirement System. The current
6.25% investment return assumption for the CERS Retirement Systems (Non-Hazardous and Hazardous),
KERS Hazardous Retirement System, and for all five health insurance plans remains reasonable.
However, it would also be reasonable if the Board wanted to decrease the assumed rate of return from
6.25% to 6.00% for these systems.
3. Salary Increases for Individual Members: Recommend an overall increase to the salary increase
assumption applicable to individual members and increasing the consistency in the assumptions for
various groups. The recommended changes include an increase to some of the step-rate and
promotional component of the salary increase assumption for shorter service employees as well as a
recommended increase to the salary increase assumption for the CERS Hazardous and State Police
Retirement System for those members with more than 10 years of service. However, we are also
recommending a slight decrease to the rate of salary increase for long-service active members in the
KERS Non-Hazardous System.
4. Payroll growth rate (used for amortizing the UAAL): Recommend no immediate change to the 0%
payroll growth rate assumption for both KERS Systems (Non-Hazardous and Hazardous) and the State
Police Retirement System. We also recommend no immediate change the current 2.0% payroll growth
assumption for both CERS Systems (Non-Hazardous and Hazardous).
Rather, we recommend that legislation be enacted to change the employers’ method of making
contributions to the System such that the dollar amount of the System’s amortization cost be allocated
to the participating employers based a fixed percentage of the total amortization cost and the
employers only contribute the normal cost rate on covered payroll. If legislation is not enacted to
redefine how the System collects contributions from the participating employers, then we recommend
the Board monitor the emerging change in active membership count and change in covered payroll to
identify if a reduction in the payroll growth assumption for any System is warranted.
Kentucky Retirement Systems
Section II – Summary of Recommendations
5
Demographic Assumptions:
5. Mortality: Recommend replacing the base retiree mortality tables with a Kentucky Retirement
Systems-specific mortality table developed using the actual mortality experience of non-disabled
retirees in KERS, CERS, and SPRS. We also recommend replacing the current mortality tables for
disabled retirees and active members with a variation of the Public Retirement Mortality Tables (PUB-
2010 Tables) recently released by the Society of Actuaries. Finally, we also recommend using a
generational mortality improvement assumption based on the ultimate rates of the published MP
improvement scales (“MP-Ultimate”) to explicitly project future improvement in life expectancy.
6. Retirement: For members with a participation date prior to July 1, 2003, we are recommending an
overall slight decrease in the rates of retirement for the KERS and CERS Systems. For members with a
participation date on or after July 1, 2003, we recommend using retirement rates that are equal to
80% of the retirement rates applicable for the pre July 1, 2003 participants for ages below age 65. We
are also recommending a decrease to the retirement rates for members in SPRS whose participation
date is on or after July 1, 2003.
7. Termination/Withdrawal: We recommend increasing the termination rates for both KERS Systems
(Non-Hazardous and Hazardous) as well as the CERS Non-Hazardous System, and decreasing the
termination rates for CERS Hazardous and SPRS Systems.
8. Disability Incidence: Recommend increasing the rates of disability incidence for the KERS and CERS
Systems (Non-Hazardous and Hazardous), and no change to the disability incidence assumption for
SPRS.
9. Participation in the Retiree Health Insurance Plan: We recommend no change the current assumption
regarding participation in the retiree health insurance plan.
Actuarial Methods and Policies
10. Asset Valuation Method: Recommend continued use of the five-year asset smoothing method with each
year’s investment losses based on the expected and actual investment earning determined on a market
value of asset basis. However, for the purpose of increased transparency and comparability we
recommend a modification to the presentation of the smoothing calculations in the report to be consistent
with the format that is commonly used by other Systems. This modification will not have a cost impact.
11. Actuarial Cost Method: Continued use of the individual Entry Age Normal cost method (EAN) used to
determine the actuarial accrued liability.
Kentucky Retirement Systems
Section II – Summary of Recommendations
6
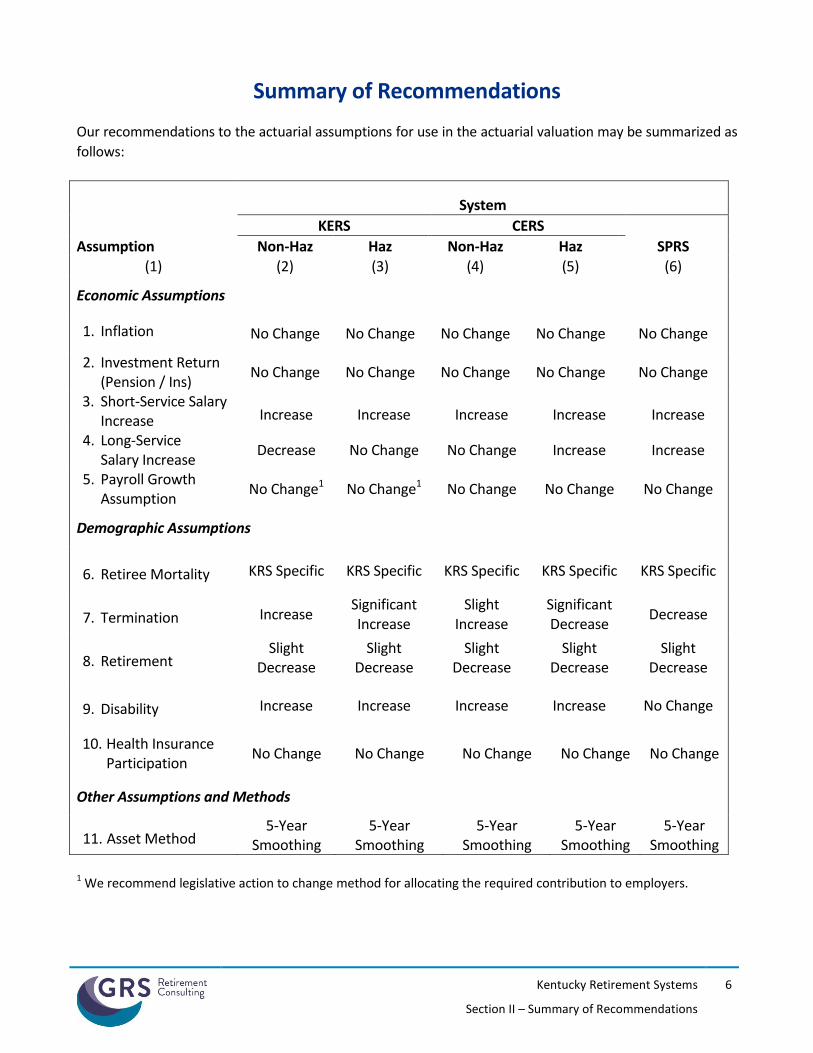
Summary of Recommendations
Our recommendations to the actuarial assumptions for use in the actuarial valuation may be summarized as
follows:
System
KERS CERS
Assumption Non-Haz Haz Non-Haz Haz SPRS (1) (2) (3) (4) (5) (6)
Economic Assumptions
1. Inflation No Change No Change No Change No Change No Change
2. Investment Return (Pension / Ins)
No Change No Change No Change No Change No Change
3. Short-Service Salary Increase Increase Increase Increase Increase Increase
4. Long-Service Salary Increase
Decrease No Change No Change Increase Increase
5. Payroll Growth Assumption
No Change1 No Change1 No Change No Change No Change
Demographic Assumptions
6. Retiree Mortality KRS Specific KRS Specific KRS Specific KRS Specific KRS Specific
7. Termination Increase Significant Increase
Slight Increase
Significant Decrease
Decrease
8. Retirement Slight
Decrease Slight
Decrease Slight
Decrease Slight
Decrease Slight
Decrease
9. Disability Increase Increase Increase Increase No Change
10. Health Insurance Participation
No Change No Change No Change No Change No Change
Other Assumptions and Methods
11. Asset Method 5-Year
Smoothing 5-Year
Smoothing 5-Year
Smoothing 5-Year
Smoothing 5-Year
Smoothing
1 We recommend legislative action to change method for allocating the required contribution to employers.
Kentucky Retirement Systems
Section II – Summary of Recommendations
7
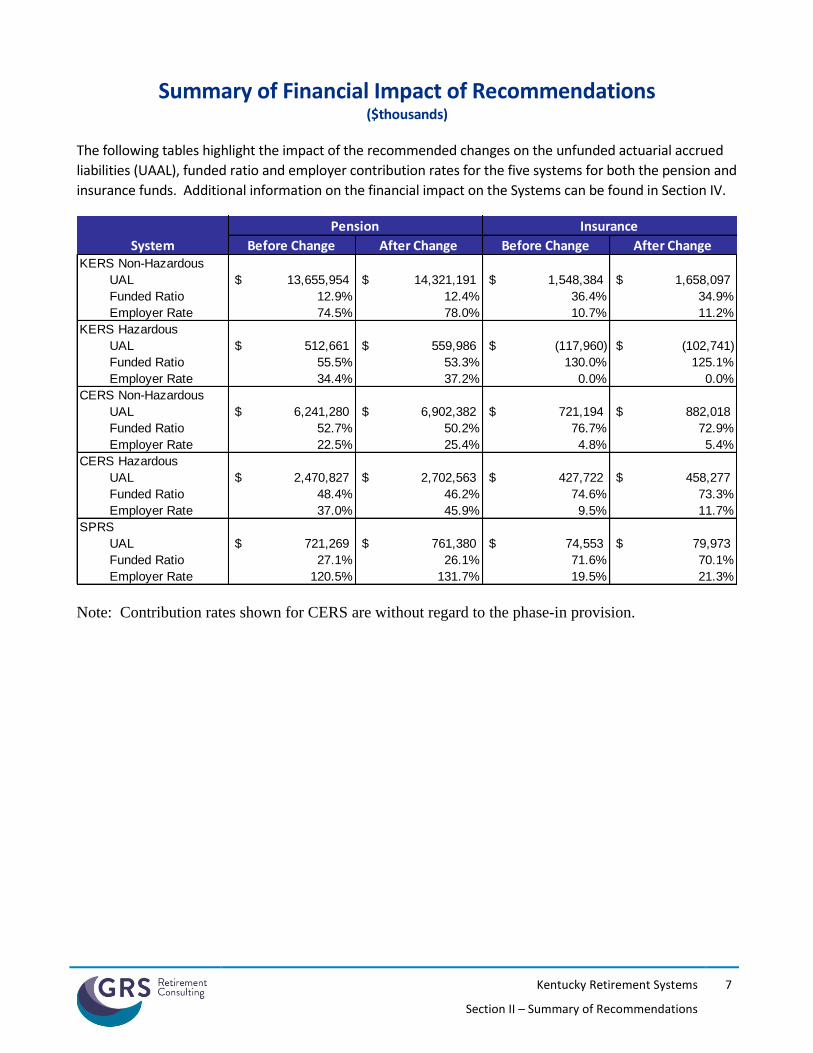
Summary of Financial Impact of Recommendations ($thousands)
The following tables highlight the impact of the recommended changes on the unfunded actuarial accrued
liabilities (UAAL), funded ratio and employer contribution rates for the five systems for both the pension and
insurance funds. Additional information on the financial impact on the Systems can be found in Section IV.
Note: Contribution rates shown for CERS are without regard to the phase-in provision.
Before Change After Change Before Change After ChangeKERS Non-Hazardous
UAL 13,655,954$ 14,321,191$ 1,548,384$ 1,658,097$
Funded Ratio 12.9% 12.4% 36.4% 34.9%
Employer Rate 74.5% 78.0% 10.7% 11.2%
KERS Hazardous
UAL 512,661$ 559,986$ (117,960)$ (102,741)$
Funded Ratio 55.5% 53.3% 130.0% 125.1%
Employer Rate 34.4% 37.2% 0.0% 0.0%
CERS Non-Hazardous
UAL 6,241,280$ 6,902,382$ 721,194$ 882,018$
Funded Ratio 52.7% 50.2% 76.7% 72.9%
Employer Rate 22.5% 25.4% 4.8% 5.4%
CERS Hazardous
UAL 2,470,827$ 2,702,563$ 427,722$ 458,277$
Funded Ratio 48.4% 46.2% 74.6% 73.3%
Employer Rate 37.0% 45.9% 9.5% 11.7%
SPRS
UAL 721,269$ 761,380$ 74,553$ 79,973$
Funded Ratio 27.1% 26.1% 71.6% 70.1%
Employer Rate 120.5% 131.7% 19.5% 21.3%
System
Pension Insurance
SECTION III
ANALYSIS OF EXPERIENCE AND RECOMMENDATIONS
Kentucky Retirement Systems
Section III – Analysis of Experience and Recommendations
9
Analysis of Experience and Recommendations
We will begin by discussing the economic assumptions: inflation, expenses, the investment return rate, the
salary increase assumption, and the rate of payroll growth. Next are the demographic assumptions:
mortality, disability, termination and retirement. Finally, we will discuss all of the actuarial methods used.
E C O N O M I C A S S U M P T I O N S
As no one knows what the future holds, the best an actuary can do is to use professional judgment to
estimate possible future economic outcomes. These estimates are based on a mixture of past experience,
future expectations, and professional judgment. The economic assumptions are much more subjective in
nature than the demographic assumptions. The actuary should consider a number of factors, including the
purpose and nature of the measurement, and appropriate historical and forward looking information.
Also, actuaries are guided by the Actuarial Standards of Practice (ASOP) adopted by the Actuarial Standards Board (ASB) and one of these standards is ASOP No. 27, Selection of Economic Assumptions for Measuring Pension Obligations, which provides guidance to actuaries giving advice on selecting economic assumptions for measuring obligations under defined benefit plans.
Each economic assumption should individually satisfy this standard. Furthermore, with respect to any
particular valuation, each economic assumption should be consistent with every other economic
assumption over the measurement period. Nevertheless, the economic assumptions are much more
subjective in nature than the demographic assumptions, which in itself can still create a difference in
opinion among individuals in the actuarial profession and possibly stakeholders of the Retirement Systems.
I N F L A T I O N A S S U M P T I O N
By “inflation,” we mean price inflation as measured by annual increases in the Consumer Price Index (CPI).
This inflation assumption underlies most of the other economic assumptions. It impacts investment return,
salary increases, and the rate of payroll growth for amortizing the unfunded actuarial accrued liability. The
current annual inflation assumption is 2.30%.
Kentucky Retirement Systems
Section III – Analysis of Experience and Recommendations
10
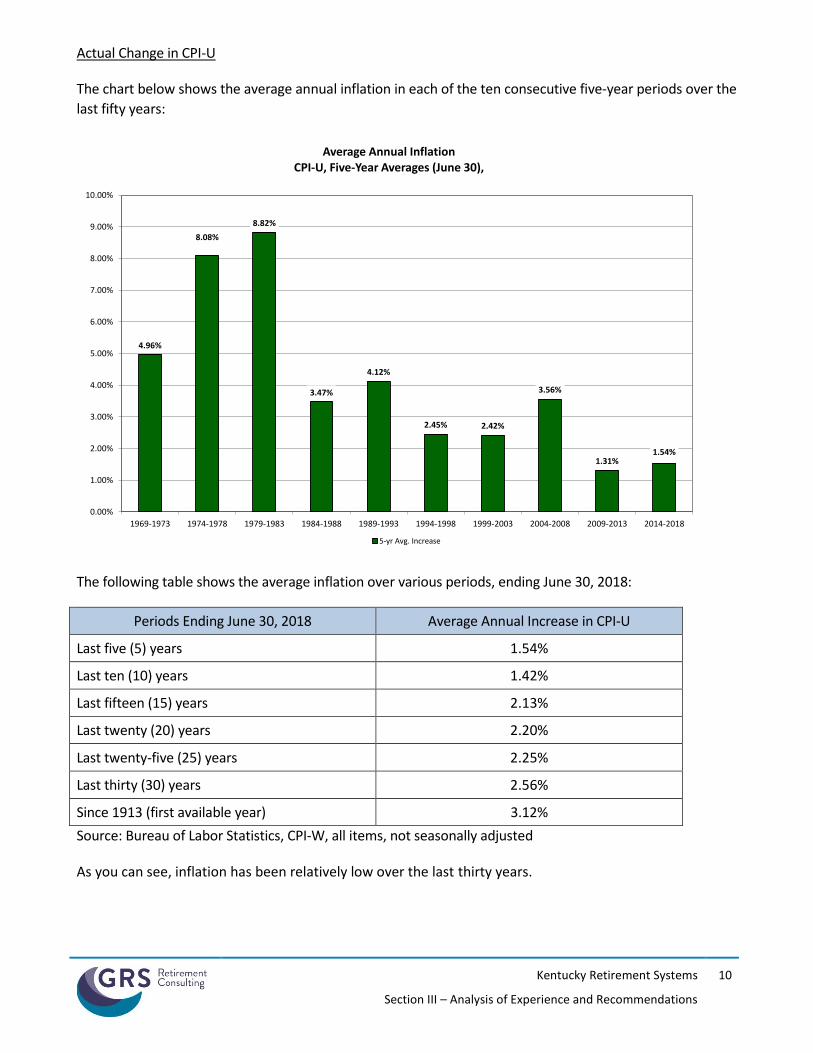
Actual Change in CPI-U
The chart below shows the average annual inflation in each of the ten consecutive five-year periods over the
last fifty years:
The following table shows the average inflation over various periods, ending June 30, 2018:
Periods Ending June 30, 2018 Average Annual Increase in CPI-U
Last five (5) years 1.54%
Last ten (10) years 1.42%
Last fifteen (15) years 2.13%
Last twenty (20) years 2.20%
Last twenty-five (25) years 2.25%
Last thirty (30) years 2.56%
Since 1913 (first available year) 3.12%
Source: Bureau of Labor Statistics, CPI-W, all items, not seasonally adjusted
As you can see, inflation has been relatively low over the last thirty years.
4.96%
8.08%
8.82%
3.47%
4.12%
2.45% 2.42%
3.56%
1.31%1.54%
0.00%
1.00%
2.00%
3.00%
4.00%
5.00%
6.00%
7.00%
8.00%
9.00%
10.00%
1969-1973 1974-1978 1979-1983 1984-1988 1989-1993 1994-1998 1999-2003 2004-2008 2009-2013 2014-2018
Average Annual Inflation CPI-U, Five-Year Averages (June 30),
5-yr Avg. Increase
Kentucky Retirement Systems
Section III – Analysis of Experience and Recommendations
11
Forward-Looking Expectations Developed by Investment Consulting Firms
Most investment consulting firms, in setting their capital market assumptions, make a price inflation
assumption as a building block for developing forward-looking return expectations. Based on a 2018
survey of capital market assumptions of eleven investment consulting firms, the average expected price
inflation for the next ten years is 2.20%. Of those firms, three of them develop longer-term assumptions
(20 years or more) and have an average expected rate of inflation of 2.4%.
Expectations Implied in the Bond Market
Another source of information about future inflation is the market for US Treasury bonds. For example,
the June 30, 2018 yield for 20-year inflation indexed Treasury bonds was 0.84% plus actual inflation. The
yield for 20-year non-indexed US Treasury bonds was 2.61%. Simplistically, this means that on that day
the bond market was predicting that inflation over the next twenty years would average 1.76% [(1 +
2.61%) / (1 + 0.84%) - 1] per year. The difference in yield for 30-year bonds implies 1.83% inflation over
the next 30 years. This is consistent with most forecasts of inflation and overall economic growth being
lower over the next decade. However, this analysis is known to be imperfect as it ignores the inflation risk
premium that buyers of US Treasury bonds often demand as well as possible differences in liquidity
between US Treasury bonds and TIPS.
Forecasts from Social Security Administration
In the Social Security Administration’s 2018 Trustees Report, the Office of the Chief Actuary is projecting a
long-term average annual inflation rate of 2.6% under the intermediate cost assumption. The Chief Actuary
for the Social Security Administration kept this assumption unchanged from the prior year and the low
cost and high cost scenarios are 2.0% and 3.2%, respectively.
Survey of Professional Forecasters and Fed Policy
The Philadelphia Federal Reserve conducts a quarterly survey of the Society of Professional Forecasters.
Their forecast for the fourth quarter of 2018 was for inflation over the next ten years (2019 to 2028) to
average 2.21%. Additionally, the Fed has openly stated that they have a target 2.00% inflation rate.
Recommendation
Using these sources, we recommend continued use of a 2.30% assumption.
I N V E S T M E N T R E T U R N A S S U M P T I O N
The investment return assumption is one of the principal assumptions used in any actuarial valuation of a
retirement plan. It is used to discount future expected benefit payments to the valuation date in order to
determine the liabilities of the plans. Even a small change to this assumption can produce significant
changes to the liabilities and contribution rates.
Kentucky Retirement Systems
Section III – Analysis of Experience and Recommendations
12
KRS maintains five retirement and five health insurance plans. Due to differences in external liquidity
requirements of the systems, there are differences in how plan assets are invested. Furthermore, the
differences in the investment policies are material enough to warrant the use of different investment return
assumptions. Specifically, the current investment return assumption is 6.25% for the CERS retirement
system (non-hazardous and hazardous), KERS retirement hazardous system, and all five health insurance
plans. On the other hand, the investment return assumption for the KERS Non-Hazardous retirement
system and SPRS is 5.25%.
Investment and Administrative Expenses
The trust fund pays expenses in addition to member benefits and refunds; we must make some assumption
about these. Currently an explicit administrative expense assumption is included in the normal cost rate.
This assumption is updated on an annual basis and is equal to the prior year’s administrative expense
divided by covered payroll. We recommend no change to this process.
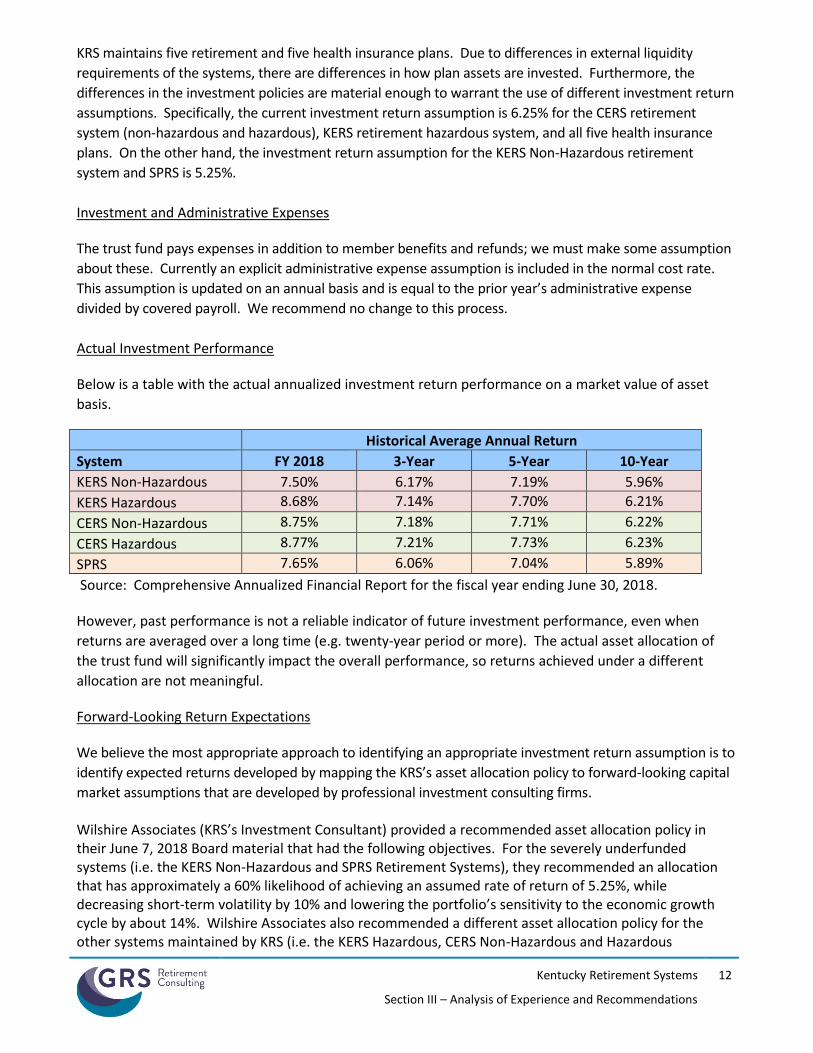
Actual Investment Performance
Below is a table with the actual annualized investment return performance on a market value of asset
basis.
Historical Average Annual Return
System FY 2018 3-Year 5-Year 10-Year
KERS Non-Hazardous 7.50% 6.17% 7.19% 5.96%
KERS Hazardous 8.68% 7.14% 7.70% 6.21%
CERS Non-Hazardous 8.75% 7.18% 7.71% 6.22%
CERS Hazardous 8.77% 7.21% 7.73% 6.23%
SPRS 7.65% 6.06% 7.04% 5.89%
Source: Comprehensive Annualized Financial Report for the fiscal year ending June 30, 2018.
However, past performance is not a reliable indicator of future investment performance, even when
returns are averaged over a long time (e.g. twenty-year period or more). The actual asset allocation of
the trust fund will significantly impact the overall performance, so returns achieved under a different
allocation are not meaningful.
Forward-Looking Return Expectations
We believe the most appropriate approach to identifying an appropriate investment return assumption is to
identify expected returns developed by mapping the KRS’s asset allocation policy to forward-looking capital
market assumptions that are developed by professional investment consulting firms. Wilshire Associates (KRS’s Investment Consultant) provided a recommended asset allocation policy in their June 7, 2018 Board material that had the following objectives. For the severely underfunded systems (i.e. the KERS Non-Hazardous and SPRS Retirement Systems), they recommended an allocation that has approximately a 60% likelihood of achieving an assumed rate of return of 5.25%, while decreasing short-term volatility by 10% and lowering the portfolio’s sensitivity to the economic growth cycle by about 14%. Wilshire Associates also recommended a different asset allocation policy for the other systems maintained by KRS (i.e. the KERS Hazardous, CERS Non-Hazardous and Hazardous
Kentucky Retirement Systems
Section III – Analysis of Experience and Recommendations
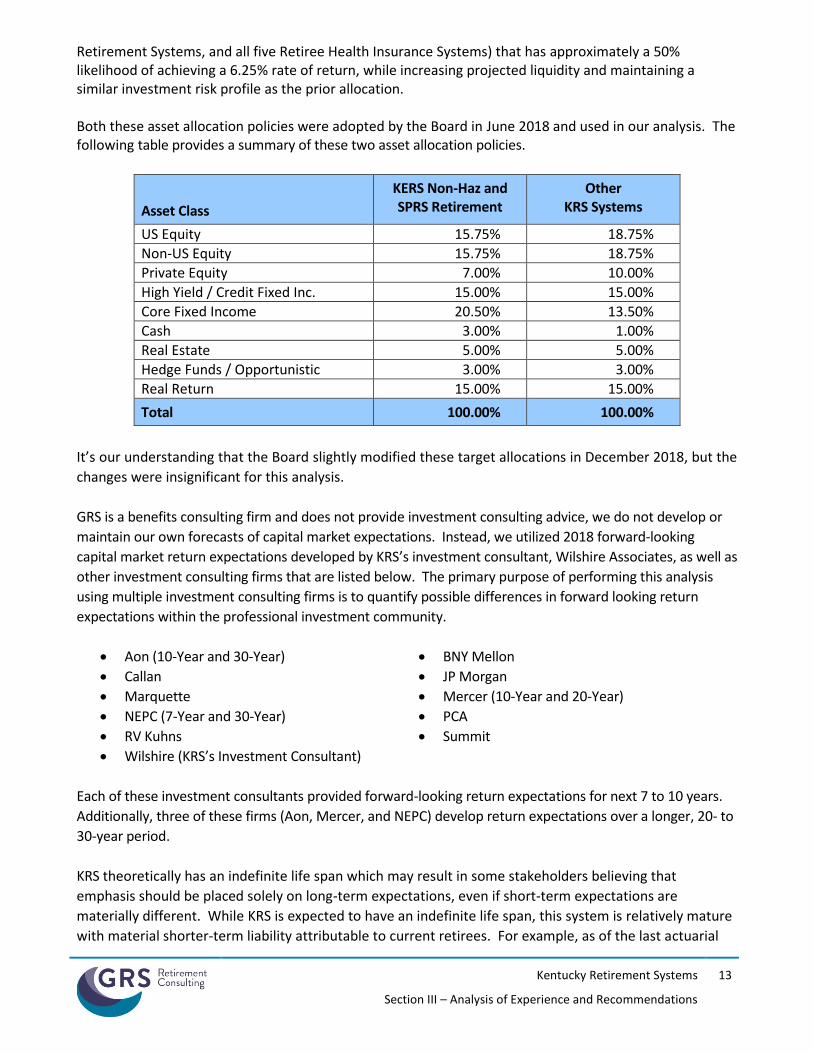
13
Retirement Systems, and all five Retiree Health Insurance Systems) that has approximately a 50% likelihood of achieving a 6.25% rate of return, while increasing projected liquidity and maintaining a similar investment risk profile as the prior allocation. Both these asset allocation policies were adopted by the Board in June 2018 and used in our analysis. The following table provides a summary of these two asset allocation policies.
Asset Class
KERS Non-Haz and SPRS Retirement
Other KRS Systems
US Equity 15.75% 18.75%
Non-US Equity 15.75% 18.75%
Private Equity 7.00% 10.00%
High Yield / Credit Fixed Inc. 15.00% 15.00%
Core Fixed Income 20.50% 13.50%
Cash 3.00% 1.00%
Real Estate 5.00% 5.00%
Hedge Funds / Opportunistic 3.00% 3.00%
Real Return 15.00% 15.00%
Total 100.00% 100.00%
It’s our understanding that the Board slightly modified these target allocations in December 2018, but the
changes were insignificant for this analysis.
GRS is a benefits consulting firm and does not provide investment consulting advice, we do not develop or
maintain our own forecasts of capital market expectations. Instead, we utilized 2018 forward-looking
capital market return expectations developed by KRS’s investment consultant, Wilshire Associates, as well as
other investment consulting firms that are listed below. The primary purpose of performing this analysis
using multiple investment consulting firms is to quantify possible differences in forward looking return
expectations within the professional investment community.
Aon (10-Year and 30-Year) BNY Mellon
Callan JP Morgan
Marquette Mercer (10-Year and 20-Year)
NEPC (7-Year and 30-Year) PCA
RV Kuhns Summit
Wilshire (KRS’s Investment Consultant)
Each of these investment consultants provided forward-looking return expectations for next 7 to 10 years.
Additionally, three of these firms (Aon, Mercer, and NEPC) develop return expectations over a longer, 20- to
30-year period.
KRS theoretically has an indefinite life span which may result in some stakeholders believing that
emphasis should be placed solely on long-term expectations, even if short-term expectations are
materially different. While KRS is expected to have an indefinite life span, this system is relatively mature
with material shorter-term liability attributable to current retirees. For example, as of the last actuarial
Kentucky Retirement Systems
Section III – Analysis of Experience and Recommendations
14
valuation $11.4 billion of the $15.7 billion total actuarial accrued liability in the KERS Non-Hazardous
System is attributable to members who are currently receiving a retirement benefit (i.e. 72% of the total
liability). Similarly, $7.8 billion of the $13.2 billion total actuarial accrued liability in the CERS Non-
Hazardous System is attributable to members who are currently receiving a retirement benefit (i.e. 59% of
the total liability). Due to the Systems’ maturity, we believe an appropriate return assumption for these
Systems should account for short-term expectations.
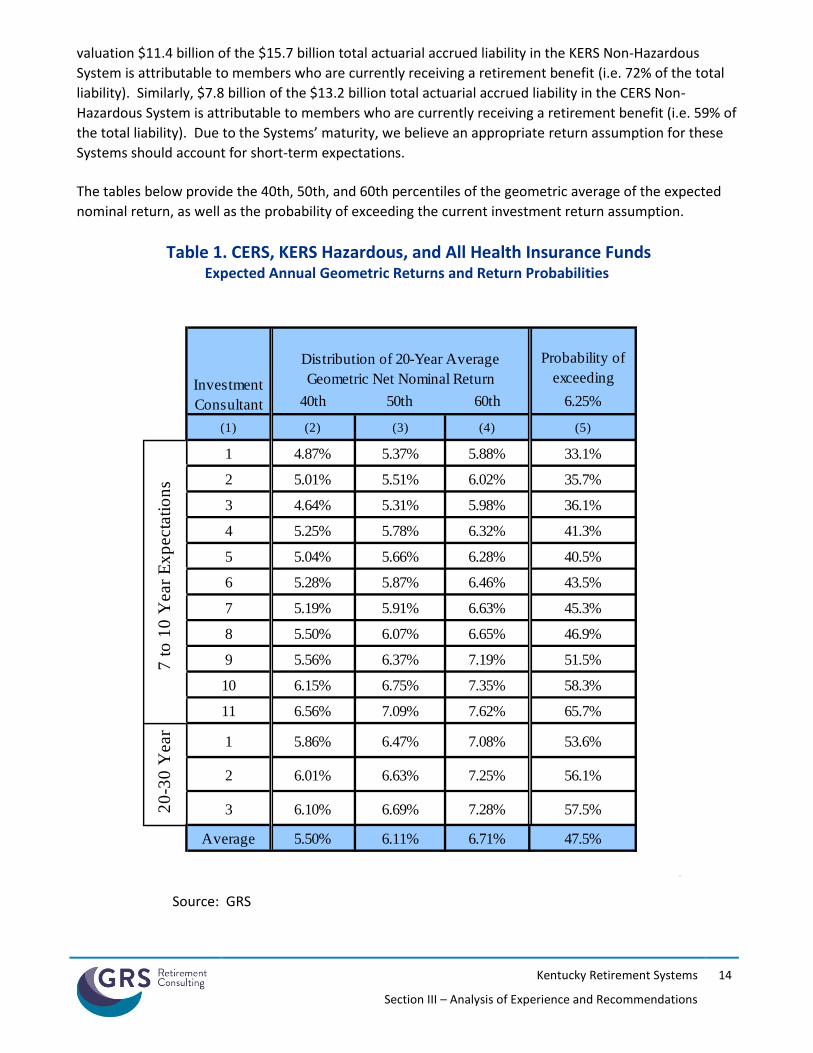
The tables below provide the 40th, 50th, and 60th percentiles of the geometric average of the expected
nominal return, as well as the probability of exceeding the current investment return assumption.
Table 1. CERS, KERS Hazardous, and All Health Insurance Funds Expected Annual Geometric Returns and Return Probabilities
Source: GRS
Probability of
exceeding
40th 50th 60th 6.25%
(1) (2) (3) (4) (5)
1 4.87% 5.37% 5.88% 33.1%
2 5.01% 5.51% 6.02% 35.7%
3 4.64% 5.31% 5.98% 36.1%
4 5.25% 5.78% 6.32% 41.3%
5 5.04% 5.66% 6.28% 40.5%
6 5.28% 5.87% 6.46% 43.5%
7 5.19% 5.91% 6.63% 45.3%
8 5.50% 6.07% 6.65% 46.9%
9 5.56% 6.37% 7.19% 51.5%
10 6.15% 6.75% 7.35% 58.3%
11 6.56% 7.09% 7.62% 65.7%
1 5.86% 6.47% 7.08% 53.6%
2 6.01% 6.63% 7.25% 56.1%
3 6.10% 6.69% 7.28% 57.5%
Average 5.50% 6.11% 6.71% 47.5%
7 t
o 1
0 Y
ear
Ex
pecta
tio
ns
20
-30
Year
Investment
Consultant
Distribution of 20-Year Average
Geometric Net Nominal Return
Kentucky Retirement Systems
Section III – Analysis of Experience and Recommendations
15
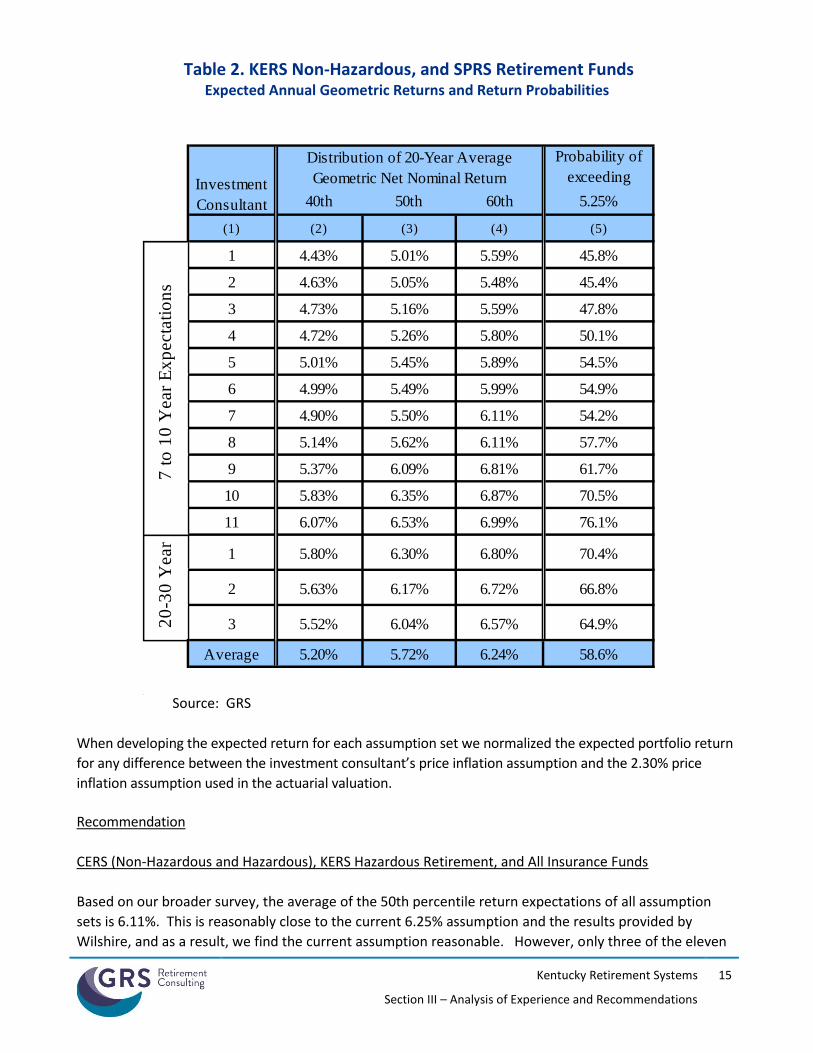
Table 2. KERS Non-Hazardous, and SPRS Retirement Funds Expected Annual Geometric Returns and Return Probabilities
Source: GRS
When developing the expected return for each assumption set we normalized the expected portfolio return
for any difference between the investment consultant’s price inflation assumption and the 2.30% price
inflation assumption used in the actuarial valuation.
Recommendation
CERS (Non-Hazardous and Hazardous), KERS Hazardous Retirement, and All Insurance Funds
Based on our broader survey, the average of the 50th percentile return expectations of all assumption
sets is 6.11%. This is reasonably close to the current 6.25% assumption and the results provided by
Wilshire, and as a result, we find the current assumption reasonable. However, only three of the eleven
Probability of
exceeding
40th 50th 60th 5.25%
(1) (2) (3) (4) (5)
1 4.43% 5.01% 5.59% 45.8%
2 4.63% 5.05% 5.48% 45.4%
3 4.73% 5.16% 5.59% 47.8%
4 4.72% 5.26% 5.80% 50.1%
5 5.01% 5.45% 5.89% 54.5%
6 4.99% 5.49% 5.99% 54.9%
7 4.90% 5.50% 6.11% 54.2%
8 5.14% 5.62% 6.11% 57.7%
9 5.37% 6.09% 6.81% 61.7%
10 5.83% 6.35% 6.87% 70.5%
11 6.07% 6.53% 6.99% 76.1%
1 5.80% 6.30% 6.80% 70.4%
2 5.63% 6.17% 6.72% 66.8%
3 5.52% 6.04% 6.57% 64.9%
Average 5.20% 5.72% 6.24% 58.6%
Investment
Consultant
Distribution of 20-Year Average
Geometric Net Nominal Return7
to
10
Year
Ex
pecta
tio
ns
20
-30
Year
Kentucky Retirement Systems
Section III – Analysis of Experience and Recommendations
16
short-term assumptions result in a greater than 50% probability of exceeding the current 6.25% return
assumption. Thus, if the Board is uncomfortable with a lower than 50% probability of achieving the
assumption over the next decade, they may want to consider lowering the assumption to 6.00%..
KERS Non-Hazardous and SPRS Retirement Funds
These two retirement funds are invested differently than the other systems maintained by KRS because
they require increased liquidity to have funds available to provide the benefit payments due to current
retirees. Specifically, as of the last actuarial valuation the funded ratio of the KERS Non-Hazardous and
SPRS Retirement funds were 12.8% and 27.1%, respectively.
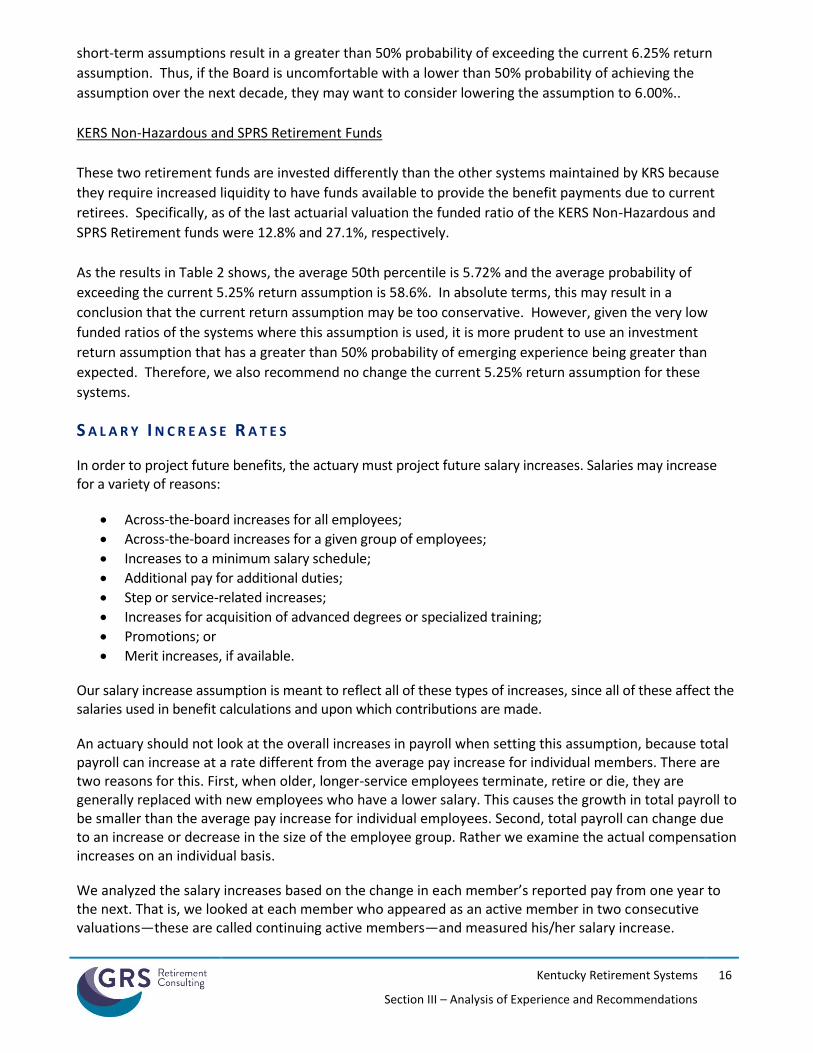
As the results in Table 2 shows, the average 50th percentile is 5.72% and the average probability of
exceeding the current 5.25% return assumption is 58.6%. In absolute terms, this may result in a
conclusion that the current return assumption may be too conservative. However, given the very low
funded ratios of the systems where this assumption is used, it is more prudent to use an investment
return assumption that has a greater than 50% probability of emerging experience being greater than
expected. Therefore, we also recommend no change the current 5.25% return assumption for these
systems.
S A L A R Y I N C R E A S E R A T E S
In order to project future benefits, the actuary must project future salary increases. Salaries may increase for a variety of reasons:
Across-the-board increases for all employees;
Across-the-board increases for a given group of employees;
Increases to a minimum salary schedule;
Additional pay for additional duties;
Step or service-related increases;
Increases for acquisition of advanced degrees or specialized training;
Promotions; or
Merit increases, if available.
Our salary increase assumption is meant to reflect all of these types of increases, since all of these affect the salaries used in benefit calculations and upon which contributions are made.
An actuary should not look at the overall increases in payroll when setting this assumption, because total payroll can increase at a rate different from the average pay increase for individual members. There are two reasons for this. First, when older, longer-service employees terminate, retire or die, they are generally replaced with new employees who have a lower salary. This causes the growth in total payroll to be smaller than the average pay increase for individual employees. Second, total payroll can change due to an increase or decrease in the size of the employee group. Rather we examine the actual compensation increases on an individual basis.
We analyzed the salary increases based on the change in each member’s reported pay from one year to the next. That is, we looked at each member who appeared as an active member in two consecutive valuations—these are called continuing active members—and measured his/her salary increase.
Kentucky Retirement Systems
Section III – Analysis of Experience and Recommendations
17
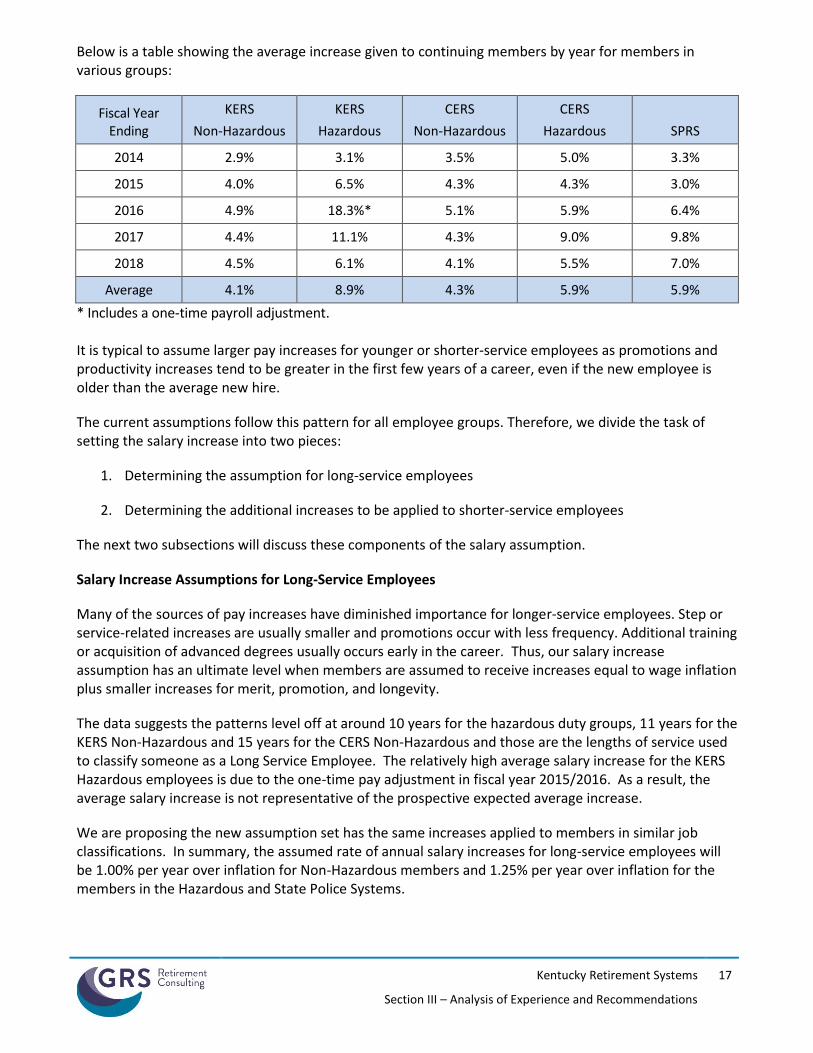
Below is a table showing the average increase given to continuing members by year for members in various groups:
Fiscal Year Ending
KERS
Non-Hazardous
KERS
Hazardous
CERS
Non-Hazardous
CERS
Hazardous SPRS
2014 2.9% 3.1% 3.5% 5.0% 3.3%
2015 4.0% 6.5% 4.3% 4.3% 3.0%
2016 4.9% 18.3%* 5.1% 5.9% 6.4%
2017 4.4% 11.1% 4.3% 9.0% 9.8%
2018 4.5% 6.1% 4.1% 5.5% 7.0%
Average 4.1% 8.9% 4.3% 5.9% 5.9%
* Includes a one-time payroll adjustment. It is typical to assume larger pay increases for younger or shorter-service employees as promotions and productivity increases tend to be greater in the first few years of a career, even if the new employee is older than the average new hire.
The current assumptions follow this pattern for all employee groups. Therefore, we divide the task of setting the salary increase into two pieces:
1. Determining the assumption for long-service employees
2. Determining the additional increases to be applied to shorter-service employees
The next two subsections will discuss these components of the salary assumption.
Salary Increase Assumptions for Long-Service Employees
Many of the sources of pay increases have diminished importance for longer-service employees. Step or service-related increases are usually smaller and promotions occur with less frequency. Additional training or acquisition of advanced degrees usually occurs early in the career. Thus, our salary increase assumption has an ultimate level when members are assumed to receive increases equal to wage inflation plus smaller increases for merit, promotion, and longevity.
The data suggests the patterns level off at around 10 years for the hazardous duty groups, 11 years for the KERS Non-Hazardous and 15 years for the CERS Non-Hazardous and those are the lengths of service used to classify someone as a Long Service Employee. The relatively high average salary increase for the KERS Hazardous employees is due to the one-time pay adjustment in fiscal year 2015/2016. As a result, the average salary increase is not representative of the prospective expected average increase.
We are proposing the new assumption set has the same increases applied to members in similar job classifications. In summary, the assumed rate of annual salary increases for long-service employees will be 1.00% per year over inflation for Non-Hazardous members and 1.25% per year over inflation for the members in the Hazardous and State Police Systems.
Kentucky Retirement Systems
Section III – Analysis of Experience and Recommendations
18
Salary Increase Assumption for Shorter-Service Employees
To analyze the service-related salary assumption, we looked at the excess in the average increases for shorter service employees over the average for longer-service employees. For example, CERS non-hazardous members with four years of service received an average increase of 4.64%, which was 1.84% more than the average increase of 2.80% for the same type of employee with fifteen or more years of service. This component of the salary scale assumption behaves more like a demographic assumption than an economic assumption, and therefore, the historical experience has a high level of creditability for purposes of establishing future expectations. Step-rate assumptions were generally increased for all five Systems. Details of our analysis are shown in Section VIII beginning on page 74.
Salary Increases – Combined Effect
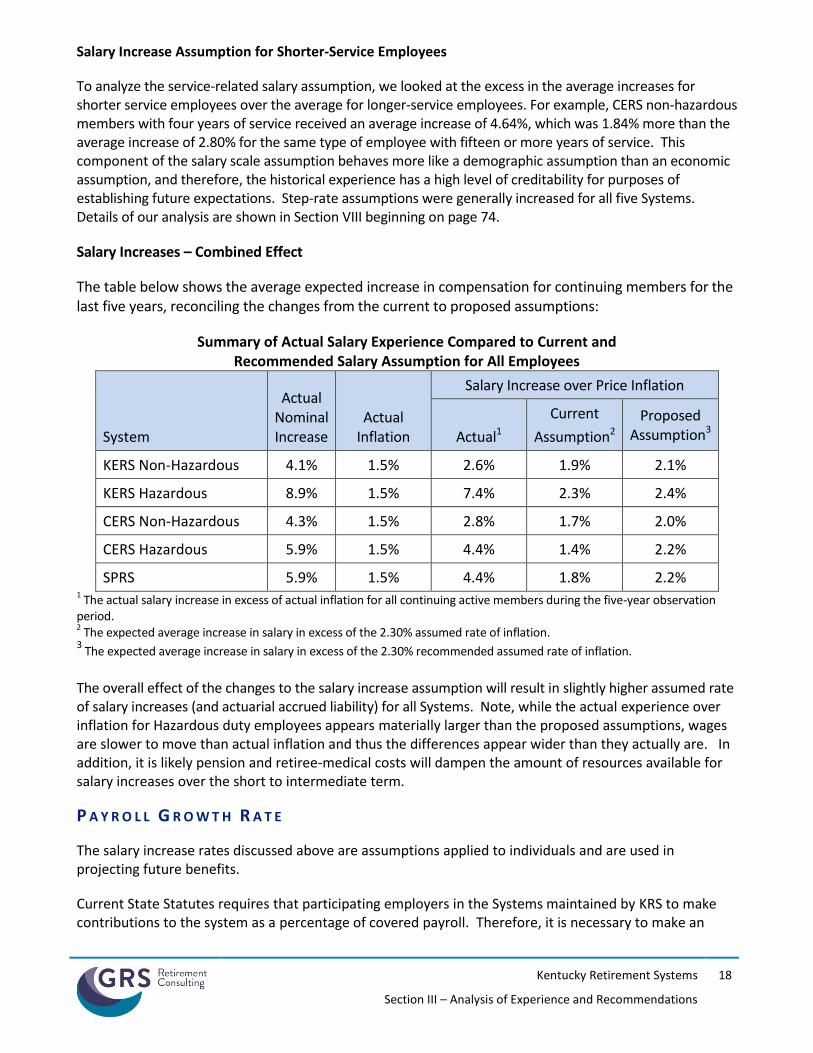
The table below shows the average expected increase in compensation for continuing members for the last five years, reconciling the changes from the current to proposed assumptions:
Summary of Actual Salary Experience Compared to Current and Recommended Salary Assumption for All Employees
System
Actual Nominal Increase
Actual Inflation
Salary Increase over Price Inflation
Actual1
Current
Assumption2
Proposed Assumption3
KERS Non-Hazardous 4.1% 1.5% 2.6% 1.9% 2.1%
KERS Hazardous 8.9% 1.5% 7.4% 2.3% 2.4%
CERS Non-Hazardous 4.3% 1.5% 2.8% 1.7% 2.0%
CERS Hazardous 5.9% 1.5% 4.4% 1.4% 2.2%
SPRS 5.9% 1.5% 4.4% 1.8% 2.2% 1 The actual salary increase in excess of actual inflation for all continuing active members during the five-year observation
period. 2 The expected average increase in salary in excess of the 2.30% assumed rate of inflation.
3 The expected average increase in salary in excess of the 2.30% recommended assumed rate of inflation.
The overall effect of the changes to the salary increase assumption will result in slightly higher assumed rate of salary increases (and actuarial accrued liability) for all Systems. Note, while the actual experience over inflation for Hazardous duty employees appears materially larger than the proposed assumptions, wages are slower to move than actual inflation and thus the differences appear wider than they actually are. In addition, it is likely pension and retiree-medical costs will dampen the amount of resources available for salary increases over the short to intermediate term.
P A Y R O L L G R O W T H R A T E
The salary increase rates discussed above are assumptions applied to individuals and are used in projecting future benefits.
Current State Statutes requires that participating employers in the Systems maintained by KRS to make contributions to the system as a percentage of covered payroll. Therefore, it is necessary to make an
Kentucky Retirement Systems
Section III – Analysis of Experience and Recommendations
19
assumption regarding the anticipated overall change in covered payroll to develop the amortization rate to finance the unfunded actuarial accrued liability over the specified funding period.
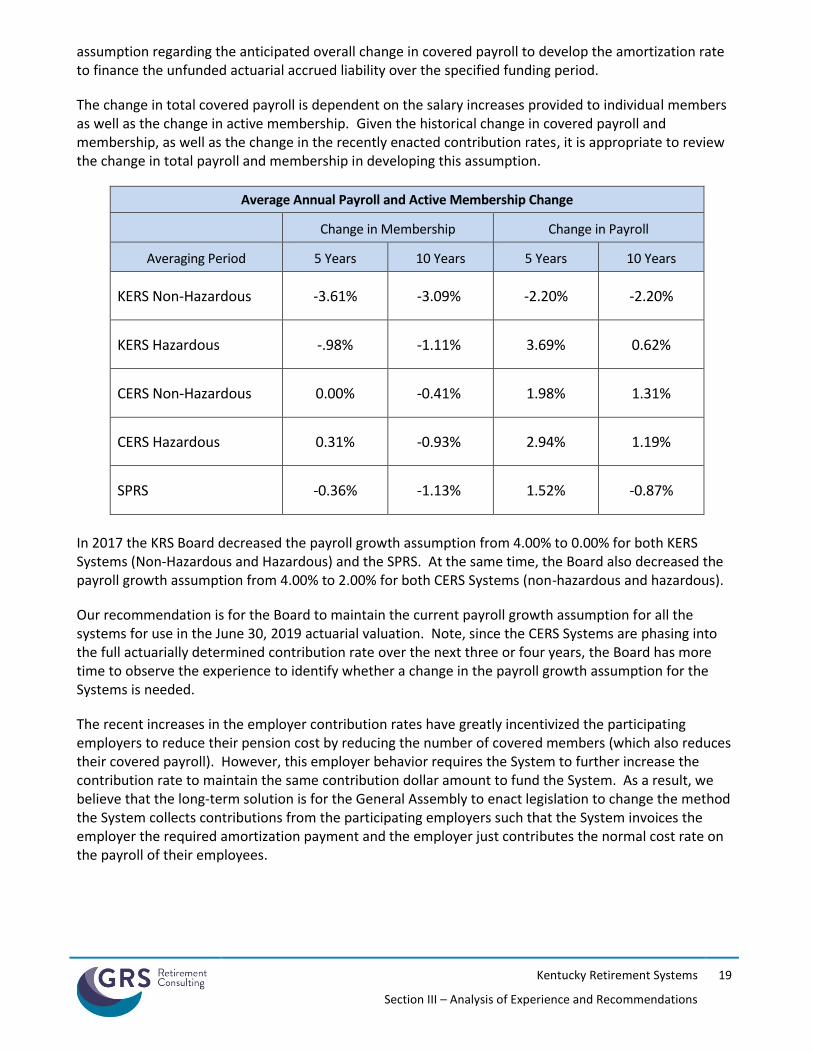
The change in total covered payroll is dependent on the salary increases provided to individual members as well as the change in active membership. Given the historical change in covered payroll and membership, as well as the change in the recently enacted contribution rates, it is appropriate to review the change in total payroll and membership in developing this assumption.
Average Annual Payroll and Active Membership Change
Change in Membership Change in Payroll
Averaging Period 5 Years 10 Years 5 Years 10 Years
KERS Non-Hazardous -3.61% -3.09% -2.20% -2.20%
KERS Hazardous -.98% -1.11% 3.69% 0.62%
CERS Non-Hazardous 0.00% -0.41% 1.98% 1.31%
CERS Hazardous 0.31% -0.93% 2.94% 1.19%
SPRS -0.36% -1.13% 1.52% -0.87%
In 2017 the KRS Board decreased the payroll growth assumption from 4.00% to 0.00% for both KERS Systems (Non-Hazardous and Hazardous) and the SPRS. At the same time, the Board also decreased the payroll growth assumption from 4.00% to 2.00% for both CERS Systems (non-hazardous and hazardous).
Our recommendation is for the Board to maintain the current payroll growth assumption for all the systems for use in the June 30, 2019 actuarial valuation. Note, since the CERS Systems are phasing into the full actuarially determined contribution rate over the next three or four years, the Board has more time to observe the experience to identify whether a change in the payroll growth assumption for the Systems is needed.
The recent increases in the employer contribution rates have greatly incentivized the participating employers to reduce their pension cost by reducing the number of covered members (which also reduces their covered payroll). However, this employer behavior requires the System to further increase the contribution rate to maintain the same contribution dollar amount to fund the System. As a result, we believe that the long-term solution is for the General Assembly to enact legislation to change the method the System collects contributions from the participating employers such that the System invoices the employer the required amortization payment and the employer just contributes the normal cost rate on the payroll of their employees.
Kentucky Retirement Systems
Section III – Analysis of Experience and Recommendations
20
D E M O G R A P H I C A S S U M P T I O N S
Actuaries are guided by the Actuarial Standards of Practice (ASOP) adopted by the Actuarial Standards Board (ASB). One of these standards is ASOP No. 35, Selection of Demographic and Other Noneconomic Assumptions for Measuring Pension Obligations. This standard provides guidance to actuaries giving advice on selecting noneconomic assumptions for measuring obligations under defined benefit plans. We believe the recommended assumptions in this report were developed in compliance with this standard.
P O S T - R E T I R E M E N T M O R T A L I T Y R A T E S KRS’s actuarial liabilities depend in part on how long retirees live. The longer a retiree lives, the longer the retiree receives benefits from the System resulting in a larger liability to the System.
The current mortality assumption is gender distinct, but there is no distinction between retirees in KERS
or CERS, or the Non-Hazardous and Hazardous Systems. Separate mortality tables are used for active
members and disabled retirees; and discussed separately in a following subsection. The currently
mortality assumption used in the actuarial valuation for non-disabled retirees is a variation of the RP-2000
Combined mortality table. The life expectancy for an age 65 retiree is 19.0 years for males and 22.1 years
for females. The current mortality assumption does not include an explicit assumption for future
improvement in life expectancy. Rather, this mortality assumption is implicitly stating that the life
expectancy for a member who retirees 20, 30, or 40 years from now will have the same life expectancy of
current retiree of the same age.
The issue of mortality improvement is one that our profession has increasingly become more focused on
studying and ensuring that the actuarial profession remains on the forefront of this issue. This has
resulted in changes to the relevant Actuarial Standard of Practice, ASOP 35, and published practice notes
to increase the disclosure regarding expected mortality improvement after the valuation date. As a
result, it is becoming industry practice to use a mortality assumption that explicitly incorporates mortality
improvement. By doing this, future life expectancy will be projected to continually increase each year in
the future and the life expectancy of someone who will reach age 65 in 2035 with have a slightly longer
life expectancy compared to someone who is currently age 65.
Analysis of Credibility of the Retirement Systems’ Mortality Experience
When selecting an appropriate mortality assumption, actuaries often use standard, published, mortality
tables. Depending on the size, or statistical credibility, of the retiree population increases, actuaries often
also adjust these published mortality tables with multipliers or age setbacks, to better reflect characteristics
of the covered group and to provide for expectations of future mortality improvement (both up to and after
the measurement date). On the other hand, a retirement system with a sufficiently large number of retirees
may be able to better model mortality experience using a mortality table based on their experience. Factors
that may be considered in selecting and/or adjusting a mortality table include the demographics of the
retiree group, the statistical credibility of its experience, and the anticipated rate of future mortality
improvement.
Kentucky Retirement Systems
Section III – Analysis of Experience and Recommendations
21
In our analysis of the mortality experience for KRS, we first measured the credibility of the dataset to
determine whether standard published tables should be used or if a statistical analysis of the Retirement
Systems’ data was warranted. Based on a practice note issued by the American Academy of Actuaries in
June 2015, a dataset needs 96 expected deaths for each gender to be within +/- 20% of the actual pattern
with 95% confidence. However, we believe a +/- 20% range to too large to be considered fully credible, for
mortality section. Other sources suggest higher requirements, such as 1,000 deaths per gender is necessary
to be considered fully credible. The following table gives the number of deaths needed by gender to have a
given level of confidence that the data is +/- X% of the actual pattern.
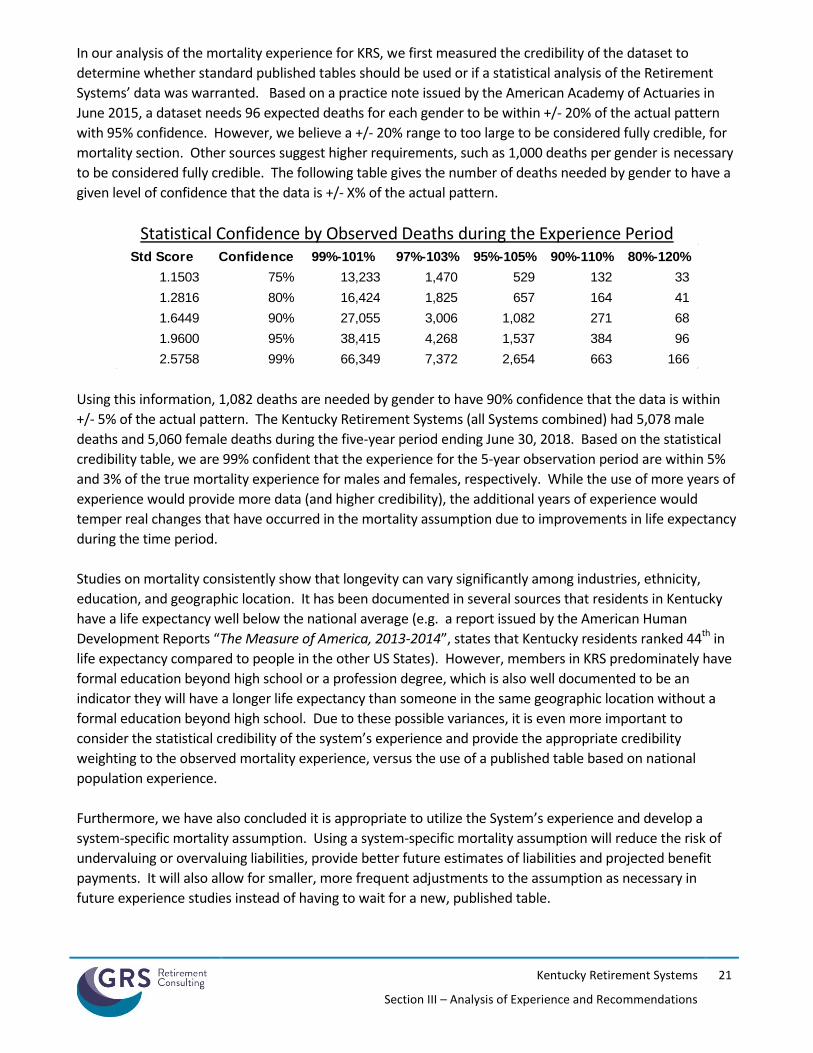
Statistical Confidence by Observed Deaths during the Experience Period
Using this information, 1,082 deaths are needed by gender to have 90% confidence that the data is within
+/- 5% of the actual pattern. The Kentucky Retirement Systems (all Systems combined) had 5,078 male
deaths and 5,060 female deaths during the five-year period ending June 30, 2018. Based on the statistical
credibility table, we are 99% confident that the experience for the 5-year observation period are within 5%
and 3% of the true mortality experience for males and females, respectively. While the use of more years of
experience would provide more data (and higher credibility), the additional years of experience would
temper real changes that have occurred in the mortality assumption due to improvements in life expectancy
during the time period.
Studies on mortality consistently show that longevity can vary significantly among industries, ethnicity,
education, and geographic location. It has been documented in several sources that residents in Kentucky
have a life expectancy well below the national average (e.g. a report issued by the American Human
Development Reports “The Measure of America, 2013-2014”, states that Kentucky residents ranked 44th in
life expectancy compared to people in the other US States). However, members in KRS predominately have
formal education beyond high school or a profession degree, which is also well documented to be an
indicator they will have a longer life expectancy than someone in the same geographic location without a
formal education beyond high school. Due to these possible variances, it is even more important to
consider the statistical credibility of the system’s experience and provide the appropriate credibility
weighting to the observed mortality experience, versus the use of a published table based on national
population experience.
Furthermore, we have also concluded it is appropriate to utilize the System’s experience and develop a
system-specific mortality assumption. Using a system-specific mortality assumption will reduce the risk of
undervaluing or overvaluing liabilities, provide better future estimates of liabilities and projected benefit
payments. It will also allow for smaller, more frequent adjustments to the assumption as necessary in
future experience studies instead of having to wait for a new, published table.
Std Score Confidence 99%-101% 97%-103% 95%-105% 90%-110% 80%-120%
1.1503 75% 13,233 1,470 529 132 33
1.2816 80% 16,424 1,825 657 164 41
1.6449 90% 27,055 3,006 1,082 271 68
1.9600 95% 38,415 4,268 1,537 384 96
2.5758 99% 66,349 7,372 2,654 663 166
Kentucky Retirement Systems
Section III – Analysis of Experience and Recommendations
22
Recommended Base Mortality Assumption
We performed our analysis using a benefit-weighted approach, where we measure the exposures and actual
deaths as the retiree’s benefit amount, rather than a headcount approach that applies an equal weighting to
all retirees. Developing a base table using a benefit-weighted approach is preferable because: (1) research
studies have consistently shown that higher wage earners generally have a longer life expectancy than lower
wage earners and (2) this approach should better model the actual liability that is released when retirees
die. A benefit-weighted approach is the same method used by the Society of Actuaries’ Retirement Plans
Experience Committee when they develop published mortality tables.
Mortality rates for the core ages of retirees, age 58 to 94, are based on the Retirement System’s experience,
using a polynomial model to provide a smooth fit to the midpoint of the experience. Mortality rates for ages
under 58 and over 98, are equal to the most recently published Pub-2010 mortality assumptions for general
members (adjusted from a base year to the central point of the experience period using projection scale
MP-Ultimate). Finally, the mortality rates for the transitional age ranges, ages 94 to 98, were developed by
a 5-year blending method to orderly transition from the rates based on the System’s experience to the
published mortality table. The R2 for the fit of the tables to actual experience in five-year age bands was
.9988 and .9978 for males and females, respectively.
The final step in the creation of the base mortality assumption was to project the preliminary table from the
center point of the analysis period (i.e., the year 2015) to the year 2019 using the MP-Ultimate mortality
improvement assumption. We will refer to this new table as the 2019 Public Retirees of Kentucky Mortality
Table (2019 PRK).
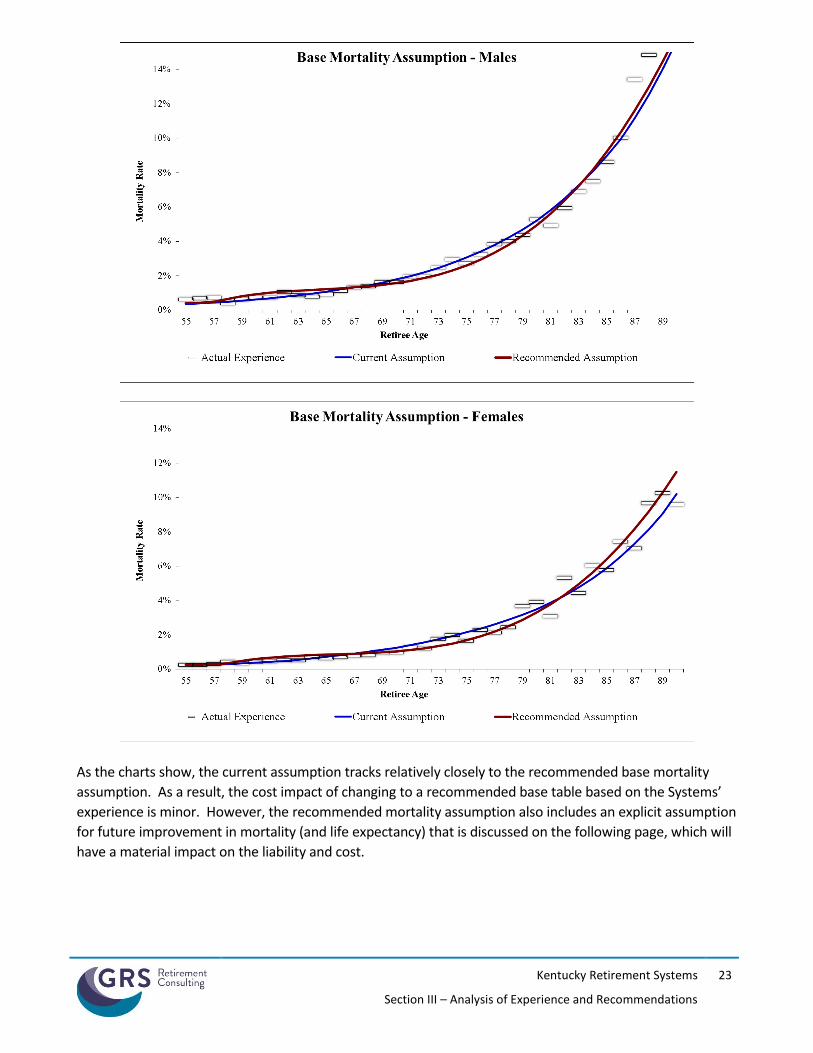
The following charts show the actual mortality experience assumption for male and female retirees, along
with the current mortality assumption, and the recommended mortality assumption. As the chart shows,
the best way to provide a better fit along the entire “curve” is to use an assumption developed using actual
experience.
Kentucky Retirement Systems
Section III – Analysis of Experience and Recommendations
23
As the charts show, the current assumption tracks relatively closely to the recommended base mortality
assumption. As a result, the cost impact of changing to a recommended base table based on the Systems’
experience is minor. However, the recommended mortality assumption also includes an explicit assumption
for future improvement in mortality (and life expectancy) that is discussed on the following page, which will
have a material impact on the liability and cost.
Kentucky Retirement Systems
Section III – Analysis of Experience and Recommendations
24
Recommended Mortality Improvement Assumption
Society of Actuaries’ Retirement Plans Experience Committee (RPEC) recognizes that there is a wide range
of opinion with respect to future levels of mortality and that the assumptions underlying mortality
improvement reflect some degree of subjectivity. Generational mortality improvement assumption Scale
AA was released by the Society of Actuaries along with the release of the RP-2000 mortality tables in the
year 2000. In October 2014, the Society of Actuaries issued final reports of the mortality study that
included the release of the RP-2014 mortality tables and the MP-2014 mortality improvement
assumption. MP-2014 is a two-dimensional improvement assumption that is a function of the age and
calendar year. In 2015, 2016, 2017, and 2018, the Society of Actuaries issued mortality improvement
assumptions MP-2015, MP-2016, MP-2017, and MP-2018, respectively. In each of these updates, the rates
of improvement during the selection period were decreased compared to the prior year improvement
assumption, which means that the original MP-2014 assumption was shown to be too conservative.
After approximately 15 years, all of the versions of the MP improvement assumptions have the same rate of
improvement at each future calendar year (the ultimate rate of mortality improvement). In general, the
assumed rate of improvement after 15 years is a flat 1% per year across most ages. This general 1% is in
line with other demographer sources and we prefer a more consistent technique for this assumption that
doesn’t give the appearance of more precision than actually is possible. Given the fact that actual
improvement in mortality has not tracked well during the select period of the MP tables, we believe it is
reasonable to use the ultimate mortality improvement rates in the MP tables for all years. Therefore, we
recommend the use of “MP-Ultimate” for the mortality improvement assumption.
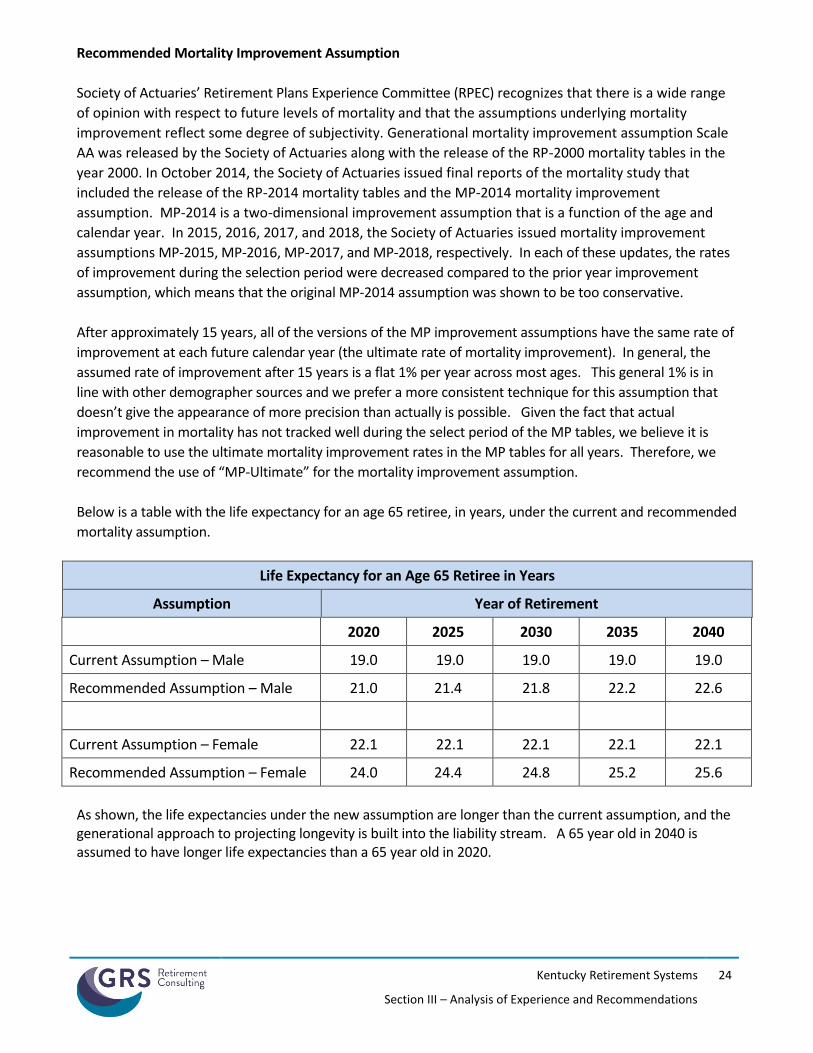
Below is a table with the life expectancy for an age 65 retiree, in years, under the current and recommended
mortality assumption.
Life Expectancy for an Age 65 Retiree in Years
Assumption Year of Retirement
2020 2025 2030 2035 2040
Current Assumption – Male 19.0 19.0 19.0 19.0 19.0
Recommended Assumption – Male 21.0 21.4 21.8 22.2 22.6
Current Assumption – Female 22.1 22.1 22.1 22.1 22.1
Recommended Assumption – Female 24.0 24.4 24.8 25.2 25.6
As shown, the life expectancies under the new assumption are longer than the current assumption, and the generational approach to projecting longevity is built into the liability stream. A 65 year old in 2040 is assumed to have longer life expectancies than a 65 year old in 2020.
Kentucky Retirement Systems
Section III – Analysis of Experience and Recommendations
25
D I S A B L E D R E T I R E E M O R T A L I T Y R A T E S
This is a less significant assumption than the mortality assumption for non-disabled retirees, because only one out of fifteen retirees is classified as disability retirement. Because the number of disabled retirees is much smaller, there is not sufficient experience to develop a system-specific assumption and we must continue to rely on using a published table.
The current disability mortality assumption is based on the RP-2000 Disabled Mortality table, with various adjustments to appropriately fit to the experience.
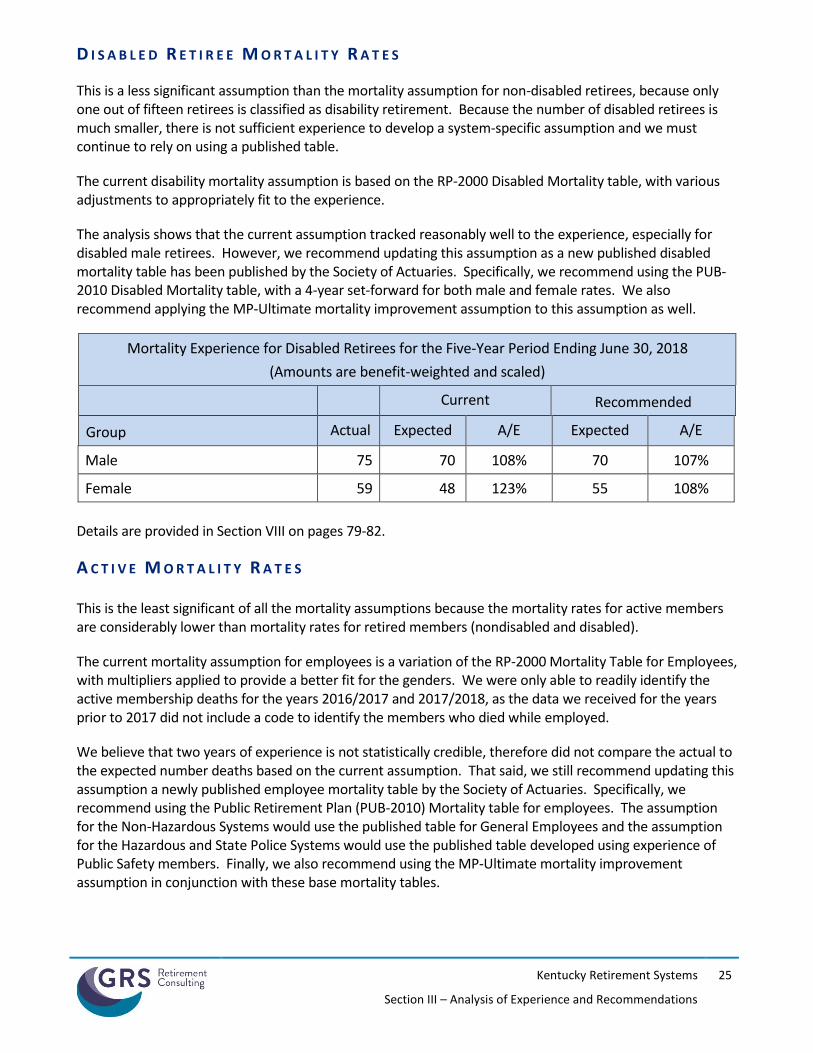
The analysis shows that the current assumption tracked reasonably well to the experience, especially for disabled male retirees. However, we recommend updating this assumption as a new published disabled mortality table has been published by the Society of Actuaries. Specifically, we recommend using the PUB-2010 Disabled Mortality table, with a 4-year set-forward for both male and female rates. We also recommend applying the MP-Ultimate mortality improvement assumption to this assumption as well.
Mortality Experience for Disabled Retirees for the Five-Year Period Ending June 30, 2018
(Amounts are benefit-weighted and scaled)
Current Recommended
Group Actual Expected A/E Expected A/E
Male 75 70 108% 70 107%
Female 59 48 123% 55 108%
Details are provided in Section VIII on pages 79-82.
A C T I V E M O R T A L I T Y R A T E S This is the least significant of all the mortality assumptions because the mortality rates for active members are considerably lower than mortality rates for retired members (nondisabled and disabled).
The current mortality assumption for employees is a variation of the RP-2000 Mortality Table for Employees, with multipliers applied to provide a better fit for the genders. We were only able to readily identify the active membership deaths for the years 2016/2017 and 2017/2018, as the data we received for the years prior to 2017 did not include a code to identify the members who died while employed.
We believe that two years of experience is not statistically credible, therefore did not compare the actual to the expected number deaths based on the current assumption. That said, we still recommend updating this assumption a newly published employee mortality table by the Society of Actuaries. Specifically, we recommend using the Public Retirement Plan (PUB-2010) Mortality table for employees. The assumption for the Non-Hazardous Systems would use the published table for General Employees and the assumption for the Hazardous and State Police Systems would use the published table developed using experience of Public Safety members. Finally, we also recommend using the MP-Ultimate mortality improvement assumption in conjunction with these base mortality tables.
Kentucky Retirement Systems
Section III – Analysis of Experience and Recommendations
26
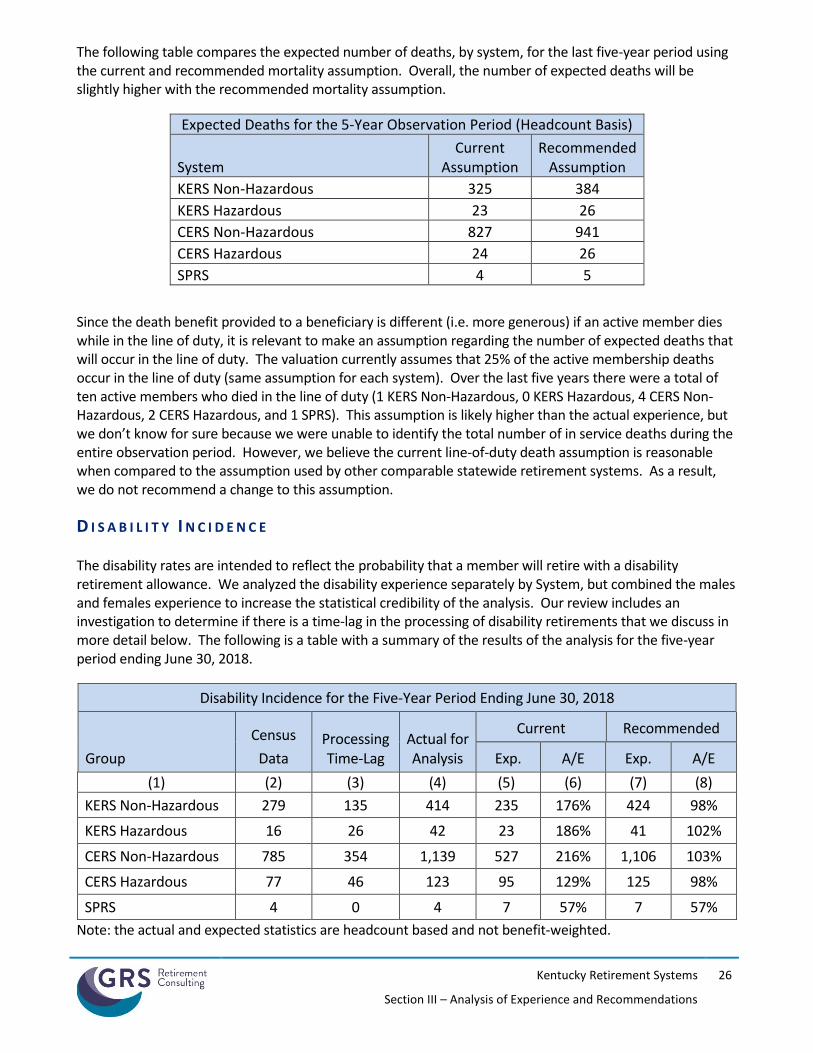
The following table compares the expected number of deaths, by system, for the last five-year period using the current and recommended mortality assumption. Overall, the number of expected deaths will be slightly higher with the recommended mortality assumption.
Expected Deaths for the 5-Year Observation Period (Headcount Basis)
System Current
Assumption Recommended
Assumption
KERS Non-Hazardous 325 384
KERS Hazardous 23 26
CERS Non-Hazardous 827 941
CERS Hazardous 24 26
SPRS 4 5
Since the death benefit provided to a beneficiary is different (i.e. more generous) if an active member dies while in the line of duty, it is relevant to make an assumption regarding the number of expected deaths that will occur in the line of duty. The valuation currently assumes that 25% of the active membership deaths occur in the line of duty (same assumption for each system). Over the last five years there were a total of ten active members who died in the line of duty (1 KERS Non-Hazardous, 0 KERS Hazardous, 4 CERS Non-Hazardous, 2 CERS Hazardous, and 1 SPRS). This assumption is likely higher than the actual experience, but we don’t know for sure because we were unable to identify the total number of in service deaths during the entire observation period. However, we believe the current line-of-duty death assumption is reasonable when compared to the assumption used by other comparable statewide retirement systems. As a result, we do not recommend a change to this assumption.
D I S A B I L I T Y I N C I D E N C E The disability rates are intended to reflect the probability that a member will retire with a disability retirement allowance. We analyzed the disability experience separately by System, but combined the males and females experience to increase the statistical credibility of the analysis. Our review includes an investigation to determine if there is a time-lag in the processing of disability retirements that we discuss in more detail below. The following is a table with a summary of the results of the analysis for the five-year period ending June 30, 2018.
Disability Incidence for the Five-Year Period Ending June 30, 2018
Group
Census
Data Processing Time-Lag
Actual for Analysis
Current Recommended
Exp. A/E Exp. A/E
(1) (2) (3) (4) (5) (6) (7) (8)
KERS Non-Hazardous 279 135 414 235 176% 424 98%
KERS Hazardous 16 26 42 23 186% 41 102%
CERS Non-Hazardous 785 354 1,139 527 216% 1,106 103%
CERS Hazardous 77 46 123 95 129% 125 98%
SPRS 4 0 4 7 57% 7 57%
Note: the actual and expected statistics are headcount based and not benefit-weighted.
Kentucky Retirement Systems
Section III – Analysis of Experience and Recommendations
27
Typically, when we review a System’s disability experience, our review includes an investigation into whether there is delay in a System’s classification of a retiree as a disabled retiree. Often if there is a delay, it is due to a combination of the time of year the member becomes disabled and the time necessary to approve a member’s application for a disability retirement benefit. For example, a member who becomes disabled late in the fiscal year may be reported in the census data files as follow: Year 1: “Active”, Year 2: “Inactive”, Year 3: “Disabled Retiree”. The reporting of the member as “Inactive” in year 2 is due to the processing of a member’s application for a disability retirement, where in reality the member was actually a “Disabled Retiree” in year 2.
The count in column (2) provides the number of members who are identified as having a year-to-year status change from “Active” to “Disabled Retiree”. The count in column (3) is the number of members who were identified as having a status change from “Inactive” to “Disabled Retiree” in a subsequent year. Together, these represent the number of disability retirements that occurred during the measurement period.
As a result of the observed processing time-lag, we significantly increased the rate of disability incidence for both KERS Systems, and the CERS Non-Hazardous System. We also slightly increased the rate of disability incidence for the CERS Hazardous System and recommended no change in the disability rates for SPRS.
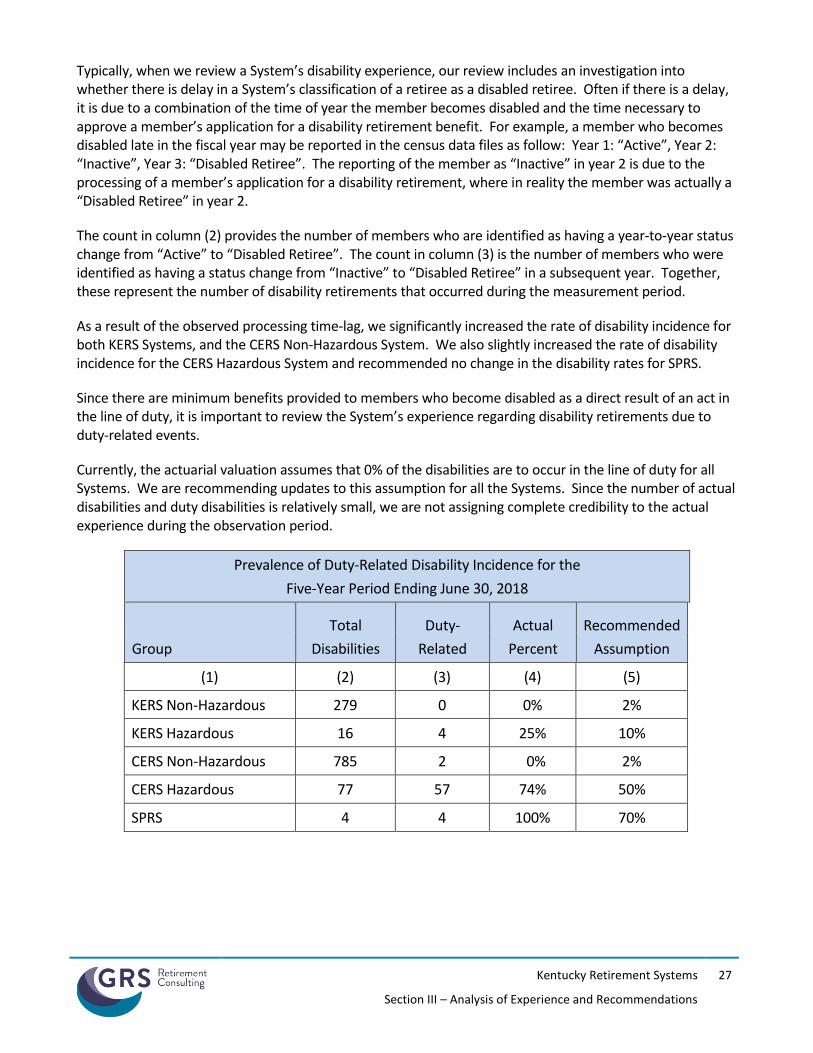
Since there are minimum benefits provided to members who become disabled as a direct result of an act in the line of duty, it is important to review the System’s experience regarding disability retirements due to duty-related events.
Currently, the actuarial valuation assumes that 0% of the disabilities are to occur in the line of duty for all Systems. We are recommending updates to this assumption for all the Systems. Since the number of actual disabilities and duty disabilities is relatively small, we are not assigning complete credibility to the actual experience during the observation period.
Prevalence of Duty-Related Disability Incidence for the
Five-Year Period Ending June 30, 2018
Group
Total
Disabilities
Duty-
Related
Actual
Percent
Recommended
Assumption
(1) (2) (3) (4) (5)
KERS Non-Hazardous 279 0 0% 2%
KERS Hazardous 16 4 25% 10%
CERS Non-Hazardous 785 2 0% 2%
CERS Hazardous 77 57 74% 50%
SPRS 4 4 100% 70%
Kentucky Retirement Systems
Section III – Analysis of Experience and Recommendations
28
T E R M I N A T I O N R A T E S
The termination assumption is used to model the effect of members leaving active membership in the
System for any reason other than death, disability, or service retirement. This applies whether the
termination is voluntary or involuntary, and whether the member takes a refund or keeps his/her account
balance on deposit. However, we only consider a termination to occur if the member changes status in the
retirement system to an inactive member. We don’t consider a termination to occur if the member works
for a new employer, but remains an active member in the same System. The valuation uses the same
termination assumption for males and females, but different assumptions for non-hazardous and hazardous
members. The current assumption is structured as a function of service. No terminations are assumed once
a member becomes eligible to commence their retirement benefit.
A higher paid member has a greater liability relative to a lower paid member, and has shown to have lower
turnover. Along those lines the termination pattern for the higher paid members will have more impact on
the future liabilities of the plan. Therefore, we have weighted the experience by salary and are counting the
payroll and the portion of the payroll that terminates employment (versus headcount) for the last 5 years.
For this assumption, it is more conservative to have an A/E ratio over 100%.
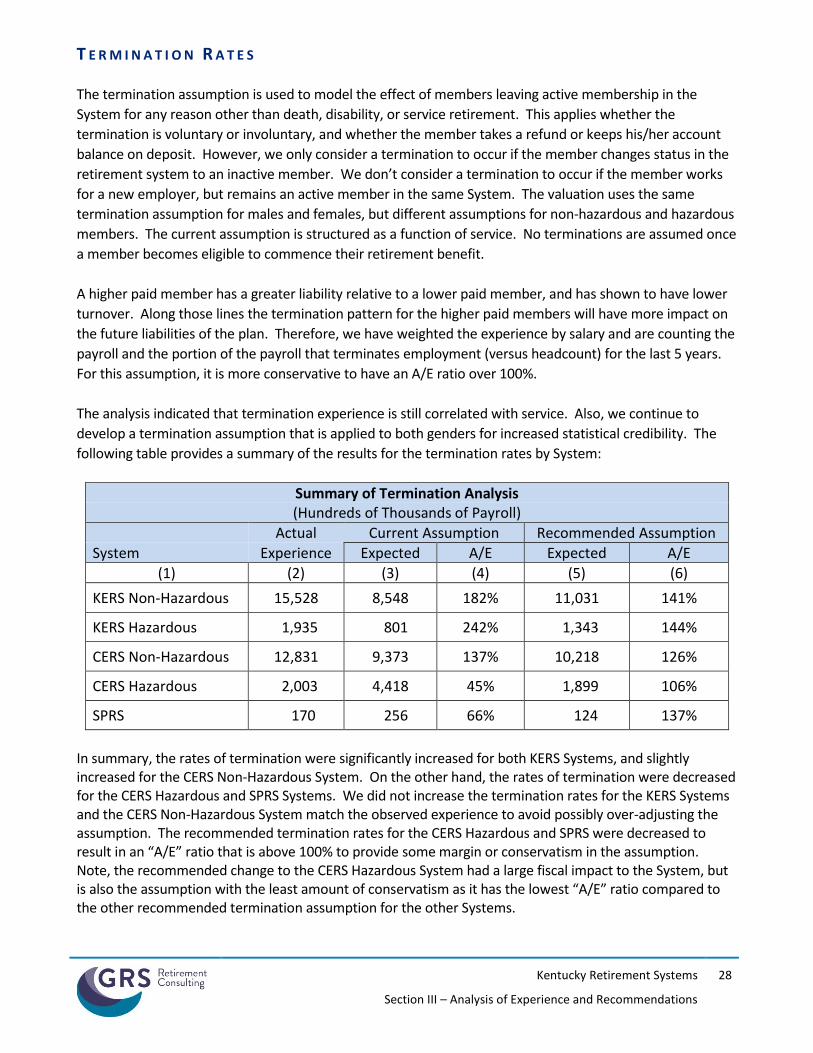
The analysis indicated that termination experience is still correlated with service. Also, we continue to
develop a termination assumption that is applied to both genders for increased statistical credibility. The
following table provides a summary of the results for the termination rates by System:
Summary of Termination Analysis (Hundreds of Thousands of Payroll)
Actual Current Assumption Recommended Assumption
System Experience Expected A/E Expected A/E
(1) (2) (3) (4) (5) (6)
KERS Non-Hazardous 15,528 8,548 182% 11,031 141%
KERS Hazardous 1,935 801 242% 1,343 144%
CERS Non-Hazardous 12,831 9,373 137% 10,218 126%
CERS Hazardous 2,003 4,418 45% 1,899 106%
SPRS 170 256 66% 124 137%
In summary, the rates of termination were significantly increased for both KERS Systems, and slightly increased for the CERS Non-Hazardous System. On the other hand, the rates of termination were decreased for the CERS Hazardous and SPRS Systems. We did not increase the termination rates for the KERS Systems and the CERS Non-Hazardous System match the observed experience to avoid possibly over-adjusting the assumption. The recommended termination rates for the CERS Hazardous and SPRS were decreased to result in an “A/E” ratio that is above 100% to provide some margin or conservatism in the assumption. Note, the recommended change to the CERS Hazardous System had a large fiscal impact to the System, but is also the assumption with the least amount of conservatism as it has the lowest “A/E” ratio compared to the other recommended termination assumption for the other Systems.
Kentucky Retirement Systems
Section III – Analysis of Experience and Recommendations
29
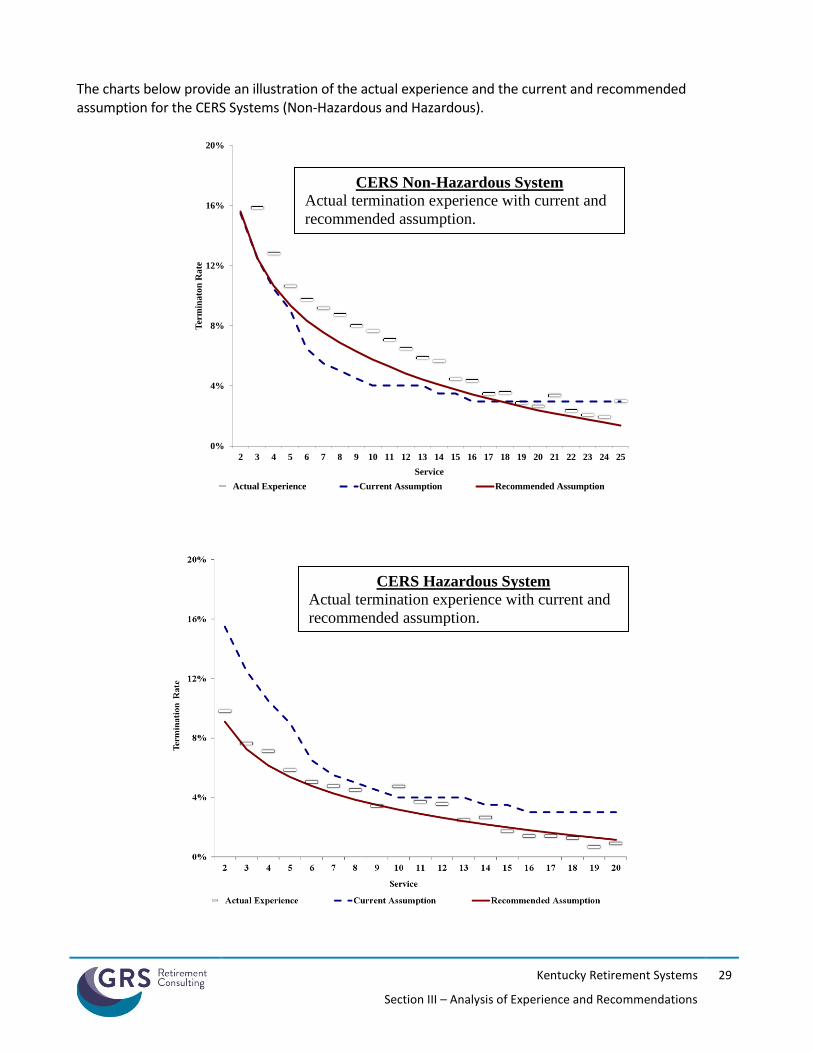
The charts below provide an illustration of the actual experience and the current and recommended assumption for the CERS Systems (Non-Hazardous and Hazardous).
0%
4%
8%
12%
16%
20%
2 3 4 5 6 7 8 9 10 11 12 13 14 15 16 17 18 19 20 21 22 23 24 25
Ter
min
ato
n R
ate
Service
Actual Experience Current Assumption Recommended Assumption
CERS Non-Hazardous System
Actual termination experience with current and
recommended assumption.
CERS Hazardous System
Actual termination experience with current and
recommended assumption.
Kentucky Retirement Systems
Section III – Analysis of Experience and Recommendations
30
Details of the termination experience are provided in Section VIII on pages 83-87. Note, since active membership deaths were included in the termination data for the experience prior to June 30, 2016, we performed the analysis treating all active deaths as terminations and then the recommended termination rates will be adjusted (i.e. reduced) in the model by the pre-retirement mortality probabilities so as not to double count the decrements.
Refund of Member Contribution Balance If a member terminates employment with a vested benefit but prior to their retirement age, they may keep their member contributions in the System and receive a monthly annuity when they reach their eligible retirement age or withdrawal their member contributions at any time and forfeit the monthly annuity. Currently, the valuation assumes that members in each System will refund their contributions if the value of their member contributions exceeds the value of their deferred monthly retirement benefit. We recommend no change to this assumption.
R E T I R E M E N T R A T E S The retirement rates are used to model when an employee will commence their retirement allowance. The current retirement assumption is the same for males and females, but vary for Non-Hazardous and Hazardous members. Also, there is a variation in the retirement assumption for Tier 1 members whose participation date is before September 1, 2008 and for members whose participation date is on and after September 1, 2008 due to differences in retirement benefits.
For this analysis we have weighted the experience by the member’s benefit. Thus, the retirement pattern for the members with a greater benefit will have a larger impact on the future liabilities of the plan. For this assumption, it is more conservative to have an A/E ratio less 100%, however, it is still reasonable to have an A/E ratio greater than 100% if there is reason to believe that future retirement experience will be different than the experience period reviewed. Below are comments regarding the recommended retirement assumption for members with a participation date before July 1, 2003 for each System. KERS Non-Hazardous System We recommend the continued use of an age based assumption, but the experience for males and females were sufficiently different for us to recommend the use of gender-distinct retirement assumption. We are recommending a decrease in the retirement rates below age 65 for males and females, but are recommending higher retirement rates at and above age 65. We are also recommending a slight decrease in the retirement rates for members (males and females) electing an early retirement. Overall this change will slightly increase the expected average retirement age from age 57 to age 58 for males and from age 56 to age 57 for females. KERS Hazardous System We recommend continued use of the service based assumption and the use of the same retirement assumption for males and females. We also recommend an increase in the retirement rate when a member attains 20 years of service, but a decrease retirement rate when the member has more than 20 years of service. Overall this will slightly decrease the average age a member is expected to retire by approximately a half year.
Kentucky Retirement Systems
Section III – Analysis of Experience and Recommendations
31
CERS Non-Hazardous System We recommend the continued use of an age based assumption. The experience for males and females was sufficiently different that we are recommending the use of gender-distinct retirement assumption. We are recommending an increase in the retirement rates below age 50 and above age 65 for males. We are also recommending a decrease in the retirement rates below age 62 and an increase in the retirement rates at and above age 62 for females. Finally, we are also recommending a slight decrease in the retirement rates for members (males and females) electing an early retirement. Overall this change will slightly change the expected average retirement age for males and increase the female expected average retirement age for approximately one year to age 61. CERS Hazardous System We recommend continued use of the service based assumption and the use of the same retirement assumption for males and females. We also recommend an increase in the retirement rate when a member attains 20 years of service, but a slight decrease in the retirement assumption when the member has more than 20 years of service. The recommended update will result in a minimal change in the expected retirement age. SPRS We recommend no change to the retirement rates for members with a participation date prior to July 1, 2003. We are recommending an adjustment to the retirement rates for members with a participation date on or after July 1, 2003 (discussed below).
Adjustment to Retirement Rates for Members Participating in KRS on or after July 1, 2003 Members with a participation date on or after July 1, 2003, receive a relatively less generous pre-age 65 health insurance benefit compared to the benefit provided to members who become participants prior to July 1, 2003. Therefore we recommend using a different retirement assumption to reflect an expectation that these members will retire at slightly later ages. Specifically, for members with a participation date on or after July 1, 2003 we are recommending that the retirement rates at each age (or service) below the maximum retirement age are 80% of the recommended retirement rates that are developed for the members with a participation date prior to July 1, 2003. Please note that we must rely on our professional judgement regarding this recommended adjustment as it will be many years into the future before there is sufficient experience to analyze their actual retirement pattern. The new rates are shown in Sections V, VI, and VII.
R E T I R E E M E D I C A L P A R T I C I P A T I O N A retiree’s participation in the health insurance plan is voluntary, not mandatory. Some retirees may not elect to be covered, especially if they have coverage through a spouse or a previous employer. As a result, it is relevant to make an assumption regarding the number of future retirees that will elect to participate in the retiree health insurance plan. It may be relevant to take into consideration the design of the health insurance plan when selecting this assumption as eligibility, plan choices, and retiree contribution requirements may affect a retiree’s decision to participate in the health insurance plan. The current assumption is a service based assumption, which is logical since the retiree’s cost subsidy increases as their service at retirement increases. The table on the following page summarizes the current participation assumption.
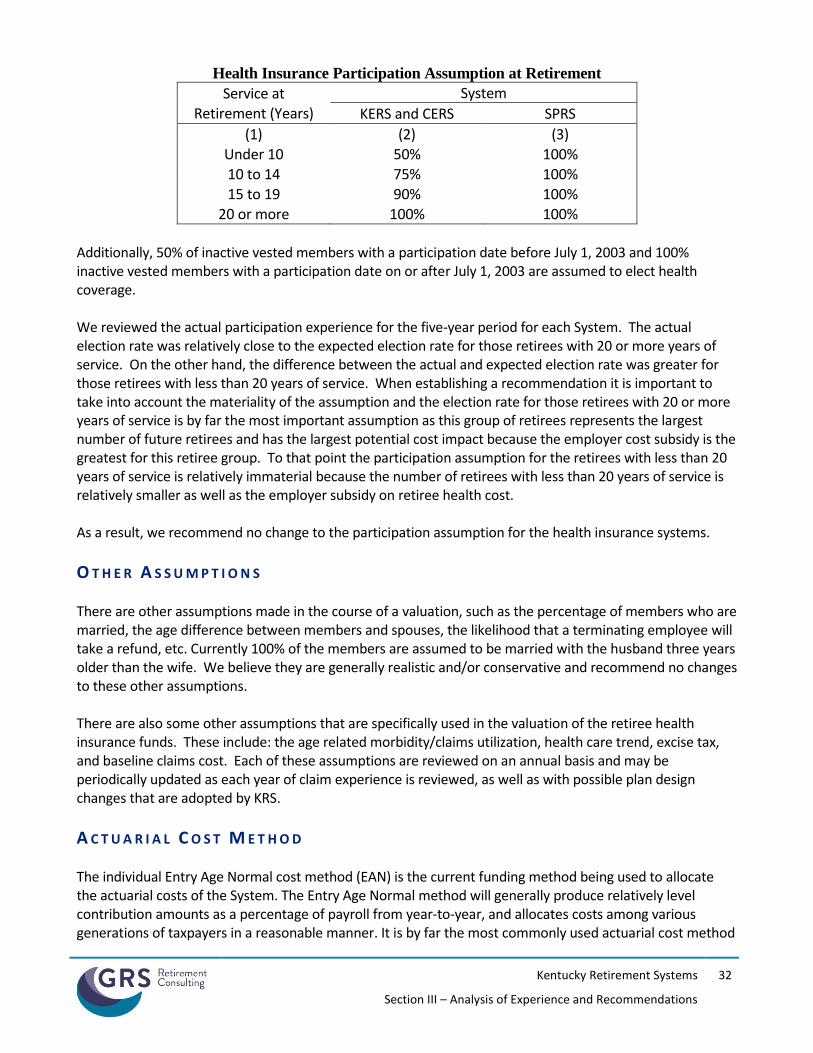
Kentucky Retirement Systems
Section III – Analysis of Experience and Recommendations
32
Health Insurance Participation Assumption at Retirement
Service at
Retirement (Years)
System
KERS and CERS SPRS
(1) (2) (3) Under 10 50% 100% 10 to 14 75% 100% 15 to 19 90% 100%
20 or more 100% 100% Additionally, 50% of inactive vested members with a participation date before July 1, 2003 and 100% inactive vested members with a participation date on or after July 1, 2003 are assumed to elect health coverage. We reviewed the actual participation experience for the five-year period for each System. The actual election rate was relatively close to the expected election rate for those retirees with 20 or more years of service. On the other hand, the difference between the actual and expected election rate was greater for those retirees with less than 20 years of service. When establishing a recommendation it is important to take into account the materiality of the assumption and the election rate for those retirees with 20 or more years of service is by far the most important assumption as this group of retirees represents the largest number of future retirees and has the largest potential cost impact because the employer cost subsidy is the greatest for this retiree group. To that point the participation assumption for the retirees with less than 20 years of service is relatively immaterial because the number of retirees with less than 20 years of service is relatively smaller as well as the employer subsidy on retiree health cost. As a result, we recommend no change to the participation assumption for the health insurance systems.
O T H E R A S S U M P T I O N S There are other assumptions made in the course of a valuation, such as the percentage of members who are married, the age difference between members and spouses, the likelihood that a terminating employee will take a refund, etc. Currently 100% of the members are assumed to be married with the husband three years older than the wife. We believe they are generally realistic and/or conservative and recommend no changes to these other assumptions. There are also some other assumptions that are specifically used in the valuation of the retiree health insurance funds. These include: the age related morbidity/claims utilization, health care trend, excise tax, and baseline claims cost. Each of these assumptions are reviewed on an annual basis and may be periodically updated as each year of claim experience is reviewed, as well as with possible plan design changes that are adopted by KRS.
A C T U A R I A L C O S T M E T H O D The individual Entry Age Normal cost method (EAN) is the current funding method being used to allocate the actuarial costs of the System. The Entry Age Normal method will generally produce relatively level contribution amounts as a percentage of payroll from year-to-year, and allocates costs among various generations of taxpayers in a reasonable manner. It is by far the most commonly used actuarial cost method
Kentucky Retirement Systems
Section III – Analysis of Experience and Recommendations
33
for large public retirement systems. We continue to believe this is the most appropriate funding method and recommend no change.
For members who have correlated service with another employer, the cost method will assume the member has no accrued liability at the date of hire and will accrue all benefits from the hire date with the current employer. Service from the other employers will be used in determining retirement eligibilities, but not in allocating the accruals over the career of the employee.
A C T U A R I A L A S S E T M E T H O D The current method for developing the actuarial value of assets is based on a five-year asset smoothing method that will identify each year’s investment gain or loss on a market value of asset basis, and recognize that amount at the rate of 20% per year. Under this method, an investment gain or loss that occurs in a particular year will be fully recognized in the actuarial value of assets after five years. This asset method is also the most common asset valuation method used by large public retirement systems. We recommend continued use of this asset smoothing method. However, we recommend a modification to the presentation of the smoothing method calculations in the valuation report to be consistent with the format that is commonly used by other Systems for increased transparency and comparability to stakeholders. This modification will not have a cost impact.

SECTION IV
ACTUARIAL IMPACT OF RECOMMENDATIONS
Fiscal Impact – KERS ($ thousands)
Kentucky Retirement Systems
Section III – Analysis of Experience and Recommendations
35
The following pages provide the actuarial impact of the recommended assumptions for each retirement system based on the June 30, 2018 actuarial valuation. In actuality, these recommended assumptions will be first used when preparing the June 30, 2019 actuarial valuation, which identifies the employer contribution requirements for the biennium period beginning July 1, 2020 and ending June 30, 2022 (FYE 2020/2021 and FYE 2022/2022). For informational purposes, the tables show the changes in the contribution requirement, unfunded actuarial accrued liability, and funded ratio due to the recommended assumption changes. The exhibits identify the financial effect due to the change in mortality, individual salary increase assumption, and all other recommended assumptions. The mortality assumption and individual salary increase assumption are illustrated separately so stakeholders can identify the financial impact of these individual assumption changes on the liability and contributions. We believe the Board’s decision about whether or not to adopt our recommendations should be based on the collective effect on the contribution rate or the actuarial liabilities. Stated another way, we do not recommend changes in individual assumptions be selectively picked based on their financial impact.
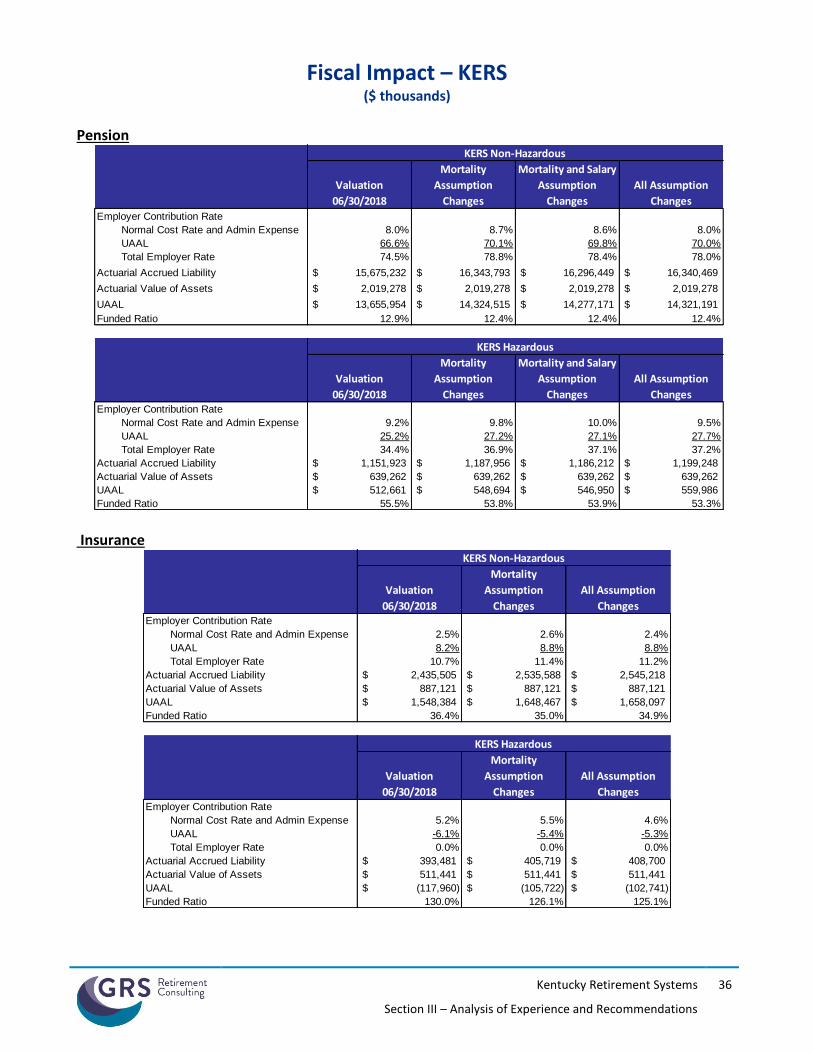
Fiscal Impact – KERS ($ thousands)
Kentucky Retirement Systems
Section III – Analysis of Experience and Recommendations
36
Pension
Insurance
Valuation
06/30/2018
Mortality
Assumption
Changes
Mortality and Salary
Assumption
Changes
All Assumption
Changes
Employer Contribution Rate
Normal Cost Rate and Admin Expense 8.0% 8.7% 8.6% 8.0%
UAAL 66.6% 70.1% 69.8% 70.0%
Total Employer Rate 74.5% 78.8% 78.4% 78.0%
Actuarial Accrued Liability 15,675,232$ 16,343,793$ 16,296,449$ 16,340,469$
Actuarial Value of Assets 2,019,278$ 2,019,278$ 2,019,278$ 2,019,278$
UAAL 13,655,954$ 14,324,515$ 14,277,171$ 14,321,191$
Funded Ratio 12.9% 12.4% 12.4% 12.4%
Valuation
06/30/2018
Mortality
Assumption
Changes
Mortality and Salary
Assumption
Changes
All Assumption
ChangesEmployer Contribution Rate
Normal Cost Rate and Admin Expense 9.2% 9.8% 10.0% 9.5%
UAAL 25.2% 27.2% 27.1% 27.7%
Total Employer Rate 34.4% 36.9% 37.1% 37.2%
Actuarial Accrued Liability 1,151,923$ 1,187,956$ 1,186,212$ 1,199,248$
Actuarial Value of Assets 639,262$ 639,262$ 639,262$ 639,262$
UAAL 512,661$ 548,694$ 546,950$ 559,986$
Funded Ratio 55.5% 53.8% 53.9% 53.3%
KERS Non-Hazardous
KERS Hazardous
Valuation
06/30/2018
Mortality
Assumption
Changes
All Assumption
ChangesEmployer Contribution Rate
Normal Cost Rate and Admin Expense 2.5% 2.6% 2.4%
UAAL 8.2% 8.8% 8.8%
Total Employer Rate 10.7% 11.4% 11.2%
Actuarial Accrued Liability 2,435,505$ 2,535,588$ 2,545,218$
Actuarial Value of Assets 887,121$ 887,121$ 887,121$
UAAL 1,548,384$ 1,648,467$ 1,658,097$
Funded Ratio 36.4% 35.0% 34.9%
Valuation
06/30/2018
Mortality
Assumption
Changes
All Assumption
ChangesEmployer Contribution Rate
Normal Cost Rate and Admin Expense 5.2% 5.5% 4.6%
UAAL -6.1% -5.4% -5.3%
Total Employer Rate 0.0% 0.0% 0.0%
Actuarial Accrued Liability 393,481$ 405,719$ 408,700$
Actuarial Value of Assets 511,441$ 511,441$ 511,441$
UAAL (117,960)$ (105,722)$ (102,741)$
Funded Ratio 130.0% 126.1% 125.1%
KERS Hazardous
KERS Non-Hazardous
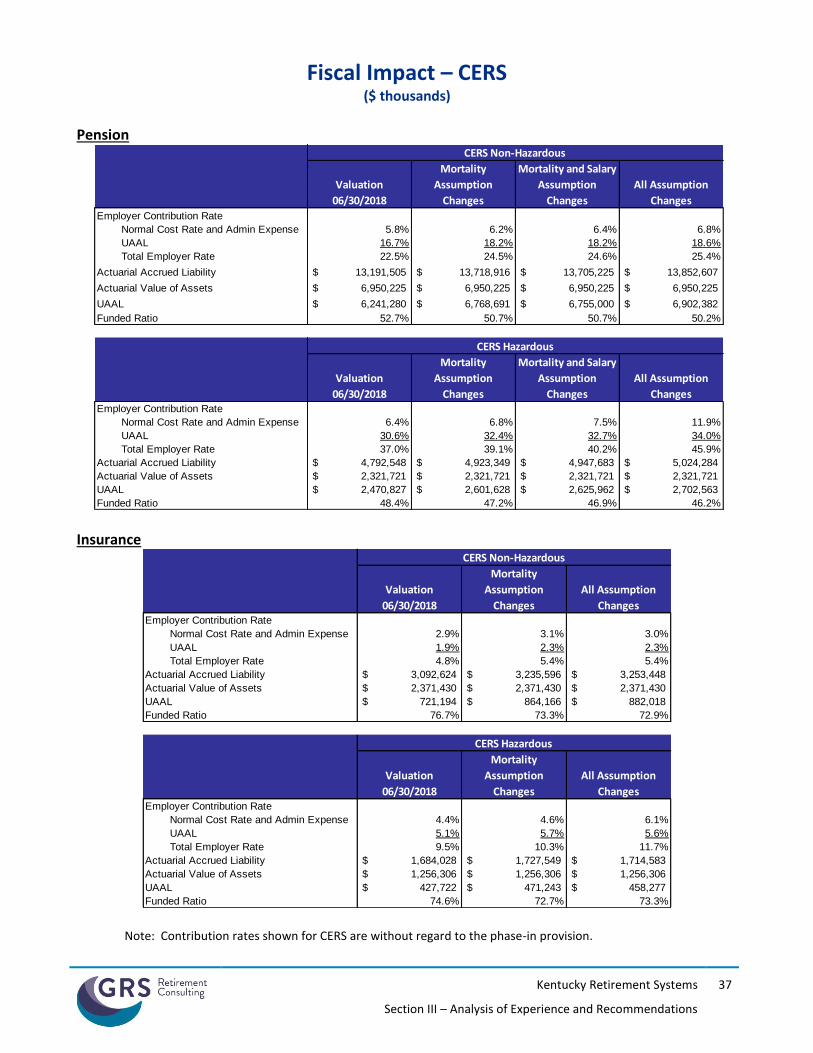
Fiscal Impact – CERS ($ thousands)
Kentucky Retirement Systems
Section III – Analysis of Experience and Recommendations
37
Pension
Insurance
Note: Contribution rates shown for CERS are without regard to the phase-in provision.
Valuation
06/30/2018
Mortality
Assumption
Changes
Mortality and Salary
Assumption
Changes
All Assumption
Changes
Employer Contribution Rate
Normal Cost Rate and Admin Expense 5.8% 6.2% 6.4% 6.8%
UAAL 16.7% 18.2% 18.2% 18.6%
Total Employer Rate 22.5% 24.5% 24.6% 25.4%
Actuarial Accrued Liability 13,191,505$ 13,718,916$ 13,705,225$ 13,852,607$
Actuarial Value of Assets 6,950,225$ 6,950,225$ 6,950,225$ 6,950,225$
UAAL 6,241,280$ 6,768,691$ 6,755,000$ 6,902,382$
Funded Ratio 52.7% 50.7% 50.7% 50.2%
Valuation
06/30/2018
Mortality
Assumption
Changes
Mortality and Salary
Assumption
Changes
All Assumption
ChangesEmployer Contribution Rate
Normal Cost Rate and Admin Expense 6.4% 6.8% 7.5% 11.9%
UAAL 30.6% 32.4% 32.7% 34.0%
Total Employer Rate 37.0% 39.1% 40.2% 45.9%
Actuarial Accrued Liability 4,792,548$ 4,923,349$ 4,947,683$ 5,024,284$
Actuarial Value of Assets 2,321,721$ 2,321,721$ 2,321,721$ 2,321,721$
UAAL 2,470,827$ 2,601,628$ 2,625,962$ 2,702,563$
Funded Ratio 48.4% 47.2% 46.9% 46.2%
CERS Non-Hazardous
CERS Hazardous
Valuation
06/30/2018
Mortality
Assumption
Changes
All Assumption
ChangesEmployer Contribution Rate
Normal Cost Rate and Admin Expense 2.9% 3.1% 3.0%
UAAL 1.9% 2.3% 2.3%
Total Employer Rate 4.8% 5.4% 5.4%
Actuarial Accrued Liability 3,092,624$ 3,235,596$ 3,253,448$
Actuarial Value of Assets 2,371,430$ 2,371,430$ 2,371,430$
UAAL 721,194$ 864,166$ 882,018$
Funded Ratio 76.7% 73.3% 72.9%
Valuation
06/30/2018
Mortality
Assumption
Changes
All Assumption
ChangesEmployer Contribution Rate
Normal Cost Rate and Admin Expense 4.4% 4.6% 6.1%
UAAL 5.1% 5.7% 5.6%
Total Employer Rate 9.5% 10.3% 11.7%
Actuarial Accrued Liability 1,684,028$ 1,727,549$ 1,714,583$
Actuarial Value of Assets 1,256,306$ 1,256,306$ 1,256,306$
UAAL 427,722$ 471,243$ 458,277$
Funded Ratio 74.6% 72.7% 73.3%
CERS Non-Hazardous
CERS Hazardous
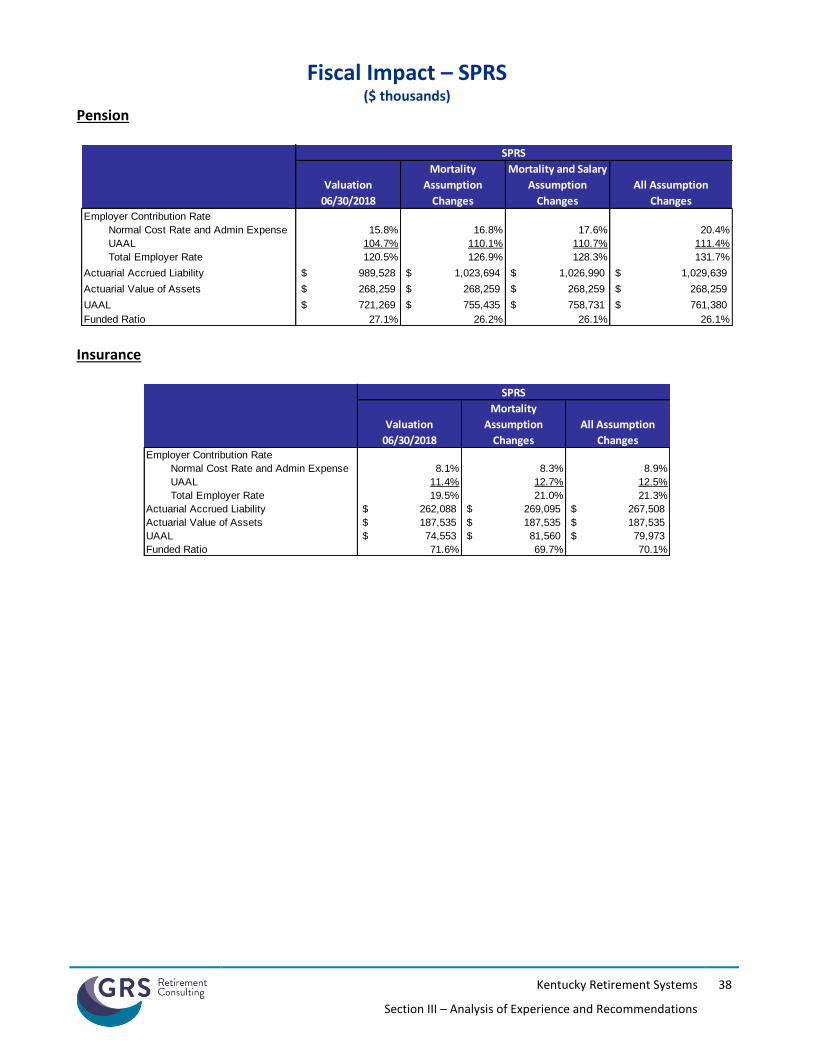
Fiscal Impact – SPRS ($ thousands)
Kentucky Retirement Systems
Section III – Analysis of Experience and Recommendations
38
Pension
Insurance
Valuation
06/30/2018
Mortality
Assumption
Changes
Mortality and Salary
Assumption
Changes
All Assumption
Changes
Employer Contribution Rate
Normal Cost Rate and Admin Expense 15.8% 16.8% 17.6% 20.4%
UAAL 104.7% 110.1% 110.7% 111.4%
Total Employer Rate 120.5% 126.9% 128.3% 131.7%
Actuarial Accrued Liability 989,528$ 1,023,694$ 1,026,990$ 1,029,639$
Actuarial Value of Assets 268,259$ 268,259$ 268,259$ 268,259$
UAAL 721,269$ 755,435$ 758,731$ 761,380$
Funded Ratio 27.1% 26.2% 26.1% 26.1%
SPRS
Valuation
06/30/2018
Mortality
Assumption
Changes
All Assumption
ChangesEmployer Contribution Rate
Normal Cost Rate and Admin Expense 8.1% 8.3% 8.9%
UAAL 11.4% 12.7% 12.5%
Total Employer Rate 19.5% 21.0% 21.3%
Actuarial Accrued Liability 262,088$ 269,095$ 267,508$
Actuarial Value of Assets 187,535$ 187,535$ 187,535$
UAAL 74,553$ 81,560$ 79,973$
Funded Ratio 71.6% 69.7% 70.1%
SPRS

SECTION V
SUMMARY OF NEW ASSUMPTIONS – KERS
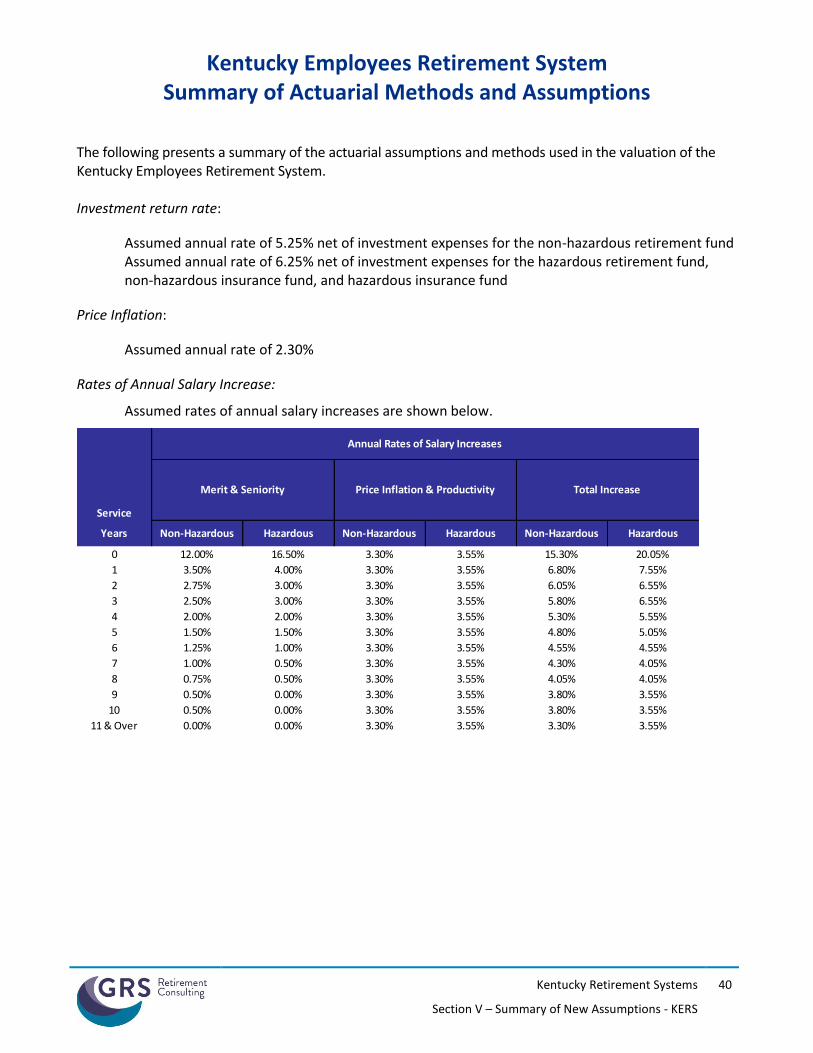
Kentucky Employees Retirement System
Summary of Actuarial Methods and Assumptions
Kentucky Retirement Systems
Section V – Summary of New Assumptions - KERS
40
The following presents a summary of the actuarial assumptions and methods used in the valuation of the Kentucky Employees Retirement System. Investment return rate:
Assumed annual rate of 5.25% net of investment expenses for the non-hazardous retirement fund Assumed annual rate of 6.25% net of investment expenses for the hazardous retirement fund, non-hazardous insurance fund, and hazardous insurance fund
Price Inflation:
Assumed annual rate of 2.30%
Rates of Annual Salary Increase:
Assumed rates of annual salary increases are shown below.
Service
Years Non-Hazardous Hazardous Non-Hazardous Hazardous Non-Hazardous Hazardous
0 12.00% 16.50% 3.30% 3.55% 15.30% 20.05%
1 3.50% 4.00% 3.30% 3.55% 6.80% 7.55%
2 2.75% 3.00% 3.30% 3.55% 6.05% 6.55%
3 2.50% 3.00% 3.30% 3.55% 5.80% 6.55%
4 2.00% 2.00% 3.30% 3.55% 5.30% 5.55%
5 1.50% 1.50% 3.30% 3.55% 4.80% 5.05%
6 1.25% 1.00% 3.30% 3.55% 4.55% 4.55%
7 1.00% 0.50% 3.30% 3.55% 4.30% 4.05%
8 0.75% 0.50% 3.30% 3.55% 4.05% 4.05%
9 0.50% 0.00% 3.30% 3.55% 3.80% 3.55%
10 0.50% 0.00% 3.30% 3.55% 3.80% 3.55%
11 & Over 0.00% 0.00% 3.30% 3.55% 3.30% 3.55%
Price Inflation & Productivity
Annual Rates of Salary Increases
Merit & Seniority Total Increase
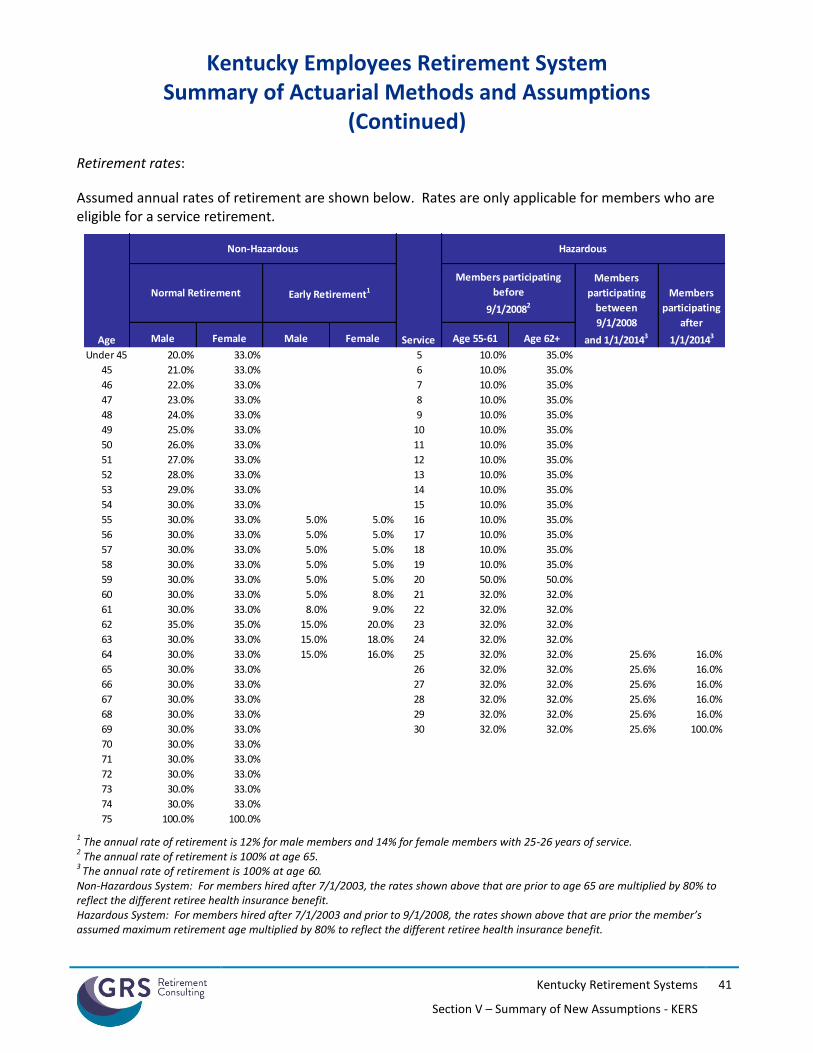
Kentucky Employees Retirement System
Summary of Actuarial Methods and Assumptions (Continued)
Kentucky Retirement Systems
Section V – Summary of New Assumptions - KERS
41
Retirement rates:
Assumed annual rates of retirement are shown below. Rates are only applicable for members who are eligible for a service retirement.
1 The annual rate of retirement is 12% for male members and 14% for female members with 25-26 years of service.
2 The annual rate of retirement is 100% at age 65.
3 The annual rate of retirement is 100% at age 60.
Non-Hazardous System: For members hired after 7/1/2003, the rates shown above that are prior to age 65 are multiplied by 80% to reflect the different retiree health insurance benefit. Hazardous System: For members hired after 7/1/2003 and prior to 9/1/2008, the rates shown above that are prior the member’s assumed maximum retirement age multiplied by 80% to reflect the different retiree health insurance benefit.
Male Female Male Female Age 55-61 Age 62+
Under 45 20.0% 33.0% 5 10.0% 35.0%
45 21.0% 33.0% 6 10.0% 35.0%
46 22.0% 33.0% 7 10.0% 35.0%
47 23.0% 33.0% 8 10.0% 35.0%
48 24.0% 33.0% 9 10.0% 35.0%
49 25.0% 33.0% 10 10.0% 35.0%
50 26.0% 33.0% 11 10.0% 35.0%
51 27.0% 33.0% 12 10.0% 35.0%
52 28.0% 33.0% 13 10.0% 35.0%
53 29.0% 33.0% 14 10.0% 35.0%
54 30.0% 33.0% 15 10.0% 35.0%
55 30.0% 33.0% 5.0% 5.0% 16 10.0% 35.0%
56 30.0% 33.0% 5.0% 5.0% 17 10.0% 35.0%
57 30.0% 33.0% 5.0% 5.0% 18 10.0% 35.0%
58 30.0% 33.0% 5.0% 5.0% 19 10.0% 35.0%
59 30.0% 33.0% 5.0% 5.0% 20 50.0% 50.0%
60 30.0% 33.0% 5.0% 8.0% 21 32.0% 32.0%
61 30.0% 33.0% 8.0% 9.0% 22 32.0% 32.0%
62 35.0% 35.0% 15.0% 20.0% 23 32.0% 32.0%
63 30.0% 33.0% 15.0% 18.0% 24 32.0% 32.0%
64 30.0% 33.0% 15.0% 16.0% 25 32.0% 32.0% 25.6% 16.0%
65 30.0% 33.0% 26 32.0% 32.0% 25.6% 16.0%
66 30.0% 33.0% 27 32.0% 32.0% 25.6% 16.0%
67 30.0% 33.0% 28 32.0% 32.0% 25.6% 16.0%
68 30.0% 33.0% 29 32.0% 32.0% 25.6% 16.0%
69 30.0% 33.0% 30 32.0% 32.0% 25.6% 100.0%
70 30.0% 33.0%
71 30.0% 33.0%
72 30.0% 33.0%
73 30.0% 33.0%
74 30.0% 33.0%
75 100.0% 100.0%
Early Retirement1
Age
Non-Hazardous Hazardous
Service
Members participating
before
9/1/20082
Members
participating
after
1/1/20143
Members
participating
between
9/1/2008
and 1/1/20143
Normal Retirement
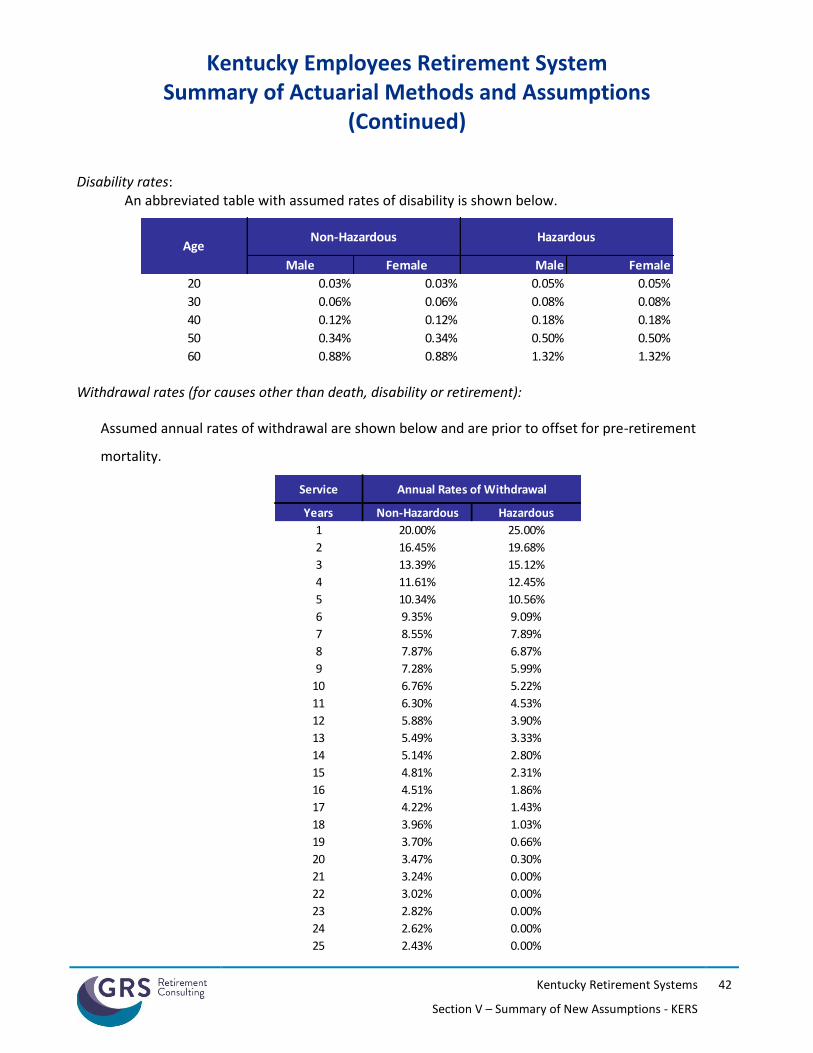
Kentucky Employees Retirement System
Summary of Actuarial Methods and Assumptions (Continued)
Kentucky Retirement Systems
Section V – Summary of New Assumptions - KERS
42
Disability rates:
An abbreviated table with assumed rates of disability is shown below.
Withdrawal rates (for causes other than death, disability or retirement):
Assumed annual rates of withdrawal are shown below and are prior to offset for pre-retirement
mortality.
Male Female Male Female
20 0.03% 0.03% 0.05% 0.05%
30 0.06% 0.06% 0.08% 0.08%
40 0.12% 0.12% 0.18% 0.18%
50 0.34% 0.34% 0.50% 0.50%
60 0.88% 0.88% 1.32% 1.32%
HazardousAge
Non-Hazardous
Service
Years Non-Hazardous Hazardous
1 20.00% 25.00%
2 16.45% 19.68%
3 13.39% 15.12%
4 11.61% 12.45%
5 10.34% 10.56%
6 9.35% 9.09%
7 8.55% 7.89%
8 7.87% 6.87%
9 7.28% 5.99%
10 6.76% 5.22%
11 6.30% 4.53%
12 5.88% 3.90%
13 5.49% 3.33%
14 5.14% 2.80%
15 4.81% 2.31%
16 4.51% 1.86%
17 4.22% 1.43%
18 3.96% 1.03%
19 3.70% 0.66%
20 3.47% 0.30%
21 3.24% 0.00%
22 3.02% 0.00%
23 2.82% 0.00%
24 2.62% 0.00%
25 2.43% 0.00%
Annual Rates of Withdrawal
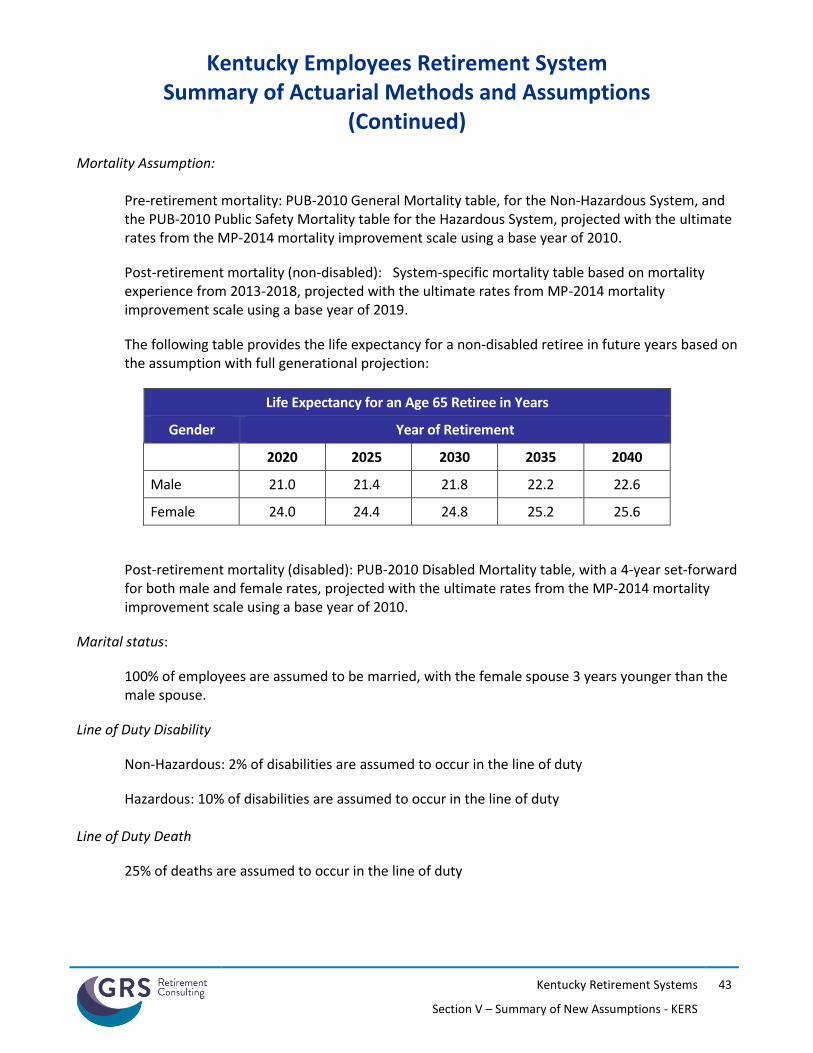
Kentucky Employees Retirement System
Summary of Actuarial Methods and Assumptions (Continued)
Kentucky Retirement Systems
Section V – Summary of New Assumptions - KERS
43
Mortality Assumption:
Pre-retirement mortality: PUB-2010 General Mortality table, for the Non-Hazardous System, and the PUB-2010 Public Safety Mortality table for the Hazardous System, projected with the ultimate rates from the MP-2014 mortality improvement scale using a base year of 2010.
Post-retirement mortality (non-disabled): System-specific mortality table based on mortality experience from 2013-2018, projected with the ultimate rates from MP-2014 mortality improvement scale using a base year of 2019.
The following table provides the life expectancy for a non-disabled retiree in future years based on the assumption with full generational projection:
Life Expectancy for an Age 65 Retiree in Years
Gender Year of Retirement
2020 2025 2030 2035 2040
Male 21.0 21.4 21.8 22.2 22.6
Female 24.0 24.4 24.8 25.2 25.6
Post-retirement mortality (disabled): PUB-2010 Disabled Mortality table, with a 4-year set-forward for both male and female rates, projected with the ultimate rates from the MP-2014 mortality improvement scale using a base year of 2010.
Marital status:
100% of employees are assumed to be married, with the female spouse 3 years younger than the male spouse.
Line of Duty Disability
Non-Hazardous: 2% of disabilities are assumed to occur in the line of duty
Hazardous: 10% of disabilities are assumed to occur in the line of duty
Line of Duty Death
25% of deaths are assumed to occur in the line of duty

Kentucky Employees Retirement System
Summary of Actuarial Methods and Assumptions (Continued)
Kentucky Retirement Systems
Section V – Summary of New Assumptions - KERS
44
Dependent Children:
For members in the Hazardous Plan who receive a duty-related death benefit, the member is assumed to be survived by two dependent children, each age 6 with payments for 15 years.
Form of Payment:
Members are assumed to elect a life-only annuity at retirement.
Actuarial Cost Method:
Entry Age Normal, Level Percentage of Pay. The Entry Age Normal actuarial cost method allocates the System’s actuarial present value of future benefits to various periods based upon service. The portion of the present value of future benefits allocated to years of service prior to the valuation date is the actuarial accrued liability, and the portion allocated to years following the valuation date is the present value of future normal costs. The normal cost is determined for each active member as the level percent of pay necessary to fully fund the expected benefits to be earned over the career of each individual active member. The normal cost is partially funded with active member contributions with the remainder funded by employer contributions.
Health Care Age Related Morbidity/Claims Utilization:
To model the impact of aging on the underlying health care costs for Medicare retirees, the valuation relied on the Society of Actuaries’ 2013 Study “Health Care Costs – From Birth to Death”. Table 4 (Development of Plan Specific Medicare Age Curve) was used to model the impact of aging for ages 65 and over.

Kentucky Employees Retirement System
Summary of Actuarial Methods and Assumptions (Continued)
Kentucky Retirement Systems
Section V – Summary of New Assumptions - KERS
45
Health Care Cost Trend Rates1:
January 1
Non-Medicare Plans
Medicare Plans
Dollar Contribution2
2020 7.00% 5.00% 1.50%
2021 6.75% 4.90% 1.50%
2022 6.50% 4.80% 1.50%
2023 6.25% 4.70% 1.50%
2024 6.00% 4.60% 1.50%
2025 5.75% 4.50% 1.50%
2026 5.50% 4.40% 1.50%
2027 5.25% 4.30% 1.50%
2028 5.00% 4.20% 1.50%
2029 4.75% 4.10% 1.50%
2030 4.50% 4.05% 1.50%
2031 4.25% 4.05% 1.50%
2032 & Beyond 4.05% 4.05% 1.50%
1All increases are assumed to occur on January 1. The 2019 premiums were known at the time of the valuation and were incorporated into the liability measurement. 2Applies to members participating on or after July 1, 2003
Health care trend assumptions are based on the model issued by the Society of Actuaries “Getzen model of Long-Run Medical Cost Trends for the SOA; Thomas E. Getzen, iHEA and Temple University 2014 © Society of Actuaries.
The underlying assumptions used to develop the health care trend rates include:
A short run period-this is a period for which anticipated health care trend rates are manually set based on local information as well as plan-specific and carrier information.
Long-term real GDP growth – 1.75%
Long-term rate of inflation – 2.30%
Long-term nominal GDP growth – 4.05%
Year that excess rate converges to 0 – 15 years from the valuation
Health care trend rates are thus the manually set rates for the short run period and rates which decline to an ultimate trend rate which equals the assumed nominal long-term GDP growth rate.
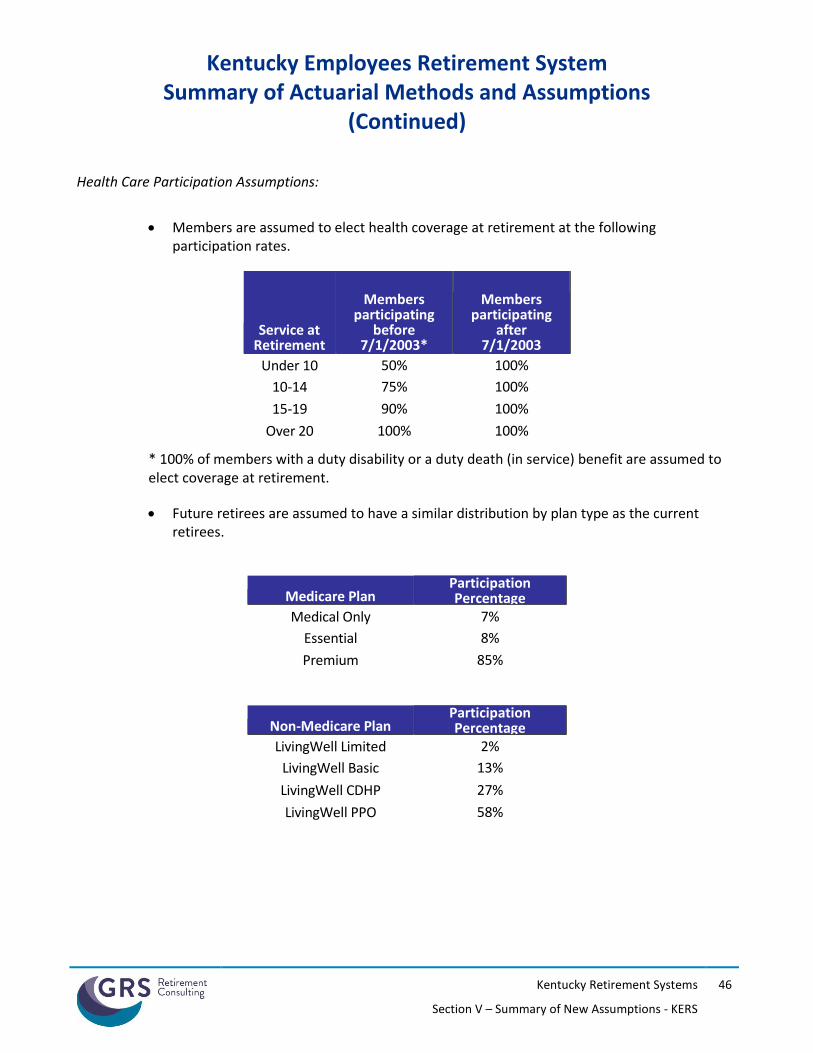
Kentucky Employees Retirement System
Summary of Actuarial Methods and Assumptions (Continued)
Kentucky Retirement Systems
Section V – Summary of New Assumptions - KERS
46
Health Care Participation Assumptions:
Members are assumed to elect health coverage at retirement at the following
participation rates.
Service at Retirement
Members participating
before 7/1/2003*
Members participating
after 7/1/2003
Under 10 50% 100%
10-14 75% 100%
15-19 90% 100%
Over 20 100% 100%
* 100% of members with a duty disability or a duty death (in service) benefit are assumed to elect coverage at retirement.
Future retirees are assumed to have a similar distribution by plan type as the current retirees.
Medicare Plan Participation Percentage
Medical Only 7%
Essential 8%
Premium 85%
Non-Medicare Plan Participation Percentage
LivingWell Limited 2%
LivingWell Basic 13%
LivingWell CDHP 27%
LivingWell PPO 58%

Kentucky Employees Retirement System
Summary of Actuarial Methods and Assumptions (Continued)
Kentucky Retirement Systems
Section V – Summary of New Assumptions - KERS
47
50% of deferred vested members participating before July 1, 2003 are assumed to elect health coverage at retirement. 100% of deferred vested members participating after July 1, 2003 are assumed to elect health coverage at retirement. Deferred vested members with non-hazardous service are assumed to begin health coverage at age 55 for members participating before September 1, 2008, and at age 60 for members participating on or after September 1, 2008. Deferred vested members with hazardous service are assumed to begin health coverage at age 50.
50% of future retirees, with hazardous service, are assumed to elect spouse health care coverage. No dependent coverage is assumed for members who only have non-hazardous service. 100% of spouses with health care coverage are assumed to continue coverage after the member’s death.
Excise (“Cadillac”) Tax:
For taxable years beginning after December 31, 2021, a 40% excise tax will be required to be paid (by the employer and/or insurer) on the aggregate cost of the health plan in excess of certain legislated thresholds. For 2018, the thresholds are $850 per month for individual coverage and $2,292 per month for family coverage. Both Actuarial Standard of Practice No. 6 and GASB Statement Nos. 74 and 75 reference this tax, and, in accordance with these standards an estimate of the impact of the Cadillac tax has been included in this valuation.
Assumptions and methods used to determine the impact of the Cadillac Tax include:
2018 thresholds of $850/$2,292 were indexed annually by 2.30%.
Premium data submitted was not adjusted for permissible exclusions to the Cadillac Tax.
There were no special adjustments to the dollar limit other than those permissible for non-Medicare retirees over 55.
In this valuation, the impact of the Cadillac Tax has been calculated by increasing the employer paid premiums for Non-Medicare retirees, who became participants before July 1, 2003, by 3.6%. Non-Medicare retirees who became participants after July 1, 2003 receive dollar subsidies per year of service, which are not expected to exceed the overall Non-Medicare premiums. As a result, the costs attributable to the Cadillac Tax for members who became participants after July 1, 2003 will be paid by the retirees.
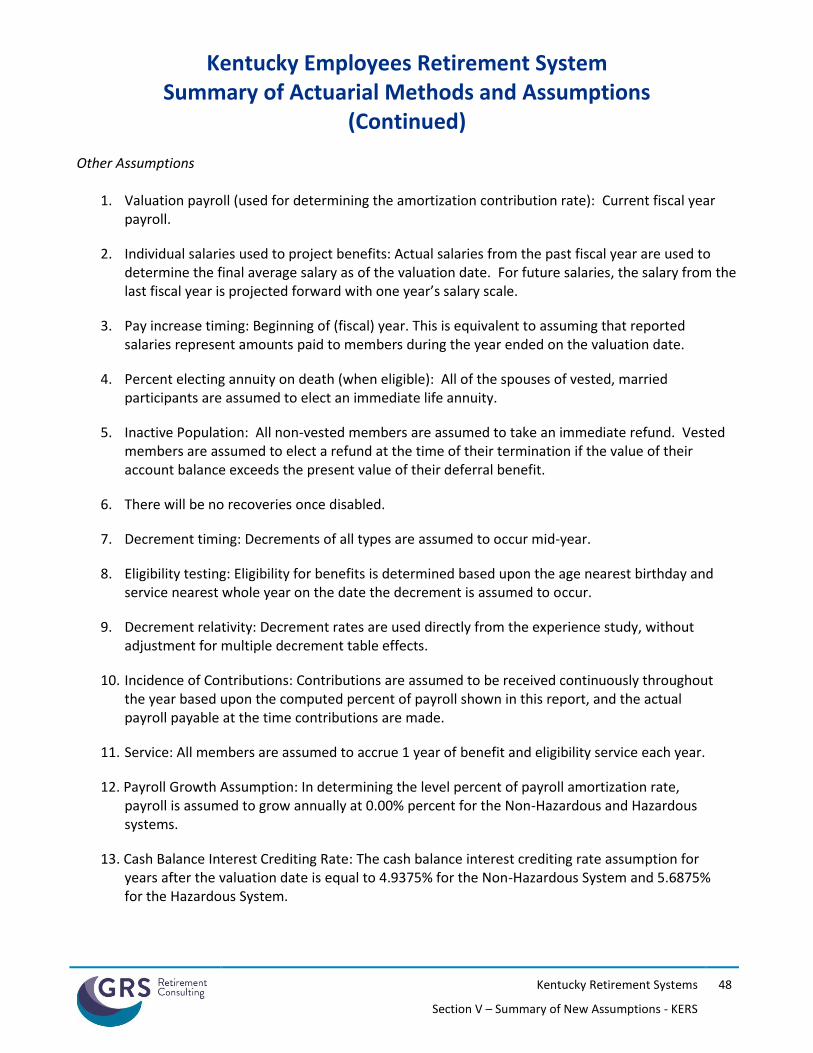
Kentucky Employees Retirement System
Summary of Actuarial Methods and Assumptions (Continued)
Kentucky Retirement Systems
Section V – Summary of New Assumptions - KERS
48
Other Assumptions
1. Valuation payroll (used for determining the amortization contribution rate): Current fiscal year payroll.
2. Individual salaries used to project benefits: Actual salaries from the past fiscal year are used to determine the final average salary as of the valuation date. For future salaries, the salary from the last fiscal year is projected forward with one year’s salary scale.
3. Pay increase timing: Beginning of (fiscal) year. This is equivalent to assuming that reported salaries represent amounts paid to members during the year ended on the valuation date.
4. Percent electing annuity on death (when eligible): All of the spouses of vested, married participants are assumed to elect an immediate life annuity.
5. Inactive Population: All non-vested members are assumed to take an immediate refund. Vested members are assumed to elect a refund at the time of their termination if the value of their account balance exceeds the present value of their deferral benefit.
6. There will be no recoveries once disabled.
7. Decrement timing: Decrements of all types are assumed to occur mid-year.
8. Eligibility testing: Eligibility for benefits is determined based upon the age nearest birthday and service nearest whole year on the date the decrement is assumed to occur.
9. Decrement relativity: Decrement rates are used directly from the experience study, without adjustment for multiple decrement table effects.
10. Incidence of Contributions: Contributions are assumed to be received continuously throughout the year based upon the computed percent of payroll shown in this report, and the actual payroll payable at the time contributions are made.
11. Service: All members are assumed to accrue 1 year of benefit and eligibility service each year.
12. Payroll Growth Assumption: In determining the level percent of payroll amortization rate, payroll is assumed to grow annually at 0.00% percent for the Non-Hazardous and Hazardous systems.
13. Cash Balance Interest Crediting Rate: The cash balance interest crediting rate assumption for years after the valuation date is equal to 4.9375% for the Non-Hazardous System and 5.6875% for the Hazardous System.
Kentucky Employees Retirement System
Summary of Actuarial Methods and Assumptions (Continued)
Kentucky Retirement Systems
Section V – Summary of New Assumptions - KERS
49
Participant Data
Participant data was supplied in electronic text files. There were separate files for (i) active and inactive members, and (ii) members and beneficiaries receiving benefits.
The data for active members included birthdate, gender, service with the current city and total vesting service, salary, and employee contribution account balances. For retired members and beneficiaries, the data included date of birth, gender, spouse's date of birth (where applicable), amount of monthly benefit, date of retirement, and form of payment code.
Salary supplied for the current year was based on the annualized earnings for the year preceding the valuation date.
Assumptions were made to correct for missing, bad, or inconsistent data. These had no material impact on the results presented.
Changes from the June 30, 2018 Valuation
Annual salary increases were updated based on the 2018 Experience Study
Annual rates of retirement, disability, withdrawal, and mortality were updated based on the 2018 Experience Study
The percent of disabilities assumed to occur in the line of duty was updated from 0% to 2% for non-hazardous members and 10% for hazardous members

SECTION VI
SUMMARY OF NEW ASSUMPTIONS – CERS
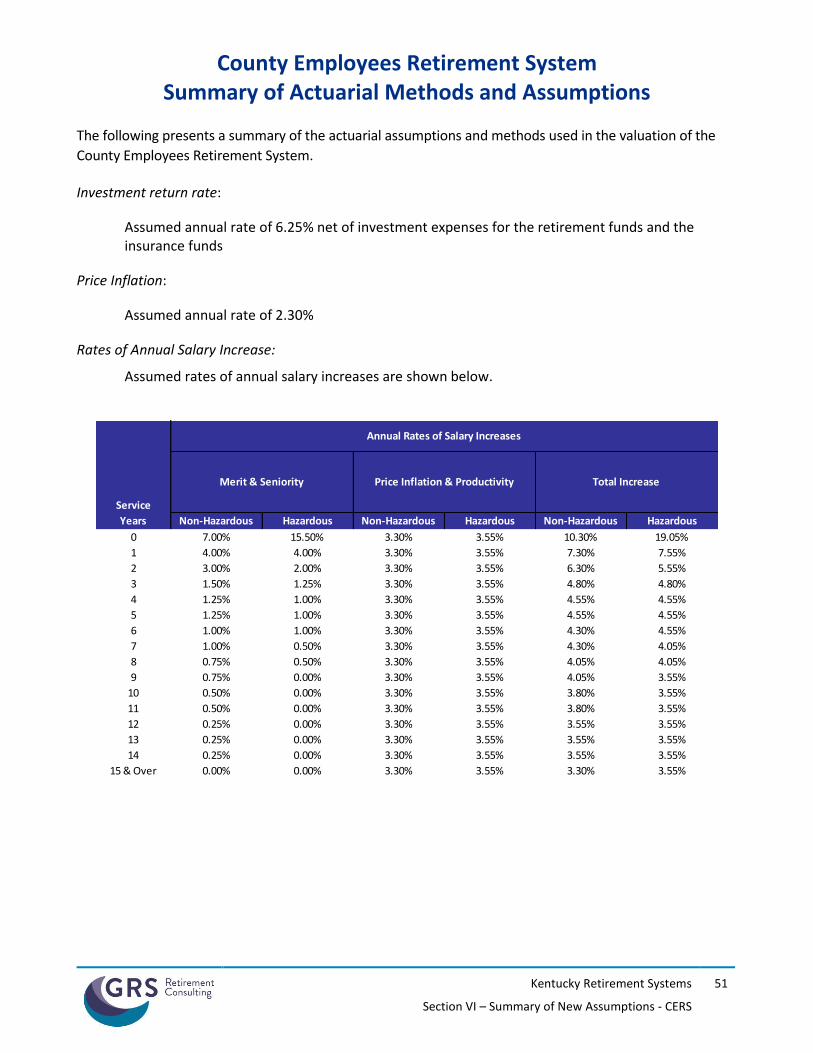
County Employees Retirement System
Summary of Actuarial Methods and Assumptions
Kentucky Retirement Systems
Section VI – Summary of New Assumptions - CERS
51
The following presents a summary of the actuarial assumptions and methods used in the valuation of the
County Employees Retirement System. Investment return rate:
Assumed annual rate of 6.25% net of investment expenses for the retirement funds and the insurance funds
Price Inflation:
Assumed annual rate of 2.30%
Rates of Annual Salary Increase:
Assumed rates of annual salary increases are shown below.
Service
Years Non-Hazardous Hazardous Non-Hazardous Hazardous Non-Hazardous Hazardous
0 7.00% 15.50% 3.30% 3.55% 10.30% 19.05%
1 4.00% 4.00% 3.30% 3.55% 7.30% 7.55%
2 3.00% 2.00% 3.30% 3.55% 6.30% 5.55%
3 1.50% 1.25% 3.30% 3.55% 4.80% 4.80%
4 1.25% 1.00% 3.30% 3.55% 4.55% 4.55%
5 1.25% 1.00% 3.30% 3.55% 4.55% 4.55%
6 1.00% 1.00% 3.30% 3.55% 4.30% 4.55%
7 1.00% 0.50% 3.30% 3.55% 4.30% 4.05%
8 0.75% 0.50% 3.30% 3.55% 4.05% 4.05%
9 0.75% 0.00% 3.30% 3.55% 4.05% 3.55%
10 0.50% 0.00% 3.30% 3.55% 3.80% 3.55%
11 0.50% 0.00% 3.30% 3.55% 3.80% 3.55%
12 0.25% 0.00% 3.30% 3.55% 3.55% 3.55%
13 0.25% 0.00% 3.30% 3.55% 3.55% 3.55%
14 0.25% 0.00% 3.30% 3.55% 3.55% 3.55%
15 & Over 0.00% 0.00% 3.30% 3.55% 3.30% 3.55%
Price Inflation & Productivity
Annual Rates of Salary Increases
Merit & Seniority Total Increase
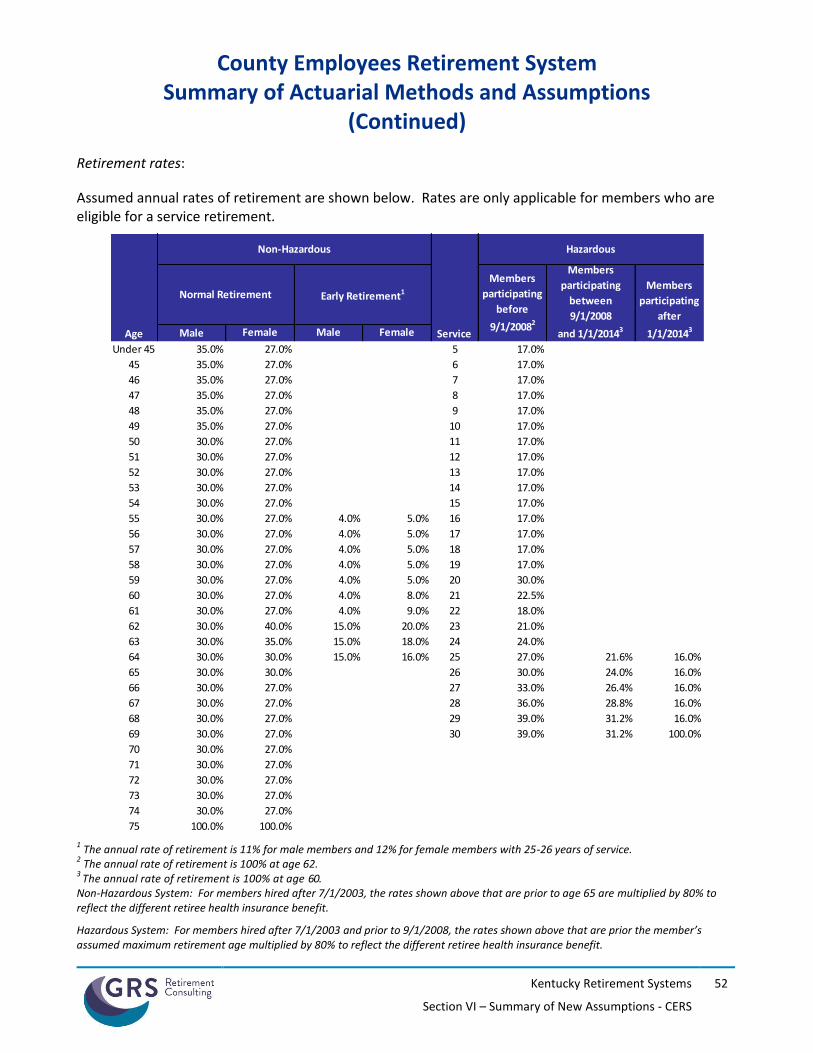
County Employees Retirement System
Summary of Actuarial Methods and Assumptions (Continued)
Kentucky Retirement Systems
Section VI – Summary of New Assumptions - CERS
52
Retirement rates:
Assumed annual rates of retirement are shown below. Rates are only applicable for members who are eligible for a service retirement.
1 The annual rate of retirement is 11% for male members and 12% for female members with 25-26 years of service.
2 The annual rate of retirement is 100% at age 62.
3 The annual rate of retirement is 100% at age 60.
Non-Hazardous System: For members hired after 7/1/2003, the rates shown above that are prior to age 65 are multiplied by 80% to reflect the different retiree health insurance benefit.
Hazardous System: For members hired after 7/1/2003 and prior to 9/1/2008, the rates shown above that are prior the member’s assumed maximum retirement age multiplied by 80% to reflect the different retiree health insurance benefit.
Male Female Male Female
Under 45 35.0% 27.0% 5 17.0%
45 35.0% 27.0% 6 17.0%
46 35.0% 27.0% 7 17.0%
47 35.0% 27.0% 8 17.0%
48 35.0% 27.0% 9 17.0%
49 35.0% 27.0% 10 17.0%
50 30.0% 27.0% 11 17.0%
51 30.0% 27.0% 12 17.0%
52 30.0% 27.0% 13 17.0%
53 30.0% 27.0% 14 17.0%
54 30.0% 27.0% 15 17.0%
55 30.0% 27.0% 4.0% 5.0% 16 17.0%
56 30.0% 27.0% 4.0% 5.0% 17 17.0%
57 30.0% 27.0% 4.0% 5.0% 18 17.0%
58 30.0% 27.0% 4.0% 5.0% 19 17.0%
59 30.0% 27.0% 4.0% 5.0% 20 30.0%
60 30.0% 27.0% 4.0% 8.0% 21 22.5%
61 30.0% 27.0% 4.0% 9.0% 22 18.0%
62 30.0% 40.0% 15.0% 20.0% 23 21.0%
63 30.0% 35.0% 15.0% 18.0% 24 24.0%
64 30.0% 30.0% 15.0% 16.0% 25 27.0% 21.6% 16.0%
65 30.0% 30.0% 26 30.0% 24.0% 16.0%
66 30.0% 27.0% 27 33.0% 26.4% 16.0%
67 30.0% 27.0% 28 36.0% 28.8% 16.0%
68 30.0% 27.0% 29 39.0% 31.2% 16.0%
69 30.0% 27.0% 30 39.0% 31.2% 100.0%
70 30.0% 27.0%
71 30.0% 27.0%
72 30.0% 27.0%
73 30.0% 27.0%
74 30.0% 27.0%
75 100.0% 100.0%
Members
participating
before
9/1/20082
Members
participating
between
9/1/2008
and 1/1/20143
Members
participating
after
1/1/20143Age
Non-Hazardous
Service
Hazardous
Normal Retirement Early Retirement1
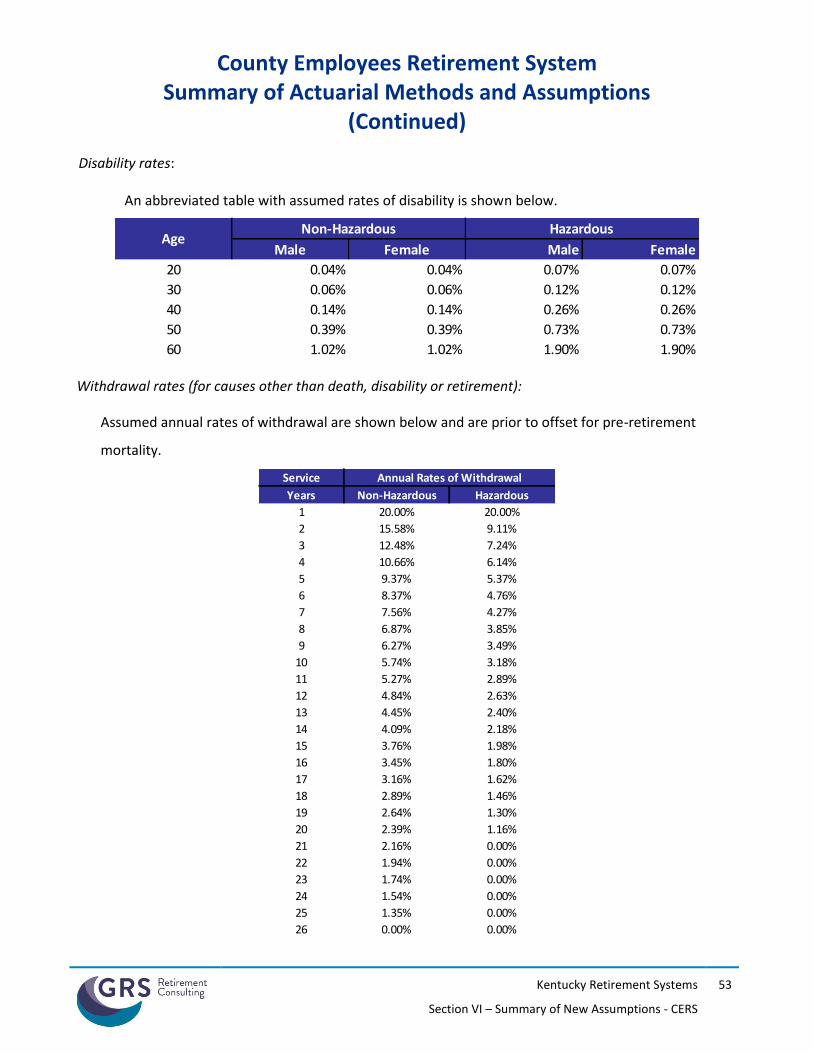
County Employees Retirement System
Summary of Actuarial Methods and Assumptions (Continued)
Kentucky Retirement Systems
Section VI – Summary of New Assumptions - CERS
53
Disability rates:
An abbreviated table with assumed rates of disability is shown below.
Withdrawal rates (for causes other than death, disability or retirement):
Assumed annual rates of withdrawal are shown below and are prior to offset for pre-retirement
mortality.
Male Female Male Female
20 0.04% 0.04% 0.07% 0.07%
30 0.06% 0.06% 0.12% 0.12%
40 0.14% 0.14% 0.26% 0.26%
50 0.39% 0.39% 0.73% 0.73%
60 1.02% 1.02% 1.90% 1.90%
HazardousAge
Non-Hazardous
Service
Years Non-Hazardous Hazardous
1 20.00% 20.00%
2 15.58% 9.11%
3 12.48% 7.24%
4 10.66% 6.14%
5 9.37% 5.37%
6 8.37% 4.76%
7 7.56% 4.27%
8 6.87% 3.85%
9 6.27% 3.49%
10 5.74% 3.18%
11 5.27% 2.89%
12 4.84% 2.63%
13 4.45% 2.40%
14 4.09% 2.18%
15 3.76% 1.98%
16 3.45% 1.80%
17 3.16% 1.62%
18 2.89% 1.46%
19 2.64% 1.30%
20 2.39% 1.16%
21 2.16% 0.00%
22 1.94% 0.00%
23 1.74% 0.00%
24 1.54% 0.00%
25 1.35% 0.00%
26 0.00% 0.00%
Annual Rates of Withdrawal
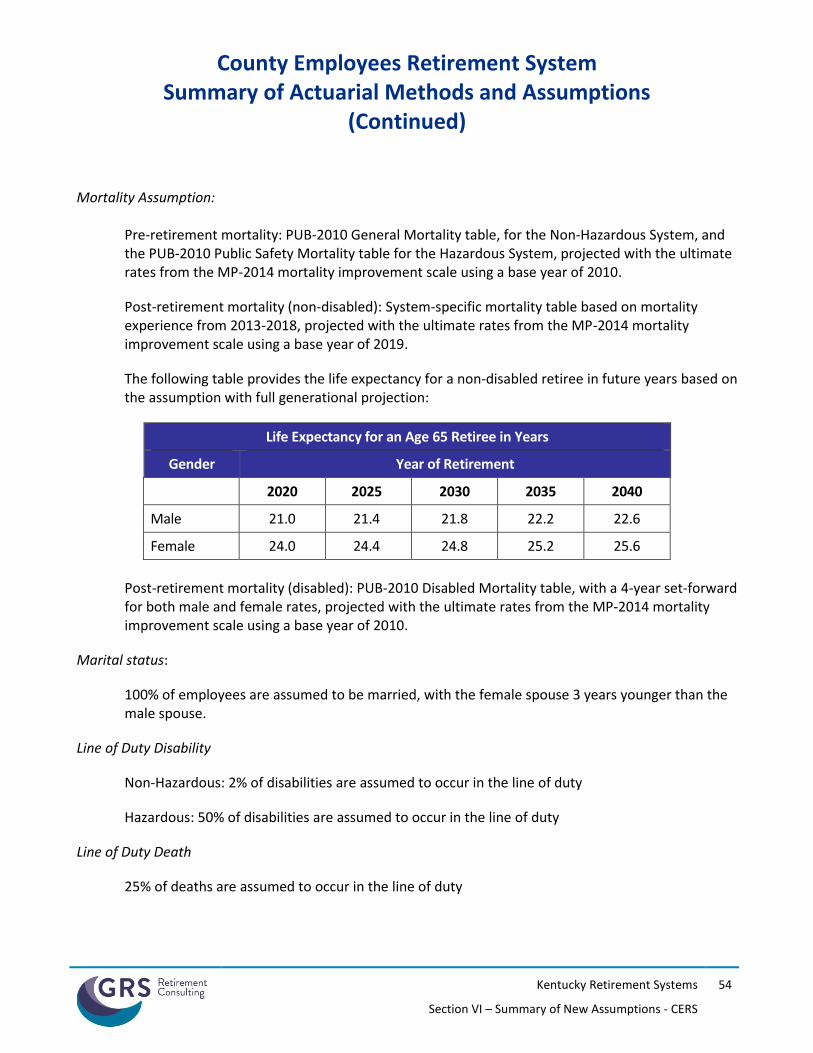
County Employees Retirement System
Summary of Actuarial Methods and Assumptions (Continued)
Kentucky Retirement Systems
Section VI – Summary of New Assumptions - CERS
54
Mortality Assumption:
Pre-retirement mortality: PUB-2010 General Mortality table, for the Non-Hazardous System, and the PUB-2010 Public Safety Mortality table for the Hazardous System, projected with the ultimate rates from the MP-2014 mortality improvement scale using a base year of 2010.
Post-retirement mortality (non-disabled): System-specific mortality table based on mortality experience from 2013-2018, projected with the ultimate rates from the MP-2014 mortality improvement scale using a base year of 2019.
The following table provides the life expectancy for a non-disabled retiree in future years based on the assumption with full generational projection:
Life Expectancy for an Age 65 Retiree in Years
Gender Year of Retirement
2020 2025 2030 2035 2040
Male 21.0 21.4 21.8 22.2 22.6
Female 24.0 24.4 24.8 25.2 25.6
Post-retirement mortality (disabled): PUB-2010 Disabled Mortality table, with a 4-year set-forward for both male and female rates, projected with the ultimate rates from the MP-2014 mortality improvement scale using a base year of 2010.
Marital status:
100% of employees are assumed to be married, with the female spouse 3 years younger than the male spouse.
Line of Duty Disability
Non-Hazardous: 2% of disabilities are assumed to occur in the line of duty
Hazardous: 50% of disabilities are assumed to occur in the line of duty
Line of Duty Death
25% of deaths are assumed to occur in the line of duty
County Employees Retirement System
Summary of Actuarial Methods and Assumptions (Continued)
Kentucky Retirement Systems
Section VI – Summary of New Assumptions - CERS
55
Dependent Children:
For members in the Hazardous Plan who receive a duty-related death benefit, the member is assumed to be survived by two dependent children, each age 6 with payments for 15 years.
Form of Payment:
Members are assumed to elect a life-only annuity at retirement.
Actuarial Cost Method:
Entry Age Normal, Level Percentage of Pay. The Entry Age Normal actuarial cost method allocates the System’s actuarial present value of future benefits to various periods based upon service. The portion of the present value of future benefits allocated to years of service prior to the valuation date is the actuarial accrued liability, and the portion allocated to years following the valuation date is the present value of future normal costs. The normal cost is determined for each active member as the level percent of pay necessary to fully fund the expected benefits to be earned over the career of each individual active member. The normal cost is partially funded with active member contributions with the remainder funded by employer contributions.
Health Care Age Related Morbidity/Claims Utilization:
To model the impact of aging on the underlying health care costs for Medicare retirees, the valuation relied on the Society of Actuaries’ 2013 Study “Health Care Costs – From Birth to Death”. Table 4 (Development of Plan Specific Medicare Age Curve) was used to model the impact of aging for ages 65 and over.
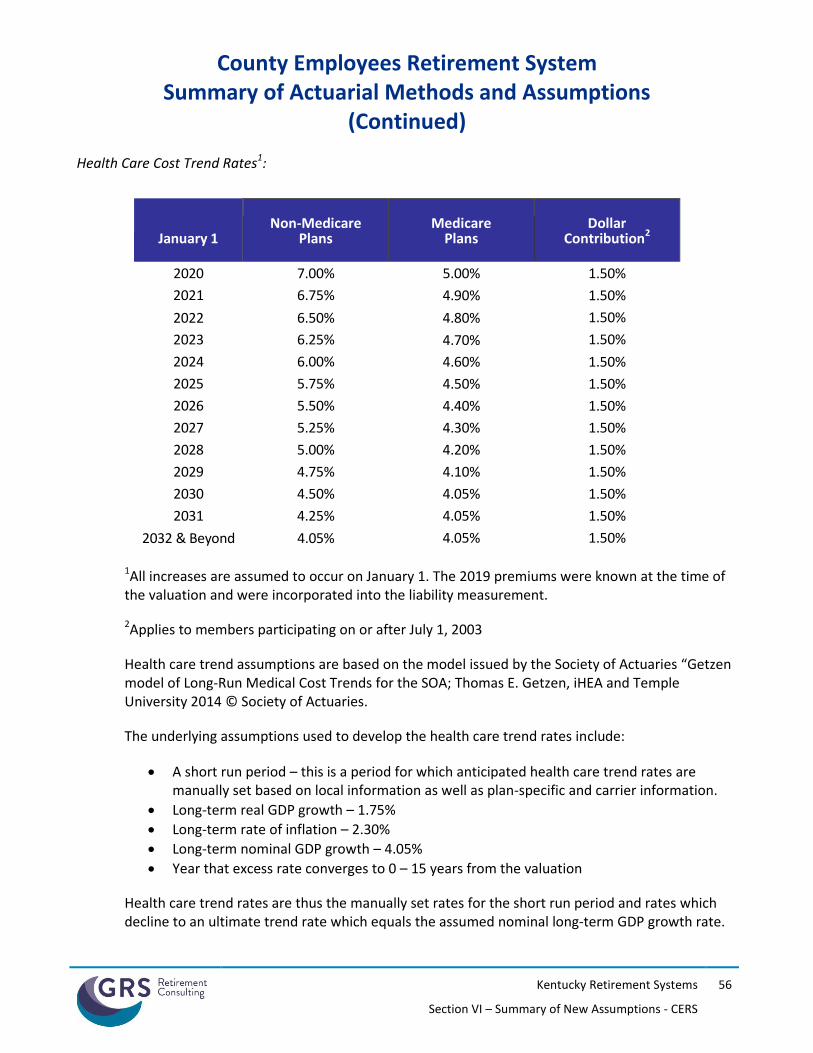
County Employees Retirement System
Summary of Actuarial Methods and Assumptions (Continued)
Kentucky Retirement Systems
Section VI – Summary of New Assumptions - CERS
56
Health Care Cost Trend Rates1:
January 1
Non-Medicare Plans
Medicare Plans
Dollar Contribution2
2020 7.00% 5.00% 1.50%
2021 6.75% 4.90% 1.50%
2022 6.50% 4.80% 1.50%
2023 6.25% 4.70% 1.50%
2024 6.00% 4.60% 1.50%
2025 5.75% 4.50% 1.50%
2026 5.50% 4.40% 1.50%
2027 5.25% 4.30% 1.50%
2028 5.00% 4.20% 1.50%
2029 4.75% 4.10% 1.50%
2030 4.50% 4.05% 1.50%
2031 4.25% 4.05% 1.50%
2032 & Beyond 4.05% 4.05% 1.50%
1All increases are assumed to occur on January 1. The 2019 premiums were known at the time of the valuation and were incorporated into the liability measurement.
2Applies to members participating on or after July 1, 2003
Health care trend assumptions are based on the model issued by the Society of Actuaries “Getzen model of Long-Run Medical Cost Trends for the SOA; Thomas E. Getzen, iHEA and Temple University 2014 © Society of Actuaries.
The underlying assumptions used to develop the health care trend rates include:
A short run period – this is a period for which anticipated health care trend rates are manually set based on local information as well as plan-specific and carrier information.
Long-term real GDP growth – 1.75%
Long-term rate of inflation – 2.30%
Long-term nominal GDP growth – 4.05%
Year that excess rate converges to 0 – 15 years from the valuation
Health care trend rates are thus the manually set rates for the short run period and rates which decline to an ultimate trend rate which equals the assumed nominal long-term GDP growth rate.
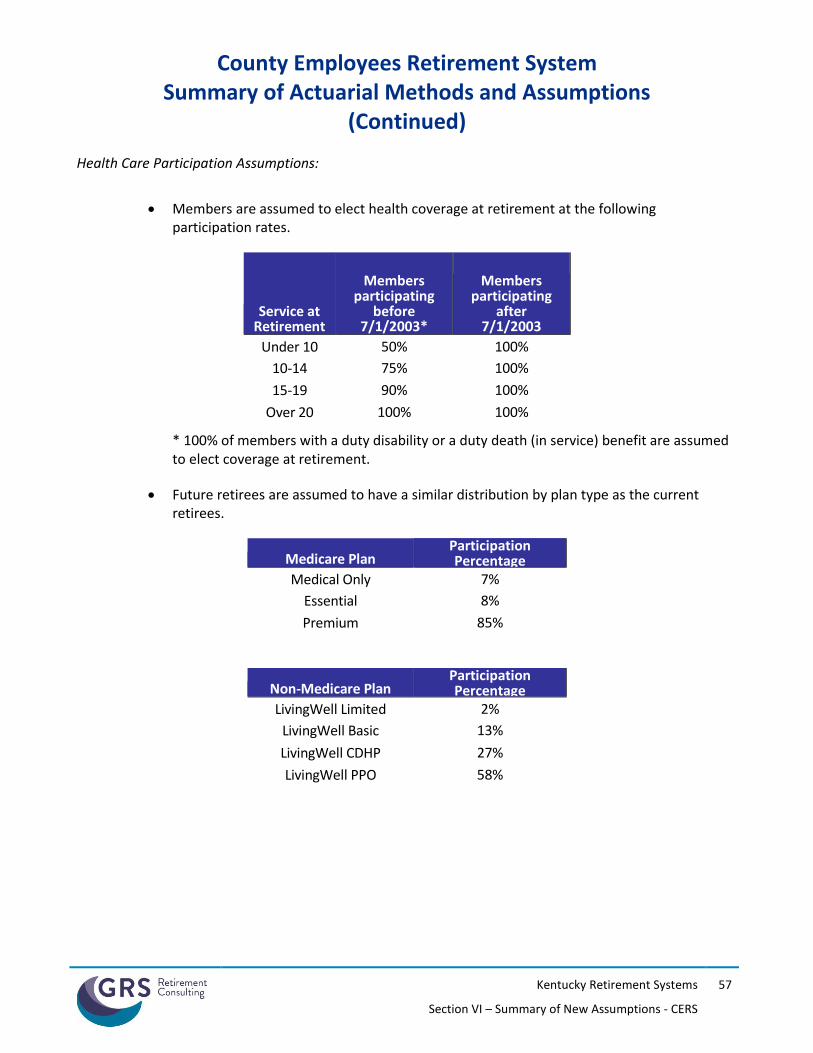
County Employees Retirement System
Summary of Actuarial Methods and Assumptions (Continued)
Kentucky Retirement Systems
Section VI – Summary of New Assumptions - CERS
57
Health Care Participation Assumptions:
Members are assumed to elect health coverage at retirement at the following
participation rates.
Service at Retirement
Members participating
before 7/1/2003*
Members participating
after 7/1/2003
Under 10 50% 100%
10-14 75% 100%
15-19 90% 100%
Over 20 100% 100%
* 100% of members with a duty disability or a duty death (in service) benefit are assumed to elect coverage at retirement.
Future retirees are assumed to have a similar distribution by plan type as the current retirees.
Medicare Plan Participation Percentage
Medical Only 7%
Essential 8%
Premium 85%
Non-Medicare Plan Participation Percentage
LivingWell Limited 2%
LivingWell Basic 13%
LivingWell CDHP 27%
LivingWell PPO 58%
County Employees Retirement System
Summary of Actuarial Methods and Assumptions (Continued)
Kentucky Retirement Systems
Section VI – Summary of New Assumptions - CERS
58
50% of deferred vested members participating before July 1, 2003 are assumed to elect health coverage at retirement. 100% of deferred vested members participating after July 1, 2003 are assumed to elect health coverage at retirement. Deferred vested members with non-hazardous service are assumed to begin health coverage at age 55 for members participating before September 1, 2008, and at age 60 for members participating on or after September 1, 2008. Deferred vested members with hazardous service are assumed to begin health coverage at age 50.
75% of future retirees, with hazardous service, are assumed to elect spouse health care coverage. No dependent coverage is assumed for members who only have non-hazardous service. 100% of spouses with health care coverage are assumed to continue coverage after the member’s death.
Excise (“Cadillac”) Tax:
For taxable years beginning after December 31, 2021, a 40% excise tax will be required to be paid (by the employer and/or insurer) on the aggregate cost of the health plan in excess of certain legislated thresholds. For 2018, the thresholds are $850 per month for individual coverage and $2,292 per month for family coverage.
Both Actuarial Standard of Practice No. 6 and GASB Statement Nos. 74 and 75 reference this tax, and, in accordance with these standards an estimate of the impact of the Cadillac tax has been included in this valuation.
Assumptions and methods used to determine the impact of the Cadillac Tax include:
2018 thresholds of $850/$2,292 were indexed annually by 2.30%.
Premium data submitted was not adjusted for permissible exclusions to the Cadillac Tax.
There were no special adjustments to the dollar limit other than those permissible for non-Medicare retirees over 55.
In this valuation, the impact of the Cadillac Tax has been calculated by increasing the employer paid premiums for Non-Medicare retirees, who became participants before July 1, 2003, by 3.6%. Non-Medicare retirees who became participants after July 1, 2003 receive dollar subsidies per year of service, which are not expected to exceed the overall Non-Medicare premiums. As a result, the costs attributable to the Cadillac Tax for members who became participants after July 1, 2003 will be paid by the retirees.
County Employees Retirement System
Summary of Actuarial Methods and Assumptions (Continued)
Kentucky Retirement Systems
Section VI – Summary of New Assumptions - CERS
59
Other Assumptions
1. Valuation payroll (used for determining the amortization contribution rate): Current fiscal year payroll.
2. Individual salaries used to project benefits: Actual salaries from the past fiscal year are used to determine the final average salary as of the valuation date. For future salaries,the salary from the last fiscal year is projected forward with one year’s salary scale.
3. Pay increase timing: Beginning of (fiscal) year. This is equivalent to assuming that reported salaries represent amounts paid to members during the year ended on the valuation date.
4. Percent electing annuity on death (when eligible): All of the spouses of vested, married participants are assumed to elect an immediate life annuity.
5. Inactive Population: All non-vested members are assumed to take an immediate refund. Vested members are assumed to elect a refund at the time of their termination if the value of their account balance exceeds the present value of their deferral benefit.
6. There will be no recoveries once disabled.
7. Decrement timing: Decrements of all types are assumed to occur mid-year.
8. Eligibility testing: Eligibility for benefits is determined based upon the age nearest birthday and service nearest whole year on the date the decrement is assumed to occur.
9. Decrement relativity: Decrement rates are used directly from the experience study, without adjustment for multiple decrement table effects.
10. Incidence of Contributions: Contributions are assumed to be received continuously throughout the year based upon the computed percent of payroll shown in this report, and the actual payroll payable at the time contributions are made.
11. Service: All members are assumed to accrue 1 year of benefit and eligibility service each year.
12. Payroll Growth Assumption: In determining the level percent of payroll amortization rate, payroll is assumed to grow annually at 2.00% percent for the Non-Hazardous and Hazardous systems.
13. Cash Balance Interest Crediting Rate: The cash balance interest crediting rate assumption for years after the valuation date is equal to 5.6875% for the Non-Hazardous and Hazardous Systems.
County Employees Retirement System
Summary of Actuarial Methods and Assumptions (Continued)
Kentucky Retirement Systems
Section VI – Summary of New Assumptions - CERS
60
Participant Data
Participant data was supplied in electronic text files. There were separate files for (i) active and inactive members, and (ii) members and beneficiaries receiving benefits.
The data for active members included birthdate, gender, service with the current city and total vesting service, salary, and employee contribution account balances. For retired members and beneficiaries, the data included date of birth, gender, spouse's date of birth (where applicable), amount of monthly benefit, date of retirement, and form of payment code.
Salary supplied for the current year was based on the annualized earnings for the year preceding the valuation date.
Assumptions were made to correct for missing, bad, or inconsistent data. These had no material impact on the results presented.
Changes from the June 30, 2018 Valuation
Annual salary increases were updated based on the 2018 Experience Study
Annual rates of retirement, disability, withdrawal, and mortality were updated based on the 2018
Experience Study
The percent of disabilities assumed to occur in the line of duty was updated from 0% to 2% for
non-hazardous members and 50% for hazardous members

SECTION VII
SUMMARY OF NEW ASSUMPTIONS – SPRS
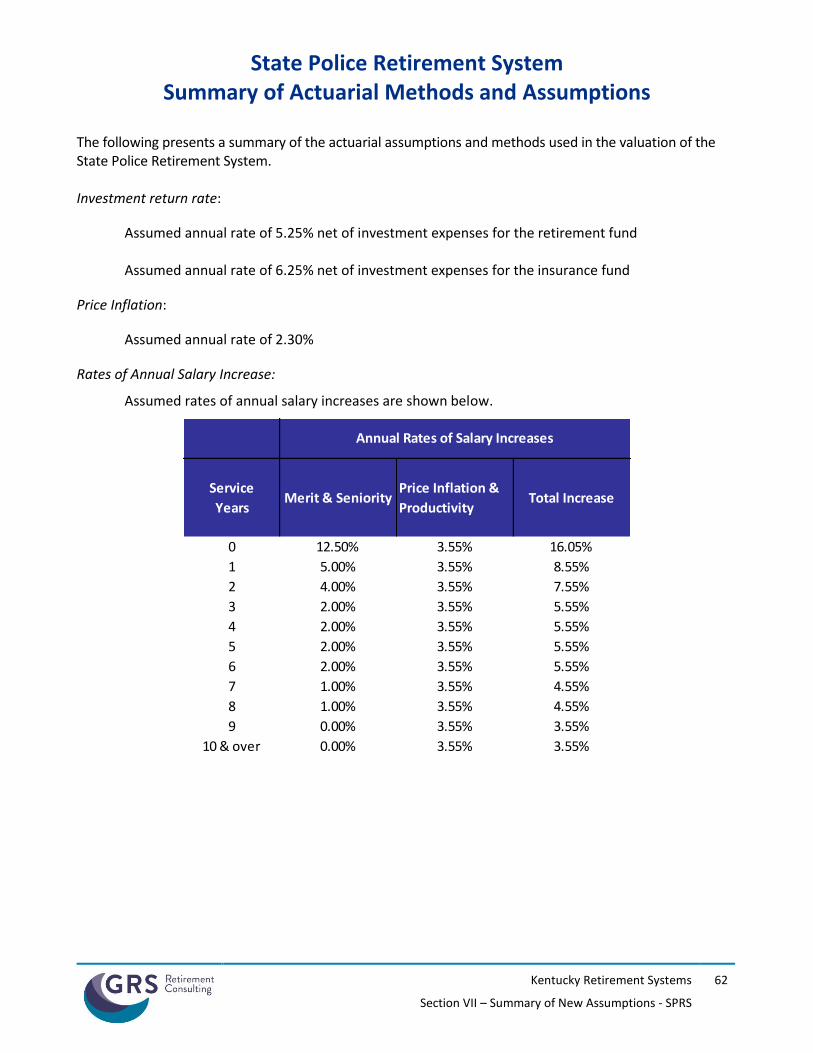
State Police Retirement System
Summary of Actuarial Methods and Assumptions
Kentucky Retirement Systems
Section VII – Summary of New Assumptions - SPRS
62
The following presents a summary of the actuarial assumptions and methods used in the valuation of the State Police Retirement System. Investment return rate:
Assumed annual rate of 5.25% net of investment expenses for the retirement fund Assumed annual rate of 6.25% net of investment expenses for the insurance fund
Price Inflation:
Assumed annual rate of 2.30%
Rates of Annual Salary Increase:
Assumed rates of annual salary increases are shown below.
Service
YearsMerit & Seniority
Price Inflation &
ProductivityTotal Increase
0 12.50% 3.55% 16.05%
1 5.00% 3.55% 8.55%
2 4.00% 3.55% 7.55%
3 2.00% 3.55% 5.55%
4 2.00% 3.55% 5.55%
5 2.00% 3.55% 5.55%
6 2.00% 3.55% 5.55%
7 1.00% 3.55% 4.55%
8 1.00% 3.55% 4.55%
9 0.00% 3.55% 3.55%
10 & over 0.00% 3.55% 3.55%
Annual Rates of Salary Increases
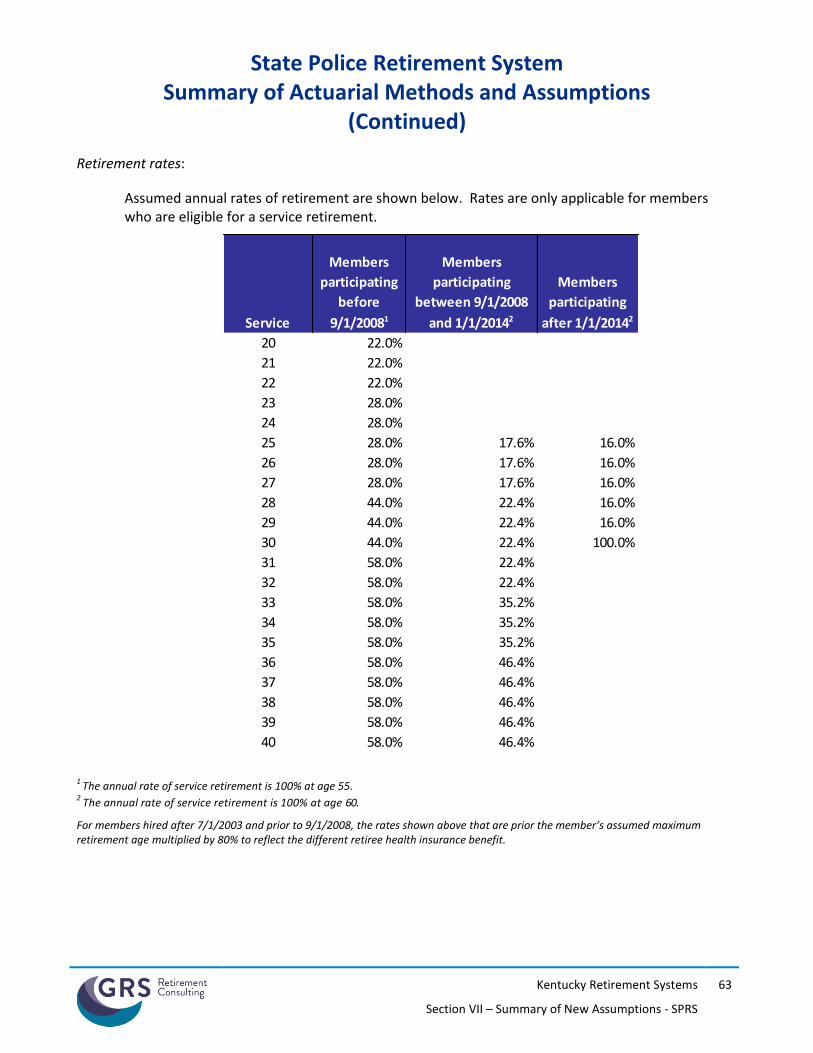
State Police Retirement System
Summary of Actuarial Methods and Assumptions (Continued)
Kentucky Retirement Systems
Section VII – Summary of New Assumptions - SPRS
63
Retirement rates:
Assumed annual rates of retirement are shown below. Rates are only applicable for members who are eligible for a service retirement.
1 The annual rate of service retirement is 100% at age 55.
2 The annual rate of service retirement is 100% at age 60.
For members hired after 7/1/2003 and prior to 9/1/2008, the rates shown above that are prior the member’s assumed maximum retirement age multiplied by 80% to reflect the different retiree health insurance benefit.
20 22.0%
21 22.0%
22 22.0%
23 28.0%
24 28.0%
25 28.0% 17.6% 16.0%
26 28.0% 17.6% 16.0%
27 28.0% 17.6% 16.0%
28 44.0% 22.4% 16.0%
29 44.0% 22.4% 16.0%
30 44.0% 22.4% 100.0%
31 58.0% 22.4%
32 58.0% 22.4%
33 58.0% 35.2%
34 58.0% 35.2%
35 58.0% 35.2%
36 58.0% 46.4%
37 58.0% 46.4%
38 58.0% 46.4%
39 58.0% 46.4%
40 58.0% 46.4%
Members
participating
between 9/1/2008
and 1/1/20142
Members
participating
after 1/1/20142
Members
participating
before
9/1/20081Service
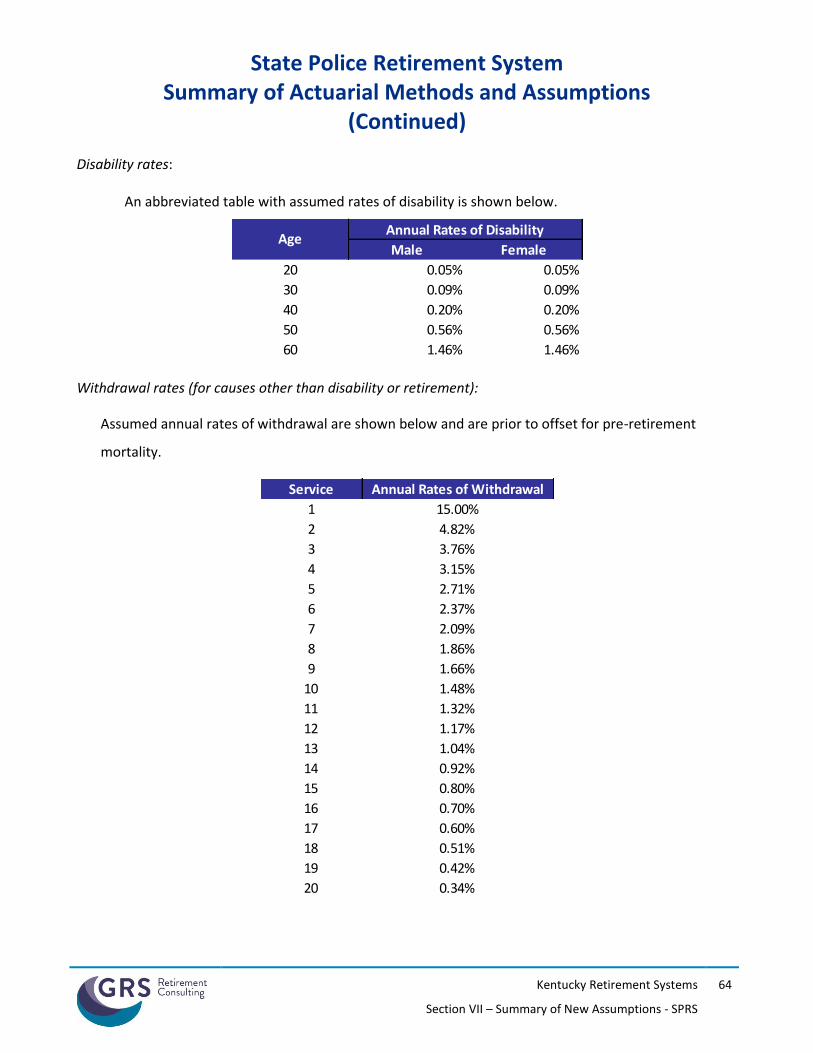
State Police Retirement System
Summary of Actuarial Methods and Assumptions (Continued)
Kentucky Retirement Systems
Section VII – Summary of New Assumptions - SPRS
64
Disability rates:
An abbreviated table with assumed rates of disability is shown below.
Withdrawal rates (for causes other than disability or retirement):
Assumed annual rates of withdrawal are shown below and are prior to offset for pre-retirement
mortality.
Male Female
20 0.05% 0.05%
30 0.09% 0.09%
40 0.20% 0.20%
50 0.56% 0.56%
60 1.46% 1.46%
AgeAnnual Rates of Disability
Service Annual Rates of Withdrawal
1 15.00%
2 4.82%
3 3.76%
4 3.15%
5 2.71%
6 2.37%
7 2.09%
8 1.86%
9 1.66%
10 1.48%
11 1.32%
12 1.17%
13 1.04%
14 0.92%
15 0.80%
16 0.70%
17 0.60%
18 0.51%
19 0.42%
20 0.34%
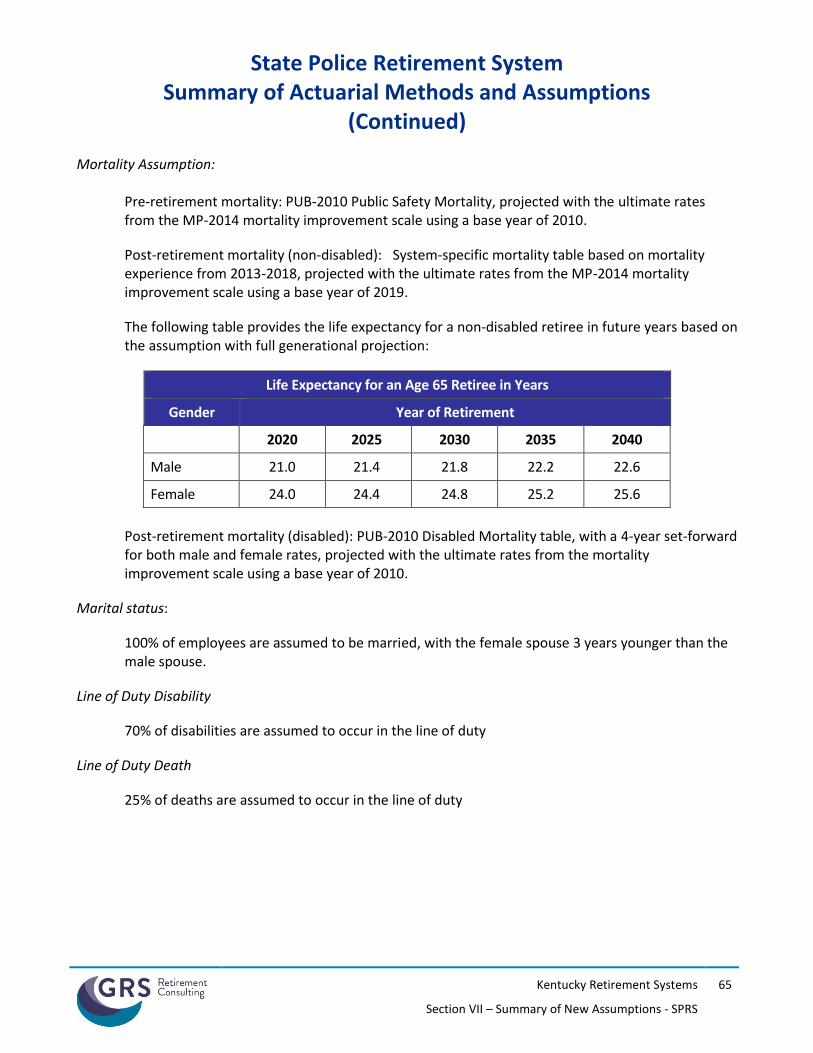
State Police Retirement System
Summary of Actuarial Methods and Assumptions (Continued)
Kentucky Retirement Systems
Section VII – Summary of New Assumptions - SPRS
65
Mortality Assumption:
Pre-retirement mortality: PUB-2010 Public Safety Mortality, projected with the ultimate rates from the MP-2014 mortality improvement scale using a base year of 2010.
Post-retirement mortality (non-disabled): System-specific mortality table based on mortality experience from 2013-2018, projected with the ultimate rates from the MP-2014 mortality improvement scale using a base year of 2019.
The following table provides the life expectancy for a non-disabled retiree in future years based on the assumption with full generational projection:
Life Expectancy for an Age 65 Retiree in Years
Gender Year of Retirement
2020 2025 2030 2035 2040
Male 21.0 21.4 21.8 22.2 22.6
Female 24.0 24.4 24.8 25.2 25.6
Post-retirement mortality (disabled): PUB-2010 Disabled Mortality table, with a 4-year set-forward for both male and female rates, projected with the ultimate rates from the mortality improvement scale using a base year of 2010.
Marital status:
100% of employees are assumed to be married, with the female spouse 3 years younger than the male spouse.
Line of Duty Disability
70% of disabilities are assumed to occur in the line of duty
Line of Duty Death
25% of deaths are assumed to occur in the line of duty
State Police Retirement System
Summary of Actuarial Methods and Assumptions (Continued)
Kentucky Retirement Systems
Section VII – Summary of New Assumptions - SPRS
66
Dependent Children:
For members in the Hazardous Plan who receive a duty-related death benefit, the member is assumed to be survived by two dependent children, each age 6 with payments for 15 years.
Form of Payment:
Members are assumed to elect a life-only annuity at retirement.
Actuarial Cost Method:
Entry Age Normal, Level Percentage of Pay. The Entry Age Normal actuarial cost method allocates the System’s actuarial present value of future benefits to various periods based upon service. The portion of the present value of future benefits allocated to years of service prior to the valuation date is the actuarial accrued liability, and the portion allocated to years following the valuation date is the present value of future normal costs. The normal cost is determined for each active member as the level percent of pay necessary to fully fund the expected benefits to be earned over the career of each individual active member. The normal cost is partially funded with active member contributions with the remainder funded by employer contributions.
Health Care Age Related Morbidity/Claims Utilization:
To model the impact of aging on the underlying health care costs for Medicare retirees, the valuation relied on the Society of Actuaries’ 2013 Study “Health Care Costs – From Birth to Death”. Table 4 (Development of Plan Specific Medicare Age Curve) was used to model the impact of aging for ages 65 and over.
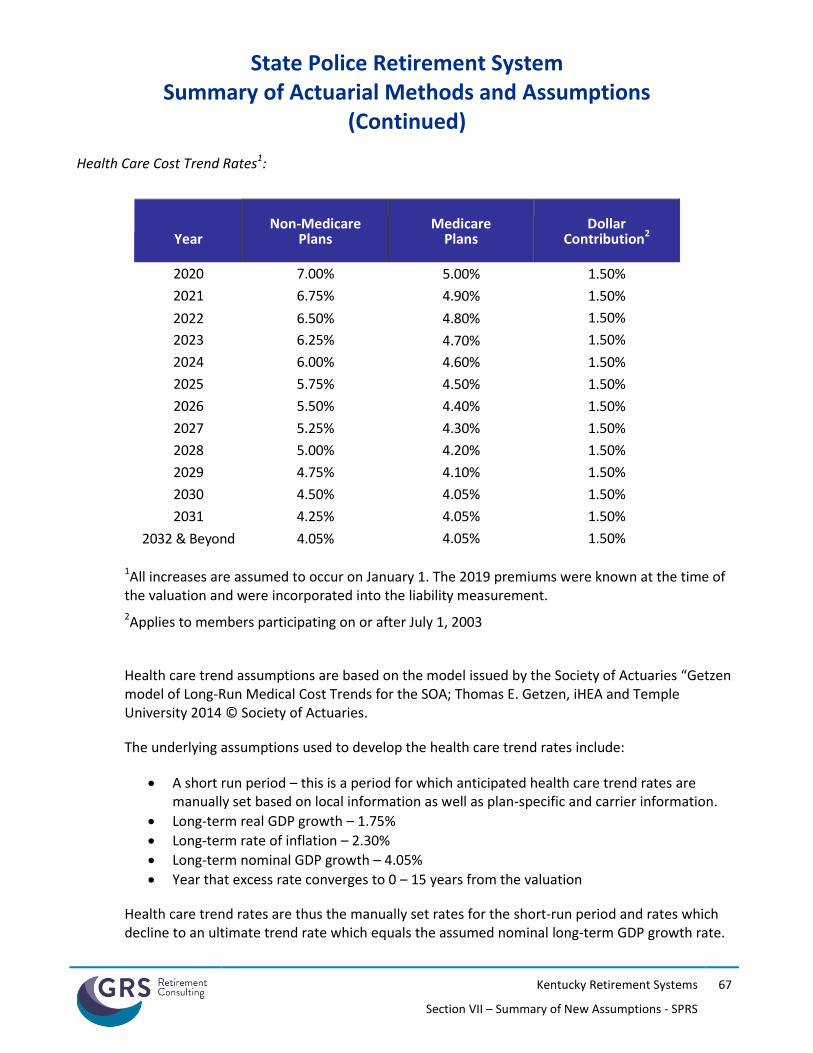
State Police Retirement System
Summary of Actuarial Methods and Assumptions (Continued)
Kentucky Retirement Systems
Section VII – Summary of New Assumptions - SPRS
67
Health Care Cost Trend Rates1:
1All increases are assumed to occur on January 1. The 2019 premiums were known at the time of the valuation and were incorporated into the liability measurement.
2Applies to members participating on or after July 1, 2003
Health care trend assumptions are based on the model issued by the Society of Actuaries “Getzen model of Long-Run Medical Cost Trends for the SOA; Thomas E. Getzen, iHEA and Temple University 2014 © Society of Actuaries.
The underlying assumptions used to develop the health care trend rates include:
A short run period – this is a period for which anticipated health care trend rates are manually set based on local information as well as plan-specific and carrier information.
Long-term real GDP growth – 1.75%
Long-term rate of inflation – 2.30%
Long-term nominal GDP growth – 4.05%
Year that excess rate converges to 0 – 15 years from the valuation
Health care trend rates are thus the manually set rates for the short-run period and rates which decline to an ultimate trend rate which equals the assumed nominal long-term GDP growth rate.
Year
Non-Medicare Plans
Medicare Plans
Dollar Contribution2
2020 7.00% 5.00% 1.50%
2021 6.75% 4.90% 1.50%
2022 6.50% 4.80% 1.50%
2023 6.25% 4.70% 1.50%
2024 6.00% 4.60% 1.50%
2025 5.75% 4.50% 1.50%
2026 5.50% 4.40% 1.50%
2027 5.25% 4.30% 1.50%
2028 5.00% 4.20% 1.50%
2029 4.75% 4.10% 1.50%
2030 4.50% 4.05% 1.50%
2031 4.25% 4.05% 1.50%
2032 & Beyond 4.05% 4.05% 1.50%
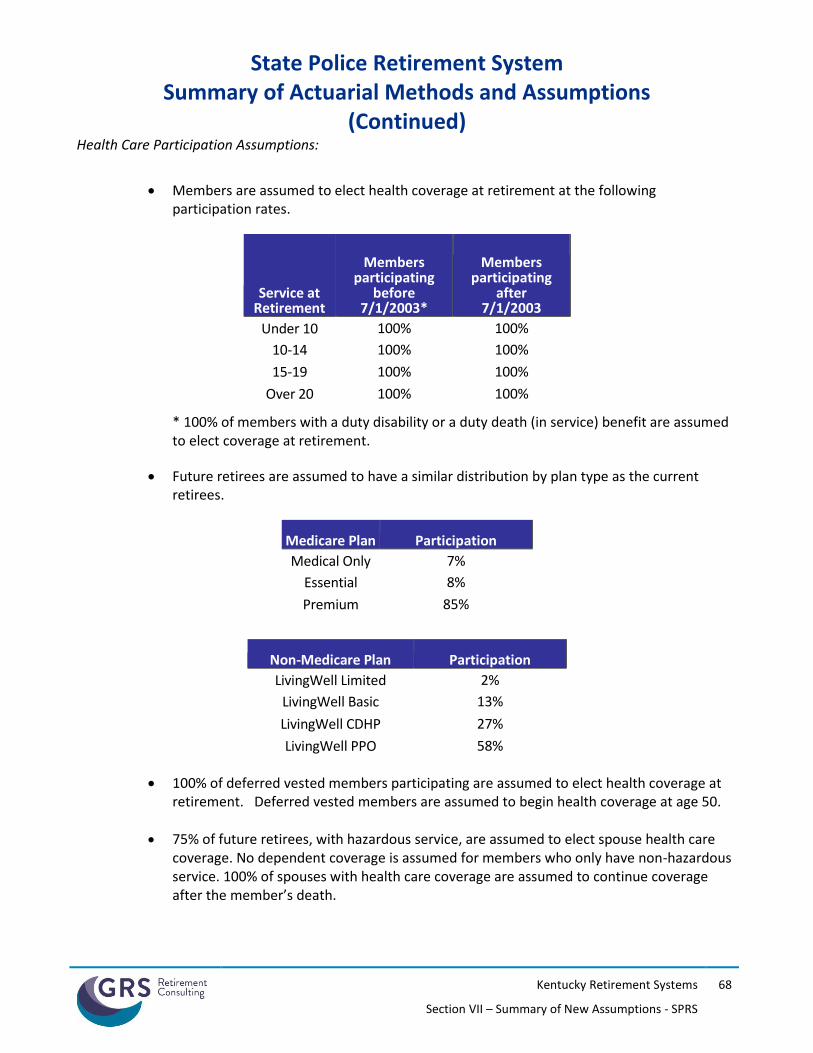
State Police Retirement System
Summary of Actuarial Methods and Assumptions (Continued)
Kentucky Retirement Systems
Section VII – Summary of New Assumptions - SPRS
68
Health Care Participation Assumptions:
Members are assumed to elect health coverage at retirement at the following
participation rates.
Service at Retirement
Members participating
before 7/1/2003*
Members participating
after 7/1/2003
Under 10 100% 100%
10-14 100% 100%
15-19 100% 100%
Over 20 100% 100%
* 100% of members with a duty disability or a duty death (in service) benefit are assumed to elect coverage at retirement.
Future retirees are assumed to have a similar distribution by plan type as the current retirees.
Medicare Plan Participation
Medical Only 7%
Essential 8%
Premium 85%
Non-Medicare Plan Participation
LivingWell Limited 2%
LivingWell Basic 13%
LivingWell CDHP 27%
LivingWell PPO 58%
100% of deferred vested members participating are assumed to elect health coverage at retirement. Deferred vested members are assumed to begin health coverage at age 50.
75% of future retirees, with hazardous service, are assumed to elect spouse health care coverage. No dependent coverage is assumed for members who only have non-hazardous service. 100% of spouses with health care coverage are assumed to continue coverage after the member’s death.
State Police Retirement System
Summary of Actuarial Methods and Assumptions (Continued)
Kentucky Retirement Systems
Section VII – Summary of New Assumptions - SPRS
69
Excise (“Cadillac”) Tax:
For taxable years beginning after December 31, 2021, a 40% excise tax will be required to be paid (by the employer and/or insurer) on the aggregate cost of the health plan in excess of certain legislated thresholds. For 2018, the thresholds are $850 per month for individual coverage and $2,292 per month for family coverage.
Both Actuarial Standard of Practice No. 6 and GASB Statement Nos. 74 and 75 reference this tax, and, in accordance with these standards an estimate of the impact of the Cadillac tax has been included in this valuation.
Assumptions and methods used to determine the impact of the Cadillac Tax include:
2018 thresholds of $850/$2,292 were indexed annually by 2.30%.
Premium data submitted was not adjusted for permissible exclusions to the Cadillac Tax.
There were no special adjustments to the dollar limit other than those permissible for non-Medicare retirees over 55.
In this valuation, the impact of the Cadillac Tax has been calculated by increasing the employer paid premiums for Non-Medicare retirees, who became participants before July 1, 2003, by 3.6%. Non-Medicare retirees who became participants after July 1, 2003 receive dollar subsidies per year of service, which are not expected to exceed the overall Non-Medicare premiums. As a result, the costs attributable to the Cadillac Tax for members who became participants after July 1, 2003 will be paid by the retirees
State Police Retirement System
Summary of Actuarial Methods and Assumptions (Continued)
Kentucky Retirement Systems
Section VII – Summary of New Assumptions - SPRS
70
Other Assumptions
1. Valuation payroll (used for determining the amortization contribution rate): Current fiscal year payroll.
2. Individual salaries used to project benefits: Actual salaries from the past fiscal year are used to determine the final average salary as of the valuation date. For future salaries, the salary from the last fiscal year is projected forward with one year’s salary scale.
3. Pay increase timing: Beginning of (fiscal) year. This is equivalent to assuming that reported salaries represent amounts paid to members during the year ended on the valuation date.
4. Percent electing annuity on death (when eligible): All of the spouses of vested, married participants are assumed to elect an immediate life annuity.
5. Inactive Population: All non-vested members are assumed to take an immediate refund. Vested members are assumed to elect a refund at the time of their termination if the value of their account balance exceeds the present value of their deferral benefit.
6. There will be no recoveries once disabled.
7. Decrement timing: Decrements of all types are assumed to occur mid-year.
8. Eligibility testing: Eligibility for benefits is determined based upon the age nearest birthday and service nearest whole year on the date the decrement is assumed to occur.
9. Decrement relativity: Decrement rates are used directly from the experience study, without adjustment for multiple decrement table effects.
10. Incidence of Contributions: Contributions are assumed to be received continuously throughout the year based upon the computed percent of payroll shown in this report, and the actual payroll payable at the time contributions are made.
11. Service: All members are assumed to accrue 1 year of benefit and eligibility service each year.
12. Payroll Growth Assumption: In determining the level percent of payroll amortization rate, payroll is assumed to grow annually at 0.00% percent
13. Cash Balance Interest Crediting Rate: The cash balance interest crediting rate assumption for years after the valuation date is equal to 4.9375%.
State Police Retirement System
Summary of Actuarial Methods and Assumptions (Continued)
Kentucky Retirement Systems
Section VII – Summary of New Assumptions - SPRS
71
Participant Data
Participant data was supplied in electronic text files. There were separate files for (i) active and inactive members, and (ii) members and beneficiaries receiving benefits.
The data for active members included birthdate, gender, service with the current city and total vesting service, salary, and employee contribution account balances. For retired members and beneficiaries, the data included date of birth, gender, spouse's date of birth (where applicable), amount of monthly benefit, date of retirement, and form of payment code.
Salary supplied for the current year was based on the annualized earnings for the year preceding the valuation date.
Assumptions were made to correct for missing, bad, or inconsistent data. These had no material impact on the results presented.
Changes from the June 30, 2018 prior valuation:
Annual salary increases were updated based on the 2018 Experience Study
Annual rates of retirement, disability, withdrawal, and mortality were updated based on the 2018 Experience Study
The percent of disabilities assumed to occur in the line of duty was updated from 0% to 70%

SECTION VIII
SUMMARY OF DATA AND EXPERIENCE
Kentucky Retirement Systems
Section VIII – Summary of Data and Experience
73
List of Tables
SALARY EXPERIENCE
a. KENTUCKY EMPLOYEES RETIREMENT SYSTEM – NON-HAZARDOUS (KERS) ................................................... 74
b. KENTUCKY EMPLOYEES RETIREMENT SYSTEM –HAZARDOUS (KERS) ............................................................ 75
c. COUNTY EMPLOYEES RETIREMENT SYSTEM – NON-HAZARDOUS (CERS) ...................................................... 76
d. COUNTY EMPLOYEES RETIREMENT SYSTEM –HAZARDOUS (CERS) ............................................................... 77
e. STATE POLICE RETIREMENT SYSTEM (SPRS) ............................................................................................ 78
POST-RETIREMENT MORTALITY EXPERIENCE
a. NON-DISABLED RETIREES (MALE) ........................................................................................................... 79
b. NON-DISABLED RETIREES (FEMALE) ........................................................................................................ 80
c. DISABLED RETIREES (MALE) ................................................................................................................... 81
d. DISABLED RETIREES (FEMALE) ................................................................................................................ 82
TERMINATION EXPERIENCE
a. KERS – NON-HAZARDOUS, SERVICE-BASED ............................................................................................ 83
b. KERS – HAZARDOUS, SERVICE-BASED .................................................................................................... 84
c. CERS – NON-HAZARDOUS, SERVICE-BASED ............................................................................................ 85
d. CERS – HAZARDOUS, SERVICE-BASED .................................................................................................... 86
e. STATE POLICE RETIREMENT SYSTEM, SERVICE-BASED ................................................................................ 87
NORMAL RETIREMENT EXPERIENCE
a. KERS – NON-HAZARDOUS, AGE-BASED (MALE) ....................................................................................... 88
b. KERS – NON-HAZARDOUS, AGE-BASED (FEMALE) .................................................................................... 89
c. KERS – HAZARDOUS, SERVICE-BASED ..................................................................................................... 90
d. CERS – NON-HAZARDOUS, AGE-BASED (MALE) ....................................................................................... 91
e. CERS – NON-HAZARDOUS, AGE-BASED (FEMALE) .................................................................................... 92
f. CERS – HAZARDOUS, SERVICE-BASED ..................................................................................................... 93
g. SPRS – SERVICE-BASED ........................................................................................................................ 94
EARLY RETIREMENT EXPERIENCE
a. KERS – NON-HAZARDOUS, AGE-BASED (MALE) ....................................................................................... 95
b. KERS – NON-HAZARDOUS, AGE-BASED (FEMALE) .................................................................................... 95
c. KERS – NON-HAZARDOUS, SERVICE-BASED (MALE) .................................................................................. 96
d. KERS – NON-HAZARDOUS, SERVICE-BASED (FEMALE) ............................................................................... 96
e. CERS – NON-HAZARDOUS, AGE-BASED (MALE) ....................................................................................... 97
f. CERS – NON-HAZARDOUS, AGE-BASED (FEMALE) .................................................................................... 97
g. CERS – NON-HAZARDOUS, SERVICE-BASED (MALE) .................................................................................. 98
h. CERS – NON-HAZARDOUS, SERVICE-BASED (FEMALE) ............................................................................... 98
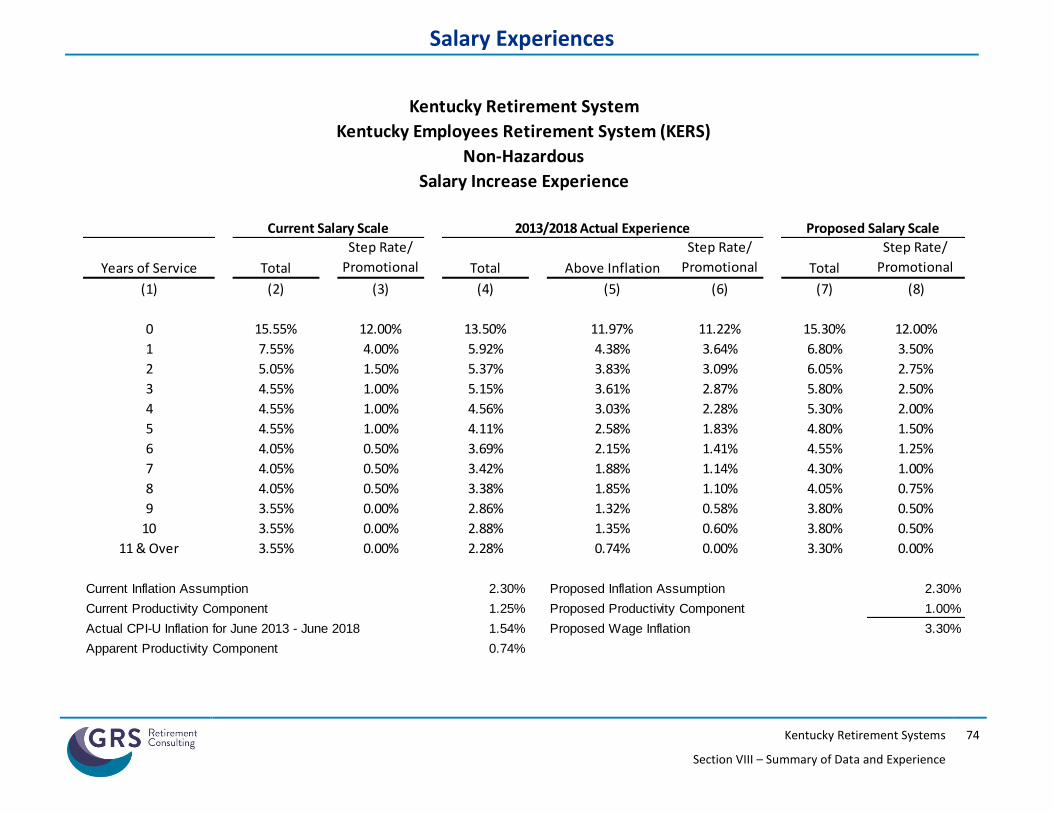
Salary Experiences
Kentucky Retirement Systems
Section VIII – Summary of Data and Experience
74
Kentucky Retirement System
Kentucky Employees Retirement System (KERS)
Non-Hazardous
Salary Increase Experience
Current Salary Scale 2013/2018 Actual Experience Proposed Salary Scale
Years of Service Total
Step Rate/
Promotional Total Above Inflation
Step Rate/
Promotional Total
Step Rate/
Promotional
(1) (2) (3) (4) (5) (6) (7) (8)
0 15.55% 12.00% 13.50% 11.97% 11.22% 15.30% 12.00%
1 7.55% 4.00% 5.92% 4.38% 3.64% 6.80% 3.50%
2 5.05% 1.50% 5.37% 3.83% 3.09% 6.05% 2.75%
3 4.55% 1.00% 5.15% 3.61% 2.87% 5.80% 2.50%
4 4.55% 1.00% 4.56% 3.03% 2.28% 5.30% 2.00%
5 4.55% 1.00% 4.11% 2.58% 1.83% 4.80% 1.50%
6 4.05% 0.50% 3.69% 2.15% 1.41% 4.55% 1.25%
7 4.05% 0.50% 3.42% 1.88% 1.14% 4.30% 1.00%
8 4.05% 0.50% 3.38% 1.85% 1.10% 4.05% 0.75%
9 3.55% 0.00% 2.86% 1.32% 0.58% 3.80% 0.50%
10 3.55% 0.00% 2.88% 1.35% 0.60% 3.80% 0.50%
11 & Over 3.55% 0.00% 2.28% 0.74% 0.00% 3.30% 0.00%
Current Inflation Assumption 2.30% Proposed Inflation Assumption 2.30%
Current Productivity Component 1.25% Proposed Productivity Component 1.00%
Actual CPI-U Inflation for June 2013 - June 2018 1.54% Proposed Wage Inflation 3.30%
Apparent Productivity Component 0.74%
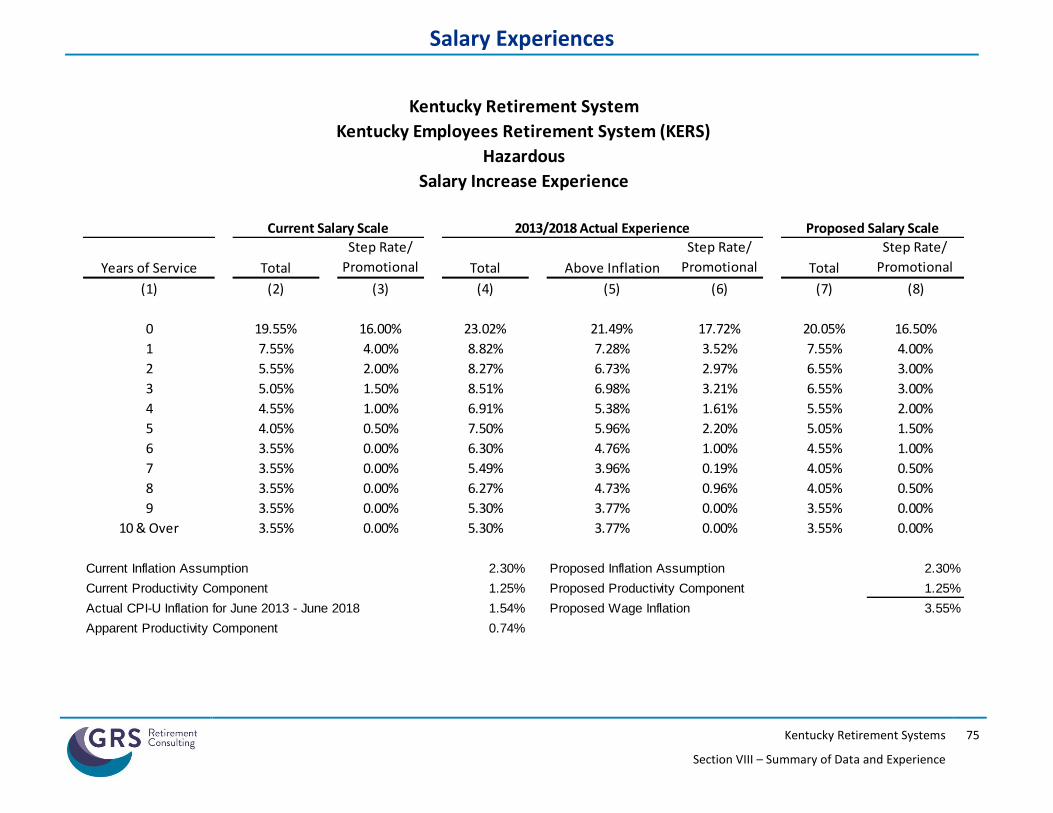
Salary Experiences
Kentucky Retirement Systems
Section VIII – Summary of Data and Experience
75
Kentucky Retirement System
Kentucky Employees Retirement System (KERS)
Hazardous
Salary Increase Experience
Current Salary Scale 2013/2018 Actual Experience Proposed Salary Scale
Years of Service Total
Step Rate/
Promotional Total Above Inflation
Step Rate/
Promotional Total
Step Rate/
Promotional
(1) (2) (3) (4) (5) (6) (7) (8)
0 19.55% 16.00% 23.02% 21.49% 17.72% 20.05% 16.50%
1 7.55% 4.00% 8.82% 7.28% 3.52% 7.55% 4.00%
2 5.55% 2.00% 8.27% 6.73% 2.97% 6.55% 3.00%
3 5.05% 1.50% 8.51% 6.98% 3.21% 6.55% 3.00%
4 4.55% 1.00% 6.91% 5.38% 1.61% 5.55% 2.00%
5 4.05% 0.50% 7.50% 5.96% 2.20% 5.05% 1.50%
6 3.55% 0.00% 6.30% 4.76% 1.00% 4.55% 1.00%
7 3.55% 0.00% 5.49% 3.96% 0.19% 4.05% 0.50%
8 3.55% 0.00% 6.27% 4.73% 0.96% 4.05% 0.50%
9 3.55% 0.00% 5.30% 3.77% 0.00% 3.55% 0.00%
10 & Over 3.55% 0.00% 5.30% 3.77% 0.00% 3.55% 0.00%
Current Inflation Assumption 2.30% Proposed Inflation Assumption 2.30%
Current Productivity Component 1.25% Proposed Productivity Component 1.25%
Actual CPI-U Inflation for June 2013 - June 2018 1.54% Proposed Wage Inflation 3.55%
Apparent Productivity Component 0.74%
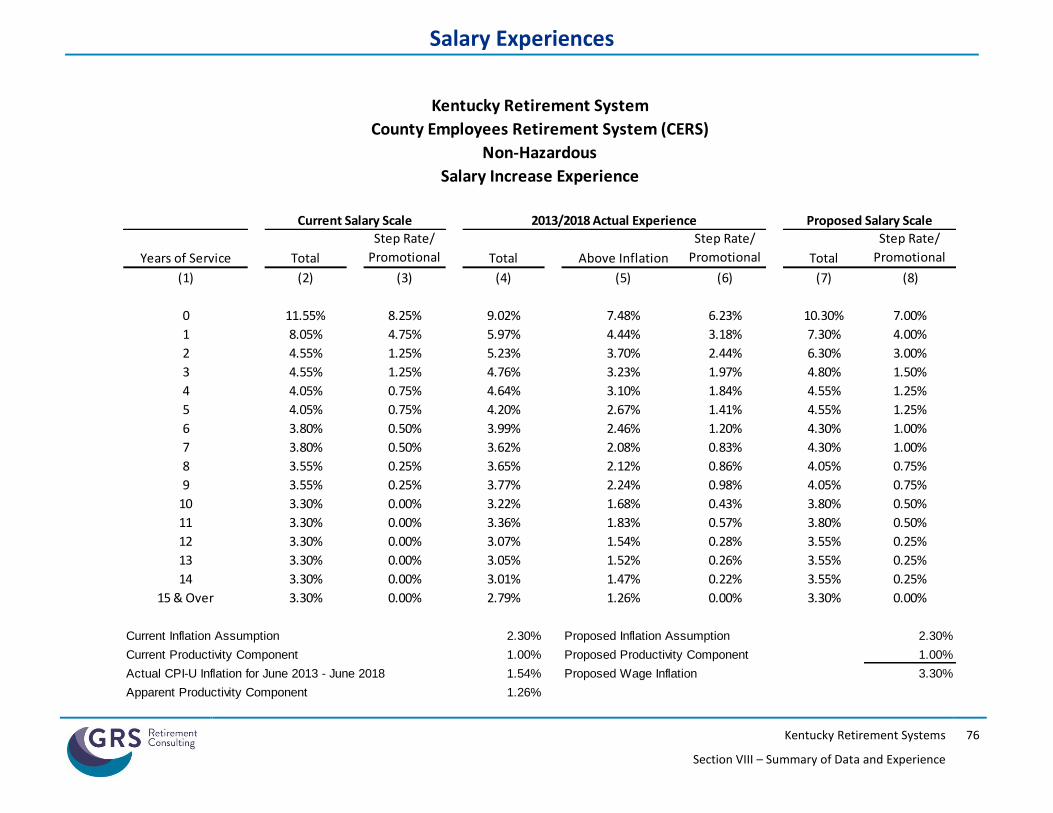
Salary Experiences
Kentucky Retirement Systems
Section VIII – Summary of Data and Experience
76
Kentucky Retirement System
County Employees Retirement System (CERS)
Non-Hazardous
Salary Increase Experience
Current Salary Scale 2013/2018 Actual Experience Proposed Salary Scale
Years of Service Total
Step Rate/
Promotional Total Above Inflation
Step Rate/
Promotional Total
Step Rate/
Promotional
(1) (2) (3) (4) (5) (6) (7) (8)
0 11.55% 8.25% 9.02% 7.48% 6.23% 10.30% 7.00%
1 8.05% 4.75% 5.97% 4.44% 3.18% 7.30% 4.00%
2 4.55% 1.25% 5.23% 3.70% 2.44% 6.30% 3.00%
3 4.55% 1.25% 4.76% 3.23% 1.97% 4.80% 1.50%
4 4.05% 0.75% 4.64% 3.10% 1.84% 4.55% 1.25%
5 4.05% 0.75% 4.20% 2.67% 1.41% 4.55% 1.25%
6 3.80% 0.50% 3.99% 2.46% 1.20% 4.30% 1.00%
7 3.80% 0.50% 3.62% 2.08% 0.83% 4.30% 1.00%
8 3.55% 0.25% 3.65% 2.12% 0.86% 4.05% 0.75%
9 3.55% 0.25% 3.77% 2.24% 0.98% 4.05% 0.75%
10 3.30% 0.00% 3.22% 1.68% 0.43% 3.80% 0.50%
11 3.30% 0.00% 3.36% 1.83% 0.57% 3.80% 0.50%
12 3.30% 0.00% 3.07% 1.54% 0.28% 3.55% 0.25%
13 3.30% 0.00% 3.05% 1.52% 0.26% 3.55% 0.25%
14 3.30% 0.00% 3.01% 1.47% 0.22% 3.55% 0.25%
15 & Over 3.30% 0.00% 2.79% 1.26% 0.00% 3.30% 0.00%
Current Inflation Assumption 2.30% Proposed Inflation Assumption 2.30%
Current Productivity Component 1.00% Proposed Productivity Component 1.00%
Actual CPI-U Inflation for June 2013 - June 2018 1.54% Proposed Wage Inflation 3.30%
Apparent Productivity Component 1.26%

Salary Experiences
Kentucky Retirement Systems
Section VIII – Summary of Data and Experience
77
Kentucky Retirement System
County Employees Retirement System (CERS)
Hazardous
Salary Increase Experience
Current Salary Scale 2013/2018 Actual Experience Proposed Salary Scale
Years of Service Total
Step Rate/
Promotional Total Above Inflation
Step Rate/
Promotional Total
Step Rate/
Promotional
(1) (2) (3) (4) (5) (6) (7) (8)
0 18.55% 15.50% 19.40% 17.87% 15.15% 19.05% 15.50%
1 9.05% 6.00% 8.41% 6.88% 4.16% 7.55% 4.00%
2 5.05% 2.00% 6.41% 4.87% 2.15% 5.55% 2.00%
3 4.30% 1.25% 5.49% 3.96% 1.24% 4.80% 1.25%
4 4.05% 1.00% 5.18% 3.65% 0.93% 4.55% 1.00%
5 3.55% 0.50% 5.54% 4.00% 1.28% 4.55% 1.00%
6 3.05% 0.00% 5.19% 3.66% 0.94% 4.55% 1.00%
7 3.05% 0.00% 4.75% 3.22% 0.50% 4.05% 0.50%
8 3.05% 0.00% 4.56% 3.02% 0.30% 4.05% 0.50%
9 3.05% 0.00% 4.26% 2.72% 0.00% 3.55% 0.00%
10 & Over 3.05% 0.00% 4.26% 2.72% 0.00% 3.55% 0.00%
Current Inflation Assumption 2.30% Proposed Inflation Assumption 2.30%
Current Productivity Component 0.75% Proposed Productivity Component 1.25%
Actual CPI-U Inflation for June 2013 - June 2018 1.54% Proposed Wage Inflation 3.55%
Apparent Productivity Component 2.72%
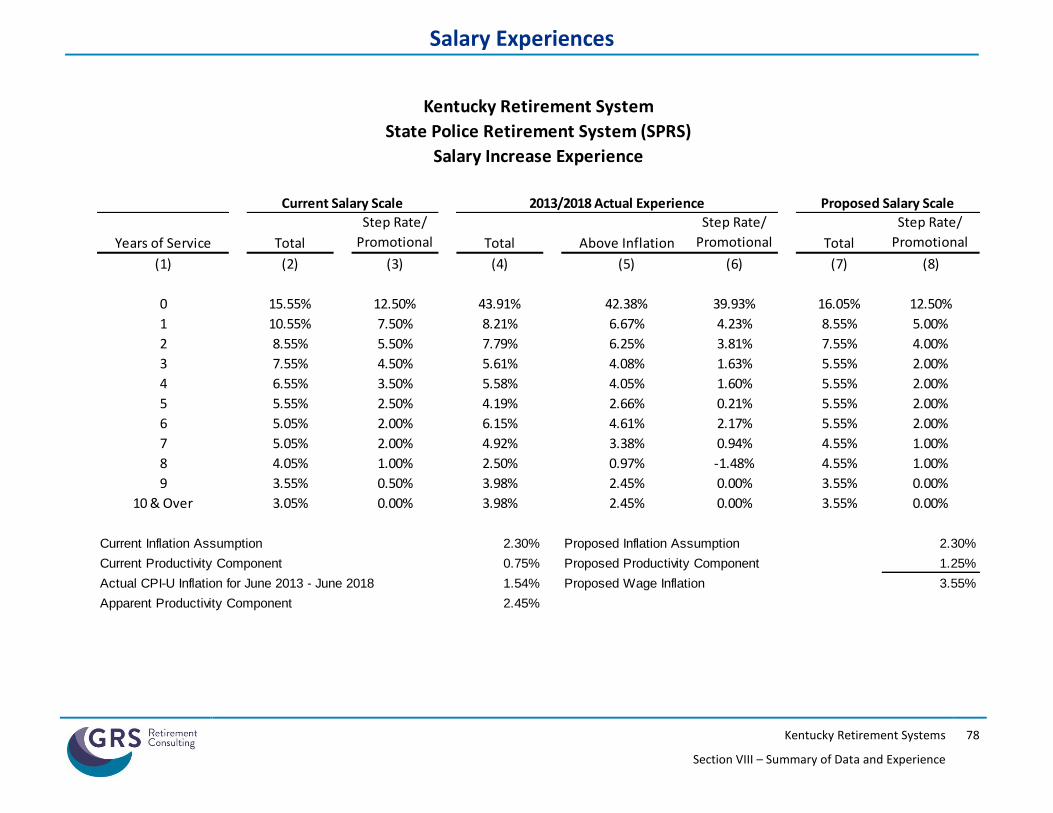
Salary Experiences
Kentucky Retirement Systems
Section VIII – Summary of Data and Experience
78
Kentucky Retirement System
State Police Retirement System (SPRS)
Salary Increase Experience
Current Salary Scale 2013/2018 Actual Experience Proposed Salary Scale
Years of Service Total
Step Rate/
Promotional Total Above Inflation
Step Rate/
Promotional Total
Step Rate/
Promotional
(1) (2) (3) (4) (5) (6) (7) (8)
0 15.55% 12.50% 43.91% 42.38% 39.93% 16.05% 12.50%
1 10.55% 7.50% 8.21% 6.67% 4.23% 8.55% 5.00%
2 8.55% 5.50% 7.79% 6.25% 3.81% 7.55% 4.00%
3 7.55% 4.50% 5.61% 4.08% 1.63% 5.55% 2.00%
4 6.55% 3.50% 5.58% 4.05% 1.60% 5.55% 2.00%
5 5.55% 2.50% 4.19% 2.66% 0.21% 5.55% 2.00%
6 5.05% 2.00% 6.15% 4.61% 2.17% 5.55% 2.00%
7 5.05% 2.00% 4.92% 3.38% 0.94% 4.55% 1.00%
8 4.05% 1.00% 2.50% 0.97% -1.48% 4.55% 1.00%
9 3.55% 0.50% 3.98% 2.45% 0.00% 3.55% 0.00%
10 & Over 3.05% 0.00% 3.98% 2.45% 0.00% 3.55% 0.00%
Current Inflation Assumption 2.30% Proposed Inflation Assumption 2.30%
Current Productivity Component 0.75% Proposed Productivity Component 1.25%
Actual CPI-U Inflation for June 2013 - June 2018 1.54% Proposed Wage Inflation 3.55%
Apparent Productivity Component 2.45%
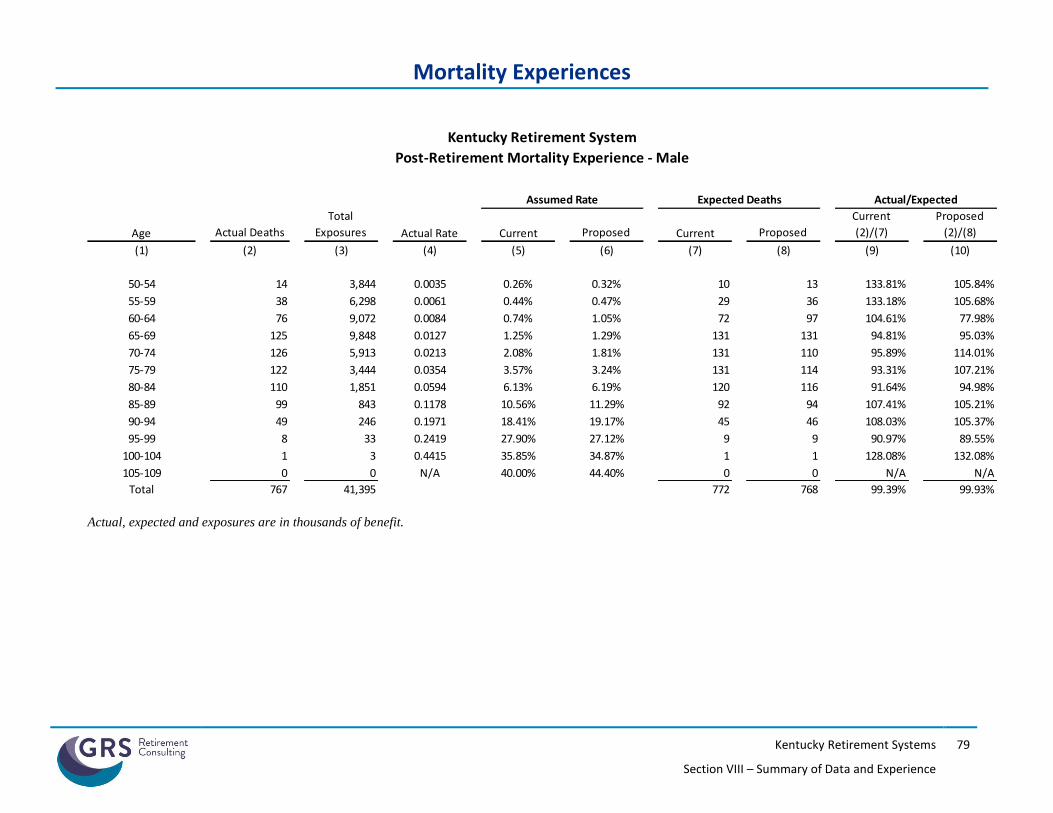
Mortality Experiences
Kentucky Retirement Systems
Section VIII – Summary of Data and Experience
79
Actual, expected and exposures are in thousands of benefit.
Kentucky Retirement System
Post-Retirement Mortality Experience - Male
Assumed Rate Expected Deaths Actual/Expected
Age Actual Deaths
Total
Exposures Actual Rate Current Proposed Current Proposed
Current
(2)/(7)
Proposed
(2)/(8)
(1) (2) (3) (4) (5) (6) (7) (8) (9) (10)
50-54 14 3,844 0.0035 0.26% 0.32% 10 13 133.81% 105.84%
55-59 38 6,298 0.0061 0.44% 0.47% 29 36 133.18% 105.68%
60-64 76 9,072 0.0084 0.74% 1.05% 72 97 104.61% 77.98%
65-69 125 9,848 0.0127 1.25% 1.29% 131 131 94.81% 95.03%
70-74 126 5,913 0.0213 2.08% 1.81% 131 110 95.89% 114.01%
75-79 122 3,444 0.0354 3.57% 3.24% 131 114 93.31% 107.21%
80-84 110 1,851 0.0594 6.13% 6.19% 120 116 91.64% 94.98%
85-89 99 843 0.1178 10.56% 11.29% 92 94 107.41% 105.21%
90-94 49 246 0.1971 18.41% 19.17% 45 46 108.03% 105.37%
95-99 8 33 0.2419 27.90% 27.12% 9 9 90.97% 89.55%
100-104 1 3 0.4415 35.85% 34.87% 1 1 128.08% 132.08%
105-109 0 0 N/A 40.00% 44.40% 0 0 N/A N/A
Total 767 41,395 772 768 99.39% 99.93%
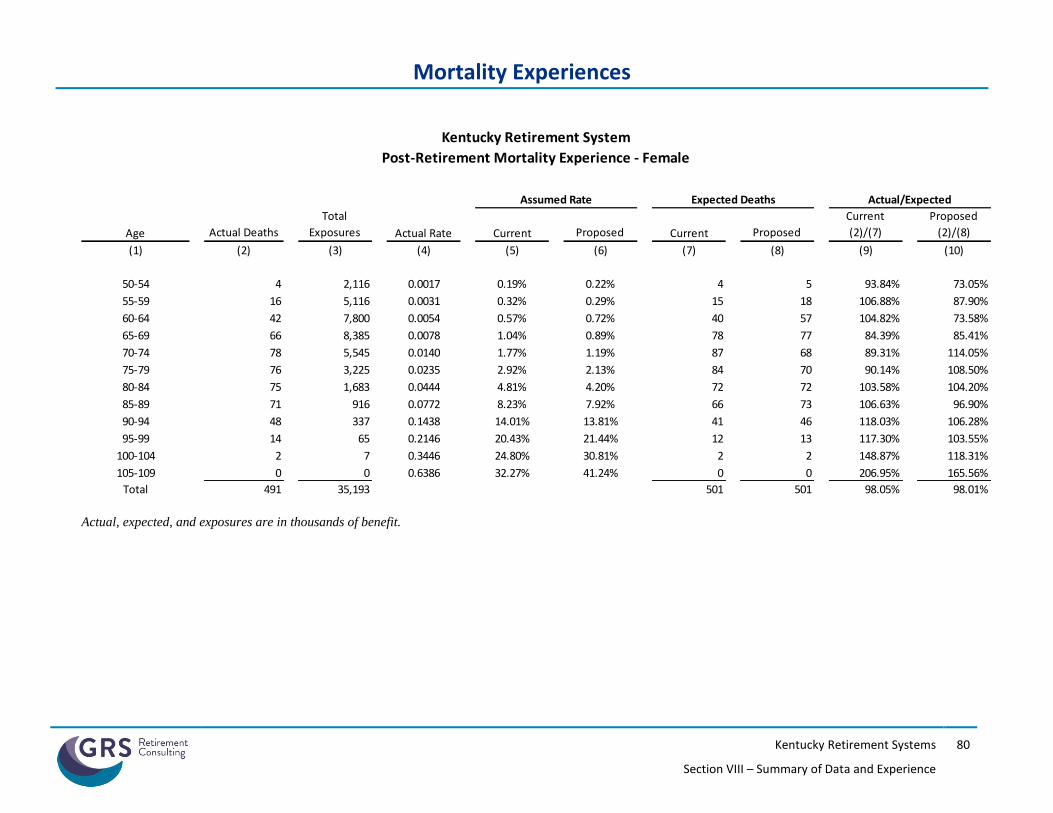
Mortality Experiences
Kentucky Retirement Systems
Section VIII – Summary of Data and Experience
80
Actual, expected, and exposures are in thousands of benefit.
Kentucky Retirement System
Post-Retirement Mortality Experience - Female
Assumed Rate Expected Deaths Actual/Expected
Age Actual Deaths
Total
Exposures Actual Rate Current Proposed Current Proposed
Current
(2)/(7)
Proposed
(2)/(8)
(1) (2) (3) (4) (5) (6) (7) (8) (9) (10)
50-54 4 2,116 0.0017 0.19% 0.22% 4 5 93.84% 73.05%
55-59 16 5,116 0.0031 0.32% 0.29% 15 18 106.88% 87.90%
60-64 42 7,800 0.0054 0.57% 0.72% 40 57 104.82% 73.58%
65-69 66 8,385 0.0078 1.04% 0.89% 78 77 84.39% 85.41%
70-74 78 5,545 0.0140 1.77% 1.19% 87 68 89.31% 114.05%
75-79 76 3,225 0.0235 2.92% 2.13% 84 70 90.14% 108.50%
80-84 75 1,683 0.0444 4.81% 4.20% 72 72 103.58% 104.20%
85-89 71 916 0.0772 8.23% 7.92% 66 73 106.63% 96.90%
90-94 48 337 0.1438 14.01% 13.81% 41 46 118.03% 106.28%
95-99 14 65 0.2146 20.43% 21.44% 12 13 117.30% 103.55%
100-104 2 7 0.3446 24.80% 30.81% 2 2 148.87% 118.31%
105-109 0 0 0.6386 32.27% 41.24% 0 0 206.95% 165.56%
Total 491 35,193 501 501 98.05% 98.01%
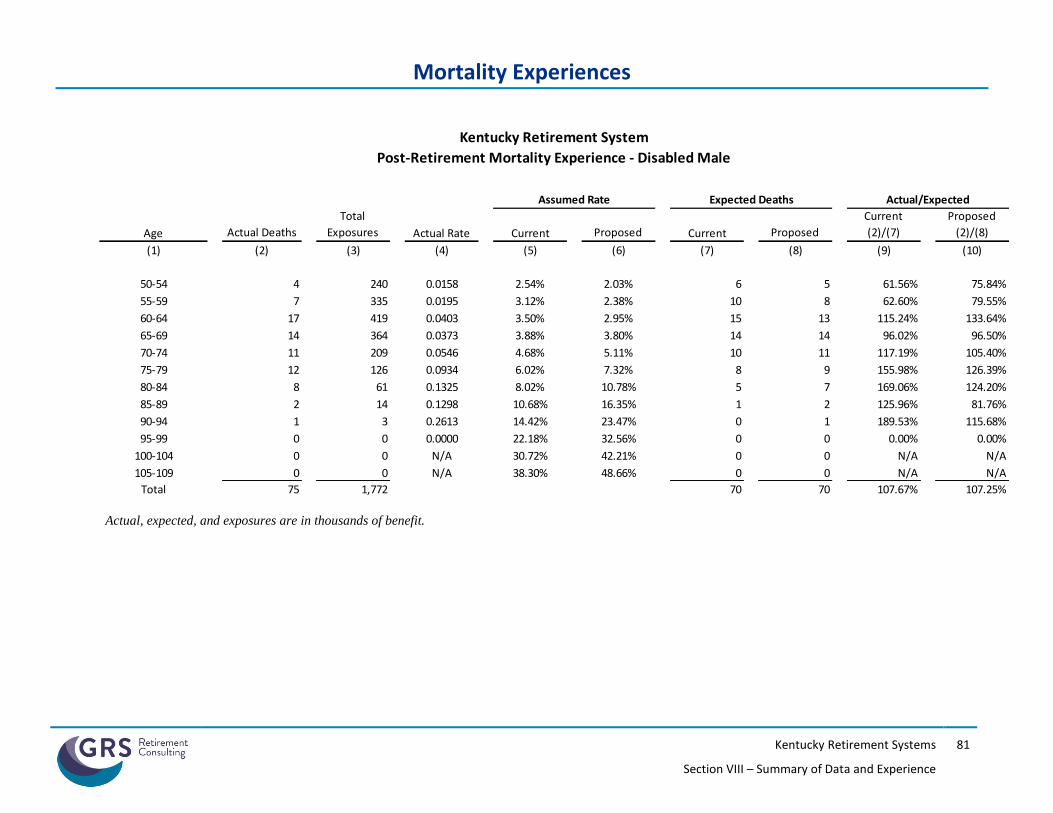
Mortality Experiences
Kentucky Retirement Systems
Section VIII – Summary of Data and Experience
81
Actual, expected, and exposures are in thousands of benefit.
Kentucky Retirement System
Post-Retirement Mortality Experience - Disabled Male
Assumed Rate Expected Deaths Actual/Expected
Age Actual Deaths
Total
Exposures Actual Rate Current Proposed Current Proposed
Current
(2)/(7)
Proposed
(2)/(8)
(1) (2) (3) (4) (5) (6) (7) (8) (9) (10)
50-54 4 240 0.0158 2.54% 2.03% 6 5 61.56% 75.84%
55-59 7 335 0.0195 3.12% 2.38% 10 8 62.60% 79.55%
60-64 17 419 0.0403 3.50% 2.95% 15 13 115.24% 133.64%
65-69 14 364 0.0373 3.88% 3.80% 14 14 96.02% 96.50%
70-74 11 209 0.0546 4.68% 5.11% 10 11 117.19% 105.40%
75-79 12 126 0.0934 6.02% 7.32% 8 9 155.98% 126.39%
80-84 8 61 0.1325 8.02% 10.78% 5 7 169.06% 124.20%
85-89 2 14 0.1298 10.68% 16.35% 1 2 125.96% 81.76%
90-94 1 3 0.2613 14.42% 23.47% 0 1 189.53% 115.68%
95-99 0 0 0.0000 22.18% 32.56% 0 0 0.00% 0.00%
100-104 0 0 N/A 30.72% 42.21% 0 0 N/A N/A
105-109 0 0 N/A 38.30% 48.66% 0 0 N/A N/A
Total 75 1,772 70 70 107.67% 107.25%
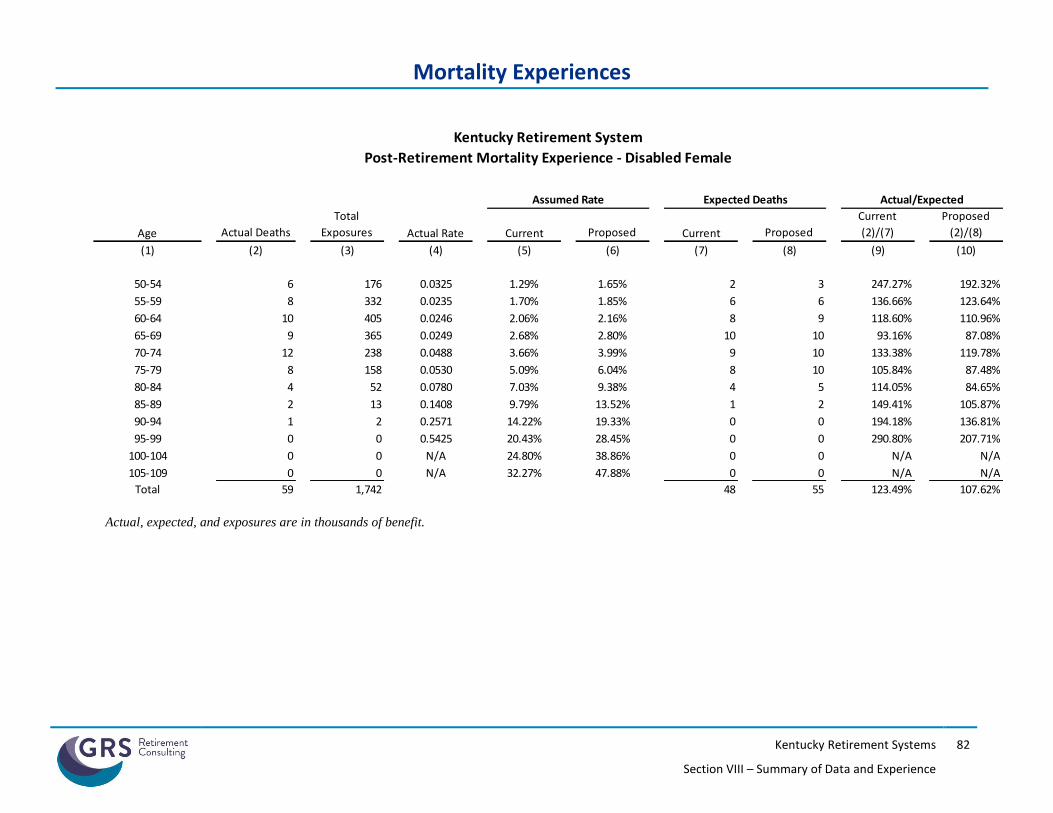
Mortality Experiences
Kentucky Retirement Systems
Section VIII – Summary of Data and Experience
82
Actual, expected, and exposures are in thousands of benefit.
Kentucky Retirement System
Post-Retirement Mortality Experience - Disabled Female
Assumed Rate Expected Deaths Actual/Expected
Age Actual Deaths
Total
Exposures Actual Rate Current Proposed Current Proposed
Current
(2)/(7)
Proposed
(2)/(8)
(1) (2) (3) (4) (5) (6) (7) (8) (9) (10)
50-54 6 176 0.0325 1.29% 1.65% 2 3 247.27% 192.32%
55-59 8 332 0.0235 1.70% 1.85% 6 6 136.66% 123.64%
60-64 10 405 0.0246 2.06% 2.16% 8 9 118.60% 110.96%
65-69 9 365 0.0249 2.68% 2.80% 10 10 93.16% 87.08%
70-74 12 238 0.0488 3.66% 3.99% 9 10 133.38% 119.78%
75-79 8 158 0.0530 5.09% 6.04% 8 10 105.84% 87.48%
80-84 4 52 0.0780 7.03% 9.38% 4 5 114.05% 84.65%
85-89 2 13 0.1408 9.79% 13.52% 1 2 149.41% 105.87%
90-94 1 2 0.2571 14.22% 19.33% 0 0 194.18% 136.81%
95-99 0 0 0.5425 20.43% 28.45% 0 0 290.80% 207.71%
100-104 0 0 N/A 24.80% 38.86% 0 0 N/A N/A
105-109 0 0 N/A 32.27% 47.88% 0 0 N/A N/A
Total 59 1,742 48 55 123.49% 107.62%
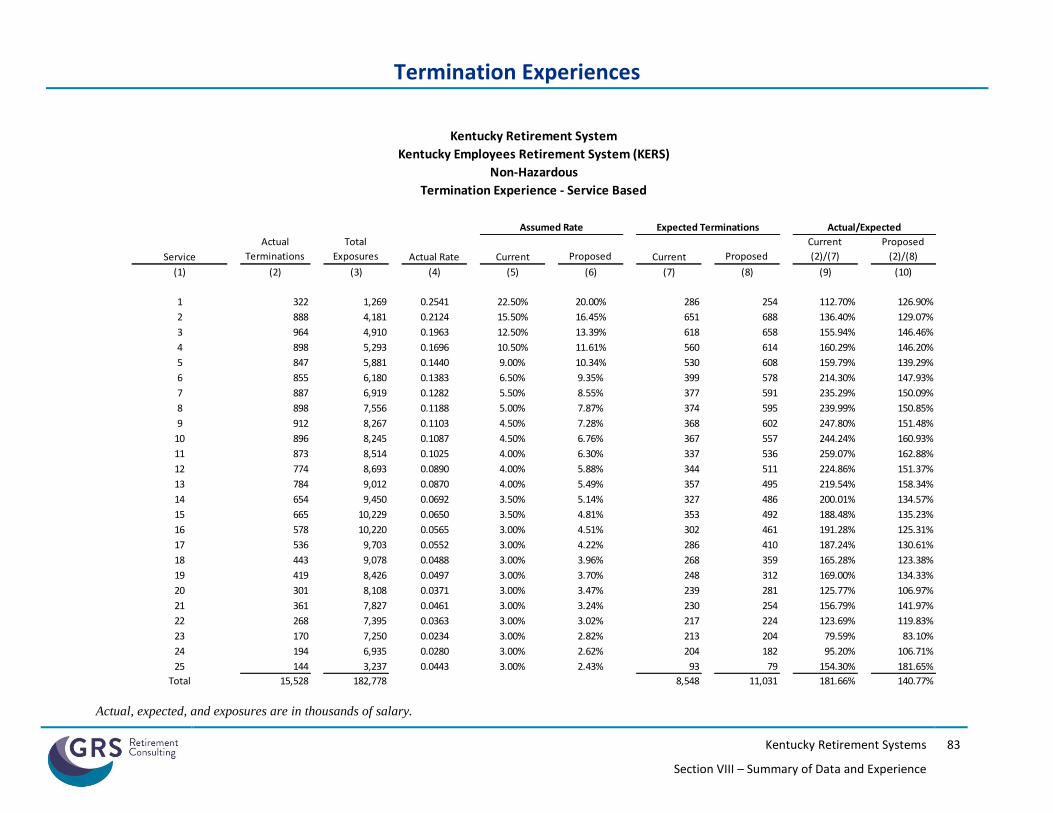
Termination Experiences
Kentucky Retirement Systems
Section VIII – Summary of Data and Experience
83
Actual, expected, and exposures are in thousands of salary.
Kentucky Retirement System Kentucky Retirement System
Kentucky Employees Retirement System (KERS) County Employees Retirement System (CERS)
Non-Hazardous Non-Hazardous
Termination Experience - Service Based Termination Experience - Service Based
Assumed Rate Expected Terminations Actual/Expected
Service
Actual
Terminations
Total
Exposures Actual Rate Current Proposed Current Proposed
Current
(2)/(7)
Proposed
(2)/(8)
(1) (2) (3) (4) (5) (6) (7) (8) (9) (10)
1 322 1,269 0.2541 22.50% 20.00% 286 254 112.70% 126.90%
2 888 4,181 0.2124 15.50% 16.45% 651 688 136.40% 129.07%
3 964 4,910 0.1963 12.50% 13.39% 618 658 155.94% 146.46%
4 898 5,293 0.1696 10.50% 11.61% 560 614 160.29% 146.20%
5 847 5,881 0.1440 9.00% 10.34% 530 608 159.79% 139.29%
6 855 6,180 0.1383 6.50% 9.35% 399 578 214.30% 147.93%
7 887 6,919 0.1282 5.50% 8.55% 377 591 235.29% 150.09%
8 898 7,556 0.1188 5.00% 7.87% 374 595 239.99% 150.85%
9 912 8,267 0.1103 4.50% 7.28% 368 602 247.80% 151.48%
10 896 8,245 0.1087 4.50% 6.76% 367 557 244.24% 160.93%
11 873 8,514 0.1025 4.00% 6.30% 337 536 259.07% 162.88%
12 774 8,693 0.0890 4.00% 5.88% 344 511 224.86% 151.37%
13 784 9,012 0.0870 4.00% 5.49% 357 495 219.54% 158.34%
14 654 9,450 0.0692 3.50% 5.14% 327 486 200.01% 134.57%
15 665 10,229 0.0650 3.50% 4.81% 353 492 188.48% 135.23%
16 578 10,220 0.0565 3.00% 4.51% 302 461 191.28% 125.31%
17 536 9,703 0.0552 3.00% 4.22% 286 410 187.24% 130.61%
18 443 9,078 0.0488 3.00% 3.96% 268 359 165.28% 123.38%
19 419 8,426 0.0497 3.00% 3.70% 248 312 169.00% 134.33%
20 301 8,108 0.0371 3.00% 3.47% 239 281 125.77% 106.97%
21 361 7,827 0.0461 3.00% 3.24% 230 254 156.79% 141.97%
22 268 7,395 0.0363 3.00% 3.02% 217 224 123.69% 119.83%
23 170 7,250 0.0234 3.00% 2.82% 213 204 79.59% 83.10%
24 194 6,935 0.0280 3.00% 2.62% 204 182 95.20% 106.71%
25 144 3,237 0.0443 3.00% 2.43% 93 79 154.30% 181.65%
Total 15,528 182,778 8,548 11,031 181.66% 140.77%
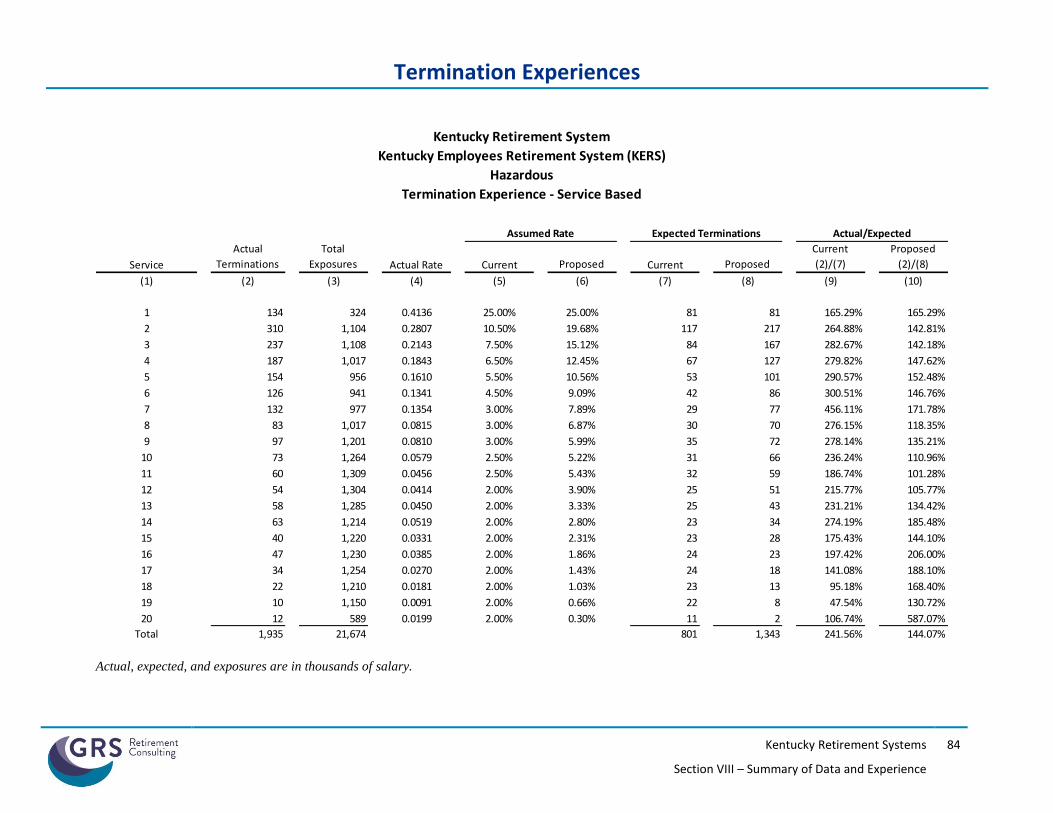
Termination Experiences
Kentucky Retirement Systems
Section VIII – Summary of Data and Experience
84
Actual, expected, and exposures are in thousands of salary.
Kentucky Retirement System Kentucky Retirement System
Kentucky Employees Retirement System (KERS) County Employees Retirement System (CERS)
Hazardous Hazardous
Termination Experience - Service Based Termination Experience - Service Based
Assumed Rate Expected Terminations Actual/Expected
Service
Actual
Terminations
Total
Exposures Actual Rate Current Proposed Current Proposed
Current
(2)/(7)
Proposed
(2)/(8)
(1) (2) (3) (4) (5) (6) (7) (8) (9) (10)
1 134 324 0.4136 25.00% 25.00% 81 81 165.29% 165.29%
2 310 1,104 0.2807 10.50% 19.68% 117 217 264.88% 142.81%
3 237 1,108 0.2143 7.50% 15.12% 84 167 282.67% 142.18%
4 187 1,017 0.1843 6.50% 12.45% 67 127 279.82% 147.62%
5 154 956 0.1610 5.50% 10.56% 53 101 290.57% 152.48%
6 126 941 0.1341 4.50% 9.09% 42 86 300.51% 146.76%
7 132 977 0.1354 3.00% 7.89% 29 77 456.11% 171.78%
8 83 1,017 0.0815 3.00% 6.87% 30 70 276.15% 118.35%
9 97 1,201 0.0810 3.00% 5.99% 35 72 278.14% 135.21%
10 73 1,264 0.0579 2.50% 5.22% 31 66 236.24% 110.96%
11 60 1,309 0.0456 2.50% 5.43% 32 59 186.74% 101.28%
12 54 1,304 0.0414 2.00% 3.90% 25 51 215.77% 105.77%
13 58 1,285 0.0450 2.00% 3.33% 25 43 231.21% 134.42%
14 63 1,214 0.0519 2.00% 2.80% 23 34 274.19% 185.48%
15 40 1,220 0.0331 2.00% 2.31% 23 28 175.43% 144.10%
16 47 1,230 0.0385 2.00% 1.86% 24 23 197.42% 206.00%
17 34 1,254 0.0270 2.00% 1.43% 24 18 141.08% 188.10%
18 22 1,210 0.0181 2.00% 1.03% 23 13 95.18% 168.40%
19 10 1,150 0.0091 2.00% 0.66% 22 8 47.54% 130.72%
20 12 589 0.0199 2.00% 0.30% 11 2 106.74% 587.07%
Total 1,935 21,674 801 1,343 241.56% 144.07%

Termination Experiences
Kentucky Retirement Systems
Section VIII – Summary of Data and Experience
85
Actual, expected, and exposures are in thousands of salary.
Kentucky Retirement System
County Employees Retirement System (CERS)
Non-Hazardous
Termination Experience - Service Based
Assumed Rate Expected Terminations Actual/Expected
Service
Actual
Terminations
Total
Exposures Actual Rate Current Proposed Current Proposed
Current
(2)/(7)
Proposed
(2)/(8)
(1) (2) (3) (4) (5) (6) (7) (8) (9) (10)
1 468 1,864 0.2511 28.00% 20.00% 524 373 89.33% 125.49%
2 1,205 5,895 0.2044 16.00% 15.58% 949 919 126.94% 131.09%
3 996 6,278 0.1586 12.00% 12.48% 760 783 131.01% 127.16%
4 852 6,644 0.1282 10.00% 10.66% 672 708 126.78% 120.33%
5 727 6,836 0.1064 8.00% 9.37% 548 641 132.74% 113.48%
6 694 7,112 0.0975 6.00% 8.37% 422 596 164.34% 116.36%
7 685 7,461 0.0918 5.00% 7.56% 368 564 186.15% 121.46%
8 678 7,751 0.0874 5.00% 6.87% 382 532 177.36% 127.35%
9 645 8,039 0.0802 4.00% 6.27% 317 504 203.34% 127.89%
10 642 8,381 0.0766 4.00% 5.74% 330 481 194.54% 133.47%
11 602 8,499 0.0708 4.00% 5.27% 336 448 179.13% 134.35%
12 574 8,853 0.0649 4.00% 4.84% 350 429 164.12% 133.90%
13 548 9,302 0.0589 4.00% 4.45% 367 414 149.32% 132.36%
14 568 10,037 0.0566 4.00% 4.09% 396 411 143.49% 138.25%
15 477 10,681 0.0447 3.00% 3.76% 315 402 151.49% 118.70%
16 477 10,973 0.0435 3.00% 3.45% 323 379 147.62% 125.81%
17 372 10,708 0.0348 3.00% 3.16% 315 339 118.19% 109.82%
18 364 10,241 0.0356 3.00% 2.89% 301 296 120.97% 123.01%
19 276 9,580 0.0288 3.00% 2.64% 281 252 98.26% 109.56%
20 235 8,872 0.0265 3.00% 2.39% 260 212 90.57% 111.08%
21 265 7,849 0.0338 3.00% 2.16% 230 170 115.43% 156.18%
22 163 6,895 0.0236 3.00% 1.94% 202 134 80.57% 121.45%
23 130 6,306 0.0206 3.00% 1.74% 185 109 70.33% 119.37%
24 109 5,641 0.0193 3.00% 1.54% 165 87 66.04% 125.25%
25 79 2,633 0.0300 3.00% 1.35% 75 35 105.46% 225.99%
Total 12,831 193,329 9,373 10,218 136.90% 125.58%
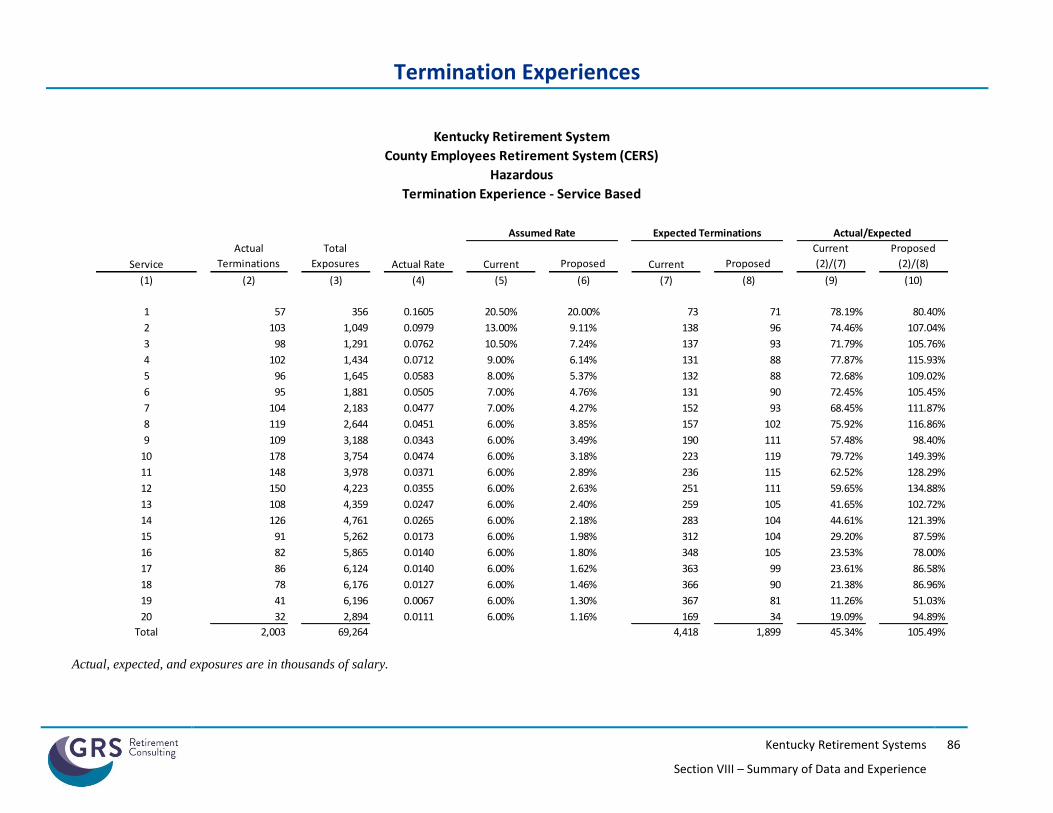
Termination Experiences
Kentucky Retirement Systems
Section VIII – Summary of Data and Experience
86
Actual, expected, and exposures are in thousands of salary.
Kentucky Retirement System
County Employees Retirement System (CERS)
Hazardous
Termination Experience - Service Based
Assumed Rate Expected Terminations Actual/Expected
Service
Actual
Terminations
Total
Exposures Actual Rate Current Proposed Current Proposed
Current
(2)/(7)
Proposed
(2)/(8)
(1) (2) (3) (4) (5) (6) (7) (8) (9) (10)
1 57 356 0.1605 20.50% 20.00% 73 71 78.19% 80.40%
2 103 1,049 0.0979 13.00% 9.11% 138 96 74.46% 107.04%
3 98 1,291 0.0762 10.50% 7.24% 137 93 71.79% 105.76%
4 102 1,434 0.0712 9.00% 6.14% 131 88 77.87% 115.93%
5 96 1,645 0.0583 8.00% 5.37% 132 88 72.68% 109.02%
6 95 1,881 0.0505 7.00% 4.76% 131 90 72.45% 105.45%
7 104 2,183 0.0477 7.00% 4.27% 152 93 68.45% 111.87%
8 119 2,644 0.0451 6.00% 3.85% 157 102 75.92% 116.86%
9 109 3,188 0.0343 6.00% 3.49% 190 111 57.48% 98.40%
10 178 3,754 0.0474 6.00% 3.18% 223 119 79.72% 149.39%
11 148 3,978 0.0371 6.00% 2.89% 236 115 62.52% 128.29%
12 150 4,223 0.0355 6.00% 2.63% 251 111 59.65% 134.88%
13 108 4,359 0.0247 6.00% 2.40% 259 105 41.65% 102.72%
14 126 4,761 0.0265 6.00% 2.18% 283 104 44.61% 121.39%
15 91 5,262 0.0173 6.00% 1.98% 312 104 29.20% 87.59%
16 82 5,865 0.0140 6.00% 1.80% 348 105 23.53% 78.00%
17 86 6,124 0.0140 6.00% 1.62% 363 99 23.61% 86.58%
18 78 6,176 0.0127 6.00% 1.46% 366 90 21.38% 86.96%
19 41 6,196 0.0067 6.00% 1.30% 367 81 11.26% 51.03%
20 32 2,894 0.0111 6.00% 1.16% 169 34 19.09% 94.89%
Total 2,003 69,264 4,418 1,899 45.34% 105.49%
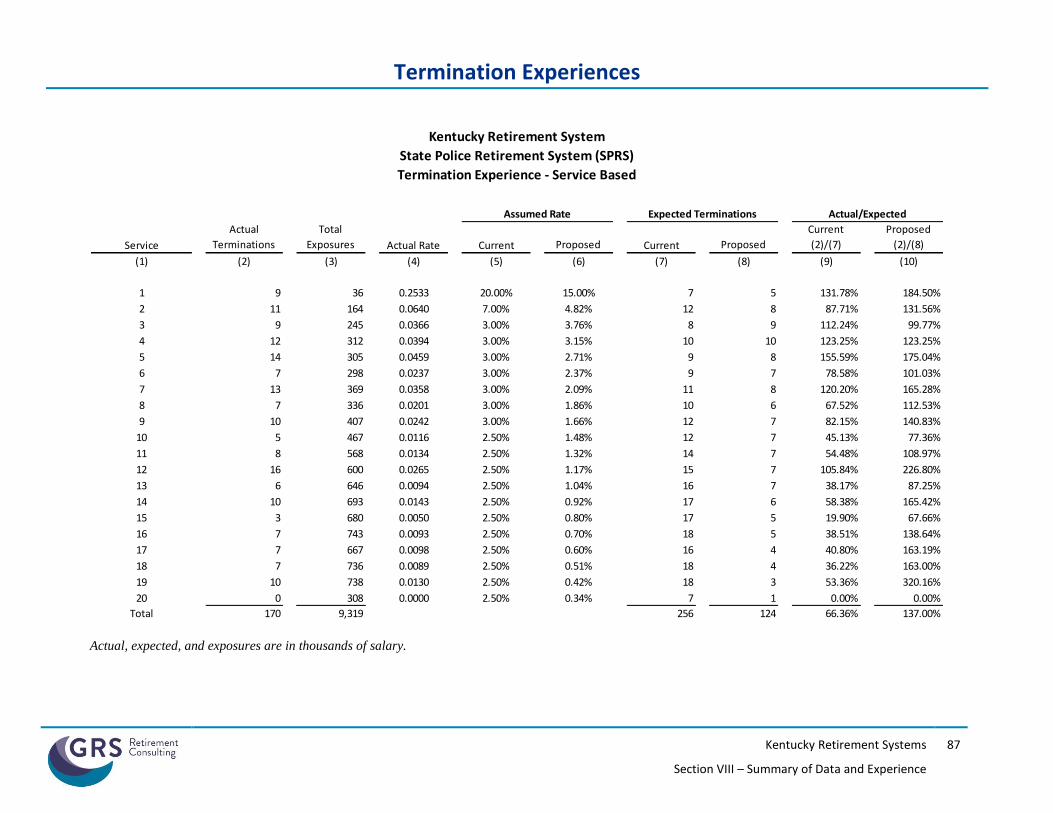
Termination Experiences
Kentucky Retirement Systems
Section VIII – Summary of Data and Experience
87
Actual, expected, and exposures are in thousands of salary.
Kentucky Retirement System
State Police Retirement System (SPRS)
Termination Experience - Service Based
Assumed Rate Expected Terminations Actual/Expected
Service
Actual
Terminations
Total
Exposures Actual Rate Current Proposed Current Proposed
Current
(2)/(7)
Proposed
(2)/(8)
(1) (2) (3) (4) (5) (6) (7) (8) (9) (10)
1 9 36 0.2533 20.00% 15.00% 7 5 131.78% 184.50%
2 11 164 0.0640 7.00% 4.82% 12 8 87.71% 131.56%
3 9 245 0.0366 3.00% 3.76% 8 9 112.24% 99.77%
4 12 312 0.0394 3.00% 3.15% 10 10 123.25% 123.25%
5 14 305 0.0459 3.00% 2.71% 9 8 155.59% 175.04%
6 7 298 0.0237 3.00% 2.37% 9 7 78.58% 101.03%
7 13 369 0.0358 3.00% 2.09% 11 8 120.20% 165.28%
8 7 336 0.0201 3.00% 1.86% 10 6 67.52% 112.53%
9 10 407 0.0242 3.00% 1.66% 12 7 82.15% 140.83%
10 5 467 0.0116 2.50% 1.48% 12 7 45.13% 77.36%
11 8 568 0.0134 2.50% 1.32% 14 7 54.48% 108.97%
12 16 600 0.0265 2.50% 1.17% 15 7 105.84% 226.80%
13 6 646 0.0094 2.50% 1.04% 16 7 38.17% 87.25%
14 10 693 0.0143 2.50% 0.92% 17 6 58.38% 165.42%
15 3 680 0.0050 2.50% 0.80% 17 5 19.90% 67.66%
16 7 743 0.0093 2.50% 0.70% 18 5 38.51% 138.64%
17 7 667 0.0098 2.50% 0.60% 16 4 40.80% 163.19%
18 7 736 0.0089 2.50% 0.51% 18 4 36.22% 163.00%
19 10 738 0.0130 2.50% 0.42% 18 3 53.36% 320.16%
20 0 308 0.0000 2.50% 0.34% 7 1 0.00% 0.00%
Total 170 9,319 256 124 66.36% 137.00%
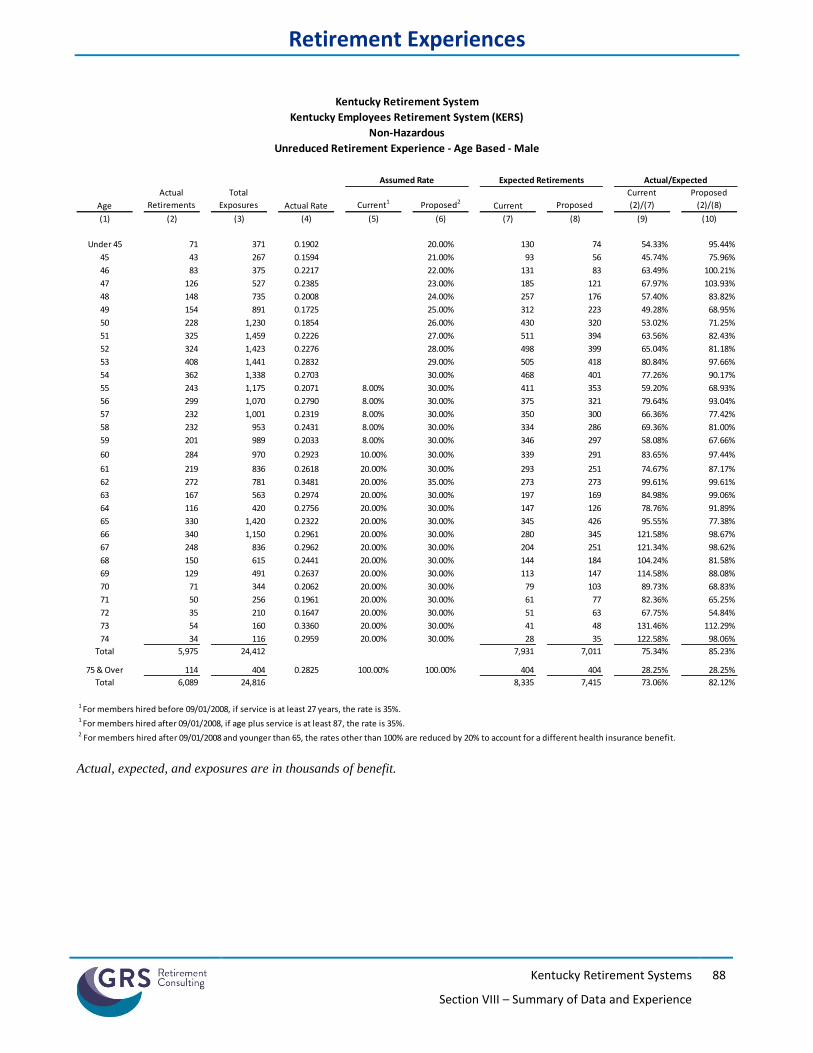
Retirement Experiences
Kentucky Retirement Systems
Section VIII – Summary of Data and Experience
88
Actual, expected, and exposures are in thousands of benefit.
Kentucky Retirement System Kentucky Retirement System
Kentucky Employees Retirement System (KERS) County Employees Retirement System (CERS)
Non-Hazardous Non-Hazardous
Unreduced Retirement Experience - Age Based - Male Unreduced Retirement Experience - Age Based - Male
Assumed Rate Expected Retirements Actual/Expected
Age
Actual
Retirements
Total
Exposures Actual Rate Current1 Proposed2Current Proposed
Current
(2)/(7)
Proposed
(2)/(8)
(1) (2) (3) (4) (5) (6) (7) (8) (9) (10)
Under 45 71 371 0.1902 20.00% 130 74 54.33% 95.44%
45 43 267 0.1594 21.00% 93 56 45.74% 75.96%
46 83 375 0.2217 22.00% 131 83 63.49% 100.21%
47 126 527 0.2385 23.00% 185 121 67.97% 103.93%
48 148 735 0.2008 24.00% 257 176 57.40% 83.82%
49 154 891 0.1725 25.00% 312 223 49.28% 68.95%
50 228 1,230 0.1854 26.00% 430 320 53.02% 71.25%
51 325 1,459 0.2226 27.00% 511 394 63.56% 82.43%
52 324 1,423 0.2276 28.00% 498 399 65.04% 81.18%
53 408 1,441 0.2832 29.00% 505 418 80.84% 97.66%
54 362 1,338 0.2703 30.00% 468 401 77.26% 90.17%
55 243 1,175 0.2071 8.00% 30.00% 411 353 59.20% 68.93%
56 299 1,070 0.2790 8.00% 30.00% 375 321 79.64% 93.04%
57 232 1,001 0.2319 8.00% 30.00% 350 300 66.36% 77.42%
58 232 953 0.2431 8.00% 30.00% 334 286 69.36% 81.00%
59 201 989 0.2033 8.00% 30.00% 346 297 58.08% 67.66%
60 284 970 0.2923 10.00% 30.00% 339 291 83.65% 97.44%
61 219 836 0.2618 20.00% 30.00% 293 251 74.67% 87.17%
62 272 781 0.3481 20.00% 35.00% 273 273 99.61% 99.61%
63 167 563 0.2974 20.00% 30.00% 197 169 84.98% 99.06%
64 116 420 0.2756 20.00% 30.00% 147 126 78.76% 91.89%
65 330 1,420 0.2322 20.00% 30.00% 345 426 95.55% 77.38%
66 340 1,150 0.2961 20.00% 30.00% 280 345 121.58% 98.67%
67 248 836 0.2962 20.00% 30.00% 204 251 121.34% 98.62%
68 150 615 0.2441 20.00% 30.00% 144 184 104.24% 81.58%
69 129 491 0.2637 20.00% 30.00% 113 147 114.58% 88.08%
70 71 344 0.2062 20.00% 30.00% 79 103 89.73% 68.83%
71 50 256 0.1961 20.00% 30.00% 61 77 82.36% 65.25%
72 35 210 0.1647 20.00% 30.00% 51 63 67.75% 54.84%
73 54 160 0.3360 20.00% 30.00% 41 48 131.46% 112.29%
74 34 116 0.2959 20.00% 30.00% 28 35 122.58% 98.06%
Total 5,975 24,412 7,931 7,011 75.34% 85.23%
75 & Over 114 404 0.2825 100.00% 100.00% 404 404 28.25% 28.25%
Total 6,089 24,816 8,335 7,415 73.06% 82.12%
1 For members hired before 09/01/2008, if service is at least 27 years, the rate is 35%.1 For members hired after 09/01/2008, if age plus service is at least 87, the rate is 35%.2 For members hired after 09/01/2008 and younger than 65, the rates other than 100% are reduced by 20% to account for a different health insurance benefit.
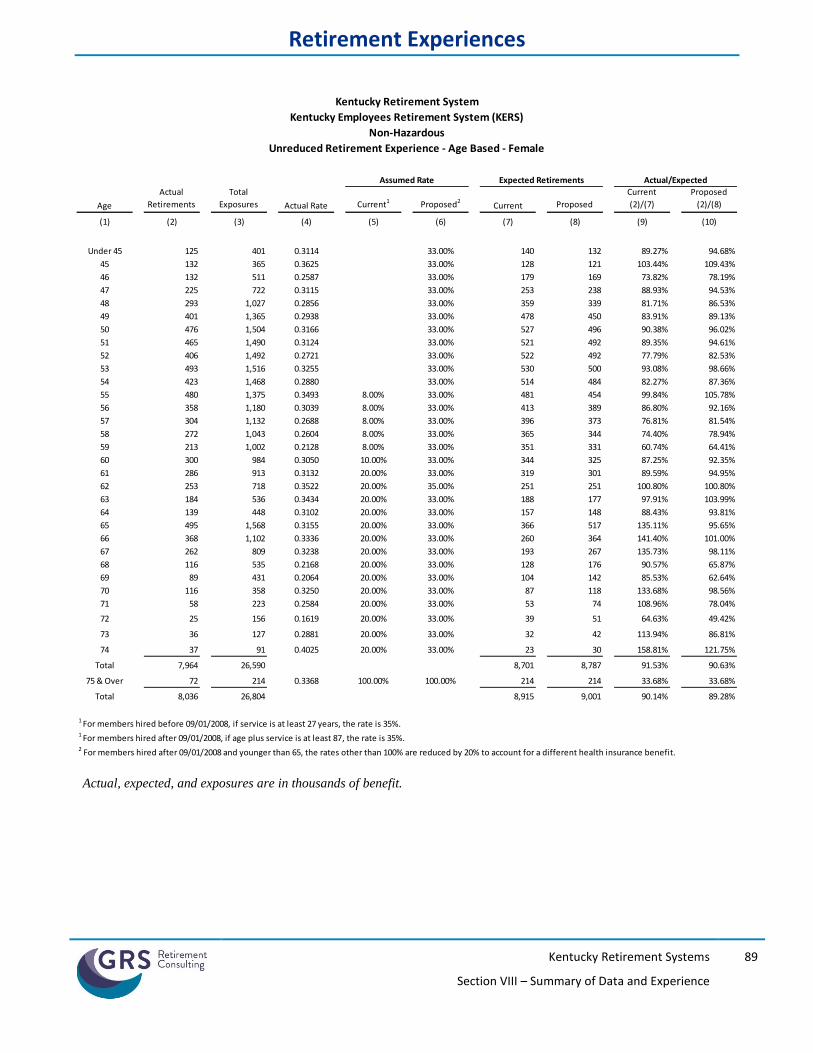
Retirement Experiences
Kentucky Retirement Systems
Section VIII – Summary of Data and Experience
89
Actual, expected, and exposures are in thousands of benefit.
Kentucky Retirement System Kentucky Retirement System
Kentucky Employees Retirement System (KERS) County Employees Retirement System (CERS)
Non-Hazardous Non-Hazardous
Unreduced Retirement Experience - Age Based - Female Unreduced Retirement Experience - Age Based - Female
Assumed Rate Expected Retirements Actual/Expected
Age
Actual
Retirements
Total
Exposures Actual Rate Current1 Proposed2Current Proposed
Current
(2)/(7)
Proposed
(2)/(8)
(1) (2) (3) (4) (5) (6) (7) (8) (9) (10)
Under 45 125 401 0.3114 33.00% 140 132 89.27% 94.68%
45 132 365 0.3625 33.00% 128 121 103.44% 109.43%
46 132 511 0.2587 33.00% 179 169 73.82% 78.19%
47 225 722 0.3115 33.00% 253 238 88.93% 94.53%
48 293 1,027 0.2856 33.00% 359 339 81.71% 86.53%
49 401 1,365 0.2938 33.00% 478 450 83.91% 89.13%
50 476 1,504 0.3166 33.00% 527 496 90.38% 96.02%
51 465 1,490 0.3124 33.00% 521 492 89.35% 94.61%
52 406 1,492 0.2721 33.00% 522 492 77.79% 82.53%
53 493 1,516 0.3255 33.00% 530 500 93.08% 98.66%
54 423 1,468 0.2880 33.00% 514 484 82.27% 87.36%
55 480 1,375 0.3493 8.00% 33.00% 481 454 99.84% 105.78%
56 358 1,180 0.3039 8.00% 33.00% 413 389 86.80% 92.16%
57 304 1,132 0.2688 8.00% 33.00% 396 373 76.81% 81.54%
58 272 1,043 0.2604 8.00% 33.00% 365 344 74.40% 78.94%
59 213 1,002 0.2128 8.00% 33.00% 351 331 60.74% 64.41%
60 300 984 0.3050 10.00% 33.00% 344 325 87.25% 92.35%
61 286 913 0.3132 20.00% 33.00% 319 301 89.59% 94.95%
62 253 718 0.3522 20.00% 35.00% 251 251 100.80% 100.80%
63 184 536 0.3434 20.00% 33.00% 188 177 97.91% 103.99%
64 139 448 0.3102 20.00% 33.00% 157 148 88.43% 93.81%
65 495 1,568 0.3155 20.00% 33.00% 366 517 135.11% 95.65%
66 368 1,102 0.3336 20.00% 33.00% 260 364 141.40% 101.00%
67 262 809 0.3238 20.00% 33.00% 193 267 135.73% 98.11%
68 116 535 0.2168 20.00% 33.00% 128 176 90.57% 65.87%
69 89 431 0.2064 20.00% 33.00% 104 142 85.53% 62.64%
70 116 358 0.3250 20.00% 33.00% 87 118 133.68% 98.56%
71 58 223 0.2584 20.00% 33.00% 53 74 108.96% 78.04%
72 25 156 0.1619 20.00% 33.00% 39 51 64.63% 49.42%
73 36 127 0.2881 20.00% 33.00% 32 42 113.94% 86.81%
74 37 91 0.4025 20.00% 33.00% 23 30 158.81% 121.75%
Total 7,964 26,590 8,701 8,787 91.53% 90.63%
75 & Over 72 214 0.3368 100.00% 100.00% 214 214 33.68% 33.68%
Total 8,036 26,804 8,915 9,001 90.14% 89.28%
1 For members hired before 09/01/2008, if service is at least 27 years, the rate is 35%.1 For members hired after 09/01/2008, if age plus service is at least 87, the rate is 35%.2 For members hired after 09/01/2008 and younger than 65, the rates other than 100% are reduced by 20% to account for a different health insurance benefit.
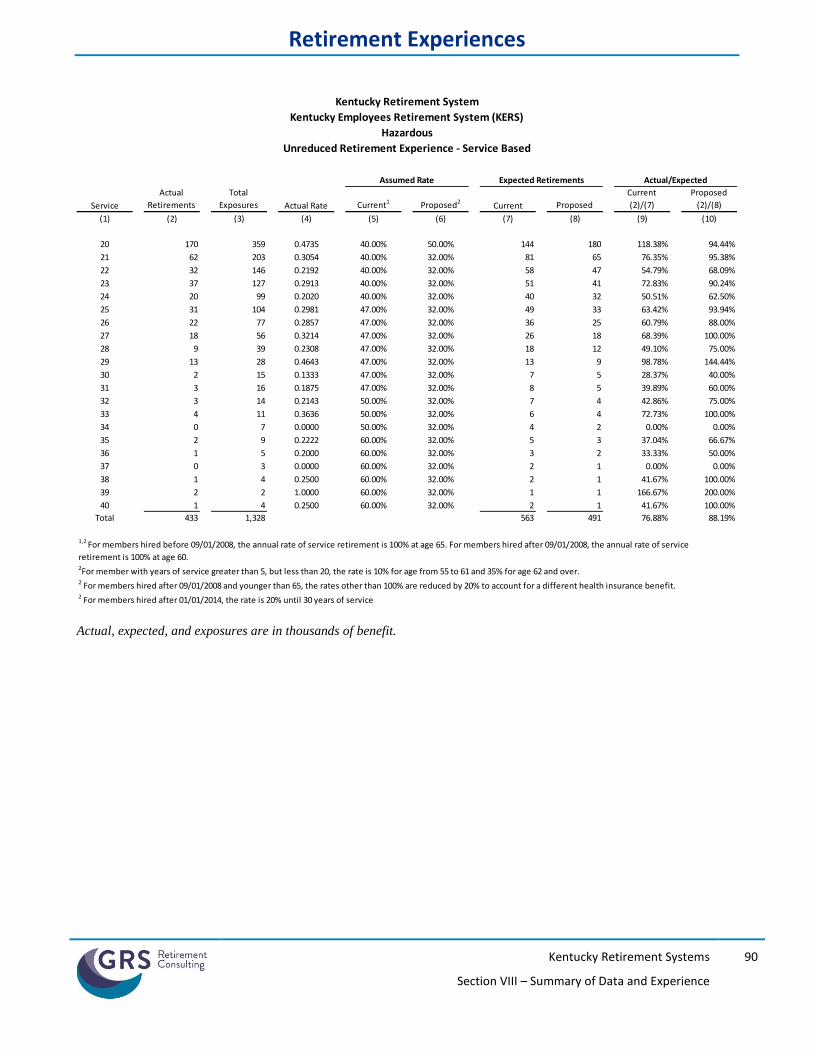
Retirement Experiences
Kentucky Retirement Systems
Section VIII – Summary of Data and Experience
90
Actual, expected, and exposures are in thousands of benefit.
Kentucky Retirement System Kentucky Retirement System
Kentucky Employees Retirement System (KERS) County Employees Retirement System (CERS)
Hazardous Hazardous
Unreduced Retirement Experience - Service Based Unreduced Retirement Experience - Service Based
Assumed Rate Expected Retirements Actual/Expected
Service
Actual
Retirements
Total
Exposures Actual Rate Current1 Proposed2Current Proposed
Current
(2)/(7)
Proposed
(2)/(8)
(1) (2) (3) (4) (5) (6) (7) (8) (9) (10)
20 170 359 0.4735 40.00% 50.00% 144 180 118.38% 94.44%
21 62 203 0.3054 40.00% 32.00% 81 65 76.35% 95.38%
22 32 146 0.2192 40.00% 32.00% 58 47 54.79% 68.09%
23 37 127 0.2913 40.00% 32.00% 51 41 72.83% 90.24%
24 20 99 0.2020 40.00% 32.00% 40 32 50.51% 62.50%
25 31 104 0.2981 47.00% 32.00% 49 33 63.42% 93.94%
26 22 77 0.2857 47.00% 32.00% 36 25 60.79% 88.00%
27 18 56 0.3214 47.00% 32.00% 26 18 68.39% 100.00%
28 9 39 0.2308 47.00% 32.00% 18 12 49.10% 75.00%
29 13 28 0.4643 47.00% 32.00% 13 9 98.78% 144.44%
30 2 15 0.1333 47.00% 32.00% 7 5 28.37% 40.00%
31 3 16 0.1875 47.00% 32.00% 8 5 39.89% 60.00%
32 3 14 0.2143 50.00% 32.00% 7 4 42.86% 75.00%
33 4 11 0.3636 50.00% 32.00% 6 4 72.73% 100.00%
34 0 7 0.0000 50.00% 32.00% 4 2 0.00% 0.00%
35 2 9 0.2222 60.00% 32.00% 5 3 37.04% 66.67%
36 1 5 0.2000 60.00% 32.00% 3 2 33.33% 50.00%
37 0 3 0.0000 60.00% 32.00% 2 1 0.00% 0.00%
38 1 4 0.2500 60.00% 32.00% 2 1 41.67% 100.00%
39 2 2 1.0000 60.00% 32.00% 1 1 166.67% 200.00%
40 1 4 0.2500 60.00% 32.00% 2 1 41.67% 100.00%
Total 433 1,328 563 491 76.88% 88.19%
1,2 For members hired before 09/01/2008, the annual rate of service retirement is 100% at age 65. For members hired after 09/01/2008, the annual rate of service
retirement is 100% at age 60.2For member with years of service greater than 5, but less than 20, the rate is 10% for age from 55 to 61 and 35% for age 62 and over.2 For members hired after 09/01/2008 and younger than 65, the rates other than 100% are reduced by 20% to account for a different health insurance benefit.2 For members hired after 01/01/2014, the rate is 20% until 30 years of service
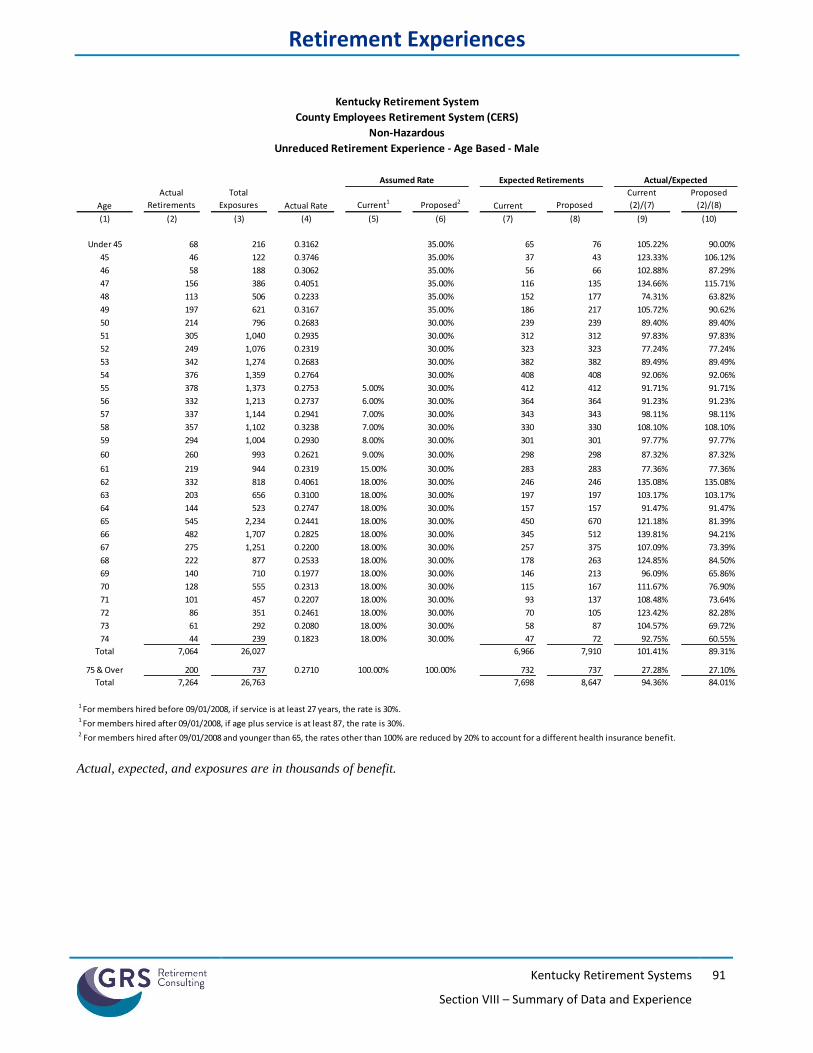
Retirement Experiences
Kentucky Retirement Systems
Section VIII – Summary of Data and Experience
91
Actual, expected, and exposures are in thousands of benefit.
Kentucky Retirement System Kentucky Retirement System
County Employees Retirement System (CERS) State Police Retirement System (SPRS)
Non-Hazardous Members hired before 09/01/2008
Unreduced Retirement Experience - Age Based - Male Unreduced Retirement Experience - Service Based - M&F
Assumed Rate Expected Retirements Actual/Expected
Age
Actual
Retirements
Total
Exposures Actual Rate Current1 Proposed2Current Proposed
Current
(2)/(7)
Proposed
(2)/(8)
(1) (2) (3) (4) (5) (6) (7) (8) (9) (10)
Under 45 68 216 0.3162 35.00% 65 76 105.22% 90.00%
45 46 122 0.3746 35.00% 37 43 123.33% 106.12%
46 58 188 0.3062 35.00% 56 66 102.88% 87.29%
47 156 386 0.4051 35.00% 116 135 134.66% 115.71%
48 113 506 0.2233 35.00% 152 177 74.31% 63.82%
49 197 621 0.3167 35.00% 186 217 105.72% 90.62%
50 214 796 0.2683 30.00% 239 239 89.40% 89.40%
51 305 1,040 0.2935 30.00% 312 312 97.83% 97.83%
52 249 1,076 0.2319 30.00% 323 323 77.24% 77.24%
53 342 1,274 0.2683 30.00% 382 382 89.49% 89.49%
54 376 1,359 0.2764 30.00% 408 408 92.06% 92.06%
55 378 1,373 0.2753 5.00% 30.00% 412 412 91.71% 91.71%
56 332 1,213 0.2737 6.00% 30.00% 364 364 91.23% 91.23%
57 337 1,144 0.2941 7.00% 30.00% 343 343 98.11% 98.11%
58 357 1,102 0.3238 7.00% 30.00% 330 330 108.10% 108.10%
59 294 1,004 0.2930 8.00% 30.00% 301 301 97.77% 97.77%
60 260 993 0.2621 9.00% 30.00% 298 298 87.32% 87.32%
61 219 944 0.2319 15.00% 30.00% 283 283 77.36% 77.36%
62 332 818 0.4061 18.00% 30.00% 246 246 135.08% 135.08%
63 203 656 0.3100 18.00% 30.00% 197 197 103.17% 103.17%
64 144 523 0.2747 18.00% 30.00% 157 157 91.47% 91.47%
65 545 2,234 0.2441 18.00% 30.00% 450 670 121.18% 81.39%
66 482 1,707 0.2825 18.00% 30.00% 345 512 139.81% 94.21%
67 275 1,251 0.2200 18.00% 30.00% 257 375 107.09% 73.39%
68 222 877 0.2533 18.00% 30.00% 178 263 124.85% 84.50%
69 140 710 0.1977 18.00% 30.00% 146 213 96.09% 65.86%
70 128 555 0.2313 18.00% 30.00% 115 167 111.67% 76.90%
71 101 457 0.2207 18.00% 30.00% 93 137 108.48% 73.64%
72 86 351 0.2461 18.00% 30.00% 70 105 123.42% 82.28%
73 61 292 0.2080 18.00% 30.00% 58 87 104.57% 69.72%
74 44 239 0.1823 18.00% 30.00% 47 72 92.75% 60.55%
Total 7,064 26,027 6,966 7,910 101.41% 89.31%
75 & Over 200 737 0.2710 100.00% 100.00% 732 737 27.28% 27.10%
Total 7,264 26,763 7,698 8,647 94.36% 84.01%
1 For members hired before 09/01/2008, if service is at least 27 years, the rate is 30%.1 For members hired after 09/01/2008, if age plus service is at least 87, the rate is 30%.2 For members hired after 09/01/2008 and younger than 65, the rates other than 100% are reduced by 20% to account for a different health insurance benefit.
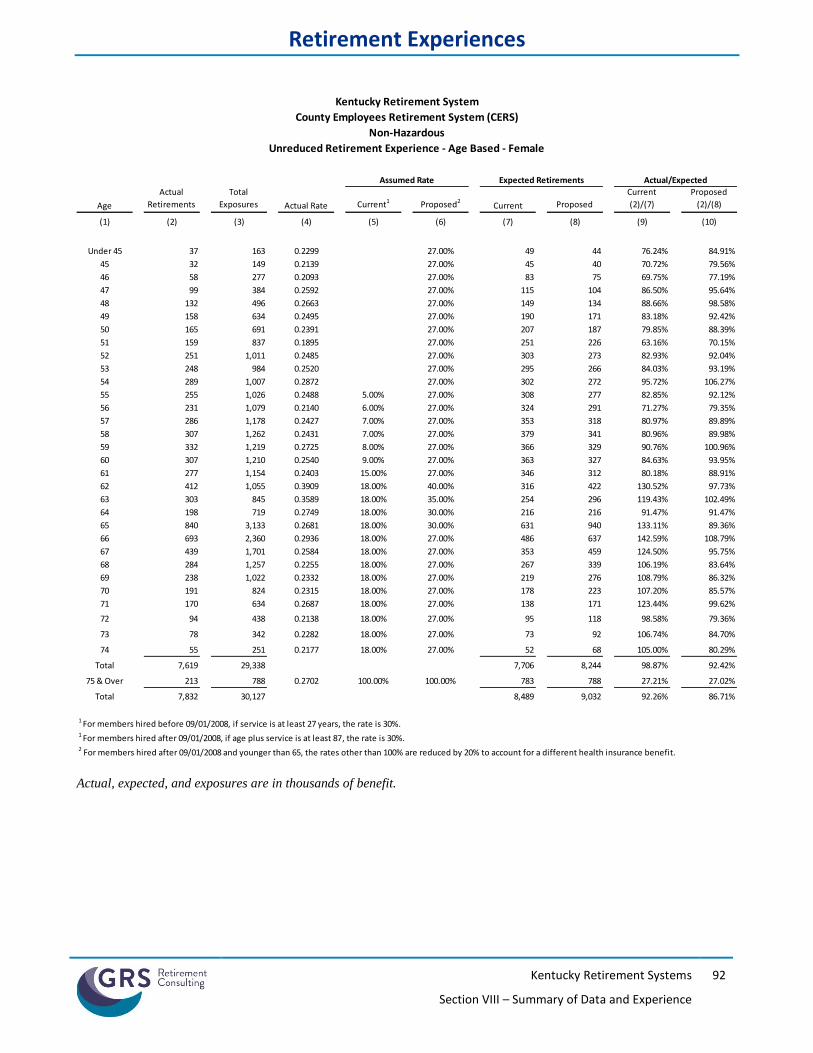
Retirement Experiences
Kentucky Retirement Systems
Section VIII – Summary of Data and Experience
92
Actual, expected, and exposures are in thousands of benefit.
Kentucky Retirement System
County Employees Retirement System (CERS)
Non-Hazardous
Unreduced Retirement Experience - Age Based - Female
Assumed Rate Expected Retirements Actual/Expected
Age
Actual
Retirements
Total
Exposures Actual Rate Current1 Proposed2Current Proposed
Current
(2)/(7)
Proposed
(2)/(8)
(1) (2) (3) (4) (5) (6) (7) (8) (9) (10)
Under 45 37 163 0.2299 27.00% 49 44 76.24% 84.91%
45 32 149 0.2139 27.00% 45 40 70.72% 79.56%
46 58 277 0.2093 27.00% 83 75 69.75% 77.19%
47 99 384 0.2592 27.00% 115 104 86.50% 95.64%
48 132 496 0.2663 27.00% 149 134 88.66% 98.58%
49 158 634 0.2495 27.00% 190 171 83.18% 92.42%
50 165 691 0.2391 27.00% 207 187 79.85% 88.39%
51 159 837 0.1895 27.00% 251 226 63.16% 70.15%
52 251 1,011 0.2485 27.00% 303 273 82.93% 92.04%
53 248 984 0.2520 27.00% 295 266 84.03% 93.19%
54 289 1,007 0.2872 27.00% 302 272 95.72% 106.27%
55 255 1,026 0.2488 5.00% 27.00% 308 277 82.85% 92.12%
56 231 1,079 0.2140 6.00% 27.00% 324 291 71.27% 79.35%
57 286 1,178 0.2427 7.00% 27.00% 353 318 80.97% 89.89%
58 307 1,262 0.2431 7.00% 27.00% 379 341 80.96% 89.98%
59 332 1,219 0.2725 8.00% 27.00% 366 329 90.76% 100.96%
60 307 1,210 0.2540 9.00% 27.00% 363 327 84.63% 93.95%
61 277 1,154 0.2403 15.00% 27.00% 346 312 80.18% 88.91%
62 412 1,055 0.3909 18.00% 40.00% 316 422 130.52% 97.73%
63 303 845 0.3589 18.00% 35.00% 254 296 119.43% 102.49%
64 198 719 0.2749 18.00% 30.00% 216 216 91.47% 91.47%
65 840 3,133 0.2681 18.00% 30.00% 631 940 133.11% 89.36%
66 693 2,360 0.2936 18.00% 27.00% 486 637 142.59% 108.79%
67 439 1,701 0.2584 18.00% 27.00% 353 459 124.50% 95.75%
68 284 1,257 0.2255 18.00% 27.00% 267 339 106.19% 83.64%
69 238 1,022 0.2332 18.00% 27.00% 219 276 108.79% 86.32%
70 191 824 0.2315 18.00% 27.00% 178 223 107.20% 85.57%
71 170 634 0.2687 18.00% 27.00% 138 171 123.44% 99.62%
72 94 438 0.2138 18.00% 27.00% 95 118 98.58% 79.36%
73 78 342 0.2282 18.00% 27.00% 73 92 106.74% 84.70%
74 55 251 0.2177 18.00% 27.00% 52 68 105.00% 80.29%
Total 7,619 29,338 7,706 8,244 98.87% 92.42%
75 & Over 213 788 0.2702 100.00% 100.00% 783 788 27.21% 27.02%
Total 7,832 30,127 8,489 9,032 92.26% 86.71%
1 For members hired before 09/01/2008, if service is at least 27 years, the rate is 30%.1 For members hired after 09/01/2008, if age plus service is at least 87, the rate is 30%.2 For members hired after 09/01/2008 and younger than 65, the rates other than 100% are reduced by 20% to account for a different health insurance benefit.
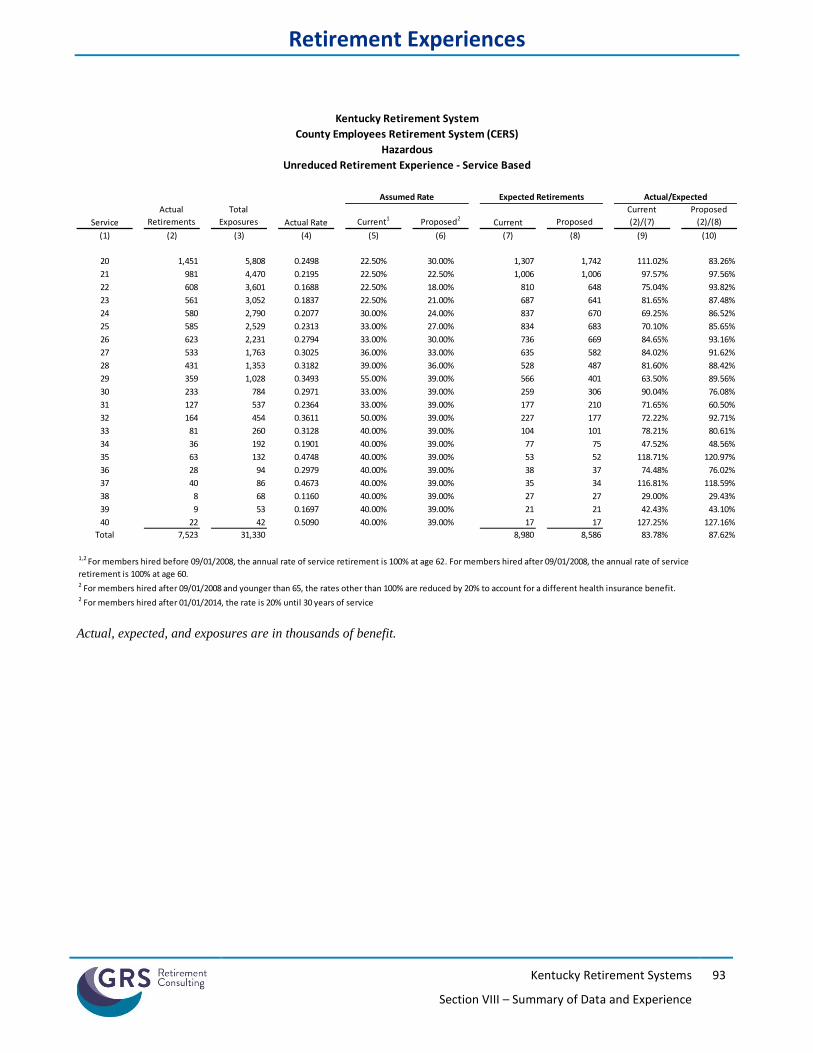
Retirement Experiences
Kentucky Retirement Systems
Section VIII – Summary of Data and Experience
93
Actual, expected, and exposures are in thousands of benefit.
Kentucky Retirement System
County Employees Retirement System (CERS)
Hazardous
Unreduced Retirement Experience - Service Based
Assumed Rate Expected Retirements Actual/Expected
Service
Actual
Retirements
Total
Exposures Actual Rate Current1 Proposed2Current Proposed
Current
(2)/(7)
Proposed
(2)/(8)
(1) (2) (3) (4) (5) (6) (7) (8) (9) (10)
20 1,451 5,808 0.2498 22.50% 30.00% 1,307 1,742 111.02% 83.26%
21 981 4,470 0.2195 22.50% 22.50% 1,006 1,006 97.57% 97.56%
22 608 3,601 0.1688 22.50% 18.00% 810 648 75.04% 93.82%
23 561 3,052 0.1837 22.50% 21.00% 687 641 81.65% 87.48%
24 580 2,790 0.2077 30.00% 24.00% 837 670 69.25% 86.52%
25 585 2,529 0.2313 33.00% 27.00% 834 683 70.10% 85.65%
26 623 2,231 0.2794 33.00% 30.00% 736 669 84.65% 93.16%
27 533 1,763 0.3025 36.00% 33.00% 635 582 84.02% 91.62%
28 431 1,353 0.3182 39.00% 36.00% 528 487 81.60% 88.42%
29 359 1,028 0.3493 55.00% 39.00% 566 401 63.50% 89.56%
30 233 784 0.2971 33.00% 39.00% 259 306 90.04% 76.08%
31 127 537 0.2364 33.00% 39.00% 177 210 71.65% 60.50%
32 164 454 0.3611 50.00% 39.00% 227 177 72.22% 92.71%
33 81 260 0.3128 40.00% 39.00% 104 101 78.21% 80.61%
34 36 192 0.1901 40.00% 39.00% 77 75 47.52% 48.56%
35 63 132 0.4748 40.00% 39.00% 53 52 118.71% 120.97%
36 28 94 0.2979 40.00% 39.00% 38 37 74.48% 76.02%
37 40 86 0.4673 40.00% 39.00% 35 34 116.81% 118.59%
38 8 68 0.1160 40.00% 39.00% 27 27 29.00% 29.43%
39 9 53 0.1697 40.00% 39.00% 21 21 42.43% 43.10%
40 22 42 0.5090 40.00% 39.00% 17 17 127.25% 127.16%
Total 7,523 31,330 8,980 8,586 83.78% 87.62%
1,2 For members hired before 09/01/2008, the annual rate of service retirement is 100% at age 62. For members hired after 09/01/2008, the annual rate of service
retirement is 100% at age 60.2 For members hired after 09/01/2008 and younger than 65, the rates other than 100% are reduced by 20% to account for a different health insurance benefit.2 For members hired after 01/01/2014, the rate is 20% until 30 years of service
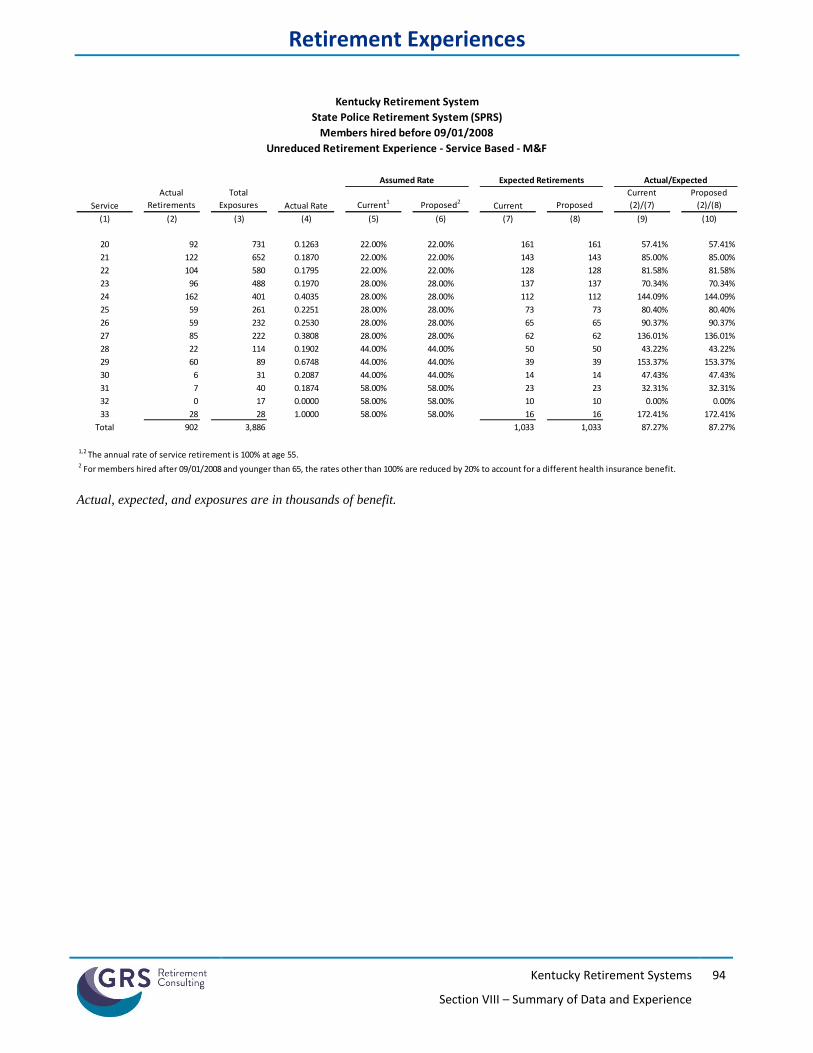
Retirement Experiences
Kentucky Retirement Systems
Section VIII – Summary of Data and Experience
94
Actual, expected, and exposures are in thousands of benefit.
Kentucky Retirement System
State Police Retirement System (SPRS)
Members hired before 09/01/2008
Unreduced Retirement Experience - Service Based - M&F
Assumed Rate Expected Retirements Actual/Expected
Service
Actual
Retirements
Total
Exposures Actual Rate Current1 Proposed2Current Proposed
Current
(2)/(7)
Proposed
(2)/(8)
(1) (2) (3) (4) (5) (6) (7) (8) (9) (10)
20 92 731 0.1263 22.00% 22.00% 161 161 57.41% 57.41%
21 122 652 0.1870 22.00% 22.00% 143 143 85.00% 85.00%
22 104 580 0.1795 22.00% 22.00% 128 128 81.58% 81.58%
23 96 488 0.1970 28.00% 28.00% 137 137 70.34% 70.34%
24 162 401 0.4035 28.00% 28.00% 112 112 144.09% 144.09%
25 59 261 0.2251 28.00% 28.00% 73 73 80.40% 80.40%
26 59 232 0.2530 28.00% 28.00% 65 65 90.37% 90.37%
27 85 222 0.3808 28.00% 28.00% 62 62 136.01% 136.01%
28 22 114 0.1902 44.00% 44.00% 50 50 43.22% 43.22%
29 60 89 0.6748 44.00% 44.00% 39 39 153.37% 153.37%
30 6 31 0.2087 44.00% 44.00% 14 14 47.43% 47.43%
31 7 40 0.1874 58.00% 58.00% 23 23 32.31% 32.31%
32 0 17 0.0000 58.00% 58.00% 10 10 0.00% 0.00%
33 28 28 1.0000 58.00% 58.00% 16 16 172.41% 172.41%
Total 902 3,886 1,033 1,033 87.27% 87.27%
1,2 The annual rate of service retirement is 100% at age 55.2 For members hired after 09/01/2008 and younger than 65, the rates other than 100% are reduced by 20% to account for a different health insurance benefit.
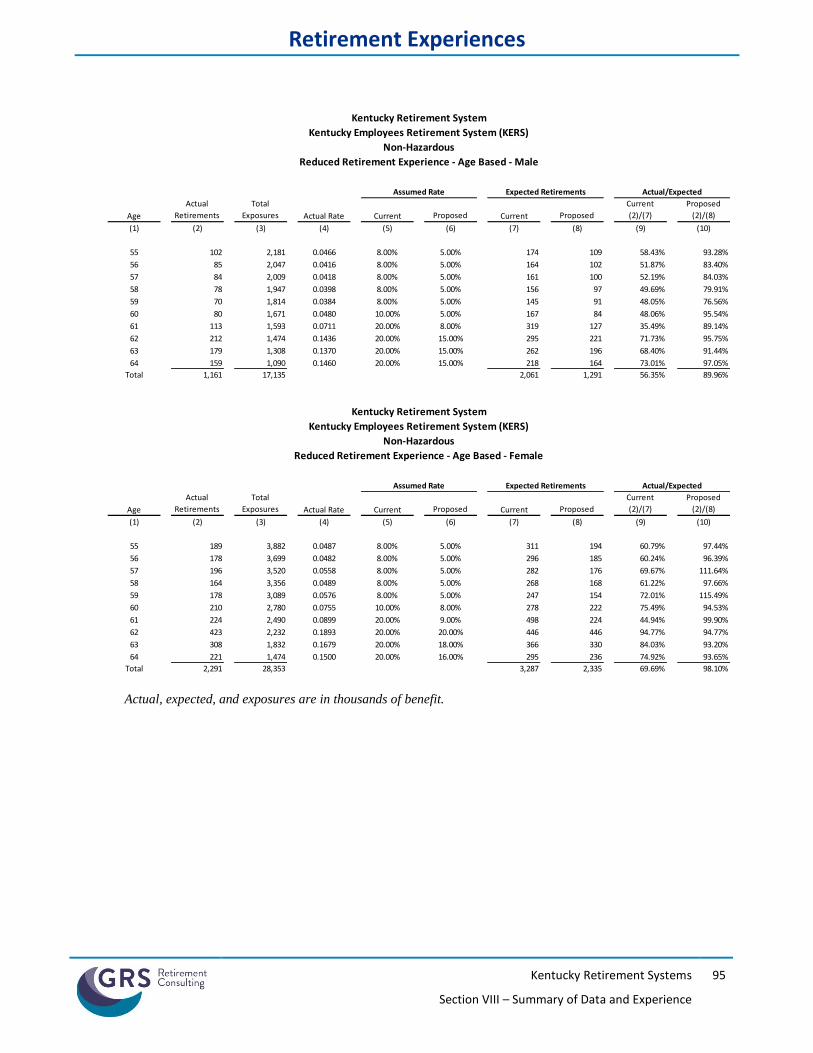
Retirement Experiences
Kentucky Retirement Systems
Section VIII – Summary of Data and Experience
95
Actual, expected, and exposures are in thousands of benefit.
Kentucky Retirement System Kentucky Retirement System
Kentucky Employees Retirement System (KERS) County Employees Retirement System (CERS)
Non-Hazardous Non-Hazardous
Reduced Retirement Experience - Age Based - Male Reduced Retirement Experience - Age Based - Male
Assumed Rate Expected Retirements Actual/Expected
Age
Actual
Retirements
Total
Exposures Actual Rate Current Proposed Current Proposed
Current
(2)/(7)
Proposed
(2)/(8)
(1) (2) (3) (4) (5) (6) (7) (8) (9) (10)
55 102 2,181 0.0466 8.00% 5.00% 174 109 58.43% 93.28%
56 85 2,047 0.0416 8.00% 5.00% 164 102 51.87% 83.40%
57 84 2,009 0.0418 8.00% 5.00% 161 100 52.19% 84.03%
58 78 1,947 0.0398 8.00% 5.00% 156 97 49.69% 79.91%
59 70 1,814 0.0384 8.00% 5.00% 145 91 48.05% 76.56%
60 80 1,671 0.0480 10.00% 5.00% 167 84 48.06% 95.54%
61 113 1,593 0.0711 20.00% 8.00% 319 127 35.49% 89.14%
62 212 1,474 0.1436 20.00% 15.00% 295 221 71.73% 95.75%
63 179 1,308 0.1370 20.00% 15.00% 262 196 68.40% 91.44%
64 159 1,090 0.1460 20.00% 15.00% 218 164 73.01% 97.05%
Total 1,161 17,135 2,061 1,291 56.35% 89.96%
Kentucky Retirement System Kentucky Retirement System
Kentucky Employees Retirement System (KERS) County Employees Retirement System (CERS)
Non-Hazardous Non-Hazardous
Reduced Retirement Experience - Age Based - Female Reduced Retirement Experience - Age Based - Female
Assumed Rate Expected Retirements Actual/Expected
Age
Actual
Retirements
Total
Exposures Actual Rate Current Proposed Current Proposed
Current
(2)/(7)
Proposed
(2)/(8)
(1) (2) (3) (4) (5) (6) (7) (8) (9) (10)
55 189 3,882 0.0487 8.00% 5.00% 311 194 60.79% 97.44%
56 178 3,699 0.0482 8.00% 5.00% 296 185 60.24% 96.39%
57 196 3,520 0.0558 8.00% 5.00% 282 176 69.67% 111.64%
58 164 3,356 0.0489 8.00% 5.00% 268 168 61.22% 97.66%
59 178 3,089 0.0576 8.00% 5.00% 247 154 72.01% 115.49%
60 210 2,780 0.0755 10.00% 8.00% 278 222 75.49% 94.53%
61 224 2,490 0.0899 20.00% 9.00% 498 224 44.94% 99.90%
62 423 2,232 0.1893 20.00% 20.00% 446 446 94.77% 94.77%
63 308 1,832 0.1679 20.00% 18.00% 366 330 84.03% 93.20%
64 221 1,474 0.1500 20.00% 16.00% 295 236 74.92% 93.65%
Total 2,291 28,353 3,287 2,335 69.69% 98.10%
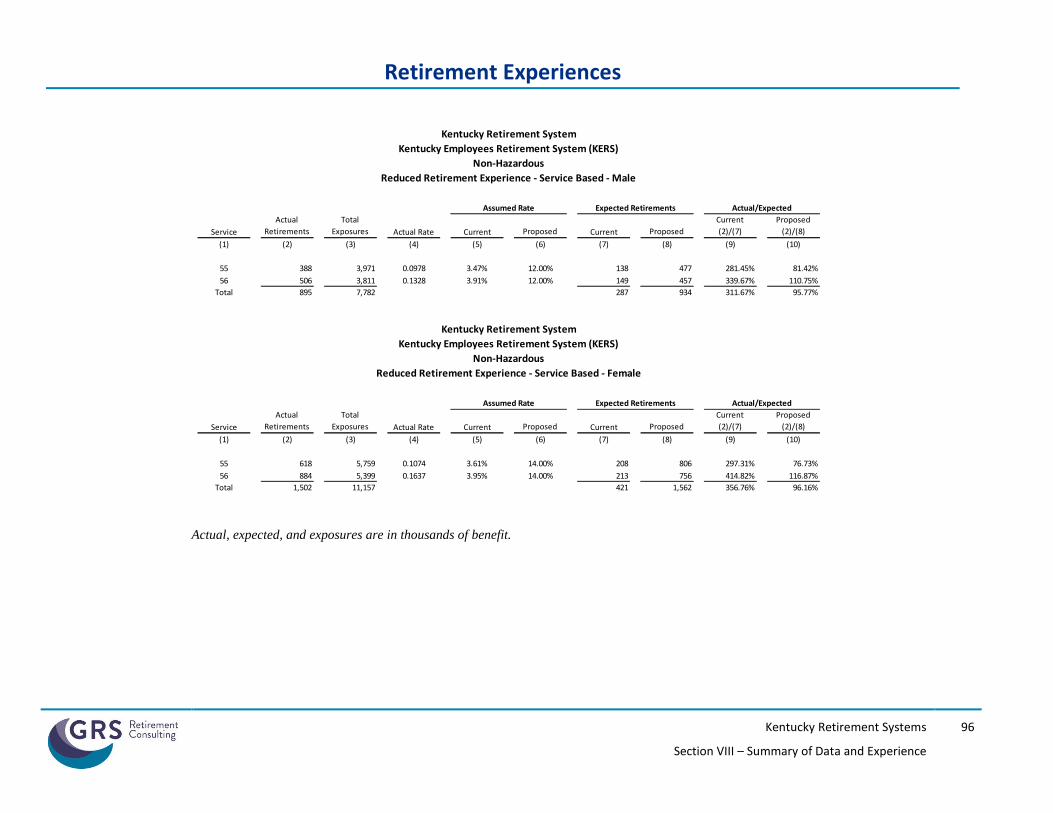
Retirement Experiences
Kentucky Retirement Systems
Section VIII – Summary of Data and Experience
96
Actual, expected, and exposures are in thousands of benefit.
Kentucky Retirement System Kentucky Retirement System
Kentucky Employees Retirement System (KERS) County Employees Retirement System (CERS)
Non-Hazardous Non-Hazardous
Reduced Retirement Experience - Service Based - Male Reduced Retirement Experience - Service Based - Male
Assumed Rate Expected Retirements Actual/Expected
Service
Actual
Retirements
Total
Exposures Actual Rate Current Proposed Current Proposed
Current
(2)/(7)
Proposed
(2)/(8)
(1) (2) (3) (4) (5) (6) (7) (8) (9) (10)
55 388 3,971 0.0978 3.47% 12.00% 138 477 281.45% 81.42%
56 506 3,811 0.1328 3.91% 12.00% 149 457 339.67% 110.75%
Total 895 7,782 287 934 311.67% 95.77%
Kentucky Retirement System Kentucky Retirement System
Kentucky Employees Retirement System (KERS) County Employees Retirement System (CERS)
Non-Hazardous Non-Hazardous
Reduced Retirement Experience - Service Based - Female Reduced Retirement Experience - Service Based - Female
Assumed Rate Expected Retirements Actual/Expected
Service
Actual
Retirements
Total
Exposures Actual Rate Current Proposed Current Proposed
Current
(2)/(7)
Proposed
(2)/(8)
(1) (2) (3) (4) (5) (6) (7) (8) (9) (10)
55 618 5,759 0.1074 3.61% 14.00% 208 806 297.31% 76.73%
56 884 5,399 0.1637 3.95% 14.00% 213 756 414.82% 116.87%
Total 1,502 11,157 421 1,562 356.76% 96.16%
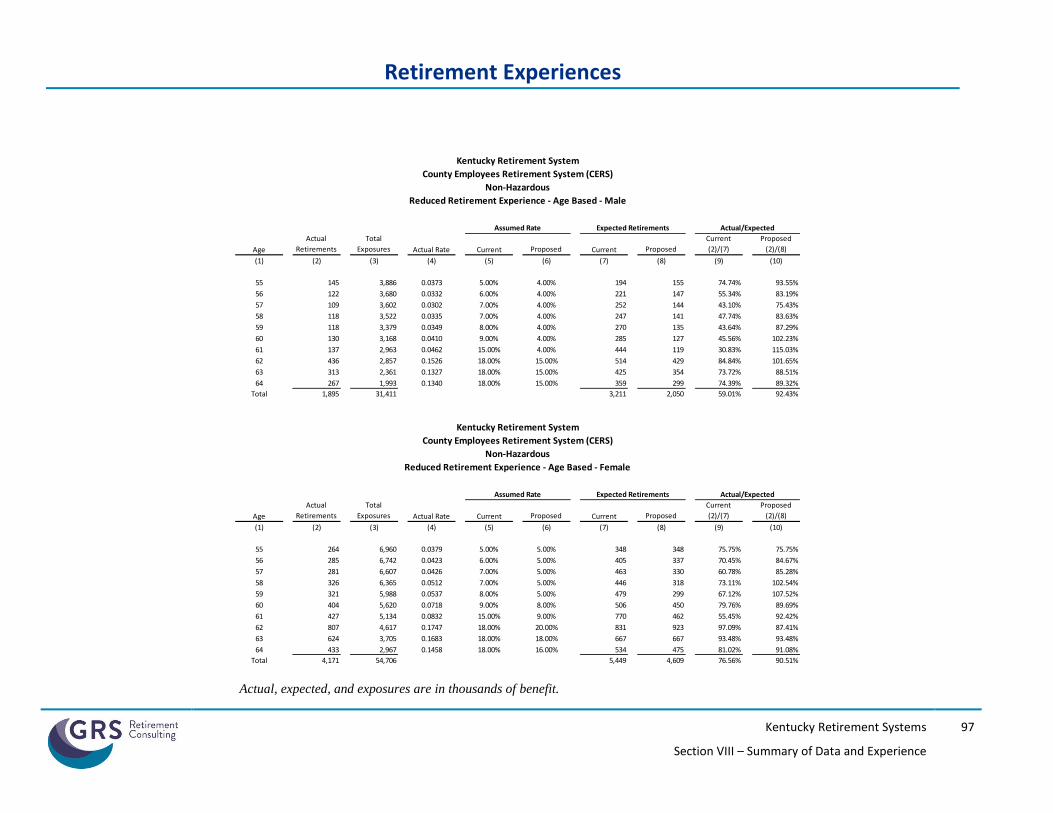
Retirement Experiences
Kentucky Retirement Systems
Section VIII – Summary of Data and Experience
97
Actual, expected, and exposures are in thousands of benefit.
Kentucky Retirement System
County Employees Retirement System (CERS)
Non-Hazardous
Reduced Retirement Experience - Age Based - Male
Assumed Rate Expected Retirements Actual/Expected
Age
Actual
Retirements
Total
Exposures Actual Rate Current Proposed Current Proposed
Current
(2)/(7)
Proposed
(2)/(8)
(1) (2) (3) (4) (5) (6) (7) (8) (9) (10)
55 145 3,886 0.0373 5.00% 4.00% 194 155 74.74% 93.55%
56 122 3,680 0.0332 6.00% 4.00% 221 147 55.34% 83.19%
57 109 3,602 0.0302 7.00% 4.00% 252 144 43.10% 75.43%
58 118 3,522 0.0335 7.00% 4.00% 247 141 47.74% 83.63%
59 118 3,379 0.0349 8.00% 4.00% 270 135 43.64% 87.29%
60 130 3,168 0.0410 9.00% 4.00% 285 127 45.56% 102.23%
61 137 2,963 0.0462 15.00% 4.00% 444 119 30.83% 115.03%
62 436 2,857 0.1526 18.00% 15.00% 514 429 84.84% 101.65%
63 313 2,361 0.1327 18.00% 15.00% 425 354 73.72% 88.51%
64 267 1,993 0.1340 18.00% 15.00% 359 299 74.39% 89.32%
Total 1,895 31,411 3,211 2,050 59.01% 92.43%
Kentucky Retirement System
County Employees Retirement System (CERS)
Non-Hazardous
Reduced Retirement Experience - Age Based - Female
Assumed Rate Expected Retirements Actual/Expected
Age
Actual
Retirements
Total
Exposures Actual Rate Current Proposed Current Proposed
Current
(2)/(7)
Proposed
(2)/(8)
(1) (2) (3) (4) (5) (6) (7) (8) (9) (10)
55 264 6,960 0.0379 5.00% 5.00% 348 348 75.75% 75.75%
56 285 6,742 0.0423 6.00% 5.00% 405 337 70.45% 84.67%
57 281 6,607 0.0426 7.00% 5.00% 463 330 60.78% 85.28%
58 326 6,365 0.0512 7.00% 5.00% 446 318 73.11% 102.54%
59 321 5,988 0.0537 8.00% 5.00% 479 299 67.12% 107.52%
60 404 5,620 0.0718 9.00% 8.00% 506 450 79.76% 89.69%
61 427 5,134 0.0832 15.00% 9.00% 770 462 55.45% 92.42%
62 807 4,617 0.1747 18.00% 20.00% 831 923 97.09% 87.41%
63 624 3,705 0.1683 18.00% 18.00% 667 667 93.48% 93.48%
64 433 2,967 0.1458 18.00% 16.00% 534 475 81.02% 91.08%
Total 4,171 54,706 5,449 4,609 76.56% 90.51%
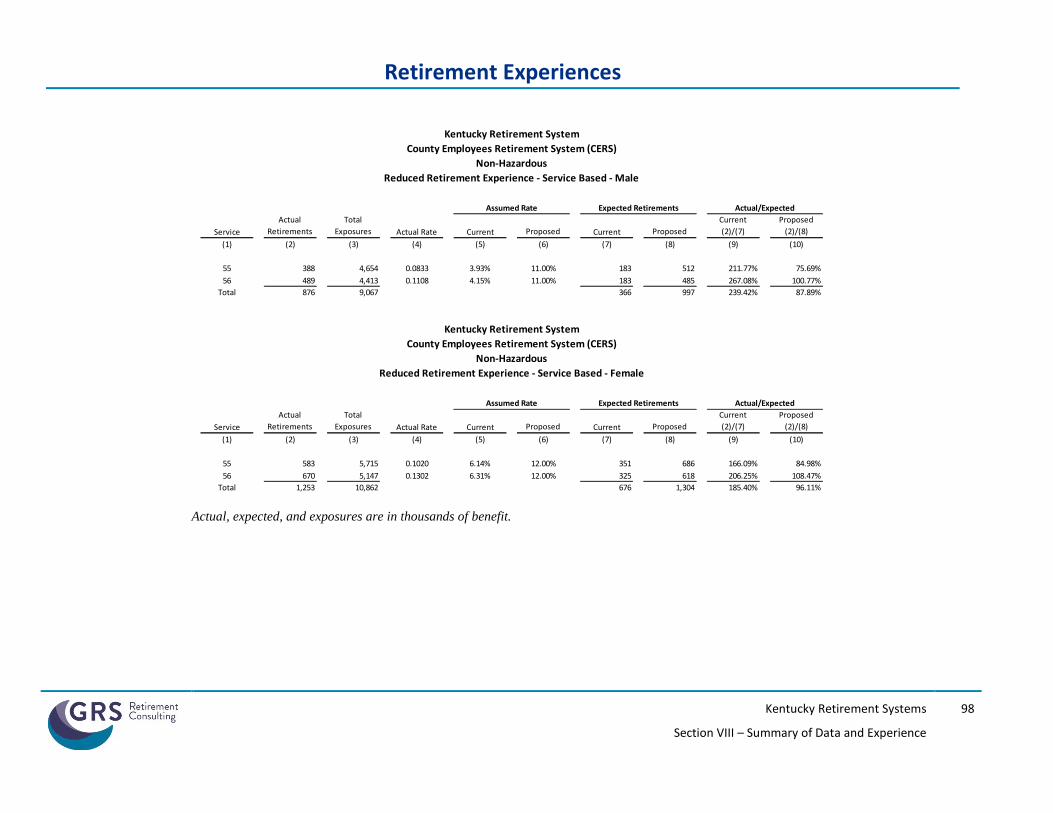
Retirement Experiences
Kentucky Retirement Systems
Section VIII – Summary of Data and Experience
98
Actual, expected, and exposures are in thousands of benefit.
Kentucky Retirement System
County Employees Retirement System (CERS)
Non-Hazardous
Reduced Retirement Experience - Service Based - Male
Assumed Rate Expected Retirements Actual/Expected
Service
Actual
Retirements
Total
Exposures Actual Rate Current Proposed Current Proposed
Current
(2)/(7)
Proposed
(2)/(8)
(1) (2) (3) (4) (5) (6) (7) (8) (9) (10)
55 388 4,654 0.0833 3.93% 11.00% 183 512 211.77% 75.69%
56 489 4,413 0.1108 4.15% 11.00% 183 485 267.08% 100.77%
Total 876 9,067 366 997 239.42% 87.89%
Kentucky Retirement System
County Employees Retirement System (CERS)
Non-Hazardous
Reduced Retirement Experience - Service Based - Female
Assumed Rate Expected Retirements Actual/Expected
Service
Actual
Retirements
Total
Exposures Actual Rate Current Proposed Current Proposed
Current
(2)/(7)
Proposed
(2)/(8)
(1) (2) (3) (4) (5) (6) (7) (8) (9) (10)
55 583 5,715 0.1020 6.14% 12.00% 351 686 166.09% 84.98%
56 670 5,147 0.1302 6.31% 12.00% 325 618 206.25% 108.47%
Total 1,253 10,862 676 1,304 185.40% 96.11%