Kentucky Regional Microgrids for Resilience Study
35
Kentucky Regional Microgrids for Resilience Study April 7, 2021 Prepared for the NASEO-NARUC Microgrid Working Group
Transcript of Kentucky Regional Microgrids for Resilience Study

Clean + Modern Grid Utility Business Models | Regulatory Innovation | Grid Integration | Transportation Electrification
Kentucky Regional Microgrids
for Resilience StudyApril 7, 2021
Prepared for the NASEO-NARUC Microgrid Working Group

Acknowledgements
SEPA would like to thank the Kentucky Energy and Environment Cabinet Office of
Energy Policy for the opportunity to conduct this study. The study was made possible
by the U.S. Department of Energy’s State Energy Program (SEP), which provides
funding and technical assistance to enhance energy security, advance state-led
energy initiatives, and maximize the benefits of decreasing energy waste.

Microgrid Study Lead
Role for our project
● Stakeholder engagement
● Data collection and landscape review
● Research and industry knowledge
● Microgrid site selection and economic analysis
Profile
● A 501c3 membership organization founded in 1992
● Staff of ~ 50, budget of ~ $10M
● Based in Washington, D.C.
● Advisory services, research, and industry
collaboration

Microgrid Study Motivations and Goals
● Power outages are a major contributor to
economic loss that can be mitigated with
microgrids
● Support private and public sector
opportunities for BRIC and other resiliency
funding
● Select and evaluate potential sites and
areas in Kentucky to achieve resilience
through microgrid deployment
● Evolving hazard mitigation planning with
microgrid considerations
Microgrids as an economic solution and a BRIC funding opportunity

6,640sites considered
Summary of Results
SEPA evaluated 6,640 sites for microgrid solutions using 6 selection criteria. SEPA
identified 558 potential site-specific installations and 12 potential regional community
microgrids.
558potential site-specific
installations
6site selection criteria
12potential regional
community microgrids

Study Methodology
• Sizing
• Cost estimates
• Deployment options
Deployment Strategy
• Nanogrids(specific facilities)
• Regional community microgrids(clusters)
Site Selection
• Critical facilities
• Load profiles
• Reliability hostpots
• Natural hazards
• Population density
• Urban areas
• Energy Burden
Data Collection
• Stakeholder engagement
• Prioritizing critical facilities and natural hazards
Landscape Review
Identifying potential microgrid deployments for critical facilities to
increase the state-wide resilience in Kentucky against natural hazards

Landscape Review –Critical Facilities and Natural Hazards
Water Treatment Facilities - Wastewater/Water
Treatment Plants
Emergency Operations Centers - Temporary or
Permanent Emergency Preparedness Command
Centers
Health Care Facilities - Hospitals and Nurseries
Fire Stations
National Defense - Military & National Guard Bases
Law Enforcement - Police, Sheriff and Park Police
Stations
Gas Stations & Petroleum Terminals
Grocery Stores
Communications Facilities - Radio, TV and Cell Tower
Transmission
Critical Facility Prioritized List:
Extreme Cold & Winter Storms
Floods
Wind
Tornadoes
Earthquakes, landslide, karst, mine
subsidence and wildfires
Extreme heat
Natural Hazard Prioritized List:
Avoiding Microgrid Deployment in
High-Risk Areas of:
Natural Hazards for Future
Consideration

Data Collection - Critical Facilities
Source: Smart Electric Power Alliance (2021) based on data provided by Matt Crawford, a Kentucky Geological Survey scientist with the University of Kentucky (2020).
Facility Data Source Key Stats Notes
Communication Facilities HIFLD 1,234 total Clusters of sites exist in more densely populated counties
Hospitals OEP 137 total More sites exist in densely populated counties.
Nursing Homes OEP 379 total More sites exist in densely populated counties.
Water Treatment Plants KyGovMaps Open Data 213 total Sites are mostly uniformly distributed across the state.
Wastewater Treatment Plants KyGovMaps Open Data 240 total Sites are mostly uniformly distributed across the state.
National Defense Facilities Data Axle 46 total Most sites are located in densely populated counties.
Law Enforcement Facilities OEP and HIFLD 484 total Clusters of sites exist in more densely populated counties.
Fire Stations OEP and HIFLD 1103 total Clusters of sites exist in more densely populated counties.
Emergency Operations Centers HIFLD 142 total Sites are distributed uniformly across the state.
Gas Stations Data Axle 1973 total Clusters of sites exist in more densely populated counties.
Grocery Stores Data Axle 1273 total Clusters of sites exist in more densely populated counties.
Natural Gas Underground
Facilities
EIA 23 total Most sites are located in central Kentucky.
Petroleum Terminals HIFLD 31 total Clusters of sites exist in more densely populated counties.

Data Collection - Tier 1 and 2 Hazards
Source: Smart Electric Power Alliance (2021) based on data provided by Matt Crawford, a Kentucky
Geological Survey scientist with the University of Kentucky (2020).
Source: Smart Electric Power Alliance (2021) based on data provided by NOAA’s National Centers for Environmental Information
Storm Events Database, HIFLD’s Historical Tornado Tracks dataset, and FEMA’s National Flood Hazard Layer (2020).

Data Collection - Population Density, Urban Areas, and Energy Burden
Source: Kentucky Atlas and Gazetteer. Commonwealth of Kentucky (2020).Source: United States Census Bureau. Urban Areas. TIGER/Line Shapefiles (2010).
Source: United States Department of Energy. Avg. Energy Burden (% income) for Counties
in Kentucky. Low-Income Energy Affordability Data (LEAD) Tool (2020).

Data Collection – Reliability Hotspots
Source: Smart Electric Power Alliance (2021) based on data from Kentucky Public Service Commission, Electric Distribution Utility Annual Reliability Reports (2019, 2020).
Map Development Methodology
● Data collected from annual
reliability reports filed by utilities
with the Kentucky Public Service
Commission.
● Locational data for the top ten
worst performing circuits (based
on SAIDI values) for each utility
was used to develop a heatmap.
● Lowest reliability in the eastern
region of Kentucky.

Site Selection
Selection Criteria
● Critical infrastructure facility type
● Geographical proximity
● Areas at high risk of natural hazard
● Reliability hotspots
● Population density
● Energy burden / underserved areas

Site Selection – Nanogrid Deployment Selection Results
Smart Electric Power Alliance, 2021

Site Selection - Regional Community Selection Results
Regional Community Microgrid Legend
1. Jefferson County Community Microgrid
2. Clay County Community Microgrid
3. Knox County Community Microgrid
4. Marion County Community Microgrid
5. Crittenden County Community Microgrid
6. Washington County Community Microgrid
7. Hopkins County Community Microgrid
8. Allen County Community Microgrid
9. Carlisle County Community Microgrid
10. Marshall County Community Microgrid
11. Bell County Community Microgrid
12. McLean County Community MicrogridSmart Electric Power Alliance, 2021

Site Selection - Representative Strategy
Representative Nanogrid & Regional Community Microgrid Deployment Strategy
Smart Electric Power Alliance, 2021

Sizing – Fire Station Example
Fire Station Load Profile
Smart Electric Power Alliance, 2021
Fire Station Microgrid Design Options

Cost Estimates – Fire Station Example
Design Option 1: Fossil Fuel Design Option 2: Moderate Renewable
Smart Electric Power Alliance, 2021

Deployment Strategies Overview:Site-Specific Installation
Fossil Fuel Only Design
Cost
Moderate Renewables
Design Cost
Critical Facility Type # Sites
Selected
Per facility (thousands) Per facility
(thousands)
Cell Towers 56 $5 - $8 $86 - $97
Hospitals 26 $861 - $1,378 $10,703 - $12,260
Nursing Homes 32 $17 - $28 $203 - $235
Water Treatment Plants 44 $10 - $17 $239 - $272
Wastewater Treatment Plants 50 $10 - $17 $239 - $272
National Defense Facilities 5 $5 - $8 $43 - $51
Law Enforcement Facilities 42 $7 - $11 $98 - $113
Fire Stations 90 $12 - $19 $166 - $192
Emergency Operations Centers 33 $7 - $11 $78 - $90
Gas Stations 110 $10 - $17 $176 - $201
Grocery Stores 70 $12 - $19 $153 - $177
Smart Electric Power Alliance, 2021

Deployment Strategies Overview:Regional Community Microgrids
Regional Community Microgrids Estimated Costs for Fossil
Fuel Only Design
Estimated Costs for Moderate
Renewables Design
Microgrid # of Critical Facilities
within Microgrid
Cost (thousands) Cost (thousands)
1 - Jefferson County Community Microgrid 5 $537 - $894 $8,798 - $9,940
2 - Clay County Community Microgrid 4 $1,141 - $1,931 $11,012 - $12,616
3 - Knox County Community Microgrid 4 $1,148 - $1,943 $11,116 - $12,732
4 - Marion County Community Microgrid 4 $43 - $72 $750 - $856
5 - Crittenden County Community Microgrid 5 $45 - $75 $667 - $766
6 - Washington County Community Microgrid 8 $63 - $106 $1,191 - $1,352
7 - Hopkins County Community Microgrid 4 $25 - $42 $367 - $420
8 - Allen County Community Microgrid 5 $38 - $64 $724 - $823
9 - Carlisle County Community Microgrid 4 $30 - $50 $548 - $622
10 - Marshall County Community Microgrid 4 $28 - $47 $614 - $693
11 - Bell County Community Microgrid 5 $42 - $69 $659 - $754
12 - McLean County Community Microgrid 4 $38 - $64 $615 - $704
Smart Electric Power Alliance, 2021

Key Takeaways
In rural areas, nanogrid installations may be
necessary due to the limited number of critical
facilities within a close proximity
Engage all stakeholders early and often to
socialize ideas, collect data, and to solicit input
on microgrid deployment process
A combination of nanogrid installations and
regional community microgrids achieve
increased resilience
Prioritize critical facilities, natural hazards,
reliability hotspots, population density, and low
income communities

Next Steps
Conduct further circuit, financial, and benefit-cost
analysis of particular sites.
Conduct design & engineering work of the
selected sites.
Socialize with other states and community
stakeholders to facilitate microgrid project
success.
Apply for FEMA and other funding to construct
and install microgrids.

Q & A

Appendix

Microgrid Study Table of Contents
0.0 Executive Summary
1.0 Introduction
2.0 Data Collection - Population / Demographics, Critical Infrastructure Facilities, Natural Hazards, Tier 1 Hazards, Tier 2
Hazards, Utility and Electricity
3.0 Site Selection - Site Selection Criteria, Selection Results, Representative Site Selection Process Example
4.0 Preliminary Analysis and Deployment Strategies - Load Analysis, Sizing, Cost Estimate, and Deployment Strategy
Methodology (includes a case study on the Fort Knox Military Microgrid Project) - Deployment strategy includes site-specific
installations and regional community microgrid projects. Sizing analysis includes a fossil-fuel only option and a moderate
renewable option.
5.0 Conclusion
6.0 Appendices - Appendix 1: Detailed Data Collection Methodology, Appendix 2: Site Selection Parameters by Critical Facility
Type, Appendix 3: Detailed Load, Sizing and Cost Analysis.

Stakeholders
Kentucky Public
Service
Commission
Kentucky
Environmental
Response Team
Kentucky
Emergency
Management
Kentucky
Division of
Water
Kentucky
Petroleum
Marketers
Association
Kentucky Office
of Energy Policy
Kentucky Retail
Federation
Kentucky
Geological
Survey
Duke Energy
Kentucky
Louisville Gas &
Electric
Kentucky
Utilities
National Rural
Electric
Cooperative
Association
American
Electric Power
Kentucky

Critical Facilities Symbol Legend

Electric Service Areas Map
Source: Kentucky Public Service Commission. Electric Service Areas. KyGovMaps Open Data (2020).

Site Selection Criteria & Data SourcesCriteria Type Data Source Criteria Description
Located at critical facility
infrastructure
-HIFLD Cellular Towers
-OEP Healthcare List
-KIA Water Treatment Plants
-KIA Wastewater Treatment Plants
-Data Axle National Defense Facilities
-HIFLD Local Law Enforcement Locations
-OEP Critical Facilities Master List
-HIFLD Fire Stations
-HIFLD Emergency Operations Centers
-Data Axle Gas Stations
-Data Axle Grocery Stores
Located at a critical facility site: cell tower, hospital, nursing
home, emergency operations center, law enforcement, water
treatment plant, wastewater treatment plant, grocery store, gas
station, fire station, or national defense facility.
Not located in a Tier 1 hazard area
-KGS Earthquake Impact (Peak Ground Acceleration)
-KGS Landslide Susceptibility
-KGS Karst Susceptibility
-KGS Mine Subsidence Susceptibility
-USDA Wildfire Hazard Potential
Location not in a Tier 1 high hazard area (earthquakes,
landslides, karst, mine subsidence, or wildfires)
Not located in a Tier 2 hazard area
-NOAA Wind Event Record
-NOAA Tornado Event Record
-NOAA Extreme Cold Event Record
-NOAA Winter Storm Event Record
-FEMA NFHL Flood Hazard
Location not in a Tier 2 high hazard area (wind, tornadoes,
extreme cold and winter storm events, or flooding)
Located in reliability hotspot -Kentucky Public Service Commission Annual Reliability Report Data Located within or nearby a reliability hotspot
High population density-Kentucky Atlas & Gazetteer
-U.S. Census Bureau Data (2010)
Located in the county with the highest population density relative
to the region, or within a designated urban area.
Energy burdened area -U.S. DOE Low-Income Energy Affordability Data Tool (LEAD)Located in the county with the highest energy burden, relative to
the region.
Smart Electric Power Alliance, 2021

Load Profile Sources
1. Cell Towers – SEPA estimated the load profile of the 56 cell towers identified in the site selection process
based on Huawei Technologies’ breakdown of the power consumption for 4G and 5G mobile networks.
2. Hospitals – obtained from the OpenEI database based on a hospital in Lexington, Kentucky.
3. Nursing Homes – obtained from the Open EI database and were based on a midrise apartment sized to
25,000 square feet.
4. Water and Wastewater Treatment Plants – obtained from American Electric Power (AEP).
5. National Defense Facilities – based on data obtained from a U.S. utility
6. Law Enforcement Facilities – obtained from AEP.
7. Fire Stations – obtained from AEP
8. Emergency Operations Centers – obtained from OpenEI database
9. Gas Stations – obtained from AEP
10. Grocery Stores – obtained from AEP

Heatmaps of Tier 2 Hazards
Source: Smart Electric Power Alliance (2021) based on data provided by NOAA’s National Centers for
Environmental Information Storm Events Database (2020).
Source: Smart Electric Power Alliance (2021) based on data provided by HIFLD, Historical Tornado Tracks
(2020).
Source: Smart Electric Power Alliance (2021) based on data provided by NOAA’s National
Centers for Environmental Information Storm Events Database (2020).
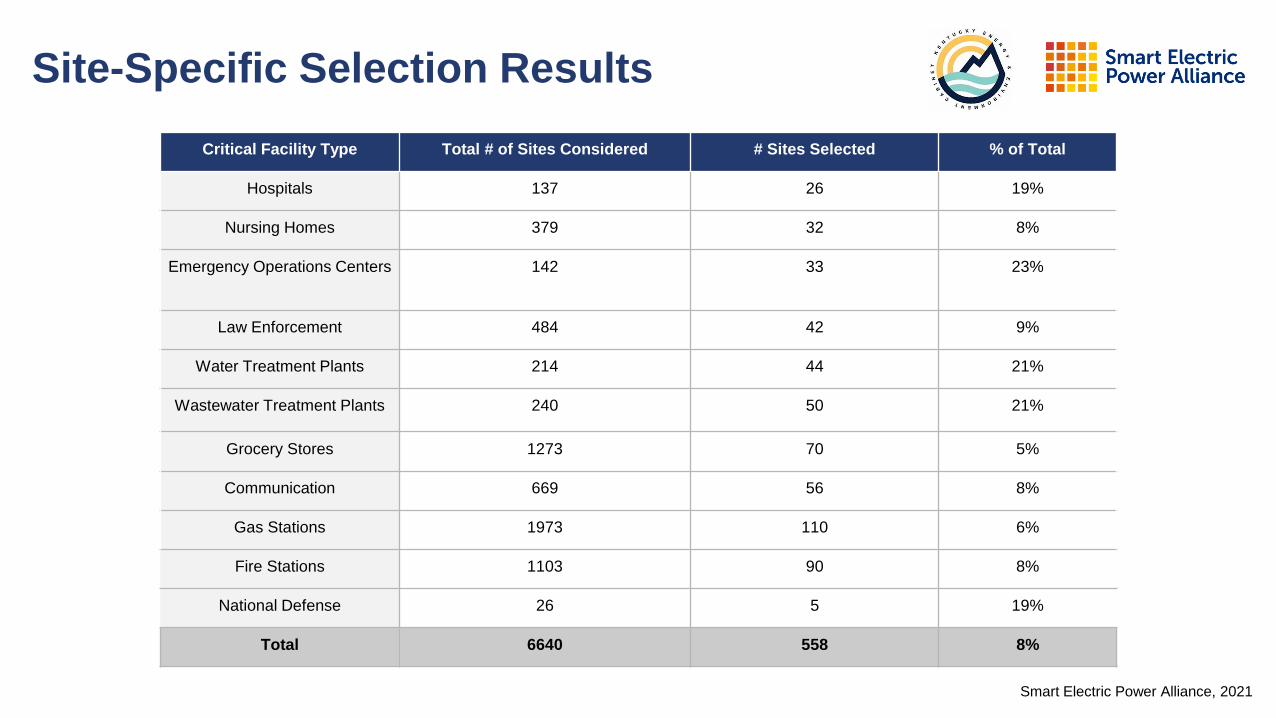
Site-Specific Selection Results
Critical Facility Type Total # of Sites Considered # Sites Selected % of Total
Hospitals 137 26 19%
Nursing Homes 379 32 8%
Emergency Operations Centers 142 33 23%
Law Enforcement 484 42 9%
Water Treatment Plants 214 44 21%
Wastewater Treatment Plants 240 50 21%
Grocery Stores 1273 70 5%
Communication 669 56 8%
Gas Stations 1973 110 6%
Fire Stations 1103 90 8%
National Defense 26 5 19%
Total 6640 558 8%
Smart Electric Power Alliance, 2021

Regional Community Selection Results Table
Regional Community Microgrid Description
1 - Jefferson County Community Microgrid Microgrid to serve an emergency operations center, fire station, grocery store, hospital, and nursing home in the city of Louisville, Jefferson County.
2 - Clay County Community Microgrid Microgrid to serve an emergency operations center, grocery store, hospital, and law enforcement facility in the city of Manchester, Clay County.
3 - Knox County Community Microgrid Microgrid to serve an emergency operations center, gas station, hospital, and nursing home in the city of Barbourville, Knox County.
4 - Marion County Community Microgrid Microgrid to serve a gas station, grocery store, nursing home, and wastewater treatment plant in the city of Lebanon, Marion County.
5 - Crittenden County Community Microgrid Microgrid to serve an emergency operations center, fire station, grocery store, law enforcement facility, and nursing home in the city of Marion,
Crittenden County.
6 - Washington County Community Microgrid Microgrid to serve a cell tower, emergency operations center, fire station, gas station, grocery store, law enforcement facility, wastewater treatment
plant, and water treatment plant in the city of Springfield, Washington County.
7 - Hopkins County Community Microgrid Microgrid to serve an emergency operations center, fire station, law enforcement facility, and national defense facility in the city of Madisonville,
Hopkins County.
8 - Allen County Community Microgrid Microgrid to serve an emergency operations center, fire station, gas station, law enforcement facility, and wastewater treatment plant in the city of
Scottsville, Allen County.
9 - Carlisle County Community Microgrid Microgrid to serve an emergency operations center, fire station, law enforcement facility, and water treatment plant in the city of Bardwell, Carlisle
County.
10 - Marshall County Community Microgrid Microgrid to serve an emergency operations center, law enforcement facility, wastewater treatment plant, and water treatment plant in the city of
Benton, Marshall County.
11 - Bell County Community Microgrid Microgrid to serve a fire station, gas station, law enforcement facility, national defense facility, and nursing home in the city of Middlesboro, Bell
County.
12 - McLean County Community Microgrid Microgrid to serve a cell tower, fire station, gas station, and nursing home in the city of Calhoun, McLean County.

Representative Site Selection Process Example
Smart Electric Power Alliance, 2021

Representative Site Selection Process Example
For Grocery Stores, SEPA applied the selection criteria with the following prioritization:
1. Tier 1 Hazard Areas – SEPA evaluated the areas at the highest risk of Tier 1 hazards across the state. Sites that were not located within those
high risk areas were prioritized.
2. Tier 2 Hazard Areas – for sites not within Tier 1 hazard areas, sites located in areas with the lowest risk of Tier 2 hazards were prioritized.
3. Geographical Proximity – for sites not within high risk areas of Tier 1 and Tier 2 hazards, SEPA estimated the geographical proximity
sensitivity as approximately to a 10 to 15-mile radius range, meaning that if multiple sites were within this distance of each other one would be
selected. For each type of critical facility, one facility was selected per county, but in the densely populated urban areas of Louisville, Lexington,
and Covington, two facilities were selected.
4. Reliability – for remaining sites, those near reliability hotspots were prioritized.
5. Population Density – sites that were located in highly populated areas and urban areas were selected according to all previous criteria except
for Tier 2 Hazard Areas and Reliability. Sites within densely populated areas that did not fall within high risk areas of Tier 2 hazards and were
located near reliability hotspots were prioritized, but the sites that did not meet those two criteria were still considered if necessary for
representation in densely populated areas.
6. Energy Burden – sites that were located in counties of high energy burden were selected according to all previous criteria except for Tier 2
Hazard Areas and Reliability. Sites within underserved areas that did not fall within high risk areas of Tier 2 hazards and were located near
reliability hotspots were prioritized, but the sites that did not meet those two criteria were still considered if necessary for representation in lower
income areas.

Caveats to Site Selection Process
Critical Facility Caveat to Selection Process
Law Enforcement Preference was given to police stations over sheriff offices.
Fire Stations Preference was given to fire departments over fire chief offices.
Gas Stations Preference was given to stations with closer geographic proximity to petroleum
terminal facilities.
Communications Facilities Only cellular towers were considered as potential microgrid sites.
Smart Electric Power Alliance, 2021