Kensington Mine Aquatic Studies 2011 Appendix G, … · CFC : Chlorofluorocarbon ; CFU :...
24
£:( Columbia Analytical Services'" www.caslab.com December 7, 20 II Analytical Report for Service Request No: KIll 0960 Gordon Willson-Naranjo Alaska Department ofFish and Game Division of Habitat P.O. Box II 0024 Juneau, AK 99811 RE: Kensington Gold Mine Whole Fish analysis/22224 Dear Gordon: Enclosed are the results of the samples submitted to our laboratory on November 09, 2011. For your reference, these analyses have been assigned our service request number K 1110960. Analyses were performed according to our laboratory's NELAP-approved quality assurance program. The test results meet requirements of the current NELAP standards, where applicable, and except as noted in the laboratory case narrative provided. For a specific list ofNELAP-accredited analytes, refer to the certifications section at www.caslab.com. All results are intended to be considered in their entirety, and Columbia Analytical Services, Inc. (CAS) is not responsible for use of less than the complete report. Results apply only to the items submitted to the laboratory for analysis and individual items (samples) analyzed, as listed in the rep<;>rt. Please call if you have any questions. My extension is 3364. You may also contact me via Email at HHolmes@casl ab. com. Respectfully submitted, Se ' Project Chemist HH/ln Page 1 of flY
Transcript of Kensington Mine Aquatic Studies 2011 Appendix G, … · CFC : Chlorofluorocarbon ; CFU :...

£:( Columbia e:"~ Analytical Services'" www.caslab.com
December 7, 20 II Analytical Report for Service Request No: KIll 0960
Gordon Willson-Naranjo Alaska Department ofFish and Game Division of Habitat P.O. Box II 0024 Juneau, AK 99811
RE: Kensington Gold Mine Whole Fish analysis/22224
Dear Gordon:
Enclosed are the results of the samples submitted to our laboratory on November 09, 2011. For your reference, these analyses have been assigned our service request number K 1110960.
Analyses were performed according to our laboratory's NELAP-approved quality assurance program. The test results meet requirements of the current NELAP standards, where applicable, and except as noted in the laboratory case narrative provided. For a specific list ofNELAP-accredited analytes, refer to the certifications section at www.caslab.com. All results are intended to be considered in their entirety, and Columbia Analytical Services, Inc. (CAS) is not responsible for use of less than the complete report. Results apply only to the items submitted to the laboratory for analysis and individual items (samples) analyzed, as listed in the rep<;>rt.
Please call if you have any questions. My extension is 3364. You may also contact me via Email at HHolmes@casl ab. com.
Respectfully submitted,
C~r~a;_naly~~lSe
HpYJitdof::~ ' Project Chemist
HH/ln Page 1 of flY

Acronyms
ASTM American Society for Testing and Materials
A2LA American Association for Laboratory Accreditation
CARB California Air Resources Board
CAS Number Chemical Abstract Service registry Number
CFC Chlorofluorocarbon
CFU Colony-Fanning Unit
DEC Department ofEnvironmental Conservation
DEQ Department ofEnvironmental Quality
DHS Department ofHealth Services
DOE Depa1iment ofEcology
DOH Department ofHealth
EPA U. S. Enviromnental Protection Agency
ELAP Environmental Laboratory Accreditation Program
GC Gas Chromatography
GC/MS Gas Chromatography/Mass Spectrometry
LOD Limit ofDetection
LOQ Limit ofQuantitation
LUFT Leaking Underground Fuel Tank
M Modified
MCL Maximum Contaminant Level is the highest permissible concentration of a
substance allowed in drinking water as established by the USEP A.
MDL Method Detection Limit
MPN Most Probable Number
MRL Method Reporting Limit
NA Not Applicable
NC Not Calculated
NCASI National Council of the Paper Industry for Air and Stream Improvement
ND Not Detected
NIOSH National Institute for Occupational Safety and Health
PQL Practical Quantitation Limit
RCRA Resource Conservation and Recovery Act
SJM Selected Ion Monitoring
TPH Total Petroleum Hydrocarbons
tr Trace level is the concentration of an analyte that is less than the PQL but greater
than or equal to the MDL.
2

Inorganic Data Qualiticrs * Tne result is an outlier. See case nan-alive.
# The control limit criteria is not applicable. See case nanative.
B The analyte was found in the associated method blank at a level that is significant relative to the sample result as defined by the DOD or NELAC standards.
E The result is an estimate amount because the value exceeded the instrument calibration range.
J The result is an estimated value.
U The analyte was analyzed fur, but was not detected ("Non-detect") at or above the MRIJMDL. DOD-QSM 4./ definition ; Analyte was not detected and is reported as less than the WD or as defined by the project. The detection limit is adjusted for dilution.
The MRUMDL or LOQ/LOD is elevated due to a matrix interference.
X See case narrative.
Q See case narrative. One or more quality control criteria was outside the limits.
H The holding time for this test is immediately following sample collection. The samples were analyzed as soon as possible after receipt by the laboratory.
Metals Data Qualifiers # The control limit criteria is not applicable. See case narrative.
J The result is an estimated value.
E The percent difference for the serial dilution was greater than 10%, indicating a pos.~ible matrix interference in the sample.
M The duplicate injection precision was not met.
N The Matrix Spike sample recovery is not within control limits. See case narrative,
S The reported value was detennined by the Method of Standard Additions (MSA).
U
W
The analyte was anal:rzed for, but was not detected ("Non-detect") at or above the MRUMDL. DOD-QSM 4.1 definition: Analyte was not detected and is reported as less than the LOD or as defined by the project. The detection limit is adjusted for dilution. The post-digestion spike for furnace AA analysis is out of control limits, while sample absorbance is less than 50% ofspike absorbance.
TilC MRUMDL or LOQ!LOD is elevated due to a matrix interference.
X Sec case narrative.
+ The correlation coefficient for theMSA is less than 0.995.
Q See case narrative. One or more quality control criteria was outside the limits.
Organic Data Qualifiers
* The result is an outlier. See case narrative.
# The control limit criteria is not applicable. See case narrative.
A A tentatively identified compound, a suspected aldol-condensation product.
B 1l1e analyte w~s found in the associated method blank at a !eve! that is significant relative to the sample result as defined by the DOD or NELAC standard">.
c The analyte was qualitatively confirmed using GC/MS techniques, paHem recognition, or by comparing to historical data.
D The reported result is from a dilution.
E The result is an estimated value.
J The result is an estimated value.
N The result is presumptive. The analyte was tentatively identified, but a confirmation analysis was not perfom1cd.
p
u
The GC or HPLC confinnation criteria was exceeded. The relative percent difference is greater than 40% between the two analytical results.
The analyte was analyzed for, but was not detected (''Non-detect") at or above the MRUMDL. DOD-QSM 4.1 definition: Analyte was not detected and is reported as less than the LOD or as defined by the project. The detection limit is adjusted for dilution.
The MRUMDL or LOQ/LOD is elevated due to a chromatographic interference.
X See case narrative.
Q See case narrative. One or more quality control criteria was outside the limits.
Additional Petroleum Hydrocarbon Specific Qualifiers
F The chromatographic fingerprint orthe sample matches the elution pattern of the calibration standard.
L Tile chromatographic fingerprint of the sample resembles a petroleum product, but the elution pattern indicates the presence of a greater amount of lighter molecular weight constituents than the calibration standard.
H The chromatot•Taphic fingerprint of the sample resembles a petroleum product, but the elution pattern indicates the presence of a greater amount ofheavier molocular weight constituents than the calibration standard.
0 The chromatographic fingerprint of the sample resembles an oil, but does not match the calibration standard.
Y The chromatographic fingerprint of the sample resembles a petroleum product eluting in approximately the correct car boll range, but the elution pallem does not match tbe calibration standard.
Z The chromatographic fingerprint docs not resemble a pelroleum pro duel.
3

Columbia Analytical Services, Inc. Kelso, WA
State Certifications, Accreditations, and Licenses
Agency Number Alaska DEC UST UST-040 ArizonaDHS AZ0339 Arkansas- DEQ 88-0637 California DHS 2286 DODELAP Lll-119 Florida DOH E87412 GeorgiaDNR 881 Hawaii DOH -ldahoDHW -Indiana DOH C-WA-01 ISO 17025 Lll-118 Louisiana DEQ 3016 Louisiana DHH LA080001 MaineDHS WA0035 Michigan DEQ 9949 Minnesota DOH 053-999-368 Montana DPHHS CERT0047 NevadaDEP WA35 New Jersey DEP WA005 New Mexico ED -
North Carolina DWQ 605 Oklahoma DEQ 9801 Oregon- DEQ (NELAP) WA100010 South Carolina DHEC 61002 Texas CEQ I 04704427-08-TX Washington DOE I Cl203 Wisconsin DNR 998386840 Wyoming (EPA Region 8) -
II E II B E H
t4tlll 4

COLUMBIA ANALYTICAL SERVICES, INC.
Client: Alaska Department of Fish & Game Senice Request No.: Kll !0960 Project: Kensington Gold Mine-Whole Fish Analysis Date Received: 11/9/11 Sample Matrix: Fish Tissue
CASE NARRATIVE
All analyses were performed consistent with the quality assurance program of Columbia Analytical Services. Inc. (CAS). This report contains analytical results for samples designated for Tier II data deliverables. When appropriate to tl1e method, metl10d blank results have been reported with each analytical test. Additional quality control analyses reported herein include: Laboratory Duplicate (DUP), Matrix Spike (MS), and Laboratory Control Sample (LCS).
Samnle Receipt
Three fish tissue samples were received for analysis at Columbia Analytical Services on 11/9/11. The samples were received in good condition aod consistent with tl1e accompanying chain of custody form. TI1e samples were stored frozen at -20C upon receipt at the laboratory.
Total Metals
Matrix Spil<e Recovery Exce1Jtions: The control criteria for matrix spike recovery of Aluminum for sample KGM Lower Slate were not applicable. The analyte concentration ht tlte sample was significantly higher t!Jan tl1e added spike concentration, preventing accurate evaluation ofthe spike recovery.
Relative Percent Difference Exceptions: The Relative Percent Difference (RPD) for the replicate analysis of Aluminmn in sample KGM Lower Slate was outside the CAS control limits (23% RPD versus a control limit of 20%). TI1e samples ·were homogenized, freeze dried, then ground prior to digestion, however tltis was not sufficient to acltieve a completely urtifonn distribution of Aluminum in the tissue.
No other anomalies associated with the analysis of these samples were observed.
5

•• "'
§)ohullhia CHAIN OF CUSTODY SRII:_~ 11 '· oq teDAllalylh.Jt·ll Serl'lces"'· COC II ~~~ (UIJIIU)'t:l! • 0\""'U Coii~)IJ") 1317 Soulh 13\h Ave. • Kelso. WA 98626 • (360) 577-7222 • (800) 695-7222x07 • FAX (360) 636-1063 -~~..;=::=;:=.~~coo."""'"' K ~lq~ ~ }A ;'lle ~y\..t,\.Q £:~\.. I / I I •--, J!'-!S"t\1 · eo..Mys·'?
PAOJECl . --·-·--·. ''""""" -z.2:21 LJ I t.J PROJECT MANAGER ~
<o
COMPANVIAOOAESS if! --.. :::::- a ~
CITVI$TA1'8ZIP <;:
8 J' .. ~ "' ~ -·· ~ 1<J
REMARKSI DATE I TIME I LAB 1.0. MATRIX "'"'
f-!-"'L-'-"'-"= '-"""'"'-t-"-'-"L'-t-'-'='-'- -fiL!I.lYt;:_!_~ - ~~- -- E_ -L- - ____,\
~
d I bEt--t=EE=Efrb·iEEEE-----.--1l+_~""ffl. · ~~~~"'-1--1-·-=- . -1- l ··--I
·--~-1 I t=l I I IJ_jjJ=tl=tl IJ=tl=tti_H__ I (r)
t I I I I t=U Hjj_\-ttttttrJJ-tl-t=t=~=1 I I l--l--1---1-1-f--·l--1---1-l-l-+--l-l-1 I I I
INVOICE INFORMATION Circle wbid1 rne~rruR he ;:malvzed·BEPORl REQUIREMENTS P.O. ff ------
_ I. noutine Report: Met11od Bill To: TotaiMelals:~s Sb Ba Be B Ca @)co ~Fe (§DMg Mn Mo @1<.@ Na € 'J;r T! Sn V~Hg Blank, Surrogate, as Dissolved Mi:ilals: AI As Sb Ba Be 8 Ca Cd Co Cr Cu Fe Pb Mg Mn Mo Ni I< Ag Na Se Sr Tl Sn V Zn Hg required
•tNDICATE STATE HYDROCARBON PROCEDUHt:: AK liA WI NUR I HWI::t:i I 0 fHER _(CIRCLE ONE) _ ll. Aepott Oup., MS, MSO as
TURNAROUND REQUIREMENTS I SPECIAL INSTRUCTIONS/COMMENTS• required
__ 241lr ~---48 hr. _Ill. Data Validation Report .--5Day
(includes all raw data) __ Standard ("I 0-15 working days)
_IV. CLP Deliverable Report __ Provide FAX Results
-· V. EOD .... -- Requested Aepo11 Dale
RELINQUISHED BY:
~M11iouf!J.., II /8/t/S1!' lUre T Oateffime 'R~,: tw.l'\___ ~----1t~-"'~-lh---~f.ircrt\falll"e Firm
RELINQUISHED BY: RECEIVED BY:
STgtlature----- Date!Ti.lile-..··-..·-· Sl911aiLir·e· -··-..---- oarerrr;11·e--... ·-
Prfi:IIiiCfNi:.lllS___ "Rnn--..----·--=--1. Pl'inte.u Na~·~--.............._. ~~!f.0.~~···==.----··-...... ..

Columbia Analytical Services, Inc. PC tC.v Cooler Receipt and Preservation Form
1
11 1Client/Project: /Hasrx:L j)eDf f)t b'f:h £ {pf/10 ServiceRequestK11__ a(\i'4'" ~-=-1 _,_,~~vC ,{"'-:{""J_B_y_:-1!7)-_
Received. if /q/f[ Op~ned: I ·, By: !£? Unloaded: _ ~"'LL IZ/)LI I fgJ.L I
1. Samples were received via? Mail UPS DHL PDX Courier HandDelivered
2. Samples were received in: (circle)
3. Were custody seals on coolers?
Box
N
NAOther·-------------=----~-
lfyes, how many and where?__-~..(-fJbrrx-iq_L.J,..!)-4<-t'-"----------------,
Envelope
lf present, were they signed and dated?
7. Packing material used. Inserts Bubble Wrap Gel Other
8. Were custody papers properly filled signed, etc.)?
9. Did all bottles arrive in good condition (unbroken)? Indicate in the table below.
10. Were all sample labels complete (i.e analysis, preservation, etc.)?
11. Did all sample labels and tags agree with custody papers? Indicate major discrepancies in the table on page 2.
12. Were appropriate bottles/containers and volumes received for the tests indicated?
13. Were tl1e pH-preserved bottles (see SMO GEN SOP) received at the appropriate pH? Indicate in the table below
14. Were VOA vials received without headspace? Indicate in the table below.
NA {f) N
NA rD N
NA N0 NA t[) N
NA 6) N
y N
y N~ 15. Was Cl2/Res negative? .J>::£) y N
Notes, Discrepancies, & Resolutions:__________________________________________________________________ __
Page__L_of___ 7

COLUMBIA ANALYTICAL SERVICES, INC.
Analytical Report
Client: Project: Sample Matrix:
Alaska Department of Fish and Game
Kensington Gold Mine Whole Fish analysis/22224
Tissue
Service Request: Date Collected: Date Received:
Klll0960 08/101!1
ll/09/ll
Solids, Total
Prep Method: Analysis Method: Test Notes:
NONE
Freeze Dry Units: Basis:
PERCENT
Wet
Sample Name Lab Code Date
Analyzed Result Result Notes
KGM Upper Slate
KGM E.Fork Slate
KGM Lower Slate
Klll0960-00 I K 1110960-002
Klll0960-003
lli!Oill
ll/10/ll ll/10/ll
22.5
24.9 23.8
Klll0960icp.spl -Sample 1210611! Page No:
8

COLUMBIA ANALYTICAL SERVICES, INC.
QAIQC Report
Client: Alaska Deparbnent ofFish and Game Service Request: Klll0960
Project: Kensington Gold Mine Whole Fish analysis/22224 Date Collected: 10/11111
Sample Matrix: Tissue Date Received: 11/09111
Date Extracted: NA Date Analyzed: 11/10111
Duplicate Summary
Sample Name: KGM Lower Slate Units: PERCENT Lab Code: Klll0960·003D Basis: Wet Test Notes:
Duplicate Relative Prep Analysis Sample Sample. Percent Result
Aualyte Method Method Result Result Average Difference Notes
Solids. Total NA Freeze Dry 23.8 23.7 23.8 <1
P~geNo.:KIIIO%ilicp_spl - DUP 12/(16/11
9

COLUMBIA ANALYTICAL SERVICES, INC.
Analytical Report
Client: Alaska Department ofFish and Game
Project: Kensington Gold Mine Whole Fish analysis/22224
Sample Matrix: Animal tissue
Mercury, Total
Prep Method: METHOD Analysis Method: 1631E Test Notes:
Dilution Date Date Result Sample Name Lab Code MRL Factor Extracted Analyzed Result Notes
KGM Upper Slate K1110960-00 1 1.0 20 11117111 11/18!11 112 KGM E. Fork, Slate K 1110960-002 1.0 20 11117/11 11118/11 107 KGM Lower Slate Klll 0960-003 1.0 20 11117111 11118/ll 67.4 Method Blank I K1110960-MB1 1.0 20 11117/11 11/18/11 ND Method Blank 2 Klll0960-MB2 1.0 20 11117111 11118!11 ND Method Blank 3 Klll0960-MB3 1.0 20 11117/11 11/l8/Il ND
Service Request: Kll!0960 Date Collected: 08/10/11 Date Received: 11/09/11
Units: ng/g ~ \~lb Basis: Dry
Kll l0%0ICP .AMI • Sampk 11129/2011 Pag~ No.:
10

CPS
S
L
T
An
Percent Recovery
CAS Relative
Prep Analysis Spike Level Sample Spike Result Acceptance Percent ResiJ!t
alyte Method Method MRL MS DMS Result MS DMS MS DMS Limits Difference Notes
rcury METHOD 1631E 1.0 247 249 42.3 317 276 Ill 94 70-130 17 Me
COLUMBIA ANALYTICAL SERVICES, INC.
QAIQC Report
lient: Alaska Department of Fish and Game Service Request: Klll0960
roject: Kensington Gold Mine Whole Fish analysis/22224 Date Collected: NA
ample Matrix: Animal tissue Date Received: NA
DatcExtracted: ll/17111 Date Analyzed: 11/18111
Matrix Spike/Duplicate Matrix Spike Summary Total Metals
ample Name: BatchQC Units: ng/g
ab Code: KII I 0959-003MS, Kll !0959-003MSD Basis: Dry
est Notes:
Page No.: KIJ i09601CP.AMI- DMS 1112912011
11

COLUMBIA ANALYTICAL SERVICES, INC.
QA!QC Report
Client: Project: LCS Matrix:
Sample Name:
Test Notes:
Alaska Department ofFish and Game Service Request: Kensington Gold Mine Whole Fish analysis/22224 Date Collected: Water Date Received:
Date Extracted: Date Analyzed:
Ongoing Precision and Recovery (OPR) Sample Summary Total Metals
Ongoing Precision and Recovery (Initial) Units: Basis:
K1110960
NA NA NA 11/18/11
ng/L NA
Analyte Prep
Method Analysis Method
True Value Result
Percent Recovery
CAS Percent
Recovery Acceptance
Limits Result Notes
Mercury METIIOD 1631E 5.00 4.87 97 70-130
Page No.: KIIIO!MOICP.At'.tfl - OPR (lcsw) lln912011
12

COLUMBIA ANALYTICAL SERVICES, INC.
QA/QC Report
Client: Project: LCS Matrix:
Sample Name:
Test Notes:
Alaska Department ofFish and Game Kensington Gold Mine Whole Fish nnalysis/22224
Service Request: Date Collected:
Water Date Received: Date Extracted: Date Analyzed:
Ongoing Precision and Recovery (OPR) Sample Summary Total Metals
Ongoing Precision and Recovery (Final) Units: Basis:
K111 0960 NA NA NA I 1/1 8/11
ng/L
NA
Analytc Prep
Method Analysis Method
True Value Result
Percent Recovery
CAS Percent
Recovery Acceptance
Limits Result Notes
Mercury METI!OD 163IE 5.00 4.60 92 70-130
Page No.:Klli096DICP.AMI-OPR(Icsw)(2} 11!2912011
13

COLUMBIA ANALYTICAL SERVICES, INC.
QNQCReport
Client: Project: LCS Matrix:
Sample Name: Lab Code: Test Notes:
Alaska Department ofFish and Game Kensington Gold Mine Whole Fish analysis/22224 Animal tissue
Quality Control Sample (QCS) Summary Total Metals
Quality Control Sample
Service Request: Date Collected: Date Received:
Date Extracted: Date Analyzed:
Units: Basis:
K1110960
NA NA 11117111
11118/11
ng/L
Dry
Source:
Analyte
TORT
Prep Method
Analysis Method
True Value Result
Percent Recovery
CAS Percent
Recovery Acceptance
Limits Result Notes
Mercury METHOD 1631E 270 247 91 70-130
Page No_·Klii09601CP_Alvfl- QCS (icv) lln9fl011
14

Columbia Analytical Services
- Cover Page-INORGANIC ANALYSIS DATA PACKAGE
Client: Project Name: Project No.:
Alaska Department of Fish and Game Kensington Gold Mine Whole Fish analysis 22224
Service Request: Klll0960
Sample Name: Lab Code:
KGM U~~er Slate K1110960-001 KGM E.Forke Slate Klll0960-002 KGM Lower Slate K1110960-003 KGM Lower SlateD K1110960-003D KGM Lower SlateS Method Blank
Klll0960-003S K1110960-MB
Comments:
Date:Approved By:
15
Columbia Analytical Services
Metals
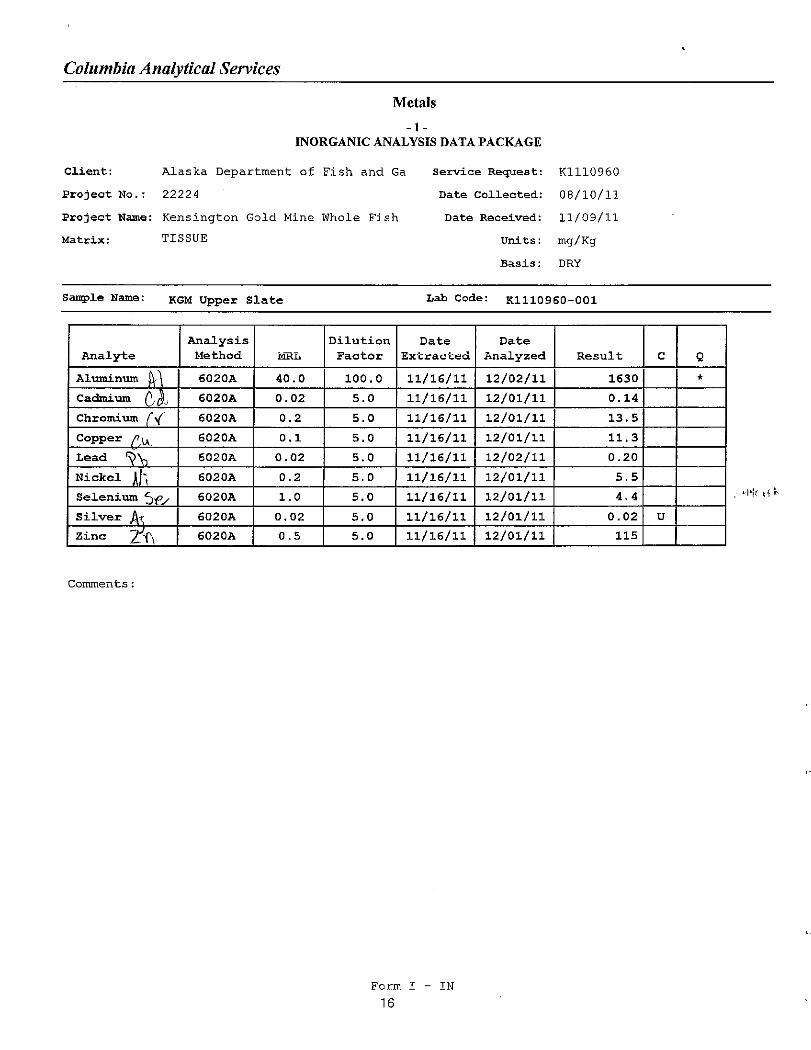
-1INORGANIC ANALYSIS DATA PACKAGE
Client: Alaska Department of Fish and Ga Service Request: Klll0960
Project No.: 22224 Date Collected: 08/10/11
Project Name: Kensington Gold Mine Whole Fish Date Received: 11/09/11
Matrix: TISSUE Units: mg/Kg
Basis: DRY
Sampl.e Name: l<GM Upper Slate Lab Code: 1<1110960-001
Analysis Dilution Date Date Analyte Method :M:RL Factor Extracted Analyzed Result c Q
Aluminum ~~ 6020A 40.0 100.0 11/16/11 12/02/11 1630 • Cadmium 6020A 0.02 5.0 11/16/11 12/01/11 0.14 ~~' Chromium (..[ 6020A 0.2 5.0 11/16/11 12/01/11 13.5
Copper f'.V.. 6020A 0.1 5.0 11/16/11 12/01/11 11.3
Lead 6020A 0.02 5.0 11/16/11 12/02/11 0.20 'Y'<l Nickel Ali 6020A 0.2 5.0 11/16/11 12/01/11 5.5
Selenium ~t'/ 6020A 1.0 5.0 11/16/11 12/01/11 4.4
Silver At. 6020A 0.02 5.0 11/16/11 12/01/11 0.02 u Zinc 6020A 0.5 5.0 11/16/11 12/01/11 115 2'1\
Comments:
Form I - IN
16

Columbia Analytical Services
Metals
- 1INORGANIC ANALYSIS DATA PACKAGE
Client: Alaska Department of Fish and Ga Service Request: Klll0960
Project No.: 22224 Date Collected: 09/13/11
Project Name: Kensington Gold Mine Whole Fish Date Received: 11/09/11
Matrix: TISSUE Units: mg/Kg
Sample Name:
Analyte
Alwninwn
Cadmium
Chromium
Copper
Lead
Nickel
Selenium
Silver
Zinc
Basis: DRY
KGM E.Fork Slate Lab Code: K1110960-002
Analysis Dilution Date Date Method MRL Factor Extracted Analyzed Result c Q
6020A 2.0 5.0 11/16/11 12/02/11 46.3 * 6020A 0.02 5.0 11/16/11 12/01/11 1.99
6020A 0.2 5.0 11/16/11 12/01/11 1.3
6020A 0.1 5.0 11/16/11 12/01/11 14.6
6020A 0.02 5.0 11/16/11 12/02/11 0.04
6020A 0.2 5.0 11/16/11 12/01/11 1.1
6020A 1.0 5.0 11/16/11 12/01/11 4.6
6020A 0.02 5.0 11/16/11 12/01/11 0.02
6020A 0.5 5.0 11/16/11 12/01/11 133
Comments:
Form I - IN
17

Columbia Analytical Services
Metals
- 1INORGANIC ANALYSIS DATA PACKAGE
C1ient: Alaska Department of Fish and Ga Service Request: Klll0960
Project No.: 22224 Date Collected: 10/11/11
Project Name: Kensington Gold Mine Whole Fish Date Received: 11/09/11
Matrix: TISSUE Units: rng/Kg
Basis: DRY
Sample Name:
Analyte
Aluminum
Cadmium
Chromium
Copper
Lead
KGM Lower Slate Lab Code: Kl110960-003
Analysis Dilution Date Date Method MRL Factor Extracted Analyzed Result
6020A 39.9 100.0 11/16/11 12/02/11 2430
6020A 0.02 5.0 11/16/11 12/01/11 0.72
6020A 0.2 5.0 11/16/11 12/01/11 17.3
6020A 0.1 5.0 11/16/11 12/01/11 15.5
6020A 0.02 5.0 11/16/11 12/02/11 0.50
c Q
•
Nickel
Selenium
Silver
Zinc
6020A 0.2 5.0 11/16/11 12/01/11 6.2
6020A 1.0 5.0 11/16/11 12/01/11 3.8
6020A 0.02 5.0 11/16/11 12/01/11 0.05
6020A 0.5 5.0 11/16/11 12/0i/11 195
Comments:
Form I - IN
18

Columbia Analytical Services
Metals
- 1JNORGANIC ANALYSIS DATA PACKAGE
Client: Alaska Department of Fish and Ga Service Request: Klll0960
Project No.: 22224 Date Collected:
Project Name: Kensington Gold Mine Whole Fish Date Received:
Matrix: TISSUE Units: rng/Kg
Basis: DRY
Sample Name: Method Blank Lab Code: K1110960-MB
c Q Analyte
.
Analysis Dilution Date Date Method MRL Factor Extracted Analyzed Result
Aluminum
Cadmium
Chromium
Copper
6020A 2.0 5.0 11/16/11 12/02/11 2.0 u * 6020A 0.02 5.0 11/16/11 12/01/11 0.02 u 6020A 0.2 5.0 11/16/11 12/01/11 0.2
6020A 0.1 5.0 11/16/11 12/01/11 0.1
u
u
Lead 6020A 0.02 5.0 11/16/11 12/02/11 0.02 u Nickel 6020A 0.2 5.0 11/16/11 12/01/11 0.2 u Selenium 6020A 1.0 5.0 11/16/11 12/01/11 1.0 u
Silver
Zinc
6020A 0.02 5.0 11/16/11 12/01/11 0.02
6020A 0.5 5.0 11/16/11 ·12/01/11 0.5
u u
Cormnents:
Form I - IN
19

Columbia Analytical Services Metals
-SA
SPIKE SAMPLE RECOVERY
Client: Alaska Department of Fish and Ga Service Request: Klll0960
Project No.: 22224 Units: MG/KG
Project Name: Kensington Gold Mine Whole Fish Basis: DRY
Matrix~ TISSUE
Sample Name: KGM Lower SlateS Lab Code: K1110960-003S
Control I Spike Sample Spike Anal.yte c cj Q Method Limit %R Result Result Added %R Aluminum I 4152.4 198.0 I 2428.41 I 871 6020A Cadmium I 75 - 125 I 5.57 0. 721 I 4. 951 98 6020A Chromium I 75 - 125 I 40.3 17.31 I 19. B I 116 6020A Copper I 75 - 125 I 41.7 1s.sl I 24.81 106 6020A Lead I 75 - 125 I 40.38 o.so I I 49. so I 81 6020A Nickel I 75 - 125 I 57.5 6.21 I 49.51 104 6020A Selenium I 75 - 125 I 20.5 3.al I 16.51 101 6020A Silver I 75 - 125 I 4.52 o.osl I 4. 951 90 6020A Zinc I 75 - 125 I 234.8 194.71 I 49. sl 81 6020A
An empty field in the Control Limit column indicates the control limit is not applicable
Form V (PART 1) - IN 20

Columbia Analytical Services
Metals
-6
DUPLICATES
Client: Alaska Department of Fish and Ga Service Request: K1110960
Project No.: 22224 Units: MG/KG
Project Name: Kensington Gold Mine Whole Fish Basis: DRY
Matrix:
Sample Name:
TISSUE
KGM Lower SlateD Lab Code: Kll10960-003D
Control. AnaJ.yte Limit
Aluminum 20
Cadmium 20
Chromium 20
Copper 20
Lead 20
Nickel 20
Selenium
Silver
Zinc 20
Sample (S)
2428.4
0.72
17.3
15.5
0.50
6.2
3.8
0.05
194.7
c Duplicate (D) c RPD Q Method
3065.4 1 23.2 6020A* 0.67 I 7.2 6020A
19.2 I 10.4 6020A
17.3 I 11.0 6020A
0.55 I 9.5 6020A
7.2 I 14.9 6020A
3.7 I 2.7 6020A
0.05 I 0.0 6020A
192.5 I 1.1 6020A
An empty field in the Control Limit column indicates the control limit is not applicable.
E'orm VI - IN
21

Columbia Analytical Services Metals
-7
LABORATORYCONTROLSA~~LE
Client: Alaska Department of Fish and Ga Service Request: Kl110960
Project No.: 22224
Project Name: Kensington Gold Mine Whole Fish
Aqueous-LCS Source:
Anal.yte
I Aluminum
Cadmium
Chromium
Copper
Lead
Nickel
Selenium
Silver
Zinc
CAS MIXED Solid LCS Source:
Aqueous: ug/L
True Found
2ooo.o1 1883.31 5o.ol 48.8 1
2oo.o1 184. o 1 250.01 244.8 1 5oo.ol 459.6 1 500.ol 464.4 1 167.ol 11a. 9 1 5o.ol 46.1 1
5oo.ol 5o5. a 1
%R
941 98 1 921 981 921 931
101 1
93 1
1011
Solid: mg/kg
True Found c
I I I I I I I I I I I I I I I I I I
Limits %R
_jI I I I I I I I
Form VII - IN
22

COLUMBIA ANALYTICAL SERVICES, INC.
QAIQC Report
Client: Alaska Department of Fish and Game Service Request: Klll0960 Project: Kennsington Gold Mine Whole Fish analysis Date Collected: NA LCS Matrix: Tissue Date Received: NA
Date Extracted: 111!6/11 Date Analyzed: 12/01-02/J I
Standard Reference Material Summary Total Metals
Sampie Name: Standard Reference Material Units: mg/Kg (ppm) Lab Code: KIll 0960-SRM I Basis: Dry
Test Notes:
Source: N.R.C.C. Dorm-3
Prep Analysis True Percent Control Result Analyte Method Method Value Result Recovery Limits Notes
Cadmium PSEP Tissue 6020A 0.29 0.33 114 0.216-0.372 Chromium PSEP Tissue 6020A 1.89 1.70 90 1.38-2.47 Copper PSEP Tissue 6020A 15.5 15.7 101 11.9-19.4 Lead PSEP Tissue 6020A 0.395 0.308 78 0.276 - 0.534 Nickel PSEP Tissue 6020A 1.28 1.25 98 0.83 - 1.82 Zinc PSEP Tissue 6020A 51.3 52.6 103 38.6-65.3
Kl1109601Cl'.sp2-DORMJ J2/tl7/1l Pa~c Nu.:
23

COLUMBIA ANALYTICAL SERVICES, INC.
QA/QC Report
Client: Alaska Department ofFish and Game Service Request: Klll0960
Project: Kennsington Gold Mine Whole Fish analysis Date Collected: NA LCS Matrix: Tissue Date Received: NA
Date Extracted: 11/16/11
Date Analyzed: 12/0 1-02/1 I
Standard Reference Material Summary Total Metals
Sample Name: Standard Reference Material Units: mg/Kg (ppm)
Lab Code: KIll 0960-SRM2 Basis: Dry
Test Notes:
Source: N.R.C.C. Tort-2
Prep Analysis True Percent Control Result Analyte Method Method Value Result Recovery Limits Notes
Cadmium PSEP Tissue 6020A 26.7 28.2 106 20.9-32.8
Chromium PSEP Tissue 6020A 0.77 0.68 88 0.5-1.1
Copper PSEP Tissue 6020A 106 103 97 77-139
Lead PSEPTissue 6020A 0.35 0.29 83 0.18-0.58
Nickel PSEP Tissue 6020A 2.5 2.3 92 1.85-3.23
Selenium PSEP Tissue 6020A 5.63 6.07 108 3.97-7.56
Zinc PSEP Tissue 6020A 180 191 106 139-223
K1110<J601CI'.sp2-TORT.! 12107/11 Page Nu.:
24