Kencana Agri Limited - listed companykencana.listedcompany.com/newsroom/20121114_0839… · ·...
15
1 Kencana Agri Limited 3Q 2012 Performance Review
Transcript of Kencana Agri Limited - listed companykencana.listedcompany.com/newsroom/20121114_0839… · ·...

1
Kencana Agri Limited
3Q 2012 Performance Review

2
Disclaimer
This document has not been independently verified and has been prepared for
informational purposes only. No representation or warranty express or imply is
made as to, and no reliance should be placed on, the fairness, accuracy,
completeness or correctness of the information or opinions contained herein.
It is not the intention to provide, and you may not rely on this document as
providing, a complete or comprehensive analysis of the company’s financial or
trading position or prospects. The information and opinions contained in these
materials are provided as at the date of this presentation and are subject to
change without notice.
None of Kencana Agri Limited or any of its affiliates, advisers or representatives
shall have any liability whatsoever (in negligence or otherwise) for any loss
whatsoever arising from any use of this document or its contents.

3
Total Production 2011 : 116,515 MT9M2012 : 87,563 MT
Palm Oil Mills : 4Total Capacity : 210 MT/hour
Biomass Power Plant
Supporting Business
Port and Bulking Terminal
Logistics
Biomass Plant : 2 (Bangka,
Belitung)
Total Capacity : 13.5 MW
Palm Kernel Cake
CPO
CPKO
Fresh Fruit Bunches (FFB)
Total Land bank :198,935* ha
Nucleus :183,888 ha
Plasma : 15,047 ha
Total Planted Area : 58,195 ha
Nucleus : 45,698 ha
Plasma : 12,497 ha
Overview of Our Group’s Activities
Total capacity : 66,000 MT
Vessels : 6
Total Capacity : 13,500 MT
Kernel Crushing Plant : 2Total Capacity : 435 MT/day
ProductsProcessingPlantation
Total Production 2011 : 13,231 MT9M2012 : 8,441 MT
Total Production 2011 : 27,641 MT9M2012 : 10,746 MT
* Subject to final measurement

4
Where We Are…
� Oil palm estate
� Oil palm estate with palm oil mill and kernel
crushing plant
� Palm oil mill
� Port and bulking terminal, Joint venture with Louis Dreyfus
Commodities
� Biomass power plant
5
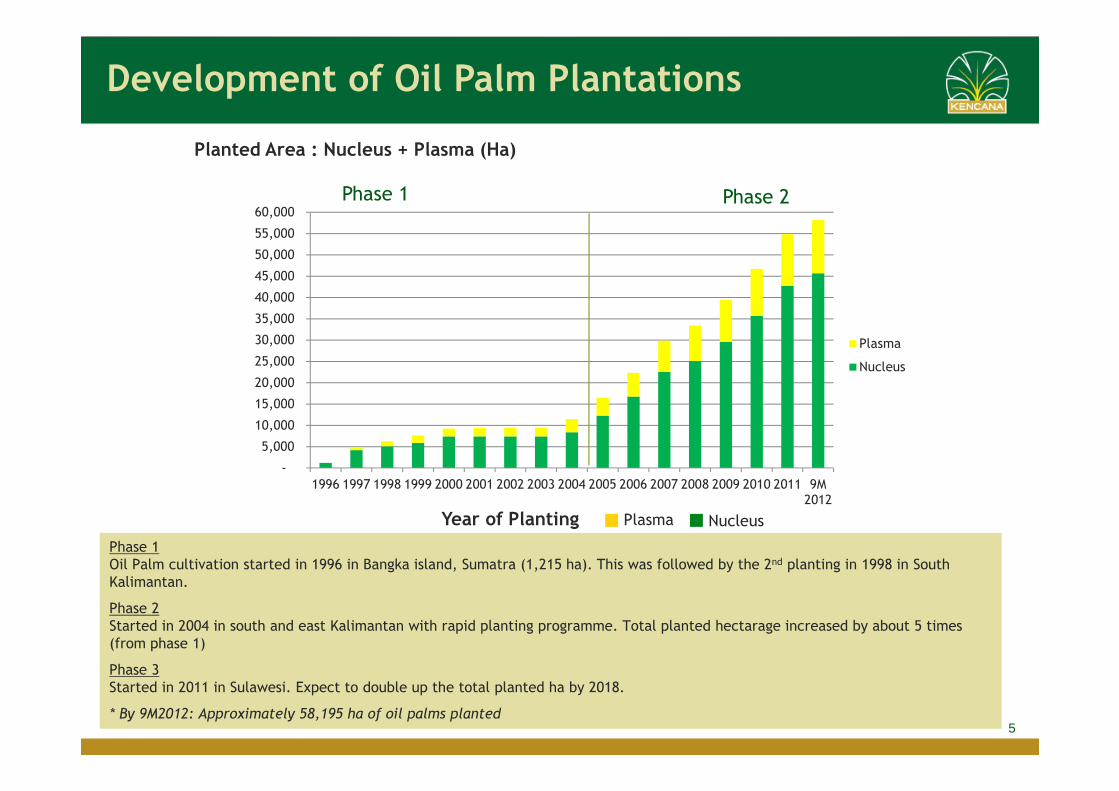
Phase 1
Oil Palm cultivation started in 1996 in Bangka island, Sumatra (1,215 ha). This was followed by the 2nd planting in 1998 in South
Kalimantan.
Phase 2
Started in 2004 in south and east Kalimantan with rapid planting programme. Total planted hectarage increased by about 5 times
(from phase 1)
Phase 3
Started in 2011 in Sulawesi. Expect to double up the total planted ha by 2018.
* By 9M2012: Approximately 58,195 ha of oil palms planted
Development of Oil Palm Plantations
Phase 1 Phase 2
Planted Area : Nucleus + Plasma (Ha)
Year of Planting Plasma Nucleus
-
5,000
10,000
15,000
20,000
25,000
30,000
35,000
40,000
45,000
50,000
55,000
60,000
1996 1997 1998 1999 2000 2001 2002 2003 2004 2005 2006 2007 2008 2009 2010 2011 9M2012
Plasma
Nucleus

6
Potential Double-Digit FFB Production Growth
AGE DISTRIBUTION OF OIL PALMS (NUCLEUS)
% of Nucleus Planted
AGE PROFILE OF OIL PALMS (Ha)
Immature %Young Mature
%Prime Mature
% Total
Nucleus 22,035 48% 11,595 25% 12,068 27% 45,698
Plasma 3,795 30% 4,434 36% 4,268 34% 12,497
Total 25,830 44% 16,029 28% 16,336 28% 58,195
• RELATIVELY YOUNG PROFILE: 72% OF YOUNG AND IMMATURE PALMS
• POTENTIAL FOR STRONG DOUBLE-DIGIT PRODUCTION GROWTH OVER THE NEXT 5 YEARS
Weighted Average Age = 6.5 Years
0%
3%
6%
9%
12%
15%
18%
21%
17 16 15 14 13 12 11 10 9 8 7 6 5 4 3 2 1
FFB Yield Parameters & Assumptions Immature Young Mature Prime Mature
Oil Palm Age (years) 1-3 4 5 6 7-20
Average FFB yield (MT/ha) 0 5-6 10-12 16-18 22-28
Age/(Years)

7
-
50,000
100,000
150,000
200,000
250,000
300,000
350,000
2000 2001 2002 2003 2004 2005 2006 2007 2008 2009 2010 2011 9M 2012
FFB Production Trend (Nucleus)
• 2000 – 2011 CAGR = 28.3%
• 2012 onward – expect steady increase in production
MT

8
Significant Land Bank for Future Planting
Total Land Bank 198,935 ha (including Plasma)
LandBank(ha)
PlantedArea(ha)
PlantedArea(%)
Nucleus 183,888 45,698 24.9
Plasma 15,047 12,497 83.0
Total 198,935 58,195 29.3
Planted Area : 29%
13%
8%
8%
71% Immature
Young Mature
Prime Mature
Unplanted Area
9
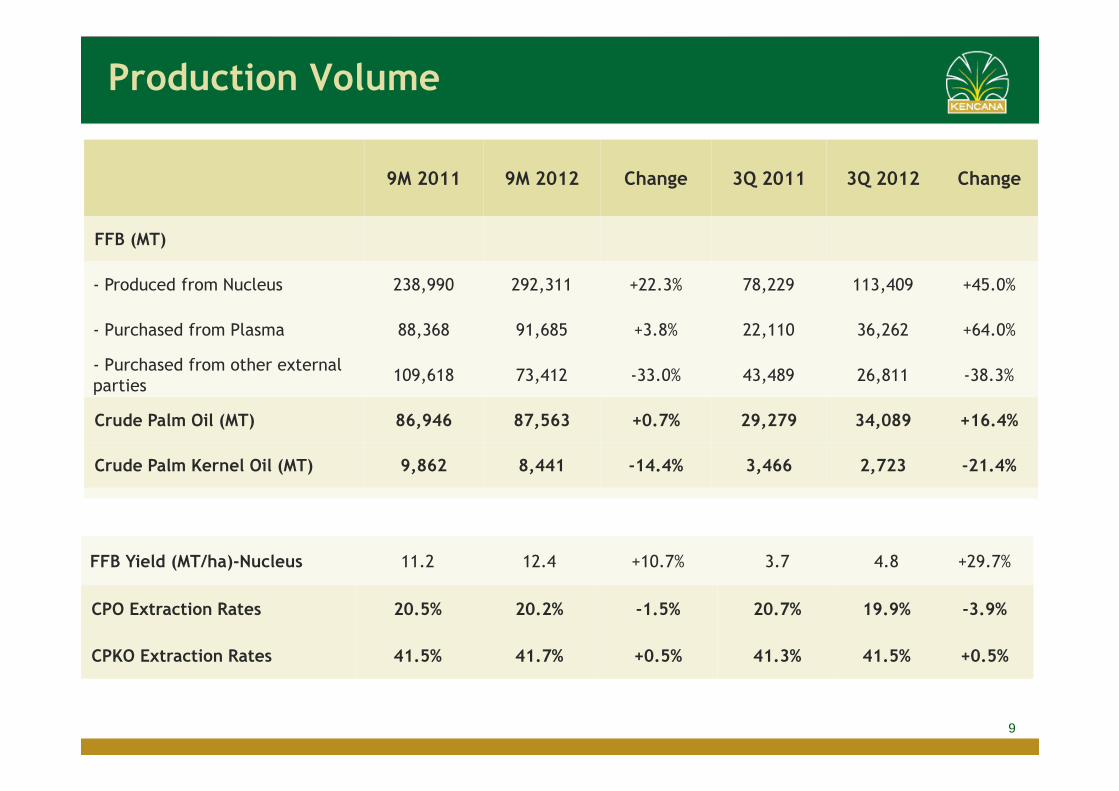
Production Volume
9M 2011 9M 2012 Change 3Q 2011 3Q 2012 Change
FFB (MT)
- Produced from Nucleus 238,990 292,311 +22.3% 78,229 113,409 +45.0%
- Purchased from Plasma 88,368 91,685 +3.8% 22,110 36,262 +64.0%
- Purchased from other external
parties109,618 73,412 -33.0% 43,489 26,811 -38.3%
Crude Palm Oil (MT) 86,946 87,563 +0.7% 29,279 34,089 +16.4%
Crude Palm Kernel Oil (MT) 9,862 8,441 -14.4% 3,466 2,723 -21.4%
FFB Yield (MT/ha)-Nucleus 11.2 12.4 +10.7% 3.7 4.8 +29.7%
CPO Extraction Rates 20.5% 20.2% -1.5% 20.7% 19.9% -3.9%
CPKO Extraction Rates 41.5% 41.7% +0.5% 41.3% 41.5% +0.5%

10
Sales Volume and Revenue (CPO & CPKO)
*) Others include sales of Kernel, Cake, FFB, and income from logistic and power generation
9M 2011 9M 2012 % change 3Q 2011 3Q 2012 % change
Sales Volume (MT)
- CPO 195,142 208,121 +6.7% 68,930 85,620 +24.2%
- CPKO12,561 9,126 -27.3% 7,895 3,854 -51.2%
Sales Revenue (USD’000)
- CPO 186,268 181,990 -2.3% 62,624 71,669 +14.5%
- CPKO 16,265 8,828 -45.7% 8,920 3,234 -63.8%
- OTHERS* 14,561 15,160 +4.1% 4,207 5,203 +23.7%
Average Sales Price (USD)
- CPO 950 880 -7.4% 910 840 -7.7%
- CPKO 1,290 970 -24.8% 1,130 840 -25.7%

11
Financial Performance
USD’000 9M 2011 9M 2012 % Change 3Q 2011 3Q 2012 % Change
Revenue 217,094 205,978 -5.1% 75,751 80,106 +5.8%
Gross profit 29,061 26,637 -8.3% 7,399 10,493 +41.8%
Operating profit 19,562 9,536 -51.2% 3,146 3,929 +24.9%
Profit before tax 13,054 4,849 -62.9% 700 2,017 +188.1%
Net profit for the period
9,604 3,936 -59.0% 469 1,046 +123.0%
EBITDA 22,761 13,014 -42.8% 3,815 4,872 +27.7%
Gross margin (%) 13.4 12.9 -0.5pp 9.8 13.1 +3.3pp
Net Profit margin (%) 4.4 1.9 -2.5pp 0.6 1.3 +0.7pp
EBITDA margin (%) 10.5 6.3 -4.2pp 5.0 6.1 +1.1pp

12
Balance Sheet
USD’000As at
31 Dec 2011
As at
30 September 2012Change
Current Assets 97,695 100,009 +2.4%
Non-current Assets 380,728 410,738 +7.9%
Total Assets 478,423 510,747 +6.8%
Current Liabilities 64,901 116,892 +80.1%
Non-current Liabilities 185,730 177,916 -4.2%
Total Liabilities 250,631 294,808 +17.6%
Shareholders’ Equity 227,792 215,939 -5.2%
Net Debt/Equity Ratio (%) 55.2 80.5 +25.3pp
Net Debt/Total Assets (%) 26.3 34.0 +7.7pp
Debt/EBITDA (x) 6.5 7.0 +0.5pp
EBITDA/Interest Expense (x) 3.0 2.8 -0.2pp

13
Cash Flows
n/m = not meaningful
USD’000 1H 2011 1H 2012 Change 2Q 2011 2Q 2012 Change
Cash at beginning of period 24,216 29,880
Net cash (used in)/from
operating activities23,387 7,065
Net cash used in
investing activities(37,157) (24,989)
Net cash from
financing activities15,483 12,421
Net effect of
exchange rate changes in
consolidating entities
(410) 1,142
Net increase/(decrease)
in cash1,303 (4,361)
Cash at end of period 25,519 25,519
USD’000 9M 2011 9M 2012 Change
Cash at beginning of period 24,216 23,019 -5.0%
Net cash from operating activities 34,607 10,507 -69.6%
Net cash used in
investing activities(55,687) (50,159) +10.0%
Net cash from
financing activities14,542 28,252 +94.3%
Net effect of exchange rate
changes in consolidating entities490 1,517 +209.6%
Net decrease in cash (6,048) (9,883) -63.4%
Cash at end of period 18,168 13,136 -27.7%

14
Updates and Future Developments
Updates:
New planted area (including plasma) of
approximately 3,300 ha in 9M 2012
4th palm oil mill with 45MT/hour capacity in East
Kalimantan is in operation
Additional land bank approximately 24,000 ha in
Central Sulawesi
Future Developments:
To maintain new planting of around 5,000-8,000
ha each year
To acquire more vessels to handle greater trading
volume

15
Thank You