kellogg Q3 2007 Earnings Release
21
1 Third Quarter 2007 Earnings Review Third Quarter 2007 Earnings Review October 29, 2007 October 29, 2007
-
Upload
finance23 -
Category
Economy & Finance
-
view
411 -
download
0
Transcript of kellogg Q3 2007 Earnings Release

1
Third Quarter 2007Earnings Review
Third Quarter 2007Earnings Review
October 29, 2007October 29, 2007

2
Forward-Looking Statements
This presentation contains, or incorporates by reference, “forward-looking statements” withprojections concerning, among other things, the Company’s strategy, and the Company’s sales, earnings, margin, operating profit, costs and expenditures, interest expense, tax rate, capital expenditure, dividends, cash flow, debt reduction, share repurchases, costs, brand building, ROIC, working capital, growth, new products, innovation, cost reduction projects, and competitive pressures. Forward-looking statements include predictions of future results or activities and may contain the words “expects,” “believes,” “should,” “will,” “will deliver,” “anticipates,” “projects,” or words or phrases of similar meaning.
The Company’s actual results or activities may differ materially from these predictions. The Company’s future results could also be affected by a variety of other factors, including competitive conditions and their impact; the effectiveness of pricing, advertising, and promotional spending programs; the success of productivity improvements and business transitions; the success of innovation and new product introductions; the recoverability of carrying amounts of goodwill and other intangibles; the availability of and interest rates on short-term financing; changes in consumer behavior and preferences; commodity and energy prices and labor costs; actual market performance of benefit plan trust investments; the levels of spending on systems initiatives, properties, business opportunities, integration of acquired businesses, and other general and administrative costs; U.S. and foreign economic conditions including interest rates, taxes and tariffs, and currency rate translations or unavailability; legal and regulatory factors; the underlying price and volatility of the Company’s common stock and the impact of equity-based employee awards; business disruption or other losses from terrorist acts or political unrest; and other items.
Forward-looking statements speak only as of the date they were made, and the Company undertakes no obligation to publicly update them.

3
Third Quarter 2007 Highlights
• Solid Revenue Growth
• Increased Levels of Investment
• 9% Higher Earnings Per Share
• Raising 2007 Earnings Guidance
• 2008 Outlook
4
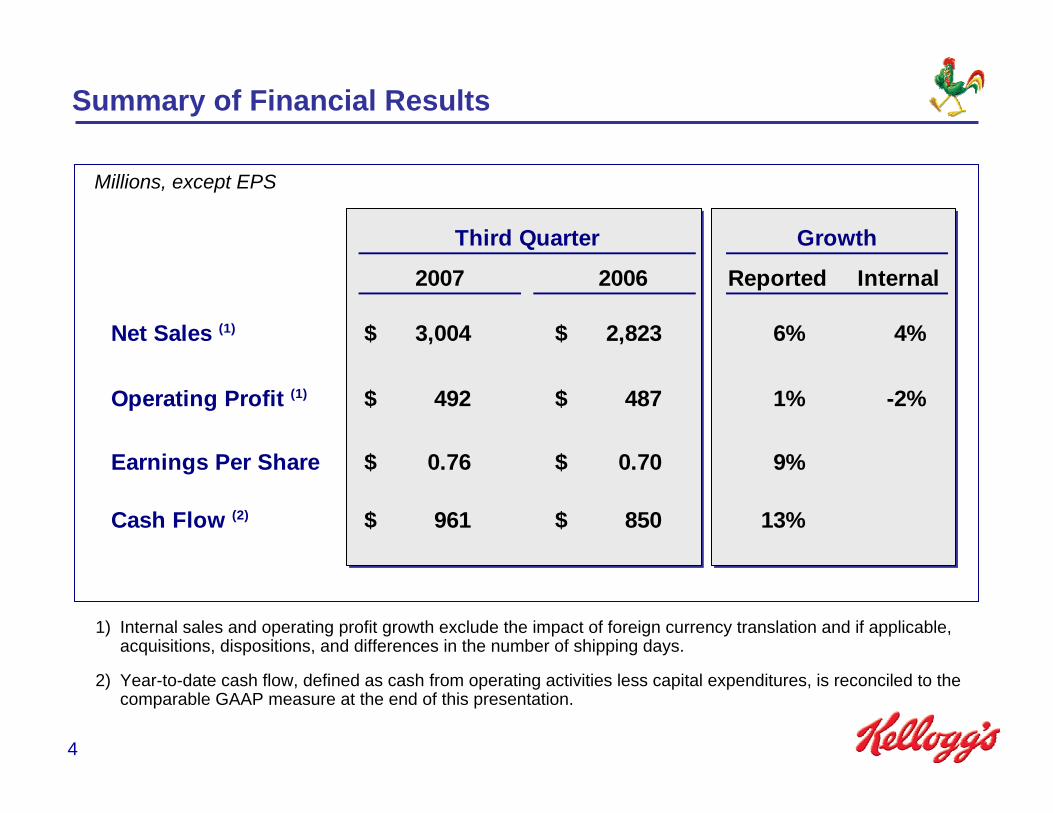
Summary of Financial Results
Millions, except EPS
1) Internal sales and operating profit growth exclude the impact of foreign currency translation and if applicable, acquisitions, dispositions, and differences in the number of shipping days.
2) Year-to-date cash flow, defined as cash from operating activities less capital expenditures, is reconciled to the comparable GAAP measure at the end of this presentation.
2006
Net Sales (1) $ 3,004 $ 2,823 6% 4%
Operating Profit (1) $ 492 $ 487 1% -2%
Earnings Per Share $ 0.76 $ 0.70 9%
Cash Flow (2) $ 961 $ 850 13%
Reported
Third Quarter
2007 Internal
Growth

5
Year-Over-Year % ChangeThird Quarter 2007: Net Sales Growth Components
* Internal net sales and operating profit growth exclude the impact of foreign currency translation and if applicable, acquisitions, dispositions, and difference in the number of shipping days.
0.0%
2.6%3.1%
0.7%
6.4%
Net Sales Tonnage Price/Mix Currency Acq./ Divest
+3.8%Internal*
YTD 7.9% 2.0% 3.6% 2.3% 0.0

6
% Change, Net Sales and Advertising
Reinvestment for the Future: Growth in Advertising
Net Sales Brand Building Net Sales Brand Building
Net SalesAdvertising
+6%
+ DD
Third Quarter 2007
+8%
+ DD
YTD 2007
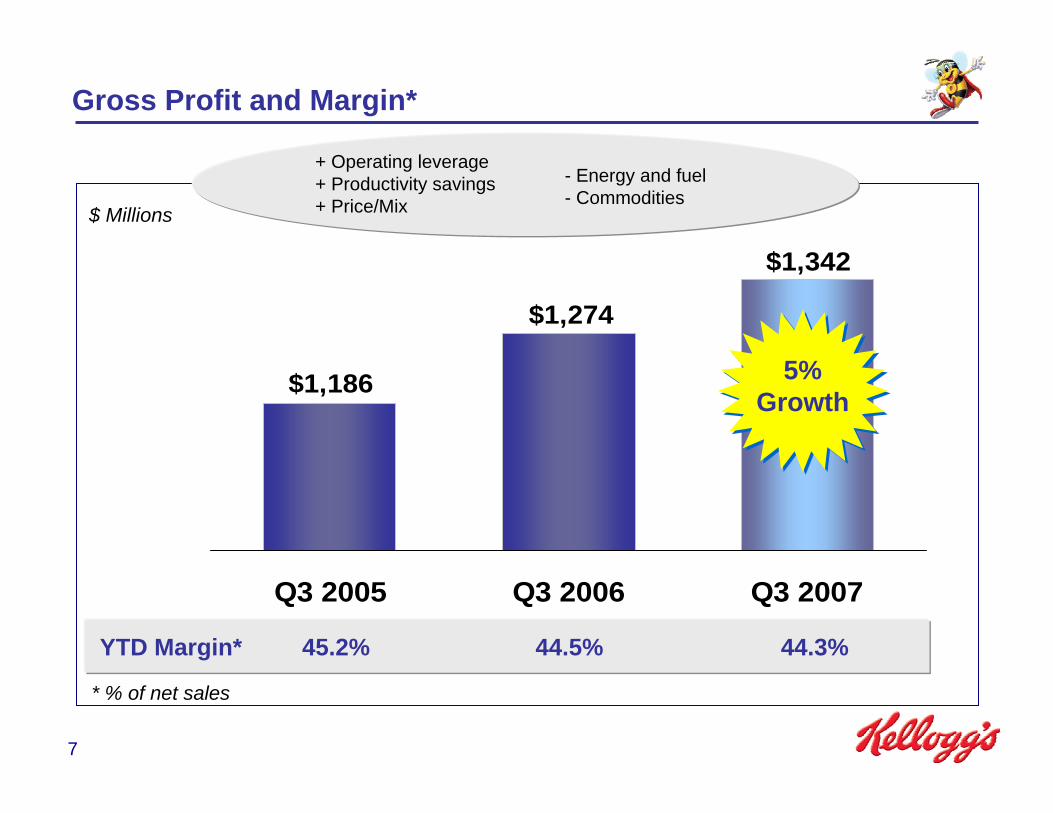
7
$1,186
$1,274
$1,342
Q3 2005 Q3 2006 Q3 2007
$ Millions
Gross Profit and Margin*
* % of net sales
- Energy and fuel- Commodities
+ Operating leverage+ Productivity savings+ Price/Mix
5% Growth
YTD Margin* 45.2% 44.5% 44.3%

8
Year-Over-Year % Change, Internal Growth (1)
Third Quarter 2007:Internal Operating Profit Growth by Area
1) Internal operating profit growth excludes the impact of foreign currency translation and if applicable, acquisitions, dispositions, and shipping day differences.
2) Includes Australia, Asia, and South Africa.
(2)% (4)% (2)%1%
(26)%
North America Europe
LatinAmerica
Asia Pacific
Total Company
YTD 3% 3% 11% (7)% (15)%
(2)

9
2007: Sixth Consecutive Year of Sustainable Growth
Grow Gross Profit• Decreased (20) basis pts
• Dollars up about $280 million
Increase Brand BuildingHigh Single Digit Increases
Drive Innovation
Increase Price / Mix2007: +3.6%
Grow Internal Net Sales2007: +5.6% Sustainable
Growth(V2V)
2007 Year-To-Date

10
$961
$850
YTD 2006 YTD 2007
$ Millions
* Kellogg defines Cash Flow as cash from operating activities, less capital expenditure; see reconciliation to GAAP cash flow at the end of this presentation.
Year-To-Date 2007: Higher Cash Flow*
13% Growth

11
2007 Outlook:Greater Confidence In Another Strong Year
Full Year 2007
+Low SD
Raising Guidance to $2.72 to $2.75Raising Guidance to $2.72 to $2.75
Internal Net Sales*
Internal Operating Profit*
Earnings Per Share
Includes significant investment in innovation, increased advertising, additional investment in up-front costs as well as higher commodity inflation
+Mid SD Growth
Greater than our long-term target of low single-digit growth
Increased up-front costs offset by lower tax rate
* Internal sales and operating profit growth exclude the impact of foreign currency translation and if applicable, acquisitions, dispositions, and differences in the number of shipping days.
19¢ ofUp-front
Costs
12
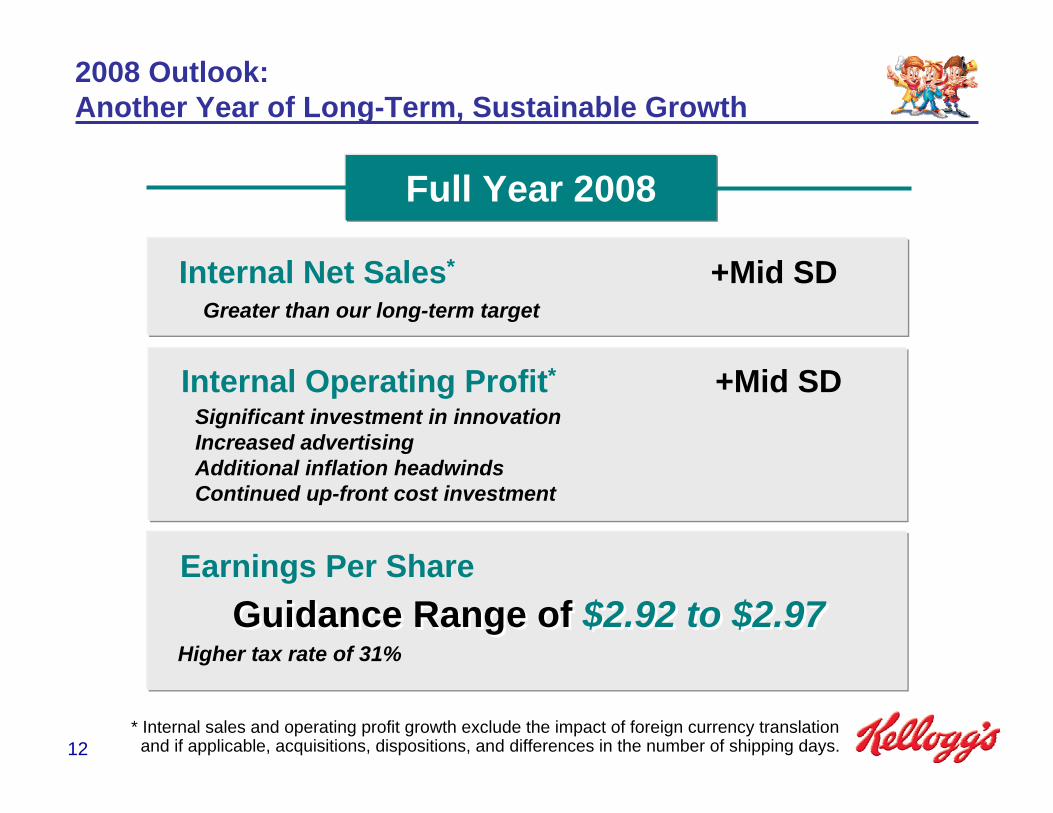
2008 Outlook:Another Year of Long-Term, Sustainable Growth
Full Year 2008
+Mid SD
Guidance Range of $2.92 to $2.97Guidance Range of $2.92 to $2.97
* Internal sales and operating profit growth exclude the impact of foreign currency translation and if applicable, acquisitions, dispositions, and differences in the number of shipping days.
Internal Net Sales*
Internal Operating Profit*
Earnings Per Share
Significant investment in innovation Increased advertising Additional inflation headwindsContinued up-front cost investment
+Mid SDGreater than our long-term target
Higher tax rate of 31%

13
6%
0%
3%
5%
Total NorthAmerica
Retail Cereal Retail Snacks Frozen andSpecialty Channels
1) Internal sales growth excludes the impact of foreign currency translation and if applicable, acquisitions, dispositions, and differences in the number of shipping days.
2) Includes U.S. and Canada retail cereal.
3) Includes biscuits, wholesome snacks, Pop-Tarts, and fruit snacks.
4) Includes frozen foods, Food Away From Home, and custom manufacturing.
Year-Over-Year %, Internal Net Sales Growth (1)
Third Quarter 2007:North America Growth
(2) (3)
(4)
YTD 6% 2% 8% 6%

14
North America Retail Cereal: Internal Net Sales Growth*Year-Over-Year % Change
0%
3%3%4% 4%
-2%
6%
Q1 Q2 Q3 Q4 Q1 Q2 Q3
2006 2007
* Internal sales and operating profit growth exclude the impact of foreign currency translation and if applicable, acquisitions, dispositions, and differences in the number of shipping days.

15
North America Retail Snacks: Internal Net Sales Growth*Year-Over-Year % Change
*Internal sales growth excludes the impact of foreign currency translation and if applicable, acquisitions, dispositions, and differences in the number of shipping days.
12% 12% 11%11% 11%
9%
5%
Q1 Q2 Q3 Q4 Q1 Q2 Q32006 2007
16
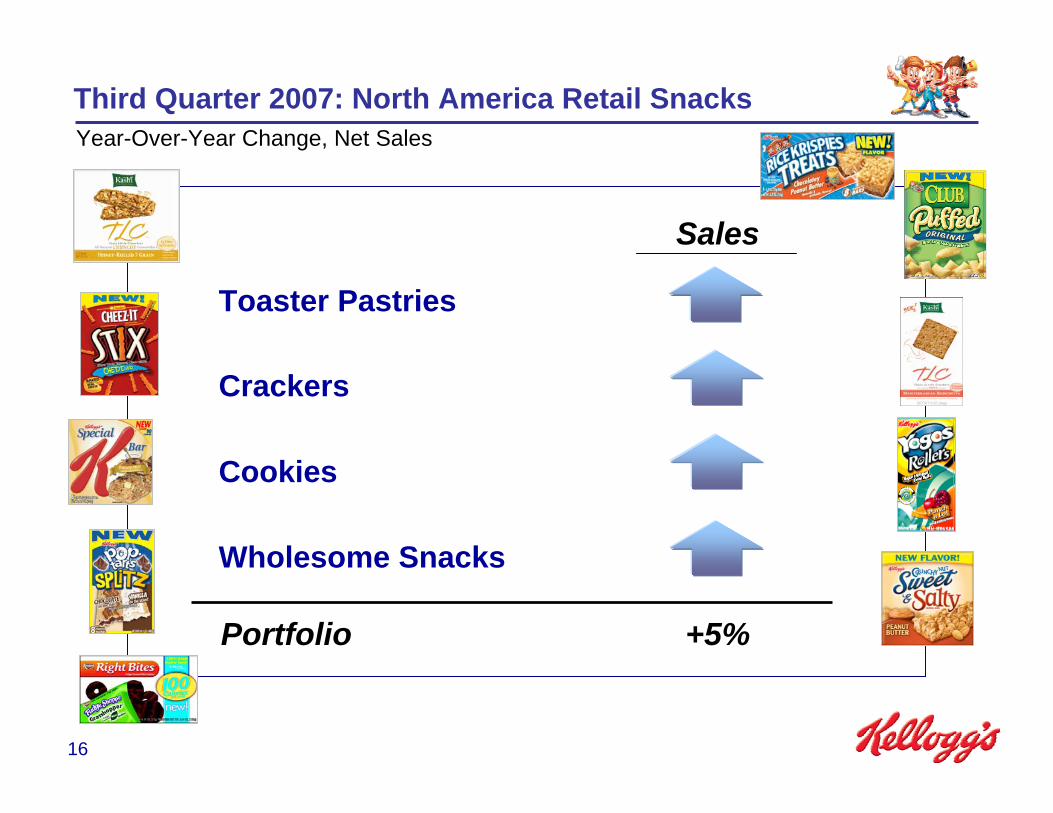
Third Quarter 2007: North America Retail SnacksYear-Over-Year Change, Net Sales
Toaster Pastries
Crackers
Cookies
Wholesome Snacks
Portfolio +5%
Sales

17
North America Frozen & Specialty Channels(1):Internal Net Sales Growth(2)
Year-Over-Year % Change
1) Includes Frozen Foods, Food Away From Home, and custom manufacturing.
2) Internal sales growth excludes the impact of foreign currency translation and if applicable, acquisitions, dispositions and differences in the number of shipping days.
6%
8%
5%
8%
5%
9%8%
Q1 Q2 Q3 Q4 Q1 Q2 Q32006 2007

18
6%5%5%
6%5%5% 5%
Q1 Q2 Q3 Q4 Q1 Q2 Q3
* Internal sales growth excludes the impact of foreign currency translation and if applicable, acquisitions, dispositions, and differences in the number of shipping days.
Kellogg International: Internal Net Sales Growth*Year-Over-Year % Change
2006 2007

19
Third Quarter International 2007: Internal Sales GrowthYear-Over-Year % Change, Internal Sales Growth (1)
1) Internal sales growth excludes the impact of foreign currency translation and if applicable, acquisitions, dispositions, and differences in the number of shipping days.
2) Includes Australia, Asia, and South Africa.
YTD 5% 6% 10% (1)%
-1%
3%
12%
5%
(2)Europe LatinAmerica
Asia Pacific
Total International

20
Confidence and visibility for another year of sustainable, dependable growth
Outlook for 2008
• Commodity inflation and volatility
• Drive initiatives to help offset inflation
• Strong innovation and advertising support
• Investment in geographic expansion
• Continued efficiency gains
21
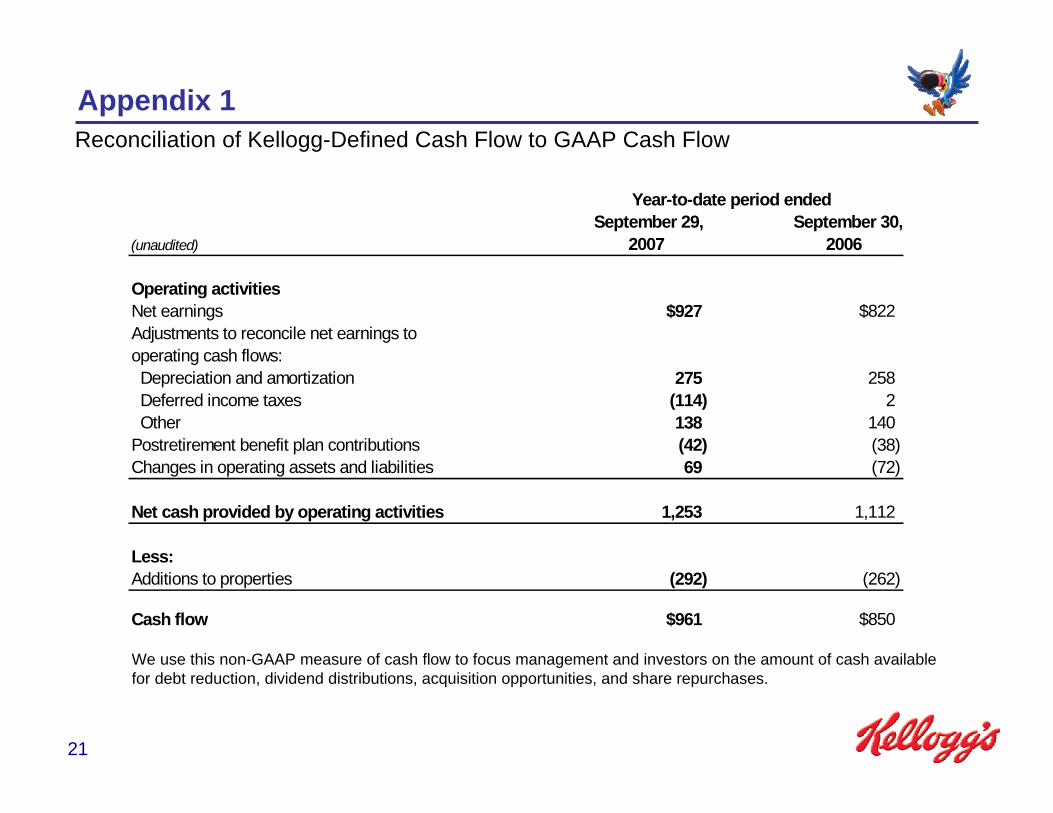
Appendix 1Reconciliation of Kellogg-Defined Cash Flow to GAAP Cash Flow
We use this non-GAAP measure of cash flow to focus management and investors on the amount of cash availablefor debt reduction, dividend distributions, acquisition opportunities, and share repurchases.
September 29, September 30,(unaudited) 2007 2006
Operating activitiesNet earnings $927 $822Adjustments to reconcile net earnings to operating cash flows: Depreciation and amortization 275 258 Deferred income taxes (114) 2 Other 138 140Postretirement benefit plan contributions (42) (38)Changes in operating assets and liabilities 69 (72)
Net cash provided by operating activities 1,253 1,112
Less:Additions to properties (292) (262)
Cash flow $961 $850
Year-to-date period ended