Kellogg Company€¦ · presciencepoint.com @presciencepoint Kellogg Company (NYSE: K) 3...
39
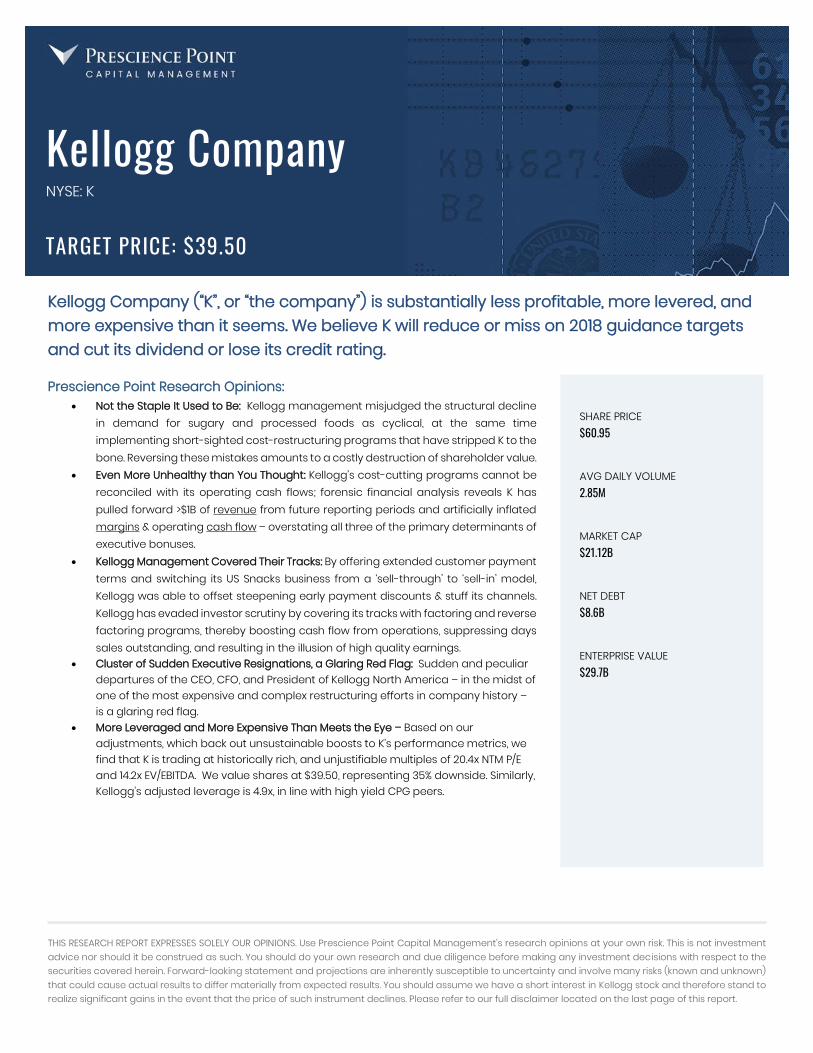
THIS RESEARCH REPORT EXPRESSES SOLELY OUR OPINIONS. Use Prescience Point Capital Management’s research opinions at your own risk. This is not investment advice nor should it be construed as such. You should do your own research and due diligence before making any investment decisions with respect to the securities covered herein. Forward-looking statement and projections are inherently susceptible to uncertainty and involve many risks (known and unknown) that could cause actual results to differ materially from expected results. You should assume we have a short interest in Kellogg stock and therefore stand to realize significant gains in the event that the price of such instrument declines. Please refer to our full disclaimer located on the last page of this report. test \ Kellogg Company (“K”, or “the company”) is substantially less profitable, more levered, and more expensive than it seems. We believe K will reduce or miss on 2018 guidance targets and cut its dividend or lose its credit rating. Prescience Point Research Opinions: • Not the Staple It Used to Be: Kellogg management misjudged the structural decline in demand for sugary and processed foods as cyclical, at the same time implementing short-sighted cost-restructuring programs that have stripped K to the bone. Reversing these mistakes amounts to a costly destruction of shareholder value. • Even More Unhealthy than You Thought: Kellogg’s cost-cutting programs cannot be reconciled with its operating cash flows; forensic financial analysis reveals K has pulled forward >$1B of revenue from future reporting periods and artificially inflated margins & operating cash flow – overstating all three of the primary determinants of executive bonuses. • Kellogg Management Covered Their Tracks: By offering extended customer payment terms and switching its US Snacks business from a ‘sell-through’ to ‘sell-in’ model, Kellogg was able to offset steepening early payment discounts & stuff its channels. Kellogg has evaded investor scrutiny by covering its tracks with factoring and reverse factoring programs, thereby boosting cash flow from operations, suppressing days sales outstanding, and resulting in the illusion of high quality earnings. • Cluster of Sudden Executive Resignations, a Glaring Red Flag: Sudden and peculiar departures of the CEO, CFO, and President of Kellogg North America – in the midst of one of the most expensive and complex restructuring efforts in company history – is a glaring red flag. • More Leveraged and More Expensive Than Meets the Eye – Based on our adjustments, which back out unsustainable boosts to K’s performance metrics, we find that K is trading at historically rich, and unjustifiable multiples of 20.4x NTM P/E and 14.2x EV/EBITDA. We value shares at $39.50, representing 35% downside. Similarly, Kellogg’s adjusted leverage is 4.9x, in line with high yield CPG peers. Kellogg Company NYSE: K SHARE PRICE $60.95 AVG DAILY VOLUME 2.85M MARKET CAP $21.12B NET DEBT $8.6B ENTERPRISE VALUE $29.7B TARGET PRICE: $39.50
Transcript of Kellogg Company€¦ · presciencepoint.com @presciencepoint Kellogg Company (NYSE: K) 3...
THIS RESEARCH REPORT EXPRESSES SOLELY OUR OPINIONS. Use Prescience Point Capital Management’s research opinions at your own risk. This is not investment advice nor should it be construed as such. You should do your own research and due diligence before making any investment decisions with respect to the securities covered herein. Forward-looking statement and projections are inherently susceptible to uncertainty and involve many risks (known and unknown) that could cause actual results to differ materially from expected results. You should assume we have a short interest in Kellogg stock and therefore stand to realize significant gains in the event that the price of such instrument declines. Please refer to our full disclaimer located on the last page of this report.
test \
Kellogg Company (“K”, or “the company”) is substantially less profitable, more levered, and more expensive than it seems. We believe K will reduce or miss on 2018 guidance targets and cut its dividend or lose its credit rating.
Prescience Point Research Opinions: • Not the Staple It Used to Be: Kellogg management misjudged the structural decline
in demand for sugary and processed foods as cyclical, at the same time implementing short-sighted cost-restructuring programs that have stripped K to the bone. Reversing these mistakes amounts to a costly destruction of shareholder value.
• Even More Unhealthy than You Thought: Kellogg’s cost-cutting programs cannot be reconciled with its operating cash flows; forensic financial analysis reveals K has pulled forward >$1B of revenue from future reporting periods and artificially inflated margins & operating cash flow – overstating all three of the primary determinants of executive bonuses.
• Kellogg Management Covered Their Tracks: By offering extended customer payment terms and switching its US Snacks business from a ‘sell-through’ to ‘sell-in’ model, Kellogg was able to offset steepening early payment discounts & stuff its channels. Kellogg has evaded investor scrutiny by covering its tracks with factoring and reverse factoring programs, thereby boosting cash flow from operations, suppressing days sales outstanding, and resulting in the illusion of high quality earnings.
• Cluster of Sudden Executive Resignations, a Glaring Red Flag: Sudden and peculiar departures of the CEO, CFO, and President of Kellogg North America – in the midst of one of the most expensive and complex restructuring efforts in company history – is a glaring red flag.
• More Leveraged and More Expensive Than Meets the Eye – Based on our adjustments, which back out unsustainable boosts to K’s performance metrics, we find that K is trading at historically rich, and unjustifiable multiples of 20.4x NTM P/E and 14.2x EV/EBITDA. We value shares at $39.50, representing 35% downside. Similarly, Kellogg’s adjusted leverage is 4.9x, in line with high yield CPG peers.
Kellogg Company NYSE: K
SHARE PRICE $60.95
AVG DAILY VOLUME 2.85M
MARKET CAP $21.12B
NET DEBT $8.6B
ENTERPRISE VALUE $29.7B
TARGET PRICE: $39.50
presciencepoint.com @presciencepoint
Kellogg Company (NYSE: K) 2
TABLE OF CONTENTS
Introduction: A Severely Malnourished Company 3
K Pulled Forward Revenue & Is More Levered, Less Profitable, With Weaker Cash Conversion Than It Appears 4
Change From “Sell-Through” to “Sell-in” Model Creates One-Time Revenue Benefit 16
Nielsen Data Suggests End Market Demand is Substantially Weaker than “Sell-In” and/or Channel is Stuffed 17
One off Pension Benefit Boosted Comparable Operating Income by 14% 21
A Case of Recurring, ‘Non-Recurring’: Restructuring Charges Persist for 5 Years 22
If restructuring charges are recurring they should not be excluded from comparable operating income 22
MGMT Running Kellogg For Short-Term Incentive Bonuses, Not Long-Term Success? 23
Departure of CEO, CFO, & President of Kellogg North America Raise Red Flags 25
Will K follow a similar path as GIS? 26
Limited Capital Structure Flexibility Suggests K May Have to Choose Between Credit Downgrade or Dividend Cut 28
Valuation 32
Conclusion 35
Appendix 36
Receivable factoring agreement background 36
Background on DSD vs. Warehouse Model 37
Background on Changes in Pension Accounting Standards 37
presciencepoint.com @presciencepoint
Kellogg Company (NYSE: K) 3
Introduction: A Severely Malnourished Company
We are short shares of Kellogg Company, the maker of Froot Loops, Pringles, Rice Krispies and other snacks and cereals. We believe the company is engaged in an unsustainable accounting charade to mask revenue and profit shortfalls and will be forced to choose between cutting its dividend and losing its credit rating; shares could fall 35%. Kellogg’s stated purpose is “to nourish families so they can flourish and thrive.” Unfortunately, when it comes to its business, the company has ignored its own mantra. Sales of Kellogg’s breakfast cereals and snacks have been falling for years as consumers move to healthier, less-processed alternatives. Instead of innovating and developing new products, it watched from the sidelines as competitors gained market share. To mask its deteriorating performance, Kellogg has instituted massive cost cuts and used accounting gimmicks and financial engineering to boost short-term sales and cash-flow numbers. These artificial performance enhancers have triggered tens of millions of dollars in bonuses for Kellogg’s executives while employees were systematically laid off. After doubling his compensation to $13 million in 2017, Kellogg’s then-CEO, John Bryant, abruptly retired at the ripe old age of 52. We believe the chickens are about to come home to roost, and newly-installed CEO Steve Cahillane will need to lower expectations, cut the dividend or find a miracle new product in order to avoid being downgraded to junk. He has referred to 2018 as a “transition year,” which should give pause to any investor expecting positive results. Our analysis is based on a months-long deep dive into Kellogg’s business, which included forensic analysis of the company’s accounting and financial statements for the past decade, interviews with former employees and industry experts, and an examination of management’s own words on conference calls and in other public venues. We even spoke to the company directly, asking pointed questions of its Investor Relations department about some of the financial engineering and accounting changes we observed. IR admitted to us that many of the moves were “optical” in order to preserve the appearance of positive. At its core, the Kellogg story is one we’ve seen many times before in corporate America. An old and venerable brand fails to invest for the long-term in the face of material challenges to its core product line – namely sugary cereals and carb-heavy snacks. Kids and adults just don’t eat as much cereal for breakfast anymore despite Kellogg’s efforts to entice them with new products like Donut Shop Pink cereal and Pop Tarts Strawberry Milkshake. But Kellogg chose to cut costs rather than invest. “For more than 100 years we’ve been working to serve the world a better breakfast,” Kellogg says on its website. Truth is, they are serving the same thing while their customers have moved on.
presciencepoint.com @presciencepoint
Kellogg Company (NYSE: K) 4
K Pulled Forward Revenue & Is More Levered, Less Profitable, With Weaker Cash Conversion Than It Appears
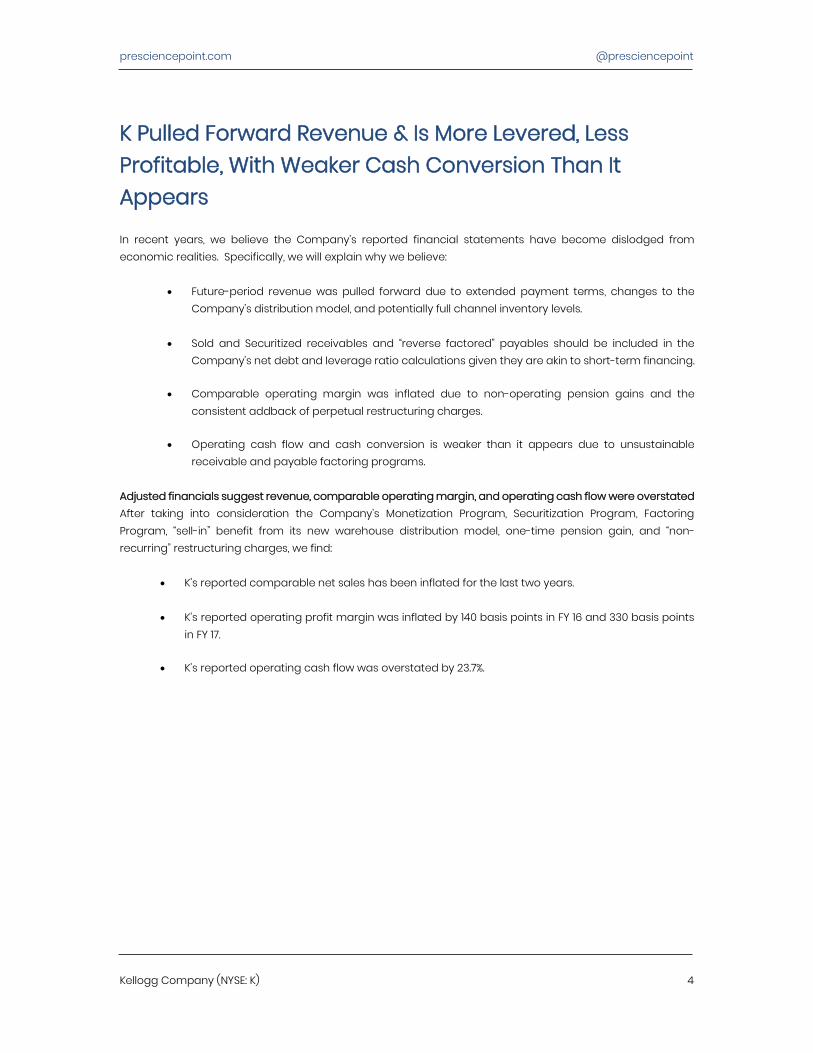
In recent years, we believe the Company’s reported financial statements have become dislodged from economic realities. Specifically, we will explain why we believe:
• Future-period revenue was pulled forward due to extended payment terms, changes to the Company’s distribution model, and potentially full channel inventory levels.
• Sold and Securitized receivables and “reverse factored” payables should be included in the Company’s net debt and leverage ratio calculations given they are akin to short-term financing.
• Comparable operating margin was inflated due to non-operating pension gains and the
consistent addback of perpetual restructuring charges. • Operating cash flow and cash conversion is weaker than it appears due to unsustainable
receivable and payable factoring programs. Adjusted financials suggest revenue, comparable operating margin, and operating cash flow were overstated After taking into consideration the Company’s Monetization Program, Securitization Program, Factoring Program, “sell-in” benefit from its new warehouse distribution model, one-time pension gain, and “non-recurring” restructuring charges, we find:
• K’s reported comparable net sales has been inflated for the last two years.
• K’s reported operating profit margin was inflated by 140 basis points in FY 16 and 330 basis points in FY 17.
• K’s reported operating cash flow was overstated by 23.7%.
presciencepoint.com @presciencepoint
Kellogg Company (NYSE: K) 5
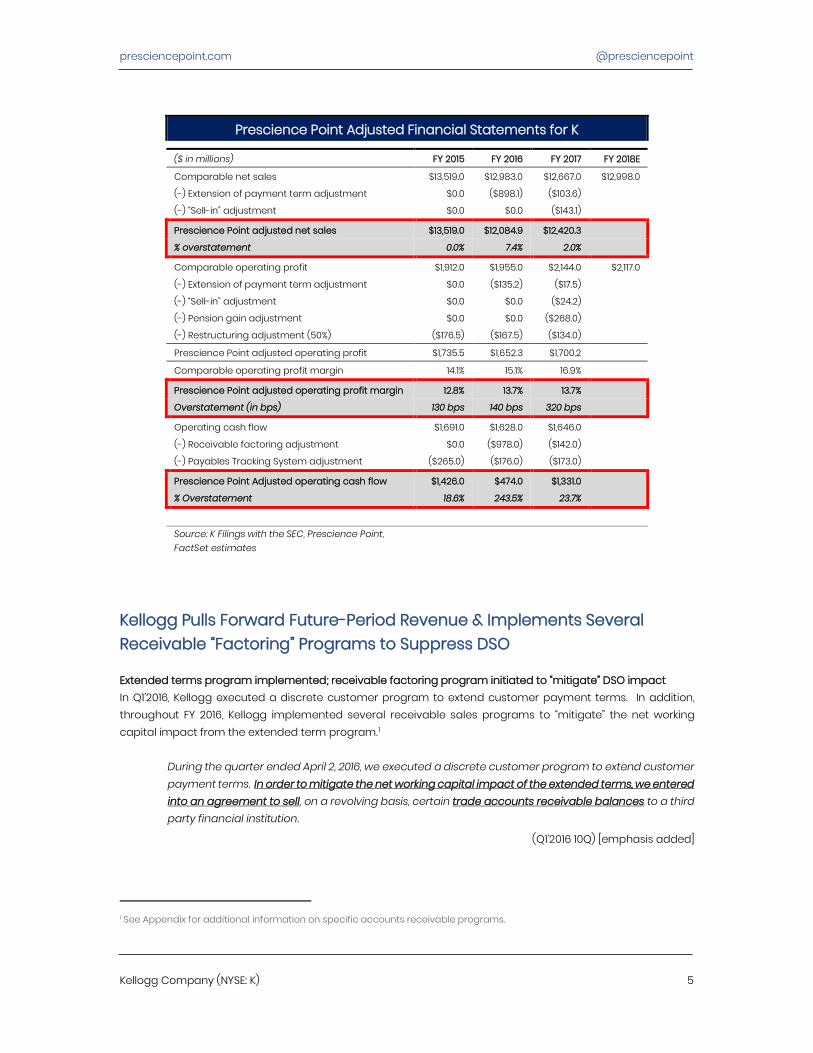
Prescience Point Adjusted Financial Statements for K ($ in millions) FY 2015 FY 2016 FY 2017 FY 2018E
Comparable net sales $13,519.0 $12,983.0 $12,667.0 $12,998.0
(-) Extension of payment term adjustment $0.0 ($898.1) ($103.6)
(-) “Sell-in” adjustment $0.0 $0.0 ($143.1)
Prescience Point adjusted net sales $13,519.0 $12,084.9 $12,420.3
% overstatement 0.0% 7.4% 2.0%
Comparable operating profit $1,912.0 $1,955.0 $2,144.0 $2,117.0
(-) Extension of payment term adjustment $0.0 ($135.2) ($17.5)
(-) “Sell-in” adjustment $0.0 $0.0 ($24.2)
(-) Pension gain adjustment $0.0 $0.0 ($268.0)
(-) Restructuring adjustment (50%) ($176.5) ($167.5) ($134.0)
Prescience Point adjusted operating profit $1,735.5 $1,652.3 $1,700.2
Comparable operating profit margin 14.1% 15.1% 16.9%
Prescience Point adjusted operating profit margin 12.8% 13.7% 13.7%
Overstatement (in bps) 130 bps 140 bps 320 bps
Operating cash flow $1,691.0 $1,628.0 $1,646.0
(-) Receivable factoring adjustment $0.0 ($978.0) ($142.0)
(-) Payables Tracking System adjustment ($265.0) ($176.0) ($173.0)
Prescience Point Adjusted operating cash flow $1,426.0 $474.0 $1,331.0
% Overstatement 18.6% 243.5% 23.7%
Source: K Filings with the SEC, Prescience Point, FactSet estimates
Kellogg Pulls Forward Future-Period Revenue & Implements Several Receivable “Factoring” Programs to Suppress DSO
Extended terms program implemented; receivable factoring program initiated to “mitigate” DSO impact In Q1’2016, Kellogg executed a discrete customer program to extend customer payment terms. In addition, throughout FY 2016, Kellogg implemented several receivable sales programs to “mitigate” the net working capital impact from the extended term program.0F
1
During the quarter ended April 2, 2016, we executed a discrete customer program to extend customer payment terms. In order to mitigate the net working capital impact of the extended terms, we entered into an agreement to sell, on a revolving basis, certain trade accounts receivable balances to a third party financial institution.
(Q1’2016 10Q) [emphasis added]
1 See Appendix for additional information on specific accounts receivable programs.
presciencepoint.com @presciencepoint
Kellogg Company (NYSE: K) 6
Extended terms program may have been implemented in response to large customers pushing aggressive terms on to Kellogg Based on conversations with several individuals in the consumer packaged goods industry and analyst community, we believe Kellogg’s extended payment terms program may have been implemented to offset the income statement impact from aggressive terms from some of Kellogg’s largest customers (e.g. Walmart). For example, a large customer tells Kellogg it can pay sooner but wants a large discount for doing so or it’s going to extend payments beyond its ordinary terms. As a result, Kellogg then uses the same strategy on its own vendors. In effect, Kellogg is able to conserve its income statement (i.e. not take a hit from accepting large discounts) at the expense of its working capital levels (i.e. accepting the extended payment terms from is own customers). Alternatively, Kellogg could have also instituted the program to generate and/or incentivize additional purchases from customers. Extended terms can provide a transitory benefit to revenue growth Extending payment terms to customers allows a company to:
• Pull forward future-period revenue, as customers are enticed to purchase more product/inventory
than they otherwise and normally would
• Eliminate early payment/pre-payment discounts Receivable factoring programs allow companies to show stronger operating cash flow and lower DSOs There are two primary benefits of a receivable factoring program:
• Cash management – Collecting receivables earlier than normal (i.e. boosting reported operating cash flow)
• Financial statement optics – Showing lower reported days sales outstanding (DSOs), as sold receivables are removed from the balance sheet
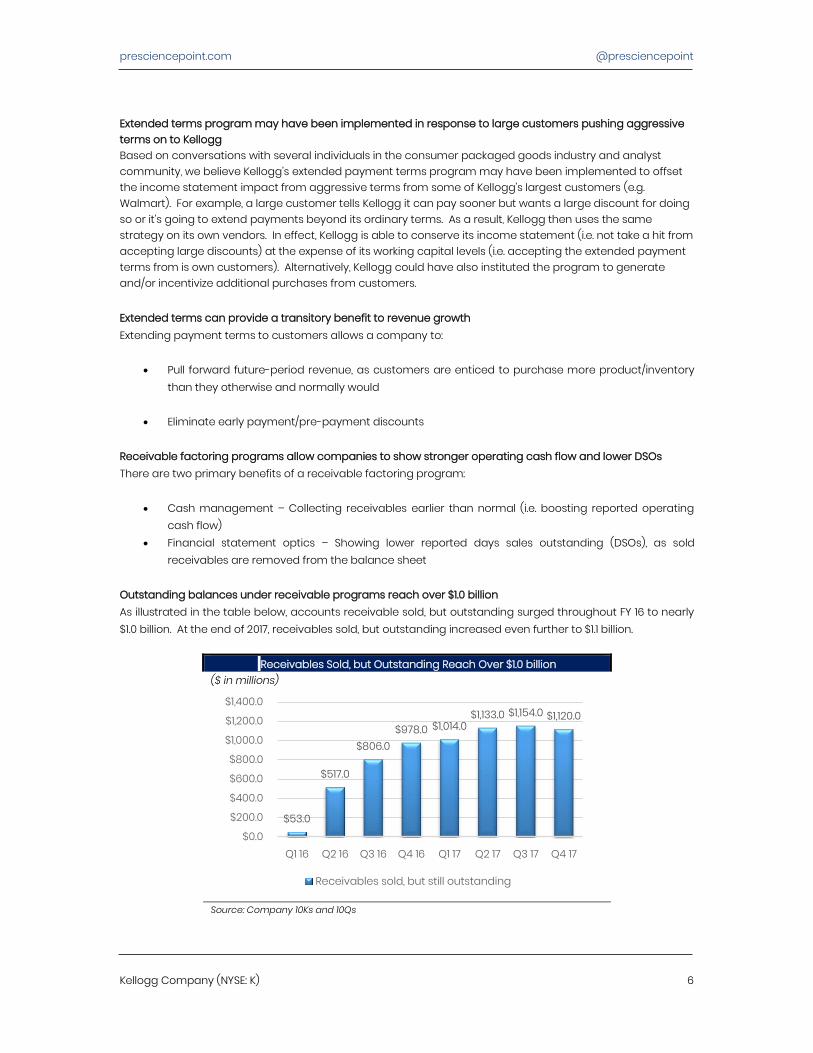
Outstanding balances under receivable programs reach over $1.0 billion As illustrated in the table below, accounts receivable sold, but outstanding surged throughout FY 16 to nearly $1.0 billion. At the end of 2017, receivables sold, but outstanding increased even further to $1.1 billion.
Receivables Sold, but Outstanding Reach Over $1.0 billion ($ in millions)
Source: Company 10Ks and 10Qs
$53.0
$517.0
$806.0 $978.0 $1,014.0
$1,133.0 $1,154.0 $1,120.0
$0.0
$200.0
$400.0
$600.0
$800.0
$1,000.0
$1,200.0
$1,400.0
Q1 16 Q2 16 Q3 16 Q4 16 Q1 17 Q2 17 Q3 17 Q4 17
Receivables sold, but still outstanding
presciencepoint.com @presciencepoint
Kellogg Company (NYSE: K) 7
We believe securitizations should be treated as short-term financing According to credit ratings agency Fitch, receivable factoring can be viewed as an alternative to secured debt. Fitch’s Corporate Rating Criteria publication on 03/23/18 says::
“Fitch views factoring essentially as an alternative to secured debt, whatever the level of recourse to the originator…Fitch will reverse the accounting treatment and adjust financial statements… Assets: the relevant section of the balance sheet is increased by the outstanding amount of factored assets at the closing date. Liabilities: the section “other debt secured” is increased by the same amount.
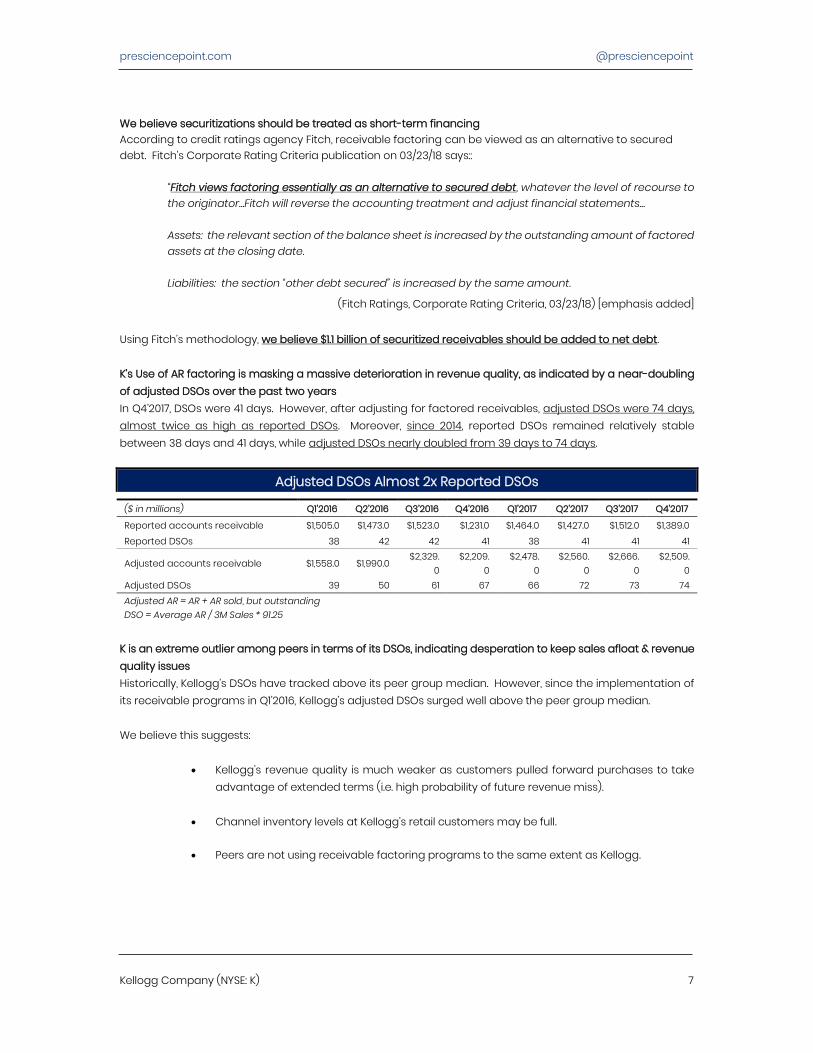
(Fitch Ratings, Corporate Rating Criteria, 03/23/18) [emphasis added] Using Fitch’s methodology, we believe $1.1 billion of securitized receivables should be added to net debt. K’s Use of AR factoring is masking a massive deterioration in revenue quality, as indicated by a near-doubling of adjusted DSOs over the past two years In Q4’2017, DSOs were 41 days. However, after adjusting for factored receivables, adjusted DSOs were 74 days, almost twice as high as reported DSOs. Moreover, since 2014, reported DSOs remained relatively stable between 38 days and 41 days, while adjusted DSOs nearly doubled from 39 days to 74 days.
Adjusted DSOs Almost 2x Reported DSOs ($ in millions) Q1’2016 Q2’2016 Q3’2016 Q4’2016 Q1’2017 Q2’2017 Q3’2017 Q4’2017
Reported accounts receivable $1,505.0 $1,473.0 $1,523.0 $1,231.0 $1,464.0 $1,427.0 $1,512.0 $1,389.0 Reported DSOs 38 42 42 41 38 41 41 41
Adjusted accounts receivable $1,558.0 $1,990.0 $2,329.
0 $2,209.
0 $2,478.
0 $2,560.
0 $2,666.
0 $2,509.
0 Adjusted DSOs 39 50 61 67 66 72 73 74 Adjusted AR = AR + AR sold, but outstanding DSO = Average AR / 3M Sales * 91.25
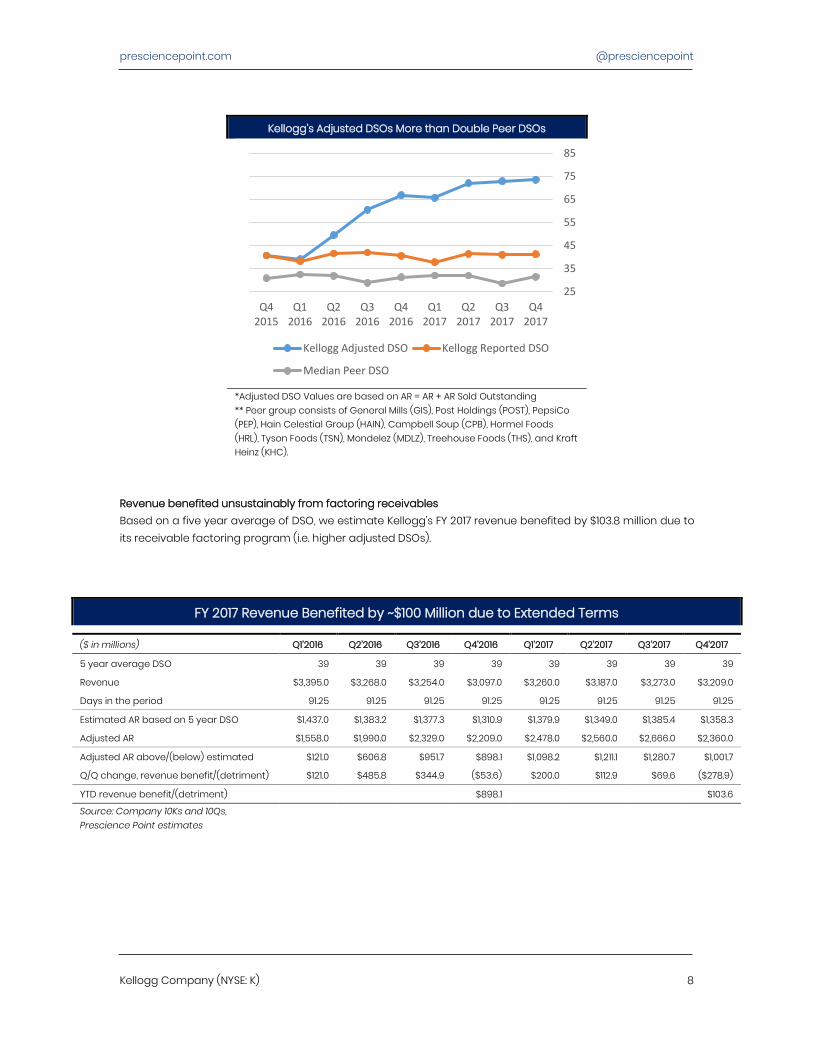
K is an extreme outlier among peers in terms of its DSOs, indicating desperation to keep sales afloat & revenue quality issues Historically, Kellogg’s DSOs have tracked above its peer group median. However, since the implementation of its receivable programs in Q1’2016, Kellogg’s adjusted DSOs surged well above the peer group median. We believe this suggests:
• Kellogg’s revenue quality is much weaker as customers pulled forward purchases to take advantage of extended terms (i.e. high probability of future revenue miss).
• Channel inventory levels at Kellogg’s retail customers may be full.
• Peers are not using receivable factoring programs to the same extent as Kellogg.
presciencepoint.com @presciencepoint
Kellogg Company (NYSE: K) 8
Kellogg’s Adjusted DSOs More than Double Peer DSOs
*Adjusted DSO Values are based on AR = AR + AR Sold Outstanding ** Peer group consists of General Mills (GIS), Post Holdings (POST), PepsiCo (PEP), Hain Celestial Group (HAIN), Campbell Soup (CPB), Hormel Foods (HRL), Tyson Foods (TSN), Mondelez (MDLZ), Treehouse Foods (THS), and Kraft Heinz (KHC).
Revenue benefited unsustainably from factoring receivables Based on a five year average of DSO, we estimate Kellogg’s FY 2017 revenue benefited by $103.8 million due to its receivable factoring program (i.e. higher adjusted DSOs).
FY 2017 Revenue Benefited by ~$100 Million due to Extended Terms ($ in millions) Q1’2016 Q2’2016 Q3’2016 Q4’2016 Q1’2017 Q2’2017 Q3’2017 Q4’2017
5 year average DSO 39 39 39 39 39 39 39 39
Revenue $3,395.0 $3,268.0 $3,254.0 $3,097.0 $3,260.0 $3,187.0 $3,273.0 $3,209.0
Days in the period 91.25 91.25 91.25 91.25 91.25 91.25 91.25 91.25
Estimated AR based on 5 year DSO $1,437.0 $1,383.2 $1,377.3 $1,310.9 $1,379.9 $1,349.0 $1,385.4 $1,358.3
Adjusted AR $1,558.0 $1,990.0 $2,329.0 $2,209.0 $2,478.0 $2,560.0 $2,666.0 $2,360.0
Adjusted AR above/(below) estimated $121.0 $606.8 $951.7 $898.1 $1,098.2 $1,211.1 $1,280.7 $1,001.7
Q/Q change, revenue benefit/(detriment) $121.0 $485.8 $344.9 ($53.6) $200.0 $112.9 $69.6 ($278.9)
YTD revenue benefit/(detriment) $898.1 $103.6
Source: Company 10Ks and 10Qs, Prescience Point estimates
25
35
45
55
65
75
85
Q42017
Q32017
Q22017
Q12017
Q42016
Q32016
Q22016
Q12016
Q42015
Kellogg Adjusted DSO Kellogg Reported DSO
Median Peer DSO
presciencepoint.com @presciencepoint
Kellogg Company (NYSE: K) 9
Extended terms programs entice customers to purchase more inventory than they ordinarily would Based on an interview with the Director of Strategic Merchandising and Pricing at a major Kellogg retail customer,
• The customer took advantage of K’s extended payment term offering
• Retailers generally prefer “just-in time” inventory purchases, but if the product has a longer shelf life (e.g. dry cereal, etc.), it will purchase more than it ordinarily would to take advantage of favorable terms
• With terms program, customer was able to purchase product and “turn-it” before it had to pay
invoice
“The extended terms program, we have absolutely taken advantage of that. One of the things that we prefer to do is to buy product and to turn it before we actually have to pay our invoices…there’s really no benefit for us to buy quantities of product that we can’t turn within a certain period of time. However, if there’s an – if – first of all, if we’ve got product that has a longer shelf-life, and dry cereal, packaged cereal, has a longer shelf-life, we have the option of taking advantage of special incentives to purchase more than what we would normally turn, knowing that we can push that product through the supply chain without having to pay anything on the product, at least until we have – until that product is actually sold through.”
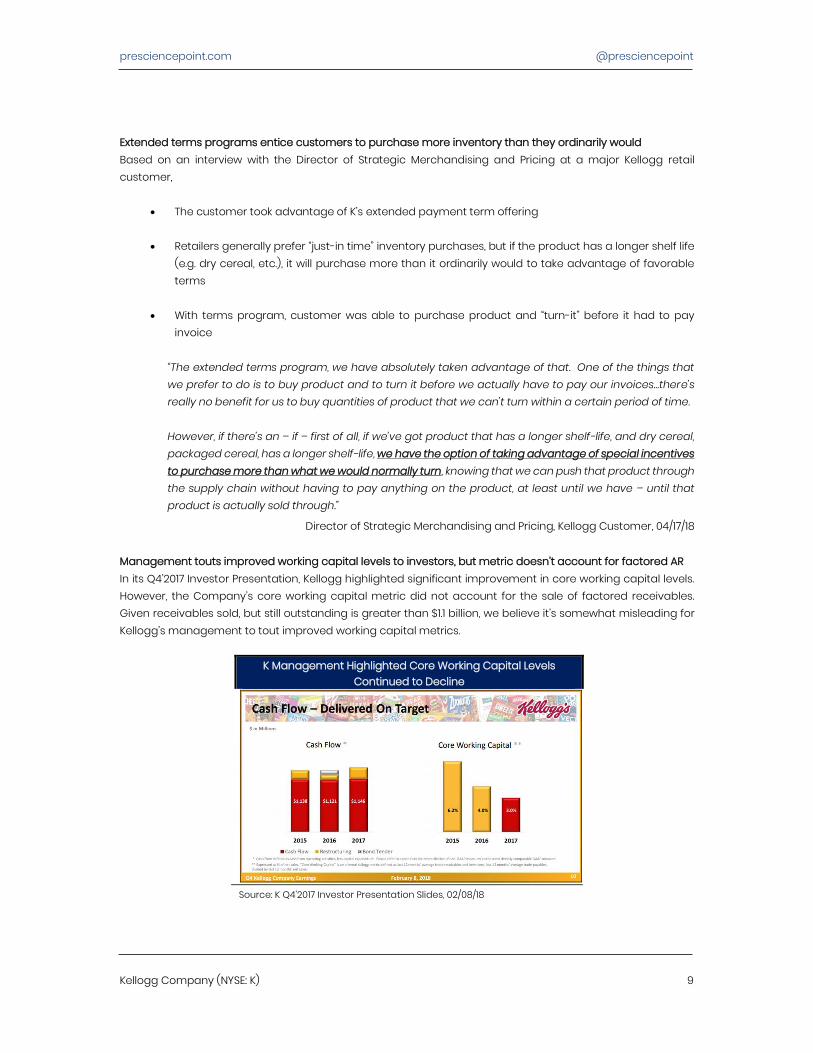
Director of Strategic Merchandising and Pricing, Kellogg Customer, 04/17/18 Management touts improved working capital levels to investors, but metric doesn’t account for factored AR In its Q4’2017 Investor Presentation, Kellogg highlighted significant improvement in core working capital levels. However, the Company’s core working capital metric did not account for the sale of factored receivables. Given receivables sold, but still outstanding is greater than $1.1 billion, we believe it’s somewhat misleading for Kellogg’s management to tout improved working capital metrics.
K Management Highlighted Core Working Capital Levels Continued to Decline
Source: K Q4’2017 Investor Presentation Slides, 02/08/18
presciencepoint.com @presciencepoint
Kellogg Company (NYSE: K) 10
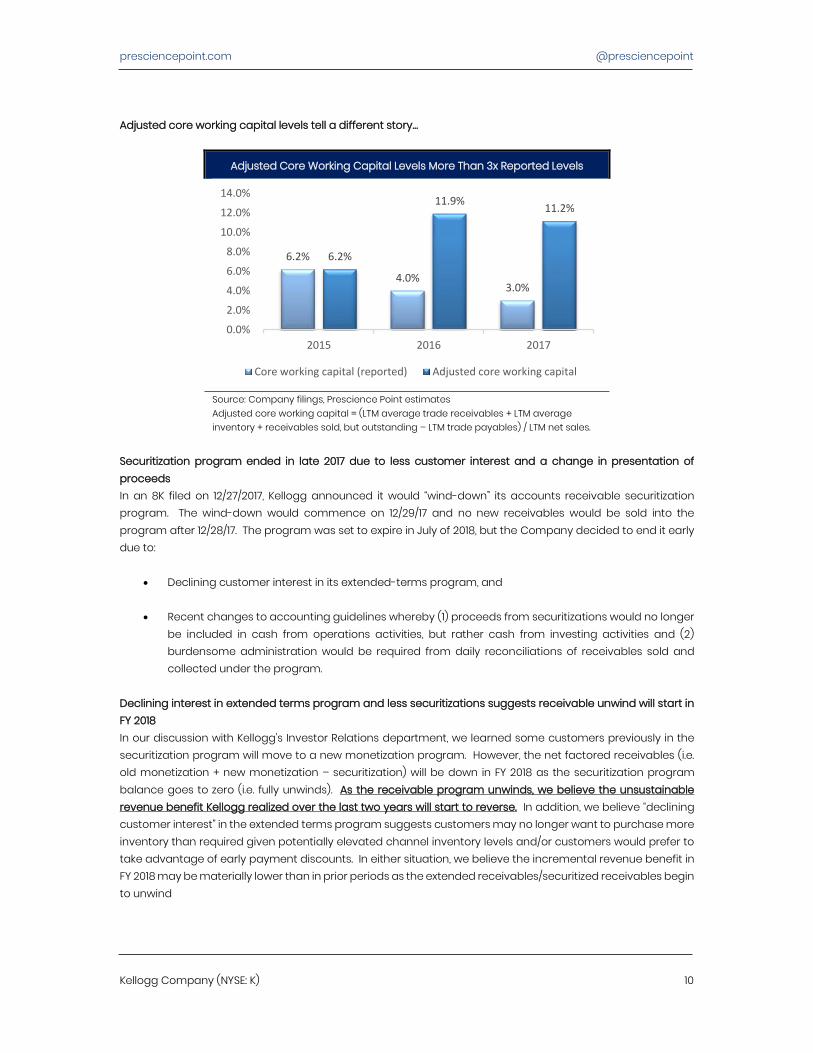
Adjusted core working capital levels tell a different story…
Adjusted Core Working Capital Levels More Than 3x Reported Levels
Source: Company filings, Prescience Point estimates Adjusted core working capital = (LTM average trade receivables + LTM average inventory + receivables sold, but outstanding – LTM trade payables) / LTM net sales.
Securitization program ended in late 2017 due to less customer interest and a change in presentation of proceeds In an 8K filed on 12/27/2017, Kellogg announced it would “wind-down” its accounts receivable securitization program. The wind-down would commence on 12/29/17 and no new receivables would be sold into the program after 12/28/17. The program was set to expire in July of 2018, but the Company decided to end it early due to:
• Declining customer interest in its extended-terms program, and
• Recent changes to accounting guidelines whereby (1) proceeds from securitizations would no longer be included in cash from operations activities, but rather cash from investing activities and (2) burdensome administration would be required from daily reconciliations of receivables sold and collected under the program.
Declining interest in extended terms program and less securitizations suggests receivable unwind will start in FY 2018 In our discussion with Kellogg’s Investor Relations department, we learned some customers previously in the securitization program will move to a new monetization program. However, the net factored receivables (i.e. old monetization + new monetization – securitization) will be down in FY 2018 as the securitization program balance goes to zero (i.e. fully unwinds). As the receivable program unwinds, we believe the unsustainable revenue benefit Kellogg realized over the last two years will start to reverse. In addition, we believe “declining customer interest” in the extended terms program suggests customers may no longer want to purchase more inventory than required given potentially elevated channel inventory levels and/or customers would prefer to take advantage of early payment discounts. In either situation, we believe the incremental revenue benefit in FY 2018 may be materially lower than in prior periods as the extended receivables/securitized receivables begin to unwind
6.2%
4.0% 3.0%
6.2%
11.9% 11.2%
0.0%
2.0%
4.0%
6.0%
8.0%
10.0%
12.0%
14.0%
2015 2016 2017
Core working capital (reported) Adjusted core working capital
presciencepoint.com @presciencepoint
Kellogg Company (NYSE: K) 11
Technically speaking, it will be a separate monetization program. But yes, I mean what you'll see is the securitization program balance goes to zero and then the existing monetization program plus the new one, you know, together will go up by all the customers that are shifting over from the securitization. Net, I think it will be down to be honest with you because enough customers have gotten off the extended terms program.
Kellogg, Investor Relations, 04/11/18 IR Contact reveals receivable programs helped Kellogg manage toward incentive plan Cash Flow metric In a discussion with Kellogg’s Investor Relations department, we learned one of the reasons the Company decided to securitize receivables was that the proceeds were included in cash from operating activities and helped the Company “manage” its Cash Flow bonus metric. 1F
2 In other words, Kellogg could extend terms to eliminate early payment discounts and boost sales, securitize the receivables to eliminate the negative impact on reported DSOs, and present securitization proceeds in cash from operating activities to preserve operating cash “optics.” But, now that securitization proceeds need to be reported as investing activities (i.e. no benefit to cash flow from operating activities), the Company eliminated the program.
Under the accounting changes, we would no longer be able to net the securitization proceeds, out of the accounts receivable to keep up at the same DSO and the same cash flow operations. Instead any proceeds from a securitization would now fall under cash for investing activities and therefore obviating the whole reason why we did it which was to keep our cash flow neutral. We have a metric Cash Flow that we publish, that we have bonus metrics tied to and when we did the extended terms programs, what we didn't want to happen was to have our Cash Flow disappear even though it might be optical, that's what investors look at, Cash Flow, which is our definition cash from operating activities minus capital expenditure. So if this securitization no longer helps offset the extended terms program receivables, then suddenly you're going to have a Cash Flow that just disappears, it's going to look at least optically like we have negative cash flow. So that's what I mean by it. I mean it's optical, but it's viewed.
K Investor Relations, 04/11/18) [emphasis added
“Reverse Factoring” Allowed Company to Delay Payments & Artificially Boost Cash Flow
Company entered into “reverse factoring” arrangement in the beginning of 2014 In 2014, the Company entered into an “accounts payable tracking system” arrangement (i.e. “reverse factoring” agreement), which allowed suppliers to sell payment obligations from the Company to designated third-party financial institutions. Effectively, this allowed Kellogg to delay payments to its suppliers. Moreover, Kellogg’s payment obligations to suppliers that utilized the program were now due to a third-party financial institution (i.e. bank), instead of the supplier.
Beginning in 2014, the Company has an agreement with a third party to provide an accounts payable tracking system which facilitates participating suppliers’ ability to monitor and, if elected, sell to
2 Annual Incentive Plan (“AIP”) Cash Flow metric defined as operating cash flow less capital expenditures.
presciencepoint.com @presciencepoint
Kellogg Company (NYSE: K) 12
designated third-party financial institutions, payment obligations of the Company. Participating suppliers may, at their sole discretion, make offers to sell one or more payment obligations of the Company prior to their scheduled due dates at a discounted price to participating financial institutions. The Company’s goal in entering into this agreement is to capture overall supplier savings, in the form of pricing, payment terms or vendor funding, created by facilitating suppliers’ ability to sell receivables, while providing them with greater working capital flexibility. We have no economic interest in the sale of these suppliers’ receivables and no direct financial relationship with the financial institutions concerning these services. The Company’s obligations to its suppliers, including amounts due and scheduled payment dates, are not impacted by suppliers’ decisions to sell amounts under this arrangement.
Kellogg Q1’2014 10Q What is the accounting impact of a “reverse factoring” program & how does it benefit Kellogg? A “reverse factoring” program allows a company to:
• Extend days payables outstanding (i.e. take longer to pay off current payable obligations).
• Hold onto cash longer (i.e. report stronger operating cash flow) and/or use less debt to finance working capital, share buybacks, etc.
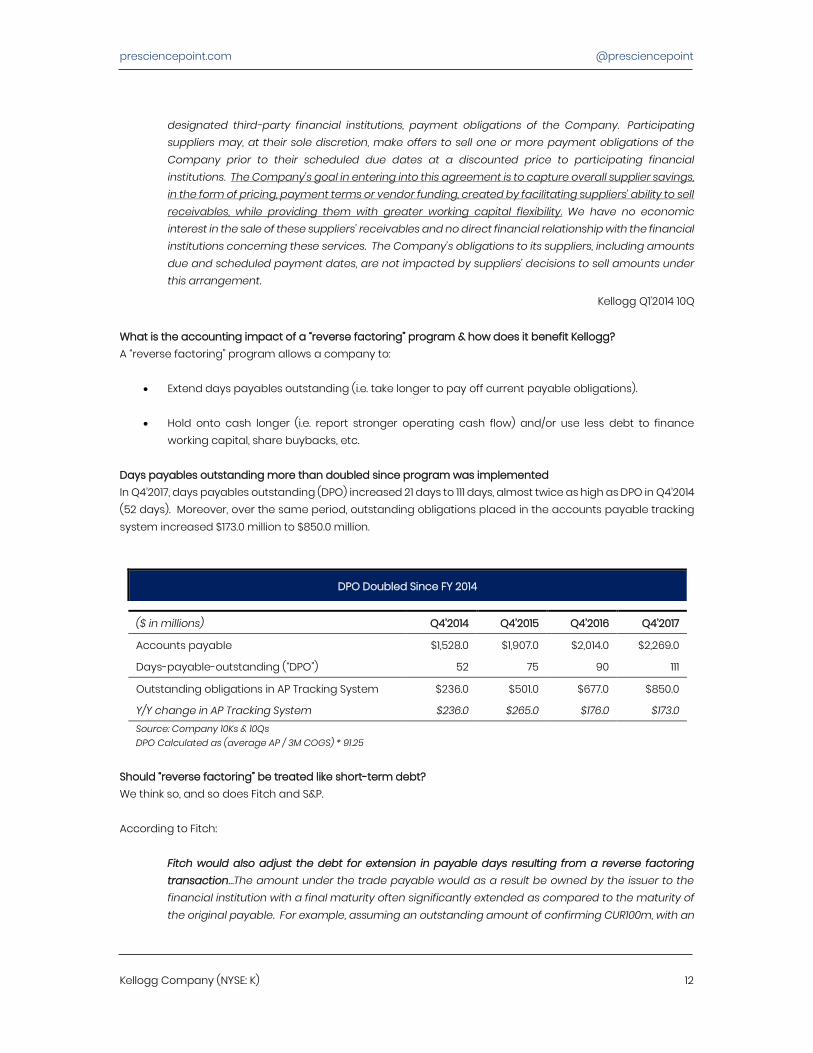
Days payables outstanding more than doubled since program was implemented In Q4’2017, days payables outstanding (DPO) increased 21 days to 111 days, almost twice as high as DPO in Q4’2014 (52 days). Moreover, over the same period, outstanding obligations placed in the accounts payable tracking system increased $173.0 million to $850.0 million.
DPO Doubled Since FY 2014
($ in millions) Q4’2014 Q4’2015 Q4’2016 Q4’2017
Accounts payable $1,528.0 $1,907.0 $2,014.0 $2,269.0
Days-payable-outstanding (“DPO”) 52 75 90 111
Outstanding obligations in AP Tracking System $236.0 $501.0 $677.0 $850.0
Y/Y change in AP Tracking System $236.0 $265.0 $176.0 $173.0 Source: Company 10Ks & 10Qs DPO Calculated as (average AP / 3M COGS) * 91.25
Should “reverse factoring” be treated like short-term debt? We think so, and so does Fitch and S&P. According to Fitch:
Fitch would also adjust the debt for extension in payable days resulting from a reverse factoring transaction…The amount under the trade payable would as a result be owned by the issuer to the financial institution with a final maturity often significantly extended as compared to the maturity of the original payable. For example, assuming an outstanding amount of confirming CUR100m, with an
presciencepoint.com @presciencepoint
Kellogg Company (NYSE: K) 13
extension of payable days from 60 days to 180 days. Fitch would consider that the 120 day extension is akin to financial debt and would add to financial debt 120/180 of the outstanding amount.
Fitch Ratings, Corporate Rating Criteria, 03/23/18 S&P applies similar treatment:
If we believe that an issuer’s trade payable days are well beyond the range of what would be deemed normal trade terms for the industry, and the improvement to cash flow/leverage measures that results from the stretch in trade payables is deemed material, then we’d make an adjustment. In the case of reverse factoring…we may make a debt adjustment for customer, if we believe that the trade payable days are well beyond the range of what would be deemed normal trade terms.
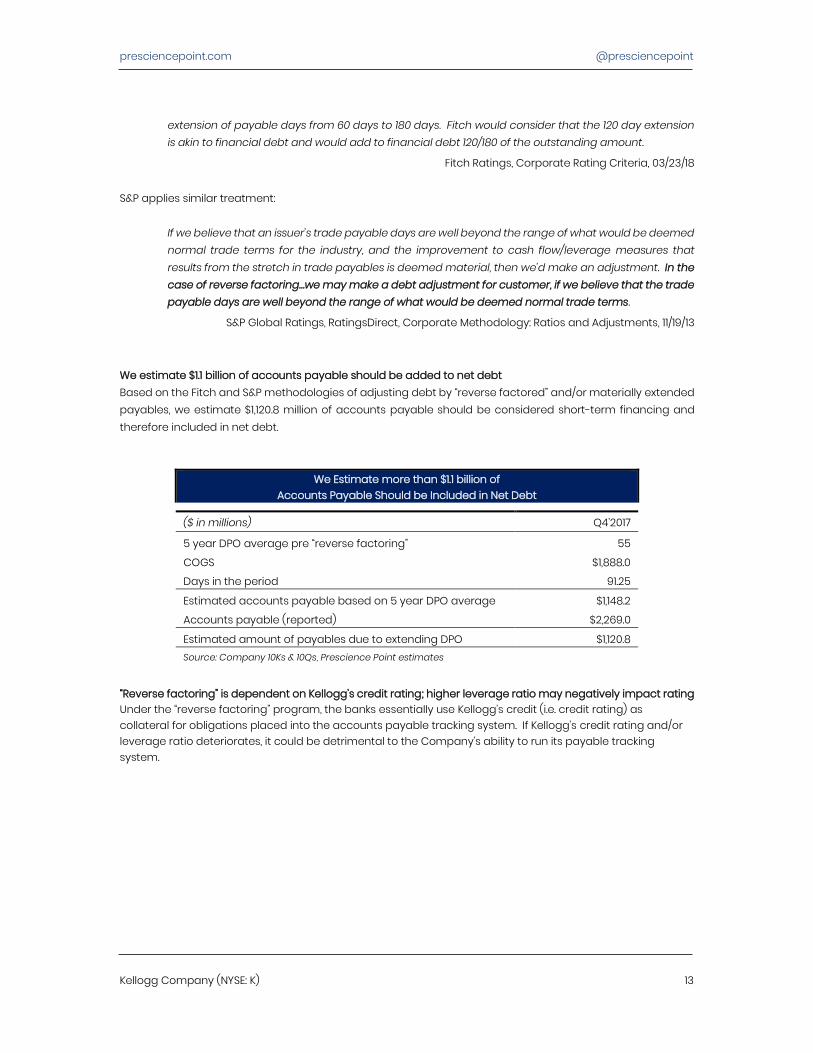
S&P Global Ratings, RatingsDirect, Corporate Methodology: Ratios and Adjustments, 11/19/13 We estimate $1.1 billion of accounts payable should be added to net debt Based on the Fitch and S&P methodologies of adjusting debt by “reverse factored” and/or materially extended payables, we estimate $1,120.8 million of accounts payable should be considered short-term financing and therefore included in net debt.
We Estimate more than $1.1 billion of Accounts Payable Should be Included in Net Debt
($ in millions) Q4’2017
5 year DPO average pre “reverse factoring” 55
COGS $1,888.0
Days in the period 91.25
Estimated accounts payable based on 5 year DPO average $1,148.2
Accounts payable (reported) $2,269.0
Estimated amount of payables due to extending DPO $1,120.8 Source: Company 10Ks & 10Qs, Prescience Point estimates
“Reverse factoring” is dependent on Kellogg’s credit rating; higher leverage ratio may negatively impact rating Under the “reverse factoring” program, the banks essentially use Kellogg’s credit (i.e. credit rating) as collateral for obligations placed into the accounts payable tracking system. If Kellogg’s credit rating and/or leverage ratio deteriorates, it could be detrimental to the Company’s ability to run its payable tracking system.
presciencepoint.com @presciencepoint
Kellogg Company (NYSE: K) 14
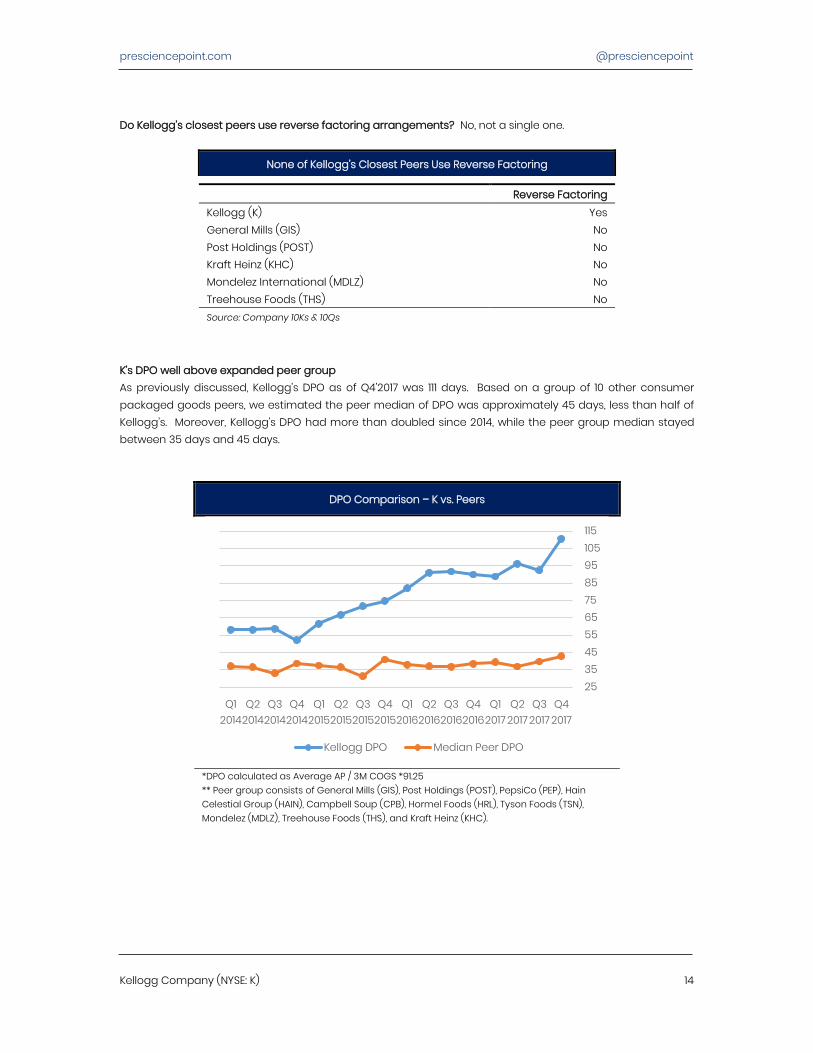
Do Kellogg’s closest peers use reverse factoring arrangements? No, not a single one.
None of Kellogg’s Closest Peers Use Reverse Factoring
Reverse Factoring Kellogg (K) Yes General Mills (GIS) No Post Holdings (POST) No Kraft Heinz (KHC) No Mondelez International (MDLZ) No Treehouse Foods (THS) No Source: Company 10Ks & 10Qs
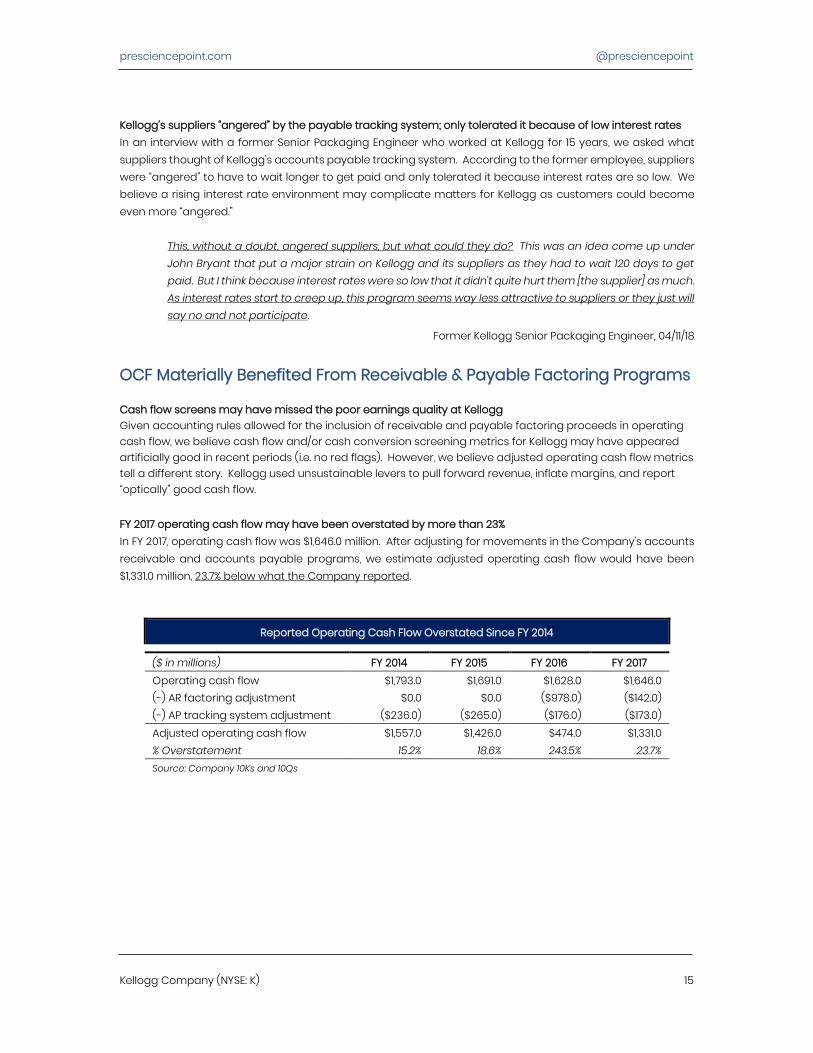
K’s DPO well above expanded peer group As previously discussed, Kellogg’s DPO as of Q4’2017 was 111 days. Based on a group of 10 other consumer packaged goods peers, we estimated the peer median of DPO was approximately 45 days, less than half of Kellogg’s. Moreover, Kellogg’s DPO had more than doubled since 2014, while the peer group median stayed between 35 days and 45 days.
DPO Comparison – K vs. Peers
*DPO calculated as Average AP / 3M COGS *91.25 ** Peer group consists of General Mills (GIS), Post Holdings (POST), PepsiCo (PEP), Hain Celestial Group (HAIN), Campbell Soup (CPB), Hormel Foods (HRL), Tyson Foods (TSN), Mondelez (MDLZ), Treehouse Foods (THS), and Kraft Heinz (KHC).
2535455565758595105115
Q42017
Q32017
Q22017
Q12017
Q42016
Q32016
Q22016
Q12016
Q42015
Q32015
Q22015
Q12015
Q42014
Q32014
Q22014
Q12014
Kellogg DPO Median Peer DPO
presciencepoint.com @presciencepoint
Kellogg Company (NYSE: K) 15
Kellogg’s suppliers “angered” by the payable tracking system; only tolerated it because of low interest rates In an interview with a former Senior Packaging Engineer who worked at Kellogg for 15 years, we asked what suppliers thought of Kellogg’s accounts payable tracking system. According to the former employee, suppliers were “angered” to have to wait longer to get paid and only tolerated it because interest rates are so low. We believe a rising interest rate environment may complicate matters for Kellogg as customers could become even more “angered.”
This, without a doubt, angered suppliers, but what could they do? This was an idea come up under John Bryant that put a major strain on Kellogg and its suppliers as they had to wait 120 days to get paid. But I think because interest rates were so low that it didn’t quite hurt them [the supplier] as much. As interest rates start to creep up, this program seems way less attractive to suppliers or they just will say no and not participate.
Former Kellogg Senior Packaging Engineer, 04/11/18
OCF Materially Benefited From Receivable & Payable Factoring Programs
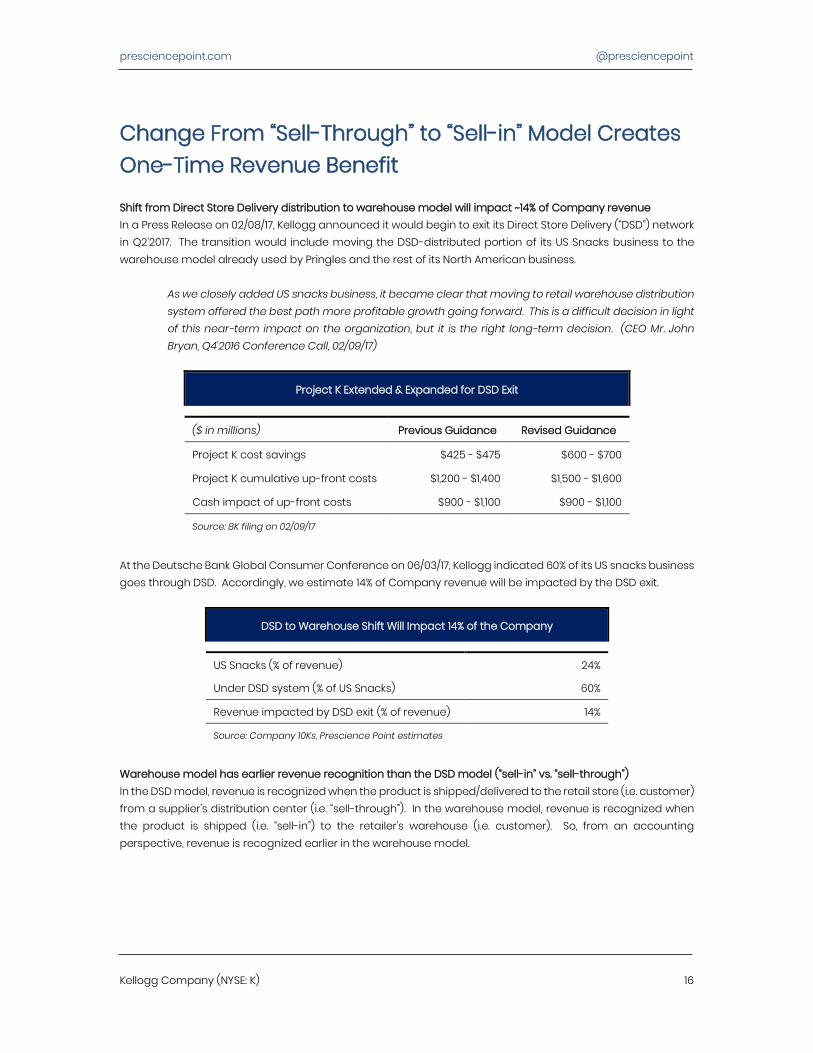
Cash flow screens may have missed the poor earnings quality at Kellogg Given accounting rules allowed for the inclusion of receivable and payable factoring proceeds in operating cash flow, we believe cash flow and/or cash conversion screening metrics for Kellogg may have appeared artificially good in recent periods (i.e. no red flags). However, we believe adjusted operating cash flow metrics tell a different story. Kellogg used unsustainable levers to pull forward revenue, inflate margins, and report “optically” good cash flow. FY 2017 operating cash flow may have been overstated by more than 23% In FY 2017, operating cash flow was $1,646.0 million. After adjusting for movements in the Company’s accounts receivable and accounts payable programs, we estimate adjusted operating cash flow would have been $1,331.0 million, 23.7% below what the Company reported.
Reported Operating Cash Flow Overstated Since FY 2014
($ in millions) FY 2014 FY 2015 FY 2016 FY 2017 Operating cash flow $1,793.0 $1,691.0 $1,628.0 $1,646.0 (-) AR factoring adjustment $0.0 $0.0 ($978.0) ($142.0) (-) AP tracking system adjustment ($236.0) ($265.0) ($176.0) ($173.0) Adjusted operating cash flow $1,557.0 $1,426.0 $474.0 $1,331.0 % Overstatement 15.2% 18.6% 243.5% 23.7% Source: Company 10Ks and 10Qs
presciencepoint.com @presciencepoint
Kellogg Company (NYSE: K) 16
Change From “Sell-Through” to “Sell-in” Model Creates One-Time Revenue Benefit
Shift from Direct Store Delivery distribution to warehouse model will impact ~14% of Company revenue In a Press Release on 02/08/17, Kellogg announced it would begin to exit its Direct Store Delivery (“DSD”) network in Q2’2017. The transition would include moving the DSD-distributed portion of its US Snacks business to the warehouse model already used by Pringles and the rest of its North American business.
As we closely added US snacks business, it became clear that moving to retail warehouse distribution system offered the best path more profitable growth going forward. This is a difficult decision in light of this near-term impact on the organization, but it is the right long-term decision. (CEO Mr. John Bryan, Q4’2016 Conference Call, 02/09/17)
Project K Extended & Expanded for DSD Exit
($ in millions) Previous Guidance Revised Guidance
Project K cost savings $425 - $475 $600 - $700
Project K cumulative up-front costs $1,200 - $1,400 $1,500 - $1,600
Cash impact of up-front costs $900 - $1,100 $900 - $1,100
Source: 8K filing on 02/09/17
At the Deutsche Bank Global Consumer Conference on 06/03/17, Kellogg indicated 60% of its US snacks business goes through DSD. Accordingly, we estimate 14% of Company revenue will be impacted by the DSD exit.
DSD to Warehouse Shift Will Impact 14% of the Company
US Snacks (% of revenue) 24%
Under DSD system (% of US Snacks) 60%
Revenue impacted by DSD exit (% of revenue) 14%
Source: Company 10Ks, Prescience Point estimates Warehouse model has earlier revenue recognition than the DSD model (“sell-in” vs. “sell-through”) In the DSD model, revenue is recognized when the product is shipped/delivered to the retail store (i.e. customer) from a supplier’s distribution center (i.e. “sell-through”). In the warehouse model, revenue is recognized when the product is shipped (i.e. “sell-in”) to the retailer’s warehouse (i.e. customer). So, from an accounting perspective, revenue is recognized earlier in the warehouse model.
presciencepoint.com @presciencepoint
Kellogg Company (NYSE: K) 17
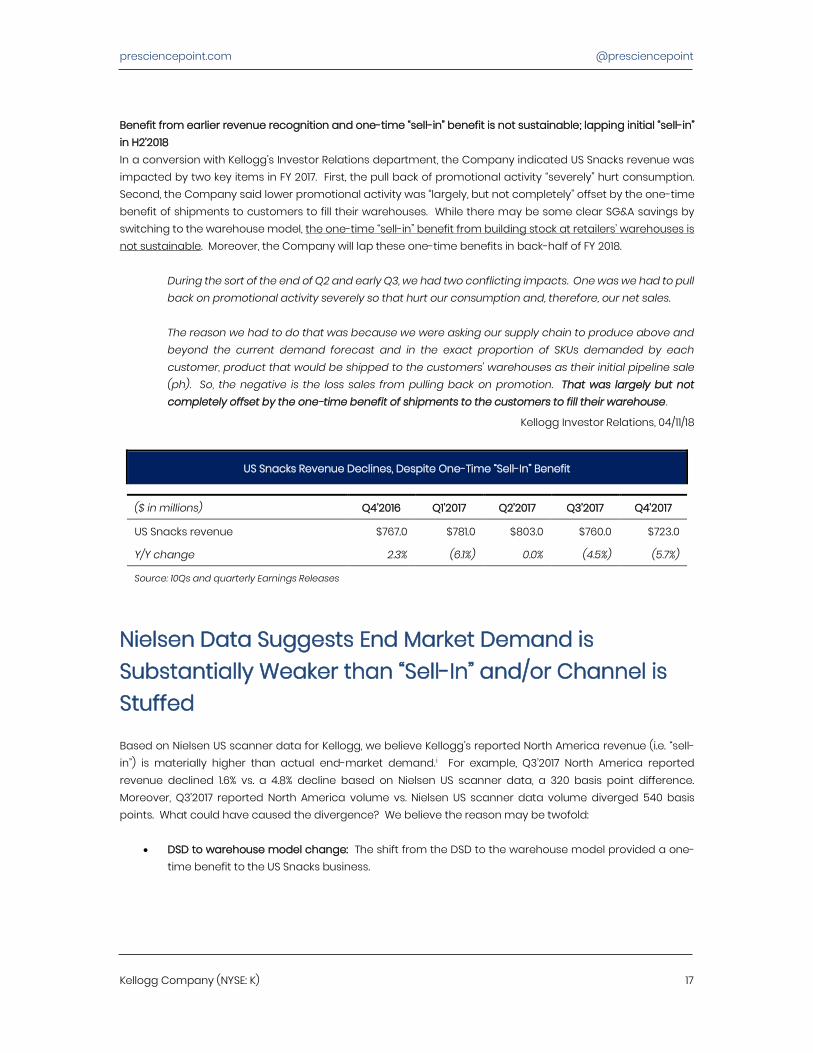
Benefit from earlier revenue recognition and one-time “sell-in” benefit is not sustainable; lapping initial “sell-in” in H2’2018 In a conversion with Kellogg’s Investor Relations department, the Company indicated US Snacks revenue was impacted by two key items in FY 2017. First, the pull back of promotional activity “severely” hurt consumption. Second, the Company said lower promotional activity was “largely, but not completely” offset by the one-time benefit of shipments to customers to fill their warehouses. While there may be some clear SG&A savings by switching to the warehouse model, the one-time “sell-in” benefit from building stock at retailers’ warehouses is not sustainable. Moreover, the Company will lap these one-time benefits in back-half of FY 2018.
During the sort of the end of Q2 and early Q3, we had two conflicting impacts. One was we had to pull back on promotional activity severely so that hurt our consumption and, therefore, our net sales. The reason we had to do that was because we were asking our supply chain to produce above and beyond the current demand forecast and in the exact proportion of SKUs demanded by each customer, product that would be shipped to the customers' warehouses as their initial pipeline sale (ph). So, the negative is the loss sales from pulling back on promotion. That was largely but not completely offset by the one-time benefit of shipments to the customers to fill their warehouse.
Kellogg Investor Relations, 04/11/18
US Snacks Revenue Declines, Despite One-Time “Sell-In” Benefit
($ in millions) Q4’2016 Q1’2017 Q2’2017 Q3’2017 Q4’2017
US Snacks revenue $767.0 $781.0 $803.0 $760.0 $723.0
Y/Y change 2.3% (6.1%) 0.0% (4.5%) (5.7%)
Source: 10Qs and quarterly Earnings Releases
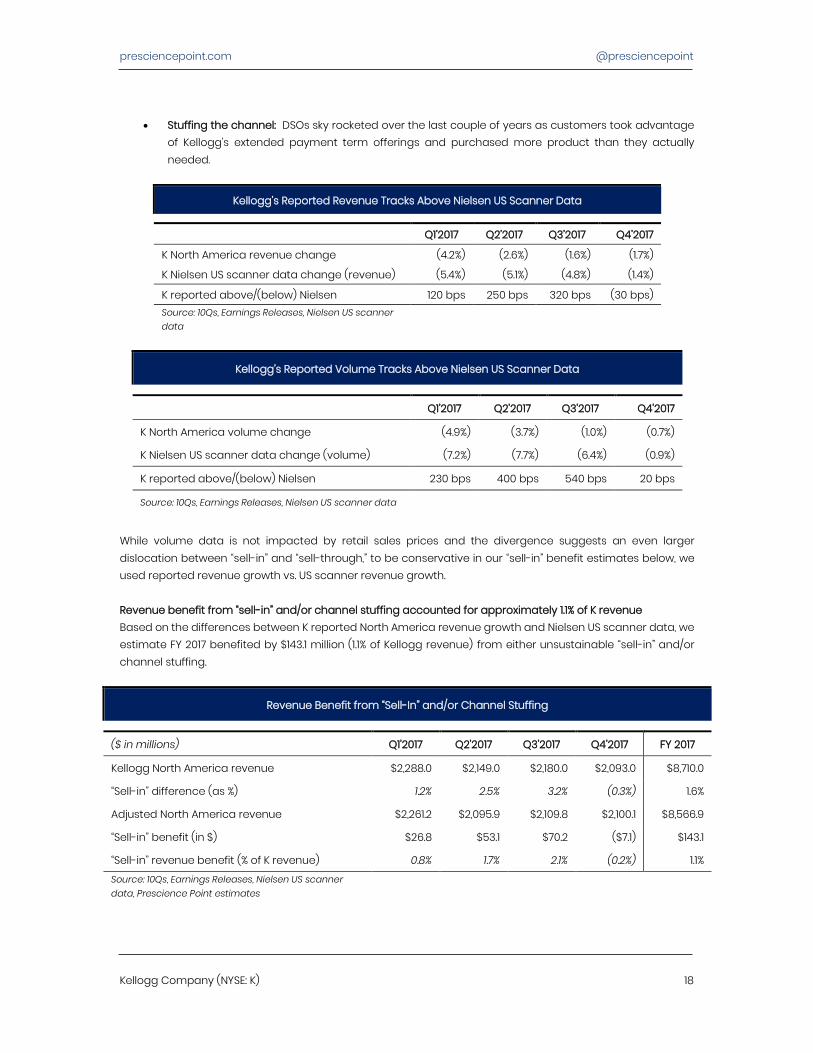
Nielsen Data Suggests End Market Demand is Substantially Weaker than “Sell-In” and/or Channel is Stuffed
Based on Nielsen US scanner data for Kellogg, we believe Kellogg’s reported North America revenue (i.e. “sell-in”) is materially higher than actual end-market demand.2F
i For example, Q3’2017 North America reported revenue declined 1.6% vs. a 4.8% decline based on Nielsen US scanner data, a 320 basis point difference. Moreover, Q3’2017 reported North America volume vs. Nielsen US scanner data volume diverged 540 basis points. What could have caused the divergence? We believe the reason may be twofold:
• DSD to warehouse model change: The shift from the DSD to the warehouse model provided a one-time benefit to the US Snacks business.
presciencepoint.com @presciencepoint
Kellogg Company (NYSE: K) 18
• Stuffing the channel: DSOs sky rocketed over the last couple of years as customers took advantage of Kellogg’s extended payment term offerings and purchased more product than they actually needed.
Kellogg’s Reported Revenue Tracks Above Nielsen US Scanner Data
Q1’2017 Q2’2017 Q3’2017 Q4’2017
K North America revenue change (4.2%) (2.6%) (1.6%) (1.7%)
K Nielsen US scanner data change (revenue) (5.4%) (5.1%) (4.8%) (1.4%)
K reported above/(below) Nielsen 120 bps 250 bps 320 bps (30 bps) Source: 10Qs, Earnings Releases, Nielsen US scanner data
Kellogg’s Reported Volume Tracks Above Nielsen US Scanner Data
Q1’2017 Q2’2017 Q3’2017 Q4’2017
K North America volume change (4.9%) (3.7%) (1.0%) (0.7%)
K Nielsen US scanner data change (volume) (7.2%) (7.7%) (6.4%) (0.9%)
K reported above/(below) Nielsen 230 bps 400 bps 540 bps 20 bps
Source: 10Qs, Earnings Releases, Nielsen US scanner data
While volume data is not impacted by retail sales prices and the divergence suggests an even larger dislocation between “sell-in” and “sell-through,” to be conservative in our “sell-in” benefit estimates below, we used reported revenue growth vs. US scanner revenue growth. Revenue benefit from “sell-in” and/or channel stuffing accounted for approximately 1.1% of K revenue Based on the differences between K reported North America revenue growth and Nielsen US scanner data, we estimate FY 2017 benefited by $143.1 million (1.1% of Kellogg revenue) from either unsustainable “sell-in” and/or channel stuffing.
Revenue Benefit from “Sell-In” and/or Channel Stuffing
($ in millions) Q1’2017 Q2’2017 Q3’2017 Q4’2017 FY 2017
Kellogg North America revenue $2,288.0 $2,149.0 $2,180.0 $2,093.0 $8,710.0
“Sell-in” difference (as %) 1.2% 2.5% 3.2% (0.3%) 1.6%
Adjusted North America revenue $2,261.2 $2,095.9 $2,109.8 $2,100.1 $8,566.9
“Sell-in” benefit (in $) $26.8 $53.1 $70.2 ($7.1) $143.1
“Sell-in” revenue benefit (% of K revenue) 0.8% 1.7% 2.1% (0.2%) 1.1% Source: 10Qs, Earnings Releases, Nielsen US scanner data, Prescience Point estimates
presciencepoint.com @presciencepoint
Kellogg Company (NYSE: K) 19
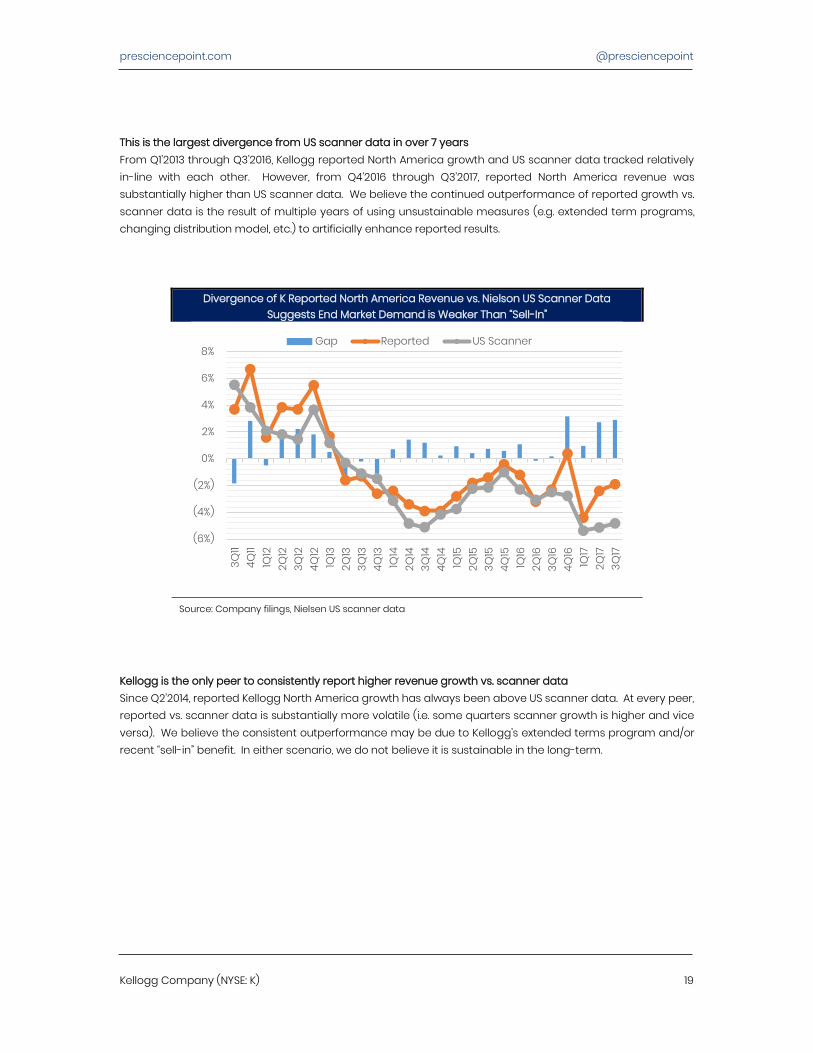
This is the largest divergence from US scanner data in over 7 years From Q1’2013 through Q3’2016, Kellogg reported North America growth and US scanner data tracked relatively in-line with each other. However, from Q4’2016 through Q3’2017, reported North America revenue was substantially higher than US scanner data. We believe the continued outperformance of reported growth vs. scanner data is the result of multiple years of using unsustainable measures (e.g. extended term programs, changing distribution model, etc.) to artificially enhance reported results.
Divergence of K Reported North America Revenue vs. Nielson US Scanner Data Suggests End Market Demand is Weaker Than “Sell-In”
Source: Company filings, Nielsen US scanner data
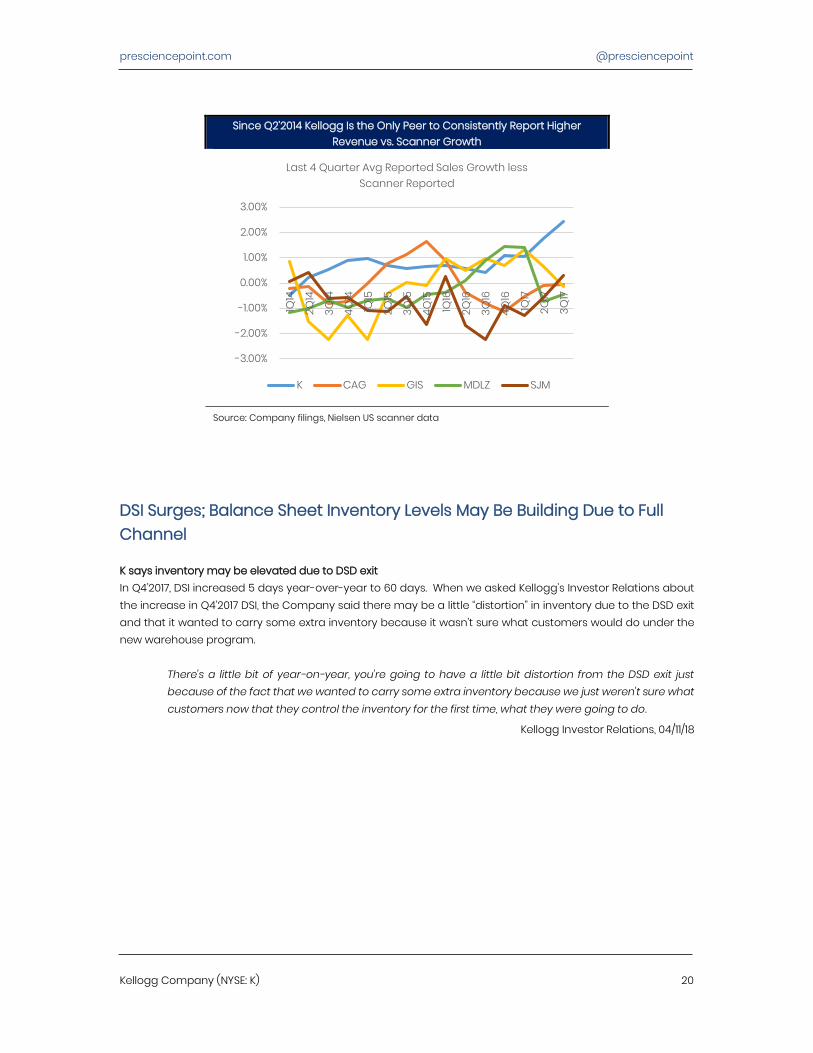
Kellogg is the only peer to consistently report higher revenue growth vs. scanner data Since Q2’2014, reported Kellogg North America growth has always been above US scanner data. At every peer, reported vs. scanner data is substantially more volatile (i.e. some quarters scanner growth is higher and vice versa). We believe the consistent outperformance may be due to Kellogg’s extended terms program and/or recent “sell-in” benefit. In either scenario, we do not believe it is sustainable in the long-term.
(6%)
(4%)
(2%)
0%
2%
4%
6%
8%
3Q11
4Q11
1Q12
2Q12
3Q12
4Q12
1Q13
2Q13
3Q13
4Q13
1Q14
2Q14
3Q14
4Q14
1Q15
2Q15
3Q15
4Q15
1Q16
2Q16
3Q16
4Q16
1Q17
2Q17
3Q17
Gap Reported US Scanner
presciencepoint.com @presciencepoint
Kellogg Company (NYSE: K) 20
Since Q2’2014 Kellogg Is the Only Peer to Consistently Report Higher Revenue vs. Scanner Growth
Source: Company filings, Nielsen US scanner data
DSI Surges; Balance Sheet Inventory Levels May Be Building Due to Full Channel
K says inventory may be elevated due to DSD exit In Q4’2017, DSI increased 5 days year-over-year to 60 days. When we asked Kellogg’s Investor Relations about the increase in Q4’2017 DSI, the Company said there may be a little “distortion” in inventory due to the DSD exit and that it wanted to carry some extra inventory because it wasn’t sure what customers would do under the new warehouse program.
There's a little bit of year-on-year, you're going to have a little bit distortion from the DSD exit just because of the fact that we wanted to carry some extra inventory because we just weren't sure what customers now that they control the inventory for the first time, what they were going to do.
Kellogg Investor Relations, 04/11/18
-3.00%
-2.00%
-1.00%
0.00%
1.00%
2.00%
3.00%
1Q14
2Q14
3Q14
4Q14
1Q15
2Q15
3Q15
4Q15
1Q16
2Q16
3Q16
4Q16
1Q17
2Q17
3Q17
Last 4 Quarter Avg Reported Sales Growth less Scanner Reported
K CAG GIS MDLZ SJM
presciencepoint.com @presciencepoint
Kellogg Company (NYSE: K) 21
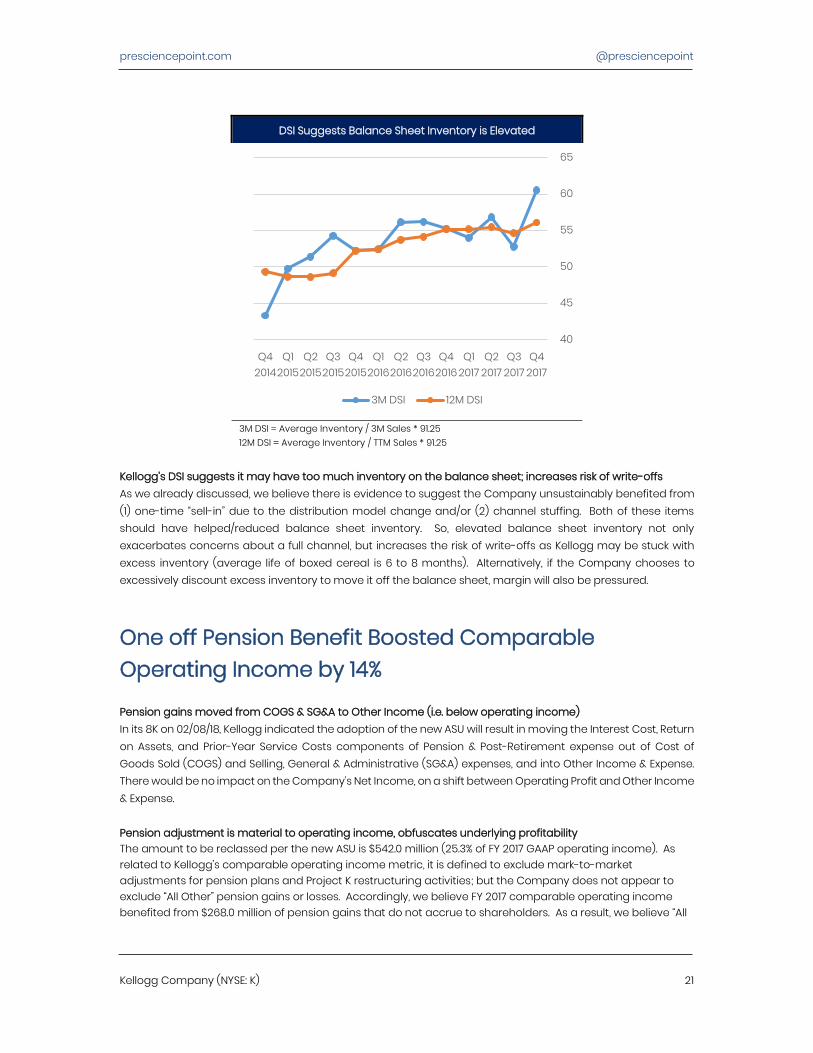
DSI Suggests Balance Sheet Inventory is Elevated
3M DSI = Average Inventory / 3M Sales * 91.25 12M DSI = Average Inventory / TTM Sales * 91.25
Kellogg’s DSI suggests it may have too much inventory on the balance sheet; increases risk of write-offs As we already discussed, we believe there is evidence to suggest the Company unsustainably benefited from (1) one-time “sell-in” due to the distribution model change and/or (2) channel stuffing. Both of these items should have helped/reduced balance sheet inventory. So, elevated balance sheet inventory not only exacerbates concerns about a full channel, but increases the risk of write-offs as Kellogg may be stuck with excess inventory (average life of boxed cereal is 6 to 8 months). Alternatively, if the Company chooses to excessively discount excess inventory to move it off the balance sheet, margin will also be pressured.
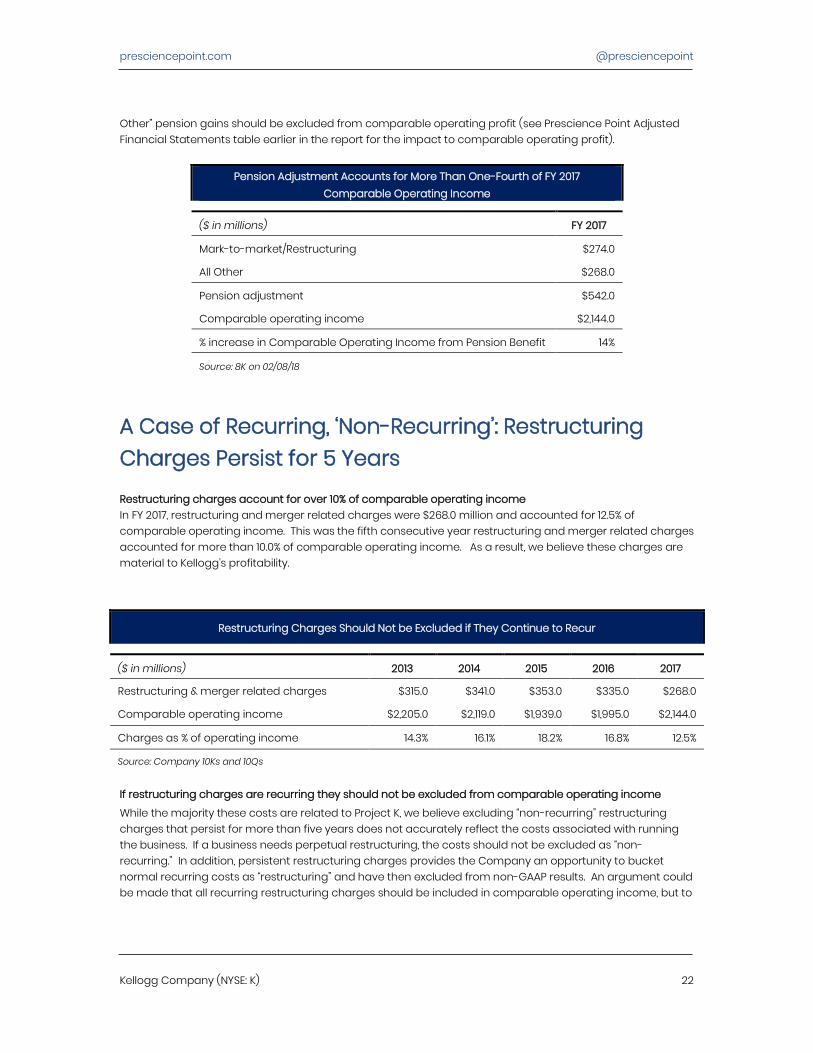
One off Pension Benefit Boosted Comparable Operating Income by 14%
Pension gains moved from COGS & SG&A to Other Income (i.e. below operating income) In its 8K on 02/08/18, Kellogg indicated the adoption of the new ASU will result in moving the Interest Cost, Return on Assets, and Prior-Year Service Costs components of Pension & Post-Retirement expense out of Cost of Goods Sold (COGS) and Selling, General & Administrative (SG&A) expenses, and into Other Income & Expense. There would be no impact on the Company’s Net Income, on a shift between Operating Profit and Other Income & Expense. Pension adjustment is material to operating income, obfuscates underlying profitability The amount to be reclassed per the new ASU is $542.0 million (25.3% of FY 2017 GAAP operating income). As related to Kellogg’s comparable operating income metric, it is defined to exclude mark-to-market adjustments for pension plans and Project K restructuring activities; but the Company does not appear to exclude “All Other” pension gains or losses. Accordingly, we believe FY 2017 comparable operating income benefited from $268.0 million of pension gains that do not accrue to shareholders. As a result, we believe “All
40
45
50
55
60
65
Q42017
Q32017
Q22017
Q12017
Q42016
Q32016
Q22016
Q12016
Q42015
Q32015
Q22015
Q12015
Q42014
3M DSI 12M DSI
presciencepoint.com @presciencepoint
Kellogg Company (NYSE: K) 22
Other” pension gains should be excluded from comparable operating profit (see Prescience Point Adjusted Financial Statements table earlier in the report for the impact to comparable operating profit).
Pension Adjustment Accounts for More Than One-Fourth of FY 2017 Comparable Operating Income
($ in millions) FY 2017
Mark-to-market/Restructuring $274.0
All Other $268.0
Pension adjustment $542.0
Comparable operating income $2,144.0
% increase in Comparable Operating Income from Pension Benefit 14%
Source: 8K on 02/08/18
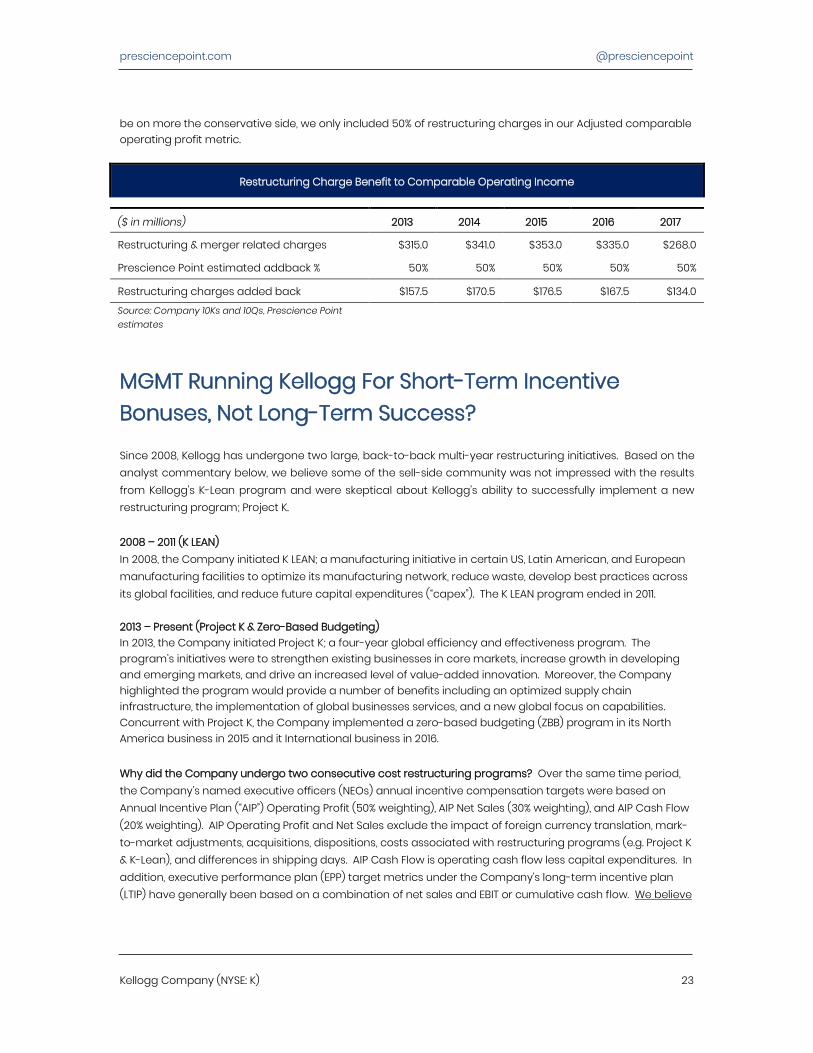
A Case of Recurring, ‘Non-Recurring’: Restructuring Charges Persist for 5 Years
Restructuring charges account for over 10% of comparable operating income In FY 2017, restructuring and merger related charges were $268.0 million and accounted for 12.5% of comparable operating income. This was the fifth consecutive year restructuring and merger related charges accounted for more than 10.0% of comparable operating income. As a result, we believe these charges are material to Kellogg’s profitability.
Restructuring Charges Should Not be Excluded if They Continue to Recur
($ in millions) 2013 2014 2015 2016 2017
Restructuring & merger related charges $315.0 $341.0 $353.0 $335.0 $268.0
Comparable operating income $2,205.0 $2,119.0 $1,939.0 $1,995.0 $2,144.0
Charges as % of operating income 14.3% 16.1% 18.2% 16.8% 12.5%
Source: Company 10Ks and 10Qs
If restructuring charges are recurring they should not be excluded from comparable operating income
While the majority these costs are related to Project K, we believe excluding “non-recurring” restructuring charges that persist for more than five years does not accurately reflect the costs associated with running the business. If a business needs perpetual restructuring, the costs should not be excluded as “non-recurring.” In addition, persistent restructuring charges provides the Company an opportunity to bucket normal recurring costs as “restructuring” and have then excluded from non-GAAP results. An argument could be made that all recurring restructuring charges should be included in comparable operating income, but to
presciencepoint.com @presciencepoint
Kellogg Company (NYSE: K) 23
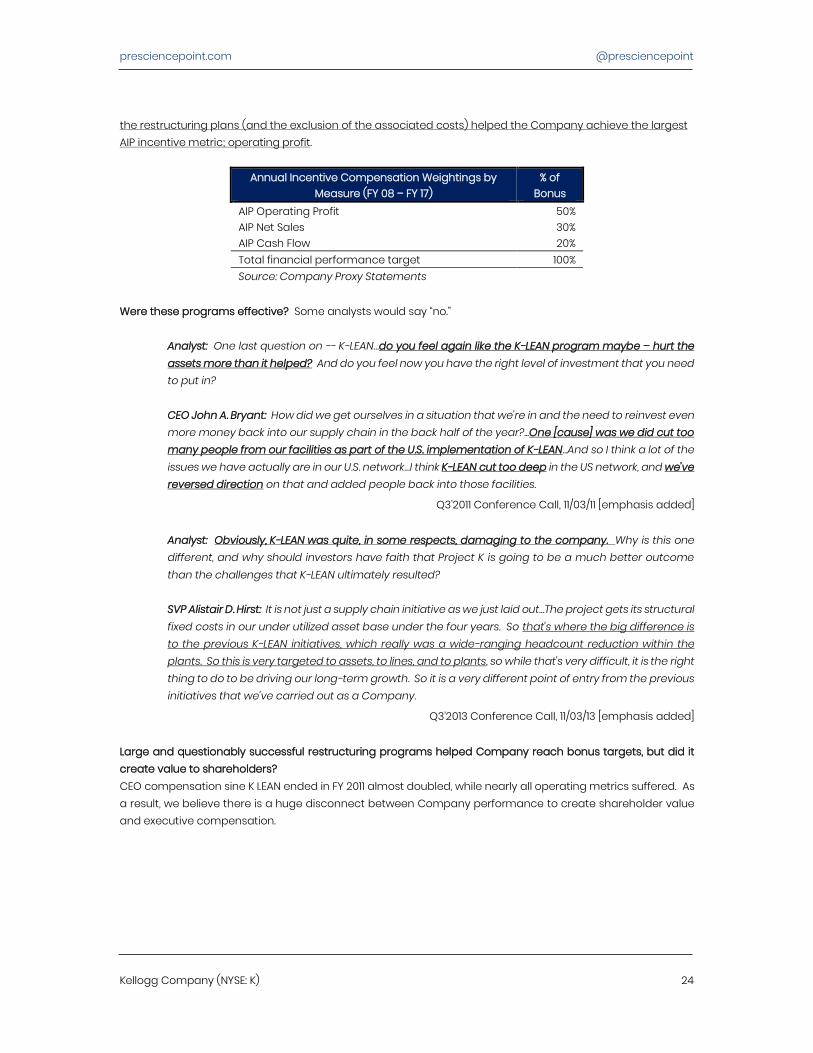
be on more the conservative side, we only included 50% of restructuring charges in our Adjusted comparable operating profit metric.
Restructuring Charge Benefit to Comparable Operating Income
($ in millions) 2013 2014 2015 2016 2017
Restructuring & merger related charges $315.0 $341.0 $353.0 $335.0 $268.0
Prescience Point estimated addback % 50% 50% 50% 50% 50%
Restructuring charges added back $157.5 $170.5 $176.5 $167.5 $134.0 Source: Company 10Ks and 10Qs, Prescience Point estimates
MGMT Running Kellogg For Short-Term Incentive Bonuses, Not Long-Term Success?
Since 2008, Kellogg has undergone two large, back-to-back multi-year restructuring initiatives. Based on the analyst commentary below, we believe some of the sell-side community was not impressed with the results from Kellogg’s K-Lean program and were skeptical about Kellogg’s ability to successfully implement a new restructuring program; Project K. 2008 – 2011 (K LEAN) In 2008, the Company initiated K LEAN; a manufacturing initiative in certain US, Latin American, and European manufacturing facilities to optimize its manufacturing network, reduce waste, develop best practices across its global facilities, and reduce future capital expenditures (“capex”). The K LEAN program ended in 2011. 2013 – Present (Project K & Zero-Based Budgeting) In 2013, the Company initiated Project K; a four-year global efficiency and effectiveness program. The program’s initiatives were to strengthen existing businesses in core markets, increase growth in developing and emerging markets, and drive an increased level of value-added innovation. Moreover, the Company highlighted the program would provide a number of benefits including an optimized supply chain infrastructure, the implementation of global businesses services, and a new global focus on capabilities. Concurrent with Project K, the Company implemented a zero-based budgeting (ZBB) program in its North America business in 2015 and it International business in 2016. Why did the Company undergo two consecutive cost restructuring programs? Over the same time period, the Company’s named executive officers (NEOs) annual incentive compensation targets were based on Annual Incentive Plan (“AIP”) Operating Profit (50% weighting), AIP Net Sales (30% weighting), and AIP Cash Flow (20% weighting). AIP Operating Profit and Net Sales exclude the impact of foreign currency translation, mark-to-market adjustments, acquisitions, dispositions, costs associated with restructuring programs (e.g. Project K & K-Lean), and differences in shipping days. AIP Cash Flow is operating cash flow less capital expenditures. In addition, executive performance plan (EPP) target metrics under the Company’s long-term incentive plan (LTIP) have generally been based on a combination of net sales and EBIT or cumulative cash flow. We believe
presciencepoint.com @presciencepoint
Kellogg Company (NYSE: K) 24
the restructuring plans (and the exclusion of the associated costs) helped the Company achieve the largest AIP incentive metric; operating profit.
Annual Incentive Compensation Weightings by Measure (FY 08 – FY 17)
% of Bonus
AIP Operating Profit 50% AIP Net Sales 30% AIP Cash Flow 20% Total financial performance target 100% Source: Company Proxy Statements
Were these programs effective? Some analysts would say “no.”
Analyst: One last question on -- K-LEAN…do you feel again like the K-LEAN program maybe – hurt the assets more than it helped? And do you feel now you have the right level of investment that you need to put in? CEO John A. Bryant: How did we get ourselves in a situation that we're in and the need to reinvest even more money back into our supply chain in the back half of the year?...One [cause] was we did cut too many people from our facilities as part of the U.S. implementation of K-LEAN...And so I think a lot of the issues we have actually are in our U.S. network…I think K-LEAN cut too deep in the US network, and we've reversed direction on that and added people back into those facilities.
Q3’2011 Conference Call, 11/03/11 [emphasis added]
Analyst: Obviously, K-LEAN was quite, in some respects, damaging to the company. Why is this one different, and why should investors have faith that Project K is going to be a much better outcome than the challenges that K-LEAN ultimately resulted? SVP Alistair D. Hirst: It is not just a supply chain initiative as we just laid out…The project gets its structural fixed costs in our under utilized asset base under the four years. So that's where the big difference is to the previous K-LEAN initiatives, which really was a wide-ranging headcount reduction within the plants. So this is very targeted to assets, to lines, and to plants, so while that's very difficult, it is the right thing to do to be driving our long-term growth. So it is a very different point of entry from the previous initiatives that we've carried out as a Company.
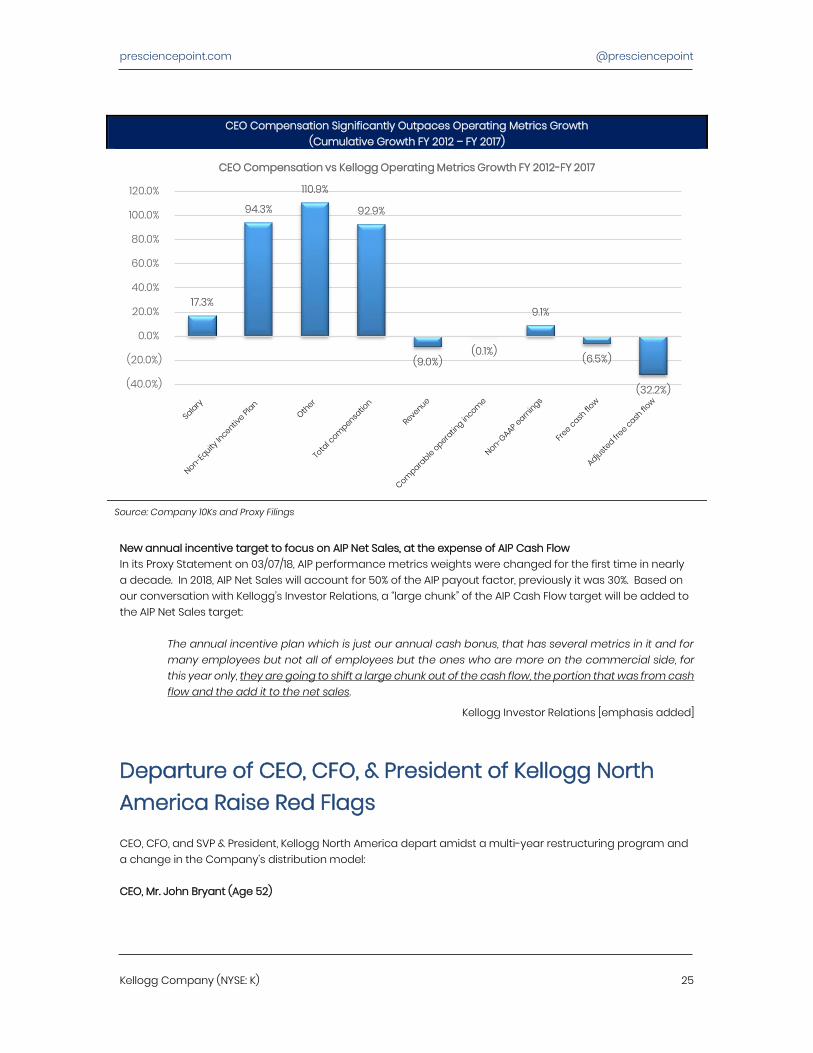
Q3’2013 Conference Call, 11/03/13 [emphasis added] Large and questionably successful restructuring programs helped Company reach bonus targets, but did it create value to shareholders? CEO compensation sine K LEAN ended in FY 2011 almost doubled, while nearly all operating metrics suffered. As a result, we believe there is a huge disconnect between Company performance to create shareholder value and executive compensation.
presciencepoint.com @presciencepoint
Kellogg Company (NYSE: K) 25
CEO Compensation Significantly Outpaces Operating Metrics Growth (Cumulative Growth FY 2012 – FY 2017)
Source: Company 10Ks and Proxy Filings
New annual incentive target to focus on AIP Net Sales, at the expense of AIP Cash Flow In its Proxy Statement on 03/07/18, AIP performance metrics weights were changed for the first time in nearly a decade. In 2018, AIP Net Sales will account for 50% of the AIP payout factor, previously it was 30%. Based on our conversation with Kellogg’s Investor Relations, a “large chunk” of the AIP Cash Flow target will be added to the AIP Net Sales target:
The annual incentive plan which is just our annual cash bonus, that has several metrics in it and for many employees but not all of employees but the ones who are more on the commercial side, for this year only, they are going to shift a large chunk out of the cash flow, the portion that was from cash flow and the add it to the net sales.
Kellogg Investor Relations [emphasis added]
Departure of CEO, CFO, & President of Kellogg North America Raise Red Flags
CEO, CFO, and SVP & President, Kellogg North America depart amidst a multi-year restructuring program and a change in the Company’s distribution model: CEO, Mr. John Bryant (Age 52)
17.3%
94.3%
110.9%
92.9%
(9.0%)(0.1%)
9.1%
(6.5%)
(32.2%)(40.0%)
(20.0%)
0.0%
20.0%
40.0%
60.0%
80.0%
100.0%
120.0%
CEO Compensation vs Kellogg Operating Metrics Growth FY 2012-FY 2017
presciencepoint.com @presciencepoint
Kellogg Company (NYSE: K) 26
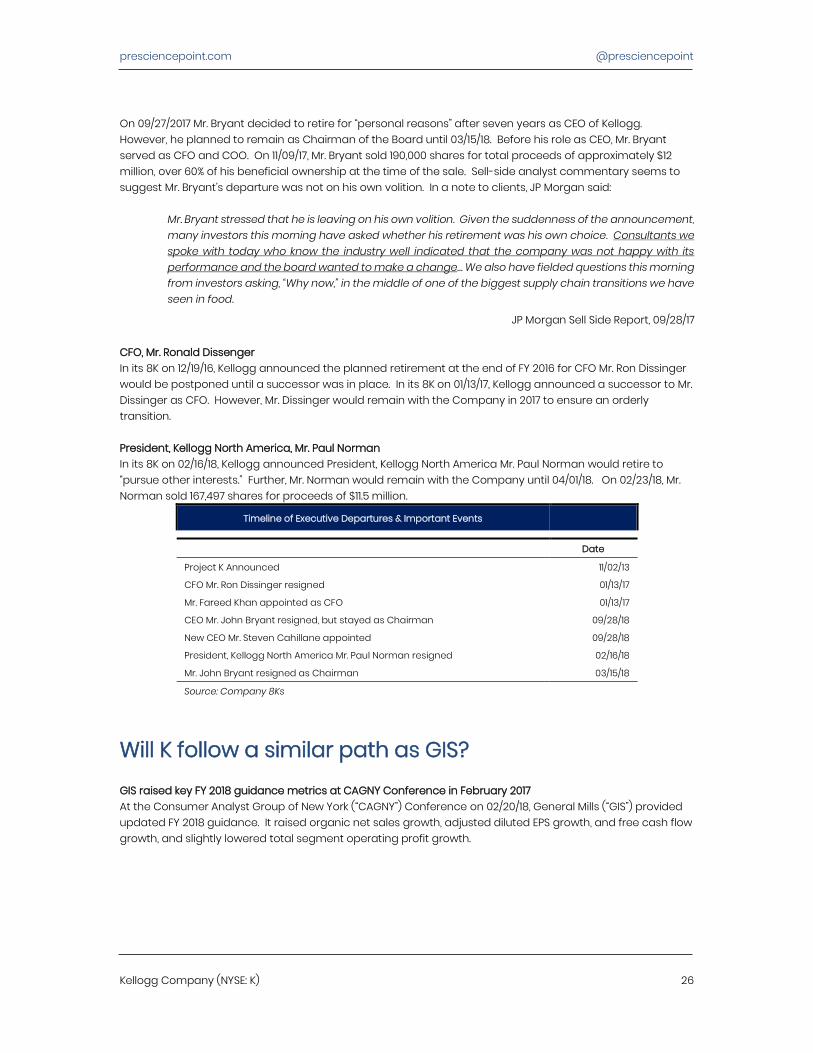
On 09/27/2017 Mr. Bryant decided to retire for “personal reasons” after seven years as CEO of Kellogg. However, he planned to remain as Chairman of the Board until 03/15/18. Before his role as CEO, Mr. Bryant served as CFO and COO. On 11/09/17, Mr. Bryant sold 190,000 shares for total proceeds of approximately $12 million, over 60% of his beneficial ownership at the time of the sale. Sell-side analyst commentary seems to suggest Mr. Bryant’s departure was not on his own volition. In a note to clients, JP Morgan said:
Mr. Bryant stressed that he is leaving on his own volition. Given the suddenness of the announcement, many investors this morning have asked whether his retirement was his own choice. Consultants we spoke with today who know the industry well indicated that the company was not happy with its performance and the board wanted to make a change… We also have fielded questions this morning from investors asking, “Why now,” in the middle of one of the biggest supply chain transitions we have seen in food.
JP Morgan Sell Side Report, 09/28/17 CFO, Mr. Ronald Dissenger In its 8K on 12/19/16, Kellogg announced the planned retirement at the end of FY 2016 for CFO Mr. Ron Dissinger would be postponed until a successor was in place. In its 8K on 01/13/17, Kellogg announced a successor to Mr. Dissinger as CFO. However, Mr. Dissinger would remain with the Company in 2017 to ensure an orderly transition. President, Kellogg North America, Mr. Paul Norman In its 8K on 02/16/18, Kellogg announced President, Kellogg North America Mr. Paul Norman would retire to “pursue other interests.” Further, Mr. Norman would remain with the Company until 04/01/18. On 02/23/18, Mr. Norman sold 167,497 shares for proceeds of $11.5 million.
Timeline of Executive Departures & Important Events
Date
Project K Announced 11/02/13
CFO Mr. Ron Dissinger resigned 01/13/17
Mr. Fareed Khan appointed as CFO 01/13/17
CEO Mr. John Bryant resigned, but stayed as Chairman 09/28/18
New CEO Mr. Steven Cahillane appointed 09/28/18
President, Kellogg North America Mr. Paul Norman resigned 02/16/18
Mr. John Bryant resigned as Chairman 03/15/18
Source: Company 8Ks
Will K follow a similar path as GIS?
GIS raised key FY 2018 guidance metrics at CAGNY Conference in February 2017 At the Consumer Analyst Group of New York (“CAGNY”) Conference on 02/20/18, General Mills (“GIS”) provided updated FY 2018 guidance. It raised organic net sales growth, adjusted diluted EPS growth, and free cash flow growth, and slightly lowered total segment operating profit growth.
presciencepoint.com @presciencepoint
Kellogg Company (NYSE: K) 27
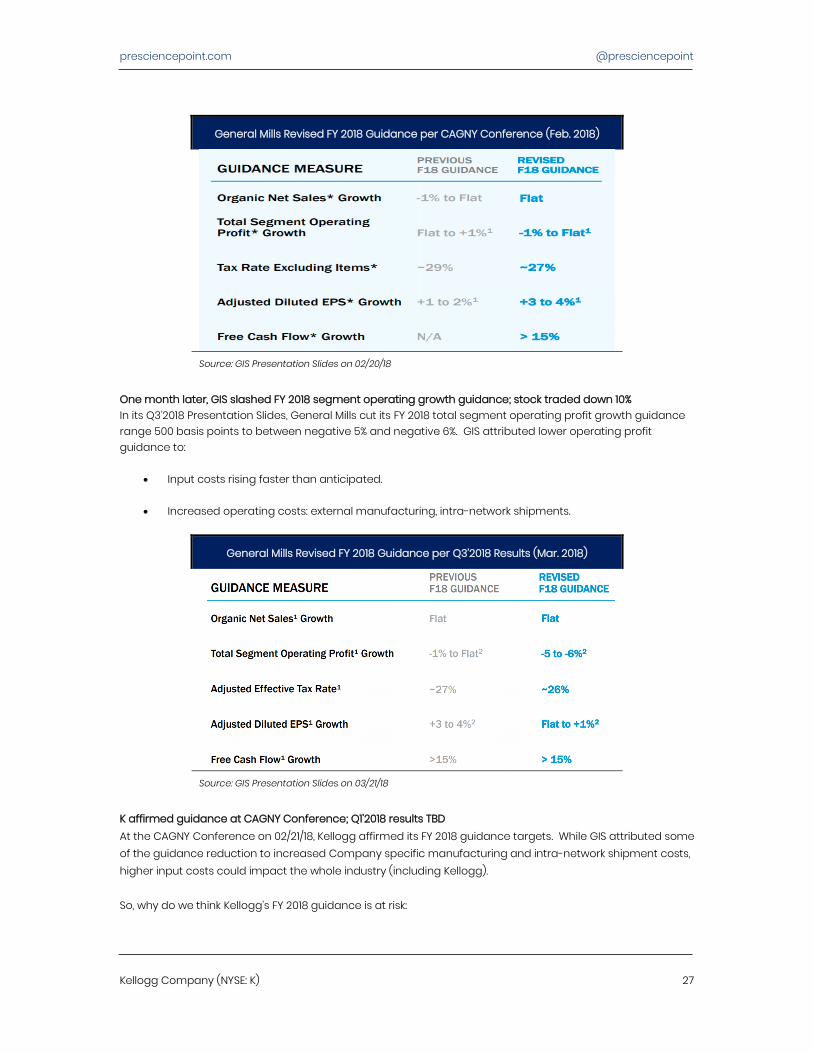
General Mills Revised FY 2018 Guidance per CAGNY Conference (Feb. 2018)
Source: GIS Presentation Slides on 02/20/18
One month later, GIS slashed FY 2018 segment operating growth guidance; stock traded down 10% In its Q3’2018 Presentation Slides, General Mills cut its FY 2018 total segment operating profit growth guidance range 500 basis points to between negative 5% and negative 6%. GIS attributed lower operating profit guidance to:
• Input costs rising faster than anticipated.
• Increased operating costs: external manufacturing, intra-network shipments.
General Mills Revised FY 2018 Guidance per Q3’2018 Results (Mar. 2018)
Source: GIS Presentation Slides on 03/21/18
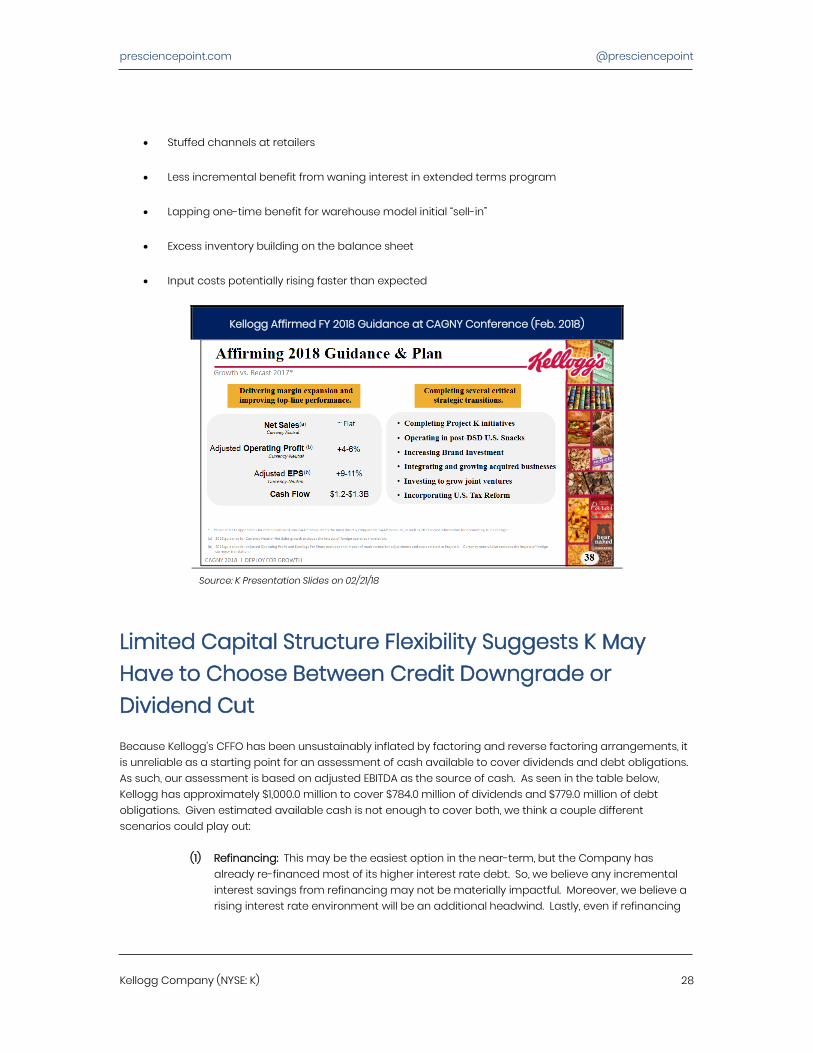
K affirmed guidance at CAGNY Conference; Q1’2018 results TBD At the CAGNY Conference on 02/21/18, Kellogg affirmed its FY 2018 guidance targets. While GIS attributed some of the guidance reduction to increased Company specific manufacturing and intra-network shipment costs, higher input costs could impact the whole industry (including Kellogg). So, why do we think Kellogg’s FY 2018 guidance is at risk:
presciencepoint.com @presciencepoint
Kellogg Company (NYSE: K) 28
• Stuffed channels at retailers
• Less incremental benefit from waning interest in extended terms program
• Lapping one-time benefit for warehouse model initial “sell-in”
• Excess inventory building on the balance sheet
• Input costs potentially rising faster than expected
Kellogg Affirmed FY 2018 Guidance at CAGNY Conference (Feb. 2018)
Source: K Presentation Slides on 02/21/18
Limited Capital Structure Flexibility Suggests K May Have to Choose Between Credit Downgrade or Dividend Cut
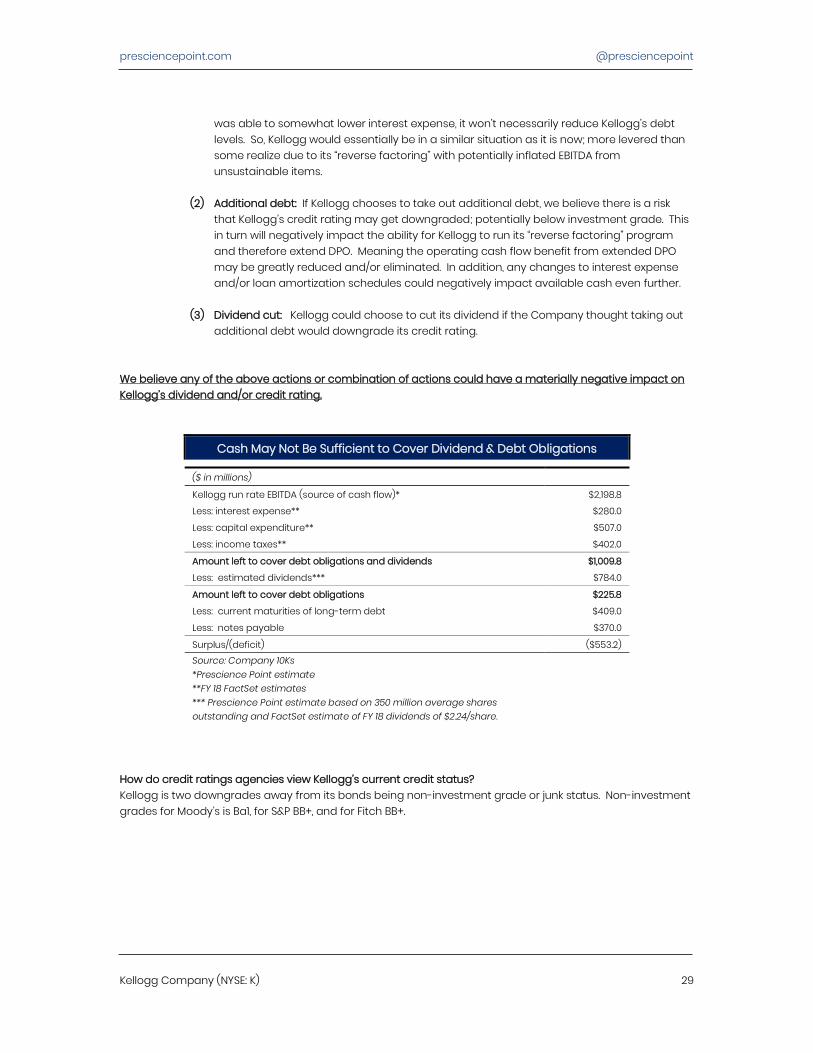
Because Kellogg’s CFFO has been unsustainably inflated by factoring and reverse factoring arrangements, it is unreliable as a starting point for an assessment of cash available to cover dividends and debt obligations. As such, our assessment is based on adjusted EBITDA as the source of cash. As seen in the table below, Kellogg has approximately $1,000.0 million to cover $784.0 million of dividends and $779.0 million of debt obligations. Given estimated available cash is not enough to cover both, we think a couple different scenarios could play out:
(1) Refinancing: This may be the easiest option in the near-term, but the Company has already re-financed most of its higher interest rate debt. So, we believe any incremental interest savings from refinancing may not be materially impactful. Moreover, we believe a rising interest rate environment will be an additional headwind. Lastly, even if refinancing
presciencepoint.com @presciencepoint
Kellogg Company (NYSE: K) 29
was able to somewhat lower interest expense, it won’t necessarily reduce Kellogg’s debt levels. So, Kellogg would essentially be in a similar situation as it is now; more levered than some realize due to its “reverse factoring” with potentially inflated EBITDA from unsustainable items.
(2) Additional debt: If Kellogg chooses to take out additional debt, we believe there is a risk that Kellogg’s credit rating may get downgraded; potentially below investment grade. This in turn will negatively impact the ability for Kellogg to run its “reverse factoring” program and therefore extend DPO. Meaning the operating cash flow benefit from extended DPO may be greatly reduced and/or eliminated. In addition, any changes to interest expense and/or loan amortization schedules could negatively impact available cash even further.
(3) Dividend cut: Kellogg could choose to cut its dividend if the Company thought taking out additional debt would downgrade its credit rating.
We believe any of the above actions or combination of actions could have a materially negative impact on Kellogg’s dividend and/or credit rating.
Cash May Not Be Sufficient to Cover Dividend & Debt Obligations ($ in millions)
Kellogg run rate EBITDA (source of cash flow)* $2,198.8
Less: interest expense** $280.0
Less: capital expenditure** $507.0
Less: income taxes** $402.0
Amount left to cover debt obligations and dividends $1,009.8
Less: estimated dividends*** $784.0
Amount left to cover debt obligations $225.8
Less: current maturities of long-term debt $409.0
Less: notes payable $370.0
Surplus/(deficit) ($553.2) Source: Company 10Ks *Prescience Point estimate **FY 18 FactSet estimates *** Prescience Point estimate based on 350 million average shares outstanding and FactSet estimate of FY 18 dividends of $2.24/share.
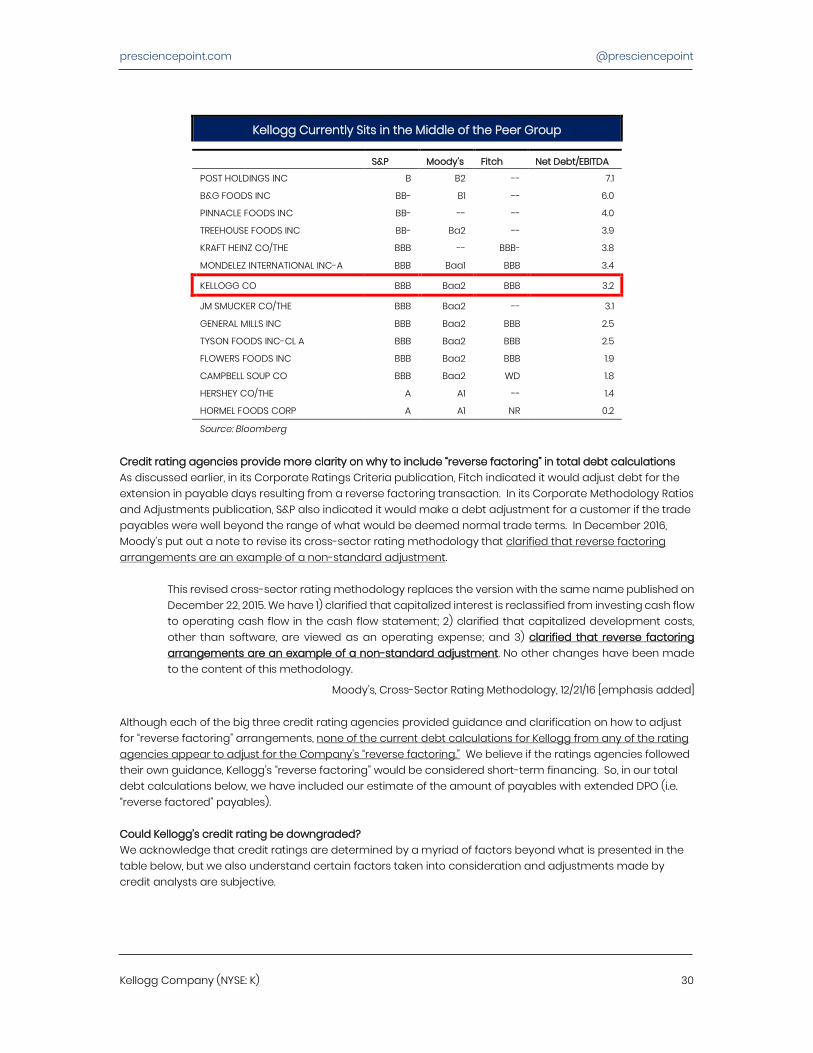
How do credit ratings agencies view Kellogg’s current credit status? Kellogg is two downgrades away from its bonds being non-investment grade or junk status. Non-investment grades for Moody’s is Ba1, for S&P BB+, and for Fitch BB+.
presciencepoint.com @presciencepoint
Kellogg Company (NYSE: K) 30
Kellogg Currently Sits in the Middle of the Peer Group S&P Moody’s Fitch Net Debt/EBITDA
POST HOLDINGS INC B B2 -- 7.1
B&G FOODS INC BB- B1 -- 6.0
PINNACLE FOODS INC BB- -- -- 4.0
TREEHOUSE FOODS INC BB- Ba2 -- 3.9
KRAFT HEINZ CO/THE BBB -- BBB- 3.8
MONDELEZ INTERNATIONAL INC-A BBB Baa1 BBB 3.4
KELLOGG CO BBB Baa2 BBB 3.2
JM SMUCKER CO/THE BBB Baa2 -- 3.1
GENERAL MILLS INC BBB Baa2 BBB 2.5
TYSON FOODS INC-CL A BBB Baa2 BBB 2.5
FLOWERS FOODS INC BBB Baa2 BBB 1.9
CAMPBELL SOUP CO BBB Baa2 WD 1.8
HERSHEY CO/THE A A1 -- 1.4
HORMEL FOODS CORP A A1 NR 0.2
Source: Bloomberg
Credit rating agencies provide more clarity on why to include “reverse factoring” in total debt calculations As discussed earlier, in its Corporate Ratings Criteria publication, Fitch indicated it would adjust debt for the extension in payable days resulting from a reverse factoring transaction. In its Corporate Methodology Ratios and Adjustments publication, S&P also indicated it would make a debt adjustment for a customer if the trade payables were well beyond the range of what would be deemed normal trade terms. In December 2016, Moody’s put out a note to revise its cross-sector rating methodology that clarified that reverse factoring arrangements are an example of a non-standard adjustment.
This revised cross-sector rating methodology replaces the version with the same name published on December 22, 2015. We have 1) clarified that capitalized interest is reclassified from investing cash flow to operating cash flow in the cash flow statement; 2) clarified that capitalized development costs, other than software, are viewed as an operating expense; and 3) clarified that reverse factoring arrangements are an example of a non-standard adjustment. No other changes have been made to the content of this methodology.
Moody’s, Cross-Sector Rating Methodology, 12/21/16 [emphasis added] Although each of the big three credit rating agencies provided guidance and clarification on how to adjust for “reverse factoring” arrangements, none of the current debt calculations for Kellogg from any of the rating agencies appear to adjust for the Company’s “reverse factoring.” We believe if the ratings agencies followed their own guidance, Kellogg’s “reverse factoring” would be considered short-term financing. So, in our total debt calculations below, we have included our estimate of the amount of payables with extended DPO (i.e. “reverse factored” payables). Could Kellogg’s credit rating be downgraded? We acknowledge that credit ratings are determined by a myriad of factors beyond what is presented in the table below, but we also understand certain factors taken into consideration and adjustments made by credit analysts are subjective.
presciencepoint.com @presciencepoint
Kellogg Company (NYSE: K) 31
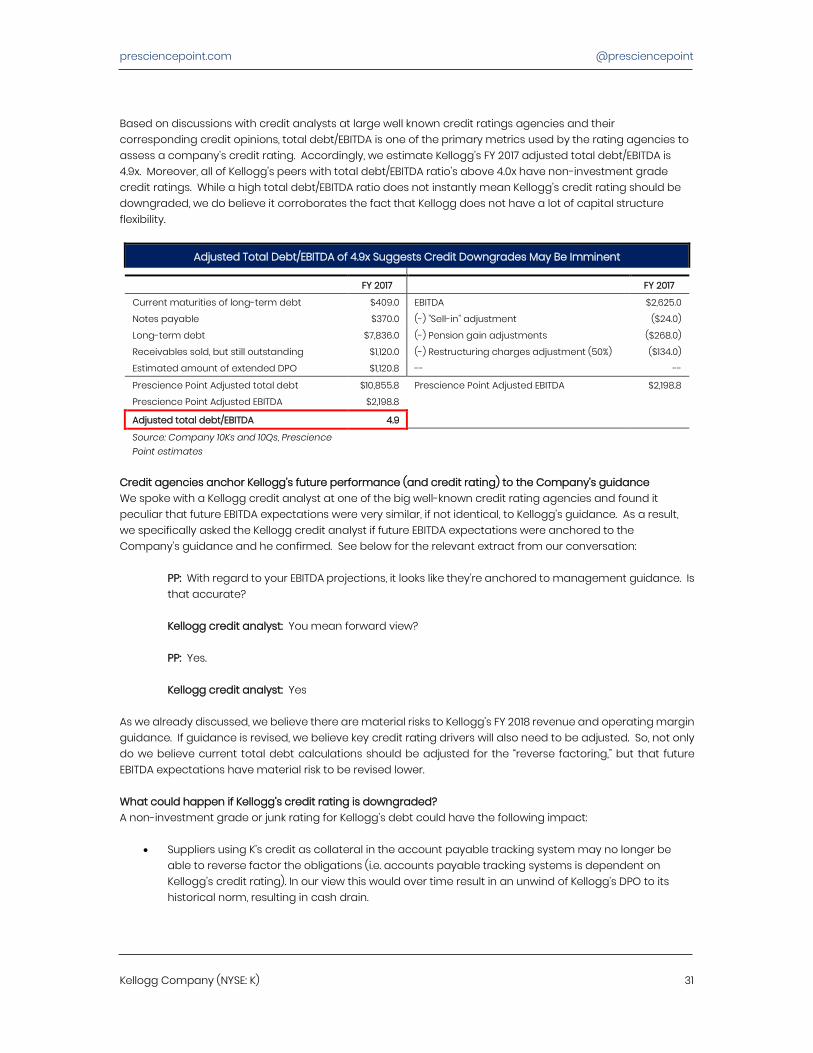
Based on discussions with credit analysts at large well known credit ratings agencies and their corresponding credit opinions, total debt/EBITDA is one of the primary metrics used by the rating agencies to assess a company’s credit rating. Accordingly, we estimate Kellogg’s FY 2017 adjusted total debt/EBITDA is 4.9x. Moreover, all of Kellogg’s peers with total debt/EBITDA ratio’s above 4.0x have non-investment grade credit ratings. While a high total debt/EBITDA ratio does not instantly mean Kellogg’s credit rating should be downgraded, we do believe it corroborates the fact that Kellogg does not have a lot of capital structure flexibility.
Adjusted Total Debt/EBITDA of 4.9x Suggests Credit Downgrades May Be Imminent FY 2017 FY 2017
Current maturities of long-term debt $409.0 EBITDA $2,625.0
Notes payable $370.0 (-) "Sell-in" adjustment ($24.0)
Long-term debt $7,836.0 (-) Pension gain adjustments ($268.0)
Receivables sold, but still outstanding $1,120.0 (-) Restructuring charges adjustment (50%) ($134.0)
Estimated amount of extended DPO $1,120.8 -- --
Prescience Point Adjusted total debt $10,855.8 Prescience Point Adjusted EBITDA $2,198.8
Prescience Point Adjusted EBITDA $2,198.8
Adjusted total debt/EBITDA 4.9
Source: Company 10Ks and 10Qs, Prescience Point estimates
Credit agencies anchor Kellogg’s future performance (and credit rating) to the Company’s guidance We spoke with a Kellogg credit analyst at one of the big well-known credit rating agencies and found it peculiar that future EBITDA expectations were very similar, if not identical, to Kellogg’s guidance. As a result, we specifically asked the Kellogg credit analyst if future EBITDA expectations were anchored to the Company’s guidance and he confirmed. See below for the relevant extract from our conversation:
PP: With regard to your EBITDA projections, it looks like they’re anchored to management guidance. Is that accurate? Kellogg credit analyst: You mean forward view? PP: Yes. Kellogg credit analyst: Yes
As we already discussed, we believe there are material risks to Kellogg’s FY 2018 revenue and operating margin guidance. If guidance is revised, we believe key credit rating drivers will also need to be adjusted. So, not only do we believe current total debt calculations should be adjusted for the “reverse factoring,” but that future EBITDA expectations have material risk to be revised lower. What could happen if Kellogg’s credit rating is downgraded? A non-investment grade or junk rating for Kellogg’s debt could have the following impact:
• Suppliers using K’s credit as collateral in the account payable tracking system may no longer be able to reverse factor the obligations (i.e. accounts payable tracking systems is dependent on Kellogg’s credit rating). In our view this would over time result in an unwind of Kellogg’s DPO to its historical norm, resulting in cash drain.
presciencepoint.com @presciencepoint
Kellogg Company (NYSE: K) 32
• Banks factoring K’s accounts receivable could end their monetization and factoring programs.
• The company’s cost of capital and interest expense could increase. Two recent accounting blow-ups with large reverse factoring programs may be cautionary tales Carillion plc (CLLN.L) and Abengoa SA (ABG.MC) both filed for bankruptcy in the last two years after their debt loads became too difficult to manage. Interestingly, both cases caught some investors off guard as balance sheet debt levels turned out to be much higher than expected due to massive “reverse factoring” arrangements. While we may not necessarily believe Kellogg is heading down the same path, we do think these two situations provide a great example of how “reverse factoring” arrangements can obfuscate underlying financials and can occasionally catch investors flat-footed.
Valuation
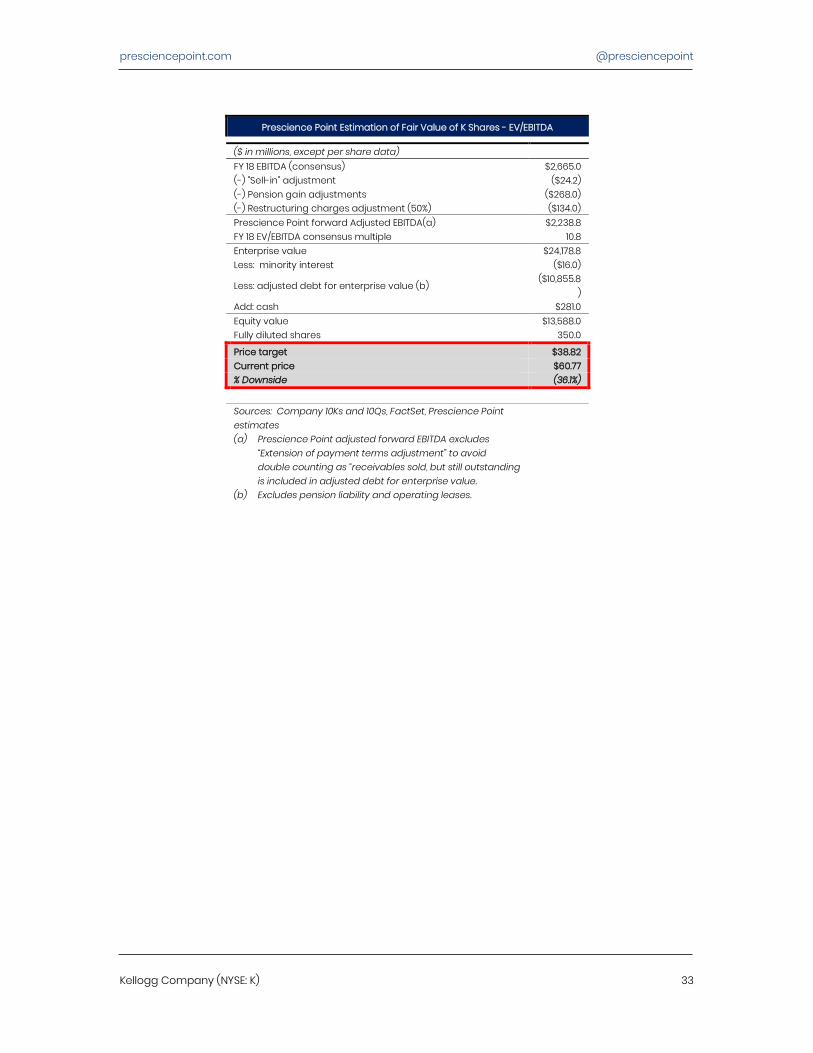
The vast majority of sell-side analysts who cover K anchor their projections to K management’s guidance. For example, the Wall Street consensus estimates for FY 18 non-GAAP earnings is $4.44 compared to K guidance of $4.47 at midpoint. We believe this suggests analysts are not accounting for a range of one-time and/or unsustainable items that benefited K over the last three years. In addition, only 1 out of 14 sell-side analysts covering K have discussed the working capital shenanigans that we presented in this report. As a result, we do not believe current estimates properly take into account the potential negative ramifications these unsustainable items may have as they unwind. Price targets and conclusion On the surface, K appears to be trading at moderate (maybe even low) valuations relative to peers and historical levels; 10.8x FY 2018 EV/EBITDA and 13.5x FY 18 P/E. However, we believe current enterprise value, EBITDA, and earnings do not reflect the true costs of K’s business. By adjusting these items (as we have discussed herein), our price target is $38.82 based on FY 2018 adjusted EV/adjusted EBITDA and $40.22 based on FY 2018 price/adjusted earnings. Accordingly, our blended price target is $39.52, reflecting $35.0 downside from the current price.
presciencepoint.com @presciencepoint
Kellogg Company (NYSE: K) 33
Prescience Point Estimation of Fair Value of K Shares - EV/EBITDA
($ in millions, except per share data) FY 18 EBITDA (consensus) $2,665.0 (-) "Sell-in" adjustment ($24.2) (-) Pension gain adjustments ($268.0) (-) Restructuring charges adjustment (50%) ($134.0) Prescience Point forward Adjusted EBITDA(a) $2,238.8 FY 18 EV/EBITDA consensus multiple 10.8 Enterprise value $24,178.8 Less: minority interest ($16.0)
Less: adjusted debt for enterprise value (b) ($10,855.8
) Add: cash $281.0 Equity value $13,588.0 Fully diluted shares 350.0
Price target $38.82 Current price $60.77 % Downside (36.1%)
Sources: Company 10Ks and 10Qs, FactSet, Prescience Point estimates (a) Prescience Point adjusted forward EBITDA excludes
“Extension of payment terms adjustment” to avoid double counting as “receivables sold, but still outstanding is included in adjusted debt for enterprise value.
(b) Excludes pension liability and operating leases.
presciencepoint.com @presciencepoint
Kellogg Company (NYSE: K) 34
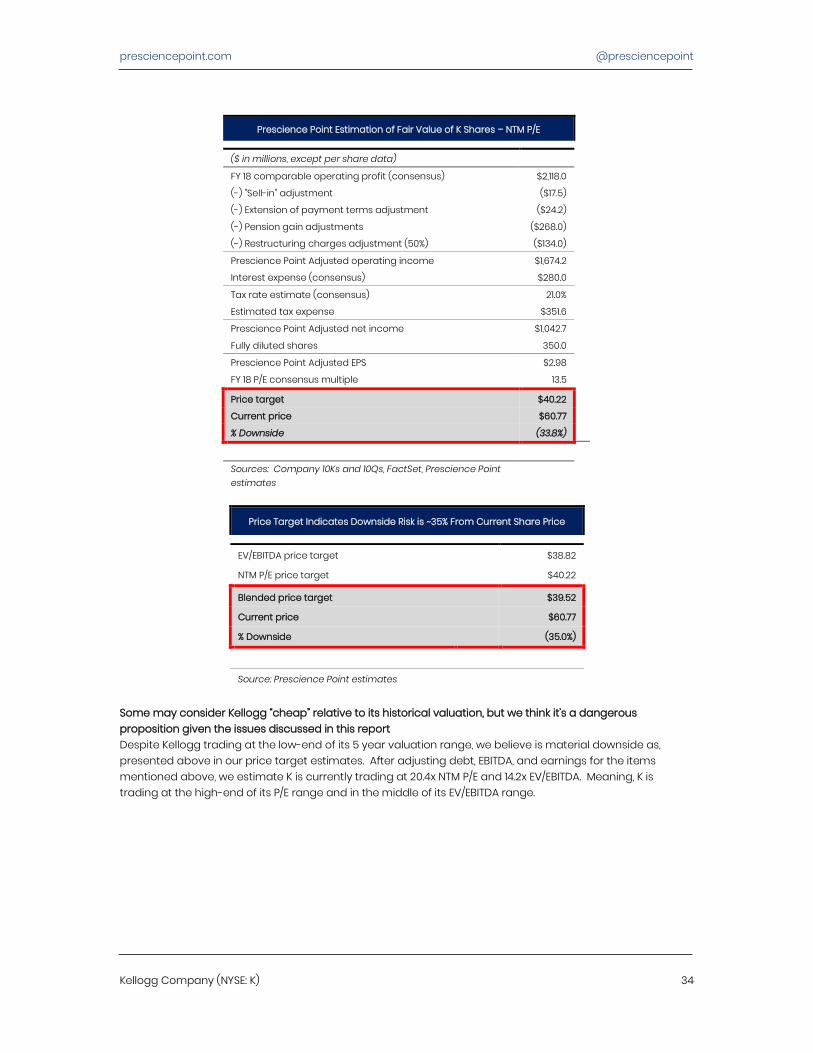
Prescience Point Estimation of Fair Value of K Shares – NTM P/E
($ in millions, except per share data)
FY 18 comparable operating profit (consensus) $2,118.0
(-) "Sell-in" adjustment ($17.5)
(-) Extension of payment terms adjustment ($24.2)
(-) Pension gain adjustments ($268.0)
(-) Restructuring charges adjustment (50%) ($134.0)
Prescience Point Adjusted operating income $1,674.2
Interest expense (consensus) $280.0
Tax rate estimate (consensus) 21.0%
Estimated tax expense $351.6
Prescience Point Adjusted net income $1,042.7
Fully diluted shares 350.0
Prescience Point Adjusted EPS $2.98
FY 18 P/E consensus multiple 13.5
Price target $40.22
Current price $60.77
% Downside (33.8%)
Sources: Company 10Ks and 10Qs, FactSet, Prescience Point estimates
Price Target Indicates Downside Risk is ~35% From Current Share Price
EV/EBITDA price target $38.82
NTM P/E price target $40.22
Blended price target $39.52
Current price $60.77
% Downside (35.0%)
Source: Prescience Point estimates
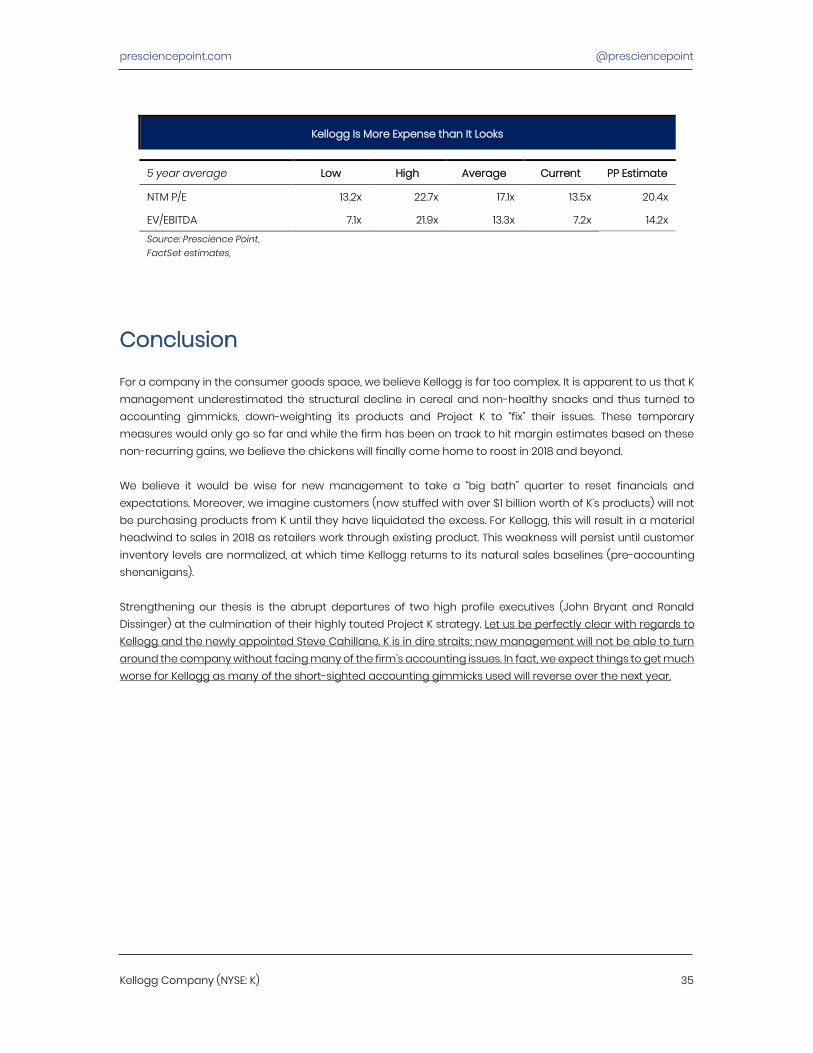
Some may consider Kellogg “cheap” relative to its historical valuation, but we think it’s a dangerous proposition given the issues discussed in this report Despite Kellogg trading at the low-end of its 5 year valuation range, we believe is material downside as, presented above in our price target estimates. After adjusting debt, EBITDA, and earnings for the items mentioned above, we estimate K is currently trading at 20.4x NTM P/E and 14.2x EV/EBITDA. Meaning, K is trading at the high-end of its P/E range and in the middle of its EV/EBITDA range.
presciencepoint.com @presciencepoint
Kellogg Company (NYSE: K) 35
Kellogg Is More Expense than It Looks
5 year average Low High Average Current PP Estimate
NTM P/E 13.2x 22.7x 17.1x 13.5x 20.4x
EV/EBITDA 7.1x 21.9x 13.3x 7.2x 14.2x Source: Prescience Point, FactSet estimates,
Conclusion
For a company in the consumer goods space, we believe Kellogg is far too complex. It is apparent to us that K management underestimated the structural decline in cereal and non-healthy snacks and thus turned to accounting gimmicks, down-weighting its products and Project K to “fix” their issues. These temporary measures would only go so far and while the firm has been on track to hit margin estimates based on these non-recurring gains, we believe the chickens will finally come home to roost in 2018 and beyond. We believe it would be wise for new management to take a “big bath” quarter to reset financials and expectations. Moreover, we imagine customers (now stuffed with over $1 billion worth of K’s products) will not be purchasing products from K until they have liquidated the excess. For Kellogg, this will result in a material headwind to sales in 2018 as retailers work through existing product. This weakness will persist until customer inventory levels are normalized, at which time Kellogg returns to its natural sales baselines (pre-accounting shenanigans). Strengthening our thesis is the abrupt departures of two high profile executives (John Bryant and Ronald Dissinger) at the culmination of their highly touted Project K strategy. Let us be perfectly clear with regards to Kellogg and the newly appointed Steve Cahillane. K is in dire straits; new management will not be able to turn around the company without facing many of the firm’s accounting issues. In fact, we expect things to get much worse for Kellogg as many of the short-sighted accounting gimmicks used will reverse over the next year.
presciencepoint.com @presciencepoint
Kellogg Company (NYSE: K) 36
Appendix
Receivable factoring agreement background
Receivable Sales Agreement (“Monetization Program”) In Q1’2016, Kellogg entered into a “Receivable Sales Agreement” whereby it could sell certain trade accounts receivable balances to a third party financial institution up to a maximum amount of $350.0 million. Amounts sold would be de-recognized from the balance sheet. In Q2’2016, the maximum amount was raised to $550.0 million. In Q4’2016, the maximum amount was raised again to $700.0 million.
During the quarter ended April 2, 2016, the Company entered into an agreement (the “Receivable Sales Agreement”), to sell, on a revolving basis, certain trade accounts receivable balances to a third party financial institution. Transfers under this agreement are accounted for as sales of receivables resulting in the receivables being de-recognized from the Consolidated Balance Sheet. The Receivable Sales Agreement provides for the continuing sale of certain receivables on a revolving basis until terminated by either party; however the maximum funding from receivables that may be sold at any time is currently $350 million. (Q1’2016 10Q) [emphasis added]
Securitization Program In Q2’2016, Kellogg established a $200.0 million accounts receivable securitization program for certain customers which will allow for extended payment terms. In Q3’2016, the program was amended to increase its capacity to $400.0 million. In Q4’2016, the program was amended again to increase its capacity to $600.0 million.
In addition to the discrete customer program above, we established a $200 million accounts receivable securitization program in July 2016 for certain customers which will allow for extended customer payment terms. (Q2’2016 10Q)
International Factoring Program In its 2016 10K, Kellogg also highlighted certain of the Company’s foreign subsidiaries would transfer accounts receivable balances of certain customers to financial institutions. However, Kellogg did not specify the maximum capacity for these foreign transfers.
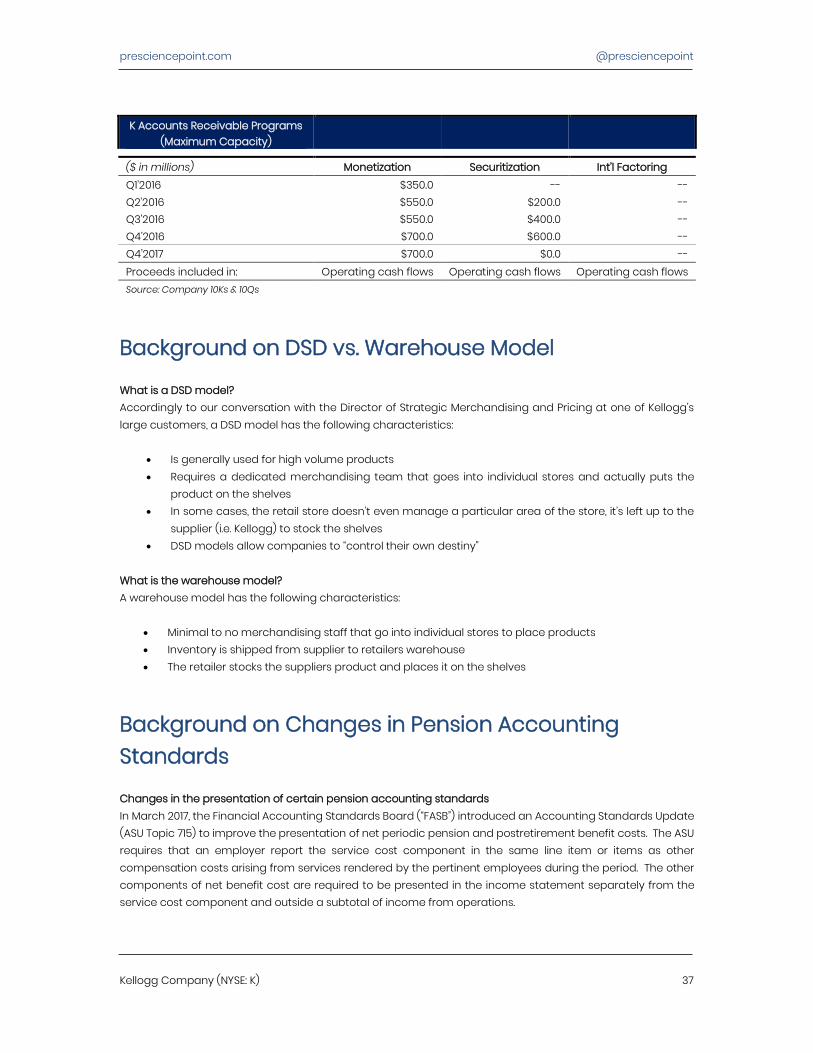
presciencepoint.com @presciencepoint
Kellogg Company (NYSE: K) 37
K Accounts Receivable Programs (Maximum Capacity)
($ in millions) Monetization Securitization Int’l Factoring Q1’2016 $350.0 -- -- Q2’2016 $550.0 $200.0 -- Q3’2016 $550.0 $400.0 -- Q4’2016 $700.0 $600.0 -- Q4’2017 $700.0 $0.0 -- Proceeds included in: Operating cash flows Operating cash flows Operating cash flows Source: Company 10Ks & 10Qs
Background on DSD vs. Warehouse Model
What is a DSD model? Accordingly to our conversation with the Director of Strategic Merchandising and Pricing at one of Kellogg’s large customers, a DSD model has the following characteristics:
• Is generally used for high volume products • Requires a dedicated merchandising team that goes into individual stores and actually puts the
product on the shelves • In some cases, the retail store doesn’t even manage a particular area of the store, it’s left up to the
supplier (i.e. Kellogg) to stock the shelves • DSD models allow companies to “control their own destiny”
What is the warehouse model? A warehouse model has the following characteristics:
• Minimal to no merchandising staff that go into individual stores to place products • Inventory is shipped from supplier to retailers warehouse • The retailer stocks the suppliers product and places it on the shelves
Background on Changes in Pension Accounting Standards
Changes in the presentation of certain pension accounting standards In March 2017, the Financial Accounting Standards Board (“FASB”) introduced an Accounting Standards Update (ASU Topic 715) to improve the presentation of net periodic pension and postretirement benefit costs. The ASU requires that an employer report the service cost component in the same line item or items as other compensation costs arising from services rendered by the pertinent employees during the period. The other components of net benefit cost are required to be presented in the income statement separately from the service cost component and outside a subtotal of income from operations.
presciencepoint.com @presciencepoint
Kellogg Company (NYSE: K) 38
© 2018 Prescience Point Capital Management. All rights reserved.
Disclaimer
This research report expresses our research opinions, which we have based upon certain facts, all of which are based upon publicly available information, and all of which are set out in this research report. Any investment involves substantial risks, including complete loss of capital. Any forecasts or estimates are for illustrative purpose only and should not be taken as limitations of the maximum possible loss or gain. Any information contained in this report may include forward looking statements, expectations, and projections. You should assume these types of statements, expectations, and projections may turn out to be incorrect for reasons beyond Prescience Point Capital Management’s (“Prescience Point”) control. This report should only be considered in its entirety. Each section should be read in the context of the entire report, and no section, paragraph, sentence or phrases is intended by its authors to stand alone or to be interpreted in isolation without reference to the rest of the report. The section headings contained in this report are for reference purposes only and may only be considered in reference to the detailed statements of opinions in their respective sections. This is not investment advice nor should it be construed as such. Use of Prescience Point’s research is at your own risk. You should do your own research and due diligence before making any investment decision with respect to securities covered herein.
You should assume that as of the publication date of any report or letter, Prescience Point (possibly along with or through our members, partners, affiliates, employees, and/or consultants) along with our clients and/or investors has a short position in all stocks (and/or are long puts/short call options of the stock) covered herein, including without limitation Kellogg Company (“K”), and therefore stands to realize significant gains in the event that the price of its stock declines. Following publication of any report or letter, we intend to continue transacting in the securities covered therein, and we may be long, short, or neutral at any time hereafter regardless of our initial recommendation.
This is not an offer to sell or a solicitation of an offer to buy any security, nor shall any security be offered or sold to any person, in any jurisdiction in which such offer would be unlawful under the securities laws of such jurisdiction.
To the best of our ability and belief, as of the date hereof, all information contained herein is accurate and reliable and does not omit to state material facts necessary to make the statements herein not misleading, and all information has been obtained from public sources we believe to be accurate and reliable, and who are not insiders or connected persons of the stock covered herein or who may otherwise owe any fiduciary duty or duty of confidentiality to the issuer, or to any other person or entity that was breached by the transmission of information to Prescience Point. However, Prescience Point recognizes that there may be non-public information in the possession of K or other insiders of K that has not been publicly disclosed by K. Therefore, such information contained herein is presented “as is,” without warranty of any kind – whether express or implied. Prescience Point makes no other representations, express or implied, as to the accuracy, timeliness, or completeness of any such information or with regard to the results to be obtained from its use.