Kellogg Company - de.marketscreener.com fileOn February 7, 2019, Kellogg Company issued a press...
29
UNITED STATES SECURITIES AND EXCHANGE COMMISSION WASHINGTON, D.C. 20549 CURRENT REPORT Pursuant to Section 13 or 15(d) of the Securities Exchange Act of 1934 Date of report (Date of earliest event reported): February 7, 2019 Kellogg Company (Exact name of registrant as specified in its charter) One Kellogg Square Battle Creek, Michigan 49016-3599 (Address of principal executive offices, including zip code) (269) 961-2000 (Registrant’s telephone number, including area code) Not Applicable (Former name or former address, if changed since last report) Check the appropriate box below if the Form 8-K filing is intended to simultaneously satisfy the filing obligation of the registrant under any of the following provisions (see General Instruction A.2 below): Section 1: 8-K (8-K) FORM 8-K Delaware 1-4171 38-0710690 (State or other jurisdiction of incorporation) (Commission File Number) (IRS Employer Identification No.) o Written communications pursuant to Rule 425 under the Securities Act (17 CFR 230.425) o Soliciting material pursuant to Rule 14a-12 under the Exchange Act (17 CFR 240.14a-12) o Pre-commencement communications pursuant to Rule 14d-2(b) under the Exchange Act (17 CFR 240.14d-2(b))
Transcript of Kellogg Company - de.marketscreener.com fileOn February 7, 2019, Kellogg Company issued a press...

UNITED STATES SECURITIES AND EXCHANGE COMMISSION
WASHINGTON, D.C. 20549
CURRENT REPORT Pursuant to Section 13 or 15(d)
of the Securities Exchange Act of 1934
Date of report (Date of earliest event reported): February 7, 2019
Kellogg Company (Exact name of registrant as specified in its charter)
One Kellogg Square Battle Creek, Michigan 49016-3599
(Address of principal executive offices, including zip code)
(269) 961-2000 (Registrant’s telephone number, including area code)
Not Applicable (Former name or former address, if changed since last report)
Check the appropriate box below if the Form 8-K filing is intended to simultaneously satisfy the filing obligation of the registrant under any of the following provisions (see General Instruction A.2 below):
Section 1: 8-K (8-K)
FORM 8-K
Delaware 1-4171 38-0710690 (State or other jurisdiction
of incorporation) (Commission File Number)
(IRS Employer Identification No.)
o Written communications pursuant to Rule 425 under the Securities Act (17 CFR 230.425)
o Soliciting material pursuant to Rule 14a-12 under the Exchange Act (17 CFR 240.14a-12)
o Pre-commencement communications pursuant to Rule 14d-2(b) under the Exchange Act (17 CFR 240.14d-2(b))

o Pre-commencement communications pursuant to Rule 13e-4(c) under the Exchange Act (17 CFR 240.13e-4(c))
Indicate by check mark whether the registrant is an emerging growth company as defined in Rule 405 of the Securities Act of 1933 (§230.405 of this chapter) or Rule 12b-2 of the Securities Exchange Act of 1934 (§240.12b-2 of this chapter).
Emerging growth company o
If an emerging growth company, indicate by check mark if the registrant has elected not to use the extended transition period for complying with any new or revised financial accounting standards provided pursuant to Section 13(a) of the Exchange
Act. o

Item 2.02. Results of Operations and Financial Condition.
The information in this Current Report, including the attached Exhibit, shall not be deemed "filed" for purposes of Section 18 of the Securities Exchange Act of 1934, as amended, nor shall it be deemed incorporated by reference into any filing under the Securities Act of 1933, except as shall be expressly set forth by specific reference in such filing. On February 7, 2019, Kellogg Company issued a press release announcing financial results for the period ended December 29, 2018, a copy of which is attached as Exhibit 99.1. Item 9.01. Financial Statements and Exhibits. (d) Exhibits. Exhibit 99.1 Press Release dated February 7, 2019

SIGNATURES
Pursuant to the requirements of the Securities Exchange Act of 1934, the registrant has duly caused this report to be signed on its behalf by the undersigned hereunto duly authorized.
(Back To Top)
Exhibit 99.1
Kellogg Company Reports 2018 Results and Issues 2019 Guidance
BATTLE CREEK, Mich. - February 7, 2019 - Kellogg Company (NYSE: K) today announced fourth quarter and full year 2018 results and issued its financial outlook for 2019. Highlights:
KELLOGG COMPANY
Date: February 7, 2019 /s/ Fareed Khan
Name: Fareed Khan
Title: Senior Vice President and Chief Financial Officer
Section 2: EX-99.1 (EXHIBIT 99.1)
Kellogg Company Financial News Release
Analyst Contact:
John Renwick, CFA (269) 961-9050
Media Contact:
Kris Bahner, (269) 961-3799
• Kellogg posted good improvement in net sales performance in 2018, both on a reported and organic basis.
• The year featured substantial investment in brands and capabilities, as well as a portfolio reshaped toward growth, resulting in improved net sales and consumption performance across brands and regions.
• Q4 results completed a year of growth in net sales, operating profit, and earnings per share.
• As previously disclosed, the Company remains in an investment phase in 2019, as it continues to invest toward
"Two Thousand Eighteen was an important year for us, in which we pivoted to growth after successfully reducing our
cost structure in recent years” said Steve Cahillane, Kellogg Company’s Chief Executive Officer. “We launched Deploy For Growth, a strategy that gives us clarity on priorities, and has us taking decisive actions to return our Company to sustainable top-line growth. We still have a lot of work to do, but we have made great strides toward reshaping our portfolio toward growth, revitalizing key brands, and developing capabilities. Our stabilization of a declining net sales trend and our improved in-market performance around the world are clear signs of this progress. This investment and progress will be evident again in 2019, setting us on a path for sustainable, profitable growth over time.”
* All guidance and goals expressed in this press release are on a currency-neutral basis, and adjusted to exclude restructuring charges, mark-to-market adjustments of pensions (service cost, interest cost, expected return on plan assets, and other net periodic pension costs are not excluded) and various financial instruments , and other costs impacting comparability. Expected net sales, margins, operating profit, operating profit margin and earnings per share are provided on this non-GAAP, currency-neutral basis only because certain information necessary to calculate such measures on a GAAP basis is unavailable, dependent on future events outside of our control and cannot be predicted without unreasonable efforts by the Company. Please refer to the "Non-GAAP Financial Measures" section included later in this press release for a further discussion of our use of non-GAAP measures, including quantification of known expected adjustment items.
1
revitalizing brands and honing capabilities to improve competitiveness.
• Kellogg issued guidance* for 2019, including currency-neutral net sales growth of 3-4%, and organic net sales growth of 1-2%; flat adjusted operating profit on a currency-neutral basis; and adjusted earnings per share decline of 5-7% on a currency-neutral basis, as it laps 2018's discrete tax benefits.
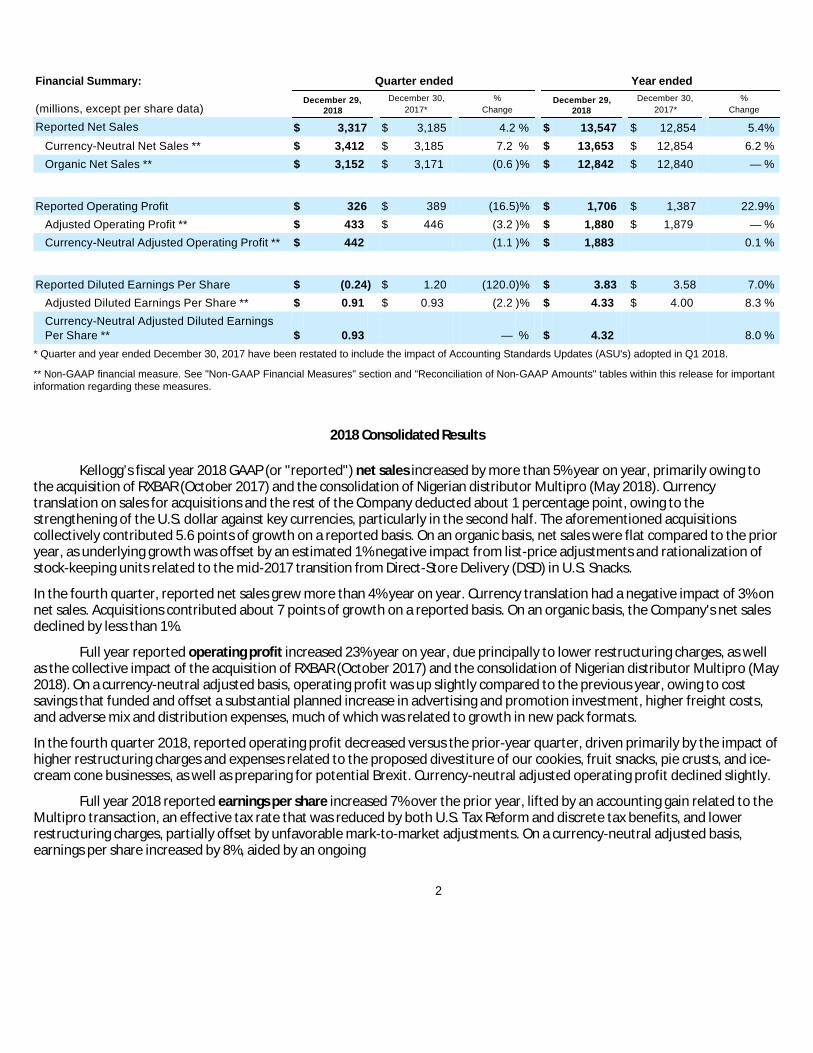
* Quarter and year ended December 30, 2017 have been restated to include the impact of Accounting Standards Updates (ASU's) adopted in Q1 2018.
** Non-GAAP financial measure. See "Non-GAAP Financial Measures" section and "Reconciliation of Non-GAAP Amounts" tables within this release for important information regarding these measures.
2018 Consolidated Results
Kellogg’s fiscal year 2018 GAAP (or "reported") net sales increased by more than 5% year on year, primarily owing to the acquisition of RXBAR (October 2017) and the consolidation of Nigerian distributor Multipro (May 2018). Currency translation on sales for acquisitions and the rest of the Company deducted about 1 percentage point, owing to the strengthening of the U.S. dollar against key currencies, particularly in the second half. The aforementioned acquisitions collectively contributed 5.6 points of growth on a reported basis. On an organic basis, net sales were flat compared to the prior year, as underlying growth was offset by an estimated 1% negative impact from list-price adjustments and rationalization of stock-keeping units related to the mid-2017 transition from Direct-Store Delivery (DSD) in U.S. Snacks.
In the fourth quarter, reported net sales grew more than 4% year on year. Currency translation had a negative impact of 3% on net sales. Acquisitions contributed about 7 points of growth on a reported basis. On an organic basis, the Company's net sales declined by less than 1%.
Full year reported operating profit increased 23% year on year, due principally to lower restructuring charges, as well as the collective impact of the acquisition of RXBAR (October 2017) and the consolidation of Nigerian distributor Multipro (May 2018). On a currency-neutral adjusted basis, operating profit was up slightly compared to the previous year, owing to cost savings that funded and offset a substantial planned increase in advertising and promotion investment, higher freight costs, and adverse mix and distribution expenses, much of which was related to growth in new pack formats.
In the fourth quarter 2018, reported operating profit decreased versus the prior-year quarter, driven primarily by the impact of higher restructuring charges and expenses related to the proposed divestiture of our cookies, fruit snacks, pie crusts, and ice-cream cone businesses, as well as preparing for potential Brexit. Currency-neutral adjusted operating profit declined slightly.
Full year 2018 reported earnings per share increased 7% over the prior year, lifted by an accounting gain related to the Multipro transaction, an effective tax rate that was reduced by both U.S. Tax Reform and discrete tax benefits, and lower restructuring charges, partially offset by unfavorable mark-to-market adjustments. On a currency-neutral adjusted basis, earnings per share increased by 8%, aided by an ongoing
2
Financial Summary: Quarter ended Year ended
(millions, except per share data) December 29,
2018 December 30,
2017* %
Change December 29,
2018 December 30,
2017* %
Change
Reported Net Sales $ 3,317 $ 3,185 4.2 % $ 13,547 $ 12,854 5.4 %
Currency-Neutral Net Sales ** $ 3,412 $ 3,185 7.2 % $ 13,653 $ 12,854 6.2 %
Organic Net Sales ** $ 3,152 $ 3,171 (0.6 )% $ 12,842 $ 12,840 — %
Reported Operating Profit $ 326 $ 389 (16.5 )% $ 1,706 $ 1,387 22.9 %
Adjusted Operating Profit ** $ 433 $ 446 (3.2 )% $ 1,880 $ 1,879 — %
Currency-Neutral Adjusted Operating Profit ** $ 442 (1.1 )% $ 1,883 0.1 %
Reported Diluted Earnings Per Share $ (0.24 ) $ 1.20 (120.0 )% $ 3.83 $ 3.58 7.0 %
Adjusted Diluted Earnings Per Share ** $ 0.91 $ 0.93 (2.2 )% $ 4.33 $ 4.00 8.3 %
Currency-Neutral Adjusted Diluted Earnings Per Share ** $ 0.93 — % $ 4.32 8.0 %

effective tax rate that was reduced by U.S. Tax Reform and by other discrete tax benefits, which more than offset the impacts of higher interest expense related to debt from recent acquisitions, and lower other income, driven mainly by a reduction in expected return on pension assets.
In the fourth quarter, earnings per share growth declined significantly on a reported basis, owing to a sharply negative swing in mark-to-market adjustments and higher restructuring charges. On a currency-neutral adjusted basis, earnings per share were flat.
2018 Business Performance
Please refer to the segment tables in the back of this document.
Kellogg Company's financial results in 2018 featured meaningful improvement in consumption and net sales performance, consistent with its stated strategy and goals. Around the world, key brands are responding positively to increased advertising and promotion investment, as well as to new pack formats designed for specific occasions and channels. In addition, net sales growth in emerging markets has accelerated, both on a reported and organic basis, reflecting the Company's expanded presence and diversified product line.
Productivity savings came in as planned, particularly the overhead reduction associated with the closing of the DSD system in U.S. Snacks. These savings helped offset rising cost pressures, particularly in transportation costs. Operating profit was held flat by a significant increase in brand-building investment across several business units, investment in new capabilities, and higher co-packing and logistics costs related to expanding into new pack formats and channels. As previously disclosed, these investments will continue into 2019, building a foundation for sustainable, profitable growth over time.
Kellogg North America’s reported net sales in 2018 increased by less than half a percent year-on-year, reflecting the positive contribution from the acquisition of RX. On an organic basis, net sales were down almost 2%, with much of the decline driven by the list-price adjustment and rationalization of stock-keeping units (SKU) related to the transition out of DSD in U.S. Snacks in mid-2017. Operating profit increased 12% on a reported basis, owing to lower restructuring charges, but declined 5% on a currency-neutral adjusted basis, primarily because of a substantial year-on-year increase in advertising and promotion investment, as well as additional costs related to expansion and accelerated growth of alternative pack formats and channels.
In the fourth quarter, net sales declined by about 2%, both on a reported and organic basis. Reported operating profit decreased sharply, on higher restructuring and expenses related to proposed divestitures. Currency-neutral adjusted-basis operating profit declined by less than 13%, due to lower net sales, mix and costs related to alternative pack formats and channels, and investment in R&D, infrastructure, and capabilities.
Specifically, by segment in Kellogg North America:
In the fourth quarter, U.S. Snacks' net sales were down 3% year on year, lapping a strong year-ago performance excluding that quarter's mechanical impact from the exit from DSD (list-price adjustment, SKU rationalization). Reported operating profit for U.S. Snacks declined 13%, on higher restructuring charges and expenses related to proposed divestitures; on a currency-neutral adjusted
3
• The U.S. Snacks segment in 2018 posted a net sales decline of nearly 5%, mostly due to the list-price adjustment and rationalization of SKUs that were related to the mid-2017 transition out of its DSD distribution system. Consumption trends improved in each of this segment's categories, with key supported brands posting consumption and share growth. Reported operating profit increased significantly year on year, owing to lower restructuring charges; currency-neutral adjusted-basis operating profit increased by nearly 7% because of reductions in overhead related to the DSD transition, which more than offset a substantial increase in advertising and promotion investment, as well as costs related to expanding into alternative pack formats and channels.

basis, operating profit declined by less than 3%, principally driven by costs related to expanding into alternative pack formats and channels.
In the fourth quarter, U.S. Morning Foods posted a net sales decline of nearly 3%, reflecting softness in the cereal category. Operating profit declined 28% on higher restructuring charges, and adjusted-basis operating profit declined by less than 12%.
In the fourth quarter, net sales for U.S. Specialty Channels declined by about 4%, lapping the year-earlier quarter's shipments related to hurricanes in the southeastern U.S. Operating profit declined 30% on a reported basis, with higher restructuring charges, and about 27% on a currency-neutral adjusted basis, reflecting primarily the change in cost allocations made this year between U.S. operating segments.
In the fourth quarter, North America Other's reported net sales increased by almost 5% year on year. The RX acquisition contributed most of the growth, with adverse currency translation offsetting organic net sales growth of almost 2%. Operating profit decreased by 25%, with higher restructuring charges and a 21% decrease in currency-neutral adjusted operating profit, driven by the impact of a product recall, a double-digit increase in brand-building, and investment in infrastructure.
Kellogg Europe in 2018 recorded an increase of almost 5% in reported net sales, reflecting favorable currency translation during the first half of the year and organic-basis net sales growth of about 3% year on year. This return to organic growth in 2018 was led by broad-based growth in Pringles, and by expansion in emerging markets like Russia and the Middle East. Reported operating profit increased by nearly 8% year on
4
• The U.S. Morning Foods segment’s net sales decreased by a little more than 2% in 2018, cutting its 2017 decline by more than half. Cereal consumption and share were impacted by category-wide softness and the mid-year supply chain disruption for Honey Smacks, which returned to shelves in the fourth quarter, but masked improving performance elsewhere in the portfolio. Of note, the Company continued to make progress toward stabilizing key health and wellness brands by emphasizing their wellness attributes, and its Core 6 brands collectively gained share in 2018. In addition, Pop-Tarts returned to consumption growth in the second half of the year. U.S. Morning Foods' operating profit declined almost 16% on a reported basis, on higher restructuring charges, and by nearly 10% on an adjusted basis, mainly due to lower net sales and adverse mix and costs related to launching new pack formats.
• The U.S. Specialty Channels segment posted a decrease in net sales of less than 1%, as it lapped shipments related to hurricanes in the southeastern U.S. during the second half of 2017. This impact was mainly in the foodservice channel, masking growth in the segment's other major channels. Operating profit declined by more than 19% on both a reported and adjusted basis, due primarily to the change in cost allocations made this year between U.S. operating segments.
• The North America Other segment, which is comprised of the U.S. Frozen Foods, Kashi, RX and Canadian businesses, increased net sales by 15% year on year, with minimal negative impact from currency translation. RX, acquired in October, 2017, sustained strong growth on expanded distribution and share, contributing almost 12 percentage points to North America Other's net sales growth. Organic-basis net sales growth in this segment was nearly 4%, led by sustained momentum in Frozen Foods and growth in Canada. North America Other’s operating profit decreased 3% on a reported basis, due to higher restructuring charges, but increased more than 1% on an currency-neutral adjusted basis, as the impact of higher sales and cost savings more than offset the impact of a double-digit increase in brand-building and investment in infrastructure.

year, aided by lower restructuring charges and favorable currency translation. On a currency-neutral adjusted basis, operating profit increased by almost 4%, reflecting growth in net sales.
In the fourth quarter, Kellogg Europe's reported net sales declined by more than 3% year on year, pulled down by more than 4% of adverse currency translation. On an organic basis, net sales were 1% higher year on year, led by wholesome snacks and Pringles. Operating profit was down almost 16% on a reported basis, driven by adverse currency translation and unusual costs related to a Brexit contingency plan for our supply chain. On a currency-neutral adjusted basis, operating profit increased by nearly 3%, mainly reflecting growth in net sales.
Kellogg Latin America's reported net sales were up less than half a percent in 2018, as adverse currency translation and a difference in shipping days largely offset organic growth of about 7%. This organic growth was driven by sustained momentum in Mexico, both in cereal and snacks, and strong growth in Mercosur, led by Parati biscuits in Brazil. Reported operating profit declined by about 5%, due to higher restructuring charges and adverse foreign currency translation; on a currency-neutral adjusted basis, operating profit increased by more than 3%, reflecting strong net sales growth.
In the fourth quarter, Kellogg Latin America's net sales declined by just under 8% on a reported basis, pulled down by adverse currency translation and a difference in shipping days. On an organic basis, net sales increased by almost 5% year on year, showing continued momentum. Operating profit increased 27% on a reported basis, despite higher restructuring charges and adverse currency translation. On a currency-neutral adjusted basis, operating profit rose more than 52%, due to increased price realization and savings.
Kellogg Asia Pacific’s reported net sales increased by more than 60%, due to the consolidation of results of rapidly expanding Multipro, and despite adverse currency translation. On an organic basis, net sales increased by 5%, an acceleration from 2017. Growth was sustained across the region, both in cereal and in snacks, and in both developed and emerging markets. Kellogg Asia Pacific recorded a nearly 51% increase in reported operating profit. Lower restructuring charges offset adverse currency translation, and currency-neutral adjusted operating profit increased by almost 52% due to the consolidation of Multipro and the impact of growth in organic-basis net sales.
In the fourth quarter, Kellogg Asia Pacific's reported net sales increased by more than 87%, driven by the consolidation of Multipro and organic-basis growth of more than 5%, and only partially offset by adverse currency translation. Reported operating profit increased by more than 84%, due to the consolidation of Multipro and strong legacy-business growth; on a currency-neutral adjusted basis, the region's operating profit increased by 78%.
2019 Guidance
The Company issued financial guidance for 2019, with more detail than provided at its November, 2018, investor event. Proposed divestiture of cookies, fruit snacks, pie crusts, and ice-cream cones is not reflected in the guidance metrics. Specifically, the Company is projecting the following for 2019:
5
• Net sales to increase +3-4% on a currency-neutral basis. This includes 4 months of impact from the Multipro consolidation, and an improved organic growth rate of +1-2%. The Company expects gradual improvement over the course of the year with balanced contributions from volume and price/mix, driven by recent revenue-growth management actions that should help cover rising costs.
• Adjusted Operating Profit to be approximately flat on a currency-neutral basis. The Company plans another year of increased investment in packaging, advertising, and capabilities. Underlying cost inflation is expected to accelerate in 2019, but will largely be offset by productivity savings and revenue-growth management actions. Negative mix and cost impacts from the expansion of alternative pack formats and channels, particularly on-the-go offerings, will be a headwind to gross profit margin, moderating in the second half.
• Adjusted EPS to decrease by 5-7% on a currency-neutral basis. This decline reflects the lapping of 2018's discrete, one-time tax benefits, especially in the first half, and the negative impact on other

income of financial markets' decline in late 2018, which reduced the value of pension assets entering the new year.
Segment Reporting in 2019
There will be two changes to the Company's segment reporting in 2019:
•Middle East, Northern Africa, and Turkey ("MENAT"). As previously announced, the Company has decided to transfer its businesses in the Middle East, North Africa, and Turkey, out of Kellogg Europe and into Kellogg Asia Pacific, which will be renamed Kellogg Asia, Middle East & Africa ("AMEA"). This consolidates all of the Company's Africa business under a single regional management team. For the purpose of restatement, the table below provides MENAT's net sales and operating profit for the previous eight quarters.
6
• Cash Flow to be roughly flat. The positive impact of lapping 2018's voluntary pension contribution is offset by reduced cash-tax benefits and an increase in capital expenditure. The latter will support growth initiatives, including investments in capacity and technology.
• Kellogg North America. In November, 2018, the Company announced a reorganization of its Kellogg North America region. With a goal of creating more holistic visibility and decision-making across all categories, as well as to improve cross-functional integrated business planning, the reorganization included the elimination of integrated business units. As such, the North America reporting segments (i.e., U.S. Snacks, U.S. Morning Foods, U.S. Specialty Channels, and North America Other) will cease to exist, effective fiscal year 2019. This change requires no restatements of Kellogg North America's net sales and operating profit, which will continue to be reported as always. In the place of the four reporting segments under Kellogg North America, the Company will provide net sales performance figures and commentary for its major category groupings.
MENAT Transfer (to AMEA, from Europe) 2018
(millions) Q1 Q2 Q3 Q4 YR
Reported net sales $ 67 $ 62 $ 65 $ 79 $ 273 Foreign currency impact — — — — — Currency-neutral net sales $ 67 $ 62 $ 65 $ 79 $ 273
Reported operating profit $ 14 $ 10 $ 11 $ 11 $ 46 Project K and cost reduction activities — — — (7 ) (7 )
Adjusted operating profit $ 14 $ 10 $ 11 $ 18 $ 53 Foreign currency impact — — — — — Currency-neutral adjusted operating profit $ 14 $ 10 $ 11 $ 18 $ 53
MENAT Transfer (to AMEA, from Europe) 2017
(millions) Q1 Q2 Q3 Q4 YR
Reported net sales $ 66 $ 55 $ 45 $ 75 $ 241
Reported operating profit $ 16 $ 15 $ 7 $ 18 $ 56 Project K and cost reduction activities (2) — (1) — (3)
Adjusted operating profit $ 18 $ 15 $ 8 $ 18 $ 59

Conference Call / Webcast
Kellogg will host a conference call to discuss results and outlook on Thursday, February 7, 2019 at 9:30 a.m. Eastern Time. The conference call and accompanying presentation slides will be broadcast live over the Internet at http://investor.kelloggs.com. Analysts and institutional investors may participate in the Q&A session by dialing (855) 209-8258 in the U.S., and (412) 542-4104 outside of the U.S. Members of the media and the public are invited to attend in a listen-only mode. Information regarding the rebroadcast is available at http://investor.kelloggs.com.
About Kellogg Company
At Kellogg Company (NYSE: K), we strive to enrich and delight the world through foods and brands that matter. Our beloved brands include Pringles®, Cheez-It®, Keebler®, Special K®, Kellogg's Frosted Flakes®, Pop-Tarts®, Kellogg's Corn Flakes®, Rice Krispies®, Eggo®, Mini-Wheats®, Kashi®, RXBAR® and more. Net sales in 2018 were more than $13 billion, comprised principally of snacks and convenience foods like cereal and frozen foods. Kellogg brands are beloved in markets around the world. We are also a company with Heart & Soul, committed to creating three billion Better Days by 2025 through our Breakfasts for Better Days global purpose platform. Visit www.KelloggCompany.com or www.OpenforBreakfast.com.
7
Non-GAAP Financial Measures
This filing includes non-GAAP financial measures that we provide to management and investors that exclude certain items that we do not consider part of on-going operations. Items excluded from our non-GAAP financial measures are discussed in the "Significant items impacting comparability" section of this filing. Our management team consistently utilizes a combination of GAAP and non-GAAP financial measures to evaluate business results, to make decisions regarding the future direction of our business, and for resource allocation decisions, including incentive compensation. As a result, we believe the presentation of both GAAP and non-GAAP financial measures provides investors with increased transparency into financial measures used by our management team and improves investors’ understanding of our underlying operating performance and in their analysis of ongoing operating trends. All historic non-GAAP financial measures have been reconciled with the most directly comparable GAAP financial measures.
Non-GAAP financial measures used include currency-neutral and organic net sales, adjusted and currency-neutral
adjusted operating profit, adjusted and currency-neutral adjusted diluted EPS, currency-neutral adjusted gross profit, currency-neutral adjusted gross margin, and cash flow. We determine currency-neutral results by dividing or multiplying, as appropriate, the current-period local currency operating results by the currency exchange rates used to translate our financial statements in the comparable prior-year period to determine what the current period U.S. dollar operating results would have been if the currency exchange rate had not changed from the comparable prior-year period. These non-GAAP financial measures may not be comparable to similar measures used by other companies.
8
• Currency-neutral net sales and organic net sales: We adjust the GAAP financial measure to exclude the impact of foreign currency, resulting in currency-neutral net sales. In addition, we exclude the impact of acquisitions, dispositions, related integration costs, shipping day differences, and foreign currency, resulting in organic net sales. We excluded the items which we believe may obscure trends in our underlying net sales performance. By providing these non-GAAP net sales measures, management intends to provide investors with a meaningful, consistent comparison of net sales performance for the Company and each of our reportable segments for the periods presented. Management uses these non-GAAP measures to evaluate the effectiveness of initiatives behind net sales growth, pricing realization, and the impact of mix on our business results. These non-GAAP measures are also used to make decisions regarding the future direction of our business, and for resource allocation decisions.
• Adjusted operating profit and diluted EPS: We adjust the GAAP financial measures to exclude the effect of Project K and cost reduction activities, mark-to-market adjustments for pension plans (service cost, interest cost, expected return on plan assets, and other net periodic pension costs are not excluded), commodities and certain foreign currency contracts, and other costs impacting comparability. We excluded the items which we believe may obscure trends in our underlying profitability. By providing these non-GAAP profitability measures, management intends to provide investors with a meaningful, consistent comparison of the Company's profitability measures for the periods presented. Management uses these non-GAAP financial measures to evaluate the effectiveness of initiatives intended to improve profitability, such as Project K, ZBB and Revenue Growth Management, to assess performance of newly acquired businesses, as well as to evaluate the impacts of inflationary pressures and decisions to invest in new initiatives within each of our segments.
• Currency-neutral adjusted gross profit, gross margin, operating profit, and diluted EPS: We adjust the GAAP financial measures to exclude the effect of Project K and cost reduction activities, mark-to-market adjustments for pension plans (service cost, interest cost, expected return on plan assets, and other net periodic pension costs are not excluded), commodities and certain foreign currency

contracts, other costs impacting comparability, and foreign currency, resulting in currency-neutral adjusted. We excluded the items which we believe may obscure trends in our underlying profitability. By providing these non-GAAP profitability measures, management intends to provide investors with a meaningful, consistent comparison of the Company's profitability measures for the periods presented. Management uses these non-GAAP financial measures to evaluate the effectiveness of initiatives intended to improve profitability, such as Project K, ZBB and Revenue Growth Management, to assess performance of newly acquired businesses, as well as to evaluate the impacts of inflationary pressures and decisions to invest in new initiatives within each of our segments.
These measures have not been calculated in accordance with GAAP and should not be viewed as a substitute for GAAP reporting measures.
Forward-looking guidance for currency-neutral net sales, organic net sales, currency-neutral adjusted operating profit, currency-neutral diluted EPS, and cash flow is included in this press release. Guidance for net sales excludes the impact of foreign currency translation and excludes the impact of acquisitions for organic. Guidance for operating profit excludes the impact of costs related to Project K, mark-to-market adjustments (service cost, interest cost, expected return on plan assets, and other net periodic pension costs are not excluded), other items that could affect comparability, and foreign currency translation. Guidance for earnings per share excludes the impact of costs related to Project K, mark-to-market adjustments (service cost, interest cost, expected return on plan assets, and other net periodic pension costs are not excluded), other items that could affect comparability, and foreign currency translation. We have provided these non-GAAP measures for future guidance for the same reasons that were outlined above for historical non-GAAP measures.
We are unable to reasonably estimate the potential full-year financial impact of mark-to-market adjustments because these impacts are dependent on future changes in market conditions (interest rates, return on assets, and commodity prices) or future decisions to be made by our management team and Board of Directors. Additionally, we are unable to reasonably estimate the potential full-year financial impacts of Brexit and costs associated with our business and portfolio realignment because of uncertainties in outcomes. Similarly, because of volatility in foreign exchange rates and shifts in country mix of our international earnings, we are unable to reasonably estimate the potential full-year financial impact of foreign currency translation.
9
• Adjusted effective income tax rate: We adjust the GAAP financial measures to exclude the effect of Project K and cost reduction activities, mark-to-market adjustments for pension plans (service cost, interest cost, expected return on plan assets, and other net periodic pension costs are not excluded), commodities and certain foreign currency contracts. In addition, we have excluded an adjustment for the transitional estimates related to the adoption of U.S. Tax Reform. We excluded the items which we believe may obscure trends in our pre-tax income and the related tax effect of those items on our adjusted effective income tax rate. By providing this non-GAAP measure, management intends to provide investors with a meaningful, consistent comparison of the Company's effective tax rate, excluding the pre-tax income and tax effect of the items noted above, for the periods presented. Management uses this non-GAAP measure to monitor the effectiveness of initiatives in place to optimize our global tax rate.
• Cash flow: Defined as net cash provided by operating activities reduced by expenditures for property additions. Cash flow does not represent the residual cash flow available for discretionary expenditures. We use this non-GAAP financial measure of cash flow to focus management and investors on the amount of cash available for debt repayment, dividend distributions, acquisition opportunities, and share repurchases once all of the Company’s business needs and obligations are met. Additionally, certain performance-based compensation includes a component of this non-GAAP measure.

As a result, these impacts are not included in the guidance provided. Therefore, we are unable to provide a full reconciliation of these non-GAAP measures used in our guidance without unreasonable effort as certain information necessary to calculate such measure on a GAAP basis is unavailable, dependent on future events outside of our control and cannot be predicted without unreasonable efforts by the Company.
See the table below that outlines the projected impact of certain other items that are excluded from non-GAAP guidance for 2019:
* 2019 full year guidance for net sales, operating profit, and earnings per share are provided on a non-GAAP basis only because certain information necessary to calculate such measures on a GAAP basis is unavailable, dependent on future events outside of our control and cannot be predicted without unreasonable efforts by the Company. These items for 2019 include impacts of Brexit, costs associated with the business and portfolio realignment, and mark-to-market adjustments for pension plans (service cost, interest cost, expected return on plan assets, and other net periodic pension costs are not excluded), commodities and certain foreign currency contracts. The Company is providing quantification of known adjustment items where available. ** Represents the estimated income tax effect on the reconciling items, using weighted-average statutory tax rates, depending upon the applicable jurisdiction.
Forward-Looking Statements Disclosure
This news release contains, or incorporates by reference, “forward-looking statements” with projections concerning, among other things, the Company’s efficiency-and-effectiveness program (Project K), the integration of acquired businesses, the Company’s strategy, Zero-Based Budgeting, and the Company’s sales, earnings, margin, operating profit, costs and expenditures, interest expense, tax rate, capital expenditure, dividends, cash flow, debt reduction, share repurchases, costs, charges, rates of return, brand building, ROIC, working capital, growth, new products, innovation, cost reduction projects, workforce reductions, savings, and competitive pressures. Forward-looking statements include predictions of future results or activities and may contain the words “expects,” “believes,” “should,” “will,” “anticipates,” “projects,” “estimates,” “implies,” “can,” or words or phrases of similar meaning.The Company’s actual results or activities may differ materially from these predictions. The Company’s future results could also be affected by a variety of factors, including the ability to implement Project K and zero-based budgeting as planned, whether the expected amount of costs associated with Project K will differ from forecasts, whether the Company will be able to realize the anticipated benefits from Project K and Zero-Based Budgeting in the amounts and times expected, the ability to realize the anticipated benefits and synergies from business acquisitions in the amounts and at the times expected, the impact of competitive conditions; the effectiveness of pricing, advertising, and promotional programs; the success of innovation, renovation and new product introductions; the recoverability of the carrying value of goodwill and other intangibles; the success of productivity improvements and business transitions; commodity and energy prices; transportation
10
Impact of certain items excluded from Non-GAAP guidance: Net Sales Operating
Profit Earnings Per
Share
Project K and cost restructuring activities (pre-tax) $45-55M $0.13-0.16
Income tax impact applicable to adjustments, net** $0.03-0.04
Currency-neutral adjusted guidance* 3-4% ~Flat (5)-(7)%
Acquisitions ~2%
Organic guidance 1-2%
Reconciliation of Non-GAAP amounts - Cash Flow Guidance
(billions)
Full Year 2019
Net cash provided by (used in) operating activities ~$1.5-1.6
Additions to properties ~($0.6)
Cash Flow ~$0.9-1.0

costs; labor costs; disruptions or inefficiencies in supply chain; the availability of and interest rates on short-term and long-term financing; actual market performance of benefit plan trust investments; the levels of spending on systems initiatives, properties, business opportunities, integration of acquired businesses, and other general and administrative costs; changes in consumer behavior and preferences; the effect of U.S. and foreign economic conditions on items such as interest rates, statutory tax rates, currency conversion and availability; legal and regulatory factors including changes in food safety, advertising and labeling laws and regulations; the ultimate impact of product recalls; business disruption or other losses from war, terrorist acts or political unrest; and other items.
Additional information concerning these and other factors can be found in our filings with the Securities and Exchange Commission, including our most recent Annual Report on Form 10-K, Quarterly Reports on Form 10-Q, and Current Reports on Form 8-K.
Forward-looking statements speak only as of the date they were made, and the Company undertakes no obligation to update them publicly.
[Kellogg Company Financial News]
Kellogg Company and Subsidiaries CONSOLIDATED STATEMENT OF INCOME (millions, except per share data)
* Quarter and year ended December 30, 2017 have been restated to include the impact of ASU's adopted in Q1 2018.
11
Quarter ended Year ended
(Results are unaudited) December 29,
2018 December 30,
2017* December 29,
2018 December 30,
2017*
Net sales $ 3,317 $ 3,185 $ 13,547 $ 12,854 Cost of goods sold 2,228 2,043 8,821 8,155 Selling, general and administrative expense 763 753 3,020 3,312 Operating profit 326 389 1,706 1,387 Interest expense 74 68 287 256 Other income (expense), net (359 ) 258 (90 ) 526 Income before income taxes (107 ) 579 1,329 1,657 Income taxes (25 ) 164 181 410 Earnings (loss) from unconsolidated entities — 2 196 7 Net income (loss) $ (82 ) $ 417 $ 1,344 $ 1,254 Net income (loss) attributable to noncontrolling interests 2 — 8 — Net income (loss) attributable to Kellogg Company $ (84 ) $ 417 $ 1,336 $ 1,254 Per share amounts:
Basic $ (0.24 ) $ 1.21 $ 3.85 $ 3.61 Diluted $ (0.24 ) $ 1.20 $ 3.83 $ 3.58
Average shares outstanding:
Basic 346 346 347 348
Diluted 348 347 348 350
Actual shares outstanding at period end 344 346

Kellogg Company and Subsidiaries CONSOLIDATED STATEMENT OF CASH FLOWS (millions)
Year ended
(unaudited) December 29,
2018 December 30,
2017*
Operating activities
Net income $ 1,344 $ 1,254 Adjustments to reconcile net income to operating cash flows:
Depreciation and amortization 516 481 Postretirement benefit plan expense (benefit) 170 (427)
Deferred income taxes 46 (58)
Stock compensation 59 66 Gain from unconsolidated entities, net (200) — Noncurrent income taxes payable (23) 144 Other (40) 27
Postretirement benefit plan contributions (287) (44)
Changes in operating assets and liabilities, net of acquisitions:
Trade receivables 76 (1,300)
Inventories (86) 80 Accounts payable 115 193 All other current assets and liabilities (154) (13)
Net cash provided by (used in) operating activities 1,536 403 Investing activities
Additions to properties (578) (501)
Collections of deferred purchase price on securitized trade receivables — 1,243 Acquisitions, net of cash acquired (28) (592)
Investments in unconsolidated entities (389) — Acquisition of cost method investments (8) (7)
Other 55 6
Net cash provided by (used in) investing activities (948) 149
Financing activities
Net (reductions) of notes payable (225) (68)
Issuances of long-term debt 993 1,251 Reductions of long-term debt (408) (632)
Net issuances of common stock 167 97 Common stock repurchases (320) (516)
Cash dividends (762) (736)
Other (11) — Net cash provided by (used in) financing activities (566) (604)
Effect of exchange rate changes on cash and cash equivalents 18 53 Increase (decrease) in cash and cash equivalents 40 1 Cash and cash equivalents at beginning of period 281 280 Cash and cash equivalents at end of period 321 281 Supplemental financial data:
Net cash provided by (used in) operating activities $ 1,536 $ 403 Additions to properties (578) (501)
Cash Flow (operating cash flow less property additions) (a) $ 958 $ (98)

* Year ended December 30, 2017 has been restated to include the impact of ASU's adopted in Q1 2018.
12

Kellogg Company and Subsidiaries CONSOLIDATED BALANCE SHEET (millions, except per share data)
* December 30, 2017 balances have been restated to include the impact of ASU's adopted in Q1 2018. Condensed from audited financial statements.
13
December 29,
2018 December 30,
2017
(unaudited) *
Current assets
Cash and cash equivalents $ 321 $ 281 Accounts receivable, net 1,375 1,389 Inventories, net 1,330 1,217 Other current assets 131 149 Total current assets 3,157 3,036 Property, net 3,731 3,716 Goodwill 6,050 5,504 Other intangibles, net 3,361 2,639 Investments in unconsolidated entities 413 429 Other assets 1,068 1,027 Total assets $ 17,780 $ 16,351 Current liabilities
Current maturities of long-term debt $ 510 $ 409 Notes payable 176 370 Accounts payable 2,427 2,269 Other current liabilities 1,416 1,474
Total current liabilities 4,529 4,522 Long-term debt 8,207 7,836 Deferred income taxes 730 355 Pension liability 651 839 Other liabilities 504 605 Commitments and contingencies
Equity
Common stock, $.25 par value 105 105 Capital in excess of par value 895 878 Retained earnings 7,652 7,069 Treasury stock, at cost (4,551) (4,417)
Accumulated other comprehensive income (loss) (1,500) (1,457)
Total Kellogg Company equity 2,601 2,178 Noncontrolling interests 558 16
Total equity 3,159 2,194
Total liabilities and equity $ 17,780 $ 16,351

Kellogg Company and Subsidiaries Adjustments to Reconcile Reported Results to Currency-Neutral Adjusted Results (millions, except per share data)
* Quarter and year ended December 30, 2017 have been restated to include the impact of ASU's adopted in Q1 2018. **Represents the estimated tax effect on the reconciling items, using weighted-average statutory tax rates, depending upon the applicable jurisdiction. For more information on the reconciling items in the table above, please refer to the Significant items impacting comparability section.
14
Quarter ended December 29, 2018
(Results are unaudited) Cost of
goods sold
Selling, general and
administrative expense
Operating profit
Other income (expense)
Income taxes
Earnings (loss) from
unconsolidated entities
Net income (loss)
Per share amount: Diluted
Mark-to-market (pre-tax) $ 16 $ (1) $ (15) $ (397) $ — $ — $ (412) $ (1.19)
Project K and cost reduction activities (pre-tax) 41 43 (84) — — — (84) (0.24)
Brexit impacts (pre-tax) 2 1 (3) — — — (3) (0.01)
Business and portfolio realignment (pre-tax) — 5 (5) — — — (5) (0.01)
Income tax impact applicable to adjustments, net** — — — — (108) — 108 0.31 Adoption of U.S. Tax Reform — — — — 5 — (5) (0.01)
Gain from unconsolidated entities, net — — — — — — — — Foreign currency impact (69) (17) (9) (1) (3) — (7) (0.02)
Adjustments to adjusted basis $ (10) $ 31 $ (116) $ (398) $ (106) $ — $ (408) $ (1.17)
Quarter ended December 30, 2017*
(Results are unaudited) Cost of
goods sold
Selling, general and
administrative expense
Operating profit
Other income (expense)
Income taxes
Earnings (loss) from
unconsolidated entities
Net income (loss)
Per share amount: Diluted
Mark-to-market (pre-tax) $ 19 $ (1) $ (18) $ 181 $ — $ — $ 163 $ 0.47 Project K and cost reduction activities (pre-tax) 30 9 (39) 15 — — (24) (0.07)
Income tax impact applicable to adjustments, net** — — — — 37 — (37) (0.11)
Adoption of U.S.Tax Reform — — — — 8 — (8) (0.02)
Adjustments to adjusted basis $ 49 $ 8 $ (57) $ 196 $ 45 $ — $ 94 $ 0.27
Year ended December 29, 2018
(Results are unaudited) Cost of
goods sold
Selling, general and
administrative expense
Operating profit
Other income (expense)
Income taxes
Earnings (loss) from
unconsolidated entities
Net income (loss)
Per share amount: Diluted
Mark-to-market (pre-tax) $ (6) $ (1) $ 7 $ (350) $ — $ — $ (343) $ (0.98)
Project K and cost reduction activities (pre-tax) 99 74 (173) 30 — — (143) (0.41)
Brexit impacts (pre-tax) 2 1 (3) — — — (3) (0.01)
Business and portfolio realignment (pre-tax) — 5 (5) — — — (5) (0.01)
Income tax impact applicable to adjustments, net** — — — — (109) — 109 0.30 Adoption of U.S. Tax Reform — — — — (11) — 11 0.04 Gain from unconsolidated entities, net — — — — — 200 200 0.57 Foreign currency impact (87) (16) (3) 3 (4) (1) 4 0.01 Adjustments to adjusted basis $ 8 $ 63 $ (177) $ (317) $ (124) $ 199 $ (170) $ (0.49)
Year ended December 30, 2017*
(Results are unaudited) Cost of
goods sold
Selling, general and
administrative expense
Operating profit
Other income (expense)
Income taxes
Earnings (loss) from
unconsolidated entities
Net income (loss)
Per share amount: Diluted
Mark-to-market (pre-tax) $ 79 $ 2 $ (81) $ 126 $ — $ — $ 45 $ 0.13 Project K and cost reduction activities (pre-tax) 115 296 (411) 148 — — (263) (0.75)
Income tax impact applicable to adjustments, net** — — — — (80) — 80 0.22 Adoption of U.S.Tax Reform — — — — 8 — (8) (0.02)
Adjustments to adjusted basis $ 194 $ 298 $ (492) $ 274 $ (72) $ — $ (146) $ (0.42)

Kellogg Company and Subsidiaries Reconciliation of Non-GAAP Amounts - Reported Net Sales to Organic Net Sales
* Quarter ended December 30, 2017 has been restated to include the impact of ASU's adopted in Q1 2018. For more information on the reconciling items in the table above, please refer to the Significant items impacting comparability section.
15
Quarter ended December 29, 2018
(millions) U.S.
Snacks
U.S. Morning Foods
U.S. Specialty Channels
North America Other
Total North America Europe
Latin America
Asia Pacific Corporate
Kellogg Consolidated
Reported net sales $ 713 $ 626 $ 275 $ 429 $ 2,043 $ 591 $ 237 $ 446 $ — $ 3,317 Foreign currency impact on total business (inc)/dec — — — (6) (6) (26) (17) (46) — (95)
Currency-neutral net sales $ 713 $ 626 $ 275 $ 435 $ 2,049 $ 617 $ 254 $ 492 $ — $ 3,412
Acquisitions — — — 19 19 — — 208 — 227 Foreign currency impact on acquisitions (inc)/dec — — — — — — — 33 — 33
Organic net sales $ 713 $ 626 $ 275 $ 416 $ 2,030 $ 617 $ 254 $ 251 $ — $ 3,152 Quarter ended December 30, 2017*
(millions) U.S.
Snacks
U.S. Morning Foods
U.S. Specialty Channels
North America Other
Total North America Europe
Latin America
Asia Pacific Corporate
Kellogg Consolidated
Reported net sales $ 736 $ 645 $ 286 $ 411 $ 2,078 $ 612 $ 257 $ 238 $ — $ 3,185 Shipping day differences — — — — — — 14 — — 14
Organic net sales $ 736 $ 645 $ 286 $ 411 $ 2,078 $ 612 $ 243 $ 238 $ — $ 3,171 % change - 2018 vs. 2017:
Reported growth (3.1)% (2.9)% (4.1)% 4.6 % (1.6)% (3.4)% (7.7)% 87.4 % —% 4.2 %
Foreign currency impact on total business (inc)/dec — % — % — % (1.5)% (0.3)% (4.4)% (6.5)% (19.2)% —% (3.0)%
Currency-neutral growth (3.1)% (2.9)% (4.1)% 6.1 % (1.3)% 1.0 % (1.2)% 106.6 % —% 7.2 %
Acquisitions — % — % — % 4.5 % 0.9 % — % — % 87.2 % —% 7.1 %
Shipping day differences — % — % — % — % — % — % (5.8)% — % —% (0.4)%
Foreign currency impact on acquisitions (inc)/dec — % — % — % — % — % — % — % 14.1 % —% 1.1 %
Organic growth (3.1)% (2.9)% (4.1)% 1.6 % (2.2)% 1.0 % 4.6 % 5.3 % —% (0.6)%
Volume (tonnage) (1.6)% 2.2 % (0.2)% 4.5 % —% (0.2)%
Pricing/mix (0.6)% (1.2)% 4.8 % 0.8 % —% (0.4)%

Kellogg Company and Subsidiaries Reconciliation of Non-GAAP Amounts - Reported Net Sales to Organic Net Sales
* Year ended December 30, 2017 has been restated to include the impact of ASU's adopted in Q1 2018. For more information on the reconciling items in the table above, please refer to the Significant items impacting comparability section.
16
Year ended December 29, 2018
(millions) U.S.
Snacks
U.S. Morning Foods
U.S. Specialty Channels
North America Other
Total North America Europe
Latin America
Asia Pacific Corporate
Kellogg Consolidated
Reported net sales $ 2,957 $ 2,643 $ 1,235 $ 1,853 $ 8,688 $ 2,395 $ 947 $ 1,517 $ — $ 13,547 Foreign currency impact on total business (inc)/dec — — — (3) (3) 46 (47) (102) — (106)
Currency-neutral net sales $ 2,957 $ 2,643 $ 1,235 $ 1,856 $ 8,691 $ 2,349 $ 994 $ 1,619 $ — $ 13,653
Acquisitions — — — 186 186 — — 536 — 722 Foreign currency impact on acquisitions (inc)/dec — — — — — — — 89 — 89
Organic net sales $ 2,957 $ 2,643 $ 1,235 $ 1,670 $ 8,505 $ 2,349 $ 994 $ 994 $ — $ 12,842 Year ended December 30, 2017*
(millions) U.S.
Snacks
U.S. Morning Foods
U.S. Specialty Channels
North America
Other Total North
America Europe Latin
America Asia
Pacific Corporate Kellogg
Consolidated
Reported net sales $ 3,110 $ 2,709 $ 1,242 $ 1,612 $ 8,673 $ 2,291 $ 944 $ 946 $ — $ 12,854 Shipping day differences — — — — — — 14 — — 14
Organic net sales $ 3,110 $ 2,709 $ 1,242 $ 1,612 $ 8,673 $ 2,291 $ 930 $ 946 $ — $ 12,840 % change - 2018 vs. 2017:
Reported growth (4.9)% (2.4)% (0.6)% 15.0 % 0.2 % 4.5 % 0.3 % 60.4 % —% 5.4 %
Foreign currency impact on total business (inc)/dec — % — % — % (0.2)% — % 1.9 % (5.0)% (10.7)% —% (0.8)%
Currency-neutral growth (4.9)% (2.4)% (0.6)% 15.2 % 0.2 % 2.6 % 5.3 % 71.1 % —% 6.2 %
Acquisitions — % — % — % 11.5 % 2.1 % — % — % 56.6 % —% 5.6 %
Shipping day differences — % — % — % — % — % — % (1.6)% — % —% (0.1)%
Foreign currency impact on acquisitions (inc)/dec — % — % — % — % — % — % — % 9.5 % —% 0.7 %
Organic growth (4.9)% (2.4)% (0.6)% 3.7 % (1.9)% 2.6 % 6.9 % 5.0 % —% — %
Volume (tonnage) (0.2)% 4.5 % 6.6 % 4.7 % —% 1.9 %
Pricing/mix (1.7)% (1.9)% 0.3 % 0.3 % —% (1.9)%

Kellogg Company and Subsidiaries Reconciliation of Non-GAAP Amounts - Reported Gross Profit to Currency-Neutral Adjusted Gross Profit
* Quarter and year ended December 30, 2017 have been restated to include the impact of ASU's adopted in Q1 2018. For more information on the reconciling items in the table above, please refer to the Significant items impacting comparability section.
Kellogg Company and Subsidiaries Reconciliation of Non-GAAP Amounts - Reported Gross Margin to Currency-Neutral Adjusted Gross Margin
* Quarter and year ended December 30, 2017 have been restated to include the impact of ASU's adopted in Q1 2018. For more information on the reconciling items in the table above, please refer to the Significant items impacting comparability section.
17
Quarter ended Year ended
(millions) December 29,
2018 December 30,
2017* December 29,
2018 December 30,
2017*
Reported gross profit $ 1,089 $ 1,142 $ 4,726 $ 4,699 Mark-to-market (COGS) (16) (19) 6 (79)
Project K and cost reduction activities (COGS) (41) (30) (99) (115)
Brexit impacts (2) — (2) — Foreign currency impact (26) — (19) —
Currency-neutral adjusted gross profit $ 1,174 $ 1,191 $ 4,840 $ 4,893
Quarter ended Year ended
December 29,
2018 December 30,
2017* December 29,
2018 December 30,
2017*
Reported gross margin 32.8 % 35.9 % 34.9 % 36.6 %
Mark-to-market (COGS) (0.5)% (0.6)% 0.1 % (0.6)%
Project K and cost reduction activities (COGS) (1.2)% (0.9)% (0.8)% (0.9)%
Brexit impacts (0.1)% — % — % — %
Foreign currency impact 0.2 % — % 0.1 % — %
Currency-neutral adjusted gross margin 34.4 % 37.4 % 35.5 % 38.1 %

Kellogg Company and Subsidiaries Reconciliation of Non-GAAP Amounts - Reported Operating Profit to Currency-Neutral Adjusted Operating Profit
* Quarter ended December 30, 2017 has been restated to include the impact of ASU's adopted in Q1 2018. For more information on the reconciling items in the table above, please refer to the Significant items impacting comparability section.
18
Quarter ended December 29, 2018
(millions) U.S.
Snacks
U.S. Morning Foods
U.S. Specialty Channels
North America Other
Total North America Europe
Latin America
Asia Pacific Corporate
Kellogg Consolidated
Reported operating profit $ 114 $ 78 $ 49 $ 42 $ 283 $ 52 $ 32 $ 38 $ (79) $ 326 Mark-to-market — — — — — — — — (15) (15)
Project K and cost reduction activities (15) (19) (3) (4) (41) (25) (8) (6) (4) (84)
Brexit impacts — — — — — (3) — — — (3)
Business and portfolio realignment (3) — — — (3) — — — (2) (5)
Adjusted operating profit $ 132 $ 97 $ 52 $ 46 $ 327 $ 80 $ 40 $ 44 $ (58) $ 433 Foreign currency impact — — — (2) (2) (3) (2) (4) 2 (9)
Currency-neutral adjusted operating profit $ 132 $ 97 $ 52 $ 48 $ 329 $ 83 $ 42 $ 48 $ (60) $ 442 Quarter ended December 30, 2017*
(millions) U.S.
Snacks
U.S. Morning Foods
U.S. Specialty Channels
North America Other
Total North America Europe
Latin America
Asia Pacific Corporate
Kellogg Consolidated
Reported operating profit $ 132 $ 108 $ 70 $ 56 $ 366 $ 62 $ 26 $ 20 $ (85) $ 389 Mark-to-market — — — — — — — — (18) (18)
Project K and cost reduction activities (4) (2) (1) (3) (10) (19) (2) (6) (2) (39)
Adjusted operating profit $ 136 $ 110 $ 71 $ 59 $ 376 $ 81 $ 28 $ 26 $ (65) $ 446 % change - 2018 vs. 2017:
Reported growth (13.3)% (28.1)% (30.0)% (25.2)% (22.7)% (15.5)% 27.0 % 84.4 % 5.0 % (16.5)%
Mark-to-market — % — % — % — % — % — % — % — % 3.8 % 0.1 %
Project K and cost reduction activities (8.0)% (16.3)% (3.5)% (3.1)% (8.8)% (10.9)% (17.7)% 19.9 % (4.4)% (11.5)%
Brexit impacts — % — % — % — % — % (3.4)% — % — % — % (0.7)%
Business and portfolio realignment (2.5)% — % — % — % (1.0)% — % — % — % (3.0)% (1.2)%
Adjusted growth (2.8)% (11.8)% (26.5)% (22.1)% (12.9)% (1.2)% 44.7 % 64.5 % 8.6 % (3.2)%
Foreign currency impact — % 0.1 % — % (1.5)% (0.2)% (3.9)% (7.7)% (13.5)% 0.1 % (2.1)%
Currency-neutral adjusted growth (2.8)% (11.9)% (26.5)% (20.6)% (12.7)% 2.7 % 52.4 % 78.0 % 8.5 % (1.1)%

Kellogg Company and Subsidiaries Reconciliation of Non-GAAP Amounts - Reported Operating Profit to Currency-Neutral Adjusted Operating Profit
* Year ended December 30, 2017 has been restated to include the impact of ASU's adopted in Q1 2018. For more information on the reconciling items in the table above, please refer to the Significant items impacting comparability section.
19
Year ended December 29, 2018
(millions) U.S.
Snacks
U.S. Morning Foods
U.S. Specialty Channels
North America Other
Total North America Europe
Latin America
Asia Pacific Corporate
Kellogg Consolidated
Reported operating profit $ 446 $ 478 $ 251 $ 222 $ 1,397 $ 297 $ 102 $ 128 $ (218) $ 1,706 Mark-to-market — — — — — — — — 7 7 Project K and cost reduction activities (28) (50) (4) (25) (107) (33) (15) (11) (7) (173)
Brexit impacts — — — — — (3) — — — (3)
Business and portfolio realignment (3) — — — (3) — — — (2) (5)
Adjusted operating profit $ 477 $ 528 $ 255 $ 247 $ 1,507 $ 333 $ 117 $ 139 $ (216) $ 1,880 Foreign currency impact — — — (2) (2) 6 (3) (7) 3 (3)
Currency-neutral adjusted operating profit $ 477 $ 528 $ 255 $ 249 $ 1,509 $ 327 $ 120 $ 146 $ (219) $ 1,883 Year ended December 30, 2017*
(millions) U.S.
Snacks
U.S. Morning Foods
U.S. Specialty Channels
North America Other
Total North America Europe
Latin America
Asia Pacific Corporate
Kellogg Consolidated
Reported operating profit $ 138 $ 567 $ 312 $ 229 $ 1,246 $ 276 $ 108 $ 84 $ (327) $ 1,387 Mark-to-market — — — — — — — — (81) (81)
Project K and cost reduction activities (309) (18) (2) (16) (345) (40) (8) (11) (7) (411)
Adjusted operating profit $ 447 $ 585 $ 314 $ 245 $ 1,591 $ 316 $ 116 $ 95 $ (239) $ 1,879 % change - 2018 vs. 2017:
Reported growth 224.4 % (15.7)% (19.8)% (3.0)% 12.1 % 7.8 % (5.2)% 50.7 % 33.1 % 22.9 %
Mark-to-market — % — % — % — % — % — % — % — % 25.2 % 7.3 %
Project K and cost reduction activities 218.3 % (6.0)% (0.7)% (3.9)% 17.6 % 3.1 % (5.6)% 6.1 % (0.5)% 16.1 %
Brexit impacts — % — % — % — % — % (0.9)% — % — % — % (0.2)%
Business and portfolio realignment (0.8)% — % — % — % (0.2)% — % — % — % (0.8)% (0.3)%
Adjusted growth 6.9 % (9.7)% (19.1)% 0.9 % (5.3)% 5.6 % 0.4 % 44.6 % 9.2 % — %
Foreign currency impact — % — % — % (0.4)% (0.1)% 1.9 % (2.8)% (7.2)% 0.6 % (0.1)%
Currency-neutral adjusted growth 6.9 % (9.7)% (19.1)% 1.3 % (5.2)% 3.7 % 3.2 % 51.8 % 8.6 % 0.1 %

Kellogg Company and Subsidiaries Reconciliation of Non-GAAP Amounts - Reported Effective Tax Rate to Adjusted Effective Tax Rate
* Year ended ended December 30, 2017 has been restated to include the impact of ASU's adopted in Q1 2018. For more information on the reconciling items in the table above, please refer to the Significant items impacting comparability section.
20
Year ended
December 29,
2018 December 30,
2017*
Reported effective tax rate 13.6 % 24.8 %
Mark-to-market (1.7)% (0.3)%
Project K and cost reduction activities (0.6)% (1.1)%
Adoption of U.S. Tax Reform (0.6)% 0.4 %
Adjusted effective tax rate 16.5 % 25.8 %

Kellogg Company and Subsidiaries Reconciliation of Non-GAAP Amounts - Reported Diluted Earnings Per Share to Currency-Neutral Adjusted Diluted Earnings Per Share
* Quarter and year ended December 30, 2017 have been restated to include the impact of ASU's adopted in Q1 2018. ** Represents the estimated income tax effect on the reconciling items, using weighted-average statutory tax rates, depending upon the applicable jurisdiction. For more information on the reconciling items in the table above, please refer to the Significant items impacting comparability section.
21
Quarter ended Year ended
December 29,
2018 December 30,
2017* December 29,
2018 December 30,
2017*
Reported EPS $ (0.24) $ 1.20 $ 3.83 $ 3.58 Mark-to-market (pre-tax) (1.19) 0.47 (0.98) 0.13 Project K and cost reduction activities (pre-tax) (0.24) (0.07) (0.41) (0.75)
Brexit impacts (pre-tax) (0.01) — (0.01) — Business and portfolio realignment (pre-tax) (0.01) — (0.01) — Income tax impact applicable to adjustments, net** 0.31 (0.11) 0.30 0.22 Adoption of U.S. Tax Reform (0.01) (0.02) 0.04 (0.02)
Gain from unconsolidated entities, net — — 0.57 — Adjusted EPS $ 0.91 $ 0.93 $ 4.33 $ 4.00 Foreign currency impact (0.02) 0.01
Currency-neutral adjusted EPS $ 0.93 $ 0.93 $ 4.32 $ 4.00

Kellogg Company and Subsidiaries Reconciliation of Non-GAAP Amounts - Reported Cash Flow to Kellogg Defined Cash Flow
(a) Cash flow is defined as net cash provided by operating activities less capital expenditures. We use this non-GAAP financial measure to focus management and investors on the amount of cash available for debt repayment, dividend distributions, acquisition opportunities and share repurchase. * Year ended December 30, 2017 has been restated to include the impact of ASU's adopted in Q1 2018.
22
Year ended
(millions, unaudited) December 29,
2018 December 30,
2017*
Operating activities
Net Income $ 1,344 $ 1,254 Adjustments to reconcile net income to operating cash flows:
Depreciation and amortization 516 481 Postretirement benefit plan expense (benefit) 170 (427)
Deferred income taxes 46 (58)
Stock compensation 59 66 Gain from unconsolidated entities, net (200) — Noncurrent income taxes payable (23) 144 Other (40) 27 Postretirement benefit plan contributions (287) (44)
Changes in operating assets and liabilities, net of acquisitions:
Trade receivables 76 (1,300)
Inventories (86) 80 Accounts payable 115 193 All other current assets and liabilities (154) (13)
Net cash provided by (used in) operating activities 1,536 403 Less:
Additions to properties (578) (501)
Cash flow (operating cash flow less property additions) (a) $ 958 $ (98)

Significant items impacting comparability
Mark-to-market accounting for pension plans, commodities and certain foreign currency contracts We recognize mark-to-market adjustments for pension plans, commodity contracts, and certain foreign currency contracts as incurred. Actuarial gains/losses for pension plans were recognized in the year they occur. Changes between contract and market prices for commodities contracts and certain foreign currency contracts result in gains/losses that were recognized in the quarter they occur. We recorded a pre-tax mark-to-market charge of $412 million and $343 million for the quarter and year-to-date periods ended December 29, 2018. We recorded a pre-tax mark-to-market benefit of $163 million and $45 million for the quarter and year-to-date periods ended December 30, 2017, respectively. Included within the aforementioned totals was a pre-tax mark-to-market charge for pension plans of $397 million and $335 million for the quarter and year-to-date periods ended December 29, 2018, respectively, and a pre-tax mark-to-market benefit of $159 million and $86 million for the quarter and year-to-date periods ended December 30, 2017, respectively. Project K and cost reduction activities Project K continued generating savings used to invest in key strategic areas of focus for the business and drove growth in the business. We recorded pre-tax charges related to this program of $84 million and $143 million for the quarter and year-to-date periods ended December 29, 2018, respectively. We also recorded pre-tax charges related to this program of $24 million and $263 million for the quarter and year-to-date periods ended December 30, 2017, respectively. Brexit impacts With the uncertainty of the United Kingdom (U.K.) exiting the European Union (EU), commonly referred to as Brexit, we have begun preparations to proactively prepare for the potential adverse impacts of Brexit, such as delays at ports of entry and departure. As a result, we incurred pre-tax charges of $3 million for the quarter and year-to-date periods ended December 29, 2018. Business and portfolio realignment Up front and/or one-time costs related to: pending and prospective divestitures and acquisitions, including our previously announced proposed divestiture of our cookies, fruit snacks, pie crusts, and ice-cream cone businesses; reorganizations in support of our Deploy for Growth priorities and a reshaped portfolio; and consulting investments in enhancing capabilities prioritized by our Deploy for Growth strategy. Acquisitions In October of 2017, the Company acquired Chicago Bar Company LLC manufacturer of RXBAR, a high protein snack bar made of simple ingredients. In our North America Other reportable segment, for the quarter and year-to-date periods ended December 29, 2018 the acquisition added $19 million and $186 million, respectively, in net sales that impacted the comparability of our reported results. In May of 2018, the Company acquired an incremental 1% ownership interest in Multipro, which along with concurrent changes to the shareholders' agreement, resulted in the Company now having a 51% controlling interest in and began consolidating Multipro, a leading distributor of a variety of food products in Nigeria and Ghana. In our Asia Pacific reportable segment, for the quarter and year-to-date periods ended December 29, 2018, the acquisition added $208 million and $536 million, respectively, in the net sales that impacted the comparability of our reported results. Shipping day differences In December 2017, we eliminated a one-month timing difference in reporting of financial results for the Parati Group. This update resulted in an additional month of financial results being reported in the quarter and year-to-date period ended December 30, 2017, which included $14 million of net sales that impacted the comparability of our reported results. Adoption of U.S. Tax Reform In conjunction with the adoption of U.S. Tax Reform, we updated our provisional estimates resulting in a $5 million increase to tax expense for the quarter ended December 29, 2018, and a net $11 million reduction of income tax expense for the year-to-date period ended December 29, 2018. These amounts primarily relate to the transition tax and assertion on foreign earnings. During the year ended December 30, 2017, we recorded net tax expense totaling $8 million related primarily to the remeasurement of deferred tax assets and liabilities, as well as the transition tax on foreign earnings. Gain on unconsolidated entities, net In connection with the Multipro business combination, the Company recognized a one-time, non-cash gain on the disposition of our previously held equity interest in Multipro of $245 million. Additionally, the Company exercised its call option to acquire a 50% interest in Tolaram Africa Foods, PTE LTD, a holding company with a 49% equity interest in an affiliated food manufacturer, resulting in the Company have a 24.5% interest in the affiliated food manufacturer. In conjunction with the exercise, the Company recognized a one-time, non-cash loss of $45 million, which represents an other than temporary excess of cost over fair value of the investment. These amounts were recorded within Earnings (loss) from unconsolidated entities during the second quarter of 2018.

Foreign currency translation We evaluate the operating results of our business on a currency-neutral basis. We determine currency-neutral operating results by dividing or multiplying, as appropriate, the current-period local currency operating results by the currency exchange rates used to translate our financial statements in the comparable prior-year period to determine what the current period U.S. dollar operating results would have been if the currency exchange rate had not changed from the comparable prior-year period. (Back To Top)