Kellogg Company - marketscreener.com fileKellogg Company (Exact name of registrant as specified in...
105
UNITED STATES SECURITIES AND EXCHANGE COMMISSION Washington, D.C. 20549 FORM 10-K For the Fiscal Year Ended January 2, 2010 For The Transition Period From To Commission file number 1-4171 Kellogg Company (Exact name of registrant as specified in its charter) One Kellogg Square Battle Creek, Michigan 49016-3599 (Address of Principal Executive Offices) Registrant’s telephone number: (269) 961-2000 Securities registered pursuant to Section 12(b) of the Securities Act: Securities registered pursuant to Section 12(g) of the Securities Act: None Indicate by a check mark if the registrant is a well-known seasoned issuer, as defined in Rule 405 of the Securities Act. Yes No Indicate by check mark if the registrant is not required to file reports pursuant to Section 13 or Section 15 (d) of the Act. Yes No Note — Checking the box above will not relieve any registrant required to file reports pursuant to Section 13 or 15(d) of the Exchange Act from their obligations under those Sections. Indicate by check mark whether the registrant: (1) has filed all reports required to be filed by Section 13 or 15(d) of the Securities Exchange Act of 1934 during the preceding 12 months (or for such shorter period that the registrant was required to file such reports), and (2) has been subject to such filing requirements for the past 90 days. Yes No Indicate by check mark whether the registrant has submitted electronically and posted on its website, if any, every Interactive Data File required to be submitted and posted pursuant to Rule 405 of Regulation S-T during the preceding 12 months (or for such shorter period that the registrant was required to submit and post such files). Yes No Indicate by check mark if disclosure of delinquent filers pursuant to Item 405 of Regulation S-K is not contained herein, and will not be contained, to the best of the registrant’s knowledge in definitive proxy or information statements incorporated by reference in Part III of this Form 10-K or any amendment to this Form 10-K. Indicate by check mark whether the registrant is a large accelerated filer, an accelerated filer, a non-accelerated filer or a smaller reporting company. See the definitions of “large accelerated filer,” “accelerated filer” and “smaller reporting company” in Rule 12b-2 of the Exchange Act. (Check one) Indicate by check mark whether the registrant is a shell company (as defined in Rule 12b-2 of the Act). Yes No The aggregate market value of the common stock held by non-affiliates of the registrant (assuming only for purposes of this computation that the W. K. Kellogg Foundation Trust, directors and executive officers may be affiliates) as of the close of business on July 4, 2009 was approximately $13.7 billion based on the closing price of $46.82 for one share of common stock, as reported for the New York Stock Exchange on that date. As of January 29, 2010, 380,565,213 shares of the common stock of the registrant were issued and outstanding. Parts of the registrant’s Proxy Statement for the Annual Meeting of Shareowners to be held on April 23, 2010 are incorporated by reference into Part III of this Report. ANNUAL REPORT PURSUANT TO SECTION 13 OR 15(d) OF THE SECURITIES EXCHANGE ACT OF 1934 TRANSITION REPORT PURSUANT TO SECTION 13 OR 15(d) OF THE SECURITIES EXCHANGE ACT OF 1934 Delaware 38-0710690 (State or other jurisdiction of Incorporation or organization) (I.R.S. Employer Identification No.) Title of each class: Name of each exchange on which registered: Common Stock, $.25 par value per share New York Stock Exchange Large accelerated filer Accelerated filer Non- accelerated filer Smaller reporting company
Transcript of Kellogg Company - marketscreener.com fileKellogg Company (Exact name of registrant as specified in...

UNITED STATES SECURITIES AND EXCHANGE COMMISSION Washington, D.C. 20549
FORM 10-K
For the Fiscal Year Ended January 2, 2010
For The Transition Period From To
Commission file number 1-4171
Kellogg Company
(Exact name of registrant as specified in its charter)
One Kellogg Square Battle Creek, Michigan 49016-3599
(Address of Principal Executive Offices)
Registrant’s telephone number: (269) 961-2000
Securities registered pursuant to Section 12(b) of the Securities Act:
Securities registered pursuant to Section 12(g) of the Securities Act: None
Indicate by a check mark if the registrant is a well-known seasoned issuer, as defined in Rule 405 of the Securities Act. Yes � No � Indicate by check mark if the registrant is not required to file reports pursuant to Section 13 or Section 15 (d) of the Act. Yes � No � Note — Checking the box above will not relieve any registrant required to file reports pursuant to Section 13 or 15(d) of the Exchange Act from their obligations under those
Sections. Indicate by check mark whether the registrant: (1) has filed all reports required to be filed by Section 13 or 15(d) of the Securities Exchange Act of 1934 during the preceding
12 months (or for such shorter period that the registrant was required to file such reports), and (2) has been subject to such filing requirements for the past 90 days. Yes � No �
Indicate by check mark whether the registrant has submitted electronically and posted on its website, if any, every Interactive Data File required to be submitted and posted pursuant to Rule 405 of Regulation S-T during the preceding 12 months (or for such shorter period that the registrant was required to submit and post such files). Yes � No �
Indicate by check mark if disclosure of delinquent filers pursuant to Item 405 of Regulation S-K is not contained herein, and will not be contained, to the best of the registrant’s knowledge in definitive proxy or information statements incorporated by reference in Part III of this Form 10-K or any amendment to this Form 10-K. �
Indicate by check mark whether the registrant is a large accelerated filer, an accelerated filer, a non-accelerated filer or a smaller reporting company. See the definitions of “large accelerated filer,” “accelerated filer” and “smaller reporting company” in Rule 12b-2 of the Exchange Act. (Check one)
Indicate by check mark whether the registrant is a shell company (as defined in Rule 12b-2 of the Act). Yes � No � The aggregate market value of the common stock held by non-affiliates of the registrant (assuming only for purposes of this computation that the W. K. Kellogg Foundation
Trust, directors and executive officers may be affiliates) as of the close of business on July 4, 2009 was approximately $13.7 billion based on the closing price of $46.82 for one share of common stock, as reported for the New York Stock Exchange on that date.
As of January 29, 2010, 380,565,213 shares of the common stock of the registrant were issued and outstanding. Parts of the registrant’s Proxy Statement for the Annual Meeting of Shareowners to be held on April 23, 2010 are incorporated by reference into Part III of this Report.
� � � � ANNUAL REPORT PURSUANT TO SECTION 13 OR 15(d) OF TH E SECURITIES EXCHANGE ACT OF 1934
� � � � TRANSITION REPORT PURSUANT TO SECTION 13 OR 15(d) O F THE SECURITIES EXCHANGE ACT OF 1934
Delaware 38-0710690 (State or other jurisdiction of Incorporation
or organization) (I.R.S. Employer Identification No.)
Title of each class: Name of each exchange on which registered: Common Stock, $.25 par value per share New York Stock Exchange
Large accelerated filer � Accelerated filer �
Non-accelerated filer � Smaller reporting company �

ITEM 1. BUSINESS
The Company. Kellogg Company, founded in 1906 and incorporated in Delaware in 1922, and its subsidiaries are engaged in the manufacture and marketing of ready-to-eat cereal and convenience foods.
The address of the principal business office of Kellogg Company is One Kellogg Square, P.O. Box 3599, Battle Creek, Michigan 49016-3599. Unless otherwise specified or indicated by the context, “Kellogg,” “we,” “us” and “our” refer to Kellogg Company, its divisions and subsidiaries.
Financial Information About Segments. Information on segments is located in Note 17 within Notes to the Consolidated Financial Statements.
Principal Products. Our principal products are ready-to-eat cereals and convenience foods, such as cookies, crackers, toaster pastries, cereal bars, fruit snacks, frozen waffles and veggie foods. These products were, as of February 26, 2010, manufactured by us in 18 countries and marketed in more than 180 countries. Our cereal products are generally marketed under the Kellogg’s name and are sold principally to the grocery trade through direct sales forces for resale to consumers. We use broker and distribution arrangements for certain products. We also generally use these, or similar arrangements, in less-developed market areas or in those market areas outside of our focus.
We also market cookies, crackers, and other convenience foods, under brands such as Kellogg’s, Keebler, Cheez-It, Murray, Austin and Famous Amos, to supermarkets in the United States through a direct store-door (DSD) delivery system, although other distribution methods are also used.
Additional information pertaining to the relative sales of our products for the years 2007 through 2009 is located in Note 17 within Notes to the Consolidated Financial Statements, which are included herein under Part II, Item 8.
Raw Materials. Agricultural commodities are the principal raw materials used in our products. Cartonboard, corrugated, and plastic are the principal packaging materials used by us. World supplies and prices of such commodities (which include such packaging materials) are constantly monitored, as are government trade policies. The cost of such commodities may fluctuate widely due to government policy and regulation, weather conditions, or other unforeseen circumstances. Continuous efforts are made to maintain and improve the quality and supply of such commodities for purposes of our short-term and long-term requirements.
The principal ingredients in the products produced by us in the United States include corn grits, wheat and wheat derivatives, oats, rice, cocoa and chocolate, soybeans and soybean derivatives, various fruits, sweeteners, flour, vegetable oils, dairy products, eggs, and other filling ingredients, which are obtained from various sources. Most of these commodities are purchased principally from sources in the United States.
We enter into long-term contracts for the commodities described in this section and purchase these items on the open market, depending on our view of possible price fluctuations, supply levels, and our relative negotiating power. While the cost of some of these commodities has, and may continue to, increase over time, we believe that we will be able to purchase an adequate supply of these items as needed. As further discussed herein under Part II, Item 7A, we also use commodity futures and options to hedge some of our costs.
Raw materials and packaging needed for internationally based operations are available in adequate supply and are sometimes imported from countries other than those where used in manufacturing.
Natural gas and propane are the primary sources of energy used to power processing ovens at major domestic and international facilities, although certain locations may use oil or propane on a back-up or alternative basis. In addition, considerable amounts of diesel fuel are used in connection with the distribution of our products. As further discussed herein under Part II, Item 7A, we use over-the-counter commodity price swaps to hedge some of our natural gas costs.
Trademarks and Technology. Generally, our products are marketed under trademarks we own. Our principal trademarks are our housemarks, brand names, slogans, and designs related to cereals and convenience foods manufactured and marketed by us, and we also grant licenses to third parties to use these marks on various goods. These trademarks include Kellogg’s for cereals, convenience foods and our other products, and the brand names of certain ready-to-eat cereals, including All-Bran, Apple Jacks, Bran Buds, Complete Bran Flakes, Complete Wheat Flakes, Cocoa Krispies, Cinnamon Crunch Crispix, Corn Pops, Cruncheroos, Kellogg’s Corn Flakes, Cracklin’ Oat Bran, Crispix, Froot Loops, Kellogg’s
1
PART 1.

Frosted Flakes, Frosted Mini-Wheats, Frosted Krispi es, Just Right, Kellogg’s Low Fat Granola, Mueslix, Pops, Product 19, Kellogg’s Raisin Bran, Rice Krispies, Raisin Bran C runch, Smacks/Honey Smacks, Smart Start, Special K and Special K Red Berries in the United States and elsewhere; Zucaritas, Choco Zucaritas, Crusli, Sucrilhos, Sucr ilhos Chocolate, Sucrilhos Banana, Vector, Musli, NutriDia, and Choco Krispis for cereals in Latin America; Vive and Vector in Canada; Choco Pops, Chocos, Crunch Red Nut, Frosties, Muslix, Fruit’n’ Fibre, Kellogg’s Crunchy Nut Corn Flakes, Honey Loo ps, Kellogg’s Extra, Sustain, Muslix, Country Store, Ricicles, Sm acks, Start, Pops, Optima and Tresor for cereals in Europe; and Cerola, Sultana Bran, Chex, Frosties, Goldies, Rice Bubbles , Nutri-Grain, Kellogg’s Iron Man Food, and BeBig for cereals in Asia and Australia. Additional Company trademarks are the names of certain combinations of ready-to-eat Kellogg’s cereals, including Fun Pak, Jumbo, and Variety .
Other Company brand names include Kellogg’s Corn Flake Crumbs; Croutettes for herb season stuffing mix; All-Bran, Choco Krispis, Froot Loops, NutriDia, Kuadri-Krispis, Zuc aritas, Special K, and Crusli for cereal bars, Keloketas for cookies, Komplete for biscuits; and Kaos for snacks in Mexico and elsewhere in Latin America; Pop-Tarts Pastry Swirls for toaster danish; Pop-Tarts and Pop-Tarts Snak-Stix for toaster pastries; Eggo, Special K, Froot Loops and Nutri-Grain for frozen waffles and pancakes; Rice Krispies Treats for baked snacks and convenience foods; Special K and Special K2O flavored water and flavored protein water mixes; Nutri-Grain cereal bars, Nutri-Grain yogurt bars, All-Bran bars and crackers, for convenience foods in the United States and elsewhere; K-Time, Rice Bubbles, Day Dawn, Be Natural, Sunibri te and LCMs for convenience foods in Asia and Australia; Nutri-Grain Squares, Nutri-Grain Elevenses , and Rice Krispies Squares for convenience foods in Europe; Fruit Winders for fruit snacks in the United Kingdom; Kashi and GoLean for certain cereals, nutrition bars, and mixes; TLC for granola and cereal bars, crackers and cookies; Special K and Vector for meal replacement products; Bear Naked for granola cereal, bars and trail mix and Morningstar Farms, Loma Linda, Natural Touch, Garde nburger and Worthington for certain meat and egg alternatives.
We also market convenience foods under trademarks and tradenames which include Keebler, Cheez-It, E. L. Fudge, Murray, Famous Amos, Austin, Ready Crust, Chips Deluxe, Clu b, Kellogg’s FiberPlus, Fudge Shoppe, Hi-Ho, Sunshi ne, Krispy, Mother’s, Munch’Ems, Right Bites, Sandies, Soft Bat ch, Stretch Island, Toasteds, Town House, Vienna Fi ngers, Wheatables , and Zesta . One of our subsidiaries is also the exclusive licensee of the Carr’s cracker and cookie line in the United States. Our trademarks also include logos and depictions of certain animated characters in conjunction with our products, including Snap!Crackle!Pop! for Cocoa Krispies and Rice Krispies cereals and Rice Krispies Treats convenience foods; Tony the Tiger for Kellogg’s Frosted Flakes, Zucaritas, Sucrilhos and Frosties cereals and convenience foods; Ernie Keebler for cookies, convenience foods and other products; the Hollow Tree logo for certain convenience foods; Toucan Sam for Froot Loops ; Dig ‘Em for Smacks ; Sunny for Kellogg’s Raisin Bran, Coco the Monkey for Coco Pops ; Cornelius for Kellogg’s Corn Flakes ; Melvin the Elephant for certain cereal and convenience foods; Chocos the Bear, Kobi the Bear and Sammy the Seal for certain cereal products.
The slogans The Best To You Each Morning, The Original & Best, They’re Gr-r-reat! , The Difference is K, One Bowl Stronger, Supercharged , Earn Your Stripes and Gotta Have My Pops, used in connection with our ready-to-eat cereals, along with L’ Eggo my Eggo , used in connection with our frozen waffles and pancakes, Elfin Magic , Childhood Is Calling, The Cookies in the Passionate Purple Package and Uncommonly Good used in connection with convenience food products, Seven Whole Grains on a Mission used in connection with Kashi all-natural foods and See Veggies Differently used in connection with meat and egg alternatives are also important Kellogg trademarks.
The trademarks listed above, among others, when taken as a whole, are important to our business. Certain individual trademarks are also important to our business. Depending on the jurisdiction, trademarks are generally valid as long as they are in use and/or their registrations are properly maintained and they have not been found to have become generic. Registrations of trademarks can also generally be renewed indefinitely as long as the trademarks are in use.
We consider that, taken as a whole, the rights under our various patents, which expire from time to time, are a valuable asset, but we do not believe that our businesses are materially dependent on any single patent or group of related patents. Our activities under licenses or other franchises or concessions which we hold are similarly a valuable asset, but are not believed to be material.
Seasonality. Demand for our products has generally been approximately level throughout the year, although some of our convenience foods have a bias for stronger demand in the second half of the year due to events and holidays. We also custom-bake cookies for the Girl Scouts of the U.S.A., which are principally sold in the first quarter of the year. 2

Working Capital. Although terms vary around the world and by business types, in the United States we generally have required payment for goods sold eleven or sixteen days subsequent to the date of invoice as 2% 10/net 11 or 1% 15/net 16. Receipts from goods sold, supplemented as required by borrowings, provide for our payment of dividends, repurchases of our common stock, capital expansion, and for other operating expenses and working capital needs.
Customers. Our largest customer, Wal-Mart Stores, Inc. and its affiliates, accounted for approximately 21% of consolidated net sales during 2009, comprised principally of sales within the United States. At January 2, 2010, approximately 17% of our consolidated receivables balance and 26% of our U.S. receivables balance was comprised of amounts owed by Wal-Mart Stores, Inc. and its affiliates. No other customer accounted for greater than 10% of net sales in 2009. During 2009, our top five customers, collectively, including Wal-Mart, accounted for approximately 34% of our consolidated net sales and approximately 44% of U.S. net sales. There has been significant worldwide consolidation in the grocery industry in recent years and we believe that this trend is likely to continue. Although the loss of any large customer for an extended length of time could negatively impact our sales and profits, we do not anticipate that this will occur to a significant extent due to the consumer demand for our products and our relationships with our customers. Our products have been generally sold through our own sales forces and through broker and distributor arrangements, and have been generally resold to consumers in retail stores, restaurants, and other food service establishments.
Backlog. For the most part, orders are filled within a few days of receipt and are subject to cancellation at any time prior to shipment. The backlog of any unfilled orders at January 2, 2010 and January 3, 2009 was not material to us.
Competition. We have experienced, and expect to continue to experience, intense competition for sales of all of our principal products in our major product categories, both domestically and internationally. Our products compete with advertised and branded products of a similar nature as well as unadvertised and private label products, which are typically distributed at lower prices, and generally with other food products. Principal methods and factors of competition include new product introductions, product quality, taste, convenience, nutritional value, price, advertising and promotion.
Research and Development. Research to support and expand the use of our existing products and to develop new food products is carried on at the W. K. Kellogg Institute for Food and Nutrition Research in Battle Creek, Michigan, and at other locations around the world. Our expenditures for research and development were approximately $181 million in 2009 and 2008 and $179 million in 2007.
Regulation. Our activities in the United States are subject to regulation by various government agencies, including the Food and Drug Administration, Federal Trade Commission and the Departments of Agriculture, Commerce and Labor, as well as voluntary regulation by other bodies. Various state and local agencies also regulate our activities. Other agencies and bodies outside of the United States, including those of the European Union and various countries, states and municipalities, also regulate our activities.
Environmental Matters. Our facilities are subject to various U.S. and foreign, federal, state, and local laws and regulations regarding the discharge of material into the environment and the protection of the environment in other ways. We are not a party to any material proceedings arising under these regulations. We believe that compliance with existing environmental laws and regulations will not materially affect our consolidated financial condition or our competitive position.
Employees. At January 2, 2010, we had approximately 30,900 employees.
Financial Information About Geographic Areas. Information on geographic areas is located in Note 17 within Notes to the Consolidated Financial Statements, which are included herein under Part II, Item 8.
Executive Officers. The names, ages, and positions of our executive officers (as of February 26, 2010) are listed below, together with their business experience. Executive officers are generally elected annually by the Board of Directors at the meeting immediately prior to the Annual Meeting of Shareowners.
Chairman of the Board
Mr. Jenness has been our Chairman since February 2005 and has served as a Kellogg director since 2000. From February 2005 until December 2006, he also served as our Chief Executive Officer. He was Chief Executive Officer of Integrated Merchandising Systems, LLC, a leader in outsource management of retail promotion and branded merchandising from 1997 to December 2004. He is also a director of Kimberly-Clark Corporation.
President and Chief Executive Officer
Mr. Mackay became our President and Chief Executive Officer on December 31, 2006 and has served as a Kellogg director since February 2005. Mr. Mackay joined Kellogg Australia in 1985 and held several
3
James M. Jenness 63
A. D. David Mackay 54

positions with Kellogg USA, Kellogg Australia and Kellogg New Zealand before leaving Kellogg in 1992. He rejoined Kellogg Australia in 1998 as Managing Director and was appointed Managing Director of Kellogg United Kingdom and Republic of Ireland later in 1998. He was named Senior Vice President and President, Kellogg USA in July 2000, Executive Vice President in November 2000, and President and Chief Operating Officer in September 2003. He is also a director of Fortune Brands, Inc.
Executive Vice President and Chief Operating Officer
Mr. Bryant joined Kellogg in March 1998, working in support of the global strategic planning process. He was appointed Senior Vice President and Chief Financial Officer, Kellogg USA, in August 2000, was appointed as Kellogg’s Chief Financial Officer in February 2002 and was appointed Executive Vice President later in 2002. He also assumed responsibility for the Natural and Frozen Foods Division, Kellogg USA, in September 2003. He was appointed Executive Vice President and President, Kellogg International in June 2004 and was appointed Executive Vice President and Chief Financial Officer, Kellogg Company, President, Kellogg International in December 2006. In July 2007, Mr. Bryant was appointed Executive Vice President and Chief Financial Officer, Kellogg Company, President, Kellogg North America and in August 2008, he was appointed Executive Vice President, Chief Operating Officer and Chief Financial Officer. Mr. Bryant served as Chief Financial Officer through December 2009.
Senior Vice President, Global Nutrition and Corporate Affairs, Chief Sustainability Officer
Dr. Clark has been Kellogg’s Senior Vice President of Global Nutrition and Corporate Affairs since June 2006. She joined Kellogg in 1977 and served in several roles of increasing responsibility before being appointed to Vice President, Worldwide Nutrition Marketing in 1996 and then to Senior Vice President, Nutrition and Marketing Communications, Kellogg USA in 1999. She was appointed to Vice President, Corporate and Scientific Affairs in October 2002, and to Senior Vice President, Corporate Affairs in August 2003. Her responsibilities were expanded in 2008 to include sustainability.
Senior Vice President, Kellogg Company President, Kellogg North America
Brad Davidson was appointed President, Kellogg North America in August 2008. Mr. Davidson joined Kellogg Canada as a sales representative in 1984. He held numerous positions in Canada, including manager of trade promotions, account executive, brand manager, area sales manager, director of customer marketing and category management, and director of Western Canada. Mr. Davidson transferred to Kellogg USA in 1997 as director, trade marketing. He later was promoted to Vice President, Channel Sales and Marketing and then to Vice President, National Teams Sales and Marketing. In 2000, he was promoted to Senior Vice President, Sales for the Morning Foods Division, Kellogg USA, and to Executive Vice President and Chief Customer Officer, Morning Foods Division, Kellogg USA in 2002. In June 2003, Mr. Davidson was appointed President, U.S. Snacks and promoted in August 2003 to Senior Vice President.
Senior Vice President and Chief Financial Officer
Ron Dissinger was appointed Senior Vice President and Chief Financial Officer effective January 2010. Mr. Dissinger joined Kellogg in 1987 as an accounting supervisor, and during the next 14 years served in a number of key financial leadership roles, both in the United States and Australia. In 2001, he was promoted to Vice President and Chief Financial Officer, U.S. Morning Foods. In 2004, Ron became Vice President, Corporate Financial Planning, and CFO, Kellogg International. In 2005, Ron became Vice President and CFO, Kellogg Europe and CFO, Kellogg International. In 2007, he was appointed Senior Vice President and Chief Financial Officer, Kellogg North America.
Senior Vice President, Kellogg Company Executive Vice President, Kellogg International and President, Kellogg Europe
Tim Mobsby has been Senior Vice President, Kellogg Company; Executive Vice President, Kellogg International; and President, Kellogg Europe since October 2000. Mr. Mobsby joined the company in 1982 in the United Kingdom, where he fulfilled a number of roles in the marketing area on both established brands and in new product development. From January 1988 to mid 1990, he worked in the cereal marketing group of Kellogg USA, his last position being Vice President of Marketing. From 1990 to 1993, he was President and Director General of Kellogg France & Benelux, before returning to the United Kingdom as Regional Director, Kellogg Europe and Managing Director, Kellogg Company of Great Britain Limited. He was subsequently appointed Vice President, Marketing, Innovation and Trade Strategy, Kellogg Europe. He was Vice President, Global Marketing from February to October 2000.
Senior Vice President, Kellogg Company President, Kellogg International
John A. Bryant 44
Celeste Clark 56
Bradford J. Davidson 49
Ronald L. Dissinger 51
Timothy P. Mobsby 54
Paul T. Norman 45

Paul Norman was appointed President, Kellogg International in August 2008. Mr. Norman joined Kellogg’s U.K. sales organization in 1987. He was 4

promoted to director, marketing, Kellogg de Mexico in January 1997; to Vice President, Marketing, Kellogg USA in February 1999; and to President, Kellogg Canada Inc. in December 2000. In February 2002, he was promoted to Managing Director, United Kingdom/Republic of Ireland and to Vice President in August 2003. He was appointed President, U.S. Morning Foods in September 2004. In December 2005, Mr. Norman was promoted to Senior Vice President.
Senior Vice President, General Counsel, Corporate Development and Secretary
Mr. Pilnick was appointed Senior Vice President, General Counsel and Secretary in August 2003 and assumed responsibility for Corporate Development in June 2004. He joined Kellogg as Vice President — Deputy General Counsel and Assistant Secretary in September 2000 and served in that position until August 2003. Before joining Kellogg, he served as Vice President and Chief Counsel of Sara Lee Branded Apparel and as Vice President and Chief Counsel, Corporate Development and Finance at Sara Lee Corporation.
Senior Vice President, Global Human Resources
Mr. Shuler joined Kellogg on February 18, 2010. In 2009, Mr. Shuler served as President of Core Strengths Management Consulting. From April 2008 to April 2009, he was Executive Vice President and Chief Human Resources Officer at The Walt Disney Company. Prior to that, Mr. Shuler served in progressively responsible human resources positions over a period of 23 years at Procter & Gamble Company in the United States and the United Kingdom, serving as Vice-President of the P&G Beauty global business unit from July 2001 and the Vice President of P&G Beauty and Health & Well Being global business units from July 2006 through March 2008.
Vice President and Corporate Controller
Mr. Andrews joined Kellogg Company in 1982. He served in various financial roles before relocating to China as general manager of Kellogg China in 1993. He subsequently served in several leadership innovation and finance roles before being promoted to Vice President, International Finance, Kellogg International in 2000. In 2002, he was appointed to Assistant Corporate Controller and assumed his current position in June 2004.
Availability of Reports; Website Access; Other Information. Our internet address is http://www.kelloggcompany.com. Through “Investor Relations” — “Financials” — “SEC Filings” on our home page, we make available free of charge our proxy statements, our annual report on Form 10-K, our quarterly reports on Form 10-Q, our current reports on Form 8-K, SEC Forms 3, 4 and 5 and any amendments to those reports filed or furnished pursuant to Section 13(a) or 15(d) of the Securities Exchange Act of 1934 as soon as reasonably practicable after we electronically file such material with, or furnish it to, the Securities and Exchange Commission. Our reports filed with the Securities and Exchange Commission are also made available to read and copy at the SEC’s Public Reference Room at 100 F Street, N.E., Washington, D.C. 20549. You may obtain information about the Public Reference Room by contacting the SEC at 1-800-SEC-0330. Reports filed with the SEC are also made available on its website at www.sec.gov.
Copies of the Corporate Governance Guidelines, the Charters of the Audit, Compensation and Nominating and Governance Committees of the Board of Directors, the Code of Conduct for Kellogg Company directors and Global Code of Ethics for Kellogg Company employees (including the chief executive officer, chief financial officer and corporate controller) can also be found on the Kellogg Company website. Any amendments or waivers to the Global Code of Ethics applicable to the chief executive officer, chief financial officer and corporate controller can also be found in the “Investor Relations” section of the Kellogg Company website. Shareowners may also request a free copy of these documents from: Kellogg Company, P.O. Box CAMB, Battle Creek, Michigan 49086-1986 (phone: (800) 961-1413), Investor Relations Department at that same address (phone: (269) 961-2800) or [email protected].
Forward-Looking Statements. This Report contains “forward-looking statements” with projections concerning, among other things, our strategy, financial principles, and plans; initiatives, improvements and growth; sales, gross margins, advertising, promotion, merchandising, brand building, operating profit, and earnings per share; innovation; investments; capital expenditures; asset write-offs and expenditures and costs related to productivity or efficiency initiatives; the impact of accounting changes and significant accounting estimates; our ability to meet interest and debt principal repayment obligations; minimum contractual obligations; future common stock repurchases or debt reduction; effective income tax rate; cash flow and core working capital improvements; interest expense; commodity and energy prices; and employee benefit plan costs and funding. Forward-looking statements include predictions of future results or activities and may contain the words “expect,” “believe,” “will,” “will deliver,” “anticipate,” “project,” “should,” or words or phrases of similar meaning. For example, forward-looking statements are found in this Item 1 and in several sections of Management’s Discussion and Analysis. Our actual results or activities may differ materially from these predictions. Our future results
5
Gary H. Pilnick 45
Dennis W. Shuler 54
Alan R. Andrews 54

could be affected by a variety of factors, including the impact of competitive conditions; the effectiveness of pricing, advertising, and promotional programs; the success of innovation, renovation and new product introductions; the recoverability of the carrying value of goodwill and other intangibles; the success of productivity improvements and business transitions; commodity and energy prices; labor costs; disruptions or inefficiencies in supply chain; the availability of and interest rates on short-term and long-term financing; actual market performance of benefit plan trust investments; the levels of spending on systems initiatives, properties, business opportunities, integration of acquired businesses, and other general and administrative costs; changes in consumer behavior and preferences; the effect of U.S. and foreign economic conditions on items such as interest rates, statutory tax rates, currency conversion and availability; legal and regulatory factors including changes in advertising and labeling laws and regulations; the ultimate impact of product recalls; business disruption or other losses from war, terrorist acts, or political unrest and the risks and uncertainties described in Item 1A below. Forward-looking statements speak only as of the date they were made, and we undertake no obligation to publicly update them.
ITEM 1A. RISK FACTORS
In addition to the factors discussed elsewhere in this Report, the following risks and uncertainties could materially adversely affect our business, financial condition and results of operations. Additional risks and uncertainties not presently known to us or that we currently deem immaterial also may impair our business operations and financial condition.
Our results may be materially and adversely impacted as a result of increases in the price of raw materials, including agricultural commodities, fuel and labor.
Agricultural commodities, including corn, wheat, soybean oil, sugar and cocoa, are the principal raw materials used in our products. Cartonboard, corrugated, and plastic are the principal packaging materials used by us. The cost of such commodities may fluctuate widely due to government policy and regulation, weather conditions, climate change or other unforeseen circumstances. To the extent that any of the foregoing factors affect the prices of such commodities and we are unable to increase our prices or adequately hedge against such changes in prices in a manner that offsets such changes, the results of our operations could be materially and adversely affected. In addition, we use derivatives to hedge price risk associated with forecasted purchases of raw materials. Our hedged price could exceed the spot price on the date of purchase, resulting in an unfavorable impact on both gross margin and net earnings.
Cereal processing ovens at major domestic and international facilities are regularly fueled by natural gas or propane, which are obtained from local utilities or other local suppliers. Short-term stand-by propane storage exists at several plants for use in case of interruption in natural gas supplies. Oil may also be used to fuel certain operations at various plants. In addition, considerable amounts of diesel fuel are used in connection with the distribution of our products. The cost of fuel may fluctuate widely due to economic and political conditions, government policy and regulation, war, or other unforeseen circumstances which could have a material adverse effect on our consolidated operating results or financial condition.
A shortage in the labor pool or other general inflationary pressures or changes in applicable laws and regulations could increase labor cost, which could have a material adverse effect on our consolidated operating results or financial condition.
Additionally, our labor costs include the cost of providing benefits for employees. We sponsor a number of defined benefit plans for employees in the United States and various foreign locations, including pension, retiree health and welfare, active health care, severance and other postemployment benefits. We also participate in a number of multiemployer pension plans for certain of our manufacturing locations. Our major pension plans and U.S. retiree health and welfare plans are funded with trust assets invested in a globally diversified portfolio of equity securities with smaller holdings of bonds, real estate and other investments. The annual cost of benefits can vary significantly from year to year and is materially affected by such factors as changes in the assumed or actual rate of return on major plan assets, a change in the weighted-average discount rate used to measure obligations, the rate or trend of health care cost inflation, and the outcome of collectively-bargained wage and benefit agreements.
Our operations face significant foreign currency exchange rate exposure which could negatively impact our operating results.
We hold assets and incur liabilities, earn revenue and pay expenses in a variety of currencies other than the U.S. dollar, including the British pound, euro, Australian dollar, Canadian dollar, Venezuelan bolivar fuerte, Russian ruble and Mexican peso. Because our consolidated financial statements are presented in U.S. dollars, we must translate our assets, liabilities, revenue and expenses into U.S. dollars at then-applicable exchange rates. Consequently, changes in the value of the U.S. dollar may negatively affect the value of these items in our consolidated financial statements, even if their value has not changed in their original currency.
Concerns with the safety and quality of food products could cause consumers to avoid certain food products or ingredients.
We could be adversely affected if consumers lose confidence in the safety and quality of certain food 6

products or ingredients, or the food safety system generally. Adverse publicity about these types of concerns, whether or not valid, may discourage consumers from buying our products or cause production and delivery disruptions.
If our food products become adulterated or misbranded, we might need to recall those items and may experience product liability if consumers are injured as a result.
Selling food products involves a number of legal and other risks, including product contamination, spoilage, product tampering or other adulteration. We may need to recall some of our products if they become adulterated or misbranded. We may also be liable if the consumption of any of our products causes injury, illness or death. A widespread product recall or market withdrawal could result in significant losses due to their costs, the destruction of product inventory, and lost sales due to the unavailability of product for a period of time. For example, in January 2009, we initiated a recall of certain Austin and Keebler branded peanut butter sandwich crackers and certain Famous Amos and Keebler branded peanut butter cookies as a result of potential contamination of ingredients at a supplier’s facility. The recall was expanded in late January and February to include Bear Naked , Kashi and Special K products impacted by that same supplier’s ingredients. The costs of the recall negatively impacted gross margin and operating profit in fiscal 2008 and 2009. We could also suffer losses from a significant product liability judgment against us. A significant product recall or product liability case could also result in adverse publicity, damage to our reputation, and a loss of consumer confidence in our food products, which could have a material adverse effect on our business results and the value of our brands. Moreover, even if a product liability or consumer fraud claim is meritless, does not prevail or is not pursued, the negative publicity surrounding assertions against our Company and our products or processes could adversely affect our reputation or brands.
Disruption of our supply chain could have an adverse effect on our business, financial condition and results of operations.
Our ability, including manufacturing or distribution capabilities, and that of our suppliers, business partners and contract manufacturers, to make, move and sell products is critical to our success. Damage or disruption to our or their manufacturing or distribution capabilities due to weather, natural disaster, fire or explosion, terrorism, pandemics, strikes, repairs or enhancements at our facilities, or other reasons, could impair our ability to manufacture or sell our products. Failure to take adequate steps to mitigate the likelihood or potential impact of such events, or to effectively manage such events if they occur, could adversely affect our business, financial condition and results of operations, as well as require additional resources to restore our supply chain.
Changes in tax, environmental, food quality and safety or other regulations or failure to comply with existing licensing, trade, food quality and safety and other regulations and laws could have a material adverse effect on our consolidated financial condition.
Our activities, both in and outside of the United States, are subject to regulation by various federal, state, provincial and local laws, regulations and government agencies, including the U.S. Food and Drug Administration, U.S. Federal Trade Commission, the U.S. Departments of Agriculture, Commerce and Labor, as well as similar and other authorities of the European Union, International Accords and Treaties and others, including voluntary regulation by other bodies.
The manufacturing, marketing and distribution of food products are subject to governmental regulation that is becoming increasingly burdensome. Those regulations control such matters as food quality and safety, ingredients, advertising, relations with distributors and retailers, health and safety and the environment. We are also regulated with respect to matters such as licensing requirements, trade and pricing practices, tax and environmental matters. The need to comply with new or revised tax, environmental, food quality and safety or other laws or regulations, or new or changed interpretations or enforcement of existing laws or regulations, may have a material adverse effect on our business and results of operations. Further, if we are found to be out of compliance with applicable laws and regulations in these areas, we could be subject to civil remedies, including fines, injunctions, or recalls, as well as potential criminal sanctions, any of which could have a material adverse effect on our business.
If we pursue strategic acquisitions, divestitures or joint ventures, we may not be able to successfully consummate favorable transactions or successfully integrate acquired businesses.
From time to time, we may evaluate potential acquisitions, divestitures or joint ventures that would further our strategic objectives. With respect to acquisitions, we may not be able to identify suitable candidates, consummate a transaction on terms that are favorable to us, or achieve expected returns and other benefits as a result of integration challenges. With respect to proposed divestitures of assets or businesses, we may encounter difficulty in finding acquirers or alternative exit strategies on terms that are favorable to us, which could delay the accomplishment of our strategic objectives, or our divesture activities may require us to recognize impairment charges. Companies or operations acquired or joint ventures created may not be profitable or may not achieve sales levels and profitability that justify the investments made. Our
7

corporate development activities may present financial and operational risks, including diversion of management attention from existing core businesses, integrating or separating personnel and financial and other systems, and adverse effects on existing business relationships with suppliers and customers. Future acquisitions could also result in potentially dilutive issuances of equity securities, the incurrence of debt, contingent liabilities and/or amortization expenses related to certain intangible assets and increased operating expenses, which could adversely affect our results of operations and financial condition.
Our consolidated financial results and demand for our products are dependent on the successful development of new products and processes.
There are a number of trends in consumer preferences which may impact us and the industry as a whole. These include changing consumer dietary trends and the availability of substitute products.
Our success is dependent on anticipating changes in consumer preferences and on successful new product and process development and product relaunches in response to such changes. We aim to introduce products or new or improved production processes on a timely basis in order to counteract obsolescence and decreases in sales of existing products. While we devote significant focus to the development of new products and to the research, development and technology process functions of our business, we may not be successful in developing new products or our new products may not be commercially successful. Our future results and our ability to maintain or improve our competitive position will depend on our capacity to gauge the direction of our key markets and upon our ability to successfully identify, develop, manufacture, market and sell new or improved products in these changing markets.
We operate in the highly competitive food industry.
We face competition across our product lines, including ready-to-eat cereals and convenience foods, from other companies which have varying abilities to withstand changes in market conditions. Some of our competitors have substantial financial, marketing and other resources, and competition with them in our various markets and product lines could cause us to reduce prices, increase capital, marketing or other expenditures, or lose category share, any of which could have a material adverse effect on our business and financial results. Category share and growth could also be adversely impacted if we are not successful in introducing new products.
Potential liabilities and costs from litigation could adversely affect our business.
There is no guarantee that the Company will be successful in defending itself in civil, criminal or regulatory actions, including under environmental, food quality and safety, and environmental laws and regulations, or in asserting its rights under various laws. In addition, the Company could incur substantial costs and fees in defending itself or in asserting its rights in these actions or meeting new legal requirements. The costs and other effects of potential and pending litigation and administrative actions against the Company, and new legal requirements, cannot be determined with certainty and may differ from expectations.
We have a substantial amount of indebtedness.
We have indebtedness that is substantial in relation to our shareholders’ equity. As of January 2, 2010, we had total debt of approximately $4.9 billion and total equity of $2.3 billion.
Our substantial indebtedness could have important consequences, including:
Our ability to make scheduled payments or to refinance our obligations with respect to indebtedness will depend on our financial and operating performance, which in turn, is subject to prevailing economic conditions, the availability of, and interest rates on, short-term financing, and financial, business and other factors beyond our control.
Our performance is affected by general economic and political conditions and taxation policies.
Customer and consumer demand for our products may be impacted by recession, financial and credit market disruptions, or other economic downturns in the United States or other nations. Our results in the 8
• impairing the ability to obtain additional financing for working capital, capital expenditures or general corporate purposes, particularly if the ratings assigned to our debt securities by rating organizations were revised downward.
• A downgrade in our credit ratings, particularly our short-term credit rating, would likely reduce the amount of commercial paper we could issue, increase our commercial paper borrowing costs, or both;
• restricting our flexibility in responding to changing market conditions or making us more vulnerable in the event of a general downturn in economic conditions or our business;
• requiring a substantial portion of the cash flow from operations to be dedicated to the payment of principal and interest on our debt, reducing the funds available to us for other purposes such as expansion through acquisitions, marketing spending and expansion of our product offerings; and
• causing us to be more leveraged than some of our competitors, which may place us at a competitive disadvantage.

past have been, and in the future may continue to be, materially affected by changes in general economic and political conditions in the United States and other countries, including the interest rate environment in which we conduct business, the financial markets through which we access capital and currency, political unrest and terrorist acts in the United States or other countries in which we carry on business.
The enactment of or increases in tariffs, including value added tax, or other changes in the application of existing taxes, in markets in which we are currently active or may be active in the future, or on specific products that we sell or with which our products compete, may have an adverse effect on our business or on our results of operations.
We may be unable to maintain our profit margins in the face of a consolidating retail environment. In addition, the loss of one of our largest customers could negatively impact our sales and profits.
Our largest customer, Wal-Mart Stores, Inc. and its affiliates, accounted for approximately 21% of consolidated net sales during 2009, comprised principally of sales within the United States. At January 2, 2010, approximately 17% of our consolidated receivables balance and 26% of our U.S. receivables balance was comprised of amounts owed by Wal-Mart Stores, Inc. and its affiliates. No other customer accounted for greater than 10% of net sales in 2009. During 2009, our top five customers, collectively, including Wal-Mart, accounted for approximately 34% of our consolidated net sales and approximately 44% of U.S. net sales. As the retail grocery trade continues to consolidate and mass marketers become larger, our large retail customers may seek to use their position to improve their profitability through improved efficiency, lower pricing and increased promotional programs. If we are unable to use our scale, marketing expertise, product innovation and category leadership positions to respond, our profitability or volume growth could be negatively affected. The loss of any large customer for an extended length of time could negatively impact our sales and profits.
An impairment in the carrying value of goodwill or other acquired intangibles could negatively affect our consolidated operating results and net worth.
The carrying value of goodwill represents the fair value of acquired businesses in excess of identifiable assets and liabilities as of the acquisition date. The carrying value of other intangibles represents the fair value of trademarks, trade names, and other acquired intangibles as of the acquisition date. Goodwill and other acquired intangibles expected to contribute indefinitely to our cash flows are not amortized, but must be evaluated by management at least annually for impairment. If carrying value exceeds current fair value, the intangible is considered impaired and is reduced to fair value via a charge to earnings. Events and conditions which could result in an impairment include changes in the industries in which we operate, including competition and advances in technology; a significant product liability or intellectual property claim; or other factors leading to reduction in expected sales or profitability. Should the value of one or more of the acquired intangibles become impaired, our consolidated earnings and net worth may be materially adversely affected.
As of January 2, 2010, the carrying value of intangible assets totaled approximately $5.1 billion, of which $3.6 billion was goodwill and $1.5 billion represented trademarks, tradenames, and other acquired intangibles compared to total assets of $11.2 billion and total equity of $2.3 billion.
Economic downturns could limit consumer demand for our products.
Retailers are increasingly offering private label products that compete with our products. Consumers’ willingness to purchase our products will depend upon our ability to offer products that appeal to consumers at the right price. It is also important that our products are perceived to be of a higher quality than less expensive alternatives. If the difference in quality between our products and those of store brands narrows, or if such difference in quality is perceived to have narrowed, then consumers may not buy our products. Furthermore, during periods of economic uncertainty, consumers tend to purchase more private label or other economy brands, which could reduce sales volumes of our higher margin products or there could be a shift in our product mix to our lower margin offerings. If we are not able to maintain or improve our brand image, it could have a material affect on our market share and our profitability.
We may not achieve our targeted cost savings and efficiencies from cost reduction initiatives.
Our success depends in part on our ability to be an efficient producer in a highly competitive industry. We have invested a significant amount in capital expenditures to improve our operational facilities. Ongoing operational issues are likely to occur when carrying out major production, procurement, or logistical changes and these, as well as any failure by us to achieve our planned cost savings and efficiencies, could have a material adverse effect on our business and consolidated financial position and on the consolidated results of our operations and profitability.
Technology failures could disrupt our operations and negatively impact our business.
We increasingly rely on information technology systems to process, transmit, and store electronic information. For example, our production and
9
distribution facilities and inventory management utilize information technology to increase efficiencies and limit costs. Furthermore, a significant portion of the communications between our personnel, customers, and suppliers depends on information technology. Like other companies, our information technology systems may be vulnerable to a variety of interruptions due to events beyond our control, including, but not limited to, natural disasters, terrorist attacks, telecommunications failures, computer viruses, hackers, and other security issues. We have technology security initiatives and disaster recovery plans in place or in process to mitigate our risk to these vulnerabilities, but these measures may not be adequate.
Our intellectual property rights are valuable, and any inability to protect them could reduce the value of our products and brands.
We consider our intellectual property rights, particularly and most notably our trademarks, but also including patents, trade secrets, copyrights and licensing agreements, to be a significant and valuable aspect of our business. We attempt to protect our intellectual property rights through a combination of patent, trademark, copyright and trade secret laws, as well as licensing agreements, third party nondisclosure and assignment agreements and policing of third party misuses of our intellectual property. Our failure to obtain or adequately protect our trademarks, products, new features of our products, or our technology, or any change in law or other changes that serve to lessen or remove the current legal protections of our intellectual property, may diminish our competitiveness and could materially harm our business.
We may be unaware of intellectual property rights of others that may cover some of our technology, brands or products. Any litigation regarding patents or other intellectual property could be costly and time-consuming and could divert the attention of our management and key personnel from our business operations. Third party claims of intellectual property infringement might also require us to enter into costly license agreements. We also may be subject to significant damages or injunctions against development and sale of certain products.
ITEM 1B. UNRESOLVED STAFF COMMENTS
None.
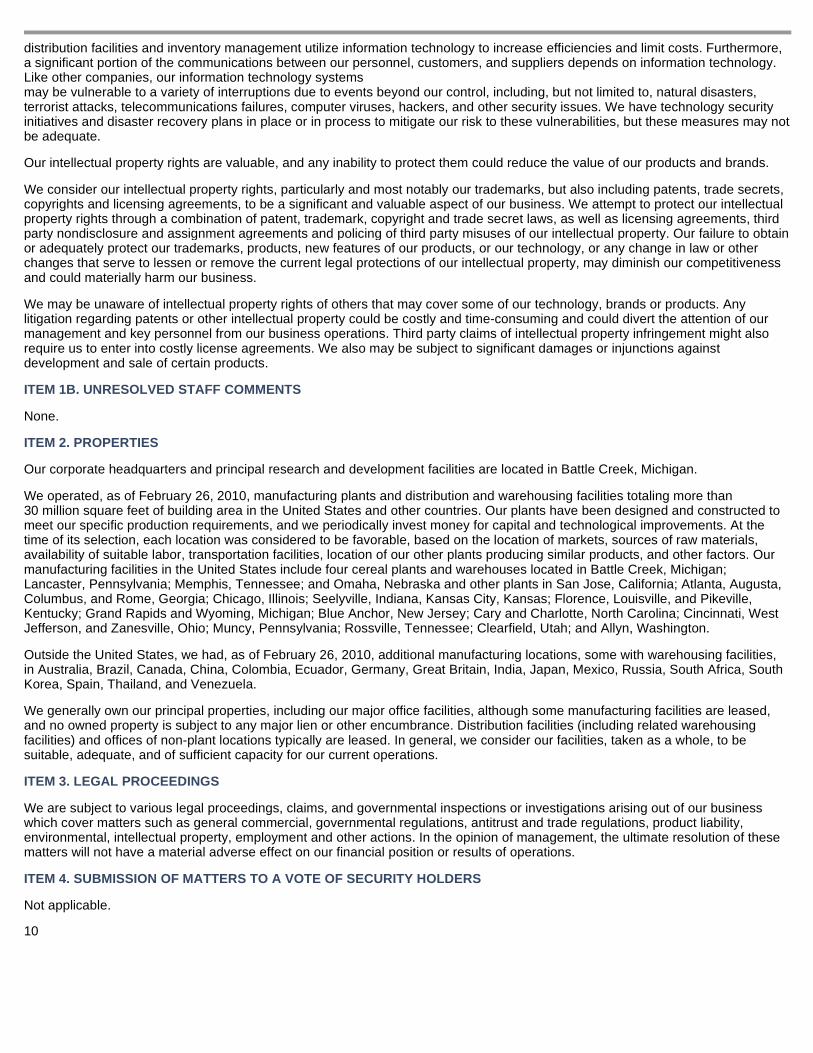
ITEM 2. PROPERTIES
Our corporate headquarters and principal research and development facilities are located in Battle Creek, Michigan.
We operated, as of February 26, 2010, manufacturing plants and distribution and warehousing facilities totaling more than 30 million square feet of building area in the United States and other countries. Our plants have been designed and constructed to meet our specific production requirements, and we periodically invest money for capital and technological improvements. At the time of its selection, each location was considered to be favorable, based on the location of markets, sources of raw materials, availability of suitable labor, transportation facilities, location of our other plants producing similar products, and other factors. Our manufacturing facilities in the United States include four cereal plants and warehouses located in Battle Creek, Michigan; Lancaster, Pennsylvania; Memphis, Tennessee; and Omaha, Nebraska and other plants in San Jose, California; Atlanta, Augusta, Columbus, and Rome, Georgia; Chicago, Illinois; Seelyville, Indiana, Kansas City, Kansas; Florence, Louisville, and Pikeville, Kentucky; Grand Rapids and Wyoming, Michigan; Blue Anchor, New Jersey; Cary and Charlotte, North Carolina; Cincinnati, West Jefferson, and Zanesville, Ohio; Muncy, Pennsylvania; Rossville, Tennessee; Clearfield, Utah; and Allyn, Washington.
Outside the United States, we had, as of February 26, 2010, additional manufacturing locations, some with warehousing facilities, in Australia, Brazil, Canada, China, Colombia, Ecuador, Germany, Great Britain, India, Japan, Mexico, Russia, South Africa, South Korea, Spain, Thailand, and Venezuela.
We generally own our principal properties, including our major office facilities, although some manufacturing facilities are leased, and no owned property is subject to any major lien or other encumbrance. Distribution facilities (including related warehousing facilities) and offices of non-plant locations typically are leased. In general, we consider our facilities, taken as a whole, to be suitable, adequate, and of sufficient capacity for our current operations.
ITEM 3. LEGAL PROCEEDINGS
We are subject to various legal proceedings, claims, and governmental inspections or investigations arising out of our business which cover matters such as general commercial, governmental regulations, antitrust and trade regulations, product liability, environmental, intellectual property, employment and other actions. In the opinion of management, the ultimate resolution of these matters will not have a material adverse effect on our financial position or results of operations.
ITEM 4. SUBMISSION OF MATTERS TO A VOTE OF SECURITY HOLDERS
Not applicable. 10

ITEM 5. MARKET FOR THE REGISTRANT’S COMMON EQUITY, RELATED STOCKHOLDER MATTERS AND ISSUER PURCHASES OF EQUITY SECURITIES
Information on the market for our common stock, number of shareowners and dividends is located in Note 16 within Notes to the Consolidated Financial Statements. On February 5, 2009, the Board of Directors authorized the repurchase of $650 million of Kellogg common stock during 2009 for general corporate purposes and to offset issuances for employee benefit programs. During the quarter ended January 2, 2010, the Company did not acquire any shares of its common stock. During 2009, the Company spent $187 million to repurchase 4 million shares. The unused portion of the 2009 authorization, amounting to $463 million, was rolled over and is available to be executed in 2010. On October 23, 2009, the Board of Directors authorized an additional stock repurchase program of up to $650 million for 2010.
11
PART II
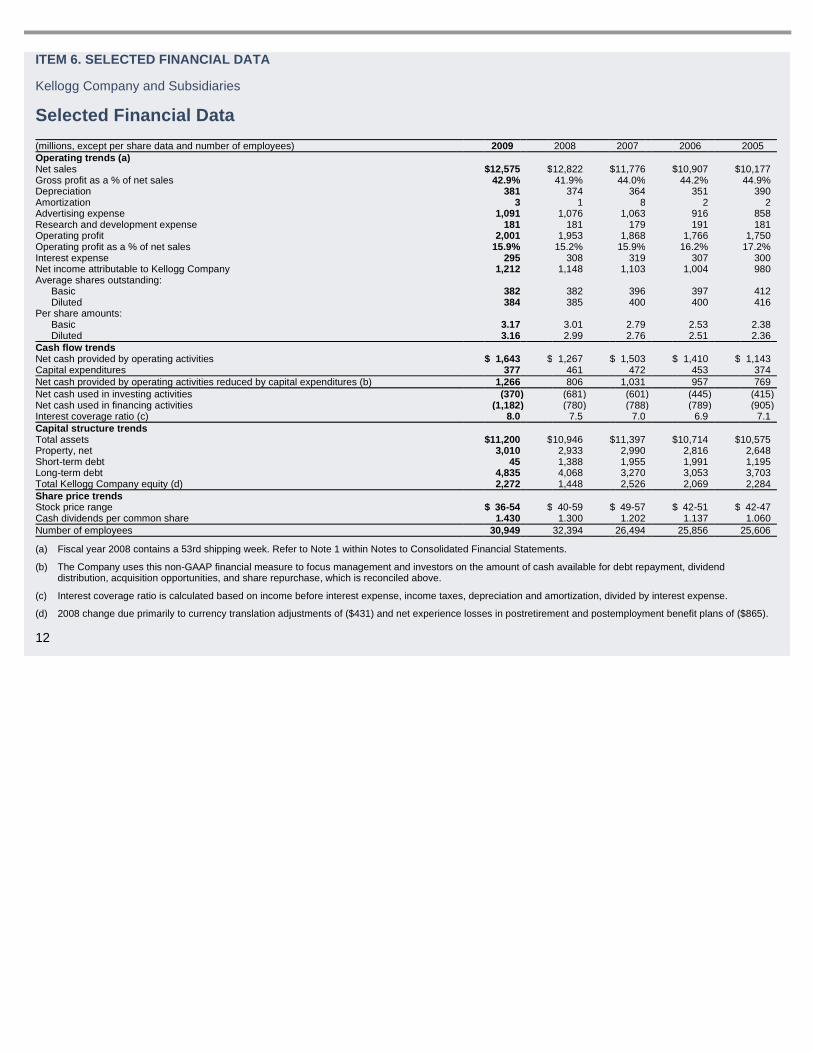
ITEM 6. SELECTED FINANCIAL DATA
Kellogg Company and Subsidiaries
Selected Financial Data
12
(millions, except per share data and number of employees) 2009 2008 2007 2006 2005 Operating trends (a) Net sales $ 12,575 $ 12,822 $ 11,776 $ 10,907 $ 10,177 Gross profit as a % of net sales 42.9% 41.9% 44.0% 44.2% 44.9% Depreciation 381 374 364 351 390 Amortization 3 1 8 2 2 Advertising expense 1,091 1,076 1,063 916 858 Research and development expense 181 181 179 191 181 Operating profit 2,001 1,953 1,868 1,766 1,750 Operating profit as a % of net sales 15.9% 15.2% 15.9% 16.2% 17.2% Interest expense 295 308 319 307 300 Net income attributable to Kellogg Company 1,212 1,148 1,103 1,004 980 Average shares outstanding:
Basic 382 382 396 397 412 Diluted 384 385 400 400 416
Per share amounts: Basic 3.17 3.01 2.79 2.53 2.38 Diluted 3.16 2.99 2.76 2.51 2.36
Cash flow trends Net cash provided by operating activities $ 1,643 $ 1,267 $ 1,503 $ 1,410 $ 1,143 Capital expenditures 377 461 472 453 374 Net cash provided by operating activities reduced by capital expenditures (b) 1,266 806 1,031 957 769 Net cash used in investing activities (370 ) (681 ) (601 ) (445 ) (415 ) Net cash used in financing activities (1,182 ) (780 ) (788 ) (789 ) (905 ) Interest coverage ratio (c) 8.0 7.5 7.0 6.9 7.1 Capital structure trends Total assets $ 11,200 $ 10,946 $ 11,397 $ 10,714 $ 10,575 Property, net 3,010 2,933 2,990 2,816 2,648 Short-term debt 45 1,388 1,955 1,991 1,195 Long-term debt 4,835 4,068 3,270 3,053 3,703 Total Kellogg Company equity (d) 2,272 1,448 2,526 2,069 2,284 Share price trends Stock price range $ 36-54 $ 40-59 $ 49-57 $ 42-51 $ 42-47 Cash dividends per common share 1.430 1.300 1.202 1.137 1.060 Number of employees 30,949 32,394 26,494 25,856 25,606
(a) Fiscal year 2008 contains a 53rd shipping week. Refer to Note 1 within Notes to Consolidated Financial Statements.
(b) The Company uses this non-GAAP financial measure to focus management and investors on the amount of cash available for debt repayment, dividend distribution, acquisition opportunities, and share repurchase, which is reconciled above.
(c) Interest coverage ratio is calculated based on income before interest expense, income taxes, depreciation and amortization, divided by interest expense.
(d) 2008 change due primarily to currency translation adjustments of ($431) and net experience losses in postretirement and postemployment benefit plans of ($865).
ITEM 7. MANAGEMENT’S DISCUSSION AND ANALYSIS OF FIN ANCIAL CONDITION AND RESULTS OF OPERATIONS
Kellogg Company and Subsidiaries
Overview The following Management’s Discussion and Analysis of Financial Condition and Results of Operations (MD&A) is intended to help the reader understand Kellogg Company, our operations and our present business environment. MD&A is provided as a supplement to, and should be read in conjunction with, our Consolidated Financial Statements and the accompanying notes thereto contained in Item 8 of this report.
Kellogg Company is the world’s leading producer of cereal and a leading producer of convenience foods, including cookies, crackers, toaster pastries, cereal bars, fruit snacks, frozen waffles, and veggie foods. Kellogg products are manufactured and marketed globally. We currently manage our operations in four geographic operating segments, comprised of North America and the three International operating segments of Europe, Latin America, and Asia Pacific.
We manage our Company for sustainable performance defined by our long-term annual growth targets. These targets are low single-digit (1 to 3%) for internal net sales, mid single-digit (4 to 6%) for internal operating profit, and high single-digit (7 to 9%) for diluted net earnings per share (EPS) on a currency neutral basis. See Foreign currency translation section for our definition of currency neutral EPS.
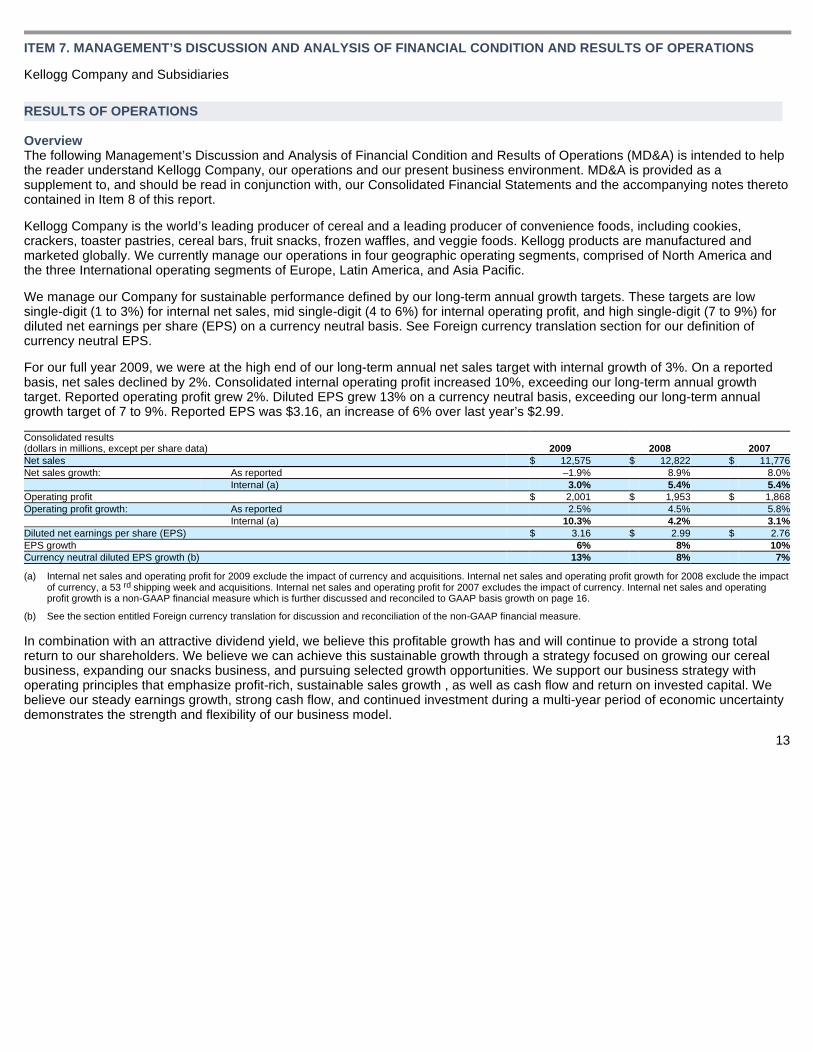
For our full year 2009, we were at the high end of our long-term annual net sales target with internal growth of 3%. On a reported basis, net sales declined by 2%. Consolidated internal operating profit increased 10%, exceeding our long-term annual growth target. Reported operating profit grew 2%. Diluted EPS grew 13% on a currency neutral basis, exceeding our long-term annual growth target of 7 to 9%. Reported EPS was $3.16, an increase of 6% over last year’s $2.99.
In combination with an attractive dividend yield, we believe this profitable growth has and will continue to provide a strong total return to our shareholders. We believe we can achieve this sustainable growth through a strategy focused on growing our cereal business, expanding our snacks business, and pursuing selected growth opportunities. We support our business strategy with operating principles that emphasize profit-rich, sustainable sales growth , as well as cash flow and return on invested capital. We believe our steady earnings growth, strong cash flow, and continued investment during a multi-year period of economic uncertainty demonstrates the strength and flexibility of our business model.
13
RESULTS OF OPERATIONS
Consolidated results (dollars in millions, except per share data) 2009 2008 2007 Net sales $ 12,575 $ 12,822 $ 11,776 Net sales growth: As reported –1.9% 8.9% 8.0% Internal (a) 3.0% 5.4% 5.4% Operating profit $ 2,001 $ 1,953 $ 1,868 Operating profit growth: As reported 2.5% 4.5% 5.8% Internal (a) 10.3% 4.2% 3.1% Diluted net earnings per share (EPS) $ 3.16 $ 2.99 $ 2.76 EPS growth 6% 8% 10% Currency neutral diluted EPS growth (b) 13% 8% 7%
(a) Internal net sales and operating profit for 2009 exclude the impact of currency and acquisitions. Internal net sales and operating profit growth for 2008 exclude the impact of currency, a 53 shipping week and acquisitions. Internal net sales and operating profit for 2007 excludes the impact of currency. Internal net sales and operating profit growth is a non-GAAP financial measure which is further discussed and reconciled to GAAP basis growth on page 16.
(b) See the section entitled Foreign currency translation for discussion and reconciliation of the non-GAAP financial measure.
rd

Net sales and operating profit
2009 compared to 2008 The following table provides an analysis of net sales and operating profit performance for 2009 versus 2008:
Our consolidated reported net sales were down compared to last year, driven by a negative impact from foreign currency translation and an extra shipping week in 2008. Excluding this negative impact, internal net sales grew by 3%, lapping last year’s strong 5% growth. While our overall volume declined, we achieved internal sales growth driven by a particularly strong year in retail cereal and a solid year in retail snacks resulting from our pricing and mix. There were several factors contributing to the volume decline. In North America, we experienced a supply disruption in our waffle plants. In both Russia and China we are moving our businesses away from lower margin products and going to higher margin branded products which resulted in a decline in volume during the year.
Our North America operating segment had internal net sales growth of almost 3% against a difficult 6% comparative in the year ago period. We experienced growth in retail cereal of 4% and 3% growth in retail snacks, which includes cookies, crackers, toaster pastries, cereal bars and fruit snacks. Weakness in frozen and specialty channels, which includes frozen foods, food service and vending, dampened net sales for the year, with a decline in net sales of 1%. Cereal continues to be a strong category where we achieved volume growth during the year. It responds well to innovation and advertising. We are committed to providing nutritious food to our consumers and introduced Froot Loops and Apple Jacks with fiber in August of 2009. Our business is focused on driving our top 8 brands as well as Kashi cereals.
We experienced broad based growth in retail snacks, with sales growth of 3%. Pop-Tarts continues to perform well and is the category leader in North America toaster pastries. A strong performance by Cheez-It , as well as innovation, drove growth in crackers. Cookies posted a slight gain for the year led by our recently acquired Mother’s brand cookies. Our growth was negatively impacted by heavy competitor activity. Our best performing category within retail snacks was wholesome snacks. The introduction of Fiber Plus , Special K Chocolaty Pretzel and Cinnabon bars drove growth in this category
Our frozen and specialty channels business was down 1%, experiencing a tough year due to a few discrete issues. Our food service business is mostly non-commercial, serving institutions such as schools, hospitals and prisons. This sector of the industry was not immediately impacted by the economic downturn that started in 2008. While we are seeing a recovery, we believe it will be slower than the commercial sectors such and hotels and restaurants, continuing to impact us until mid-2010. We have also been experiencing a supply disruption in our waffle facilities. We have been making improvements in our facilities and are working with regulatory agencies. A combination of extensive enhancements and repairs at our facilities and a flood at one facility, significantly impacted production in the second-half of the year. While our plants are operational, they are not running at their previous level of capacity. Demand continues to exceed supply. We are exploring ways to increase capacity, including investing additional capital, but expect this situation will impact our net sales in 2010. This impact is included in our 2010 guidance.
Our International operating segments collectively achieved net sales growth of 3% on an internal basis. Europe’s internal net sales increased 2% year-over-year. Europe was a tough environment for us in 2009. We encountered some retailer disputes earlier in the year that were resolved in the second half of the year, helping us to achieve cereal volume growth. Latin America’s internal net sales growth was 7% attributable to both volume and price increases driven by retail cereal in Mexico and Venezuela. Internal net
(dollars in millions) North
America Europe Latin
America
Asia Pacific
(a) Corporate Consolidated 2009 net sales $8,510 $ 2,361 $ 963 $ 741 $— $12,575 2008 net sales $8,457 $ 2,619 $ 1,030 $ 716 $— $12,822 % change — 2009 vs. 2008:
Volume (tonnage) (b) –.7% –1.6% 1.2% –1.3% — –.7% Pricing/mix 3.5% 3.2% 5.6% 6.3% — 3.7%
Subtotal — internal business 2.8% 1.6% 6.8% 5.0% — 3.0% Acquisitions (c) .1% .3% — 3.7% — .3% Shipping day differences (d) –1.8% –1.1% –.5% –.9% — –1.5% Foreign currency impact –.5% –10.6% –12.9% –4.3% — –3.7%
Total change .6% –9.8% –6.6% 3.5% — –1.9%
(dollars in millions) North
America Europe Latin
America
Asia Pacific
(a) Corporate Consolidated 2009 operating profit $1,569 $ 348 $ 179 $ 86 $(181 ) $ 2,001 2008 operating profit $1,447 $ 390 $ 209 $ 92 $(185 ) $ 1,953 % change — 2009 vs. 2008:
Internal business 11.4% 7.0% –2.0% 13.5% — 10.3% Acquisitions (c) — — — –8.4% — –.4% Shipping day differences (d) –2.4% –1.3% .9% –.8% 1.8% –1.8% Foreign currency impact –.5% –16.5% –13.1% –10.5% — –5.6%
Total change 8.5% –10.8% –14.2% –6.2% 1.8% 2.5%
(a) Includes Australia, Asia and South Africa.
(b) We measure the volume impact (tonnage) on revenues based on the stated weight of our product shipments.
(c) Impact of results for the year-to-date period ended January 2, 2010 from the acquisitions of United Bakers, Navigable Foods, Specialty Cereal and certain assets and liabilities of IndyBake.
(d) Impact of 53 shipping week in 2008. rd
® ®
®
®
®
®
® ® ®

sales in Asia Pacific grew 5%, driven by strong cereal performances in Australia and India.
Our consolidated operating profit was strong, increasing by 10% on an internal basis and by 2% on a reported basis. Reported operating profit in each of our operating segments was negatively impacted by foreign exchange as well as the absence of a 53 week in 2009. In 2009, we continued to experience cost 14
rd
pressures, increased our spending on up-front costs, and invested in advertising. We were able to more than offset these increased costs by savings from our cost reduction and productivity initiatives as well as pricing and mix. During the full-year of 2009, our up-front costs were $138 million, which were $63 million higher than the previous year. Up-front costs represent both exit or disposal activities as well as other cost reduction initiatives.
North America’s internal operating profit growth of 11% was driven by price and savings from our cost reduction initiatives, which was partially offset by significantly higher up-front costs and increased advertising. Up-front costs reduced North America’s operating profit by 4%. Europe’s internal operating profit increased 7% benefiting from media deflation and operating efficiencies while absorbing higher up-front costs which reduced operating profit by 3%. Internal operating profit decreased 2% in Latin America due to significantly higher material costs and increased advertising. Internal operating profit growth in Asia Pacific was 14% due to sales growth, while reported operating profit was negatively impacted by the acquisition of Navigable Foods. For further information on our acquisitions, see Note 2 within Notes to Consolidated Financial Statements.
2008 compared to 2007 The following tables provide an analysis of net sales and operating profit performance for 2008 versus 2007:
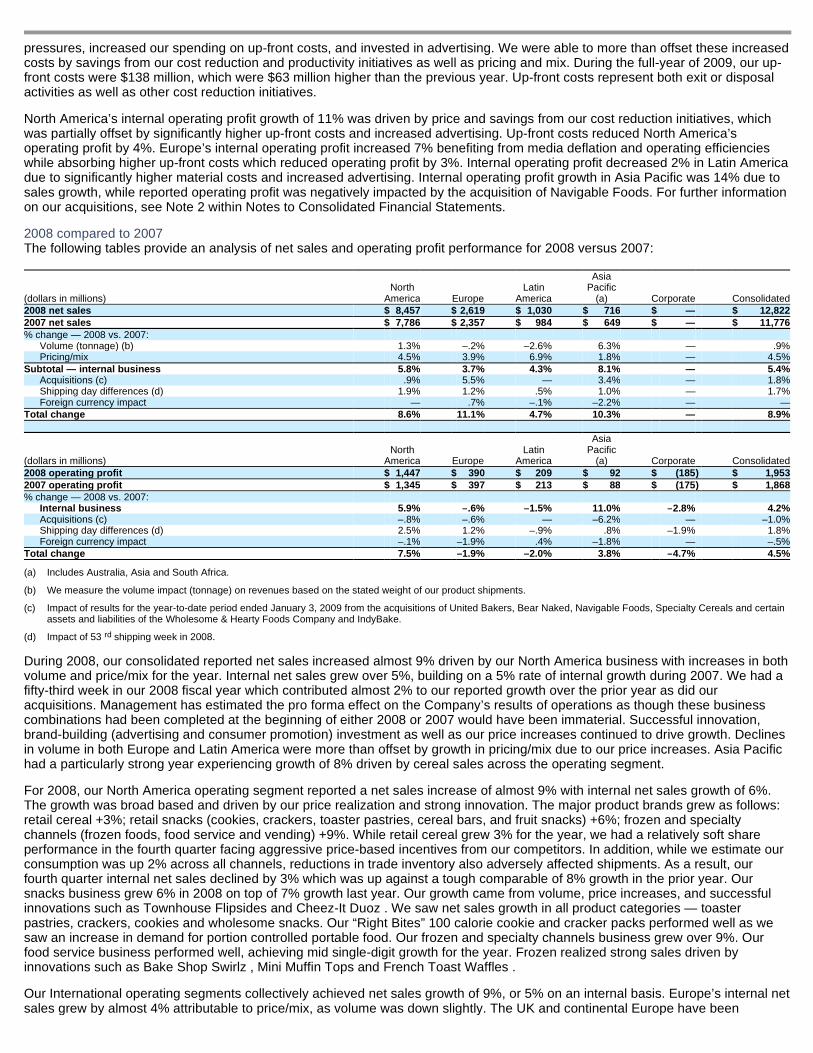
During 2008, our consolidated reported net sales increased almost 9% driven by our North America business with increases in both volume and price/mix for the year. Internal net sales grew over 5%, building on a 5% rate of internal growth during 2007. We had a fifty-third week in our 2008 fiscal year which contributed almost 2% to our reported growth over the prior year as did our acquisitions. Management has estimated the pro forma effect on the Company’s results of operations as though these business combinations had been completed at the beginning of either 2008 or 2007 would have been immaterial. Successful innovation, brand-building (advertising and consumer promotion) investment as well as our price increases continued to drive growth. Declines in volume in both Europe and Latin America were more than offset by growth in pricing/mix due to our price increases. Asia Pacific had a particularly strong year experiencing growth of 8% driven by cereal sales across the operating segment.
For 2008, our North America operating segment reported a net sales increase of almost 9% with internal net sales growth of 6%. The growth was broad based and driven by our price realization and strong innovation. The major product brands grew as follows: retail cereal +3%; retail snacks (cookies, crackers, toaster pastries, cereal bars, and fruit snacks) +6%; frozen and specialty channels (frozen foods, food service and vending) +9%. While retail cereal grew 3% for the year, we had a relatively soft share performance in the fourth quarter facing aggressive price-based incentives from our competitors. In addition, while we estimate our consumption was up 2% across all channels, reductions in trade inventory also adversely affected shipments. As a result, our fourth quarter internal net sales declined by 3% which was up against a tough comparable of 8% growth in the prior year. Our snacks business grew 6% in 2008 on top of 7% growth last year. Our growth came from volume, price increases, and successful innovations such as Townhouse Flipsides and Cheez-It Duoz . We saw net sales growth in all product categories — toaster pastries, crackers, cookies and wholesome snacks. Our “Right Bites” 100 calorie cookie and cracker packs performed well as we saw an increase in demand for portion controlled portable food. Our frozen and specialty channels business grew over 9%. Our food service business performed well, achieving mid single-digit growth for the year. Frozen realized strong sales driven by innovations such as Bake Shop Swirlz , Mini Muffin Tops and French Toast Waffles .
Our International operating segments collectively achieved net sales growth of 9%, or 5% on an internal basis. Europe’s internal net sales grew by almost 4% attributable to price/mix, as volume was down slightly. The UK and continental Europe have been
(dollars in millions) North
America Europe Latin
America
Asia Pacific
(a) Corporate Consolidated 2008 net sales $ 8,457 $ 2,619 $ 1,030 $ 716 $ — $ 12,822 2007 net sales $ 7,786 $ 2,357 $ 984 $ 649 $ — $ 11,776 % change — 2008 vs. 2007:
Volume (tonnage) (b) 1.3% –.2% –2.6% 6.3% — .9% Pricing/mix 4.5% 3.9% 6.9% 1.8% — 4.5%
Subtotal — internal business 5.8% 3.7% 4.3% 8.1% — 5.4% Acquisitions (c) .9% 5.5% — 3.4% — 1.8% Shipping day differences (d) 1.9% 1.2% .5% 1.0% — 1.7% Foreign currency impact — .7% –.1% –2.2% — —
Total change 8.6% 11.1% 4.7% 10.3% — 8.9%
(dollars in millions) North
America Europe Latin
America
Asia Pacific
(a) Corporate Consolidated 2008 operating profit $ 1,447 $ 390 $ 209 $ 92 $ (185 ) $ 1,953 2007 operating profit $ 1,345 $ 397 $ 213 $ 88 $ (175 ) $ 1,868 % change — 2008 vs. 2007:
Internal business 5.9% –.6% –1.5% 11.0% –2.8% 4.2% Acquisitions (c) –.8% –.6% — –6.2% — –1.0% Shipping day differences (d) 2.5% 1.2% –.9% .8% –1.9% 1.8% Foreign currency impact –.1% –1.9% .4% –1.8% — –.5%
Total change 7.5% –1.9% –2.0% 3.8% –4.7% 4.5%
(a) Includes Australia, Asia and South Africa.
(b) We measure the volume impact (tonnage) on revenues based on the stated weight of our product shipments.
(c) Impact of results for the year-to-date period ended January 3, 2009 from the acquisitions of United Bakers, Bear Naked, Navigable Foods, Specialty Cereals and certain assets and liabilities of the Wholesome & Hearty Foods Company and IndyBake.
(d) Impact of 53 shipping week in 2008. rd

impacted by the economic crisis which had consumers searching for value and retailers reducing inventory. Snacks products performed well across the
15

region, especially in the UK driven by Rice Krispies Squares . Latin America’s internal net sales growth was 4% attributable to our price increases and driven by cereal sales in Mexico and Venezuela. The growth in 2008 was on top of 2007 growth of 9%. Volume was down for 2008 due to the economic environment which impacted consumer confidence. Asia Pacific had a very strong year with 8% internal net sales growth. The growth was volume driven and broad based in both retail cereal and retail snacks.
Consolidated operating profit in 2008 grew by almost 5% on an as reported basis and 4% on an internal basis. Operating profit in all areas was impacted by cost pressures as discussed in more detail in the Margin performance section below. North America grew by 6% driven by growth in net sales and lower exit costs which offset higher commodity costs. Costs associated with the peanut-related recall of Kellogg products adversely impacted North America’s operating profit by $34 million or 2% of the full year operating profit. See the Voluntary product withdrawal section for more details. Operating profit declined slightly in both Europe and Latin America due to increased commodity costs and cost reduction initiatives. Asia Pacific’s operating profit increased 11% on an internal basis due to strong top line growth. On a consolidated basis, operating profit from acquisitions decreased internal operating profit by 1%, in line with our expectations, with Europe and Asia Pacific being particularly impacted by our Russian and Chinese acquisitions, respectively.
Margin performance Margin performance was as follows:
We strive for gross profit dollar growth to reinvest in brand-building and innovation expenditures. We maximize our gross profit dollars by managing external cost pressures through product pricing and mix improvements, implementing productivity savings and technological initiatives as well as entering into commodity hedges and fixed price contracts to reduce the cost of product ingredients and packaging. For full year 2009, our gross profit was up $24 million, despite the negative impact of foreign exchange of $213 million and $46 million of higher up-front costs in cost of goods sold (COGS). As illustrated in the preceding table, our consolidated gross margin increased by 100 basis points in 2009. Our acquisitions lowered gross margin by approximately 10 basis points. Although moderating, we also continue to experience inflationary cost pressures for fuel, energy, commodities and employee benefits. During the year, higher costs, including increased investment in up-front costs recorded in COGS, were more than offset by savings from cost reduction initiatives and price increases. Our selling, general and administrative (SGA) expense as a percentage of net sales increased slightly due to higher up-front costs of $17 million recorded in overhead as well as an increase in advertising spend.
Our decline in gross margin for 2008 reflected the impact of significant cost pressure with higher costs for commodities, energy, and fuel being partially offset by the impact of cost reduction initiatives and increased pricing. For 2008, these cost pressures represented 10% of 2007’s COGS, primarily associated with our ingredient purchases. In 2008, acquisitions negatively impacted margin by 50 basis points. For 2008, our SGA% decreased over the prior year due to our strong net sales growth, lower expense related to cost reduction initiatives recorded in SGA expense, continued discipline in overhead spending and efficiencies in advertising and promotion.
Foreign currency translation The reporting currency for our financial statements is the U.S. dollar. Certain of our assets, liabilities, expenses and revenues are denominated in currencies other than the U.S. dollar, primarily in the euro, British pound, Mexican peso, Australian dollar and Canadian dollar. To prepare our consolidated financial statements, we must translate those assets, liabilities, expenses and revenues into U.S. dollars at the applicable exchange rates. As a result, increases and decreases in the value of the U.S. dollar against these other currencies will affect the amount of these items in our consolidated financial statements, even if their value has not changed in their original currency. This could have significant impact on our results if such increase or decrease in the value of the U.S. dollar is substantial.
Due to potential volatility in the foreign exchange markets, we measure EPS growth and provide guidance on a currency neutral basis, assuming earnings are translated at the prior year’s exchange rates. This non-GAAP financial measure is being used to focus management and investors on local currency business results, thereby providing visibility to the underlying trends of the Company. Management believes that excluding the impact of foreign currency from EPS provides a better measurement of comparability given the volatility in foreign exchange markets. 16
Change vs. prior year
(pts.) 2009 2008 2007 2009 2008
Gross margin (a) 42.9% 41.9% 44.0% 1.0 (2.1 ) SGA% (b) –27.0% –26.7% –28.1% (.3 ) 1.4 Operating margin 15.9% 15.2% 15.9% .7 (.7 )
(a) Gross profit as a percentage of net sales. Gross profit is equal to net sales less cost of goods sold.
(b) Selling, general and administrative expense as a percentage of net sales.

Below is a reconciliation of reported EPS to currency neutral EPS for the fiscal years 2009, 2008 and 2007:
Exit or disposal activities We view our continued spending on cost reduction initiatives as part of our ongoing operating principles to provide greater visibility in achieving our long-term profit growth targets. Initiatives undertaken are currently expected to recover cash implementation costs within a five-year period of completion. Upon completion (or as each major stage is completed in the case of multi-year programs), the project begins to deliver cash savings and/or reduced depreciation. Certain of these initiatives represent exit or disposal plans for which material charges will be incurred. We include these charges in our measure of operating segment profitability. Management announced its intention to achieve $1 billion of annual cost savings in three years (beginning in 2012). These initiatives are integral to meeting our $1 billion savings challenge.
Refer to Note 3 within Notes to Consolidated Financial Statements for further details on our exit or disposal activities.
Other cost reduction initiatives
2009 activities We incurred costs related to our cost reduction initiatives which do not qualify as exit costs under generally accepted accounting principles in the United States. These represent cash costs for consulting and other charges for our COGS and SGA programs.
Costs incurred in fiscal year 2009 as well as total program costs are as follows (in millions):
The additional cost and cash outlay in 2010 for these programs, excluding exit costs, is estimated to be $30 to $35 million. Prior year activities During 2008, we incurred $17 million of expense related to the elimination of the accelerated ownership feature of certain employee stock options. Refer to Note 7 within Notes to Consolidated Financial Statements. This expense was recorded in SGA expense within corporate operating profit.
We also incurred $10 million of expense during 2008 in connection with a payment for the restructuring of our labor force at a manufacturing facility in Mexico. The cost, which was recorded in COGS and was attributable to the Latin America operating segment, resulted in employee benefit cost savings.
Interest expense As illustrated in the following table, annual interest expense for the 2007-2009 periods has trended down slightly. The decline in 2009 was due primarily to lower commercial paper balances during the year, the impact of our fixed-to-variable interest rate swaps on our long-term debt and lower commercial paper interest rates, partially offset by the costs of early redemption of long-term debt, and interest on long-term debt issued in 2009. Interest income (recorded in other income (expense), net) was (in millions), 2009-$4; 2008-$20; 2007-$23. The decline for 2009 was primarily due to a drop in average interest rates. We currently expect that our 2010 gross interest expense will be approximately $250 to $260 million.
Other income (expense), net Refer to Note 15 within to Notes to Consolidated Financial Statements.
Income taxes Our long-term objective is to achieve a consolidated effective income tax rate of approximately 30% in comparison to a U.S. federal statutory income tax rate of 35%. We pursue planning initiatives globally in order to move toward our target. Excluding the impact of
Consolidated results 2009 2008 2007 Diluted net earnings per share (EPS) $ 3.16 $ 2.99 $ 2.76 Translational impact (a) 0.22 — (0.07 ) Currency neutral EPS $ 3.38 $ 2.99 $ 2.69 Currency neutral EPS growth (b) 13% 8% 7%
(a) Translation impact is the difference between reported EPS and the translation of current year net profits at prior year exchange rates, adjusted for gains (losses) on translational hedges.
(b) Calculated as a percentage of growth from the prior years’ reported EPS.
(millions)
For the year ended
January 2, 2010 Total program costs through
January 2, 2010
COGS
programs SGA
Programs Total COGS
programs SGA
Programs Total North America $ 38 $ 13 $ 51 $ 50 $ 13 $ 63 Europe 10 2 12 10 2 12 Latin America 5 — 5 5 — 5 Asia Pacific 5 — 5 5 — 5 Total $ 58 $ 15 $ 73 $ 70 $ 15 $ 85
Change vs. prior
year (dollars in millions) 2009 2008 2007 2009 2008 Reported interest expense (a) $ 295 $ 308 $ 319 Amounts capitalized 3 6 5 Gross interest expense $ 298 $ 314 $ 324 –5.1% –3.1%
(a) Reported interest expense for 2009 and 2007 includes charges of approximately $35 and $5, respectively, related to the early redemption of long-term debt.

discrete adjustments and the cost of remitted and unremitted foreign earnings, our sustainable consolidated effective income tax rate for 2009 was 30%. For 2008 and 2007, it was 31% and 32% respectively. We currently expect our 2010 sustainable rate to be approximately 31%. Our reported rates of 28.2% for 2009, 29.7% for 2008 and 28.7% for 2007 were lower than the sustainable
17

rates for those years due to the favorable effect of various discrete adjustments such as audit settlements, international restructuring initiatives and statutory rate changes. Refer to Note 10 within Notes to Consolidated Financial Statements for further information. For 2010, we expect our consolidated effective income tax rate to be approximately 30% to 31%. This could be impacted if pending uncertain tax matters, including tax positions that could be affected by planning initiatives, are resolved more or less favorably than we currently expect. Fluctuations in foreign currency exchange rates could also impact the effective tax rate as it is dependent upon the U.S. dollar earnings of foreign subsidiaries doing business in various countries with differing statutory tax rates.
Voluntary product withdrawal Refer to Note 13 within Notes to Consolidated Financial Statements.
Our principal source of liquidity is operating cash flows supplemented by borrowings for major acquisitions and other significant transactions. Our cash-generating capability is one of our fundamental strengths and provides us with substantial financial flexibility in meeting operating and investing needs.
We believe that our operating cash flows, together with our credit facilities and other available debt financing, will be adequate to meet our operating, investing and financing needs in the foreseeable future. However, there can be no assurance that volatility and/or disruption in the global capital and credit markets will not impair our ability to access these markets on terms acceptable to us, or at all.
Operating activities The principal source of our operating cash flow is net earnings, meaning cash receipts from the sale of our products, net of costs to manufacture and market our products. Our cash conversion cycle (defined as days of inventory and trade receivables outstanding less days of trade payables outstanding, based on a trailing 12 month average) is relatively short, equating to approximately 23 days for 2009, 22 days for 2008, and 24 days for 2007. The increase in 2009 was the result of a decrease in days of trade payables outstanding, while the decrease in 2008 was the result of a decrease in days of inventory outstanding. The following table presents the major components of our operating cash flow:
Our net cash provided by operating activities for 2009 was $376 million higher than in 2008, due primarily to positive cash flows associated with other working capital and lower pension and postretirement benefit plan contributions, partially offset by the impact of changes in core working capital and deferred income taxes in 2009.
Net cash provided by operating activities in 2008 was $236 million lower than 2007, due primarily to the increase in pension and other postretirement benefit plan contributions in 2008 and an unfavorable year-over-year variance in other working capital. Partially offsetting the decrease in 2008 operating cash flows was the impact of changes in deferred income taxes and a favorable variance in core working capital.
In 2009, core working capital was an average of 6.5% of net sales, an increase of 0.3% compared with 2008. In 2008, core working capital was an average of 6.2% of net sales, an improvement of 0.6% compared with 2007. We manage core working capital through timely collection of accounts receivable, extending terms on accounts payable and careful monitoring of inventory.
In 2009, the favorable year-over-year variance in other working capital was largely attributable to income taxes and advertising and promotion. Other working capital in 2008 reflected an increase in cash paid associated with hedging programs, cash paid for advertising and promotion, and the impact of changes in accrued salaries and wages.
Our total pension and postretirement plan funding amounted to $100 million, $451 million and $96 million, in 2009, 2008 and 2007, respectively. During 2008, adverse conditions in the equity markets caused 18
LIQUIDITY AND CAPITAL RESOURCES
(dollars in millions) 2009 2008 2007 Operating activities Net income $ 1,208 $ 1,146 $ 1,102
year-over-year change 5.4% 4.0% Items in net income not requiring (providing) cash: Depreciation and amortization 384 375 372 Deferred income taxes (40 ) 157 (69 ) Other 13 121 184 Net income after non-cash items 1,565 1,799 1,589
year-over-year change –13.0% 13.2% Pension and other postretirement benefit plan contributions (100 ) (451 ) (96 ) Changes in operating assets and liabilities: Core working capital (a) (147 ) 121 16 Other working capital 325 (202 ) (6 )
Total 178 (81 ) 10 Net cash provided by operating activities $ 1,643 $ 1,267 $ 1,503
year-over-year change 29.7% –15.7%
(a) Inventory, trade receivables and trade payables.

the actual rate of return on our pension and postretirement plan assets to be significantly below our assumed long-term rate of return of 8.9%. As a result, we decided to make additional contributions to our pension and postretirement plans amounting to $400 million in the fourth quarter of 2008.
The Pension Protection Act (PPA), and subsequent regulations, determines defined benefit plan minimum funding requirements in the United States. We believe that we will not be required to make any contributions under PPA requirements until 2013. Our projections concerning timing of PPA funding requirements are subject to change primarily based on general market conditions affecting trust asset performance, future discount rates based on average yields of high grade corporate bonds and our future decisions regarding certain elective provisions of the PPA.
We currently project that we will make total U.S. and foreign plan contributions in 2010 of approximately $50 million. Actual 2010 contributions could be different from our current projections, as influenced by our decision to undertake discretionary funding of our benefit trusts versus other competing investment priorities, future changes in government requirements, trust asset performance, renewals of union contracts, or higher-than-expected health care claims cost experience.
We measure cash flow as net cash provided by operating activities reduced by expenditures for property additions. We use this non-GAAP financial measure of cash flow to focus management and investors on the amount of cash available for debt repayment, dividend distributions, acquisition opportunities, and share repurchases. Our cash flow metric is reconciled to the most comparable GAAP measure, as follows:
Changes in cash flow (as defined) for 2009 and 2008 were primarily attributable to the additional $400 million in pension contributions we made in the fourth quarter of 2008 and lower capital expenditures 2009.
For 2010, we are expecting cash flow (as defined) to be comparable to 2009. We expect to achieve our target principally through operating profit growth, and continued prudent management of our working capital.
Investing activities Our net cash used in investing activities for 2009 amounted to $370 million, a decrease of $311 million compared with 2008. Net cash used in investing activities of $681 million in 2008 increased by $80 million compared with 2007.
The reduction in cash used in investing activities in 2009 was attributable mainly to the reduction in business acquisition activity in 2009, and to a lesser extent, it also reflected lower capital spending. During 2008, we used cash to expand our platform for future growth with acquisitions in Russia, China, the U.S. and Australia. During 2007, we completed two business acquisitions in order to support the continued growth of our North America operating segment. Acquisitions are discussed in Note 2 within Notes to Consolidated Financial Statements.
Cash paid for additions to properties as a percentage of net sales amounted to 3.0% in 2009, 3.6% in 2008, and 4.0% in 2007.
In 2009, we spent capital for a new facility to manufacture ready-to-eat cereal in Mexico and completed the expansion of the global research center located in Battle Creek, Michigan, the W. K. Kellogg Institute for Food and Nutrition Research. The investment in our global research center, which began in 2008, reflects our commitment to innovation which is a key driver to the growth of our business. In 2008, we also incurred construction costs to increase manufacturing capacity in Europe. In 2007, we also increased capacity, including the purchase of a previously leased snacks manufacturing facility in Chicago, Illinois.
We continue to expect our Kellogg’s lean, efficient, and agile network (K LEAN) manufacturing efficiency initiative to result in a trend toward lower capital spending. Going forward, our long-term target for capital spending is between 3.0% and 4.0% of net sales. Our 2010 capital plan projects spending of $500 million, which is at the high end of our 3.0% to 4.0% range. This is driven by a significant investment in our information technology infrastructure as we reinstall and upgrade our SAP platform. We also have plans to expand our manufacturing capacity in 2010, primarily for Eggo waffles in the U.S.
Financing activities Our net cash used in financing activities for 2009, 2008 and 2007 amounted to $1,182 million, $780 million, and $788 million, respectively.
Total debt was $4.9 billion at year-end 2009 and $5.5 billion at year-end 2008. The reduction in total debt, primarily commercial paper, resulted from purchasing fewer shares of our stock in 2009 compared to 2008.
In November 2009, we issued $500 million of ten-year 4.15% fixed rate U.S. Dollar Notes, and used proceeds of $496 million to retire a portion of our 6.6% U.S. Dollar Notes due 2011. We retired $482 million
19
(dollars in millions) 2009 2008 2007 Net cash provided by operating activities $ 1,643 $ 1,267 $ 1,503 Additions to properties (377 ) (461 ) (472 ) Cash flow $ 1,266 $ 806 $ 1,031
year-over-year change 57.1% -21.8%
®

of the 2011 debt through a tender offer, which resulted in $35 million of interest expense and an acceleration of $3 million loss on an interest rate swap, which was previously recorded in accumulated other comprehensive income. These charges were included in cash flows from operating activities. This debt had an effective interest rate of 7.08%. In May 2009, we issued $750 million of seven-year 4.45% fixed rate U.S. Dollar Notes, and used proceeds of $745 million to pay down commercial paper. In May 2009, we also entered into interest rate swaps on $1,150 million of our debt. Interest rate swaps with notional amounts totaling $750 million effectively converted our 5.125% U.S. Dollar Notes due 2012 from a fixed rate to a floating rate obligation for the remainder of the five-year term. In addition, interest rate swaps with notional amounts totaling $400 million effectively converted a portion of our 6.6% U.S. Dollar Notes due 2011 from a fixed rate to a floating rate obligation for the remaining term.
In March 2008, we issued $750 million of five-year 4.25% fixed rate U.S. Dollar Notes under an existing shelf registration statement. We used proceeds of $746 million from issuance of this long-term debt to retire a portion of our commercial paper. In conjunction with this debt issuance, we entered into interest rate swaps with notional amounts totaling $750 million, which effectively converted this debt from a fixed rate to a floating rate obligation for the duration of the five-year term. In 2008, we had cash outflows of $465 million in connection with the repayment of five-year U.S. Dollar Notes at maturity in June 2008. That debt had an effective interest rate of 3.35%.
In February 2007, we redeemed Euro Notes for $728 million. To partially finance this redemption, we established a program to issue euro commercial paper notes up to a maximum aggregate amount outstanding at any time of $750 million or its equivalent in alternative currencies. In December 2007, the Company issued $750 million of five-year 5.125% fixed rate U.S. Dollar Notes under the existing shelf registration statement, using the proceeds to replace a portion of our U.S. commercial paper.
Our Board of Directors authorized stock repurchases of up to $650 million for 2009. During 2009, we spent $187 million to purchase approximately 4 million shares of common stock. The unused portion of the 2009 authorization, amounting to $463 million, was rolled over and is available to be executed against in 2010. The Board of Directors has authorized an additional stock repurchase program of up to $650 million bringing the total 2010 stock repurchase authorization to $1,113 million. During 2008 and 2007, we repurchased $650 million of our common stock each year under programs authorized by our Board of Directors. The number of shares repurchased amounted to approximately 13 million and 12 million shares, respectively, in 2008 and 2007. A separate $500 million share repurchase authorization received Board approval in third quarter 2008. We made no share repurchases under this authorization because we decided to use cash to fund pension plans and reduce commercial paper in the fourth quarter of 2008. The $500 million share repurchase authorization was later canceled.
We paid quarterly dividends to shareholders totaling $1.43 per share in 2009, $1.30 per share in 2008 and $1.202 per share in 2007. Total cash paid for dividends increased by 10.3% in 2009 and 4.2% in 2008. Our objective is to maintain our dividend pay-out ratio between 40% and 50% of reported net earnings.
Our long-term debt agreements contain customary covenants that limit the Company and some of its subsidiaries from incurring certain liens or from entering into certain sale and lease-back transactions. Some agreements also contain change in control provisions. However, they do not contain acceleration of maturity clauses that are dependent on credit ratings. A change in the Company’s credit ratings could limit our access to the U.S. short-term debt market and/or increase the cost of refinancing long-term debt in the future. However, even under these circumstances, we would continue to have access to our Five-Year Credit Agreement, which expires in 2011, under which we can borrow up to $2.0 billion on a revolving credit basis. This source of liquidity is unused and available on an unsecured basis, although we do not currently plan to use it.
During the third quarter of 2008 and thereafter, capital and credit markets, including commercial paper markets, experienced increased instability and disruption as the U.S. and global economies underwent a period of extreme uncertainty. Throughout this period of uncertainty, we continued to have access to the U.S. and Canadian commercial paper markets. Our commercial paper and term debt credit ratings have not been affected by the changes in the credit environment, and the amount of our total debt outstanding remained relatively flat over the past three years.
We monitor the financial strength of our third-party financial institutions, including those that hold our cash and cash equivalents as well as those who serve as counterparties to our credit facilities, our derivative financial instruments, and other arrangements.
We continue to believe that we will be able to meet our interest and principal repayment obligations and maintain our debt covenants for the foreseeable future, while still meeting our operational needs, including the pursuit of selected bolt-on acquisitions. This will be accomplished through our strong cash flow, our short-term borrowings, and our maintenance of credit facilities on a global basis. 20

Off-balance sheet arrangements As of January 2, 2010 and January 3, 2009 the Company did not have any material off-balance sheet arrangements.
Contractual obligations The following table summarizes future estimated cash payments to be made under existing contractual obligations. Further information on debt obligations is contained in Note 6 within Notes to Consolidated Financial Statements. Further information on lease obligations is contained in Note 5. Further information on uncertain tax positions is contained in Note 10.
Promotional expenditures Our promotional activities are conducted either through the retail trade or directly with consumers and include activities such as in-store displays and events, feature price discounts, consumer coupons, contests and loyalty programs. The costs of these activities are generally recognized at the time the related revenue is recorded, which normally precedes the actual cash expenditure. The recognition of these costs therefore requires management judgment regarding the volume of promotional offers that will be redeemed by either the retail trade or consumer. These estimates are made using various techniques including historical data on performance of similar promotional programs. Differences between estimated expense and actual redemptions are normally insignificant and recognized as a change in management estimate in a subsequent period. On a full-year basis, these subsequent period adjustments have rarely represented more than 0.3% of our Company’s net sales. However, our Company’s total promotional expenditures (including amounts classified as a revenue reduction) represented approximately 40% of 2009 net sales; therefore, it is likely that our results would be materially different if different assumptions or conditions were to prevail.
Goodwill and other intangible assets We perform an impairment evaluation of goodwill and intangible assets with indefinite useful lives at least annually during the fourth quarter of each year in conjunction with our annual budgeting process. Goodwill impairment testing first requires a comparison between the carrying value and fair value of a reporting unit with associated goodwill. Carrying value is based on the assets and liabilities associated with the operations of that reporting unit, which often requires allocation of shared or corporate items among reporting units. For the 2009 goodwill impairment test, the fair value of the reporting units was estimated based on market multiples. Our
21
OFF-BALANCE SHEET ARRANGEMENTS AND CONTRACTUAL OBLI GATIONS
Contractual obligations Payments due by period
(millions) Total 2010 2011 2012 2013 2014
2015 and
beyond Long-term debt:
Principal $ 4,809 $ 1 $ 946 $ 751 $ 752 $ 8 $ 2,351 Interest (a) 2,450 234 219 211 144 136 1,506
Capital leases 6 2 1 1 1 — 1 Operating leases 604 141 122 91 66 51 133 Purchase obligations (b) 628 534 50 22 7 6 9 Uncertain tax positions (c) 35 35 — — — — —Other long-term (d) 1,002 105 93 60 95 254 395 Total $ 9,534 $ 1,052 $ 1,431 $ 1,136 $ 1,065 $ 455 $ 4,395
(a) Includes interest payments on long-term fixed rate debt.
(b) Purchase obligations consist primarily of fixed commitments under various co-marketing agreements and to a lesser extent, of service agreements, and contracts for future delivery of commodities, packaging materials, and equipment. The amounts presented in the table do not include items already recorded in accounts payable or other current liabilities at year-end 2009, nor does the table reflect cash flows we are likely to incur based on our plans, but are not obligated to incur. Therefore, it should be noted that the exclusion of these items from the table could be a limitation in assessing our total future cash flows under contracts.
(c) In addition to the $35 million reported in the 2010 column and classified as a current liability, the Company has $98 million recorded in long-term liabilities for which it is not reasonably possible to predict when it may be paid.
(d) Other long-term contractual obligations are those associated with noncurrent liabilities recorded within the Consolidated Balance Sheet at year-end 2009 and consist principally of projected commitments under deferred compensation arrangements, multiemployer plans, and supplemental employee retirement benefits. The table also includes our current estimate of minimum contributions to defined benefit pension and postretirement benefit plans through 2015 as follows: 2010-$47; 2011-$53; 2012-$36; 2013-$77; 2014-$240; 2015-$226.
CRITICAL ACCOUNTING ESTIMATES

approach employs market multiples based on earnings before interest, taxes, depreciation and amortization and earnings for companies comparable to our reporting units. Management believes the assumptions used for the impairment test are consistent with those utilized by a market participant performing similar valuations for our reporting units.
Similarly, impairment testing of other intangible assets requires a comparison of carrying value to fair value of that particular asset. Fair values of non-goodwill intangible assets are based primarily on projections of future cash flows to be generated from that asset. For instance, cash flows related to a particular trademark would be based on a projected royalty stream attributable to branded product sales discounted at rates consistent with rates used by market participants. These estimates are made using various inputs including historical data, current and anticipated market conditions, management plans, and market comparables.
We also evaluate the useful life over which a non-goodwill intangible asset is expected to contribute directly or indirectly to the cash flows of the Company. An intangible asset with a finite useful life is amortized; an intangible asset with an indefinite useful life is not amortized, but is evaluated annually for impairment. Reaching a determination on useful life requires significant judgments and assumptions regarding the future effects of obsolescence, demand, competition, other economic factors (such as the stability of the industry, known technological advances, legislative action that results in an uncertain or changing regulatory environment, and expected changes in distribution channels), the level of required maintenance expenditures, and the expected lives of other related groups of assets.
At January 2, 2010, goodwill and other intangible assets amounted to $5.1 billion, consisting primarily of goodwill and trademarks associated with the 2001 acquisition of Keebler Foods Company. Within this total, approximately $1.4 billion of non-goodwill intangible assets were classified as indefinite-lived, comprised principally of Keebler trademarks. We currently believe that the fair value of our goodwill and other intangible assets exceeds their carrying value and that those intangibles so classified will contribute indefinitely to the cash flows of the Company. At January 2, 2010, the fair value of our North America snacks reporting unit was almost twice its book value. However, if we had used materially different assumptions, which we do not believe are reasonably possible, regarding the future performance of our business or a different weighted-average cost of capital in the valuation, this could have resulted in significant impairment losses and/or amortization expense. Retirement benefits Our Company sponsors a number of U.S. and foreign defined benefit employee pension plans and also provides retiree health care and other welfare benefits in the United States and Canada. Plan funding strategies are influenced by tax regulations and asset return performance. A substantial majority of plan assets are invested in a globally diversified portfolio of equity securities with smaller holdings of debt securities and other investments. We recognize the cost of benefits provided during retirement over the employees’ active working life to determine the obligations and expense related to our retiree benefit plans. Inherent in this concept is the requirement to use various actuarial assumptions to predict and measure costs and obligations many years prior to the settlement date. Major actuarial assumptions that require significant management judgment and have a material impact on the measurement of our consolidated benefits expense and accumulated obligation include the long-term rates of return on plan assets, the health care cost trend rates, and the interest rates used to discount the obligations for our major plans, which cover employees in the United States, United Kingdom and Canada.
To conduct our annual review of the long-term rate of return on plan assets, we model expected returns over a 20-year investment horizon with respect to the specific investment mix of each of our major plans. The return assumptions used reflect a combination of rigorous historical performance analysis and forward-looking views of the financial markets including consideration of current yields on long-term bonds, price-earnings ratios of the major stock market indices, and long-term inflation. Our U.S. plan model, corresponding to approximately 68% of our trust assets globally, currently incorporates a long-term inflation assumption of 2.5% and an active management premium of 1% (net of fees) validated by historical analysis. Although we review our expected long-term rates of return annually, our benefit trust investment performance for one particular year does not, by itself, significantly influence our evaluation. Our expected rates of return are generally not revised, provided these rates continue to fall within a “more likely than not” corridor of between the 25th and 75th percentile of expected long-term returns, as determined by our modeling process. Our assumed rate of return for U.S. plans in 2009 of 8.9% equated to approximately the 58th percentile expectation of our 2009 model. Similar methods are used for various foreign plans with invested assets, reflecting local economic conditions. Foreign trust investments represent approximately 32% of our global benefit plan assets.
Based on consolidated benefit plan assets at January 2, 2010, a 100 basis point reduction in the assumed rate of return would increase 2010 benefits expense by approximately $40 million. 22

Correspondingly, a 100 basis point shortfall between the assumed and actual rate of return on plan assets for 2010 would result in a similar amount of arising experience loss. Any arising asset-related experience gain or loss is recognized in the calculated value of plan assets over a five-year period. Once recognized, experience gains and losses are amortized using a declining-balance method over the average remaining service period of active plan participants, which for U.S. plans is presently about 12 years. Under this recognition method, a 100 basis point shortfall in actual versus assumed performance of all of our plan assets in 2010 would reduce pre-tax earnings by approximately $1.4 million in 2011, increasing to approximately $7 million in 2015. For each of the three fiscal years, our actual return on plan assets exceeded (was less than) the recognized assumed return by the following amounts (in millions): 2009-$507; 2008–$(1,528); 2007–$(99).
To conduct our annual review of health care cost trend rates, we model our actual claims cost data over a five-year historical period, including an analysis of pre-65 versus post-65 age groups and other important demographic components in our covered retiree population. This data is adjusted to eliminate the impact of plan changes and other factors that would tend to distort the underlying cost inflation trends. Our initial health care cost trend rate is reviewed annually and adjusted as necessary to remain consistent with recent historical experience and our expectations regarding short-term future trends. In comparison to our actual five-year compound annual claims cost growth rate of approximately 2.4%, our initial trend rate for 2010 of 7.1% reflects the expected future impact of faster-growing claims experience for certain demographic groups within our total employee population. Our initial rate is trended downward by 0.5% per year, until the ultimate trend rate of 4.5% is reached. The ultimate trend rate is adjusted annually, as necessary, to approximate the current economic view on the rate of long-term inflation plus an appropriate health care cost premium. Based on consolidated obligations at January 2, 2010, a 100 basis point increase in the assumed health care cost trend rates would increase 2010 benefits expense by approximately $17 million. A 100 basis point excess of 2010 actual health care claims cost over that calculated from the assumed trend rate would result in an arising experience loss of approximately $9 million. Any arising health care claims cost-related experience gain or loss is recognized in the calculated amount of claims experience over a four-year period. Once recognized, experience gains and losses are amortized using a straight-line method over 15 years. The net experience gain arising from recognition of 2009 claims experience was approximately $16 million.
To conduct our annual review of discount rates, we selected the discount rate using the spot yield curve underlying the Citigroup Index (published monthly by Citigroup). Using this methodology, we determined the single discount rate for each of our retirement plans that was equivalent to discounting against the entire Citigroup spot yield curve. The measurement dates for our defined benefit plans are consistent with our fiscal year end. Accordingly, we select discount rates to measure our benefit obligations that are consistent with market indices during December of each year.
Based on consolidated obligations at January 2, 2010, a 25 basis point decline in the weighted-average discount rate used for benefit plan measurement purposes would increase 2010 benefits expense by approximately $14 million. All obligation-related experience gains and losses are amortized using a straight-line method over the average remaining service period of active plan participants.
Despite the previously-described rigorous policies for selecting major actuarial assumptions, we periodically experience material differences between assumed and actual experience. As of January 2, 2010, we had consolidated unamortized prior service cost and net experience losses of approximately $1.7 billion, as compared to approximately $1.9 billion at January 3, 2009. The year-over-year decrease in net unamortized amounts was attributable primarily to favorable asset performance during 2009. Of the total unamortized amounts at January 2, 2010, approximately $1.5 billion was related to asset losses that occurred during 2008, offset by $0.5 billion in asset gains during 2009, with the remainder largely related to discount rate reductions and net unfavorable health care claims experience (including upward revisions in the assumed trend rate) prior to 2009. For 2010, we currently expect total amortization of prior service cost and net experience losses to be approximately $37 million higher than the actual 2009 amount of approximately $73 million. Total employee benefit expense for 2010 is expected to be higher than 2009 due to lower discount rates, a further phase in of the 2008 investment losses, offset by better than expected 2009 investment performance. Based on our current actuarial assumptions, we expect 2011 pension expense to increase significantly primarily due to the amortization of net experience losses.
During 2009 we made contributions in the amount of $87 million to Kellogg’s global tax-qualified pension programs. This amount was mostly discretionary. We anticipate making additional contributions in future years due to the poor performance of global equity markets during 2008. Additionally we contributed $13 million to our retiree medical programs; most of this contribution was also discretionary and largely used to fund benefit obligations related to our union retiree healthcare benefits.
Assuming actual future experience is consistent with our current assumptions, annual amortization of accumulated prior service cost and net experience
23

losses during each of the next several years would increase versus the 2009 amount.
Income taxes Our consolidated effective income tax rate is influenced by tax planning opportunities available to us in the various jurisdictions in which we operate. Judgment is required in evaluating our tax positions to determine how much benefit should be recognized in our income tax expense. We establish tax reserves associated with uncertain tax positions based on a benefit recognition model, which we believe could result in a greater amount of benefit (and a lower amount of reserve) being initially recognized in certain circumstances.
The Company evaluates uncertain tax positions in two steps. The first step is to determine whether it is more-likely-than not that a tax position will be sustained upon examination based upon the technical merit of the position. In weighing the technical merits of the position, we consider the facts and circumstances of the position; we assume the reviewing tax authority has full knowledge of the position; and we consider the weight of authoritative guidance. The second step is measurement; a tax position that meets the more-likely-than not recognition threshold is measured to determine the amount of benefit to recognize in the financial statements. While reviewing the ranges of probable outcomes, the Company records the largest amount of benefit that is greater than 50 percent likely of being realized upon ultimate settlement. The tax position will be derecognized when it is no longer more-likely-than not of being sustained.
For the periods presented, our income tax and related interest reserves have averaged approximately $130 million. Reserve adjustments for individual issues have rarely exceeded 1% of earnings before income taxes annually. Significant tax reserve adjustments impacting our effective tax rate would be separately presented in the rate reconciliation table of Note 10 within Notes to Consolidated Financial Statements.
The current portion of our tax reserves and related interest reserves are presented in the Consolidated Balance Sheet within other current liabilities and the amount expected to be settled after one year is recorded in other liabilities.
Variable Interest Entities In June 2009, the Financial Accounting Standards Board (FASB) issued guidance that changed the consolidation model for variable interest entities (VIEs). This guidance requires companies to qualitatively assess the determination of the primary beneficiary of a VIE based on whether a company (1) has the power to direct matters that most significantly impact the activities of the VIE, and (2) has the obligation to absorb losses or the right to receive benefits of the VIE that could potentially be significant to the VIE. This standard is effective at the beginning of our 2010 fiscal year and must be applied retrospectively. The adoption of this guidance will not have a significant impact on our financial statements.
Despite a tough economy in 2009, we met or exceeded all of our long-term annual targets. We are poised to continue this momentum in 2010. We expect our business model and strategy will deliver internal net sales growth of 2 to 3%, in line with our long-term annual targets of low single-digits (1 to 3%). Internal operating profit is expected to grow 8 to 10%, above our long-term annual target of mid single-digits (4 to 6%). We expect this growth to result from savings from our up-front cost programs as well as lower spending on up-front costs. We expect our earnings per share to grow 11 to 13%, above our long-term annual target of high single-digit (7 to 9%) growth on a currency neutral basis. Gross profit margin percentage is expected to expand by approximately 100 basis points as our savings from cost reduction initiatives will more than offset pressure on cost of goods sold. Gross interest expense for 2010 is expected to decline to approximately $250 to $260 million. Our effective tax rate is estimated to be approximately 30% to 31%. We continue to remain committed to investing in brand building, cost-reduction initiatives, and other growth opportunities. Lastly, we expect our cash flow performance to remain strong and are currently expecting 2010 cash flow to be similar to 2009’s result of $1,266 million after capital expenditures.
ITEM 7A. QUANTITATIVE AND QUALITATIVE DISCLOSURES A BOUT MARKET RISK
Our Company is exposed to certain market risks, which exist as a part of our ongoing business operations. We use derivative financial and commodity instruments, where appropriate, to manage these risks. As a matter of policy, we do not engage in trading or speculative transactions. Refer to Note 12 within Notes to Consolidated Financial Statements for further information on our derivative financial and commodity instruments.
Foreign exchange risk Our Company is exposed to fluctuations in foreign currency cash flows related to third-party purchases, intercompany loans and product shipments. Our Company is also exposed to fluctuations in the value of foreign currency investments in subsidiaries and cash flows related to repatriation of these investments. Additionally, our Company is exposed to 24
ACCOUNTING STANDARDS TO BE ADOPTED IN FUTURE PERIOD S
FUTURE OUTLOOK

volatility in the translation of foreign currency earnings to U.S. dollars. Primary exposures include the U.S. dollar versus the British pound, euro, Australian dollar, Canadian dollar, and Mexican peso, and in the case of inter-subsidiary transactions, the British pound versus the euro. We assess foreign currency risk based on transactional cash flows and translational volatility and may enter into forward contracts, options, and currency swaps to reduce fluctuations in net long or short currency positions. Forward contracts and options are generally less than 18 months duration. Currency swap agreements are established in conjunction with the term of underlying debt issuances.
The total notional amount of foreign currency derivative instruments at year-end 2009 was $1,588 million, representing a settlement obligation of $24 million. The total notional amount of foreign currency derivative instruments at year-end 2008 was $924 million, representing a settlement receivable of $22 million. All of these derivatives were hedges of anticipated transactions, translational exposure, or existing assets or liabilities, and mature within 18 months. Assuming an unfavorable 10% change in year-end exchange rates, the settlement obligation would have increased by approximately $159 million at year-end 2009 and the settlement receivable would have decreased by $92 million at year-end 2008. These unfavorable changes would generally have been offset by favorable changes in the values of the underlying exposures.
With regard to our foreign currency exchange risk, we continue to monitor the highly volatile economic environment in Venezuela. On January 8, 2010, the Venezuelan government instituted a two tier official exchange rate system which was effective as of January 11, 2010. This resulted in a devaluation of the official rate that had previously been at 2.15 bolivars per $1. A preferential rate for essential items such as medical, food and heavy machinery was established at 2.6 bolivars per $1, referred to as the “preferential rate”. All other imports will be imported at 4.3 bolivars per $1, referred to as the “oil rate”. The government is compiling a list of the items it deems essential which can be imported at the preferential rate. We are in the process of determining which exchange rates will be applicable to our imports into Venezuela. However, currency exchange restrictions in Venezuela restrict our ability to obtain U.S. dollars at the official exchange rates. U.S. dollars may be obtained through a legal parallel exchange mechanism. We have and may continue to use this mechanism to exchange bolivars for U.S. dollars in order to satisfy U.S. dollar denominated obligations of our Venezuelan operations. As such, as of the end of our 2009 fiscal year, we are using the parallel rate to translate our Venezuelan subsidiary’s financial statements to U.S. dollars. The impact of this change was not material to the Consolidated Financial Statements despite rates implied by transactions in the parallel market being significantly higher than the official rates.
Inflation in Venezuela has been at relatively high levels over the past few years. We use a blend of the National Consumer Price Index and the Consumer Price Index to determine whether Venezuela is a highly inflationary economy. The blended index exceeded 100% during the fourth quarter of 2009 and as such, Venezuela will be designated as a highly inflationary economy as of the beginning of our 2010 fiscal year. Gains and losses resulting from the translation of the financial statements of subsidiaries operating in highly inflationary economies are recorded in earnings. We expect reported net sales and operating profit in Latin America will be negatively impacted, and it could be significant to our Latin America operating segment. On a consolidated basis, Venezuela represents only 1% to 2% of our business; therefore, the overall impact is expected to be minimal.
Interest rate risk Our Company is exposed to interest rate volatility with regard to future issuances of fixed rate debt and existing and future issuances of variable rate debt. Primary exposures include movements in U.S. Treasury rates, London Interbank Offered Rates (LIBOR), and commercial paper rates. We periodically use interest rate swaps and forward interest rate contracts to reduce interest rate volatility and funding costs associated with certain debt issues, and to achieve a desired proportion of variable versus fixed rate debt, based on current and projected market conditions.
During 2009 and 2008, we entered into interest rate swaps in connection with certain U.S. Dollar Notes. Refer to disclosures contained in Note 6 within Notes to Consolidated Financial Statements. The total notional amount of our interest rate swaps was $1,900 million and $750 million, as of January 2, 2010 and January 3, 2009, respectively. Assuming average variable rate debt levels during the year, a one percentage point increase in interest rates would have increased interest expense by approximately $22 million in 2009 and $21 million in 2008.
Price risk Our Company is exposed to price fluctuations primarily as a result of anticipated purchases of raw and packaging materials, fuel, and energy. Primary exposures include corn, wheat, soybean oil, sugar, cocoa, paperboard, natural gas, and diesel fuel. We have historically used the combination of long-term contracts with suppliers, and exchange-traded futures and option contracts to reduce price fluctuations in a desired percentage of forecasted raw material purchases over a duration of generally less than 18 months. During 2006, we entered into two separate 10-year over-the-counter commodity swap
25

transactions to reduce fluctuations in the price of natural gas used principally in our manufacturing processes. The notional amount of the swaps totaled $146 million as of January 2, 2010 and equates to approximately 50% of our North America manufacturing needs over the remaining hedge period. At year-end 2008 the notional amount was $167 million.
The total notional amount of commodity derivative instruments at year-end 2009, including the North America natural gas swaps, was $213 million, representing a settlement obligation of approximately $16 million. Assuming a 10% decrease in year-end commodity prices, the settlement obligation would increase by approximately $18 million, generally offset by a reduction in the cost of the underlying commodity purchases. The total notional amount of commodity derivative instruments at year-end 2008, including the natural gas swaps, was $267 million, representing a settlement obligation of approximately $16 million. Assuming a 10% decrease in year-end commodity prices, this settlement obligation would increase by approximately $24 million, generally offset by a reduction in the cost of the underlying commodity purchases.
In some instances the Company has reciprocal collateralization agreements with counterparties regarding fair value positions in excess of certain thresholds. These agreements call for the posting of collateral in the form of cash, treasury securities or letters of credit if a fair value loss position to the Company or our counterparties exceeds a certain amount. There were no collateral balance requirements at January 2, 2010 or January 3, 2009.
In addition to the commodity derivative instruments discussed above, we use long-term contracts with suppliers to manage a portion of the price exposure associated with future purchases of certain raw materials, including rice, sugar, cartonboard, and corrugated boxes. It should be noted the exclusion of these contracts from the analysis above could be a limitation in assessing the net market risk of our Company. 26

ITEM 8. FINANCIAL STATEMENTS AND SUPPLEMENTARY DATA
Kellogg Company and Subsidiaries
Consolidated Statement of Income
Refer to Notes to Consolidated Financial Statements.
27
(millions, except per share data) 2009 2008 2007 Net sales $ 12,575 $ 12,822 $ 11,776 Cost of goods sold 7,184 7,455 6,597 Selling, general and administrative expense 3,390 3,414 3,311 Operating profit $ 2,001 $ 1,953 $ 1,868 Interest expense 295 308 319 Other income (expense), net (22 ) (14 ) (3 ) Income before income taxes 1,684 1,631 1,546 Income taxes 476 485 444 Net income $ 1,208 $ 1,146 $ 1,102 Net loss attributable to noncontrolling interests (4 ) (2 ) (1 ) Net income attributable to Kellogg Company $ 1,212 $ 1,148 $ 1,103 Per share amounts:
Basic $ 3.17 $ 3.01 $ 2.79 Diluted $ 3.16 $ 2.99 $ 2.76
Dividends per share $ 1.430 $ 1.300 $ 1.202

Kellogg Company and Subsidiaries
Consolidated Balance Sheet
Refer to Notes to Consolidated Financial Statements. 28
(millions, except share data) 2009 2008 Current assets Cash and cash equivalents $ 334 $ 255 Accounts receivable, net 1,093 1,100 Inventories 910 897 Other current assets 221 269
Total current assets $ 2,558 $ 2,521 Property, net 3,010 2,933 Goodwill 3,643 3,637 Other intangibles, net 1,458 1,461 Other assets 531 394
Total assets $ 11,200 $ 10,946 Current liabilities Current maturities of long-term debt $ 1 $ 1 Notes payable 44 1,387 Accounts payable 1,077 1,135 Other current liabilities 1,166 1,029
Total current liabilities $ 2,288 $ 3,552 Long -term debt 4,835 4,068 Deferred income taxes 425 300 Pension liability 430 631 Other liabilities 947 940
Commitments and contingencies
Equity Common stock, $.25 par value, 1,000,000,000 shares authorized
Issued: 419,058,168 shares in 2009 and 418,842,707 shares in 2008 105 105 Capital in excess of par value 472 438 Retained earnings 5,481 4,836 Treasury stock at cost
37,678,215 shares in 2009 and 36,981,580 shares in 2008 (1,820 ) (1,790 ) Accumulated other comprehensive income (loss) (1,966 ) (2,141 )
Total Kellogg Company equity 2,272 1,448 Noncontrolling interests 3 7
Total equity 2,275 1,455 Total liabilities and equity $ 11,200 $ 10,946

29 Kellogg Company and Subsidiaries
Consolidated Statement of Equity
Refer to Notes to Consolidated Financial Statements.
(millions)
Common stock Capital in
excess
of par value
Retained
earnings
Treasury stock Accumulated
other comprehensive
income (loss)
Total
Kellogg Company
equity
Non-
controlling
interests (a)
Total equity
Total comprehensive
income (loss)
shares amount shares amount Balance, December 30, 2006 419 $ 105 $ 292 $ 3,630 21 $ (912 ) $ (1,046 ) $ 2,069 $ 3 $ 2,072 $ 1,126
Impact of adoption of accounting standard for uncertain tax positions 2 2 2
Common stock repurchases 12 (650 ) (650 ) (650 )
Net income (loss) 1,103 1,103 (1 ) 1,102 1,102
Dividends (475 ) (475 ) (475 )
Other comprehensive income (loss) 219 219 219 219
Stock compensation 69 69 69
Stock options exercised and other 27 (43 ) (4 ) 205 189 189
Balance, December 29, 2007 419 $ 105 $ 388 $ 4,217 29 $ (1,357 ) $ (827 ) $ 2,526 $ 2 $ 2,528 $ 1,321
Common stock repurchases 13 (650 ) (650 ) (650 )
Business acquisitions 7 7
Net income (loss) 1,148 1,148 (2 ) 1,146 1,146
Dividends (495 ) (495 ) (495 )
Other comprehensive income (loss) (1,314 ) (1,314 ) (1,314 ) (1,314 )
Stock compensation 51 51 51
Stock options exercised and other (1 ) (34 ) (5 ) 217 182 182
Balance, January 3, 2009 419 $ 105 $ 438 $ 4,836 37 $ (1,790 ) $ (2,141 ) $ 1,448 $ 7 $ 1,455 $ (168 )
Common stock repurchases 4 (187 ) (187 ) (187 )
Net income (loss) 1,212 1,212 (4 ) 1,208 1,208
Dividends (546 ) (546 ) (546 )
Other comprehensive income (loss) 175 175 175 175
Stock compensation 37 37 37
Stock options exercised and other (3 ) (21 ) (3 ) 157 133 133
Balance, January 2, 2010 419 $ 105 $ 472 $ 5,481 38 $ (1,820 ) $ (1,966 ) $ 2,272 $ 3 $ 2,275 $ 1,383
(a) Refer to Note 1 for further information.

Kellogg Company and Subsidiaries
Consolidated Statement of Cash Flows
Refer to Notes to Consolidated Financial Statements. 30
(millions) 2009 2008 2007 Operating activities Net income $ 1,208 $ 1,146 $ 1,102 Adjustments to reconcile net income to operating cash flows:
Depreciation and amortization 384 375 372 Deferred income taxes (40 ) 157 (69 ) Other 13 121 184
Pension and other postretirement benefit contributions (100 ) (451 ) (96 ) Changes in operating assets and liabilities:
Trade receivables (75 ) 48 (63 ) Inventories (13 ) 41 (88 ) Accounts payable (59 ) 32 167 Accrued income taxes 112 (85 ) (67 ) Accrued interest expense (5 ) 3 (1 ) Accrued and prepaid advertising, promotion and trade allowances 91 (10 ) 36 Accrued salaries and wages 21 (45 ) 5 Exit plan-related reserves 21 (2 ) (9 ) All other current assets and liabilities 85 (63 ) 30 Net cash provided by operating activities $ 1,643 $ 1,267 $ 1,503
Investing activities Additions to properties $ (377 ) $ (461 ) $ (472 ) Acquisitions of businesses, net of cash acquired — (213 ) (128 ) Other 7 (7 ) (1 )
Net cash used in investing activities $ (370 ) $ (681 ) $ (601 ) Financing activities Net increase (reduction) of notes payable, with maturities less than or equal to 90 days $ (1,284 ) $ 23 $ 625 Issuances of notes payable, with maturities greater than 90 days 10 190 804 Reductions of notes payable, with maturities greater than 90 days (70 ) (316 ) (1,209 ) Issuances of long-term debt 1,241 756 750 Reductions of long-term debt (482 ) (468 ) (802 ) Net issuances of common stock 131 175 163 Common stock repurchases (187 ) (650 ) (650 ) Cash dividends (546 ) (495 ) (475 ) Other 5 5 6
Net cash used in financing activities $ (1,182 ) $ (780 ) $ (788 ) Effect of exchange rate changes on cash and cash equivalents (12 ) (75 ) (1 ) Increase (decrease) in cash and cash equivalents $ 79 $ (269 ) $ 113 Cash and cash equivalents at beginning of year 255 524 411 Cash and cash equivalents at end of year $ 334 $ 255 $ 524
Kellogg Company and Subsidiaries
Notes to Consolidated Financial Statements NOTE 1 ACCOUNTING POLICIES
Basis of presentation The consolidated financial statements include the accounts of Kellogg Company and its majority-owned subsidiaries (Kellogg or the Company). Intercompany balances and transactions are eliminated.
The Company’s fiscal year normally ends on the Saturday closest to December 31 and as a result, a 53rd week is added approximately every sixth year. The Company’s 2009 and 2007 fiscal years each contained 52 weeks and ended on January 2, 2010 and December 29, 2007, respectively. The Company’s 2008 fiscal year ended on January 3, 2009, and included a 53rd week. While quarters normally consist of 13-week periods, the fourth quarter of fiscal 2008 included a 14th week.
Use of estimates The preparation of financial statements in conformity with accounting principles generally accepted in the United States of America requires management to make estimates and assumptions that affect the reported amounts of assets and liabilities, the disclosure of contingent liabilities at the date of the financial statements and the reported amounts of revenues and expenses during the periods reported. Actual results could differ from those estimates.
Cash and cash equivalents Highly liquid investments with original maturities of three months or less are considered to be cash equivalents.
Accounts receivable Accounts receivable consists principally of trade receivables, which are recorded at the invoiced amount, net of allowances for doubtful accounts and prompt payment discounts. Trade receivables do not bear interest. The allowance for doubtful accounts represents management’s estimate of the amount of probable credit losses in existing accounts receivable, as determined from a review of past due balances and other specific account data. Account balances are written off against the allowance when management determines the receivable is uncollectible. The Company does not have off-balance sheet credit exposure related to its customers.
Inventories Inventories are valued at the lower of cost or market. Cost is determined on an average cost basis. Property The Company’s property consists mainly of plants and equipment used for manufacturing activities. These assets are recorded at cost and depreciated over estimated useful lives using straight-line methods for financial reporting and accelerated methods, where permitted, for tax reporting. Major property categories are depreciated over various periods as follows (in years): manufacturing machinery and equipment 5-20; computer and other office equipment 3-5; building components 15-30; building structures 50. Cost includes interest associated with significant capital projects. Plant and equipment are reviewed for impairment when conditions indicate that the carrying value may not be recoverable. Such conditions include an extended period of idleness or a plan of disposal. Assets to be disposed of at a future date are depreciated over the remaining period of use. Assets to be sold are written down to realizable value at the time the assets are being actively marketed for sale and a sale is expected to occur within one year. As of year-end 2009 and 2008, the carrying value of assets held for sale was insignificant.
Goodwill and other intangible assets The Company’s goodwill and intangible assets are comprised primarily of amounts related to the 2001 acquisition of Keebler Foods Company (Keebler). Management expects the Keebler trademarks to contribute indefinitely to the cash flows of the Company. Accordingly, these intangible assets have been classified as having indefinite lives. Goodwill and indefinite-lived intangibles are not amortized, but are tested at least annually for impairment. An intangible asset with a finite life is amortized on a straight-line basis over the estimated useful life.
For the goodwill impairment test, the fair value of the reporting units are estimated based on market multiples. This approach employs market multiples based on earnings before interest, taxes, depreciation and amortization and earnings for companies that are comparable to the Company’s reporting units. The assumptions used for the impairment test are consistent with those utilized by a market participant performing similar valuations for the Company’s reporting units.
Similarly, impairment testing of other intangible assets requires a comparison of carrying value to fair value of that particular asset. Fair values of non-goodwill intangible assets are based primarily on projections of future cash flows to be generated from that asset. For instance, cash flows related to a particular trademark would be based on a projected royalty stream attributable to branded product sales, discounted at rates consistent with rates used by market participants.
31

These estimates are made using various inputs including historical data, current and anticipated market conditions, management plans, and market comparables.
Revenue recognition The Company recognizes sales upon delivery of its products to customers. Revenue, which includes shipping and handling charges billed to the customer, is reported net of applicable provisions for discounts, returns, allowances, and various government withholding taxes. Methodologies for determining these provisions are dependent on local customer pricing and promotional practices, which range from contractually fixed percentage price reductions to reimbursement based on actual occurrence or performance. Where applicable, future reimbursements are estimated based on a combination of historical patterns and future expectations regarding specific in-market product performance. The Company classifies promotional payments to its customers, the cost of consumer coupons, and other cash redemption offers in net sales. The cost of promotional package inserts is recorded in cost of goods sold (COGS). Other types of consumer promotional expenditures are recorded in selling, general and administrative (SGA) expense.
Advertising The costs of advertising are expensed as incurred and are classified within SGA expense.
Research and development The costs of research and development (R&D) are expensed as incurred and are classified within SGA expense. R&D includes expenditures for new product and process innovation, as well as significant technological improvements to existing products and processes. The Company’s R&D expenditures primarily consist of internal salaries, wages, consulting, and supplies attributable to time spent on R&D activities. Other costs include depreciation and maintenance of research facilities and equipment, including assets at manufacturing locations that are temporarily engaged in pilot plant activities.
Stock-based compensation The Company uses stock-based compensation, including stock options, restricted stock and executive performance shares, to provide long-term performance incentives for its global workforce.
The Company classifies pre-tax stock compensation expense principally in SGA expense within its corporate operations. Expense attributable to awards of equity instruments is recorded in capital in excess of par value within the Consolidated Balance Sheet.
Certain of the Company’s stock-based compensation plans contain provisions that accelerate vesting of awards upon retirement, disability, or death of eligible employees and directors. A stock-based award is considered vested for expense attribution purposes when the employee’s retention of the award is no longer contingent on providing subsequent service. Accordingly, the Company recognizes compensation cost immediately for awards granted to retirement-eligible individuals or over the period from the grant date to the date retirement eligibility is achieved, if less than the stated vesting period.
The Company recognizes compensation cost for stock option awards that have a graded vesting schedule on a straight-line basis over the requisite service period for the entire award.
Corporate income tax benefits realized upon exercise or vesting of an award in excess of that previously recognized in earnings (“windfall tax benefit”) is presented in the Consolidated Statement of Cash Flows as a financing activity, classified as “other.” Realized windfall tax benefits are credited to capital in excess of par value in the Consolidated Balance Sheet. Realized shortfall tax benefits (amounts which are less than that previously recognized in earnings) are first offset against the cumulative balance of windfall tax benefits, if any, and then charged directly to income tax expense. The Company currently has sufficient cumulative windfall tax benefits to absorb arising shortfalls, such that earnings were not affected during the periods presented. Correspondingly, the Company includes the impact of pro forma deferred tax assets (i.e., the “as if” windfall or shortfall) for purposes of determining assumed proceeds in the treasury stock calculation of diluted earnings per share.
Pension benefits, nonpension postretirement and pos temployment benefits The Company sponsors a number of U.S. and foreign plans to provide pension, health care, and other welfare benefits to retired employees, as well as salary continuance, severance, and long-term disability to former or inactive employees.
The recognition of benefit expense is based on several actuarial assumptions, such as discount rate, long-term rate of compensation increase, long-term rate of return on plan assets and health care cost trend rate, and is reported within COGS and SGA expense on the Consolidated Statement of Income.
The Company recognizes the net overfunded or underfunded position of a defined postretirement benefit plan as a pension asset or pension liability on the Consolidated Balance Sheet. The change in funded status for the year is reported as a component of other comprehensive income (loss), net of tax, in equity.
Obligations associated with the Company’s postemployment benefit plans, which are unfunded, are included in other current liabilities and other liabilities on the Consolidated Balance Sheet. 32
Uncertain tax positions The Company recognizes uncertain tax positions based on a benefit recognition model. Provided that the tax position is deemed more likely than not of being sustained, the Company recognizes the largest amount of tax benefit that is greater than 50 percent likely of being ultimately realized upon settlement. The tax position is derecognized when it is no longer more likely than not of being sustained. The Company classifies income tax-related interest and penalties as interest expense and SGA expense, respectively, on the Consolidated Statement of Income.
Business combinations and noncontrolling interests In December 2007, the FASB issued separate standards on business combinations and noncontrolling interests in consolidated financial statements. These standards were adopted by the Company at the beginning of its 2009 fiscal year.
For business combinations, the underlying fair value concepts of previous guidance was retained, but the method for applying the acquisition method changed in a number of significant respects including 1) the requirement to expense transaction fees and expected restructuring costs as incurred, rather than including these amounts in the allocated purchase price, 2) the requirement to recognize the fair value of contingent consideration at the acquisition date, rather than the expected amount when the contingency is resolved, 3) the requirement to recognize the fair value of acquired in-process research and development assets at the acquisition date, rather than immediately expensing them, and 4) the requirement to recognize a gain in relation to a bargain purchase price, rather than reducing the allocated basis of long-lived assets. In addition, changes in deferred tax asset valuation allowances and acquired income tax uncertainties after the measurement period are recognized in net income rather than as adjustments to the cost of an acquisition, including changes that relate to business combinations completed prior to 2009. To date, the impact of adoption of this standard on the Company’s financial statements has not been significant.
For noncontrolling interests, the consolidated financial statements are presented as if the parent company investors (controlling interests) and other minority investors (noncontrolling interests) in partially-owned subsidiaries have similar economic interests in a single entity. As a result, investments in noncontrolling interests are reported as equity in the consolidated financial statements. Furthermore, the consolidated financial statements include 100% of a controlled subsidiary’s earnings, rather than only the Company’s share. Lastly, transactions between the Company and noncontrolling interests are reported in equity as transactions between shareholders provided that these transactions do not create a change in control. Previously, acquisitions of additional interests in a controlled subsidiary generally resulted in remeasurement of assets and liabilities acquired; dispositions of interests resulted in a gain or loss. The Company’s adoption of this pronouncement changed its presentation of noncontrolling interests.
NOTE 2 ACQUISITIONS, GOODWILL AND OTHER INTANGIBLE ASSETS
Acquisitions During 2008 and 2007, the Company made acquisitions in order to expand its presence geographically and increase its manufacturing capacity.
Assets, liabilities, and results of operations of the acquired businesses have been included in the Company’s consolidated financial statements beginning on the dates of acquisition; such amounts were insignificant to the Company’s consolidated financial position and results of operations. In addition, the pro forma effect of these acquisitions on the Company’s results of operations, as though these business combinations had been completed at the beginning of 2007, would have been immaterial when considered individually or in the aggregate.
Specialty Cereals. In September 2008, the Company acquired Specialty Cereals of Sydney, Australia, a manufacturer and distributor of natural ready-to-eat cereals. The Company paid $37 million cash in connection with the transaction, including approximately $5 million to the seller’s lenders to settle debt of the acquired entity. Assets acquired consisted primarily of property, plant and equipment of $19 million and goodwill of $18 million (which will not be deductible for income tax purposes). This acquisition has been included in the Asia Pacific operating segment.
IndyBake Products/Brownie Products. In August 2008, the Company acquired certain assets and liabilities of the business of IndyBake Products and Brownie Products (collectively, IndyBake), located in Indiana and Illinois. IndyBake, a contract manufacturing business that produced cracker, cookie and frozen dough products, had been a partner to Kellogg for many years as a snacks contract manufacturer.
The Company paid approximately $42 million in cash in connection with the transaction, including approximately $8 million to the seller’s lenders. Assets acquired consisted primarily of property, plant and equipment of $12 million and goodwill of $25 million (which will be deductible for income tax purposes). Other assets acquired amounted to $5 million, net of other liabilities acquired. This acquisition has been included in the North America operating segment.
Navigable Foods. In June 2008, the Company acquired a majority interest in the business of Zhenghang Food Company Ltd. (Navigable Foods) for
33
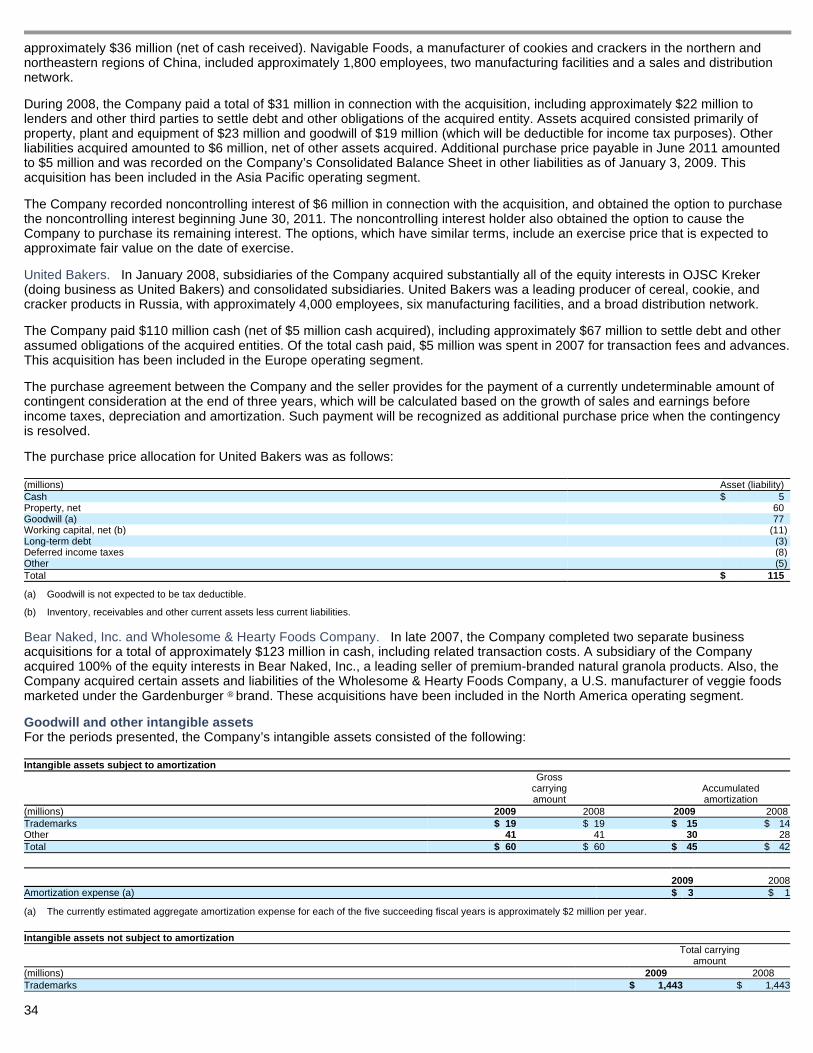
approximately $36 million (net of cash received). Navigable Foods, a manufacturer of cookies and crackers in the northern and northeastern regions of China, included approximately 1,800 employees, two manufacturing facilities and a sales and distribution network.
During 2008, the Company paid a total of $31 million in connection with the acquisition, including approximately $22 million to lenders and other third parties to settle debt and other obligations of the acquired entity. Assets acquired consisted primarily of property, plant and equipment of $23 million and goodwill of $19 million (which will be deductible for income tax purposes). Other liabilities acquired amounted to $6 million, net of other assets acquired. Additional purchase price payable in June 2011 amounted to $5 million and was recorded on the Company’s Consolidated Balance Sheet in other liabilities as of January 3, 2009. This acquisition has been included in the Asia Pacific operating segment.
The Company recorded noncontrolling interest of $6 million in connection with the acquisition, and obtained the option to purchase the noncontrolling interest beginning June 30, 2011. The noncontrolling interest holder also obtained the option to cause the Company to purchase its remaining interest. The options, which have similar terms, include an exercise price that is expected to approximate fair value on the date of exercise.
United Bakers. In January 2008, subsidiaries of the Company acquired substantially all of the equity interests in OJSC Kreker (doing business as United Bakers) and consolidated subsidiaries. United Bakers was a leading producer of cereal, cookie, and cracker products in Russia, with approximately 4,000 employees, six manufacturing facilities, and a broad distribution network.
The Company paid $110 million cash (net of $5 million cash acquired), including approximately $67 million to settle debt and other assumed obligations of the acquired entities. Of the total cash paid, $5 million was spent in 2007 for transaction fees and advances. This acquisition has been included in the Europe operating segment.
The purchase agreement between the Company and the seller provides for the payment of a currently undeterminable amount of contingent consideration at the end of three years, which will be calculated based on the growth of sales and earnings before income taxes, depreciation and amortization. Such payment will be recognized as additional purchase price when the contingency is resolved. The purchase price allocation for United Bakers was as follows:
Bear Naked, Inc. and Wholesome & Hearty Foods Company. In late 2007, the Company completed two separate business acquisitions for a total of approximately $123 million in cash, including related transaction costs. A subsidiary of the Company acquired 100% of the equity interests in Bear Naked, Inc., a leading seller of premium-branded natural granola products. Also, the Company acquired certain assets and liabilities of the Wholesome & Hearty Foods Company, a U.S. manufacturer of veggie foods marketed under the Gardenburger brand. These acquisitions have been included in the North America operating segment.
Goodwill and other intangible assets For the periods presented, the Company’s intangible assets consisted of the following:
34
(millions) Asset (liability) Cash $ 5 Property, net 60 Goodwill (a) 77 Working capital, net (b) (11 ) Long-term debt (3 ) Deferred income taxes (8 ) Other (5 ) Total $ 115
(a) Goodwill is not expected to be tax deductible.
(b) Inventory, receivables and other current assets less current liabilities.
Intangible assets subject to amortization
Gross carrying amount
Accumulated amortization
(millions) 2009 2008 2009 2008 Trademarks $ 19 $ 19 $ 15 $ 14 Other 41 41 30 28 Total $ 60 $ 60 $ 45 $ 42
2009 2008 Amortization expense (a) $ 3 $ 1
(a) The currently estimated aggregate amortization expense for each of the five succeeding fiscal years is approximately $2 million per year.
Intangible assets not subject to amortization
Total carrying
amount (millions) 2009 2008 Trademarks $ 1,443 $ 1,443
®

NOTE 3 EXIT OR DISPOSAL ACTIVITIES
The Company views its continued spending on cost-reduction initiatives as part of its ongoing operating principles to provide greater visibility in achieving its long-term profit growth targets. Initiatives undertaken are currently expected to recover cash implementation costs within a five-year period of completion. Upon completion (or as each major stage is completed in the case of multi-year programs), the project begins to deliver cash savings and/or reduced depreciation.
Cost summary During 2009, the Company recorded $65 million of costs associated with exit or disposal activities. $44 million represented severance and other cash costs, $3 million was for pension costs, $6 million for asset write offs, and $12 million for other costs including relocation of assets and employees. $40 million of the charges were recorded in cost of goods sold (COGS) in the following operating segments (in millions): North America—$14; Europe—$16; Latin America—$9; and Asia Pacific—$1. $25 million of the charges were recorded in selling, general and administrative (SGA) expense in the following operating segments (in millions): North America—$10; Europe—$13; Latin America—$1; and Asia Pacific—$1.
The Company recorded $27 million of costs in 2008 associated with exit or disposal activities comprised of $7 million of asset write offs, $17 million of severance and other cash costs and $3 million related to pension costs. $23 million of the 2008 charges were recorded in COGS within the Europe operating segment, with the balance recorded in SGA expense in the Latin America operating segment.
For 2007, the Company recorded charges of $100 million, comprised of $7 million of asset write- offs, $72 million for severance and other exit costs including route franchise settlements, $15 million for other cash expenditures, and $6 million for a multiemployer pension plan withdrawal liability. $23 million of the total 2007 charges were recorded in COGS within the Europe operating segment results, with $77 million recorded in SGA expense within the North America operating results.
At January 2, 2010, exit cost reserves were $25 million, related to severance payments which will be made in 2010. Exit cost reserves at January 3, 2009 were $2 million related to severance payments.
Specific initiatives 2009 activities During 2009, the Company incurred costs related to plans which will result in COGS and SGA expense savings. The COGS programs are Kellogg’s lean, efficient, and agile network (K LEAN), a European manufacturing optimization in Bremen, Germany and a supply chain network rationalization in Latin America. The SGA programs focus on the efficiency and effectiveness of various support functions.
K LEAN seeks to optimize the Company’s global manufacturing network, reduce waste, develop best practices on a global basis and reduce capital expenditures. The Company incurred $24 million of costs for 2009 and expects to incur an additional $14 million in 2010. The charges are primarily for cash payments for severance and other cash costs for asset removal and relocation at various global manufacturing facilities. The above costs impacted operating segments for the year-to-date period, as follows (in millions): North America—$14; Europe—$9; and Asia Pacific—$1.
During 2009, the Company incurred $25 million of costs for SGA programs which will result in an improvement in the efficiency and effectiveness of various support functions. The programs realign these functions to provide greater consistency across processes, procedures and capabilities in order to support the global organization. The Company expects to incur an additional $16 million in 2010 for these programs. The charges represent cash payments for severance and other cash costs associated with the elimination of salaried positions. The above costs impacted operating segments for the year-to-date period, as follows (in millions): North America—$10; Europe—$13; Latin America—$1; and Asia Pacific—$1.
The total costs for these projects, all incurred during the year ended January 2, 2010 were as follows:
Changes in the carrying amount of goodwill
(millions) North
America Europe Latin
America
Asia Pacific
(a) Consolidated
December 29, 2007 $ 3,513 $ — $ — $ 2 $ 3,515 Purchase accounting adjustments 1 — — — 1 Acquisitions 25 77 — 37 139 Currency translation adjustment — (16 ) — (2 ) (18 ) January 3, 2009 $ 3,539 $ 61 $ — $ 37 $ 3,637 Currency translation adjustment — 1 — 5 6 January 2, 2010 $ 3,539 $ 62 $ — $ 42 $ 3,643
(a) Includes Australia, Asia and South Africa.
(millions)
Year-to-date period ended January 2,
2010
Employee severance
Other cash costs (a)
Retirement benefits (b) Total
COGS programs $ 15 $ 6 $ 3 $ 24 SGA programs 17 8 — 25 Total $ 32 $ 14 $ 3 $ 49

35
(a) Includes cash costs for equipment removal and relocation.
(b) Pension plan curtailment losses and special termination benefits.

A reconciliation of the severance reserves is as follows:
The Company incurred $7 million of costs during the year, representing cash payments for severance, related to a manufacturing optimization program in Bremen, Germany. The program will result in future cash savings through the elimination of employee positions and were recorded within COGS in the Europe operating segment. The program was substantially complete as of the end of the third quarter, 2009. Severance reserves were $7 million as of January 2, 2010 which will be paid out during 2010.
The Company incurred $9 million of costs related to a supply chain rationalization in Latin America which resulted in the closing of a plant in Guatemala. The charges represent $3 million of cash payments for severance and other cash costs associated with the elimination of employee positions and $6 million for asset removal and relocation costs as well as non-cash asset write offs. Efficiencies gained in other plants in the Latin America network allow the Company to service the Guatemala market from those plants. The costs were recorded in COGS in the Latin America operating segment and there were no severance reserves as of January 2, 2010.
Prior year activities During 2008, the Company executed a cost-reduction initiative in Latin America that resulted in the elimination of salaried positions. The cost of the program was $4 million and was recorded in Latin America’s SGA expense. The charge related primarily to severance benefits which were paid in 2008. There were no reserves as of January 3, 2009 related to this program.
The Company commenced a multi-year European manufacturing optimization plan in 2006 to improve utilization of its facility in Manchester, England and to better align production in Europe. The project resulted in an elimination of hourly and salaried positions from the Manchester facility through voluntary early retirement and severance programs. The Company incurred $8 million of expense in 2008, $19 million in 2007 and $28 million in 2006. The pension trust funding requirements of these early retirements exceeded the recognized benefit expense by $5 million which was funded in 2006. During this program certain manufacturing equipment was removed from service. All of the costs for the European manufacturing optimization plan have been recorded in COGS within the Company’s Europe operating segment. All other cash costs were paid in the period incurred. The project was completed in 2008.
In October 2007, management committed to reorganize certain production processes at the Company’s plants in Valls, Spain and Bremen, Germany. Commencement of this plan followed consultation with union representatives at the Bremen facility regarding the elimination of employee positions. The Company incurred $15 million of costs in 2008 and $4 million of costs in 2007. This reorganization plan improved manufacturing and distribution efficiency across the Company’s continental European operations, and was completed as of the end of the Company’s 2008 fiscal year. All of the costs for European production process realignment have been recorded in COGS within the Company’s Europe operating segment.
The following table presents total project costs for the manufacturing optimization and reorganization of production activities. There was a $2 million severance reserve as of the end of January 3, 2009 related to the manufacturing optimization plan. There were no reserves for either program at January 2, 2010.
In July 2007, management commenced a plan to reorganize the Company’s direct store-door delivery (DSD) operations in the southeastern United States. This DSD reorganization plan was intended to integrate the Company’s southeastern sales and distribution regions with the rest of its U.S. DSD operations, resulting in greater efficiency across the nationwide network. The Company exited 517 distribution route franchise agreements with independent contractors. The plan also resulted in the involuntary termination or relocation of employee positions. Total project costs incurred were $77 million, principally consisting of cash expenditures for route franchise settlements and to a lesser extent, for employee separation, relocation, and reorganization. This initiative is complete. 36
(millions)
Balance January 3,
2009 Accruals Payments
Balance January 2,
2010
COGS programs $ — $ 15 $ (9 ) $ 6 SGA programs — 17 (5 ) 12 Total $ — $ 32 $ (14 ) $ 18
(millions)
Total project costs
Employee severance
Other cash costs
(a) Asset
write -offs
Retirement benefits
(b) Total Manufacturing optimization $ 24 $ 13 $ 6 $ 12 $ 55 Reorganization of production 6 2 11 — 19 Total $ 30 $ 15 $ 17 $ 12 $ 74
(a) Includes cash costs for equipment removal and relocation.
(b) Pension plan curtailment losses and special termination benefits.

NOTE 4 EQUITY
Earnings per share Basic net earnings per share is determined by dividing net income attributable to Kellogg Company by the weighted-average number of common shares outstanding during the period. Diluted net earnings per share is similarly determined, except that the denominator is increased to include the number of additional common shares that would have been outstanding if all dilutive potential common shares had been issued. Dilutive potential common shares are comprised principally of employee stock options issued by the Company. The total number of anti-dilutive potential common shares excluded from the reconciliation for each period was (in millions): 2009–12.2; 2008–2.6; 2007–0.8. Basic net earnings per share is reconciled to diluted net earnings per share in the following table:
Stock transactions The Company issues shares to employees and directors under various equity-based compensation and stock purchase programs, as further discussed in Note 7. The number of shares issued during the periods presented was (in millions): 2009–3; 2008–5; 2007–4. The Company issued shares totaling less than one million in each of the years presented under Kellogg Direct , a direct stock purchase and dividend reinvestment plan for U.S. shareholders.
The Board of Directors authorized stock repurchases of up to $650 million for 2009. During 2009, the Company spent $187 million to purchase approximately 4 million shares of common stock. The unused portion of the 2009 authorization, amounting to $463 million, was rolled over and is available to be executed in 2010. The Board of Directors has authorized an additional stock repurchase program of up to $650 million for 2010. During 2008 and 2007, the Company repurchased $650 million of common stock each year under programs authorized by its Board of Directors. The number of shares repurchased amounted to approximately 13 million and 12 million shares, respectively, in 2008 and 2007.
Comprehensive income Comprehensive income includes net income and all other changes in equity during a period except those resulting from investments by or distributions to shareholders. Other comprehensive income for the periods presented consists of foreign currency translation adjustments, unrealized gains and losses on cash flow hedges and adjustments for net experience losses and prior service cost associated with defined benefit pension and other postretirement plans.
During 2008, the assets of the Company’s postretirement and postemployment benefit plans suffered losses of over $1 billion due to the substantial allocation of assets in the equity market. These losses are recognized in other comprehensive income and for pension plans is recognized in the calculated value of plan assets over a five-year period and once recognized, are amortized using a declining-balance method over the average remaining service period of active plan participants.
37
(millions, except per share data)
Net income attributable to Kellogg Company
Average shares
outstanding
Net earnings
per share
2009 Basic $ 1,212 382 $ 3.17 Dilutive potential common shares — 2 (.01 ) Diluted $ 1,212 384 $ 3.16
2008 Basic $ 1,148 382 $ 3.01 Dilutive potential common shares — 3 (.02 ) Diluted $ 1,148 385 $ 2.99
2007 Basic $ 1,103 396 $ 2.79 Dilutive potential common shares — 4 (.03 ) Diluted $ 1,103 400 $ 2.76
TM

Accumulated other comprehensive income (loss) at year end consisted of the following:
NOTE 5 LEASES AND OTHER COMMITMENTS
The Company’s leases are generally for equipment and warehouse space. Rent expense on all operating leases was (in millions): 2009-$150; 2008-$145; 2007-$135. During 2008 and 2007, the Company entered into approximately $3 million and $5 million, respectively, in capital lease agreements to finance the purchase of equipment. The Company did not enter into any capital lease agreements during 2009.
At January 2, 2010, future minimum annual lease commitments under noncancelable operating and capital leases were as follows:
(millions) Pre-tax amount
Tax (expense)
benefit After-tax amount
2009 Net income $ 1,208 Other comprehensive income:
Foreign currency translation adjustments $ 65 $ — 65 Cash flow hedges:
Unrealized loss on cash flow hedges (6 ) 3 (3 ) Reclassification to net earnings (3 ) — (3 )
Postretirement and postemployment benefits: Amounts arising during the period:
Net experience gain (loss) 161 (72 ) 89 Prior service cost (33 ) 11 (22 )
Reclassification to net earnings: Net experience loss 63 (21 ) 42 Prior service cost 11 (4 ) 7
$ 258 $ (83 ) 175 Total comprehensive income $ 1,383 2008 Net income $ 1,146 Other comprehensive income:
Foreign currency translation adjustments $ (431 ) $ — (431 ) Cash flow hedges:
Unrealized loss on cash flow hedges (33 ) 12 (21 ) Reclassification to net earnings 5 (2 ) 3
Postretirement and postemployment benefits: Amounts arising during the period:
Net experience gain (loss) (1,402 ) 497 (905 ) Prior service cost 3 (1 ) 2
Reclassification to net earnings: Net experience loss 49 (17 ) 32 Prior service cost 9 (3 ) 6
$ (1,800 ) $ 486 (1,314 ) Total comprehensive income $ (168 ) 2007 Net income $ 1,102 Other comprehensive income:
Foreign currency translation adjustments $ 4 $ — 4 Cash flow hedges:
Unrealized loss on cash flow hedges 34 (11 ) 23 Reclassification to net earnings 5 (1 ) 4
Postretirement and postemployment benefits: Amounts arising during the period:
Net experience gain (loss) 187 (68 ) 119 Prior service cost 7 (4 ) 3
Reclassification to net earnings: Net experience loss 89 (30 ) 59 Prior service cost 10 (3 ) 7
$ 336 $ (117 ) 219 Total comprehensive income $ 1,321
(millions) 2009 2008 Foreign currency translation adjustments $ (771 ) $ (836 ) Cash flow hedges — unrealized net loss (30 ) (24 ) Postretirement and postemployment benefits:
Net experience loss (1,104 ) (1,235 ) Prior service cost (61 ) (46 ) Total accumulated other comprehensive loss $ (1,966 ) $ (2,141 )
(millions)
Operating
leases
Capital
leases 2010 $ 141 $ 2 2011 122 1 2012 91 1 2013 66 1 2014 51 — 2015 and beyond 133 1 Total minimum payments $ 604 $ 6 Amount representing interest (1 )

The Company has provided various standard indemnifications in agreements to sell and purchase business assets and lease facilities over the past several years, related primarily to pre-existing tax, environmental, and employee benefit obligations. Certain of these indemnifications are limited by agreement in either amount and/or term and others are unlimited. The Company has also provided various “hold harmless” provisions within certain service type agreements. Because the Company is not currently aware of any actual exposures associated with these indemnifications, management is unable to estimate the maximum potential future payments to be made. At January 2, 2010, the Company had not recorded any liability related to these indemnifications. 38
Obligations under capital leases 5 Obligations due within one year (2 ) Long-term obligations under capital leases $ 3

NOTE 6 DEBT
The following table presents the components of notes payable at year end 2009 and 2008:
Long-term debt at year end consisted primarily of issuances of fixed rate U.S. Dollar Notes, as follows:
39
(dollars in millions) 2009 2008
Principal amount
Effective interest
rate Principal amount
Effective interest
rate U.S. commercial paper $ — — $ 1,272 4.1% Canadian commercial paper — — 38 2.8% Other 44 77 $ 44 $ 1,387
(millions) 2009 2008 (a) 7.45% U.S. Dollar Debentures due 2031 $ 1,089 $ 1,089 (a) 6.6% U.S. Dollar Notes due 2011 951 1,426 (b) 5.125% U.S. Dollar Notes due 2012 749 749 (c) 4.25% U.S. Dollar Notes due 2013 787 792 (d) 4.45% U.S. Dollar Notes due 2016 748 — (e) 4.15% U.S. Dollar Notes due 2019 498 — Other 14 13
4,836 4,069 Less current maturities (1 ) (1 ) Balance at year end $ 4,835 $ 4,068
(a) In March 2001, the Company issued $4.6 billion of long-term debt instruments, primarily to finance the acquisition of Keebler Foods Company. The preceding table reflects the remaining principal amounts outstanding as of year-end 2009 and 2008. The effective interest rates on these Notes, reflecting issuance discount and swap settlement, were as follows: due 2011-7.08%; due 2031-7.62%. Initially, these instruments were privately placed, or sold outside the United States, in reliance on exemptions from registration under the Securities Act of 1933, as amended (the 1933 Act). The Company then exchanged new debt securities for these initial debt instruments, with the new debt securities being substantially identical in all respects to the initial debt instruments, except for being registered under the 1933 Act. These debt securities contain standard events of default and covenants. The Notes due 2011 and the Debentures due 2031 may be redeemed in whole or in part by the Company at any time at prices determined under a formula (but not less than 100% of the principal amount plus unpaid interest to the redemption date). The Company redeemed $72 million of the Notes due 2011 in December 2007, and another $482 million in December 2009. The Company incurred $35 million of interest expense and $3 million of accelerated losses on interest rate swaps previously recorded in accumulated other comprehensive income in connection with the 2009 tender offer. In May 2009, the Company entered into interest rate swaps with notional amounts totaling $400 million, which effectively converted a portion of the Notes due 2011 from a fixed rate to a floating rate obligation for the remainder of the ten-year term. These derivative instruments, which were designated as fair value hedges of the debt obligation, resulted in an effective interest rate of 5.78% as of January 2, 2010 on the portion of the debt related to the interest rate swaps. The fair value adjustment for the interest rate swaps was $6 million, and was recorded as an increase in the hedged debt balance at January 2, 2010.
(b) In December 2007, the Company issued $750 million of five-year 5.125% fixed rate U.S. Dollar Notes, using the proceeds from these Notes to replace a portion of its U.S. commercial paper. These Notes were issued under an existing shelf registration statement. The effective interest rate on these Notes, reflecting issuance discount and swap settlement, is 5.12%. The Notes contain customary covenants that limit the ability of the Company and its restricted subsidiaries (as defined) to incur certain liens or enter into certain sale and lease-back transactions. The customary covenants also contain a change of control provision. In May 2009, the Company entered into interest rate swaps with notional amounts totaling $750 million, which effectively converted these Notes from a fixed rate to a floating rate obligation for the remainder of the five-year term. These derivative instruments, which were designated as fair value hedges of the debt obligation, resulted in an effective interest rate of 3.42% as of January 2, 2010. The fair value adjustment for the interest rate swaps was $1 million, and was recorded as a decrease in the hedged debt balance at January 2, 2010.
(c) On March 6, 2008, the Company issued $750 million of five-year 4.25% fixed rate U.S. Dollar Notes, using the proceeds from these Notes to retire a portion of its U.S. commercial paper. These Notes were issued under an existing shelf registration statement. The effective interest rate on these Notes, reflecting issuance discount and swap settlement, is 4.29%. The Notes contain customary covenants that limit the ability of the Company and its restricted subsidiaries (as defined) to incur certain liens or enter into certain sale and lease-back transactions. The customary covenants also contain a change of control provision. In conjunction with this debt issuance, the Company entered into interest rate swaps with notional amounts totaling $750 million, which effectively converted this debt from a fixed rate to a floating rate obligation for the duration of the five-year term. These derivative instruments, which were designated as fair value hedges of the debt obligation, resulted in an effective interest rate of 1.17% as of January 2, 2010. The fair value adjustment for the interest rate swaps was $38 million, and was recorded as an increase in the hedged debt balance at January 2, 2010.
(d) On May 18, 2009, the Company issued $750 million of seven-year 4.45% fixed rate U.S. Dollar Notes, using net proceeds from these Notes to retire a portion of its commercial paper. The effective interest rate on these Notes, reflecting issuance discount and swap settlement, is 4.46%. The Notes contain customary covenants that limit the ability of the Company and its restricted subsidiaries (as defined) to incur certain liens or enter into certain sale and lease-back transactions. The customary covenants also contain a change of control provision.
(e) On November 15, 2009, the Company issued $500 million of ten-year 4.15% fixed rate U.S. Dollar Notes, using net proceeds from these Notes to retire a portion of its 6.6% U.S. Dollar Notes due 2011. The effective interest rate on these Notes, reflecting issuance discount and swap settlement, is 4.23%. The newly issued Notes contain customary covenants that limit the ability of the Company and its restricted subsidiaries (as defined) to incur certain liens or enter into certain sale and lease-back transactions. The customary covenants also contain a change of control provision.

In February 2007, the Company and two of its subsidiaries (the Issuers) established a program under which the Issuers may issue euro-commercial paper notes up to a maximum aggregate amount outstanding at any time of $750 million or its equivalent in alternative currencies. The notes may have maturities ranging up to 364 days and will be senior unsecured obligations of the applicable Issuer. Notes issued by subsidiary Issuers will be guaranteed by the Company. The notes may be issued at a discount or may bear fixed or floating rate interest or a coupon calculated by reference to an index or formula. As of January 2, 2010 and January 3, 2009, no notes were outstanding under this program.
At January 2, 2010, the Company had $2.3 billion of short-term lines of credit, virtually all of which were unused and available for borrowing on an unsecured basis. These lines were comprised principally of an unsecured Five-Year Credit Agreement, which the Company entered into during November 2006 and expires in 2011. The agreement allows the Company to borrow, on a revolving credit basis, up to $2.0 billion, to obtain letters of credit in an aggregate amount up to $75 million, and to provide a procedure for lenders to bid on short-term debt of the Company. The agreement contains customary covenants and warranties, including specified restrictions on indebtedness, liens, sale and leaseback transactions, and a specified interest coverage ratio. If an event of default occurs, then, to the extent permitted, the administrative agent may terminate the commitments under the credit facility, accelerate any outstanding loans, and demand the deposit of cash collateral equal to the lender’s letter of credit exposure plus interest.
The Company entered into a $400 million unsecured 364-Day Credit Agreement effective January 31, 2007, containing customary covenants, warranties, and restrictions similar to those described herein for the Five-Year Credit Agreement. The facility was available for general corporate purposes, including commercial paper back-up. The $400 million Credit Agreement expired at the end of January 2008 and the Company did not renew it.
Scheduled principal repayments on long-term debt are (in millions): 2010–$1; 2011–$946; 2012–$751; 2013–$752; 2014–$8; 2015 and beyond–$2,351.
Interest paid was (in millions): 2009–$302; 2008–$305; 2007–$305. Interest expense capitalized as part of the construction cost of fixed assets was (in millions): 2009–$3; 2008–$6; 2007–$5.
NOTE 7 STOCK COMPENSATION
The Company uses various equity-based compensation programs to provide long-term performance incentives for its global workforce. Currently, these incentives consist principally of stock options, and to a lesser extent, executive performance shares and restricted stock grants. The Company also sponsors a discounted stock purchase plan in the United States and matching-grant programs in several international locations. Additionally, the Company awards restricted stock to its outside directors. These awards are administered through several plans, as described within this Note.
The 2009 Long-Term Incentive Plan (2009 Plan), approved by shareholders in 2009, permits awards to employees and officers in the form of incentive and non-qualified stock options, performance units, restricted stock or restricted stock units, and stock appreciation rights. The 2009 Plan, which replaced the 2003 Long-Term Incentive Plan (2003 Plan), authorizes the issuance of a total of (a) 27 million shares; plus (b) the total number of shares as to which awards granted under the 2009 Plan or the 2003 or 2001 Incentive Plans expire or are forfeited, terminated or settled in cash, with no more than 5 million shares to be issued in satisfaction of performance units, performance-based restricted shares and other awards (excluding stock options and stock appreciation rights), with additional annual limitations on awards or payments to individual participants. Options granted under the 2009 Plan generally vest over three years while options granted under the 2003 Plan vest over two years. At January 2, 2010, there were 27 million remaining authorized, but unissued, shares under the 2009 Plan. Although 2.8 million shares remained available for grant under the 2003 Plan, no new awards will be granted, and the 2003 Plan will remain in existence solely for the purpose of addressing the rights of holders of existing awards already granted under the plan.
The Non-Employee Director Stock Plan (2009 Director Plan) was approved by shareholders in 2009 and allows each eligible non-employee director to receive shares of the Company’s common stock annually. The number of shares granted pursuant to each annual award will be determined by the Nominating and Governance Committee of the Board of Directors. The 2009 Director Plan, which replaced the 2000 Non-Employee Director Stock Plan (2000 Director Plan), reserves 500,000 shares for issuance, plus the total number of shares as to which awards granted under the 2009 Director Plan or the 2000 Director Plans expire or are forfeited, terminated or settled in cash. The 2000 Director Plan allowed each eligible non-employee director to receive 2,100 shares of the Company’s common stock annually and annual grants of options to purchase 5,000 shares of the Company’s common stock. Under both the 2009 and 2000 Director Plans, shares (other than stock options) are placed in the Kellogg Company Grantor Trust for Non-Employee Directors (the Grantor Trust). Under the terms of the Grantor Trust, shares are available to a director only upon termination of service on the 40

Board. Under the 2009 Director Plan, 32,510 shares were awarded in 2009. Under the 2000 Director Plan, awards were as follows: 2008–54,465 options and 19,964 shares; 2007–51,791 options and 21,702 shares. No awards were granted under the 2000 Director Plan during 2009. Although 0.3 million shares remained available for grant under the 2000 Director Plan, no new awards will be granted, and the plan will remain in existence solely for the purpose of addressing the rights of holders of existing awards already granted under the plan. Stock options granted to directors under the 2000 Director Plan are included in the option activity tables within this Note.
The 2002 Employee Stock Purchase Plan was approved by shareholders in 2002 and permits eligible employees to purchase Company stock at a discounted price. This plan allows for a maximum of 2.5 million shares of Company stock to be issued at a purchase price equal to 95% of the fair market value of the stock on the last day of the quarterly purchase period. Total purchases through this plan for any employee are limited to a fair market value of $25,000 during any calendar year. The Plan was amended in 2007. Prior to amendment, Company stock was issued at a purchase price equal to 85% of the fair market value of the stock on the first or last day of the quarterly purchase period. At January 2, 2010, there were approximately 0.9 million remaining authorized, but unissued, shares under this plan. Shares were purchased by employees under this plan as follows (approximate number of shares): 2009–159,000; 2008–157,000; 2007–232,000. Options granted to employees to purchase discounted stock under this plan are included in the option activity tables within this Note.
Additionally, during 2002, an international subsidiary of the Company established a stock purchase plan for its employees. Subject to limitations, employee contributions to this plan are matched 1:1 by the Company. Under this plan, shares were granted by the Company to match an approximately equal number of shares purchased by employees as follows (approximate number of shares): 2009–74,000; 2008–78,000; 2007–75,000.
Compensation expense for all types of equity-based programs and the related income tax benefit recognized were as follows:
Pre-tax compensation expense for 2008 included $4 million of expense related to the modification of certain stock options to eliminate the accelerated ownership feature (AOF) and $13 million representing cash compensation to holders of modified stock options to replace the value of the AOF, which is discussed in the section, “Stock options.”
As of January 2, 2010, total stock-based compensation cost related to nonvested awards not yet recognized was approximately $27 million and the weighted-average period over which this amount is expected to be recognized was approximately 2 years.
Cash flows realized upon exercise or vesting of stock-based awards in the periods presented are included in the following table. Tax benefits realized upon exercise or vesting of stock-based awards generally represent the tax benefit of the difference between the exercise price and the strike price of the option.
Cash used by the Company to settle equity instruments granted under stock-based awards was insignificant.
Shares used to satisfy stock-based awards are normally issued out of treasury stock, although management is authorized to issue new shares to the extent permitted by respective plan provisions. Refer to Note 4 for information on shares issued during the periods presented to employees and directors under various long-term incentive plans and share repurchases under the Company’s stock repurchase authorizations. The Company does not currently have a policy of repurchasing a specified number of shares issued under employee benefit programs during any particular time period.
Stock options During 2009, non-qualified stock options were granted to eligible employees under the 2009 Plan with exercise prices equal to the fair market value of the Company’s stock on the grant date, a contractual term of ten years, and a three-year graded vesting period.
During 2007 and 2008, non-qualified stock options were granted to eligible employees under the 2003 Plan with exercise prices equal to the fair market value of the Company’s stock on the grant date, a contractual term of ten years, and a two-year graded vesting period. Grants to outside directors under the Director Plan included similar terms, but vested immediately.
41
(millions) 2009 2008 2007 Pre-tax compensation expense $ 48 $ 74 $ 81 Related income tax benefit $ 17 $ 26 $ 29
(millions) 2009 2008 2007 Total cash received from option exercises and similar instruments $ 131 $ 175 $ 163 Tax benefits realized upon exercise or vesting of stock-based awards:
Windfall benefits classified as financing cash flow $ 4 $ 12 $ 15 Other amounts classified as operating cash flow 12 17 11 Total $ 16 $ 29 $ 26
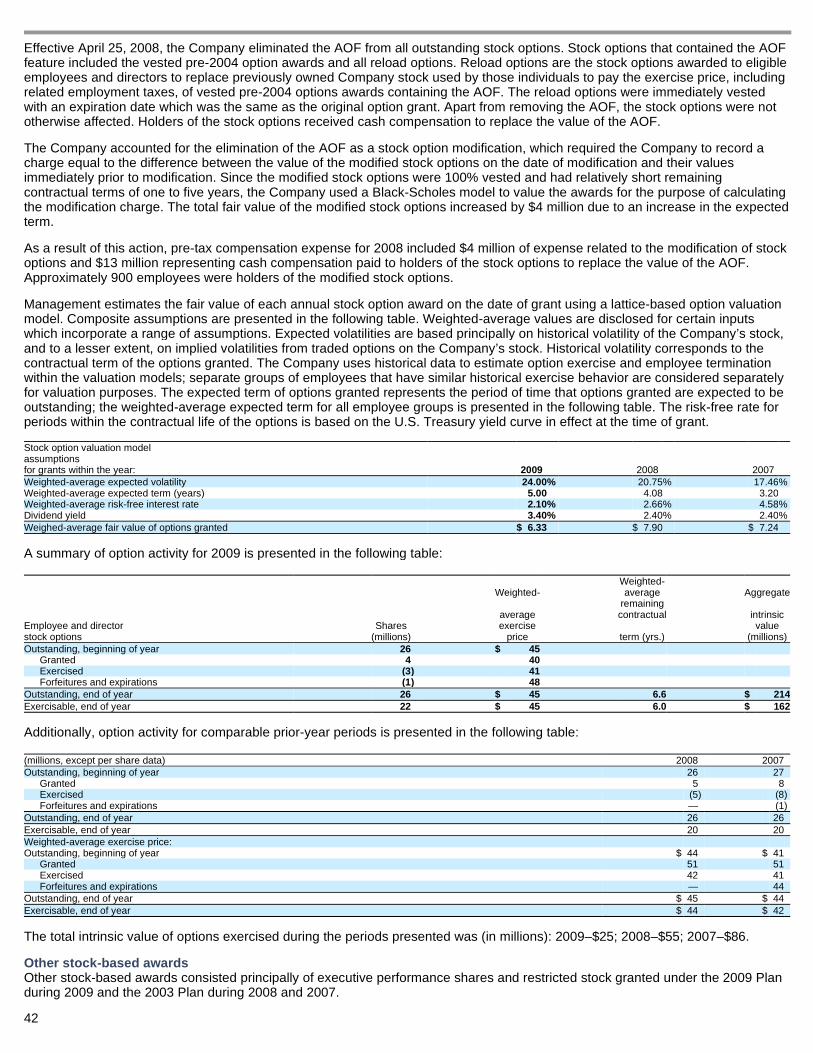
Effective April 25, 2008, the Company eliminated the AOF from all outstanding stock options. Stock options that contained the AOF feature included the vested pre-2004 option awards and all reload options. Reload options are the stock options awarded to eligible employees and directors to replace previously owned Company stock used by those individuals to pay the exercise price, including related employment taxes, of vested pre-2004 options awards containing the AOF. The reload options were immediately vested with an expiration date which was the same as the original option grant. Apart from removing the AOF, the stock options were not otherwise affected. Holders of the stock options received cash compensation to replace the value of the AOF.
The Company accounted for the elimination of the AOF as a stock option modification, which required the Company to record a charge equal to the difference between the value of the modified stock options on the date of modification and their values immediately prior to modification. Since the modified stock options were 100% vested and had relatively short remaining contractual terms of one to five years, the Company used a Black-Scholes model to value the awards for the purpose of calculating the modification charge. The total fair value of the modified stock options increased by $4 million due to an increase in the expected term.
As a result of this action, pre-tax compensation expense for 2008 included $4 million of expense related to the modification of stock options and $13 million representing cash compensation paid to holders of the stock options to replace the value of the AOF. Approximately 900 employees were holders of the modified stock options.
Management estimates the fair value of each annual stock option award on the date of grant using a lattice-based option valuation model. Composite assumptions are presented in the following table. Weighted-average values are disclosed for certain inputs which incorporate a range of assumptions. Expected volatilities are based principally on historical volatility of the Company’s stock, and to a lesser extent, on implied volatilities from traded options on the Company’s stock. Historical volatility corresponds to the contractual term of the options granted. The Company uses historical data to estimate option exercise and employee termination within the valuation models; separate groups of employees that have similar historical exercise behavior are considered separately for valuation purposes. The expected term of options granted represents the period of time that options granted are expected to be outstanding; the weighted-average expected term for all employee groups is presented in the following table. The risk-free rate for periods within the contractual life of the options is based on the U.S. Treasury yield curve in effect at the time of grant.
A summary of option activity for 2009 is presented in the following table:
Additionally, option activity for comparable prior-year periods is presented in the following table:
The total intrinsic value of options exercised during the periods presented was (in millions): 2009–$25; 2008–$55; 2007–$86.
Other stock-based awards Other stock-based awards consisted principally of executive performance shares and restricted stock granted under the 2009 Plan during 2009 and the 2003 Plan during 2008 and 2007. 42
Stock option valuation model assumptions for grants within the year: 2009 2008 2007 Weighted-average expected volatility 24.00 % 20.75 % 17.46 % Weighted-average expected term (years) 5.00 4.08 3.20 Weighted-average risk-free interest rate 2.10 % 2.66 % 4.58 % Dividend yield 3.40 % 2.40 % 2.40 % Weighed-average fair value of options granted $ 6.33 $ 7.90 $ 7.24
Employee and director stock options
Shares (millions)
Weighted-
average exercise
price
Weighted- average
remaining contractual
term (yrs.)
Aggregate
intrinsic value
(millions) Outstanding, beginning of year 26 $ 45
Granted 4 40 Exercised (3 ) 41 Forfeitures and expirations (1 ) 48
Outstanding, end of year 26 $ 45 6.6 $ 214 Exercisable, end of year 22 $ 45 6.0 $ 162
(millions, except per share data) 2008 2007 Outstanding, beginning of year 26 27
Granted 5 8 Exercised (5 ) (8 ) Forfeitures and expirations — (1 )
Outstanding, end of year 26 26 Exercisable, end of year 20 20 Weighted-average exercise price: Outstanding, beginning of year $ 44 $ 41
Granted 51 51 Exercised 42 41 Forfeitures and expirations — 44
Outstanding, end of year $ 45 $ 44 Exercisable, end of year $ 44 $ 42

In 2009, 2008 and 2007, the Company made performance share awards to a limited number of senior executive-level employees, which entitles these employees to receive a specified number of shares of the Company’s common stock on the vesting date, provided cumulative three-year targets are achieved. The cumulative three-year targets involved cost savings for the 2009 grant, operating profit for the 2008 grant and cash flow for the 2007 grant. Management estimates the fair value of performance share awards based on the market price of the underlying stock on the date of grant, reduced by the present value of estimated dividends foregone during the performance period. The 2009, 2008 and 2007 target grants (as revised for non-vested forfeitures and other adjustments) currently correspond to approximately 179,000, 165,000 and 180,000 shares, respectively, with a grant-date fair value of approximately $36, $47, and $46 per share. The actual number of shares issued on the vesting date could range from zero to 200% of target, depending on actual performance achieved. Based on the market price of the Company’s common stock at year-end 2009, the maximum future value that could be awarded on the vesting date was (in millions): 2009 award–$19; 2008 award–$18; and 2007 award–$14. The 2006 performance share award, payable in stock, was settled at 200% of target in February 2009 for a total dollar equivalent of $19 million.
The Company also periodically grants restricted stock and restricted stock units to eligible employees under the 2009 Plan during 2009 and under the 2003 Plan during previous years presented. Restrictions with respect to sale or transferability generally lapse after three years and the grantee is normally entitled to receive shareholder dividends during the vesting period. Management estimates the fair value of restricted stock grants based on the market price of the underlying stock on the date of grant. A summary of restricted stock activity for the year ended January 2, 2010, is presented in the following table:
Grants of restricted stock and restricted stock units for comparable prior-year periods were: 2008–162,000; 2007–55,000.
The total fair value of restricted stock and restricted stock units vesting in the periods presented was (in millions): 2009–$3; 2008–$7; 2007–$6. NOTE 8 PENSION BENEFITS
The Company sponsors a number of U.S. and foreign pension plans to provide retirement benefits for its employees. The majority of these plans are funded or unfunded defined benefit plans, although the Company does participate in a limited number of multiemployer or other defined contribution plans for certain employee groups. Defined benefits for salaried employees are generally based on salary and years of service, while union employee benefits are generally a negotiated amount for each year of service. The Company uses its fiscal year end as the measurement date for its defined benefit plans.
Obligations and funded status The aggregate change in projected benefit obligation, plan assets, and funded status is presented in the following tables.
Employee restricted stock and restricted stock units
Shares (thousands)
Weighted-
average grant-date
fair value
Non-vested, beginning of year 377 $ 48 Granted 68 47 Vested (185 ) 48 Forfeited (4 ) 51 Non-vested, end of year 256 $ 48
(millions) 2009 2008 Change in projected benefit obligation Beginning of year $ 3,121 $ 3,314 Service cost 79 85 Interest cost 196 197 Plan participants' contributions 4 3 Amendments 30 11 Actuarial gain (loss) 264 (18 ) Benefits paid (183 ) (211 ) Curtailment and special termination benefits 3 11 Foreign currency adjustments 102 (271 ) End of year $ 3,616 $ 3,121 Change in plan assets Fair value beginning of year $ 2,574 $ 3,613 Actual return on plan assets 719 (930 ) Employer contributions 87 354 Plan participants' contributions 4 3 Benefits paid (158 ) (177 ) Special termination benefits — 3 Foreign currency adjustments 108 (292 ) Fair value end of year $ 3,334 $ 2,574 Funded status $ (282 ) $ (547 ) Amounts recognized in the Consolidated
Balance Sheet consist of Other assets $ 160 $ 96 Other current liabilities (12 ) (12 ) Other liabilities (430 ) (631 ) Net amount recognized $ (282 ) $ (547 ) Amounts recognized in accumulated other

43
comprehensive income consist of Net experience loss $ 1,287 $ 1,432 Prior service cost 102 82 Net amount recognized $ 1,389 $ 1,514

The accumulated benefit obligation for all defined benefit pension plans was $3.32 billion and $2.85 billion at January 2, 2010 and January 3, 2009, respectively. Information for pension plans with accumulated benefit obligations in excess of plan assets were:
Expense The components of pension expense are presented in the following table. Pension expense for defined contribution plans relates principally to multiemployer plans in which the Company participates on behalf of certain unionized workforces in the United States. The 2009 defined contribution plan expense includes $12 million related to multi-employer plan obligations. The final calculation of this liability is pending full-year 2010 contribution base units and is therefore subject to adjustment. The associated cash obligation is payable over a maximum 20-year period; management has not determined the actual period over which the payments will be made.
Any arising obligation-related experience gain or loss is amortized using a straight-line method over the average remaining service period of active plan participants. Any asset-related experience gain or loss is recognized as described in the Assumptions section. The estimated net experience loss and prior service cost for defined benefit pension plans that will be amortized from accumulated other comprehensive income into pension expense over the next fiscal year are approximately $78 million and $14 million, respectively.
Certain of the Company’s subsidiaries sponsor 401(k) or similar savings plans for active employees. Expense related to these plans was (in millions): 2009–$37; 2008–$37; 2007–$36. Company contributions to these savings plans approximate annual expense. Company contributions to multiemployer and other defined contribution pension plans approximate the amount of annual expense presented in the preceding table. Beginning in 2010, new U.S. salaried and non-union hourly employees will not be eligible to participate in the defined benefit pension plan. These employees will be eligible to participate in an enhanced defined contribution plan. The change does not impact employees with a hire date before December 31, 2009.
Assumptions The worldwide weighted-average actuarial assumptions used to determine benefit obligations were:
The worldwide weighted-average actuarial assumptions used to determine annual net periodic benefit cost were:
To determine the overall expected long-term rate of return on plan assets, the Company models expected returns over a 20-year investment horizon with respect to the specific investment mix of its major plans. The return assumptions used reflect a combination of rigorous historical performance analysis and forward-looking views of the financial markets including consideration of current yields on long-term bonds, price-earnings ratios of the major stock market indices, and long-term inflation. The U.S. model, which corresponds to approximately 68% of consolidated pension and other postretirement benefit plan assets, incorporates a long-term inflation assumption of 2.5% and an active management premium of 1% (net of fees) validated by historical analysis. Similar methods are used for various foreign plans with invested assets, reflecting local economic conditions. Although management reviews the Company’s expected long-term rates of return annually, the benefit trust investment performance for one particular year does not, by itself, significantly influence this evaluation. The expected rates of return are generally not revised, provided these rates continue to fall within a “more likely than not” corridor of between the 25th and 75th percentile of expected long-term returns, as determined by the Company’s modeling process. The expected rate of return for 2009 of 8.9% equated to approximately the 58th percentile expectation. Any future variance between the expected and actual rates of return on plan assets is recognized in the calculated value of plan assets over a five-year period and once recognized, experience gains and losses are amortized using a declining-balance method over the average remaining service period of active plan participants.
(millions) 2009 2008 Projected benefit obligation $ 2,759 $ 2,385 Accumulated benefit obligation $ 2,601 $ 2,236 Fair value of plan assets $ 2,317 $ 1,759
(millions) 2009 2008 2007 Service cost $ 79 $ 85 $ 96 Interest cost 196 197 188 Expected return on plan assets (315 ) (300 ) (282 ) Amortization of unrecognized prior service cost 13 12 13 Recognized net loss 46 36 64 Curtailment and special termination benefits—net loss 6 12 4 Pension expense:
Defined benefit plans 25 42 83 Defined contribution plans 38 22 25 Total $ 63 $ 64 $ 108
2009 2008 2007 Discount rate 5.7% 6.2% 6.2% Long-term rate of compensation increase 4.1% 4.2% 4.4%
2009 2008 2007 Discount rate 6.2% 6.2% 5.7% Long-term rate of compensation increase 4.2% 4.4% 4.4% Long-term rate of return on plan assets 8.9% 8.9% 8.9%

44

To conduct the annual review of discount rates, the Company selected the discount rate using the spot yield curve underlying the Citigroup Index (published monthly by Citigroup). Using this methodology, the Company determined the single discount rate for the pension, postretirement and postemployment plans equivalent to discounting against the entire Citigroup spot yield curve. The measurement dates for our defined benefit plans are consistent with the Company’s fiscal year end. Accordingly, the Company selects discount rates to measure benefit obligations that are consistent with market indices during December of each year.
Plan assets For the year ended January 2, 2010, the Company adopted a new accounting standard requiring additional disclosure for Plan assets of defined benefit pension and other post-retirement plans. As required by the standard, the Company categorized Plan assets within a three level fair value hierarchy described as follows:
Investments stated at fair value as determined by quoted market prices (Level 1) include:
Cash and cash equivalents: Value based on cost, which approximate fair value.
Corporate stock, common: Value based on the last sales price on the primary exchange.
Mutual funds: Valued at the net asset value of shares held by the Plan at year end.
Investments stated at estimated fair value using significant observable inputs (Level 2) include:
Cash and cash equivalents: Institutional short-term investment vehicles valued daily.
Collective trusts : Value based on the net asset value of units held at year end.
Bonds: Value based on matrices or models from pricing vendors.
Investments stated at estimated fair value using significant unobservable inputs (Level 3) include:
Real Estate: Value based on the net asset value of units held at year end. The fair value of real estate holdings is based on market data including earnings capitalization, discounted cash flow analysis, comparable sales transactions or a combination of these methods.
Bonds: Value based on matrices or models from brokerage firms. A limited number of the investments are in default.
The Company’s investment strategy for its major defined benefit plans is to maintain a diversified portfolio of asset classes with the primary goal of meeting long-term cash requirements as they become due. Assets are invested in a prudent manner to maintain the security of funds while maximizing returns within the Plan’s investment policy. The investment policy specifies the type of investment vehicles appropriate for the Plan, asset allocation guidelines, criteria for the selection of investment managers, procedures to monitor overall investment performance as well as investment manager performance. It also provides guidelines enabling Plan fiduciaries to fulfill their responsibilities.
The current weighted-average target asset allocation reflected by this strategy is: equity securities–76%; debt securities–23%; other–1%. Investment in Company common stock represented 1.6% and 1.8% of consolidated plan assets at January 2, 2010 and January 3, 2009, respectively. Plan funding strategies are influenced by tax regulations and funding requirements. The Company currently expects to contribute approximately $35 million to its defined benefit pension plans during 2010.
Level 3 gains and losses Changes in the fair value of the Plan’s Level 3 assets are summarized as follows:
(millions) Total
Level 1 Total
Level 2 Total
Level 3 Total Cash and cash equivalents $ 55 $ 116 $ — $ 171 Corporate stock, common 713 — — 713 Mutual funds:
Equity investments 493 — — 493 Collective trusts:
Equity investments — 1,147 — 1,147 Debt investments — 285 — 285
Bonds, corporate — 278 3 281 Bonds, government — 78 — 78 Government mortgage backed securities — 74 — 74 Bonds, other — 57 4 61 Real estate — — 33 33 Other — — (2 ) (2 ) Total $ 1,261 $ 2,035 $ 38 $ 3,334
(millions)
Fair Value
January 3, 2009
Net Purchases,
Sales and
Other Gain
(Loss)
Transfer
Out
Fair Value
January 2, 2010
Bonds, corporate $ 11 (4 ) 1 (5 ) $ 3 Bonds, other 11 (6 ) 1 (2 ) 4

Benefit payments The following benefit payments, which reflect expected future service, as appropriate, are expected to be paid (in millions): 2010–$190; 2011–$216; 2012–$210; 2013–$208; 2014–$215; 2015 to 2019–$1,229.
45
Real estate 28 — 5 — 33 Other 3 (4 ) (1 ) — (2 ) Total $ 53 (14 ) 6 (7 ) $ 38
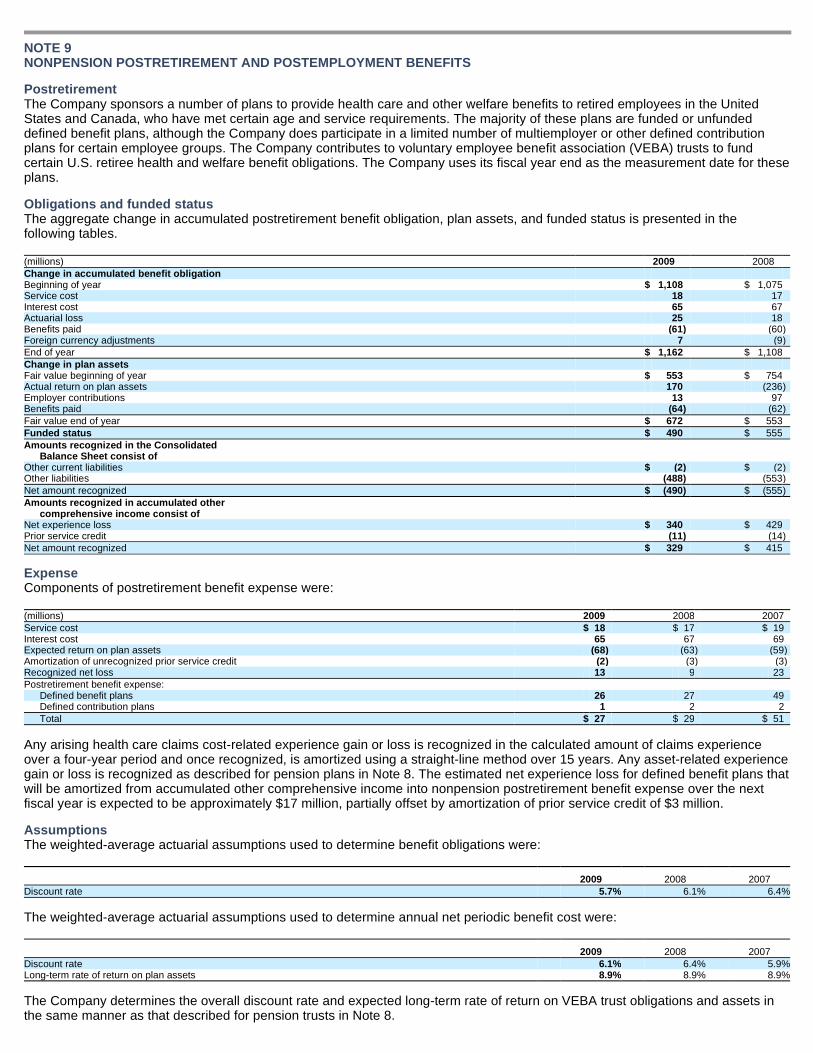
NOTE 9 NONPENSION POSTRETIREMENT AND POSTEMPLOYMENT BENEFI TS
Postretirement The Company sponsors a number of plans to provide health care and other welfare benefits to retired employees in the United States and Canada, who have met certain age and service requirements. The majority of these plans are funded or unfunded defined benefit plans, although the Company does participate in a limited number of multiemployer or other defined contribution plans for certain employee groups. The Company contributes to voluntary employee benefit association (VEBA) trusts to fund certain U.S. retiree health and welfare benefit obligations. The Company uses its fiscal year end as the measurement date for these plans.
Obligations and funded status The aggregate change in accumulated postretirement benefit obligation, plan assets, and funded status is presented in the following tables.
Expense Components of postretirement benefit expense were:
Any arising health care claims cost-related experience gain or loss is recognized in the calculated amount of claims experience over a four-year period and once recognized, is amortized using a straight-line method over 15 years. Any asset-related experience gain or loss is recognized as described for pension plans in Note 8. The estimated net experience loss for defined benefit plans that will be amortized from accumulated other comprehensive income into nonpension postretirement benefit expense over the next fiscal year is expected to be approximately $17 million, partially offset by amortization of prior service credit of $3 million.
Assumptions The weighted-average actuarial assumptions used to determine benefit obligations were:
The weighted-average actuarial assumptions used to determine annual net periodic benefit cost were:
The Company determines the overall discount rate and expected long-term rate of return on VEBA trust obligations and assets in the same manner as that described for pension trusts in Note 8.
(millions) 2009 2008 Change in accumulated benefit obligation Beginning of year $ 1,108 $ 1,075 Service cost 18 17 Interest cost 65 67 Actuarial loss 25 18 Benefits paid (61 ) (60 ) Foreign currency adjustments 7 (9 ) End of year $ 1,162 $ 1,108 Change in plan assets Fair value beginning of year $ 553 $ 754 Actual return on plan assets 170 (236 ) Employer contributions 13 97 Benefits paid (64 ) (62 ) Fair value end of year $ 672 $ 553 Funded status $ 490 $ 555 Amounts recognized in the Consolidated
Balance Sheet consist of Other current liabilities $ (2 ) $ (2 ) Other liabilities (488 ) (553 ) Net amount recognized $ (490 ) $ (555 ) Amounts recognized in accumulated other
comprehensive income consist of Net experience loss $ 340 $ 429 Prior service credit (11 ) (14 ) Net amount recognized $ 329 $ 415
(millions) 2009 2008 2007 Service cost $ 18 $ 17 $ 19 Interest cost 65 67 69 Expected return on plan assets (68 ) (63 ) (59 ) Amortization of unrecognized prior service credit (2 ) (3 ) (3 ) Recognized net loss 13 9 23 Postretirement benefit expense:
Defined benefit plans 26 27 49 Defined contribution plans 1 2 2 Total $ 27 $ 29 $ 51
2009 2008 2007 Discount rate 5.7% 6.1% 6.4%
2009 2008 2007 Discount rate 6.1% 6.4% 5.9% Long-term rate of return on plan assets 8.9% 8.9% 8.9%

The assumed health care cost trend rate is 7.1% for 2010, decreasing gradually to 4.5% by the year 2015 and remaining at that level thereafter. These trend rates reflect the Company’s recent historical experience and management’s expectations regarding future trends. A one percentage point change in assumed health care cost trend rates would have the following effects:
46
(millions)
One percentage
point increase
One percentage
point decrease Effect on total of service and interest cost components $ 9 $ (8 ) Effect on postretirement benefit obligation $ 119 $ (100 )

Plan assets The fair value of Plan assets summarized by level within the fair value hierarchy described in Note 8, are as follows:
The Company’s asset investment strategy for its VEBA trusts is consistent with that described for its pension trusts in Note 8. The current target asset allocation is 75% equity securities and 25% debt securities. The Company currently expects to contribute approximately $15 million to its VEBA trusts during 2010.
Level 3 gains and losses The change in the fair value of the Plan’s Level 3 assets is summarized as follows:
Postemployment Under certain conditions, the Company provides benefits to former or inactive employees in the United States and several foreign locations, including salary continuance, severance, and long-term disability. The Company recognizes an obligation for any of these benefits that vest or accumulate with service. Postemployment benefits that do not vest or accumulate with service (such as severance based solely on annual pay rather than years of service) or costs arising from actions that offer benefits to employees in excess of those specified in the respective plans are charged to expense when incurred. The Company’s postemployment benefit plans are unfunded. Actuarial assumptions used are generally consistent with those presented for pension benefits in Note 8. The aggregate change in accumulated postemployment benefit obligation and the net amount recognized were:
Components of postemployment benefit expense were:
All gains and losses are recognized over the average remaining service period of active plan participants. The estimated net experience loss that will be amortized from accumulated other comprehensive income into postemployment benefit expense over the next fiscal year is approximately $4 million.
Benefit payments The following benefit payments, which reflect expected future service, as appropriate, are expected to be paid:
(millions) Total
Level 1 Total
Level 2 Total
Level 3 Total Cash and cash equivalents $ — $ 31 $ — $ 31 Corporate stock, common 132 4 — 136 Mutual funds:
Equity investments 122 — — 122 Debt investments 45 — — 45
Collective trusts: Equity investments — 202 — 202 Debt investments — 28 — 28
Bonds, corporate — 73 — 73 Bonds, government — 14 — 14 Government mortgage backed securities — 13 — 13 Bonds, other — 7 1 8 Total $ 299 $ 372 $ 1 $ 672
(millions)
Fair Value
January 3, 2009
Net Purchases,
Sales and Other Gain
Transfer
Out
Fair Value
January 2, 2010
Bonds, other $ 6 (2 ) 1 (4 ) $ 1
(millions) 2009 2008 Change in accumulated benefit obligation Beginning of year $ 65 $ 63 Service cost 6 5 Interest cost 4 4 Actuarial loss 8 1 Benefits paid (10 ) (7 ) Foreign currency adjustments 1 (1 ) End of year $ 74 $ 65 Funded status $ (74 ) $ (65 ) Amounts recognized in the Consolidated
Balance Sheet consist of Other current liabilities $ (7 ) $ (6 ) Other liabilities (67 ) (59 ) Net amount recognized $ (74 ) $ (65 ) Amounts recognized in accumulated other
comprehensive income consist of Net experience loss $ 39 $ 34 Net amount recognized $ 39 $ 34
(millions) 2009 2008 2007 Service cost $ 6 $ 5 $ 6 Interest cost 4 4 2 Recognized net loss 4 4 2 Postemployment benefit expense $ 14 $ 13 $ 10
(millions) Postretirement Postemployment 2010 $ 65 $ 8

47
2011 68 8 2012 70 8 2013 72 9 2014 74 9 2015-2019 401 53

NOTE 10 INCOME TAXES
Income before income taxes and the provision for U.S. federal, state, and foreign taxes on these earnings were:
The difference between the U.S. federal statutory tax rate and the Company’s effective income tax rate was:
As presented in the preceding table, the Company’s 2009 consolidated effective tax rate was 28.2%, as compared to 29.7% in 2008 and 28.7% in 2007. The 2009 effective tax rate reflects the favorable impact of various audit settlements as well as a U.S. deduction for qualified production activities as defined by the Internal Revenue Code. The deduction is based on U.S. manufacturing activities. The deduction for 2008 was limited due to contributions to the Company’s benefit plans. During 2009, the Company finalized its assessment of foreign earnings and capital to be repatriated under the prior year repatriation plan resulting in a favorable impact to the cost of remitted and unremitted foreign earnings.
At January 2, 2010, accumulated foreign subsidiary earnings of approximately $1.3 billion were considered indefinitely invested in those businesses. Accordingly, deferred income taxes have not been provided on these earnings and it is not practical to estimate the deferred tax impact of those earnings.
The 2008 effective tax rate reflects the favorable impact of various tax audit settlements. In conjunction with a planned international legal restructuring, management recorded a $33 million tax charge in the second quarter and an additional $9 million during the third and fourth quarters for a total charge of $42 million on $1 billion of unremitted foreign earnings and capital. During the year, the Company repatriated approximately $710 million of earnings and capital which carried a cash tax charge of $24 million. This amount was less than the charge recorded during the year due to the impact of favorable movements in foreign currency. This cost was further offset by foreign tax related items of $16 million, reducing the net cost of repatriation to $8 million. The Company has provided $18 million of deferred taxes related to the remaining $290 million of unremitted foreign earnings. These amounts are reflected in the cost of remitted and unremitted foreign earnings line item.
2007’s effective rate benefited from the favorable effect of discrete items in that year. In the first quarter of 2007, management implemented an international restructuring initiative which eliminated a foreign tax liability of approximately $40 million. Accordingly, the reversal was recorded within the Company’s consolidated provision for income taxes. The Company benefited from statutory rate reductions, primarily in the United Kingdom and in Germany which resulted in an $11 million reduction to income tax expense. During 2007, the Company repatriated approximately $327 million of current year foreign earnings, for a gross U.S. tax cost of $35 million. This cost was offset by foreign tax credit related items of $31 million, reducing the net cost of repatriation to $4 million.
Generally, the changes in valuation allowances on deferred tax assets and corresponding impacts on the effective income tax rate result from management’s assessment of the Company’s ability to utilize certain future tax deductions, operating losses and tax credit carryforwards prior to expiration. For 2009, the increase in valuation allowance primarily relates to a deduction in an International location for which the Company does not anticipate future realization. For 2007, the .5% rate reduction presented in the preceding table primarily reflects the reversal of a valuation allowance against U.S. foreign tax credits which were utilized in conjunction with the aforementioned 2007 foreign earnings repatriation. Total tax benefits of carryforwards at year-end 2009 and 2008 were approximately $37 million and $27 million, respectively, with related valuation allowances at year-end 2009 and 2008 of approximately $22 and $20 million. Of the total
(millions) 2009 2008 2007 Income before income taxes
United States $ 1,207 $ 1,030 $ 998 Foreign 477 601 548
$ 1,684 $ 1,631 $ 1,546 Income taxes
Currently payable Federal $ 331 $ 135 $ 395 State 39 3 30 Foreign 146 190 88
516 328 513 Deferred
Federal (8 ) 173 (74 ) State (3 ) 22 (3 ) Foreign (29 ) (38 ) 8
(40 ) 157 (69 ) Total income taxes $ 476 $ 485 $ 444
2009 2008 2007 U.S. statutory income tax rate 35.0% 35.0% 35.0% Foreign rates varying from 35% –4.2 –5.0 –4.0 State income taxes, net of federal benefit 1.4 1.0 1.1 Cost of remitted and unremitted foreign earnings –.8 1.6 2.3 Tax audit settlements –.9 –1.5 —Net change in valuation allowances .4 — –.5 Statutory rate changes, deferred tax impact .1 –.1 –.6 International restructuring — — –2.6 U.S. deduction for qualified production activities –1.6 — —Other –1.2 –1.3 –2.0 Effective income tax rate 28.2% 29.7% 28.7%

48

carryforwards at year-end 2009, approximately $1 million expire in 2010 with the remainder expiring after five years.
The following table provides an analysis of the Company’s deferred tax assets and liabilities as of year-end 2009 and 2008. The significant decrease in the “employee benefits” caption of the Company’s deferred tax asset during 2009 is related to pension contributions made at the end of 2008 and net experience gains associated with employer pension and other postretirement benefit plans that are recorded in other comprehensive income, net of tax.
The change in valuation allowance against deferred tax assets was:
Cash paid for income taxes was (in millions): 2009–$409; 2008–$397; 2007–$560. Income tax benefits realized from stock option exercises and deductibility of other equity-based awards are presented in Note 7.
Uncertain tax positions The Company files income taxes in the U.S. federal jurisdiction, and in various state, local, and foreign jurisdictions. For the past several years, the Company’s annual provision for U.S. federal income taxes has represented approximately 70% of the Company’s consolidated income tax provision. With limited exceptions, the Company is no longer subject to U.S. federal examinations by the Internal Revenue Service (IRS) for years prior to 2009. In 2008, the IRS commenced a focused review of the Company’s 2006 and 2007 U.S. federal income tax returns which was completed in the fourth quarter of 2009 with no material impact to the consolidated effective income tax rate. The Company was chosen to participate in the IRS’ Compliance Assurance Program (CAP) beginning with the 2008 tax year. The 2008 tax year was finalized in 2009, subject to a routine review by the Joint Committee of Taxation for refunds related to foreign tax credits. The Company is under examination for income and non-income tax filings in various state and foreign jurisdictions, most notably: 1) a U.S.-Canadian transfer pricing issue pending international arbitration (Competent Authority) with a related advanced pricing agreement for years 1997-2008 for which an extension through 2011 has been requested; and 2) an on-going examination of 2002-2007 U.K. income tax filings.
As of January 2, 2010, the Company has classified $22 million of unrecognized tax benefits as a current liability, representing several individually insignificant income tax positions under examination in various jurisdictions. Management’s estimate of reasonably possible changes in unrecognized tax benefits during the next twelve months is comprised of the current liability balance expected to be settled within one year, offset by approximately $4 million of projected additions related primarily to ongoing intercompany transfer pricing activity. Management is currently unaware of any issues under review that could result in significant additional payments, accruals, or other material deviation in this estimate.
Following is a reconciliation of the Company’s total gross unrecognized tax benefits as of the years ended January 2, 2010, January 3, 2009 and December 29, 2007. For the 2009 year, approximately $108 million represents the amount that, if recognized, would affect the Company’s effective income tax rate in future periods.
Deferred tax
assets Deferred tax
liabilities (millions) 2009 2008 2009 2008 U.S. state income taxes $ 8 $ 7 $ 60 $ 59 Advertising and promotion-related 26 23 4 10 Wages and payroll taxes 30 27 — —Inventory valuation 22 18 — 2 Employee benefits 393 479 42 26 Operating loss and credit carryforwards 37 27 — —Hedging transactions 15 22 — 5 Depreciation and asset disposals 18 17 313 299 Capitalized interest 7 7 11 12 Trademarks and other intangibles — — 467 461 Deferred compensation 50 51 — —Stock options 51 46 — —Unremitted foreign earnings — — 20 18 Other 67 44 12 9
724 768 929 901 Less valuation allowance (28 ) (22 ) — —
Total deferred taxes $ 696 $ 746 $ 929 $ 901 Net deferred tax asset (liability) $ (233 ) $ (155 ) Classified in balance sheet as: Other current assets $ 128 $ 112 Other current liabilities (7 ) (15 ) Other assets 71 48 Other liabilities (425 ) (300 ) Net deferred tax asset (liability) $ (233 ) $ (155 )
(millions) 2009 2008 2007 Balance at beginning of year $ 22 $ 22 $ 28 Additions charged to income tax expense 14 6 4 Reductions credited to income tax expense (7 ) (3 ) (12 ) Currency translation adjustments (1 ) (3 ) 2 Balance at end of year $ 28 $ 22 $ 22
(millions) 2009 2008 2007 Balance at beginning of year $ 132 $ 169 $ 143 Tax positions related to current year:
Additions 17 24 31 Reductions — — —
Tax positions related to prior years:
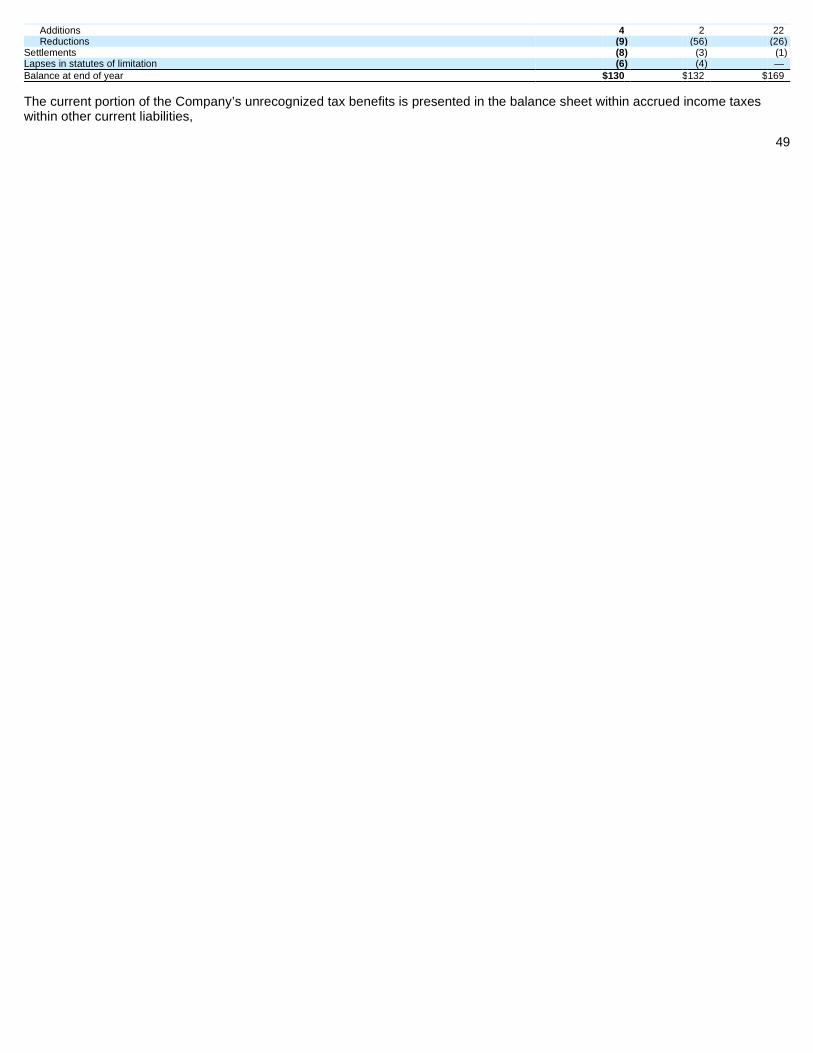
The current portion of the Company’s unrecognized tax benefits is presented in the balance sheet within accrued income taxes within other current liabilities,
49
Additions 4 2 22 Reductions (9 ) (56 ) (26 )
Settlements (8 ) (3 ) (1 ) Lapses in statutes of limitation (6 ) (4 ) — Balance at end of year $ 130 $ 132 $ 169

and the amount expected to be settled after one year is recorded in other liabilities.
The Company classifies income tax-related interest and penalties as interest expense and SGA expense, respectively. For the year ended January 2, 2010, the company recognized a reduction of $1 million of tax-related interest and penalties and had $25 million accrued at year end. For the year ended January 3, 2009, the Company recognized a reduction of $2 million of tax-related interest and penalties and had approximately $29 million accrued at January 3, 2009. For the year ended December 29, 2007, the Company recognized $9 million of tax-related interest and penalties and had $31 million accrued at December 29, 2007.
NOTE 11 FAIR VALUE MEASUREMENTS
The Company has categorized its financial assets and liabilities into a three-level fair value hierarchy, based on the nature of the inputs used in determining fair value. The hierarchy gives the highest priority to quoted prices in active markets for identical assets or liabilities (level 1) and the lowest priority to unobservable inputs (level 3). Following is a description of each category in the fair value hierarchy and the financial assets and liabilities of the Company that are included in each category at January 2, 2010 and January 3, 2009.
Level 1 — Financial assets and liabilities whose values are based on unadjusted quoted prices for identical assets or liabilities in an active market. For the Company, level 1 financial assets and liabilities consist primarily of commodity derivative contracts.
Level 2 — Financial assets and liabilities whose values are based on quoted prices in markets that are not active or model inputs that are observable either directly or indirectly for substantially the full term of the asset or liability. For the Company, level 2 financial assets and liabilities consist of interest rate swaps and over-the-counter commodity and currency contracts.
The Company’s calculation of the fair value of interest rate swaps is derived from a discounted cash flow analysis based on the terms of the contract and the interest rate curve. Commodity derivatives are valued using an income approach based on the commodity index prices less the contract rate multiplied by the notional amount. Foreign currency contracts are valued using an income approach based on forward rates less the contract rate multiplied by the notional amount.
Level 3 — Financial assets and liabilities whose values are based on prices or valuation techniques that require inputs that are both unobservable and significant to the overall fair value measurement. These inputs reflect management’s own assumptions about the assumptions a market participant would use in pricing the asset or liability. The Company did not have any level 3 financial assets or liabilities as of January 2, 2010, or January 3, 2009.
The following table presents the Company’s fair value hierarchy for those assets and liabilities measured at fair value on a recurring basis as of January 2, 2010 and January 3, 2009:
Financial instruments The carrying values of the Company’s short-term items, including cash, cash equivalents, accounts receivable, accounts payable and notes payable approximate fair value. The fair value of the Company’s long-term debt is calculated based on broker quotes and was approximately $5.2 billion at January 2, 2010, as compared to the carrying value of $4.8 billion.
Credit risk concentration The Company is exposed to credit loss in the event of nonperformance by counterparties on derivative financial and commodity contracts. Management believes a concentration of credit risk with respect to derivative counterparties is limited due to the credit ratings of the counterparties and the use of master netting and reciprocal collateralization agreements.
Master netting agreements apply in situations where the Company executes multiple contracts with the same counterparty. Certain counterparties represent a concentration of credit risk to the Company. If those counterparties fail to perform according to the terms of derivative contracts, this would result in a loss to the Company of $36 million as of January 2, 2010.
For certain derivative contracts, reciprocal collateralization agreements with counterparties call for the posting of collateral in the form of cash, treasury securities or letters of credit if a fair value loss position to the Company or our counterparties exceeds a certain amount. There were no collateral balance requirements at January 2, 2010. 50
Level 1 Level 2 Total (millions) 2009 2008 2009 2008 2009 2008 Assets:
Derivatives (recorded in other current assets) $ 4 $ 9 $ 7 $ 34 $ 11 $ 43 Derivatives (recorded in other assets) — — 44 43 44 43
Total assets $ 4 $ 9 $ 51 $ 77 $ 55 $ 86 Liabilities:
Derivatives (recorded in other current liabilities) $ — $ — $ (37 ) $ (17 ) $ (37 ) $ (17 ) Derivatives (recorded in other liabilities) — — (15 ) (4 ) (15 ) (4 )
Total liabilities $ — $ — $ (52 ) $ (21 ) $ (52 ) $ (21 )

Management believes concentrations of credit risk with respect to accounts receivable is limited due to the generally high credit quality of the Company’s major customers, as well as the large number and geographic dispersion of smaller customers. However, the Company conducts a disproportionate amount of business with a small number of large multinational grocery retailers, with the five largest accounts comprising approximately 30% of consolidated accounts receivable at January 2, 2010.
NOTE 12 DERIVATIVE INSTRUMENTS AND HEDGING ACTIVITIES
The Company adopted a new accounting standard regarding disclosures about derivative instruments and hedging activities as of the beginning of its 2009 fiscal year.
The Company is exposed to certain market risks such as changes in interest rates, foreign currency exchange rates, and commodity prices, which exist as a part of its ongoing business operations. Management uses derivative financial and commodity instruments, including futures, options, and swaps, where appropriate, to manage these risks. Instruments used as hedges must be effective at reducing the risk associated with the exposure being hedged and must be designated as a hedge at the inception of the contract.
The Company designates derivatives as cash flow hedges, fair value hedges, net investment hedges, or other contracts used to reduce volatility in the translation of foreign currency earnings to U.S. dollars. The fair value of derivative instruments is recorded in other current assets, other assets, other current liabilities or other liabilities. Gains and losses representing either hedge ineffectiveness, hedge components excluded from the assessment of effectiveness, or hedges of translational exposure are recorded in the Consolidated Statement of Income in other income (expense), net. Within the Consolidated Statement of Cash Flows, settlements of cash flow and fair value hedges are classified as an operating activity; settlements of all other derivatives are classified as a financing activity. As a matter of policy, the Company does not engage in trading or speculative hedging transactions.
Cash flow hedges Qualifying derivatives are accounted for as cash flow hedges when the hedged item is a forecasted transaction. Gains and losses on these instruments are recorded in other comprehensive income until the underlying transaction is recorded in earnings. When the hedged item is realized, gains or losses are reclassified from accumulated other comprehensive income (loss) (AOCI) to the Consolidated Statement of Income on the same line item as the underlying transaction. The cumulative net loss attributable to cash flow hedges recorded in AOCl at January 2, 2010, was $30 million, related to forward interest rate contracts settled during 2001, 2003 and 2009 in conjunction with fixed rate long-term debt issuances, 10-year natural gas price swaps entered into in 2006, commodity price cash flow hedges and net losses on foreign currency cash flow hedges. The interest rate contract losses will be reclassified into interest expense over the next 22 years. The natural gas swap losses will be reclassified to COGS over the next 7 years. Losses related to foreign currency and commodity price cash flow hedges will be reclassified into earnings during the next 18 months.
Fair value hedges Qualifying derivatives are accounted for as fair value hedges when the hedged item is a recognized asset, liability, or firm commitment. Gains and losses on these instruments are recorded in earnings, offsetting gains and losses on the hedged item.
Net investment hedges Qualifying derivative and nonderivative financial instruments are accounted for as net investment hedges when the hedged item is a nonfunctional currency investment in a subsidiary. Gains and losses on these instruments are included in foreign currency translation adjustments in AOCI.
Other contracts The Company also periodically enters into foreign currency forward contracts and options to reduce volatility in the translation of foreign currency earnings to U.S. dollars. Gains and losses on these instruments are recorded in other income (expense), net, generally reducing the exposure to translation volatility during a full-year period.
Foreign currency exchange risk The Company is exposed to fluctuations in foreign currency cash flows related primarily to third-party purchases, intercompany transactions and nonfunctional currency denominated third-party debt. The Company is also exposed to fluctuations in the value of foreign currency investments in subsidiaries and cash flows related to repatriation of these investments. Additionally, the Company is exposed to volatility in the translation of foreign currency denominated earnings to U.S. dollars. Management assesses foreign currency risk based on transactional cash flows and translational volatility and enters into forward contracts, options, and currency swaps to reduce fluctuations in net long or short currency positions. Forward contracts and options are generally less than 18 months duration. Currency swap agreements are established in conjunction with the term of underlying debt issues.
For foreign currency cash flow and fair value hedges, the assessment of effectiveness is generally based on
51

changes in spot rates. Changes in time value are reported in other income (expense), net.
The total notional amount of foreign currency derivative instruments was $1,588 million and $924 million at January 2, 2010 and January 3, 2009, respectively.
Interest rate risk The Company is exposed to interest rate volatility with regard to future issuances of fixed rate debt. The Company periodically uses interest rate swaps, including forward-starting swaps, to reduce interest rate volatility and funding costs associated with certain debt issues, and to achieve a desired proportion of variable versus fixed rate debt, based on current and projected market conditions.
Fixed-to-variable interest rate swaps are accounted for as fair value hedges and the assessment of effectiveness is based on changes in the fair value of the underlying debt, using incremental borrowing rates currently available on loans with similar terms and maturities.
The total notional amount of interest rate derivative instruments was $1,900 million and $750 million at January 2, 2010 and January 3, 2009, respectively.
Price risk The Company is exposed to price fluctuations primarily as a result of anticipated purchases of raw and packaging materials, fuel, and energy. The Company has historically used the combination of long-term contracts with suppliers, and exchange-traded futures and option contracts to reduce price fluctuations in a desired percentage of forecasted raw material purchases over a duration of generally less than 18 months. During 2006, the Company entered into two separate 10-year over-the-counter commodity swap transactions to reduce fluctuations in the price of natural gas used principally in its manufacturing processes. The notional amount of the swaps totaled $146 million as of January 2, 2010 and $167 million as of January 3, 2009. Commodity contracts are accounted for as cash flow hedges. The assessment of effectiveness for exchange-traded instruments is based on changes in futures prices. The assessment of effectiveness for over-the-counter transactions is based on changes in designated indexes.
The total notional amount of commodity derivative instruments, including the natural gas swaps was $213 million and $267 million at January 2, 2010 and January 3, 2009, respectively.
Credit-risk-related contingent features Certain of the Company’s derivative instruments contain provisions requiring the Company to post collateral on those derivative instruments that are in a liability position if the Company’s credit rating falls below BB+ (S&P), or Baa1 (Moody’s). The fair value of all derivative instruments with credit-risk-related contingent features in a liability position on January 2, 2010 was $18 million. If the credit-risk-related contingent features were triggered as of January 2, 2010, the Company would be required to post collateral of $18 million. In addition, certain derivative instruments contain provisions that would be triggered in the event the Company defaults on its debt agreements. There were no collateral posting requirements as of January 2, 2010 triggered by credit-risk-related contingent features.
Fair values of derivative instruments in the Consolidated Balance Sheet designated as hedging instruments as of January 2, 2010 were as follows:
52
Asset derivatives Liability derivatives
(millions) Balance sheet
location Fair
value Balance sheet
location Fair
value Foreign currency exchange contracts Other current assets $ 7 Other current liabilities $ (31 ) Interest rate contracts Other assets 44 Other liabilities (1 ) Commodity contracts Other current assets 4 Other current liabilities (6 ) Commodity contracts Other assets — Other liabilities (14 ) Total $ 55 $ (52 )

The effect of derivative instruments on the Consolidated Statement of Income for the year ended January 2, 2010 was as follows:
Refer to Note 11 for disclosures regarding the fair value of the Company’s derivatives. NOTE 13 VOLUNTARY PRODUCT WITHDRAWAL
On January 16, 2009, the Company announced a recall of certain Austin and Keebler branded peanut butter sandwich crackers and certain Famous Amos and Keebler branded peanut butter cookies. The recall was expanded in February to include certain Bear Naked , Kashi and Special K products. The decision was made following an investigation by the United States Food and Drug Administration concerning a salmonella outbreak thought to be caused by tainted peanut-related products. The products subject to the recall contained peanut-based ingredients manufactured by the Peanut Corporation of America whose Blakely, Georgia plant was found to contain salmonella.
The charges associated with the withdrawal reduced full-year operating profit by $31 million or $.06 of earnings per share for 2009 and $34 million or $0.06 of earnings per share for 2008. Estimated customer returns and consumer rebates were recorded as a reduction of net sales; costs associated with returned product and the disposal and write-off of inventory were recorded as COGS; and other recall costs were recorded as SGA expense. The following table presents a summary of the total charges for the years ended January 2, 2010 and January 3, 2009.
The costs in the above table represent actual costs incurred, which exclude the impact of lost sales.
NOTE 14 CONTINGENCIES
The Company is subject to various legal proceedings, claims, and governmental inspections or investigations in the ordinary course of business covering matters such as general commercial, governmental regulations, antitrust and trade regulations, product liability, environmental intellectual property, employment and other actions. Management has determined that the ultimate resolution of these matters will not have a material adverse effect on the Company’s financial position or results of operations.
NOTE 15 OTHER INCOME (EXPENSE), NET
Other income (expense), net includes non-operating items such as interest income, charitable donations, and gains and losses related to foreign currency transactions and remeasurements and commodity derivatives. Other income (expense), net for the periods presented was (in millions): 2009–$(22); 2008–$(14); 2007–$(3).
During 2009, the Company recorded $10 million of foreign exchange losses associated with the remeasurement of nonfunctional bolivar denominated assets and $14 million of foreign exchange losses associated with the remeasurement of U.S. dollar denominated liabilities. Currency exchange restrictions in
53
Derivatives in fair value hedging relationships (millions)
Location of gain (loss) recognized in income
Gain (loss) recognized in income
Foreign currency exchange contracts Other income (expense), net $ (46 )
Interest rate contracts Interest expense 28 Total $ (18 )
Derivatives in cash flow hedging relationships (millions)
Gain (loss)
recognized
in AOCI
Location of gain (loss) reclassified
From AOCI
Gain (loss) reclassified from
AOCI into
income Location of gain (loss)
recognized in income (a) Gain (loss)
recognized in income (a) Foreign currency exchange
contracts $ (23 )
Cost of goods sold
$ 19
Other income (expense), net
$ (8 )
Foreign currency exchange contracts
3
Selling, general and administrative expense
(3 )
Other income (expense), net
—
Interest rate contracts — Interest expense (8 ) N/A — Commodity contracts 14 Cost of goods sold (5 ) Other income (expense), net (2 ) Total $ (6 ) $ 3 $ (10 ) Derivatives not designated as hedging instruments (millions)
Location of gain (loss) recognized in income
Gain (loss) recognized in income
Foreign currency exchange contracts
Other income (expense), net
$ 1
(a) Includes the ineffective portion and amount excluded from effectiveness testing
(millions) 2009 2008 Total Reduction of net sales $ 12 $ 12 $ 24 Cost of goods sold 18 21 39 SGA expense 1 1 2 Total $ 31 $ 34 $ 65

Venezuela restrict the Company’s ability to obtain U.S. dollars at the official exchange rate. U.S. dollars may be obtained through a legal parallel exchange mechanism. The Company has used this mechanism to exchange bolivars for U.S. dollars in order to satisfy U.S. dollar denominated obligations of the Company’s Venezuelan subsidiary As a result, the Company determined as of the end of 2009, that the parallel rate was the appropriate rate to translate the balance sheet of its Venezuelan subsidiary into U.S. dollars. The Company recorded a negative impact of $40 million in other comprehensive income as a result of moving from the official rate to the parallel rate for translation purposes,
NOTE 16 QUARTERLY FINANCIAL DATA (unaudited)
The principal market for trading Kellogg shares is the New York Stock Exchange (NYSE). At year-end 2009, the closing price (on the NYSE) was $53.20 and there were 41,259 shareholders of record.
Dividends paid per share and the quarterly price ranges on the NYSE during the last two years were:
NOTE 17 OPERATING SEGMENTS
Kellogg Company is the world’s leading producer of cereal and a leading producer of convenience foods, including cookies, crackers, toaster pastries, cereal bars, fruit snacks, frozen waffles and veggie foods. Kellogg products are manufactured and marketed globally. Principal markets for these products include the United States and United Kingdom. The Company currently manages its operations in four geographic operating segments, comprised of North America and the three International operating segments of Europe, Latin America and Asia Pacific. 54
Net sales Gross profit (millions, except per share data) 2009 2008 2009 2008 First $ 3,169 $ 3,258 $ 1,302 $ 1,364 Second 3,229 3,343 1,404 1,444 Third 3,277 3,288 1,440 1,403 Fourth 2,900 2,933 1,245 1,156 $ 12,575 $ 12,822 $ 5,391 $ 5,367
Net income attributable
to Kellogg Company Per share amounts
2009 2008 2009 2008 Basic Diluted Basic Diluted First $ 321 $ 315 $ .84 $ .84 $ .82 $ .81 Second 354 312 .93 .92 .82 .82 Third 361 342 .94 .94 .90 .89 Fourth 176 179 .46 .46 .47 .47 $ 1,212 $ 1,148
2009 — Quarter Dividend
per share Stock price
High Low First $ .3400 $ 45.94 $ 35.64 Second .3400 47.72 37.84 Third .3750 49.90 45.58 Fourth .3750 54.10 48.15 $ 1.4300 2008 — Quarter First $ .3100 $ 53.00 $ 46.25 Second .3100 54.15 47.87 Third .3400 58.51 47.62 Fourth .3400 57.66 40.32 $ 1.3000

The measurement of operating segment results is generally consistent with the presentation of the Consolidated Statement of Income and Consolidated Balance Sheet. Intercompany transactions between operating segments were insignificant in all periods presented.
The Company’s largest customer, Wal-Mart Stores, Inc. and its affiliates, accounted for approximately 21% of consolidated net sales during 2009, 20% in 2008, and 19% in 2007, comprised principally of sales within the United States.
Supplemental geographic information is provided below for net sales to external customers and long-lived assets:
Supplemental product information is provided below for net sales to external customers:
(millions) 2009 2008 2007 Net sales
North America $ 8,510 $ 8,457 $ 7,786 Europe 2,361 2,619 2,357 Latin America 963 1,030 984 Asia Pacific (a) 741 716 649 Consolidated $ 12,575 $ 12,822 $ 11,776
Segment operating profit North America $ 1,569 $ 1,447 $ 1,345 Europe 348 390 397 Latin America 179 209 213 Asia Pacific (a) 86 92 88 Corporate (181 ) (185 ) (175 ) Consolidated $ 2,001 $ 1,953 $ 1,868
Depreciation and amortization North America $ 256 249 $ 239 Europe 60 72 71 Latin America 28 24 24 Asia Pacific (a) 22 23 23 Corporate 18 7 15 Consolidated $ 384 $ 375 $ 372
Interest expense North America $ — $ 1 $ 2 Europe 1 2 13 Latin America — — 1 Asia Pacific (a) — — — Corporate 294 305 303 Consolidated $ 295 $ 308 $ 319
Income taxes North America $ 474 $ 418 $ 388 Europe 22 25 27 Latin America 32 38 40 Asia Pacific (a) 16 16 14 Corporate (68 ) (12 ) (25 ) Consolidated $ 476 $ 485 $ 444
Total assets North America $ 8,465 $ 8,443 $ 8,255 Europe 1,630 1,545 2,017 Latin America 585 515 527 Asia Pacific (a) 535 408 397 Corporate 3,354 4,305 5,276 Elimination entries (3,369 ) (4,270 ) (5,075 ) Consolidated $ 11,200 $ 10,946 $ 11,397
Additions to long -lived assets North America $ 236 $ 262 $ 331 Europe 50 172 76 Latin America 58 70 37 Asia Pacific (a) 30 66 21 Corporate 3 6 7 Consolidated $ 377 $ 576 $ 472
(a) Includes Australia, Asia and South Africa.
(millions) 2009 2008 2007 Net sales
United States $ 7,946 $ 7,866 $ 7,224 United Kingdom 906 1,026 1,018 Other foreign countries 3,723 3,930 3,534 Consolidated $ 12,575 $ 12,822 $ 11,776
Long -lived assets United States $ 1,916 $ 1,922 $ 1,870 United Kingdom 278 260 377 Other foreign countries 816 751 743 Consolidated $ 3,010 $ 2,933 $ 2,990
(millions) 2009 2008 2007 North America
Retail channel cereal $ 3,080 $ 3,038 $ 2,784 Retail channel snacks 4,012 3,960 3,553 Frozen and specialty channels 1,418 1,459 1,449
International Cereal 3,326 3,547 3,346

55
Convenience foods 739 818 644 Consolidated $ 12,575 $ 12,822 $ 11,776

NOTE 18 SUPPLEMENTAL FINANCIAL STATEMENT DATA
NOTE 19 SUBSEQUENT EVENTS
The Company evaluated subsequent events through the time of filing of the Annual Report on Form 10-K. 56
Consolidated Statement of Income (millions) 2009 2008 2007 Research and development expense $ 181 $ 181 $ 179 Advertising expense $ 1,091 $ 1,076 $ 1,063
(Consolidated Balance Sheet (millions) 2009 2008 Trade receivables $ 951 $ 876 Allowance for doubtful accounts (9 ) (10 ) Other receivables 151 234
Accounts receivable, net $ 1,093 $ 1,100 Raw materials and supplies $ 214 $ 203 Finished goods and materials in process 696 694
Inventories $ 910 $ 897 Deferred income taxes $ 128 $ 112 Other prepaid assets 93 157
Other current assets $ 221 $ 269 Land $ 106 $ 94 Buildings 1,750 1,579 Machinery and equipment (a) 5,383 5,112 Construction in progress 291 319 Accumulated depreciation (4,520 ) (4,171 )
Property, net $ 3,010 $ 2,933 Other intangibles $ 1,503 $ 1,503 Accumulated amortization (45 ) (42 )
Other intangibles, net $ 1,458 $ 1,461 Pension $ 160 $ 96 Other 371 298
Other assets $ 531 $ 394 Accrued income taxes $ 33 $ 51 Accrued salaries and wages 322 280 Accrued advertising and promotion 409 357 Other 402 341
Other current liabilities $ 1,166 $ 1,029 Nonpension postretirement benefits $ 488 $ 553 Other 459 387
Other liabilities $ 947 $ 940
(a) Includes an insignificant amount of capitalized internal-use software.
Allowance for doubtful accounts (millions) 2009 2008 2007 Balance at beginning of year $ 10 $ 5 $ 6 Additions charged to expense 3 6 1 Doubtful accounts charged to reserve (4 ) (1 ) (2 ) Balance at end of year $ 9 $ 10 $ 5

Management’s Responsibility for Financial Statement s
Management is responsible for the preparation of the Company’s consolidated financial statements and related notes. We believe that the consolidated financial statements present the Company’s financial position and results of operations in conformity with accounting principles that are generally accepted in the United States, using our best estimates and judgments as required.
The independent registered public accounting firm audits the Company’s consolidated financial statements in accordance with the standards of the Public Company Accounting Oversight Board and provides an objective, independent review of the fairness of reported operating results and financial position.
The Board of Directors of the Company has an Audit Committee composed of five non-management Directors. The Committee meets regularly with management, internal auditors, and the independent registered public accounting firm to review accounting, internal control, auditing and financial reporting matters.
Formal policies and procedures, including an active Ethics and Business Conduct program, support the internal controls and are designed to ensure employees adhere to the highest standards of personal and professional integrity. We have a rigorous internal audit program that independently evaluates the adequacy and effectiveness of these internal controls. Management’s Report on Internal Control over Financ ial Reporting
Management is responsible for designing, maintaining and evaluating adequate internal control over financial reporting, as such term is defined in Rule 13a-15(f) under the Securities Exchange Act of 1934, as amended. Our internal control over financial reporting is designed to provide reasonable assurance regarding the reliability of financial reporting and the preparation of the financial statements for external purposes in accordance with U.S. generally accepted accounting principles.
We conducted an evaluation of the effectiveness of our internal control over financial reporting based on the framework in Internal Control — Integrated Framework issued by the Committee of Sponsoring Organizations of the Treadway Commission.
Because of its inherent limitations, internal control over financial reporting may not prevent or detect misstatements. Also, projections of any evaluation of effectiveness to future periods are subject to the risk that controls may become inadequate because of changes in conditions or that the degree of compliance with the policies or procedures may deteriorate.
Based on our evaluation under the framework in Internal Control — Integrated Framework, management concluded that our internal control over financial reporting was effective as of January 2, 2010. The effectiveness of our internal control over financial reporting as of January 2, 2010 has been audited by PricewaterhouseCoopers LLP, an independent registered public accounting firm, as stated in their report which follows.
57
A. D. David Mackay President and Chief Executive Officer
Ronald L. Dissinger Senior Vice President and Chief Financial Officer

Report of Independent Registered Public Accounting Firm To the Shareholders and Board of Directors of Kello gg Company
In our opinion, the consolidated financial statements listed in the index appearing under Item 15(a)(1) present fairly, in all material respects, the financial position of Kellogg Company and its subsidiaries at January 2, 2010 and January 3, 2009, and the results of their operations and their cash flows for each of the three years in the period ended January 2, 2010 in conformity with accounting principles generally accepted in the United States of America. Also in our opinion, the Company maintained, in all material respects, effective internal control over financial reporting as of January 2, 2010, based on criteria established in Internal Control — Integrated Framework issued by the Committee of Sponsoring Organizations of the Treadway Commission (COSO). The Company’s management is responsible for these financial statements, for maintaining effective internal control over financial reporting and for its assessment of the effectiveness of internal control over financial reporting, included in the accompanying Management’s Report on Internal Control over Financial Reporting. Our responsibility is to express opinions on these financial statements and on the Company’s internal control over financial reporting based on our integrated audits. We conducted our audits in accordance with the standards of the Public Company Accounting Oversight Board (United States). Those standards require that we plan and perform the audits to obtain reasonable assurance about whether the financial statements are free of material misstatement and whether effective internal control over financial reporting was maintained in all material respects. Our audits of the financial statements included examining, on a test basis, evidence supporting the amounts and disclosures in the financial statements, assessing the accounting principles used and significant estimates made by management, and evaluating the overall financial statement presentation. Our audit of internal control over financial reporting included obtaining an understanding of internal control over financial reporting, assessing the risk that a material weakness exists, and testing and evaluating the design and operating effectiveness of internal control based on the assessed risk. Our audits also included performing such other procedures as we considered necessary in the circumstances. We believe that our audits provide a reasonable basis for our opinions.
A company’s internal control over financial reporting is a process designed to provide reasonable assurance regarding the reliability of financial reporting and the preparation of financial statements for external purposes in accordance with generally accepted accounting principles. A company’s internal control over financial reporting includes those policies and procedures that (i) pertain to the maintenance of records that, in reasonable detail, accurately and fairly reflect the transactions and dispositions of the assets of the company; (ii) provide reasonable assurance that transactions are recorded as necessary to permit preparation of financial statements in accordance with generally accepted accounting principles, and that receipts and expenditures of the company are being made only in accordance with authorizations of management and directors of the company; and (iii) provide reasonable assurance regarding prevention or timely detection of unauthorized acquisition, use, or disposition of the company’s assets that could have a material effect on the financial statements.
Because of its inherent limitations, internal control over financial reporting may not prevent or detect misstatements. Also, projections of any evaluation of effectiveness to future periods are subject to the risk that controls may become inadequate because of changes in conditions, or that the degree of compliance with the policies or procedures may deteriorate.
58
Battle Creek, Michigan February 26, 2010

ITEM 9. CHANGES IN AND DISAGREEMENTS WITH ACCOUNTAN TS ON ACCOUNTING AND FINANCIAL DISCLOSURE
None.
ITEM 9A. CONTROLS AND PROCEDURES
(a) We maintain disclosure controls and procedures that are designed to ensure that information required to be disclosed in our Exchange Act reports is recorded, processed, summarized and reported within the time periods specified in the SEC’s rules and forms, and that such information is accumulated and communicated to our management, including our Chief Executive Officer and Chief Financial Officer as appropriate, to allow timely decisions regarding required disclosure under Rules 13a-15(e) and 15d-15(e). Disclosure controls and procedures, no matter how well designed and operated, can provide only reasonable, rather than absolute, assurance of achieving the desired control objectives.
As of January 2, 2010, management carried out an evaluation under the supervision and with the participation of our Chief Executive Officer and our Chief Financial Officer, of the effectiveness of the design and operation of our disclosure controls and procedures. Based on the foregoing, our Chief Executive Officer and Chief Financial Officer concluded that our disclosure controls and procedures were effective at the reasonable assurance level.
(b) Pursuant to Section 404 of the Sarbanes-Oxley Act of 2002, we have included a report of management’s assessment of the design and effectiveness of our internal control over financial reporting as part of this Annual Report on Form 10-K. The independent registered public accounting firm of PricewaterhouseCoopers LLP also attested to, and reported on, the effectiveness of our internal control over financial reporting. Management’s report and the independent registered public accounting firm’s attestation report are included in our 2009 financial statements in Item 8 of this Report under the captions entitled “Management’s Report on Internal Control over Financial Reporting” and “Report of Independent Registered Public Accounting Firm” and are incorporated herein by reference.
(c) During the last fiscal quarter, there have been no changes in our internal control over financial reporting that have materially affected, or are reasonably likely to materially affect, our internal control over financial reporting.
ITEM 9B. OTHER INFORMATION
Not applicable.
ITEM 10. DIRECTORS, EXECUTIVE OFFICERS AND CORPORATE GOVERNANCE
Directors — Refer to the information in our Proxy Statement to be filed with the Securities and Exchange Commission for the Annual Meeting of Shareowners to be held on April 23, 2010 (the “Proxy Statement”), under the caption “Proposal 1 — Election of Directors,” which information is incorporated herein by reference.
Identification and Members of Audit Committee; Audit Committee Financial Expert — Refer to the information in the Proxy Statement under the caption “Board and Committee Membership,” which information is incorporated herein by reference.
Executive Officers of the Registrant — Refer to “Executive Officers” under Item 1 at pages 3 through 5 of this Report.
For information concerning Section 16(a) of the Securities Exchange Act of 1934, refer to the information under the caption “Security Ownership — Section 16(a) Beneficial Ownership Reporting Compliance” of the Proxy Statement, which information is incorporated herein by reference. Code of Ethics for Chief Executive Officer, Chief Financial Officer and Controller — We have adopted a Global Code of Ethics which applies to our chief executive officer, chief financial officer, corporate controller and all our other employees, and which can be found at www.kelloggcompany.com. Any amendments or waivers to the Global Code of Ethics applicable to our chief executive officer, chief financial officer or corporate controller may also be found at www.kelloggcompany.com.
ITEM 11. EXECUTIVE COMPENSATION
Refer to the information under the captions “2009 Director Compensation and Benefits,” “Compensation Discussion and Analysis,” “Executive Compensation,” “Retirement and Non-Qualified Defined Contribution and Deferred Compensation Plans,” “Employment Agreements,” and “Potential Post-Employment Payments,” of the Proxy Statement, which is incorporated herein by reference. See also the information under the caption “Compensation Committee Report” of the Proxy Statement, which information is incorporated herein by reference; however, such information is only “furnished” hereunder and not deemed “filed” for purposes of Section 18 of the Securities Exchange Act of 1934.
59
PART III

ITEM 12. SECURITY OWNERSHIP OF CERTAIN BENEFICIAL O WNERS AND MANAGEMENT AND RELATED STOCKHOLDER MATTERS
Refer to the information under the captions “Security Ownership — Five Percent Holders” and “Security Ownership — Officer and Director Stock Ownership” of the Proxy Statement, which information is incorporated herein by reference. Securities Authorized for Issuance Under Equity Com pensation Plans
Three plans are considered “Equity compensation plans not approved by security holders.” The Kellogg Share Incentive Plan, which was adopted in 2002 and is available to most U.K. employees of specified Kellogg Company subsidiaries; a similar plan, which is available to employees in the Republic of Ireland; and the Deferred Compensation Plan for Non-Employee Directors, which was adopted in 1986 and amended in 1993 and 2002.
Under the Kellogg Share Incentive Plan, eligible U.K. employees may contribute up to 1,500 Pounds Sterling annually to the plan through payroll deductions. The trustees of the plan use those contributions to buy shares of our common stock at fair market value on the open market, with Kellogg matching those contributions on a 1:1 basis. Shares must be withdrawn from the plan when employees cease employment. Under current law, eligible employees generally receive certain income and other tax benefits if those shares are held in the plan for a specified number of years. A similar plan is also available to employees in the Republic of Ireland. As these plans are open market plans with no set overall maximum, no amounts for these plans are included in the above table. However, approximately 74,000 shares were purchased by eligible employees under the Kellogg Share Incentive Plan, the plan for the Republic of Ireland and other similar predecessor plans during 2009, with approximately an additional 74,000 shares being provided as matched shares. Under the Deferred Compensation Plan for Non-Employee Directors, non-employee Directors may elect to defer all or part of their compensation (other than expense reimbursement) into units which are credited to their accounts. The units have a value equal to the fair market value of a share of our common stock on the appropriate date, with dividend equivalents being earned on the whole units in non-employee Directors’ accounts. Units may be paid in either cash or shares of our common stock, either in a lump sum or in up to ten annual installments, with the payments to begin as soon as practicable after the non-employee Director’s service as a Director terminates. No more than 150,000 shares are authorized for use under this plan, of which approximately 11,000 had been issued as of January 2, 2010. Because Directors may elect, and are likely to elect, a distribution of cash rather than shares, the contingently issuable shares are not included in column (a) of the table above.
ITEM 13. CERTAIN RELATIONSHIPS AND RELATED TRANSACT IONS, AND DIRECTOR INDEPENDENCE
Refer to the information under the captions “Corporate Governance — Director Independence” and “Related Person Transactions” of the Proxy Statement, which information is incorporated herein by reference. 60
(millions, except per share data) Plan category
Number of securities to be issued upon
exercise of outstanding
options, warrants and rights as of
January 2, 2010 (a)
Weighted -average
exercise price of outstanding
options, warrants
and rights as of January 2,
2010 (b)
Number of securities remaining available for
future issuance under equity compensation plans
(excluding securities reflected
in column (a)) as of January 2, 2010
(c) Equity compensation plans approved by
security holders 26.5 $ 45 28.4 Equity compensation plans not approved by
security holders 0.0 N/A 0.1 Total 26.5 $ 45 28.5

ITEM 14. PRINCIPAL ACCOUNTANT FEES AND SERVICES
Refer to the information under the captions “Proposal 2 — Ratification of PricewaterhouseCoopers LLP — Fees Paid to Independent Registered Public Accounting Firm” and “Proposal 2 — Ratification of PricewaterhouseCoopers LLP — Preapproval Policies and Procedures” of the Proxy Statement, which information is incorporated herein by reference.
ITEM 15. EXHIBITS, FINANCIAL STATEMENT SCHEDULES
The Consolidated Financial Statements and related Notes, together with Management’s Report on Internal Control over Financial Reporting, and the Report thereon of PricewaterhouseCoopers LLP dated February 26, 2010, are included herein in Part II, Item 8.
(a) 1. Consolidated Financial Statements Consolidated Statement of Income for the years ended January 2, 2010, January 3, 2009 and December 29, 2007.
Consolidated Balance Sheet at January 2, 2010 and January 3, 2009.
Consolidated Statement of Equity for the years ended January 2, 2010, January 3, 2009 and December 29, 2007. Consolidated Statement of Cash Flows for the years ended January 2, 2010, January 3, 2009 and December 29, 2007.
Notes to Consolidated Financial Statements.
Management’s Report on Internal Control over Financial Reporting.
Report of Independent Registered Public Accounting Firm.
(a) 2. Consolidated Financial Statement Schedule All financial statement schedules are omitted because they are not applicable or the required information is shown in the financial statements or the notes thereto.
(a) 3. Exhibits required to be filed by Item 601 of Regulation S-K The information called for by this Item is incorporated herein by reference from the Exhibit Index on pages 63 through 66 of this Report.
61
PART IV

SIGNATURES
Pursuant to the requirements of Section 13 or 15(d) of the Securities Exchange Act of 1934, the Registrant has duly caused this Report to be signed on its behalf by the undersigned, thereunto duly authorized, this 26th day of February, 2010.
Pursuant to the requirements of the Securities Exchange Act of 1934, this Report has been signed below by the following persons on behalf of the Registrant and in the capacities and on the dates indicated.
62
KELLOGG COMPANY
By: /s/ A. D. D AVID M ACKAY A. D. David Mackay President and Chief Executive Officer
Name Capacity Date
/s/ A. D. D AVID M ACKAY A. D. David Mackay
President and Chief Executive Officer and Director (Principal Executive Officer)
February 26, 2010
/s/ R ONALD L. D ISSINGER Ronald L. Dissinger
Senior Vice President and Chief Financial Officer (Principal Financial Officer)
February 26, 2010
/s/ A LAN R. A NDREWS Alan R. Andrews
Vice President and Corporate Controller (Principal Accounting Officer)
February 26, 2010
* James M. Jenness
Chairman of the Board and Director
February 26, 2010
* Benjamin S. Carson Sr.
Director
February 26, 2010
* John T. Dillon
Director
February 26, 2010
* Gordon Gund
Director
February 26, 2010
* Dorothy A. Johnson
Director
February 26, 2010
* Donald R. Knauss
Director
February 26, 2010
* Ann McLaughlin Korologos
Director
February 26, 2010
* Rogelio M. Rebolledo
Director
February 26, 2010
* Sterling K. Speirn
Director
February 26, 2010
* Robert A. Steele
Director
February 26, 2010
* John L. Zabriskie
Director
February 26, 2010
* By:
/s/ G ARY H. P ILNICK Gary H. Pilnick
Attorney-in-Fact
February 26, 2010

EXHIBIT INDEX
63
Exhibit No. Description
Electronic(E), Paper(P) or Incorp. By Ref.(IBRF)
1.01
Underwriting Agreement, dated May 18, 2009, by and among Kellogg Company, J.P. Morgan Securities, Inc., Deutsche Bank Securities Inc. and HSBC Securities (USA) Inc., incorporated by reference to Exhibit 1.1 to our Current Report on Form 8-K dated May 18, 2009, Commission file number 1-4171.
IBRF
1.02
Underwriting Agreement, dated November 16, 2009, by and among Kellogg Company, Banc of America Securities LLC and Sun Trust Robinson Humphrey, Inc., incorporated by reference to Exhibit 1.1 to our Current Report on Form 8-K dated November 16, 2009, Commission file number 1-4171.
IBRF
3.01
Amended Restated Certificate of Incorporation of Kellogg Company, incorporated by reference to Exhibit 4.1 to our Registration Statement on Form S-8, file number 333-56536.
IBRF
3.02
Bylaws of Kellogg Company, as amended, incorporated by reference to Exhibit 3.1 to our Current Report on Form 8-K dated April 24, 2009, Commission file number 1-4171.
IBRF
4.01
Fiscal Agency Agreement dated as of January 29, 1997, between us and Citibank, N.A., Fiscal Agent, incorporated by reference to Exhibit 4.01 to our Annual Report on Form 10-K for the fiscal year ended December 31, 1997, Commission file number 1-4171.
IBRF
4.02
Amended and Restated Five-Year Credit Agreement dated as of November 10, 2006 with twenty-four lenders, JPMorgan Chase Bank, N.A., as Administrative Agent, J.P. Morgan Europe Limited, as London Agent, JPMorgan Chase Bank, N.A., Toronto Branch, as Canadian Agent, J.P. Morgan Australia Limited, as Australian Agent, Barclays Bank PLC, as Syndication Agent and Bank of America, N.A., Citibank, N.A. and Suntrust Bank, as Co-Documentation Agents, incorporated by reference to Exhibit 4.02 to our Annual Report on Form 10-K for the fiscal year ended December 30, 2006, Commission file number 1-4171.
IBRF
4.03
Indenture dated August 1, 1993, between us and Harris Trust and Savings Bank, incorporated by reference to Exhibit 4.1 to our Registration Statement on Form S-3, Commission file number 33-49875.
IBRF
4.04
Form of Kellogg Company 4 7/8% Note Due 2005, incorporated by reference to Exhibit 4.06 to our Annual Report on Form 10-K for the fiscal year ended December 31, 1999, Commission file number 1-4171.
IBRF
4.05
Indenture and Supplemental Indenture dated March 15 and March 29, 2001, respectively, between Kellogg Company and BNY Midwest Trust Company, including the forms of 6.00% notes due 2006, 6.60% notes due 2011 and 7.45% Debentures due 2031, incorporated by reference to Exhibit 4.01 and 4.02 to our Quarterly Report on Form 10-Q for the quarter ending March 31, 2001, Commission file number 1-4171.
IBRF
4.06
Form of 2.875% Senior Notes due 2008 issued under the Indenture and Supplemental Indenture described in Exhibit 4.05, incorporated by reference to Exhibit 4.01 to our Current Report on Form 8-K dated June 5, 2003, Commission file number 1-4171.
IBRF
4.07
Agency Agreement dated November 28, 2005, between Kellogg Europe Company Limited, Kellogg Company, HSBC Bank and HSBC Institutional Trust Services (Ireland) Limited, incorporated by reference to Exhibit 4.1 of our Current Report in Form 8-K dated November 28, 2005, Commission file number 1-4171.
IBRF
4.08
Canadian Guarantee dated November 28, 2005, incorporated by reference to Exhibit 4.2 of our Current Report on Form 8-K dated November 28, 2005, Commission file number 1-4171.
IBRF
4.09
364-Day Credit Agreement dated as of January 31, 2007 with the lenders named therein, JPMorgan Chase Bank, N.A., as Administrative Agent, and Barclays Bank PLC, as Syndication Agent. J.P. Morgan Securities Inc. and Barclays Capital served as Joint Lead Arrangers and Joint Bookrunners, incorporated by reference to Exhibit 4.09 to our Annual Report on Form 10-K for the fiscal year ended December 30, 2006, Commission file number 1-4171.
IBRF
4.10
364-Day Credit Agreement dated as of June 13, 2007 with JPMorgan Chase Bank, N.A., incorporated by reference to Exhibit 4.01 to our Quarterly Report on Form 10-Q for the quarter ending June 30, 2007, Commission file number 1-4171.
IBRF
4.11
Form of Multicurrency Global Note related to Euro-Commercial Paper Program, incorporated by reference to Exhibit 4.10 to our Annual Report on Form 10-K for the fiscal year ended December 30, 2006, Commission file number 1-4171.
IBRF
4.12 Officers’ Certificate of Kellogg Company (with form of 4.25% Senior Note due March 6, 2013) IBRF

64
Exhibit No. Description
Electronic(E), Paper(P) or Incorp. By Ref.(IBRF)
4.13
Form of Indenture between Kellogg Company and The Bank of New York Mellon Trust Company, N.A., incorporated by reference to Exhibit 4.1 to our Registration Statement on Form S-3, Commission file number 333-159303.
IBRF
4.14
Officers’ Certificate of Kellogg Company (with form of Kellogg Company 4.450% Senior Note Due May 30, 2016), incorporated by reference to Exhibit 4.2 to our Current Report on Form 8-K dated May 18, 2009, Commission file number 1-4171.
IBRF
10.01
Kellogg Company Excess Benefit Retirement Plan, incorporated by reference to Exhibit 10.01 to our Annual Report on Form 10-K for the fiscal year ended December 31, 1983, Commission file number 1-4171.*
IBRF
10.02
Kellogg Company Supplemental Retirement Plan, incorporated by reference to Exhibit 10.05 to our Annual Report on Form 10-K for the fiscal year ended December 31, 1990, Commission file number 1-4171.*
IBRF
10.03
Kellogg Company Supplemental Savings and Investment Plan, as amended and restated as of January 1, 2003, incorporated by reference to Exhibit 10.03 to our Annual Report on Form 10-K for the fiscal year ended December 28, 2002, Commission file number 1-4171.*
IBRF
10.04
Kellogg Company International Retirement Plan, incorporated by reference to Exhibit 10.05 to our Annual Report on Form 10-K for the fiscal year ended December 31, 1997, Commission file number 1-4171.*
IBRF
10.05
Kellogg Company Executive Survivor Income Plan, incorporated by reference to Exhibit 10.06 to our Annual Report on Form 10-K for the fiscal year ended December 31, 1985, Commission file number 1-4171.*
IBRF
10.06
Kellogg Company Key Executive Benefits Plan, incorporated by reference to Exhibit 10.09 to our Annual Report on Form 10-K for the fiscal year ended December 31, 1991, Commission file number 1-4171.*
IBRF
10.07
Kellogg Company Key Employee Long Term Incentive Plan, incorporated by reference to Exhibit 10.6 to our Annual Report on Form 10-K for the fiscal year ended December 29, 2007, Commission file number 1-4171.*
IBRF
10.08
Amended and Restated Deferred Compensation Plan for Non-Employee Directors, incorporated by reference to Exhibit 10.1 to our Quarterly Report on Form 10-Q for the fiscal quarter ended March 29, 2003, Commission file number 1-4171.*
IBRF
10.09
Kellogg Company Senior Executive Officer Performance Bonus Plan, incorporated by reference to Exhibit 10.10 to our Annual Report on Form 10-K for the fiscal year ended December 31, 1995, Commission file number 1-4171.*
IBRF
10.10
Kellogg Company 2000 Non-Employee Director Stock Plan, incorporated by reference to Exhibit 10.10 to our Annual Report on Form 10-K for the fiscal year ended December 29, 2007, Commission file number 1-4171.*
IBRF
10.11
Kellogg Company 2001 Long-Term Incentive Plan, as amended and restated as of February 20, 2003, incorporated by reference to Exhibit 10.11 to our Annual Report on Form 10-K for the fiscal year ended December 28, 2002.*
IBRF
10.12
Kellogg Company Bonus Replacement Stock Option Plan, incorporated by reference to Exhibit 10.12 to our Annual Report on Form 10-K for the fiscal year ended December 31, 1997, Commission file number 1-4171.*
IBRF
10.13
Kellogg Company Executive Compensation Deferral Plan incorporated by reference to Exhibit 10.13 to our Annual Report on Form 10-K for the fiscal year ended December 31, 1997, Commission file number 1-4171.*
IBRF
10.14
Agreement between us and David Mackay, incorporated by reference to Exhibit 10.1 to our Quarterly Report on Form 10-Q for the fiscal quarter ended September 27, 2003, Commission file number 1-4171.*
IBRF
10.15
Retention Agreement between us and David Mackay, incorporated by reference to Exhibit 10.3 to our Quarterly Report on Form 10-Q for the fiscal period ended September 25, 2004, Commission file number 1-4171.*
IBRF
10.16
Employment Letter between us and James M. Jenness, incorporated by reference to Exhibit 10.18 to our Annual Report in Form 10-K for the fiscal year ended January 1, 2005, Commission file number 1-4171.*
IBRF

65
Exhibit No. Description
Electronic(E), Paper(P) or Incorp. By Ref.(IBRF)
10.17
Agreement between us and other executives, incorporated by reference to Exhibit 10.05 of our Quarterly Report on Form 10-Q for the quarter ended June 30, 2000, Commission file number 1-4171.*
IBRF
10.18
Stock Option Agreement between us and James Jenness, incorporated by reference to Exhibit 4.4 to our Registration Statement on Form S-8, file number 333-56536.*
IBRF
10.19
Kellogg Company 2002 Employee Stock Purchase Plan, as amended and restated as of January 1, 2008, incorporated by reference to Exhibit 10.22 to our Annual Report on Form 10-K for the fiscal year ended December 29, 2007, Commission file number 1-4171.*
IBRF
10.20
Kellogg Company 1993 Employee Stock Ownership Plan, incorporated by reference to Exhibit 10.23 to our Annual Report on Form 10-K for the fiscal year ended December 29, 2007, Commission file number 1-4171.*
IBRF
10.21
Kellogg Company 2003 Long-Term Incentive Plan, as amended and restated as of December 8, 2006, incorporated by reference to Exhibit 10.25 to our Annual Report on Form 10-K for the fiscal year ended December 30, 2006, Commission file number 1-4171.*
IBRF
10.22
Kellogg Company Senior Executive Annual Incentive Plan, incorporated by reference to Annex II of our Board of Directors’ proxy statement for the annual meeting of shareholders held on April 21, 2006.*
IBRF
10.23
Kellogg Company Severance Plan, incorporated by reference to Exhibit 10.25 of our Annual Report on Form 10-K for the fiscal year ended December 28, 2002, Commission file number 1-4171.*
IBRF
10.24
Form of Non-Qualified Option Agreement for Senior Executives under 2003 Long-Term Incentive Plan, incorporated by reference to Exhibit 10.4 to our Quarterly Report on Form 10-Q for the fiscal period ended September 25, 2004, Commission file number 1-4171.*
IBRF
10.25
Form of Restricted Stock Grant Award under 2003 Long-Term Incentive Plan, incorporated by reference to Exhibit 10.5 to our Quarterly Report on Form 10-Q for the fiscal period ended September 25, 2004, Commission file number 1-4171.*
IBRF
10.26
Form of Non-Qualified Option Agreement for Non-Employee Director under 2000 Non-Employee Director Stock Plan, incorporated by reference to Exhibit 10.6 to our Quarterly Report on Form 10-Q for the fiscal period ended September 25, 2004, Commission file number 1-4171.*
IBRF
10.27
First Amendment to the Key Executive Benefits Plan, incorporated by reference to Exhibit 10.39 of our Annual Report in Form 10-K for our fiscal year ended January 1, 2005, Commission file number 1-4171.*
IBRF
10.28
2006-2008 Executive Performance Plan, incorporated by reference to Exhibit 10.1 of our Current Report on Form 8-K dated February 17, 2006, Commission file number 1-4171 (the “2006 Form 8-K”).*
IBRF
10.29
Restricted Stock Grant/Non-Compete Agreement between us and John Bryant, incorporated by reference to Exhibit 10.1 of our Quarterly Report on Form 10-Q for the period ended April 2, 2005, Commission file number 1-4171 (the “2005 Q1 Form 10-Q”).*
IBRF
10.30
Restricted Stock Grant/Non-Compete Agreement between us and Jeff Montie, incorporated by reference to Exhibit 10.2 of the 2005 Q1 Form 10-Q.*
IBRF
10.31
Executive Survivor Income Plan, incorporated by reference to Exhibit 10.42 of our Annual Report in Form 10-K for our fiscal year ended December 31, 2005, Commission file number 1-4171.*
IBRF
10.32
Purchase and Sale Agreement between us and W. K. Kellogg Foundation Trust, incorporated by reference to Exhibit 10.1 to our Current Report on Form 8-K/A dated November 8, 2005, Commission file number 1-4171.
IBRF
10.33
Purchase and Sale Agreement between us and W. K. Kellogg Foundation Trust, incorporated by reference to Exhibit 10.1 to our Current Report on Form 8-K dated February 16, 2006, Commission file number 1-4171.
IBRF
10.34
Agreement between us and A.D. David Mackay, incorporated by reference to Exhibit 10.1 to our Current Report on Form 8-K dated October 20, 2006, Commission file number 1-4171.*
IBRF
10.35
Agreement between us and James M. Jenness, incorporated by reference to Exhibit 10.2 to our Current Report on Form 8-K dated October 20, 2006, Commission file number 1-4171.*
IBRF
10.36
2007-2009 Executive Performance Plan, incorporated by reference to Exhibit 10.1 of our Current Report on Form 8-K dated February 20, 2007, Commission file number 1-4171.*
IBRF

We agree to furnish to the Securities and Exchange Commission, upon its request, a copy of any instrument defining the rights of holders of long-term debt of Kellogg and our subsidiaries and any of our unconsolidated subsidiaries for which Financial Statements are required to be filed.
We will furnish any of our shareowners a copy of any of the above Exhibits not included herein upon the written request of such shareowner and the payment to Kellogg of the reasonable expenses incurred in furnishing such copy or copies. 66
Exhibit No. Description
Electronic(E), Paper(P) or Incorp. By Ref.(IBRF)
10.37
Agreement between us and Jeffrey W. Montie, dated July 23, 2007, incorporated by reference to Exhibit 10.1 to our Current Report on Form 8-K dated July 23, 2007, Commission file number 1-4171.*
IBRF
10.38
Letter Agreement between us and John A. Bryant, dated July 23, 2007, incorporated by reference to Exhibit 10.2 to our Current Report on Form 8-K dated July 23, 2007, Commission file number 1-4171.*
IBRF
10.39
Agreement between us and James M. Jenness, dated February 22, 2008, incorporated by reference to Exhibit 10.1 to our Current Report on Form 8-K dated February 22, 2008, Commission file number 1-4171.*
IBRF
10.40
2008-2010 Executive Performance Plan, incorporated by reference to Exhibit 10.2 of our Current Report on Form 8-K dated February 22, 2008, Commission file number 1-4171.*
IBRF
10.41
Agreement between us and Jeffrey W. Montie, dated August 11, 2008, incorporated by reference to Exhibit 10.1 to our Current Report on Form 8-K dated August 11, 2008, Commission file number 1-4171.*
IBRF
10.42
Form of Amendment to Form of Agreement between us and certain executives, incorporated by reference to Exhibit 10.1 to our Current Report on Form 8-K dated December 18, 2008, Commission file number 1-4171.*
IBRF
10.43
Amendment to Letter Agreement between us and John A. Bryant, dated December 18, 2008, incorporated by reference to Exhibit 10.2 to our Current Report on Form 8-K dated December 18, 2008, Commission file number 1-4171.*
IBRF
10.44
Form of Restricted Stock Grant Award under 2003 Long-Term Incentive Plan, incorporated by reference to Exhibit 10.2 to our Current Report on Form 8-K dated December 18, 2008, Commission file number 1-4171.*
IBRF
10.45
2009-2011 Executive Performance Plan, incorporated by reference to Exhibit 10.1 of our Current Report on Form 8-K dated February 20, 2009, Commission file number 1-4171.*
IBRF
10.46
Form of Option Terms and Conditions for SVP Executive Officers under 2003 Long-Term Incentive Plan, incorporated by reference to Exhibit 10.2 to our Current Report on Form 8-K dated February 20, 2009, Commission file number 1-4171.*
IBRF
10.47
Kellogg Company 2009 Long-Term Incentive Plan, incorporated by reference to Exhibit 10.1 to our Registration Statement on Form S-8 dated April 27, 2009, Commission file number 333-158824.*
IBRF
10.48
Kellogg Company 2009 Non-Employee Director Stock Plan, incorporated by reference to Exhibit 10.1 to our Registration Statement on Form S-8 dated April 27, 2009, Commission file number 333-158826.*
IBRF
10.49
2010-2012 Executive Performance Plan, incorporated by reference to Exhibit 10.1 of our Current Report on Form 8-K dated February 23, 2010, Commission file number 1-4171.*
IBRF
21.01 Domestic and Foreign Subsidiaries of Kellogg. E 23.01 Consent of Independent Registered Public Accounting Firm. E 24.01
Powers of Attorney authorizing Gary H. Pilnick to execute our Annual Report on Form 10-K for the fiscal year ended January 2, 2010, on behalf of the Board of Directors, and each of them.
E
31.1 Rule 13a-14(a)/15d-14(a) Certification by A.D. David Mackay. E 31.2 Rule 13a-14(a)/15d-14(a) Certification by Ronald L. Dissinger. E 32.1 Section 1350 Certification by A.D. David Mackay. E 32.2 Section 1350 Certification by Ronald L. Dissinger. E * A management contract or compensatory plan required to be filed with this Report.

KELLOGG COMPANY Exhibit 21.01
North America
Kellogg Company Subsidiaries
Kashi Company Subsidiaries
Kellogg USA Inc Subsidiaries
Keebler Holding Corp Subsidiaries
Keebler Foods Company Subsidiaries
Austin Quality Foods, Inc. Subsidiaries:
Keebler Company Subsidiaries
• Argkel, Inc. – Delaware (DORMANT) • Canada Holding LLC – Delaware • CC Real Estate Holdings, LLC • Kashi Company – California • Keebler USA, Inc. – Delaware • Kellogg Asia Inc. – Delaware (DORMANT) • Kellogg Fearn, Inc. – Michigan (DORMANT) • Kellogg Holding, LLC – Delaware • Kellogg USA Inc. – Michigan • KFSC, Inc. – Barbados • K-One Inc. – Delaware (DORMANT) • K-Two Inc. – Delaware (DORMANT) • McCamly Plaza Hotel Inc. – Delaware • The Eggo Company – Delaware • Trafford Park Insurance Limited – Bermuda • Worthington Foods, Inc. – Ohio
• Bear Naked, Inc. – Delaware
• Keebler Holding Corp – Georgia
• Keebler Foods Company – Delaware
• Austin Quality Foods, Inc. – Delaware • BDH, Inc. – Delaware (DORMANT) • Keebler Company – Delaware • Keebler Foreign Sales Corporation – Virgin Islands • Shaffer, Clarke & Co., Inc. – Delaware (DORMANT)
• AQFTM, Inc. – Delaware • Cary Land Corporation – North Carolina (DORMANT)
• Godfrey Transport, Inc. – Delaware • Illinois Baking Corporation – Delaware (DORMANT) • Kellogg IT Services Company – Delaware

Kellogg Sales Company Subsidiaries
(d/b/a Kellogg’s Snacks d/b/a Kellogg’s Food Away From Home d/b/a Austin Quality Sales Company)
Worthington Foods, Inc.
K-One Inc and K-Two Inc. Subsidiaries
Canada Holding LLC Subsidiaries
Kellogg Canada, Inc. Subsidiaries
• Kellogg North America Company – Delaware • Kellogg Sales Company – Delaware
• Barbara Dee Cookie Company, L.L.C. – Delaware (DORMANT) • Famous Amos Chocolate Chip Cookie Company, L.L.C. – Delaware (DORMANT) • Gardenburger, LLC – Delaware (DORMANT) • Kashi Sales, L.L.C. – Delaware (DORMANT) • Little Brownie Bakers, L.L.C. – Delaware (DORMANT) • Mother’s Cookie Company, L.L.C. – Delaware (DORMANT) • Murray Biscuit Company, L.L.C. – Delaware (DORMANT) • President Baking Company, L.L.C. – Delaware (DORMANT) • Specialty Foods, L.L.C. – Delaware (DORMANT) • Stretch Island Fruit Sales L.L.C. – Delaware (DORMANT) • Sunshine Biscuits, L.L.C. – Delaware (DORMANT)
• Specialty Foods Investment Company – Delaware (DORMANT)
• SIA Kellogg Latvija – Latvia (owned 50% by K-One, 49% by K-Two and 1% by Kellogg (Deutschland) GmbH) (DORMANT) • Kellogg Latvia, Inc. – Delaware (owned 50% by K-One, 49% by K-Two and 1% by Kellogg (Deutschland) GmbH)
• Kellogg Canada Inc. – Canada (Kellogg Company-28% & Canada Holding LLC-72%)
• Keeb Canada, Inc. – Canada
Asia
Kellogg Company Subsidiaries
Kellogg Asia Marketing Inc. Subsidiaries
Kellogg Hong Kong Private Limited – Hong Kong
Kellogg (Shandong) Food Co., Ltd.
• K (China) Limited – Delaware (DORMANT) • K India Limited – Delaware • Kellogg (Japan) K.K. – Tokyo, Japan • Kellogg (Thailand) Limited – Delaware • Kellogg (Thailand) Limited – Thailand • Kellogg Asia Pte Ltd. – Singapore • Kellogg Asia Co., Ltd – Seoul, South Korea • Kellogg Asia Marketing Inc. – Delaware • Kellogg Asia Sdn. Bhd. – Malaysia • Kellogg India Private Limited – India (<1%-Kellogg Asia Inc.) • Nhong Shim Kellogg Co. Ltd. – South Korea (90% Kellogg Company/10% Korean Partners)
• Kellogg Foods (Shanghai) Co. Ltd – China • Kellogg Malaysia Manufacturing SDN BHD (DORMANT)
• Kellogg (Shandong) Food Co., Ltd.
• Kellogg (Qingdao) Food Co., Ltd. • Fushun Zhengying Food Co., Ltd.

Australia -New Zealand
Kellogg Canada Inc. Subsidiaries
Kellogg Australia Holdings Pty Ltd, Subsidiaries
Kellogg (Aust.) Pty. Ltd. Subsidiaries
• Kellogg Australia Holdings Pty Ltd, Pagewood, Australia
• Kellogg (Aust.) Pty. Ltd. – Australia
• Day Dawn Pty Ltd. – Australia • Kashi Company Pty.Ltd. – Australia • Kellogg (N.Z.) Limited – New Zealand • Kellogg Superannuation Pty. Ltd. – Sydney, Australia • Specialty Cereals Pty Limited • The Healthy Snack People Pty Limited – Carmahaven, NSW, Australia

Europe
Kellogg Company Subsidiaries
Kellogg International Holding Company Subsidiaries
Kellogg Holding Company Limited Subsidiaries
Kellogg Europe Company Limited Subsidiaries
Kellogg Lux I S.a.r.l. Subsidiaries
Prime Bond Limited Subsidiaries
Kreker OJSC Subsidiaries
• Gollek B.V. – Netherlands (INACTIVE) • Kellogg (Poland) Sp. Zo.o – Poland (liquidation process) (DORMANT) • Kellogg International Holding Company – Delaware • Kellogg Netherlands Holding B.V. – Netherlands (INACTIVE) • Kellogg UK Minor Limited – Manchester, England • Kellogg Hungary – Hungary (DORMANT)
• Kellogg Holding Company Limited – Bermuda • Kellogg Italia S.p.A. – Delaware
• Kellogg Europe Company Limited – Bermuda
• Kellogg Hong Kong Private Limited – Hong Kong (1%-KECL, LLC) • Kellogg Lux I S.a.r.l. – Luxemburg • Kellogg Lux II S.a.r.l. – Luxemburg • KECL, LLC – Delaware
• Kellogg Europe Trading Limited – Ireland • Kellogg Europe Treasury Services Limited – Ireland • Kellogg Irish Holding Company Limited – Ireland • Kellogg Lux V S.a.r.l. – Luxemburg • Kellogg Malta Limited – Malta • UMA Investments s. zo.o – Poland • Prime Bond Limited – Cyprus
• Kreker OJSC – Russian Federation • Kellogg Europe Services Limited – Ireland • Kellogg Lux VI S.a.r.l. – Luxemberg
• United Bakers CJSC – Russian Federation • Pischekombinat Trentr CJSC – Russian Federation • TC Elf LLC – Russian Federation • United Bakers Pskov OJSC – Russian Federation • Gorokhovetskiy Pischevik OJSC – Russian Federation • Vyazmapischevik OJSC – Russian Federation • Zavod Pischevykh Productov LLC – Russian Federation

United Bakers Subsidiaries
Sukhie Zavtraki LLC Subsidiaries
Kellogg Europe Trading Limited Subsidiaries
Kellogg Irish Holding Company Limited Subsidiaries
Kellogg Lux III S.a.r.l. Subsidiaries
Kellogg Group S.a.r.l.
Kellogg (Deutschland) GmbH Subsidiaries
Kellogg U.K. Holding Company Limited Subsidiaries
Kellogg Espana, S.L. Subsidiaries
• Sukhie Zavtraki LLC – Russian Federation
• Ekstruzionniye Tekhnologii LLC – Russian Federation
• Kellogg Med Gida Ticaret Limited Sirketi – Turkey (50% ownership)
• Kellogg Lux III S.a.r.l. – Luxemburg
• Kellogg Group S.a.r.l. – Luxemburg (formerly known as Kellogg Lux IV S.a.r.l.) • Kellogg Europe Finance Ltd
• Kellogg (Deutschland) GmbH – Germany • Kellogg Company of South Africa (Pty) Limited – South Africa • Kellogg Group Limited – England and Wales • Kellogg U.K. Holding Company Limited – England • Kellogg’s Produits Alimentaires, S.A.S. – France • Nordisk Kellogg’s ApS – Denmark • Portable Foods Manufacturing Company Limited – England
• Kellogg (Schweiz) GmbH – Switzerland • Kellogg (Osterreich) GmbH – Austria • Kellogg Services GmbH – Germany • Kellogg Manufacturing GmbH & Co. KG – Germany Limited Partnership (Kellogg Services GmbH-limited partner) • Gebrueder Nielsen Reismuehlen und Staerke-Fabrik mit Beschraenkter Haftung – Bremen, Germany (DORMANT)
• Kellogg Company of Ireland, Limited – Ireland • Kellogg Espana, S.L. – Spain • Kellogg Management Services (Europe) Limited – England • Kellogg Manchester Limited – England • Kellogg Marketing and Sales Company (UK) Limited – England • Kellogg Supply Services (Europe) Limited – England (DORMANT) • Kellogg Company of Great Britain Limited – England
• Kellogg Manufacturing Espana, S.L. – Spain

Nordisk Kellogg’s ApS Subsidiaries
Kellogg Manchester Limited Subsidiaries
KELF Limited Subsidiaries
Kellogg Company of Great Britain Limited
• K/S NK Leasing – Denmark (95%) Nordisk Kellogg’s ApS & 5% Kellogg Management Services (Europe) Ltd)
• KELF Limited – England
• Kellogg Talbot LLC – Delaware
• Favorite Food Products Limited – Manchester, England (DORMANT) • Kelcone Limited – Aylesbury, England (DORMANT) • Kelcorn Limited – Manchester, England (DORMANT) • Kelmill Limited – Liverpool, England (DORMANT) • Kelpac Limited – Manchester, England (DORMANT) • Saragusa Frozen Foods Limited – Manchester, England (DORMANT)

Latin America
Kellogg Company Subsidiaries
Alimentos Kellogg, S.A. Subsidiaries
Kelarg, Inc. Subsidiaries
Kellogg Company Mexico, S. de R.L. de C.V. Subsidiaries
Kellogg de Mexico, S. de R.L. de C.V. Subsidiaries
Gollek, Inc. Subsidiaries
• Alimentos Kellogg, S.A. – Venezuela • Gollek Inc. – Delaware • Kelarg, Inc. – Delaware (DORMANT) • Kellogg Brasil, Inc. – Delaware • Kellogg Caribbean Inc. – Delaware • Kellogg Caribbean Services Company, Inc. – Puerto Rico • Kellogg Chile Inc. – Delaware • Kellogg Chile Limited – Chile (Kellogg Company-99.02% & .08%-Kellogg Chile, Inc.) • Kellogg Company Mexico, S. de R.L. de C.V. – Mexico (82.2%-Kellogg Company & 17.8%-Kellogg Latin America Services LLC) • Kellogg Costa Rica S. de R.L. – Costa Rica • Kellogg de Centro America, S.A. – Guatemala • Kellogg de Colombia, S.A. – Colombia (95%-Kellogg Company & 5%-Kellogg Brasil, Inc.) • Kellogg de Peru, S.A.C. – Peru (99%-Kellogg Company & 1%-Gollek Inc.) • Kellogg Ecuador. C. LTDA – Ecuador • Kellogg Latin America Services, LLC – Delaware (Kellogg Company-99% & 1%-Kellogg Holding LLC)
• Gollek, S.A. – Venezuela (DORMANT)
• Kellogg Argentina S.A. – Argentina (95%-Kelarg, Inc. & 5%-Kellogg Company)
• Gollek Interamericas, S. de R.L., de C.V. – Mexico
• Gollek Services, S.A. a/k/a Gollek Servicios, S.C. – Mexico (98.75%-Kellogg Company Mexico, S. de R.L. de C.V.; 1.25%- Gollek
Interamericas, S. de R.L., de C.V.)
• Kellman, S. de R.L. de C.V. – Mexico (96.67%-Kellogg Company Mexico, S. de R.L. de C.V.; 3.33%- Gollek Interamericas, S. de
R.L., de C.V.) • Kellogg de Mexico, S. de R.L. de C.V. – Mexico (formerly Kellogg de Mexico, S.A. de C.V.)
• Kellogg Servicios, S.C. – Mexico (98%-Kellogg Company Mexico, S. de R.L. de C.V.; 2%- Gollek Interamericas, S. de R.L., de
C.V.)
• Pronumex, S. de R.L. de C.V. – Mexico (96.67%-Kellogg Company Mexico, S. de R.L. de C.V.; 3.33%- Gollek Interamericas, S. de
R.L., de C.V.) • Instituto de Nutricion y Salud Kellogg, A.C. – Mexico
• Servicios Argkel, S.C. – Mexico (98%-Kellogg de Mexico, S. de R.L. de C.V.; 2%- Gollek Interamericas, S. de R.L., de C.V.)
• Kellogg Brasil & CIA – Brasil (50%-Gollek, Inc.; 50%-Kellogg Brasil, Inc.) • Kellogg El Salvador S. de R.L. de C.V. – El Salvador (99%-Gollek Inc & 1%-Kellogg de Centro America, S.A.)

Exhibit 23.01
CONSENT OF INDEPENDENT REGISTERED PUBLIC ACCOUNTING FIRM
We hereby consent to the incorporation by reference in the Registration Statements on Form S-3 (Nos. 333-72312, 333-135767, 333-159303 and 333-160537) and the Registration Statements on Form S-8 (Nos. 33-40651, 33-53403, 333-56536, 333-88162, 333-109233, 333-109234, 333-109235, 333-109238, 333-158824 and 333-158826) of Kellogg Company of our report dated February 26, 2010 relating to the financial statements and the effectiveness of internal control over financial reporting, which appears in this Form 10-K.
/s/ PricewaterhouseCoopers LLP
PricewaterhouseCoopers LLP Battle Creek, Michigan February 26, 2010

Exhibit 24.01
POWER OF ATTORNEY
KNOW ALL BY THESE PRESENT, That I, the undersigned Director of Kellogg Company, a Delaware corporation, hereby appoint Gary H. Pilnick, Senior Vice President, General Counsel, Corporate Development and Secretary of Kellogg Company, as my lawful attorney-in-fact and agent, to act on my behalf, with full power of substitution, in executing and filing the Company’s Annual Report on Form 10-K for fiscal year ended January 2, 2010, and any exhibits, amendments and other documents related thereto, with the Securities and Exchange Commission.
Whereupon, I grant unto said Gary H. Pilnick full power and authority to perform all necessary and appropriate acts in connection therewith, and hereby ratify and confirm all that said attorney-in-fact and agent, or his substitute, may lawfully do, or cause to be done, by virtue hereof.
Dated: February 19, 2010
/s/ James M. Jenness James M. Jenness

POWER OF ATTORNEY
KNOW ALL BY THESE PRESENT, That I, the undersigned Director of Kellogg Company, a Delaware corporation, hereby appoint Gary H. Pilnick, Senior Vice President, General Counsel, Corporate Development and Secretary of Kellogg Company, as my lawful attorney-in-fact and agent, to act on my behalf, with full power of substitution, in executing and filing the Company’s Annual Report on Form 10-K for fiscal year ended January 2, 2010, and any exhibits, amendments and other documents related thereto, with the Securities and Exchange Commission.
Whereupon, I grant unto said Gary H. Pilnick full power and authority to perform all necessary and appropriate acts in connection therewith, and hereby ratify and confirm all that said attorney-in-fact and agent, or his substitute, may lawfully do, or cause to be done, by virtue hereof.
Dated: February 19, 2010
/s/ Benjamin S. Carson, Sr. Benjamin S. Carson, Sr.

POWER OF ATTORNEY
KNOW ALL BY THESE PRESENT That I, the undersigned Director of Kellogg Company, a Delaware corporation, hereby appoint Gary H. Pilnick, Senior Vice President, General Counsel, Corporate Development and Secretary of Kellogg Company, as my lawful attorney-in-fact and agent, to act on my behalf, with full power of substitution, in executing and filing the Company’s Annual Report on Form 10-K for fiscal year ended January 2, 2010, and any exhibits, amendments and other documents related thereto, with the Securities and Exchange Commission.
Whereupon, I grant unto said Gary H. Pilnick full power and authority to perform all necessary and appropriate acts in connection therewith, and hereby ratify and confirm all that said attorney-in-fact and agent, or his substitute, may lawfully do, or cause to be done, by virtue hereof.
Dated: February 19, 2010
/s/ John T. Dillon John T. Dillon

POWER OF ATTORNEY
KNOW ALL BY THESE PRESENT, That I, the undersigned Director of Kellogg Company, a Delaware corporation, hereby appoint Gary H. Pilnick, Senior Vice President, General Counsel, Corporate Development and Secretary of Kellogg Company, as my lawful attorney-in-fact and agent, to act on my behalf, with full power of substitution, in executing and filing the Company’s Annual Report on Form 10-K for fiscal year ended January 2, 2010, and any exhibits, amendments and other documents related thereto, with the Securities and Exchange Commission.
Whereupon, I grant unto said Gary H. Pilnick full power and authority to perform all necessary and appropriate acts in connection therewith, and hereby ratify and confirm all that said attorney-in-fact and agent, or his substitute, may lawfully do, or cause to be done, by virtue hereof.
Dated: February 19, 2010
/s/ Gordon Gund Gordon Gund

POWER OF ATTORNEY
KNOW ALL BY THESE PRESENT, That I, the undersigned Director of Kellogg Company, a Delaware corporation, hereby appoint Gary H. Pilnick, Senior Vice President, General Counsel, Corporate Development and Secretary of Kellogg Company, as my lawful attorney-in-fact and agent, to act on my behalf, with full power of substitution, in executing and filing the Company’s Annual Report on Form 10-K for fiscal year ended January 2, 2010, and any exhibits, amendments and other documents related thereto, with the Securities and Exchange Commission.
Whereupon, I grant unto said Gary H. Pilnick full power and authority to perform all necessary and appropriate acts in connection therewith, and hereby ratify and confirm all that said attorney-in-fact and agent, or his substitute, may lawfully do, or cause to be done, by virtue hereof.
Dated: February 19, 2010
/s/ Dorothy A. Johnson Dorothy A. Johnson

POWER OF ATTORNEY
KNOW ALL BY THESE PRESENT, That I, the undersigned Director of Kellogg Company, a Delaware corporation, hereby appoint Gary H. Pilnick, Senior Vice President, General Counsel, Corporate Development and Secretary of Kellogg Company, as my lawful attorney-in-fact and agent, to act on my behalf, with full power of substitution, in executing and filing the Company’s Annual Report on Form 10-K for fiscal year ended January 2, 2010, and any exhibits, amendments and other documents related thereto, with the Securities and Exchange Commission.
Whereupon, I grant unto said Gary H. Pilnick full power and authority to perform all necessary and appropriate acts in connection therewith, and hereby ratify and confirm all that said attorney-in-fact and agent, or his substitute, may lawfully do, or cause to be done, by virtue hereof.
Dated: February 19, 2010
/s/ Donald R. Knauss Donald R. Knauss

POWER OF ATTORNEY
KNOW ALL BY THESE PRESENT, That I, the undersigned Director of Kellogg Company, a Delaware corporation, hereby appoint Gary H. Pilnick, Senior Vice President, General Counsel, Corporate Development and Secretary of Kellogg Company, as my lawful attorney-in-fact and agent, to act on my behalf, with full power of substitution, in executing and filing the Company’s Annual Report on Form 10-K for fiscal year ended January 2, 2010, and any exhibits, amendments and other documents related thereto, with the Securities and Exchange Commission.
Whereupon, I grant unto said Gary H. Pilnick full power and authority to perform all necessary and appropriate acts in connection therewith, and hereby ratify and confirm all that said attorney-in-fact and agent, or his substitute, may lawfully do, or cause to be done, by virtue hereof.
Dated: February 19, 2010
/s/ Ann McLaughlin Korologos Ann McLaughlin Korologos

POWER OF ATTORNEY
KNOW ALL BY THESE PRESENT, That I, the undersigned Director of Kellogg Company, a Delaware corporation, hereby appoint Gary H. Pilnick, Senior Vice President, General Counsel, Corporate Development and Secretary of Kellogg Company, as my lawful attorney-in-fact and agent, to act on my behalf, with full power of substitution, in executing and filing the Company’s Annual Report on Form 10-K for fiscal year ended January 2, 2010, and any exhibits, amendments and other documents related thereto, with the Securities and Exchange Commission.
Whereupon, I grant unto said Gary H. Pilnick full power and authority to perform all necessary and appropriate acts in connection therewith, and hereby ratify and confirm all that said attorney-in-fact and agent, or his substitute, may lawfully do, or cause to be done, by virtue hereof.
Dated: February 19, 2010
/s/ Rogelio M. Rebolledo Rogelio M. Rebolledo

POWER OF ATTORNEY
KNOW ALL BY THESE PRESENT, That I, the undersigned Director of Kellogg Company, a Delaware corporation, hereby appoint Gary H. Pilnick, Senior Vice President, General Counsel, Corporate Development and Secretary of Kellogg Company, as my lawful attorney-in-fact and agent, to act on my behalf, with full power of substitution, in executing and filing the Company’s Annual Report on Form 10-K for fiscal year ended January 2, 2010, and any exhibits, amendments and other documents related thereto, with the Securities and Exchange Commission.
Whereupon, I grant unto said Gary H. Pilnick full power and authority to perform all necessary and appropriate acts in connection therewith, and hereby ratify and confirm all that said attorney-in-fact and agent, or his substitute, may lawfully do, or cause to be done, by virtue hereof.
Dated: February 19, 2010
/s/ Sterling K. Speirn Sterling K. Speirn

POWER OF ATTORNEY
KNOW ALL BY THESE PRESENT, That I, the undersigned Director of Kellogg Company, a Delaware corporation, hereby appoint Gary H. Pilnick, Senior Vice President, General Counsel, Corporate Development and Secretary of Kellogg Company, as my lawful attorney-in-fact and agent, to act on my behalf, with full power of substitution, in executing and filing the Company’s Annual Report on Form 10-K for fiscal year ended January 2, 2010, and any exhibits, amendments and other documents related thereto, with the Securities and Exchange Commission.
Whereupon, I grant unto said Gary H. Pilnick full power and authority to perform all necessary and appropriate acts in connection therewith, and hereby ratify and confirm all that said attorney-in-fact and agent, or his substitute, may lawfully do, or cause to be done, by virtue hereof.
Dated: February 19, 2010
/s/ Robert A. Steele Robert A. Steele

POWER OF ATTORNEY
KNOW ALL BY THESE PRESENT, That I, the undersigned Director of Kellogg Company, a Delaware corporation, hereby appoint Gary H. Pilnick, Senior Vice President, General Counsel, Corporate Development and Secretary of Kellogg Company, as my lawful attorney-in-fact and agent, to act on my behalf, with full power of substitution, in executing and filing the Company’s Annual Report on Form 10-K for fiscal year ended January 2, 2010, and any exhibits, amendments and other documents related thereto, with the Securities and Exchange Commission.
Whereupon, I grant unto said Gary H. Pilnick full power and authority to perform all necessary and appropriate acts in connection therewith, and hereby ratify and confirm all that said attorney-in-fact and agent, or his substitute, may lawfully do, or cause to be done, by virtue hereof.
Dated: February 19, 2010
/s/ John L. Zabriskie John L. Zabriskie

Exhibit 31.1
CERTIFICATION
I, A. D. David Mackay, certify that:
1. I have reviewed this annual report on Form 10-K of Kellogg Company;
2. Based on my knowledge, this report does not contain any untrue statement of a material fact or omit to state a material fact necessary to make the statements made, in light of the circumstances under which such statements were made, not misleading with respect to the period covered by this report;
3. Based on my knowledge, the financial statements, and other financial information included in this annual report, fairly present in all material respects the financial condition, results of operations and cash flows of the registrant as of, and for, the periods presented in this report;
4. The registrant’s other certifying officer and I are responsible for establishing and maintaining disclosure controls and procedures (as defined in Exchange Act Rules 13a-15(e) and 15d-15(e)) and internal control over financial reporting (as defined in Exchange Act Rules 13a-15(f) and 15d-15(f)) for the registrant and we have:
5. The registrant’s other certifying officer and I have disclosed, based on our most recent evaluation of internal control over financial reporting, to the registrant’s auditors and the audit committee of the registrant’s board of directors (or persons performing the equivalent functions):
Date: February 26, 2010
a) Designed such disclosure controls and procedures, or caused such disclosure controls and procedures to be designed under our
supervision, to ensure that material information relating to the registrant, including its consolidated subsidiaries, is made known to us by others within those entities, particularly during the period in which this report is being prepared;
b) Designed such internal control over financial reporting, or caused such internal control over financial reporting to be designed under
our supervision, to provide reasonable assurance regarding the reliability of financial reporting and the preparation of financial statements for external purposes in accordance with generally accepted accounting principles;
c) Evaluated the effectiveness of the registrant’s disclosure controls and procedures and presented in this report our conclusions about
the effectiveness of the disclosure controls and procedures, as of the end of the period covered by this report based on such evaluation; and
d) Disclosed in this report any change in the registrant’s internal control over financial reporting that occurred during the registrant’s
most recent fiscal quarter (the registrant’s fiscal fourth quarter in the case of an annual report) that has materially affected, or is reasonably likely to materially affect, the registrant’s internal control over financial reporting; and
a) All significant deficiencies and material weaknesses in the design or operation of internal control over financial reporting which are
reasonably likely to adversely affect the registrant’s ability to record, process, summarize and report financial information; and
b) Any fraud, whether or not material, that involves management or other employees who have a significant role in the registrant’s
internal control over financial reporting.
/s/ A. D. David Mackay Name: A. D. David Mackay Title: President and Chief Executive Officer
Exhibit 31.2
CERTIFICATION
I, Ronald L. Dissinger, certify that:
1. I have reviewed this annual report on Form 10-K of Kellogg Company;
2. Based on my knowledge, this report does not contain any untrue statement of a material fact or omit to state a material fact necessary to make the statements made, in light of the circumstances under which such statements were made, not misleading with respect to the period covered by this report;
3. Based on my knowledge, the financial statements, and other financial information included in this annual report, fairly present in all material respects the financial condition, results of operations and cash flows of the registrant as of, and for, the periods presented in this report;
4. The registrant’s other certifying officer and I are responsible for establishing and maintaining disclosure controls and procedures (as defined in Exchange Act Rules 13a-15(e) and 15d-15(e)) and internal control over financial reporting (as defined in Exchange Act Rules 13a-15(f) and 15d-15(f)) for the registrant and we have:
5. The registrant’s other certifying officer and I have disclosed, based on our most recent evaluation of internal control over financial reporting, to the registrant’s auditors and the audit committee of the registrant’s board of directors (or persons performing the equivalent functions):
Date: February 26, 2010
a) Designed such disclosure controls and procedures, or caused such disclosure controls and procedures to be designed under our
supervision, to ensure that material information relating to the registrant, including its consolidated subsidiaries, is made known to us by others within those entities, particularly during the period in which this report is being prepared;
b) Designed such internal control over financial reporting, or caused such internal control over financial reporting to be designed under
our supervision, to provide reasonable assurance regarding the reliability of financial reporting and the preparation of financial statements for external purposes in accordance with generally accepted accounting principles;
c) Evaluated the effectiveness of the registrant’s disclosure controls and procedures and presented in this report our conclusions about
the effectiveness of the disclosure controls and procedures, as of the end of the period covered by this report based on such evaluation; and
d) Disclosed in this report any change in the registrant’s internal control over financial reporting that occurred during the registrant’s
most recent fiscal quarter (the registrant’s fiscal fourth quarter in the case of an annual report) that has materially affected, or is reasonably likely to materially affect, the registrant’s internal control over financial reporting; and
a) All significant deficiencies and material weaknesses in the design or operation of internal control over financial reporting which are
reasonably likely to adversely affect the registrant’s ability to record, process, summarize and report financial information; and
b) Any fraud, whether or not material, that involves management or other employees who have a significant role in the registrant’s
internal control over financial reporting.
/ s / Ronald L. Dissinger Name: Ronald L. Dissinger Title: Senior Vice President and Chief Financial Officer

Exhibit 32.1
SECTION 1350 CERTIFICATION
I, A. D. David Mackay, President and Chief Executive Officer of Kellogg Company hereby certify, on the date hereof, pursuant to 18 U.S.C. Section 1350, as adopted pursuant to Section 906 of the Sarbanes-Oxley Act of 2002, that
A signed copy of this original statement required by Section 906 has been provided to Kellogg Company and will be retained by Kellogg Company and furnished to the Securities and Exchange Commission or its staff on request.
Date: February 26, 2010
(1) the Annual Report on Form 10-K of Kellogg Company for the period ended January 2, 2010 (the “Report” ) fully complies with the
requirements of Section 13(a) or 15(d) of the Securities Exchange Act of 1934; and
(2) the information contained in the Report fairly presents, in all material respects, the financial condition and results of operations of
Kellogg Company.
/s/ A. D. David Mackay Name: A. D. David Mackay Title: President and Chief Executive Officer

Exhibit 32.2
SECTION 1350 CERTIFICATION
I, Ronald L. Dissinger, Senior Vice President and Chief Financial Officer of Kellogg Company hereby certify, on the date hereof, pursuant to 18 U.S.C. Section 1350, as adopted pursuant to Section 906 of the Sarbanes-Oxley Act of 2002, that
A signed copy of this original statement required by Section 906 has been provided to Kellogg Company and will be retained by Kellogg Company and furnished to the Securities and Exchange Commission or its staff on request.
Date: February 26, 2010
(1) the Annual Report on Form 10-K of Kellogg Company for the period ended January 2, 2010 (the “Report” ) fully complies with the
requirements of Section 13(a) or 15(d) of the Securities Exchange Act of 1934; and
(2) the information contained in the Report fairly presents, in all material respects, the financial condition and results of operations of
Kellogg Company.
/s/ Ronald L. Dissinger Name: Ronald L. Dissinger Title: Senior Vice President and Chief Financial Officer