Keeping GF successful - annual-report.georgfischer.com · 7 GF Corporation Letter to the...
157
Annual Report 2018 Keeping GF successful
Transcript of Keeping GF successful - annual-report.georgfischer.com · 7 GF Corporation Letter to the...

Annual Report 2018
Keeping GF successful

Major strategic steps done
3 GF Corporation:
3 Our Corporation 4 Key figures 2018 7 Letter to the Shareholders
11 Highlights 2018 14 Sustainability at GF 19 Organization of GF 22 GF Piping Systems: 22 At a glance 24 A clever solution 29 GF Casting Solutions: 29 At a glance 31 “We believe in continuous growth opportunities” 37 GF Machining Solutions: 37 At a glance 39 Clean laser technology to replace chemical etching 44 Corporate Governance 70 Compensation Report
Financial Report 2018
96 Consolidated financial statements142 Financial statements Georg Fischer Ltd156 Key figures
2 Content

3 GF Corporation
Our Corporation
GF comprises three divisions: GF Piping Systems, GF Casting Solutions, and GF Machining Solutions. Founded in 1802, the Corporation is headquartered in Switzerland and is present in 33 countries with 140 companies, 57 of them production facilities. Its 15’027 employees generated sales of CHF 4’572 million in 2018. GF is the preferred partner of its customers for the safe transport of liquids and gases, lightweight casting components, and high-precision manufacturing technologies.

4 GF Corporation
Key figures 2018
in CHFSales
in CHFEBIT
4’572million
4’572million
GF Piping Systems
GF Casting Solutions
GF Machining Solutions
382million
382million
GF Piping Systems
GF Casting Solutions
GF Machining Solutions
Sales
in CHF million
4’572
EBIT
in CHF million
382
EBIT margin
in %
8.4
ROIC
in %
22.4
Earnings per share
in CHF
69
Net profit after minorities
in CHF million
281

5 GF Corporation
Free cash flow before acquisitions/divestitures
in CHF million
147
Number of employees
15’027
Corporation GF Piping Systems GF Casting Solutions GF Machining SolutionsCHF million 2018 2017 2018 2017 2018 2017 2018 2017
Order intake 4'521 4'274 1'865 1'718 1'617 1'527 1'042 1'030Sales 4'572 4'150 1'821 1'678 1'687 1'482 1'066 992Sales growth % 10.2 10.8 8.5 12.3 13.8 11.0 7.5 8.3Organic growth % 6.5 9.8 8.2 12.1 5.2 8.9 5.4 7.4EBITDA 529 491 269 245 160 158 102 96EBIT 382 352 217 189 86 93 88 82Net profit after minorities 281 252 Free cash flow before acquisitions/divestitures 147 204 Return on sales (EBIT margin) % 8.4 8.5 11.9 11.3 5.1 6.3 8.3 8.3Invested capital (IC) 1'494 1'466 688 671 531 481 262 269Return on invested capital (ROIC) % 22.4 20.3 27.2 22.9 16.1 19.5 27.5 24.1Number of employees 15'027 15'835 6'852 6'764 4'693 5'738 3'394 3'255

6 GF Corporation
Key figures per region
in % (100% = CHF 4’572 million) in % (100% = CHF 1’668 million) in % (100% = 15’027)Sales per region Gross value added per region Employees per region

7 GF Corporation
Letter to the shareholders
Successful year, major strategic transformation
Yves Serra, President and CEO (left), and Andreas Koopmann, Chairman of the Board of Directors, at GF Machining Solutions in Beijing (China).
Dear shareholders,
GF grew again double-digit in 2018 to reach CHF 4’572 million. Free of acquisitions, divestments and currency effects, growth amounted to 7%, well above the 2020 strategy objectives of 3–5% per annum.
Sales grew by 7% to CHF 4’572 million.
The main pillar of organic growth has been GF Piping Systems, recording a high 8% organic growth rate for our largest division. The Corporation increased sales in all three regions Europe, Asia and America with America growing the most. After a very strong first semester, markets were affected during the second half-year by the ongoing trade tensions, which led to a softening of the GF growth rate.
The operational result (EBIT) increased by 9% to CHF 382 million. Both GF Piping Systems and GF Machining Solutions are the drivers of this increase.
The return on sales (ROS) stood at 8.4%, (2017: 8.5%), well in line with our 8–9% objective range. The return on invested capital (ROIC) further increased to 22.4%, compared to 20.3% in 2017, marginally surpassing our 18–22% objective range. The number of employees at year end decreased to 15’027, compared to 15’835 per end of 2017 as a consequence of the divestments of two iron foundries at GF Casting Solutions, whereas the

8 GF Corporation
acquisition of Precicast Industrial Holding SA (Switzerland) in April 2018 added 812 employees to the Corporation.
GF achieved a net profit after minorities of CHF 281 million, an increase of 12% compared to 2017 and a free cash flow before acquisitions of CHF 147 million (previous year CHF 204 million), basically at the lower end of GF’s target range of CHF 150–200 million. The main difference with previous year comes from future-oriented investments, namely the new production facility of GF Machining Solutions in Switzerland and the new US light metal foundry of GF Casting Solutions.
Earnings per share reached CHF 69 against CHF 62 in the previous year.
Earnings per share reached CHF 69, compared to CHF 62 in 2017. In view of the positive financial development in 2018, the Board of Directors will propose at the upcoming Annual Shareholders’ Meeting an increased dividend of CHF 25 a share, up from CHF 23 in the previous year.
GF Piping SystemsGF Piping Systems increased its sales by 9% to CHF 1’821 million. Organically the division grew by 8%. In 2018, the American and European operations of GF Piping Systems were the main growth contributors, whereas growth was muted in China as the ongoing trade disputes affected customer sentiment. The division generated an EBIT of CHF 217 million, 15% above previous year. The EBIT margin reached 11.9%, compared to 11.3% in 2017, as most plants were well-loaded and the sales of high-value products increased again over-proportionally.
GF Piping Systemsgrew its sales by 9%
1’821CHF million
GF Casting SolutionsGF Casting Solutions (formerly GF Automotive) also increased its sales in a significant manner to CHF 1’687 million, up 14%. The major growth drivers were the acquisitions of Precicast Industrial Holding SA (Switzerland) in April 2018 and of Eucasting Ro SRL (Romania) in November 2017. Organic growth stood at 5%. After a solid first half-year, the automotive industry in Europe suffered during the second half from new emission registration rules leading main car manufacturers to temporarily reduce production. The division’s operating result stood at CHF 86 million, compared to CHF 93 million in 2017. On one hand, the ramp-up of the new light metal foundry in the US had, as expected, a strong negative impact on profit and on the other hand, plant load suffered at year-end from the reduction of customer call-offs.
GF Casting Solutions grew its sales by 14%
1’687CHF million
GF Machining SolutionsOrder intake at GF Machining Solutions was slightly above the previous year with America showing a strong growth whereas the Chinese market became softer during the second half year as trade frictions affected customer sentiment. The division increased sales by 8% to CHF 1’066 million, organically +5%. The main drivers for the sales increase have been the aerospace and medical industries in Europe and the US. The operating result increased by 7% to CHF 88 million, resulting in an unchanged ROS of 8.3%.
GF Machining Solutions grew its sales by 8% to
1’066CHF million
Portfolio actively reshaped towards higher value businessesDuring 2018, the portfolio of GF Casting Solutions has been reshaped to intensify the focus on growing and promising fields such as light metal components for the automotive industry and precision castings for aircraft engines and gas turbines. Accordingly, the two large iron casting plants of

9 GF Corporation
Singen and Mettmann (Germany) have been divested in December to three experienced managers of GF Casting Solutions.
Furthermore, in April 2018, GF acquired Precicast Industrial Holding SA (Switzerland), a well-known precision castings specialist for the aerospace and gas turbine sectors. These two important strategic steps aim at generating a clearly higher profit margin at GF Casting Solutions. They also lead to a substantial reduction in the GF Corporation’s exposure to the automotive industry.
OutlookMacroeconomic conditions have become even more uncertain and volatile during the last few months. Chances are however intact, barring unforeseen circumstances, to pursue our positive development.
Chances are intact, barring unforeseen circumstances, to pursue our positive development.
At GF Piping Systems, a high number of new products are being launched such as a whole line of digital valves whilst promising market segments are being developed, like the cooling of data centers. GF Casting Solutions expects a clearly improved operating performance. The division begins the year with a reshaped portfolio and a large amount of orders worldwide. In addition, its new light metal joint-venture, GF Linamar, in the US is rapidly increasing production. GF Machining Solutions expects a steady growth in the aerospace and medical sectors. Automation orders keep growing and the division recently launched new technologies such as promising 3D printing systems and digital services.
Moreover, the weight of the most profitable division, GF Piping Systems within the Corporation has continued to significantly increase to almost 50% of total sales.
For GF overall, the 2020 Strategy growth objectives remain unchanged at 3–5%. Regarding profitability, reinforced through the portfolio reshaping of GF Casting Solutions, the objectives for the current 2016–2020 strategy have been increased to 9–10% (from 8–9%) for the ROS and 20–24% (from 18–22%) for the ROIC.
Vice-Chairman Gerold Bührer to retire from the GF BoardIn December 2018, we announced that our Vice-Chairman Gerold Bührer will retire from our Board at the next Annual Shareholders’ Meeting in April, having reached the age limit of 70. In the Board for the last 18 years, Gerold Bührer has been a long-standing member of our Audit Committee, combining his intimate understanding of GF where he had worked from 1991 to 2000 as CFO with his extensive knowledge of the national and international economic and political landscape. We wish Gerold Bührer all the best in his future endeavors and thank him again for his countless very valuable contributions he made to our company.
CFO Andreas Müller to succeed Yves Serra as CEO in April 2019After 27 years at the service of GF, the last eleven as our CEO, Yves Serra (65) will retire in April 2019 and will be succeeded by the current CFO, Andreas Müller (48). Yves Serra will be proposed for election to our Board at the upcoming Annual Shareholders’ Meeting of 17 April 2019.
The Board of Directors nominated Mads Joergensen as new CFO, effective 18 April 2019. Since 2009, he has served as CFO of GF Piping Systems.

10 GF Corporation
Carlos Vasto succeeds Josef Edbauer as Head of GF Casting SolutionsOn 1 September 2018, Carlos Vasto (55) became Head of GF Casting Solutions. He replaced Josef Edbauer (61) who went into retirement after a long and successful career at GF. The Board and Executive Committee thank very much Josef Edbauer for his 40 years’ commitment to GF and wish him the best of health in this new chapter in his life.
Grateful thanks to our employees and customersOur heartfelt gratitude goes to all GF employees whose remarkable team spirit allows us to better serve our clients across borders. Our innovation initiatives depend very much on listening to and quickly acting upon our customer needs. May we therefore equally thank our customers for their openness in sharing their needs.
We also thank you, our shareholders, for your continuing trust, and our banks for their long-standing support for our company.
Andreas KoopmannChairman of the Board of Directors
Yves SerraPresident and CEO
The Board of Directors would like to thank Yves Serra, our outgoing CEO for his important contributions to GF in various operational positions during his long career in our company since 1991. In particular since 2008, when he took over the highest executive function in the Group as CEO, he has, with his teams, successfully led the company through deep transformations. GF has, during his tenure as CEO, experienced one of the longest periods of profitable growth in its history.
The Board of Directors looks forward, subject to his election by our shareholders, to a fruitful cooperation with Yves Serra as a Board member in the years to come.
Andreas KoopmannChairman of the Board of Directors

11 GF Corporation
Highlights 2018
01/2018
Strengthening presence in the aerospace business
In January 2018, GF Casting Solutions purchased 100% of Precicast Industrial Holding SA, the Swiss-based precision casting specialist. This is in line with the division’s strategy to increase its industrial sectors presence, in particular in the promising aerospace field. Upon closing in April, the division was renamed from GF Automotive to GF Casting Solutions, which reflects the portfolio evolution.
03/2018
Klostergut: A property for 100 years
GF has owned the listed convent Klostergut Paradies in Schlatt (Switzerland) since 1918. Today, it serves as a training center for the Corporation. In 2018, GF organized a range of activities and the exhibition “100 years of GF at Klostergut Paradies” to celebrate the 100th anniversary.
05/2018
GF invests more than CHF 20 million in Schaffhausen
In May 2018, the complete refurbishment of the headquarters of GF Piping Systems in Schaffhausen (Switzerland) has started. Over an area of 3’000 square meters, the project will give rise to innovative offices with team, co-working and project rooms, a spacious laboratory and a new training center with attractive training and exhibition rooms. Energy efficiency measures and a new photovoltaic system will bring the building up to the Minergie standard in the future. With the modernization project costing more than CHF 20 million, which is due to be completed by the end of 2019, GF is equipping itself for the future, with digitalization and agile working concepts remaining key focal points.

12 GF Corporation
07/2018
For a sustainable company development
It is of great importance for GF to reduce the accident rate. Most recently, this rate has been reduced company-wide from 25 to 15.9 per one million working hours. The company is thus well on track in achieving the stated sustainability target for 2020. The target focuses on achieving a 20% reduction in the accident rate compared with the average rate between 2013 and 2015. Further sustainability goals, indicators and efforts are extensively described in the GF Sustainability Report that was published in July 2018.
09/2018
New Head of GF Casting Solutions
Carlos Vasto took over as the Head of GF Casting Solutions on 1 September 2018. The Brazilian-Italian dual citizen stepped into the shoes of Josef Edbauer, who retired at the end of 2018 after working at GF for more than 40 years. Carlos Vasto has been with GF since 1987 and has extensive international experience in the automotive and the mechanical engineering sectors. Most recently, he led the division’s Business Unit “Iron and Investment Casting Europe”.
11/2018
Modern plant of GF Machining Solutions in China
GF Machining Solutions will open a new plant in the high-tech district in the ultra-modern industrial park in Changzhou (China) by the end of November 2019. The groundbreaking ceremony took place in November 2018. The building spans over 32’000 square meters and is primarily intended for the manufacturing and development of machine tools. With the new building, technical innovations will be promoted and the division will acquire leading companies as its customers. Moreover, this project contributes significantly towards the overarching goal of establishing GF Machining Solutions as the world’s leading provider for high-quality machine tools.
11/2018
GF won large orders in the aerospace sector
In North America, GF Machining Solutions has won a large number of new orders in the strategically important aerospace sector. The new orders include the whole range of Electrical Discharge Machines (EDM), milling and laser machines as well as automation solutions and services for a total value of approx. USD 100 million. The customers, well-known aircraft engine manufacturers and their suppliers, will use the new machines for the highly demanding production of blades, blisks and other complex components to be used in the latest generation of aero engines. The orders are to be delivered in the next four years, starting 2019.

13 GF Corporation
11/2018
Record-high orders for the e-mobility market
In 2018, GF Casting Solutions received several large contracts to supply lightweight components for a new generation of electric vehicles. The new contracts have been placed by Chinese and European manufacturers and amount to approx. CHF 370 million. The high number of new orders underscores GF Casting Solutions’ lightweight competence in the fast growing e-mobility market segment in China. Lightweight design is an important factor in improving the range of electric cars.
12/2018
Divesting two European iron casting plants
GF Casting Solutions is reducing its presence in iron casting in Europe, in order to achieve a stronger focus on light metal casting. As a consequence, the iron casting plants located in Singen and Mettmann (Germany) have been divested as of December 2018. The reshaping of its portfolio will allow GF Casting Solutions to better leverage opportunities in light vehicle structures and aircraft engine components.
12/2018
CEO change at GF
The Board of Directors of GF has appointed Andreas Müller as CEO of the Corporation. At the Annual Shareholders’ Meeting of 17 April 2019 he will take over from Yves Serra, who has reached the retirement age of 65. Andreas Müller is today CFO and Member of the Executive Committee of GF. Previously, he was CFO of GF Casting Solutions for eight years. Andreas Müller has extensive experience in finance & operations, portfolio management, acquisitions, risk management, IT and strategy. The Board of Directors of GF will propose the election of Yves Serra to the Board at the Annual Shareholders’ Meeting.

14 GF Corporation
Sustainability at GF
Being an internationally active industrial Corporation, GF touches a variety of stakeholder groups along its entire value chain. Therefore, sustainability management at GF involves two aspects – where the organization can have a direct influence, and where GF’s impact is indirect. The latter relates to the product lifecycles and their use by our customers. The former refers to an inward view of GF’s own conduct and activities as well as partially to its supply chain.
Herein, compliance with social and environmental standards and respect towards people and planet are the cornerstones of GF’s business approach. The five values of GF form the foundation for GF’s business conduct and Corporate strategy. The values are translated into a set of standards for ethics and integrity, which define GF’s culture and are summarized in the Corporation’s Code of Conduct.
In GF’s core business, sustainability efforts are directly linked to the Corporation’s understanding of its purpose – to add value to and improve the quality of lives through all of our business endeavors. The products and solutions of GF accompany the daily activities of people all over the world – from when they are drinking tap water, taking escalators, driving to work, to them going to a dentist’s or working on a laptop. In all of these situations, it is highly likely that GF’s products were involved in the process of bringing that experience to the end consumer. GF aims to ensure that the components or full-system solutions that are designed and produced, address the megatrends facing today’s society and provide best added value from both quality and sustainability angles for our customers.
Focused on safety and efficiencyWith its products and solutions, GF Piping Systems ensures high water quality along the entire water management cycle and addresses the need for safety, reliability, efficiency and hygiene in the distribution of this valuable resource. As an example of one of the many solutions of GF Piping Systems, COOL-FIT 4.0, a pre-insulated piping system made of plastic and using an innovating joining technology, enables customers to use energy more efficiently. This is guaranteed by a 100% maintenance-free and easy-to-install system, with 30% higher energy efficiency compared to market alternatives. In addition, installations take about half of the time.

15 GF Corporation
COOL-FIT 4.0 enables reliable and safe cooling for industrial and commercial systems with 30% higher energy efficiency.
Innovative materials and bionic design enable GF Casting Solutions to create extremely lightweight components. Therefore, the division addresses the pressing issues facing the automotive and aerospace sectors on how to substantially reduce the CO emissions of vehicles and jet engines of aircraft. In addition to emission reductions, less weight means a greater range, which is an important aspect for both industries, particularly for the transition towards e-mobility. Reducing material wherever possible, adjusting shapes, integrating functions, and combining the flexibility of iron casting with steel inserts and magnesium casts allows for a more than 20% weight reduction of GF components as compared to those made using traditional methods.
2
By using the magnesium die casting process, the weight of components, like this cross car beam, can be significantly reduced.
EDM, laser, milling and other machines of GF Machining Solutions offer energy-saving solutions for the production of molds and finished parts used by a broad range of industries. A concrete example of the application of GF’s laser machines can be found in the texturing of mold surfaces.

16 GF Corporation
Here, the standard practice is to use an acid-etching process requiring chemicals, which are associated with environmental and risk hazards. Applying a direct laser texturing technology allows this potential damage to be reduced, while also increasing consistency in production and minimizing waste of materials.
Medical parts, such as implants, are some of the many applications of the modern laser technology of GF Machining Solutions. The technology combines high-precision texturing with an increase in energy efficiency of up to 25%.
In line with Strategy 2020For broader impact through the lifetime of its products, GF continuously engages with customers to understand their needs and requirements. GF strives to meet and exceed the expectations that customers set towards their suppliers with regard to social and environmental performance. Additionally, GF works on continuously optimizing its own logistics processes in order to increase efficiencies and be more environmentally friendly.
GF supports international efforts for transparency on and advancement of sustainability topics:
CDP reporting on Climate Change and Water
UNGC membership – signatory and a participant
Concrete sustainability-relevant measures that the Corporation and its three divisions are working on are based on the set of Sustainability Targets 2020 defined in 2015. These targets are closely linked with the Strategy 2020 of GF and the respective activities contribute to the key strategic thrusts of the Corporation. GF is now slightly past the halfway mark. So far the Corporation could advance and observe progress on a number of sustainability topics. However, it is a gradual process, and it is necessary to ensure that systematic measures continue to be applied to meet the set ambition levels.
In 2018, the focus was placed on further streamlining the internal processes on environmental and social Key Performance Indicator reporting as well as on increased collaboration between the various internal functions and the dedicated sustainability specialists to further anchor the topic into daily activities of GF. Safety at work remained highest priority, with continuous measures implemented across the locations. A range of activities was implemented to increase the energy efficiency of production facilities, and concept development was initiated on a framework to ensure sustainability in GF’s supply chain. Continuing an annual tradition, GF conducted a regional sustainability conference in 2018, bringing together for the first time the GF environmental and Health

17 GF Corporation
& Safety specialists from the European locations. The objectives of the event were to foster knowledge exchange among locations and to increase momentum on goals set within the Sustainability Targets 2020 in the areas of energy efficiency, waste management and workplace safety.
Anchored in the social environmentIn accordance with its fundamental values, GF supports and promotes cultural and social programs at its various locations, as well as activities that contribute to the common good. In 2018, around CHF 2 million were spent corporation-wide on social involvement activities. In addition to this, several GF companies supported local activities by making substantial contributions. The biggest contributions in 2018 went to the Corporation-owned foundations Klostergut Paradies, Iron Library and Clean Water.
GF is a member of various Swiss and international business associations with annual membership fees in the amount of less than CHF 0.1 million. In the year under review, no contributions were made to political parties or to individual politicians.
Klostergut Paradies: A property for 100 yearsGF has owned Klostergut Paradies in Schlatt (Switzerland) since 1918. Today, this historical building serves as a seminar and training center for the Corporation. GF celebrated this centenary with a festive ceremony for guests from politics, business and society. At the same time, a photo exhibition was opened in the heritage-protected monastery, recalling “100 years of GF in the Klostergut Paradies”. A new book with historical photos from the Corporate Archives and the history of the Corporation also proved to be very popular. The Iron Library is situated in a wing of the monastery. This corporation-owned foundation has the largest private collection of books on the subject of iron and industrialization. Together with the Corporate Archives, it is the center of competence for maintaining the Corporation’s historical and cultural heritage.
A sustainably better access to clean drinking waterThrough its Clean Water Foundation GF has supported a total of 145 drinking water projects worldwide since 2002. To date, GF has invested more than CHF 10 million and has improved the lives of more than 300’000 people with sustainably better access to clean drinking water. Another sustainable initiative was launched in order to mark “100 years of vocational training at GF”. In this context, 16 GF apprentices were given the opportunity to spend a week visiting development projects in Bolivia and playing an active part in assisting in them. This unforgettable travel experience for the young people was arranged jointly by the Clean Water Foundation and Caritas Switzerland, the foundation’s biggest partner, and financed by GF.

18 GF Corporation
In summer 2018, 16 GF apprentices spent a week in Bolivia, where they visited several development projects.
For highlights of specific actions that took place during 2018 and status achievement tracking towards the Sustainability Targets 2020, please refer to the Sustainability Report 2018. It will be published on the GF website in April 2019.

19 GF Corporation
Organization of GF
The GF Executive Committee f.l.t.r.: Carlos Vasto (Head of GF Casting Solutions), Yves Serra (CEO), Pascal Boillat (Head of GF Machining Solutions), Andreas Müller (CFO) and Joost Geginat (Head of GF Piping Systems) at GF Casting Solutions in Altenmarkt (Austria).
Georg Fischer Ltd, the Holding Company of the GF Corporation, is organized under Swiss law. It is headquartered in Schaffhausen (Switzerland), and listed on the SIX Swiss Exchange.
Board of DirectorsThe nine members of the Board of Directors are elected individually by the Annual Shareholders’ Meeting. The Board of Directors has ultimate responsibility for supervising and monitoring the management of Georg Fischer Ltd. It decides on the company strategy and organizational structure, the organization of finance and accounting, the annual budget and the investment budget, and appoints the members of the Executive Committee, to which it transfers the operational management of the Corporation. All members of the Board of Directors are non-executive.
Executive CommitteeThe Chief Executive Officer (CEO) is responsible for the management of the Corporation. Under his leadership, the Executive Committee addresses all issues of relevance to the Corporation, takes decisions within its remit, and submits proposals to the Board of Directors.

20 GF Corporation
Corporate structureGF Corporation is organized in the three divisions GF Piping Systems, GF Casting Solutions, GF Machining Solutions and the two Corporate Staff Units Finance & Controlling and Corporate Development. The Heads of the Divisions and the Corporate Staff Units are responsible for managing their businesses and for achieving their business objectives.
Corporate CenterThe CEO and the CFO form the Corporate Center in the narrower sense. The Corporate Center is closely involved in management, planning, IT, communications, finance, management development, and corporate culture and is supported in these tasks by a team of about 50 people. The Corporate Center ensures that risk management, transparency, Corporate Governance, sustainability, and compliance practices meet the requirements of the owners and the public, and it supports the Board of Directors in meeting its responsibilities.
FinanceCorporate Finance & Controlling uses state-of-the-art information systems to ensure the time-critical financial management of the Corporation. A standardized system of financial reporting is used throughout the entire Corporation, guaranteeing immediate and complete transparency. Currency, interest rate, and credit risks are monitored and managed at Corporation level.
Management development Strategically important competencies and information are shared and made available throughout the Corporation. Considerable importance is attached to internal training, talent management and to putting the best possible people in management positions. Up to 70% of all senior management positions are filled with internal candidates.
CommunicationThe Corporation has a strong brand with GF, which has been built up and strengthened consistently over many years. The Corporation builds confidence in its products and services with an open and active communication policy to customers, employees, media, analysts, shareholders, and other stakeholders.
Corporate values The sustainable development of the Corporation is supported by shared corporate values. They are put down in writing in the Code of Conduct and are becoming increasingly important with the spread of globalization.
Corporate Governance For detailed information on Corporate Governance see the same named chapter.

21 GF Corporation
GF organization structureAs of 31 December 2018

22 GF Piping Systems
Key figures
GF Piping Systems at a glance
GF Piping Systems is a leading supplier of piping systems made of plastics and metal. The division focuses on system solutions and high-quality components for the safe transport of water, chemicals and gases, as well as corresponding services. The product portfolio of fittings, valves, pipes, automation and jointing technologies covers all applications of the water cycle.
Global presenceGF Piping Systems supports customers in the fields of utility, industry and building technology in over 100 countries through its own sales companies and representative offices. The division operates several research and development centers as well as more than 30 production sites in Europe, Asia, North and South America.
Employees
6’852CHF million 2018 2017
Order intake 1'865 1'718Sales 1'821 1'678Sales growth % 8.5 12.3Organic growth % 8.2 12.1EBITDA 269 245EBIT 217 189Return on sales (EBIT margin) % 11.9 11.3Invested capital (IC) 688 671Return on invested capital (ROIC) % 27.2 22.9Number of employees 6'852 6'764
in CHFSales per region
in CHFSales per segment
1’821million
Germany Switzerland
Austria Rest of Europe
Americas China
Rest of Asia Rest of world
1’821million
Utility
Industry
Building technology

23 GF Piping Systems
Strategy 2020
Cooling of data centers offers great market potential
Global providers of cloud-based storage solutions, mobile telephony service providers as well as search engine and social network operators are constantly increasing their systems’ capacities – and enhancing their performance. As they invest in these, more is demanded in terms of the security of data and operations. It is essential that efficient and constant cooling of the IT infrastructure is provided, in order to avoid overheating and the interruptions that result from it. GF Piping Systems has been helping companies in keeping their data centers cool for some years now. The system solution COOL-FIT 4.0 was rolled out in 2018. It ensures that GF Piping Systems continues to meet the highest process security standards, and enables its customers to use energy more efficiently while reducing their maintenance and operating costs. Therefore, the division has good prospects of being able to succeed in this promising growth market.
Strategy 2020
Driving the digitalization of products and applications
A significant milestone was achieved in the digitalization of GF Piping Systems’ products: the latest generation of the division’s actuators will become smart. These “smart actuators”, once connected to the operator’s smartphones and tablets, impress with easy handling and data access as well as remote control and diagnosis. Increased efficiency and simplified workflow from installation to maintenance are the effects. The new actuator will be launched in the first half of 2019.
Strategy 2020
Establishing collaborative working
The way of working these days has changed significantly. Collaboration and interaction are key terms in the modern working world. A shift to project and team spaces instead of individual workplaces helps GF Piping Systems to become more agile and flexible in its way of working. By fall 2019, the division’s headquarters in Schaffhausen (Switzerland) will be completely refurbished. Over an area of 3’000 square meters innovative offices with team, co-working and project rooms will be realized which foster collaboration resulting in higher innovational strength.

24 GF Piping Systems
A clever solution
The Hycleen Automation System is suitable for new buildings such as the senior and care center Senevita Mülibach (Switzerland). Source renderings: Senevita AG
When drinking water is set at the wrong temperature and does not circulate enough in the piping, bacteria reproduce particularly fast. The Hycleen Automation System from GF Piping Systems was developed for exactly this type of situation, and ensures perfect drinking water quality in hospitals, retirement homes or schools.
Arnaud Andreolli, Product Manager for the building technology segment at GF Piping Systems in Sissach (Switzerland), knows the dangers of bacterial contamination in drinking water very well: “Especially elderly people or people with a weak immune system can get more easily infected with legionella and develop illnesses such as severe pneumonia.” Owners or managers of hospitals or large public facilities in countries with particularly strict regulations, for example in Germany, Austria or Switzerland, have therefore increasingly been inquiring about sustainable solutions that ensure safe water supply, reports Andreolli.
Lower energy consumptionGF Piping Systems responded to this demand and developed the Hycleen Automation System in 2018 – the first solution of its kind worldwide. Based on a four-stage concept, it sustainably reduces bacteria levels in drinking water for single-family houses and residential buildings as well as retirement homes, schools and hospitals. By circulating the water and creating a permanent hydraulic balance across all the pipes, the system ensures a constant high temperature of over 55°C and consequently a virtually sterile environment. This can systematically prevent any

25 GF Piping Systems
excessive formation of legionella bacteria, for which the ideal growth conditions are between 25°C and 50°C. The Hycleen Automation System only allows as much hot water to circulate in the pipes as necessary and in so doing prevents the loss of warmth and energy that would have been necessary to reheat the water. This enables owners or managers of large houses and buildings with multiple connections to save up to 15% in energy consumption.
Ideal for existing and new buildingsIn February 2018, the Hycleen Automation System was put into operation for the first time at a customer’s premises – in the Erlabrunn clinical center in Germany’s Ore Mountains region. Senevita Mülibach, a senior and care center located 15 kilometers northwest of Zurich (Switzerland), demonstrates that the Hycleen Automation System is not only suitable for existing buildings but also for new buildings. Following the completion of the construction work and its inauguration in September 2019, the striking, elliptical building will offer living space for up to 109 senior citizens and people in need of nursing care. 81 nursing rooms and 18 apartments for the elderly with roof gardens, administration offices and infrastructure rooms distributed over four floors provide for an environment that is a pleasure to live in and meets all requirements.
Yannik Waeber from the engineering firm Basler & Hofmann West AG based in Zollikofen (Switzerland) was commissioned by the client Senevita to lead the technical planning of the building technology in the Mülibach center. He was aware right from the start of the planning phase that special measures were needed for older people in the new residential and care center, i.e. to control the water temperature and prevent germs from building up in the hot water. Yannik Waeber was already familiar with the GF Piping Systems building technology product range, including from a previous renovation of a senior citizens’ home. “During discussions with the Swiss sales company of GF Piping Systems, I was made aware of the Hycleen Automation System that had just been launched on the market at the beginning of 2018,” recalls Waeber. “It was well suited to our needs because the circulation system with automatic adjustment capabilities ensures the best hygienic conditions in the long term and reduces the risk of germs forming.”
It took only two weeks for the system to be delivered after being ordered, and the technician had assembled and connected the Hycleen Automation System within a few days after this – which involved a total of 260 meters of cable, 19 adapters, 18 valves and 1 system master with control screen. As with the Erlabrunn clinical center, the installation in Mülibach was quick and uncomplicated. The extent to which the Hycleen Automation System can reduce energy costs for water heating will become apparent after the first year of operation. Yannik Waeber and the center operator Senevita are hoping for considerable savings.
Arnaud AndreolliProduct Manager at GF Piping Systems
“The Hycleen Automation System is exceeding the expectations of our customers.”

26 GF Piping Systems
Tapping into new marketsProduct Manager Arnaud Andreolli is satisfied with the current level of demand being shown for the Hycleen Automation System. “By the end of 2018, we will have installed the system in 33 buildings – with many more orders in the pipeline.” He concludes that the Hycleen Automation System is even exceeding expectations at the moment. “The feedback collected by our sales companies has shown that customers recognize and appreciate the added value provided by GF’s Hycleen.”
In addition to Germany and Turkey, the division also has plans to expand into the markets of Switzerland, Austria, Norway, Sweden, Finland, Denmark, France, Italy, Spain, Australia, India and the USA.
Low effort, big impactThe energy-conscious Hycleen Automation System from the Hycleen product range ensures improved hygiene standards for drinking water in public and private buildings. A unique system master with a control screen and easy-to-operate software manages up to 50 connected valves, sensors and applications.
Improved hygiene standards for drinking water in four stepsThe Hycleen Automation System covers the four processes for ensuring drinking water quality: prevention, monitoring, intervention and risk assessment.
Prevention: targeted preventive measures can make a difference to the quality of drinking water. Alongside ensuring the water is at the right temperature, these measures also include maintaining a constant hydraulic balance and regular flushing.
Monitoring: this refers to taking the existing drinking water quality as well as the type of building into consideration. Seamless temperature monitoring is just as important as the storing and documenting of measurements.
Intervention: an intervention should only be carried out as the last resort in ensuring high-quality drinking water. Some methods of intervention include thermal or chemical disinfection.
Risk assessment: risk assessment is particularly important for larger projects. The wide range of data that can be obtained using the Hycleen system is a major help in assessing the condition of the drinking water and in recognizing risks.
Hycleen Automation System from GF Piping Systems
https://www.youtube.com/embed/0rrWRTXfOao

27 GF Piping Systems
Arnaud Andreolli is Product Manager for the building technology segment at GF Piping Systems in Sissach (Switzerland).
Senevita Mülibach is a senior and care center located 15 kilometers northwest of Zurich (Switzerland).
Yannik Waeber was commissioned by Senevita to lead the technical planning of the building technology in the Mülibach center.
The Hycleen Automation System ensures optimum hygienic conditions in the long term due to the circulation system with automatic adjustment capabilities.
Yannik Waeber: “Due to Hycleen we are hoping for considerable savings in energy costs.”

28 GF Piping Systems
“A very important preventive measure against contamination”
Yannik Waeber from Basler & Hofmann West AG in Zollikofen (Switzerland) is responsible for planning the building technology being installed in the new Senevita Mülibach senior and care center.
As it is going to be used as a retirement and nursing home, we focused on drinking water hygiene right from the start of the planning phase. One of the key preventive measures for combating the formation of legionella germs for us is guaranteeing a specific temperature in the hot water supply. Our aim is to keep the temperature constant within the range recommended by the Swiss Federal Office of Public Health and the Swiss Federal Food Safety and Veterinary Office.
Mr. Waeber, what were the key factors involved in planning sanitary engineering in the Mülibach project?
The Hycleen Automation System is an important resource for constantly maintaining the temperature of hot water at a specified level. With the temperature measurements in the circulation controllers and the ability to record the measurement data, the hot water temperatures can also be monitored over longer periods of time and in various operating states.
Why do you appreciate the Hycleen Automation System and what are your expectations of it?
I was very happy with the help we received during the project planning phase. Since the Hycleen Automation System is a new product and we had no experience with it, the GF technicians provided us with professional advice and support.
What was it like working with GF?

29 GF Casting Solutions
Key figures
GF Casting Solutions at a glance
GF Casting Solutions is a technologically pioneering development partner and manufacturer of cast components and systems for the global automotive industry, aerospace and energy markets, off-highway vehicles as well as for industrial applications. The highly complex lightweight components are produced using different manufacturing technologies – from the development to the ready-to-mount solution.
Global presenceGF Casting Solutions manufactures at 14 production sites in Germany, Austria, Romania, Switzerland, China and the USA. The research and development centers with globally recognized lightweight and bionic design expertise are located in Schaffhausen (Switzerland) and Suzhou (China).
Employees
4’693CHF million 2018 2017
Order intake 1'617 1'527Sales 1'687 1'482Sales growth % 13.8 11.0Organic growth % 5.2 8.9EBITDA 160 158EBIT 86 93Return on sales (EBIT margin) % 5.1 6.3Invested capital (IC) 531 481Return on invested capital (ROIC) % 16.1 19.5Number of employees 4'693 5'738
in CHFSales per region
in CHFSales per segment
1’687million
Germany Switzerland
Austria Rest of Europe
Americas China
Rest of Asia Rest of world
1’687million
Aerospace/Energy
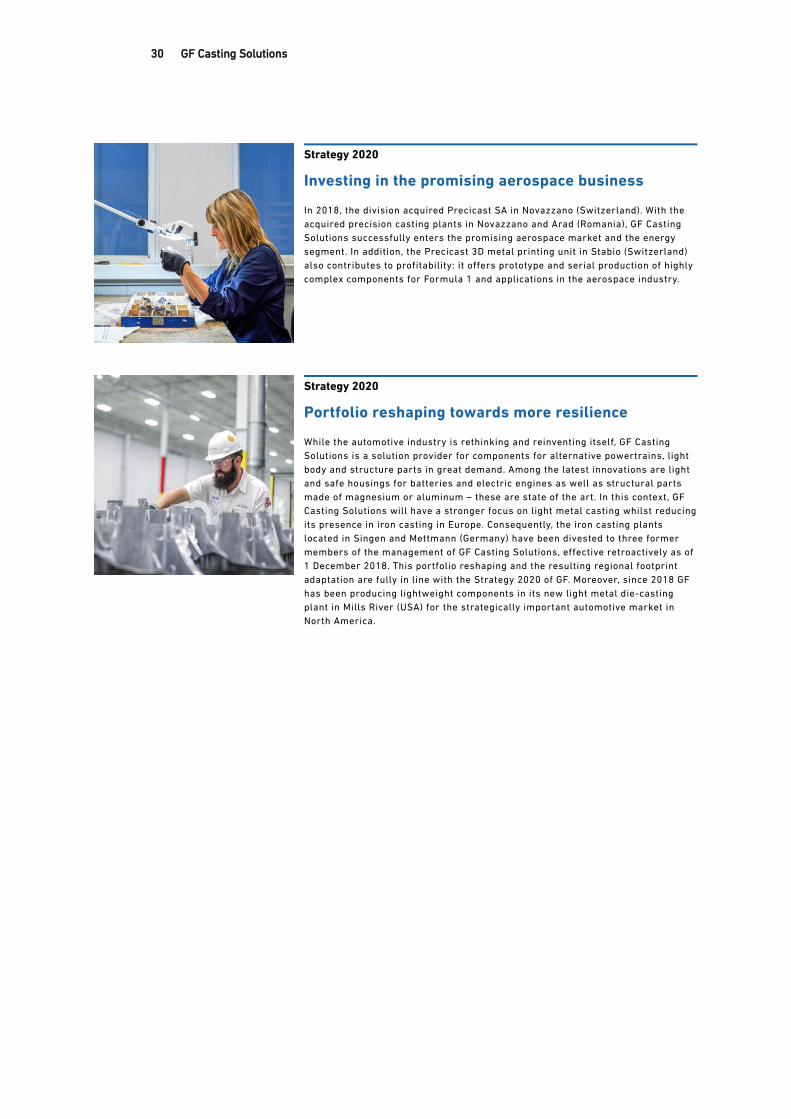
30 GF Casting Solutions
Strategy 2020
Investing in the promising aerospace business
In 2018, the division acquired Precicast SA in Novazzano (Switzerland). With the acquired precision casting plants in Novazzano and Arad (Romania), GF Casting Solutions successfully enters the promising aerospace market and the energy segment. In addition, the Precicast 3D metal printing unit in Stabio (Switzerland) also contributes to profitability: it offers prototype and serial production of highly complex components for Formula 1 and applications in the aerospace industry.
Strategy 2020
Portfolio reshaping towards more resilience
While the automotive industry is rethinking and reinventing itself, GF Casting Solutions is a solution provider for components for alternative powertrains, light body and structure parts in great demand. Among the latest innovations are light and safe housings for batteries and electric engines as well as structural parts made of magnesium or aluminum – these are state of the art. In this context, GF Casting Solutions will have a stronger focus on light metal casting whilst reducing its presence in iron casting in Europe. Consequently, the iron casting plants located in Singen and Mettmann (Germany) have been divested to three former members of the management of GF Casting Solutions, effective retroactively as of 1 December 2018. This portfolio reshaping and the resulting regional footprint adaptation are fully in line with the Strategy 2020 of GF. Moreover, since 2018 GF has been producing lightweight components in its new light metal die-casting plant in Mills River (USA) for the strategically important automotive market in North America.

31 GF Casting Solutions
“We believe in continuous growth opportunities”
DHI and GF Precicast worked together very closely to make the precision-casting airfoils development more efficient and faster.
Doosan Heavy Industries (DHI) is a leading manufacturer of power generation equipment. In 2020, this South Korean company will bring its first in-house designed gas turbine to market. GF Precicast, part of GF Casting Solutions, is DHI’s strategic partner, equipping the turbine with heat-resistant precision-casting parts.
In recent decades, global electricity consumption has risen steadily. The reason for this is unabated and ongoing economic growth, particularly in growing markets such as China, Russia and India. In order to meet the rising demand for electricity, many countries are promoting the operation of gas power plants. Doosan Heavy Industries (DHI) in Changwon (South Korea), with annual sales of more than USD 5.7 billion and more than 7’000 employees worldwide in 2017, is one of the world’s leading manufacturers of power generation equipment and systems. The company provides electricity producers in South Korea and abroad with boilers, steam turbines, generators and components for gas turbines.
GF Precicast has many years of experience in precision castingGas turbine power plants are the most commonly used alternative to coal and nuclear power generation and as backup power plants are a perfect complement to renewable energy production. DHI therefore decided – on the basis of its extensive expertise and experience in component manufacturing – to bring a powerful 270-megawatt gas turbine of its own design to the electricity generation market. “This turbine is the result of

32 GF Casting Solutions
six years of research and development work,” explains Jeon Chae Hong, Team Leader of the Hot Part Engineering Team and Principal Research Engineer at DHI. GF Precicast has been a partner of DHI since 2017 and has been involved in the development work. It is producing three different precision-casting airfoils for the new DHI turbine. “DHI selected us as their supplier because of our many years of experience in the production of high-temperature-application precision-casting parts for the gas turbine industry,” explains Daniel Crot, Head of Sales & Marketing at GF Precicast in Novazzano (Switzerland). “Besides DHI we currently supply more than 15 other customers in the gas turbine industry,” according to Crot. These include market leaders such as Siemens, GE Power and Ansaldo Energia.
Jeon Chae Hong is persuaded of the value of the collaborative arrangement: “GF Precicast has very modern, high-tech manufacturing processes. And they have a good reputation in the gas turbine industry. This is why GF Precicast is the right strategic partner for us.”
Since November 2018 GF Precicast has been equipping the new DHI gas turbine with three high-temperature-application turbine airfoils. “In the current market, we estimate that we will sell up to ten gas turbines a year,” says Jeon Chae Hong. “Initially we are focusing on the US and Saudi Arabia markets, currently the two most important markets for industrial gas turbines.” For GF Precicast, ten gas turbines a year means supplying more than 2’000 additional parts per year.
Growth of electricity consumption is pushing up demand for gas turbinesRising electricity consumption combined with sustainability challenges and the available natural gas reserves are making gas power plants very relevant for electricity production. “We believe in continuous growth opportunities in the industrial gas turbine business for GF Precicast as the energy produced from gas is still among the most competitive energies,” says Crot. GF Precicast seeks to utilize this potential, he says. “We want to maintain a broad customer base around the world and we want to do all we can to make our customers successful.” From this perspective, DHI and GF Precicast make perfect partners. That can already be seen in the work they have done together so far.
“DHI initially set tight delivery schedules,” recalls Daniel Crot. “Accordingly, DHI’s and our project management team worked together very closely on a solution to make development of the precision-casting airfoils more efficient and faster,” explains Crot. He places great value on DHI’s willingness to collaborate and is proud of their good working relationship as partners. Jeon Chae Hong readily repays the compliment: “Professionalism, proactive management and state-of-the-art precision-casting processes make it easy to deal with challenges that arise.” That applies both to DHI’s new 270-megawatt gas turbine and to even more powerful future developments.
Jeon Chae HongPrincipal Research Engineer at DHI
“GF Precicast has very modern, high-tech manufacturing processes. And a good reputation.”

33 GF Casting Solutions
This is how an industrial gas turbine produces electricityA gas turbine for electricity production consists of a compressor that compresses air that is sucked in. In the combustion chamber, the compressed air is ignited with gas. The air-gas mixture quickly expands under high pressure and transfers its energy via turbine blades to a drive shaft. The shaft is connected to a generator, which produces electricity. Industrial gas turbines work like gas turbines in aircraft, which produce the thrust. More about industrial gas turbines can be found at the GF Precicast website.
About GF PrecicastIn line with its Strategy 2020, GF Casting Solutions is expanding into higher-value businesses and offering even more global solutions. For that reason, at the beginning of 2018 GF Casting Solutions acquired Precicast Industrial Holding SA. GF Precicast produces precision-casting parts as well as additive manufacturing components for customers in the energy and aerospace industries. A share of 75% of its precision-casting parts go to the European market, while 10% are destined for the US market. Asia accounts for a 15% share. Through its strategic partnership with DHI, GF Precicast is significantly increasing the latter share. GF Precicast has more than 800 employees in Switzerland and Romania.

34 GF Casting Solutions
Jeon Chae Hong (center) visits GF Precicast in Novazzano (Switzerland).
Daniel Crot (center) and his project management team in Novazzano.
Employee Mauro Albizzati from the Heat Treatment Department machines some cast components.
Giuseppe Ballarino works in the Finishing Department at GF Precicast, where the cast components are deburred and polished.
Daniel Crot, Head of Sales & Marketing at GF Precicast, shows a precision-casting airfoil.
Jeon Chae Hong next to a model of an industrial gas turbine. In 2020 DHI will bring its first in-house designed, 270-megawatt gas turbine to the market.

35 GF Casting Solutions
GF Precicast produces cored and solid buckets and nozzles for industrial gas turbines. These are located in the hot part of the turbine, for example a first stage bucket
… or a second stage bucket
… or a second stage nozzle … or a 3rd stage nozzle.

36 GF Casting Solutions
“With GF Precicast, we can rely on our requirements being met”
Jeon Chae Hong is team leader of the Hot Part Engineering Team and Principal Research Engineer at Doosan Heavy Industries and Construction in Changwon (South Korea). He has worked for the company for eleven years in various positions. In the production of the 270-megawatt gas turbine, he and his engineering team, led by DHI´s Senior Research Engineer Jeongsung Lee, are working closely with the engineering team comprised of Wendel Niles, Michele Imbriale and Adam Mierzejewski from GF Precicast.
The major challenging point in this development is keeping to the timeline. To ensure this DHI tries to squeeze the development period, especially the casting.
Mr. Chae Hong, what is the challenge in building a gas turbine?
The production of precision-casting airfoils with internal cooling passages that have to withstand extremely high operating temperatures is very challenging. In addition, the solution has to be suitably competitive on price and offer rapid availability of the precision-casting parts. With GF Precicast, we can rely on our requirements being met.
How does GF Precicast support you?
Within a very short period we developed a good relationship. GF Precicast’s ability to meet all our demands is impressive. In our sector we value solution-driven work – at the end of the day, it is about high-quality products. Close collaboration often gives rise to long-standing partnerships with suppliers. We look forward to our shared journey with GF Precicast.
What do you appreciate about working with GF Precicast?

37 GF Machining Solutions
Key figures
GF Machining Solutions at a glance
GF Machining Solutions is one of the world’s leading providers of complete solutions to the tool and mold making industry and to manufacturers of precision components. The portfolio includes milling, wire-cutting and die-sinking EDM machines. Moreover, the division offers spindles, laser texturing, additive manufacturing, tooling and automation as well as digitalization solutions and customer services. The key customer segments are the aerospace, ICT, medical and automotive industries.
Global presenceGF Machining Solutions is present in more than 50 countries with its own sales companies. In addition, the division operates production facilities and research and development centers in Switzerland, the USA, Sweden and China.
Employees
3’394CHF million 2018 2017
Order intake 1'042 1'030Sales 1'066 992Sales growth % 7.5 8.3Organic growth % 5.4 7.4EBITDA 102 96EBIT 88 82Return on sales (EBIT margin) % 8.3 8.3Invested capital (IC) 262 269Return on invested capital (ROIC) % 27.5 24.1Number of employees 3'394 3'255
in CHFSales per region
in CHFSales per segment
1’066million
Germany Switzerland
Austria Rest of Europe
Americas China
Rest of Asia Rest of world
1’066million
Milling
Customer service

38 GF Machining Solutions
Strategy 2020
New strategic partnership in additive manufacturing
In August 2018, GF Machining Solutions announced a strategic partnership with 3D Systems, Rock Hill (USA), a leader in additive manufacturing. The goal is to develop integrated manufacturing solutions based on additive manufacturing technology. The partnership combines 3D Systems’ expertise in metal additive manufacturing and GF Machining Solutions’ conventional metal machining knowledge. The first machine that was developed together – the DMP Factory 500 – was presented in September 2018 on the occasion of the International Manufacturing Technology Show (IMTS) in Chicago (USA).
Strategy 2020
Creating a modern innovation center
GF Machining Solutions is building a new innovation and production facility in Biel (Switzerland). The milling and laser operations in Switzerland will be concentrated in one state-of-the-art production plant. The three current locations in Nidau, Ipsach and Luterbach will be brought together under the roof of the new building, with approx. 450 workplaces. This lays the ideal foundations for future growth through synergies and streamlined processes. In building a modern R&D center on site, GF Machining Solutions is also preparing for the future. The relocation of the current sites will take place until mid-year 2019 and the official opening is planned in September 2019. The new building was planned with a strong focus on sustainability – it will boast fiberglass insulation exclusively and the waste heat given off by the machines will in turn be used to heat the building.

39 GF Machining Solutions
Clean laser technology to replace chemical etching
The engraving and texturing company Custom Etch in New Castle (USA) operates six GF laser machines.
Custom Etch is the largest laser texturing service provider in North America. The US company processes more than 4’000 molds every year. For eight years, Custom Etch has relied on the time-saving and environmentally-friendly lasers provided by GF Machining Solutions and purchased their seventh GF machine arriving in June 2019.
This is an impressive transformation, as in 2011 the employees at Custom Etch were still wearing protective clothing and face masks when using chemical etching to treat molds. Today, the majority of the work processes carried out in New Castle (USA) are handled by state-of-the-art lasers from GF Machining Solutions.
“Thanks to the consistently good order situation, we now have six GF machines running in our plant,” says Donald Melonio, Vice President of Custom Etch. The company processes up to 4’200 individual molds every year. In June 2019, GF will supply an additional LASER P 4000 U machine to Custom Etch, making it the third of its kind to be used in New Castle. Custom Etch intends to use the machine primarily for processing large molds for the automotive sector. The new laser machine enables Custom Etch to deal with the numerous texturing orders more quickly. What’s more, the company is seeing a further increase in demand: “Our customers have already committed to projects in 2019,” reveals Melonio. In addition to manufacturers of PET bottles, car lighting elements and fiberglass doors, the company has also recently expanded its client base to include American companies from the aerospace and transport sectors.

40 GF Machining Solutions
Much faster and more accuratelyJean-Paul Nicolet from Laser Business Development and Market Support at GF Machining Solutions in Geneva has looked after Custom Etch since the beginning of the partnership. “Laser technology is completely changing the way engraving and texturing companies work,” Nicolet points out. “Today, production processes – from product design to the finished mold – are fully digitalized and automated. Meanwhile, virtually everything that product designers want can be realized.” In addition, the GF Machining Solutions laser machines process the molds much faster and more accurately than would be possible manually. Donald Melonio confirms that his clients get the finished molds back in half the time that was required before. “The labor costs previously involved in masking, applying patterns and acid etching molds have been significantly reduced.” He adds that the new machines have enabled him to recruit more staff, such as programmers. What makes him particularly happy is the reduction of chemical substances. “Since the introduction of the laser technology, we used 35% less chemical substances last year. We expect to reduce this figure by a further 10% in 2019,” says Melonio. With its six machines, Custom Etch is among GF Machining Solutions’ top five customers in the field of laser texturing. “We carry out 60% of our orders using laser machines. This figure will rise further,” reveals Donald Melonio.
Donald MelonioVice President of Custom Etch
“As we increase our laser processing, acid processing will decrease directly.”
Interest in environmentally friendly technologiesJean-Paul Nicolet also works with other clients in the field of laser texturing. Despite the high investment costs of up to several hundred thousand Swiss francs for each laser machine, he sees a worldwide shift to the modern, more efficient and more environmentally friendly technology. The mold processing company Tian Zhi Zun in Suzhou (China), for example, currently uses four LASER P 4000 U machines and has switched all its production for clients from the automotive, electronics and consumer goods industries from chemical etching to laser technology. “In China, there are sometimes high taxes and levies imposed on procedures involving chemical substances. As a result, there is a great deal of pressure and motivation for change,” says Nicolet. He has also noticed that many companies are interested in environmentally friendly manufacturing techniques such as laser technology of their own accord. “Especially for production facilities, the topic of sustainability is becoming more and more important.”
It’s just the beginningCustom Etch discovered laser texturing at the start of 2010, when the company faced a challenge in applying a geometric style texture to PET bottles for Pepsi brands. “This was a very challenging project. We could have achieved the desired result manually by etching, but labor cost and time would have been prohibitive,” Donald Melonio remembers. “Our search led us to the GF Machining Solutions laser technology portfolio, and we purchased our first machine to fulfill the Pepsi order.” Nine years later, Custom Etch hopes to continue moving forward – in terms of both order volumes and the technology used in the plant. “We feel that the texturing industry is just beginning its evolution from previously manual to mainly digital processes. There’s a great deal of potential in doing this,” says Donald Melonio. It is for this reason that he relies on the support of GF Machining Solutions. “We expect to see the continued commitment to improvements from GF that we have experienced in the last eight years.”

41 GF Machining Solutions
This is how chemical etching and laser texturing workChemical etching uses chemicals to dissolve unprotected parts of a metal mold to produce a predefined structure or engraving. Precise manual work is required in the multi-stage process. After cleaning the mold, synthetic resin or a protective lacquer is applied as acid protection. This protection is then removed using needles, styli or scalpels on the areas to be etched. Wax print or multi-layer films are applied to these places to transfer the pattern. The desired engraving is created in the subsequent acid bath, where the material surface is removed from the unprotected areas. After the bath, the piece is intensively cleaned, rinsed off and polished.
In contrast, fully digital 3D laser engraving offers a greater freedom of design, greater safety and a higher quality. The technology allows almost unlimited design options on individual surfaces, such as molds for automotive parts, ICT, packaging, tool and mold making, or shoes and sports items. A five-axis laser applies the pattern directly to the mold surface, which means there is no need to use or dispose of chemical substances.
GF Machining Solutions LASER P 4000 U machine demonstration
https://www.youtube.com/embed/-srPONeoPVU

42 GF Machining Solutions
Jean-Paul Nicolet from Laser Business Development and Market Support at GF Machining Solutions in Geneva (Switzerland).
Laser technology is completely changing the way engraving and texturing companies work.
Today, production processes are fully digitalized and automated. The fully digital 3D laser engraving allows almost unlimited design options on individual surfaces, such as on molds for automotive parts.
Custom Etch processes up to 4’200 individual molds every year. Donald Melonio is Vice President of Custom Etch. He greatly values his relationship with the GF teams in Geneva and Chicago.

43 GF Machining Solutions
“The GF team truly understands our needs”
Donald Melonio is Vice President of Custom Etch. The company is based in New Castle, Pennsyilvania (USA), and processes up to 4’200 individual molds every year.
The greatest challenge has always been to provide the highest level of quality and still be able to meet the price and timing expected by the customers. Custom Etch recognized long ago that the quality of the laser was far superior to the manual process. To that end, we have committed to this technology knowing that when we had enough capacity, we could provide our services at a price and turnaround superior to current industry levels.
Mr. Melonio, what is the challenge in texturing a mold?
The team at GF truly understands the needs of the texture company. Their laser system is the only one we have found that addresses the size and speed requirements of our industry.
How does GF Machining Solutions support you?
I value greatly my relationship with the GF teams in Geneva and Chicago. GF has made it possible for my staff to truly understand the technology and significantly grow our business. They have provided valuable insight and solutions to problems as they have arisen over the last eight years. The GF team has spent countless hours assisting Custom Etch to become the largest North American supplier of laser texturing.
What do you appreciate about working with GF Machining Solutions?

44 Corporate Governance
Corporate Governance
Introduction by the Chairman of the Board of Directors
Dear shareholders,The Board of Directors and the Executive Committee of GF attach great importance to good Corporate Governance in the interest of shareholders, customers, business partners, and employees. In the year under review, we have made major efforts with Corporation’s compensation policy, held many discussions and deepened our understanding of our shareholders’ expectations. You can view the consequences of this in the Compensation Report and in the comments below.
Trust-based collaboration between Board of Directors, CEO and Executive CommitteeGF has a strong, broadly supported, competent and independent Board of Directors. Another key success factor is the transparent and trust-based collaboration between the Board of Directors, CEO and Executive Committee. This is nurtured and put into practice in exemplary fashion at GF. This includes, above all, mutual respect as well as regular and open information of the Board of Directors by the Executive Committee. Joint visits to companies and markets, which provide time for in-depth encounters, are also very valuable.
Change of CEO and change in the Board of DirectorsOne of the most important tasks for any Board of Directors is succession planning. Our CEO Yves Serra has reached retirement age. The Board of Directors therefore began succession planning early with the additional support of a specialist consulting company. With the appointment of the present CFO Andreas Müller, as the new CEO, we were able to find an excellent internal solution that guarantees continuity. Andreas Müller will become new CEO after the Annual Shareholders’ Meeting on 17 April 2019.
There is also a change in the Board of Directors. We are proposing to appoint Yves Serra to replace Gerold Bührer, who is stepping down from the Board of Directors due to achieving the age limit of 70 years. His in-depth knowledge of all aspects of GF, his many years’ experience in Asia and strategic thinking will help the Board of Directors continue to overcome future challenges.
Two members have been on the Board for more than twelve years, namely Roman Boutellier (since 1999) and Zhiqiang Zhang (since 2005). As the former long-term Vice Chairman of the ETH Zurich, former Professor of Innovation and Technology Management at the ETH Zurich and former CEO of listed companies, Roman Boutellier has an excellent combination of technology and innovation expertise and operating management experience. Zhiqiang Zhang is a Chinese citizen and has held key positions in leading European corporations in China for many years. As GF generates around 20% of the Corporation’s revenue in China, his expertise in China and in-depth knowledge of European culture and its economy are extremely valuable. Therefore, the Board of Directors is proposing both for re-election.
At the end of 2018, one third of the Board of Directors had been on the Board for less than five years, another third between five and ten years, with the remainer more than ten years. This means that we have a balanced ratio of continuity and experience, and benefit from the widely spread experience and in-depth knowledge of all members of the Board.
Strategy 2020 well on trackIn the year under review, GF made further progress in implementing Strategy 2020. This included expanding our presence in growth markets and stepping up involvement in markets for higher value businesses. With the divestment of two of the largest iron foundries in Germany, the start of precision casting and building up further production capacity for light metal parts in the USA, Romania and China, GF Casting Solutions (previously GF Automotive) in particular has fundamentally changed its portfolio.

45 Corporate Governance
Engagement with shareholdersGF sets great store on positive and trust-based collaboration with you, our shareholders. We were unhappy that the Compensation Report was only approved by a relatively narrow majority at the Annual Shareholders’ Meeting 2018. We held many discussions with shareholders and proxy advisors in the year under review. As a result, we have revised and newly adopted the long-term incentive plan (LTI) in the compensation system for the Executive Committee for 2019. We invite you to remain active and to let us know your views.
2018 was a significant and successful year, but there is still a great deal to do. The changing operating conditions also require a high level of commitment and flexibility from everyone. We are very confident that we will continue to make further progress with your support.
Andreas KoopmannChairman of the Board of Directors
46 Corporate Governance
Content of the report
The present publication fulfills all obligations of the SIX Exchange Regulation directive on information relating to Corporate Governance and is based on the Swiss Code of Best Practice for Corporate Governance of economiesuisse, the Swiss Business Federation. The Compensation Report is presented in a separate chapter. All data and information apply to the reporting date of 31 December 2018, unless otherwise noted. Any changes occurring before the editorial deadline on 21 February 2019 are listed at the end of this chapter. Any changes occurring after the editorial deadline can be found on our website.
This report provides information on structures and processes, areas of responsibility and decision-making procedures, control mechanisms, as well as the rights and obligations of the various stakeholders. GF also publishes the Articles of Association of Georg Fischer Ltd, the internal Organization and Business Rules, the Code of Conduct, and more information online at:www.georgfischer.com/content/gf/com/en/investoren/annual-report.html

47 Corporate Governance
Governance bodies
Board of DirectorsBased on the Swiss Code of Best Practice for Corporate Governance from economiesuisse all members of the Board of Directors are independent and non-executive. Moreover, the Chairman of the Board of Directors does not simultaneously act as the CEO. The Board of Directors assigns the preparation of businesses to the following three committees:
– Audit Committee– Compensation Committee– Nomination Committee
The Board of Directors comprises nine members. The three committees each consist of three members, with every member belonging to one committee. The members of the Board of Directors have different nationalities, professional experience and skills. More information on the members of the Board of Directors’ backgrounds can be found in chapter Members of the Board of Directors.
Management structureThe Board of Directors appoints the persons entrusted with the management. The CEO, supported by the other members of the Executive Committee, bears responsibility for the management of the Corporation, where this is not delegated to the divisions or the Corporate Staff Units. The Heads of the Divisions, supported by the Heads of the Business Units and Service Centers, bear responsibility for the management of the divisions. The Corporate Staff Units support the Board of Directors and the Executive Committee in their management and supervisory functions.
Compensation, shareholdings and loansInformation regarding the compensation paid to and shareholdings of the members of the Board of Directors and Executive Committee, as well as loans granted to those individuals can be found in the Compensation Report and in the note 6 Compensation and shareholdings of the financial statements of Georg Fischer Ltd.

48 Corporate Governance
Corporate structure and affiliated companiesThe parent company of all Corporate Companies is Georg Fischer Ltd. It is incorporated under Swiss law and domiciled in Schaffhausen (Switzerland). Georg Fischer Ltd is listed on the SIX Swiss Exchange (FI-N; security number 175230). Its share capital is CHF 4’100’898, and its market capitalization was CHF 3’225 million as of 31 December 2018 (previous year: CHF 5’282 million).
The Corporation has the operational divisions: GF Piping Systems, GF Casting Solutions and GF Machining Solutions, plus the Corporate Staff Units Finance & Controlling and Corporate Development. The GF organization structure is displayed in the chapter Organization of GF in the Business Report.
An overview of all Affiliated Companies in the scope of consolidation can be found in the notes to the consolidated financial statements in note 4.2 Affiliated companies. The list contains the company name, domicile, share capital and percentage held by GF.

49 Corporate Governance
GF share and shareholders
Share
Capital and share informationFully paid-in share capital amounts to CHF 4’100’898 and is divided into 4’100’898 registered shares each with a par value of CHF 1. Each registered share has one vote at the Annual Shareholders’ Meeting. The authorized capital and the conditional capital amount to a maximum of 600’000 shares in total. The maximum authorized or conditional capital is reduced by the amount that authorized or conditional capital is created by the issue of bonds or similar debt instruments or new shares.
By no later than 17 April 2020, the maximum authorized share capital will be CHF 600’000 divided into no more than 600’000 registered shares, each with a par value of CHF 1. Moreover, the share capital may be increased via the conditional capital by a maximum of CHF 600’000 by the issue of no more than 600’000 fully paid-in registered shares, each with a nominal value of CHF 1, through the exercise of conversion rights and/or warrants granted in connection with the issuance on capital markets of bonds or similar debt instruments of the company or one of its Corporate Companies. As of 31 December 2018, no such bonds or similar debt instruments were outstanding. The beneficiaries and the conditions and modalities of the issue of authorized capital are described in § 4.4a) of the Articles of Association of Georg Fischer Ltd and those of conditional capital in § 4.4b) of the Articles of Association of Georg Fischer Ltd.www.georgfischer.com/content/gf/com/en/investoren/annual-report.html
The subscription to and acquisition of the new shares, and any subsequent transfer of the shares, are subject to the statutory restrictions on transferability.
No participation or profit-sharing certificates exist.
Restrictions on transferabilityEntry in the company’s share register as a shareholder or beneficiary with voting rights is subject to the approval of the Board of Directors. Approval of registration is subject to the following conditions: a natural person or legal entity may not accumulate, either directly or indirectly, more than 5% of the registered share capital. Persons who are bound by capital or voting rights, by consolidated management or in a similar manner, or who have come to an agreement for the purpose of circumventing this rule, shall be deemed as one person.
Nominee registrationsPersons who hold shares for third parties (referred to as “nominees”) are only entered in the share register with voting rights if the nominee declares their willingness to disclose the names, addresses, and shareholdings of those persons on whose behalf they hold the shares. The same registration limitations apply, mutatis mutandis, to nominees as to individual shareholders.
Cancellation or amendment of restrictionsCancellation or easing of the restrictions on the transferability of registered shares requires a resolution of the Annual Shareholders’ Meeting passed by at least two-thirds of the shares represented and an absolute majority of the par value of the shares represented.
Convertible bonds and optionsThere are no outstanding convertible bonds, and GF has issued no options.

50 Corporate Governance
Share information
1 In the years 2015 to 2018 as a dividend out of retained earnings. In 2014, as a dividend out of retained earnings and reserves from capital contributions.
2018 2017 2016 2015 2014
Share capital
Number of shares as of 31 December Registered shares 4'100'898 4'100'898 4'100'898 4'100'898 4'100'898Thereof entitled to dividend 4'100'898 4'100'898 4'100'898 4'100'898 4'100'898
Number of registered shareholders 15'521 12'562 12'651 14'005 13'446
Share prices in CHF Registered share Highest (intraday) 1'420 1'317 901 739 738Lowest (intraday) 730 811 601 524 495Closing as of 31 December 787 1'288 834 679 629
Earnings in CHF Per registered share 69 62 53 46 45
Price-earnings ratio 11 21 16 15 14
Market capitalization as of 31 December CHF million 3'225 5'282 3'420 2'785 2'579As % of sales 71 127 91 76 68As % of equity attributable to shareholders of Georg Fischer Ltd 233 401 296 258 244
Cash flow from operating activities in CHF Per registered share 97 100 98 80 61
Equity attributable to shareholders of Georg Fischer Ltd in CHF Per registered share 337 322 283 264 259
Dividend paid (proposed) in CHF million 1 103 94 82 74 70
Dividend paid (proposed) in CHF
Per registered share 1 25 23 20 18 17
Pay-out ratio in % 36 37 38 39 38
Ticker symbols
– Telekurs, Dow Jones (DJT): FI-N– Bloomberg: FI/N SW– Reuters: FIN.S – Security number: 175230– ISIN: CH0001752309

51 Corporate Governance
Share price 2014–2018
Market capitalization and earnings per shareOn 31 December 2018 the market capitalization stood at CHF 3’225 million and earnings per share at CHF 69 (previous year: CHF 62).
Proposed dividend paymentAt the Annual Shareholders’ Meeting, the Board of Directors will propose the payment out of retained earnings of a dividend in the amount of CHF 25 per registered share.
Shareholders
Significant shareholders and shareholder groupsAs of 31 December 2018, two shareholders had shareholdings between 3% and 5%. The BlackRock Group, held directly or indirectly by BlackRock, Inc., New York (USA), had shareholdings of 4.92% and Impax Asset Management Limited, London (Great Britain), had shareholdings of 3.02%.
In the year under review, 58 disclosure notifications were filed. 26 of the filings related to Norges Bank (the Central Bank of Norway), Oslo (Norway), 24 to the BlackRock Group, held directly or indirectly by BlackRock Inc., New York (USA), 4 to JPMorgan Chase & Co., New York (USA), 3 to UBS Fund Management (Switzerland) AG, Basel (Switzerland) and 1 to Impax Asset Management Limited, London (Great Britain).
Disclosure notifications pertaining to shareholdings in Georg Fischer Ltd that were filed with Georg Fischer Ltd and the SIX Swiss Exchange are published on the latter’s electronic publication platform and can be accessed via the following link:www.six-exchange-regulation.com/en/home/publications/significant-shareholders.html
Cross-shareholdingsThere are no cross-shareholdings or shareholder pooling agreements with other companies.

52 Corporate Governance
Shareholdings of members of the Board of Directors, the Executive Committee, and the Senior ManagementA total of 43’504 Georg Fischer shares were held by members of the Board of Directors, the Executive Committee, and the Senior Management as of 31 December 2018 (previous year: 41’717 Georg Fischer shares):
Number ofGeorg Fischer
registered shares
as of 31 Dec. 2018
Number ofGeorg Fischer
registered sharesas of 31 Dec. 2017
Members of the Board of Directors 15'752 14'252Members of the Executive Committee 8'758 8'765Members of the Senior Management 18'994 18'700Total 43'504 41'717
In % of issued shares 1.06% 1.02%
The shares of the share-based compensation program are either treasury shares or repurchased on the market.
Number of registered shareholders as of 31 December 2018
Number of shares
Number of registered
shareholders Shares in %
1–100 13'614 9.3%101–1'000 1'700 11.1%1'001–10'000 189 9.0%10'001–100'000 16 15.5%> 100'000 2 9.4%Total registered shareholder / shares 15'521 54.3%Unregistered shares 45.7%Total 100.0%
Registered shareholders per type as of 31 December 2018
Shareholders in % Shares in %
Individual shareholders 93.6% 38.4%Legal entities 6.4% 61.6%Total 100.0% 100.0%
Registered shareholders per country as of 31 December 2018
Shareholders in % Shares %
Germany 6.5% 3.2%Great Britain 0.4% 15.9%Switzerland 89.0% 68.5%USA 0.4% 6.7%Other countries 3.7% 5.7%Total 100.0% 100.0%
Shareholders’ rightsAs of 31 December 2018, Georg Fischer Ltd had 15’468 shareholders with voting rights (previous year: 12’514), most of whom reside in Switzerland. To maintain this broad base, the Articles of Association of Georg Fischer Ltd provide for the statutory restrictions summarized hereinafter.

53 Corporate Governance
Restriction on voting rightsThe total number of votes exercised by one person for their own shares and shares for which they vote by proxy may not exceed 5% of the votes of the company’s total share capital. Persons bound by capital or voting rights, by consolidated management, or otherwise acting in concert for the purpose of circumventing this provision are deemed to be one person.
The restriction of voting rights under § 4.10 of the Articles of Association of Georg Fischer Ltd may be revoked only by a resolution of the Annual Shareholders’ Meeting, passed by a two-thirds majority of the shares represented and an absolute majority of the par value of the shares represented.
Proxy votingA shareholder may, on the basis of a written power of attorney, be represented at the Annual Shareholders’ Meeting by another shareholder entitled to vote or the independent proxy. Shareholders can also confer powers of attorney and issue instructions to independent proxies electronically. Partnerships may be represented by a partner or authorized signatory, legal entities by a person authorized by law or the Articles of Association of Georg Fischer Ltd, married persons by their spouse, wards by their legal guardians, and minors by their legal representative, regardless of whether such representatives are shareholders or not.
Statutory quorumFor specific legal and statutory reasons (§ 12.2 of the Articles of Association of Georg Fischer Ltd), the following resolutions of the Annual Shareholders’ Meeting require a majority greater than the simple majority as laid down by law for votes. At least two-thirds of the shares represented and an absolute majority of the par value of the shares represented must be in favor of:
– the cases listed in Art. 704 para. 1 CO– the alleviation or withdrawal of limitations upon the transfer of registered shares– the creation, extension, alleviation, or withdrawal of the voting restrictions– the conversion of registered shares into bearer shares– the amendments to § 16.1 of the Articles of Association of Georg Fischer Ltd– the removal of restrictions concerning the passing of resolutions by the Shareholders’ Meeting,
particularly those of § 12 of the Articles of Association of Georg Fischer Ltd
Convocation of the Annual Shareholders’ MeetingNo regulations exist which deviate from those stipulated by law.
AgendaShareholders representing a minimum of 0.3% of the share capital may request that an item be added to the agenda. The application must be submitted in writing no later than 60 days before the Annual Shareholders’ Meeting and must specify the item to be discussed and the shareholder’s proposal.
Entry in the share registerThe deadline for entering shareholders in the share register with regard to attendance at the Annual Shareholders’ Meeting is around ten days before the date of the Annual Shareholders’ Meeting. The deadline is mentioned in the invitation to the Annual Shareholders’ Meeting.
Change of controlThe Articles of Association of Georg Fischer Ltd do not contain any regulations governing “opting-out” or “opting-up”. As of 1 January 2014, the contractually agreed period of notice for the members of the Executive Committee is basically twelve months. Furthermore, a change of control will result in the cancellation of all existing disposal limitations for shares allocated according to the share plan. In the event of a change of control, bondholders and banks have the right to demand the immediate repayment of bonds and loans before they are due.

54 Corporate Governance
Board of Directors
As of 31 December 2018
ResponsibilitiesThe Board of Directors has ultimate responsibility for supervising and monitoring the management of Georg Fischer Ltd. The Board of Directors is responsible for all matters vested to it by the law or the Articles of Association of Georg Fischer Ltd, provided it has not delegated these to other bodies. These are in particular:
– decisions on corporate strategy and the organizational structure– appointing and dismissing members of the Executive Committee– organizing finance and accounting– determining the annual and investment budgets
Unless otherwise provided for by law or the Articles of Association of Georg Fischer Ltd, the Board of Directors delegates operational management to the Chief Executive Officer, who is assisted in this task by the Executive Committee. The extent to which competencies are delegated by the Board of Directors to the Executive Committee and the nature of the cooperation between the Board and the Executive Committee are defined by the Organization and Business Rules. www.georgfischer.com/content/gf/com/en/investoren/annual-report.html
Elections and term of officeAs per § 16.2 of the Articles of Association of Georg Fischer Ltd, the members of the Board of Directors have to be elected individually, and their term of office ends at the next Annual Shareholders’ Meeting. Re-election is possible.
The average term of office of members of the Board of Directors is ten years. Two-thirds of members of the Board of Directors have a term of office of less than ten years. Members of the Board must resign their mandate at the Annual Shareholders’ Meeting following their 70th birthday.
2018At the 122nd Annual Shareholders’ Meeting on 18 April 2018, all nine members of the Board of Directors were re-elected.
Internal organizational structurePursuant to § 16.3 of the Articles of Association of Georg Fischer Ltd, the Annual Shareholders’ Meeting elects a member of the Board of Directors as its Chairman for the period of one year until the next ordinary Annual Shareholders’ Meeting. Re-election is possible.

55 Corporate Governance
With the exception of the election of a Chairman of the Board of Directors, who is elected by the Annual Shareholders’ Meeting, the Board of Directors constitutes itself by electing a Vice Chairman from within its ranks once a year. Alongside the election of Andreas Koopmann as Chairman of the Board of Directors, Gerold Bührer was elected by the Board of Directors as its Vice Chairman on the day of the Annual Shareholders’ Meeting on 18 April 2018.
In addition, pursuant to § 20.1 of the Articles of Association of Georg Fischer Ltd, the Annual Shareholders’ Meeting elects the members of the Compensation Committee.
Diversity and independenceThe Board of Directors comprises nine members. Each member normally belongs to one of the three standing committees. When members are elected, the focus is not only on experience in executive and management functions, industry and technology markets, innovation, finance and accounting, risk management and law, but also on specific international relationships and regional market knowledge. The Board of Directors also aims to achieve a proper balance of competence and knowledge, taking into account the main operational focus of the Corporation, its international orientation, and the accounting requirements of listed companies. The Board of Directors broadly covers the required competence and knowledge. Expert knowledge in innovation and digitalization is being gradually expanded. After the retirement of Gerold Bührer from the Board of Directors, the expertise in finance and accounting will also be built up again.
Expertise/Experience
Nationality
100%
Legal
100%
Swiss German Brazilian
Chinese
Tenure
100%
<5 years 5 to 10 years >10 years

56 Corporate Governance
Based on the Swiss Code of Best Practice for Corporate Governance from economiesuisse all members of the Board of Directors are independent and non-executive. There are no significant business relationships between members of the Board or the companies or organizations they represent and Georg Fischer Ltd or a Corporate Company.
MandatePursuant to § 21 of the Articles of Association of Georg Fischer Ltd, a member of the Board of Directors may at one and the same time hold no more than four additional mandates as a member of the supreme managerial or governing body of listed legal entities and no more than ten additional mandates as a member of the supreme managerial or governing body of unlisted legal entities.
In addition, a member of the Board of Directors may not hold more than ten mandates that he or she exercises by order of the company, in legal entities belonging to the member’s own family, in a professional or industry association or in a charitable institution.
Mandates of associated companies or institutions, which are exercised in the function as a member of the supreme managerial or governing body of a legal entity, together count as one mandate.
Succession planningFor new nominations, a requirement profile is drawn up based on a competence matrix, and suitable candidates are sought and contacted with the help of an external executive recruiter. The Nomination Committee is responsible for preparing and drawing up the requirement profile as well as for pre-selection. Candidates also meet the Chairman and other members of the Board of Directors personally before any nominations are proposed.
All members of the Board of Directors are independent and non-executive. However, three members have been on the Board of Directors for more than twelve years. Gerold Bührer (member of the Board of Directors since 2001) will step down from the Board at the Annual Shareholders’ Meeting 2019. Meanwhile, Roman Boutellier and Zhiqiang Zhang (members since 1999 and 2005 respectively) will be proposed for re-election at the Annual Shareholders’ Meeting 2019. As the former long-term Vice Chairman of the ETH Zurich, former Professor of Innovation and Technology Management at the ETH Zurich and former CEO of listed companies, Roman Boutellier has an excellent combination of technology and innovation expertise and operating management experience. Zhiqiang Zhang is a Chinese citizen and has held key positions in leading European corporations in China for many years. As GF generates around 20% of the Corporation’s revenue in China, his expertise in China and in-depth knowledge of European culture and its economy are extremely valuable. Therefore, the Board of Directors is proposing their re-election.
Areas of responsibilityThe members of the three standing Board Committees are listed at the beginning of this chapter and in the separate section Members of the Board of Directors. The Board Committees provide preliminary advice to the Board of Directors and do not make any definitive decisions. They discuss the issues assigned to them and make proposals to the Board of Directors as a whole. The CEO attends the meetings of the Board Committees, but is not entitled to vote. Minutes of the committee meetings are sent to all members of the Board of Directors. The Chairmen of the individual committees also make a verbal report at the next meeting of the Board of Directors and submit any proposals.
Working methods of the Board of DirectorsDecisions are made by the Board of Directors as a body. Members of the Executive Committee also participate in Board meetings for agenda items relating to the company’s business, but are not entitled to vote. Only the Chief Executive Officer is present when personnel topics are dealt with. Personnel topics affecting him directly are treated in his absence. Invitations to Board meetings list all the items that the Board of Directors, a Board Committee, or the CEO wish to discuss. All participants in a Board meeting receive detailed written material on the proposals in advance.
The Board of Directors meets at least four times a year under the leadership of its Chairman. During the year under review, it met six times: five meetings lasted less than a day. One meeting, including the annual strategy meeting in 2018 that was dedicated to reviewing Strategy 2020, lasted two days. The dates of the regular meetings are generally set two years in advance to enable all members to attend personally. In the

57 Corporate Governance
year under review, the attendance rate was 100%. The three standing Board Committees met a total of 20 times.
External consultants are called on for their services when specific topics are involved. Further information is provided in the section on the Board Committees.
EvaluationThe Board of Directors carried out a self-assessment in 2018, the results of which were circulated and noted. The Board of Directors will discuss these in 2019 and agree measures to further optimize the Board of Directors’ work.
Audit CommitteeThe Audit Committee consists of three Board members (see separate section Members of the Board of Directors). It supports the Board of Directors in monitoring accounting and financial reporting, supervises the internal and external audit function, assesses the efficiency of the internal control system including risk management and compliance with legal and statutory provisions, acknowledges the sensitivity analysis of the pension funds of Georg Fischer Ltd, and issues its opinions on transactions concerning equity and liabilities at Georg Fischer Ltd. The Audit Committee also decides whether or not the consolidated financial statements and those of Georg Fischer Ltd can be recommended to the Board of Directors for presentation to the Annual Shareholders’ Meeting.
As a rule, the Chairman of the Board, the CEO, the CFO, the Head of Corporate Controlling and Investor Relations, the Head of Internal Audit, and a representative of the external auditor also take part in the meetings. At the request of the Audit Committee the external auditor also provides information on current questions related to the financial reporting requirements and financial issues.
In the year under review, the Audit Committee held five ordinary and two extraordinary meetings, four of which lasted half a day, and the other three lasted between one and two hours. All members of the Audit Committee attended all seven meetings.
Compensation CommitteeThe Compensation Committee consists of three Board members (see separate section Members of the Board of Directors), who are elected on a yearly basis by the Annual Shareholders’ Meeting. It supports the Board of Directors in setting compensation policy at the highest corporate level. It uses knowledge of internal and external compensation specialists about market data from comparable companies in Switzerland, in addition to publicly available data obtained on the basis of compensation disclosures. Furthermore, based on internal and external sources, common market practices and expectations of stakeholders are continuously evaluated by the Compensation Committee. Adaptations to the long-term incentive plan (LTI) decided and implemented in the reporting year, based on requirements expressed by the shareholders of GF, will be implemented in 2019. These adaptations are disclosed in the Compensation Report. The Compensation Committee proposes to the Board of Directors the total amount of compensation to be paid to the entire Executive Committee and the Chief Executive Officer.
The Compensation Committee held three ordinary and three extraordinary meetings during the past fiscal year, each of which lasted one to two hours. All six Compensation Committee meetings were consistently attended by all of the Compensation Committee members, with the exception of one person at an extraordinary meeting.
Nomination CommitteeThe Nomination Committee consists of three Board members (see separate section Members of the Board of Directors). It supports the Board of Directors in succession planning and assists in the selection of suitable candidates for the Board of Directors and the Executive Committee. The Nomination Committee is kept informed annually about succession planning for the Senior Management levels, about the talent pipeline within Senior Management, and the diversity situation. For specific high-level recruitments, services of headhunters were hired.
In the year under review, the Nomination Committee held three ordinary and four extraordinary meetings, which lasted one to two hours on average. All members of the Nomination Committee attended all seven meetings.

58 Corporate Governance
Information and control instrumentsThe Board of Directors is informed in depth about business performance every month. The members of the Board receive the monthly report. In addition to an introductory commentary on the current course of business, it contains the most important key figures for the course of business and the monthly closing as well as a preview of the next three months and the year-end. These key figures are broken down by Corporation, divisions and Corporate Companies. The Executive Committee presents and comments on business performance and presents its assessment of business performance for the coming months at Board meetings. It also presents all important topics to the Board of Directors.
In addition, the Board of Directors receives regularly the forecast containing the expected figures at year-end. Once a year, the Board of Directors receives and approves the budget of the Corporation and the divisions for the following year. The Board of Directors holds as a general rule a two-day meeting once a year to discuss the strategies of the divisions and the Corporation as a whole. Once a year, it discusses the Corporate Risk Officer’s report, the Corporation’s risk profile and is updated about the measures taken to minimize and control risk.
The Chairman of the Board of Directors attends the Corporate Convention of the Senior Management and the Executive Committee’s strategy meeting and is a regular attendee at other corporate management meetings. The Chairman of the Board of Directors and the CEO inform and consult each other regularly on all business matters that are of fundamental importance or have far-reaching ramifications. The Chairman of the Board receives the invitations and minutes of the Executive Committee and Corporate Staff Meetings. He visits Corporate Companies on a regular basis to see their operations in person and how they are implementing the Corporation’s strategy. In 2018, he visited Corporate Companies in Europe, in the USA and in Asia.
Internal AuditInternal Audit reports to the Chairman of the Audit Committee operationally and to the CFO administratively. Based on the audit plan approved by the Audit Committee, Corporate Companies are audited either annually or every two to three years, depending on the risk assessment and based on a comprehensive audit program. In the year under review, 41 internal audits were conducted. The audit reports are reconciled with the management of the audited Corporate Companies and distributed to the line managers, the external auditor, the Executive Committee, the Chairman of the Board of Directors as well as the Chairman of the Audit Committee. Audit reports with significant findings are presented to and discussed in the Audit Committee.
Internal Audit ensures that all discrepancies arising in internal and external audits are addressed and submits a report to the Executive Committee and the Audit Committee. The Head of Internal Audit prepares an annual report, which is discussed by the Executive Committee and the Audit Committee. He also serves as the secretary of the Audit Committee.
Corporate ComplianceThe Service Center Law & Compliance informs the Board of Directors and the Executive Committee about legal issues and significant changes to the law. The Corporate Compliance Officer (CCO) is appointed by the Chief Executive Officer and in this function reports to the General Counsel; he informs the CEO directly, if necessary. The CCO helps Corporate Companies comply with the law, internal directives, and the Corporation’s principles of business ethics in their business activities, in particular through preventive measures and training in the divisions along with information and advice to the Corporate Companies. The Executive Committee, in consultation with the CCO, defines priority issues.
A number of compliance measures were implemented in 2018:
– further implementation of the “Compliance Agreement for Intermediaries” as a guideline for GF business partners who act in the name or interest of Corporate Companies within the GF Corporation
– roughly 2’900 internal e-learnings were conducted on anticorruption, competition, and cartel law as well as for export controls and economic sanctions
– training courses on antitrust law, anticorruption, export controls, and/or other compliance topics at various Corporate Companies
– ongoing advice and support for internal revisions

59 Corporate Governance
– continuation of specific compliance measures for intermediaries in China (e.g. ongoing checks regarding the appropriateness of compensation paid to intermediaries as well as examination of their ownership structure so as to avoid conflicts of interests)
– further implementation of a web-based system for the prevention of business with sanctioned persons and organizations
– advice on issues relating to export controls, cartel law, and labor law– further implementation of the function “Compliance Agents” (carried out by the Business Unit
Controllers) for risk assessment and internal control– updating the data protection measures in view of the changed legislation in the EU and preparatory
activities with respect to the forthcoming revised Swiss data protection law
Code of Conduct of GF: www.georgfischer.com/content/gf/com/en/UeberGeorgFischer/nachhaltigkeit/code-of-conduct.html
Risk managementThe Board of Directors and the Executive Committee attach great importance to the thorough handling of risks in the areas of strategy, finance, markets, management and resources, operations, and sustainability. The Head of the Service Center Risk Management & Tax acts as the Chief Risk Officer (CRO) and, in this function, directly reports to the CEO. The CRO is supported by a non-executive risk officer from each division. Supplemented by internal experts of the corporate risk management, the risk officers under the leadership of the CRO constitute the Corporate Risk Council which met twice during the year under review. In addition, the CRO conducted workshops with the management of the three divisions as well as with the Executive Committee to analyze the risk situation, discuss measures to mitigate the risks, and define the actual top risks of each unit. Based on the results of the workshops, a risk report was prepared which was reviewed and approved by the Board of Directors in September.
The handling of financial and operational risks is explained in the notes to the consolidated financial statements in note 3.6 Risk management.
AssessmentThe Board of Directors evaluates and assesses the performance of the Executive Committee and its members at least once a year in the absence of the Executive Committee members. The Chairman of the Board of Directors must approve any appointments of Executive Committee members to external Boards of Directors or to high-level political or other public functions.

60 Corporate Governance
Members of the Board of Directors
As of 31 December 2018 Committees
Audit CommitteeHubert Achermann, ChairmanGerold Bührer Roger Michaelis
Compensation CommitteeEveline Saupper, ChairwomanRiet CadonauJasmin Staiblin
Nomination CommitteeAndreas Koopmann, Chairman Roman Boutellier Zhiqiang Zhang
Andreas Koopmann
Chairman of the Board1951 (Switzerland)
Dipl. Masch.-Ing. ETH Zurich (Switzerland), MBA from IMD Lausanne (Switzerland)
Board Member since 2010, Chairman of the Board since 2012
CommitteesChairman of the Nomination Committee
Corporate GovernanceIndependent member
Professional background, careerVarious positions in Swiss industrial companies (1979–1982); Vice President of Engineering and Production, Bobst Group, Roseland (USA) (1982–1989); various senior positions in the Bobst Group (Switzerland) (1989–2009), as CEO (1995–2009); Chairman of Alstom (Switzerland) AG (2010–2012)
Other activities of governing bodies in listed corporationsVice Chairman of the Board of Directors of Nestlé AG (2013–April 2018); Member of the Board of Directors of Credit Suisse Group AG (both Switzerland)
Further professional activities and functionsVice Chairman of the Board of Directors of CSD Holding AG; Member of the Board of Directors of Sonceboz SA; Member of the Board of economiesuisse (all Switzerland)
Gerold Bührer
Vice Chairman of the Board 1948 (Switzerland)
lic. oec. publ. University of Zurich (Switzerland)
Board Member since 2001, Vice Chairman of the Board since 2012
CommitteesMember of the Audit Committee
Corporate GovernanceIndependent member
Professional background, careerVarious positions at the Union Bank of Switzerland (now UBS) (1973–1990), ultimately as a Member of the Executive Management of the bank’s investment company; Member of the Executive Committee of Georg Fischer Ltd (1991–2000); Member of the Swiss Parliament (1991–2007); President of economiesuisse (2007–2012)
Other activities of governing bodies in listed corporationsFirst Vice Chairman of the Board of Directors of Swiss Life (until April 2018) (Switzerland)
Further professional activities and functionsChairman of the Board of Directors of Fehr Advice & Partners AG and of Meier + Cie AG; Board Member of Cellere AG (until MAy 2018); Member of the European Advisory Council of J.P. Morgan (all Switzerland)

61 Corporate Governance
Hubert Achermann
Member of the Board of Directors 1951 (Switzerland)
Dr. iur, attorney, graduated in law at the University of Bern (Switzerland)
Board Member since 2014
CommitteesChairman of the Audit Committee
Corporate GovernanceIndependent member
Professional background, careerLegal advisor at FIDES Treuhandgesellschaft in Zurich (1982–1987); heading the company’s Lucerne office (1987–1994); Partner and Vice Chairman of the Board of Directors of the newly created KPMG Schweiz (1992–1994); joined the four-person Executive Board, where he was responsible for tax and law (1994–2004); CEO of KPMG Schweiz and performed several key roles for KPMG International (2004–2012); first Lead Director of KPMG International and Member of the KPMG Global Board (2009–2012)
Other activities of governing bodies in listed corporationsMember of the Board and Head Audit Committee of UBS Switzerland AG (Switzerland)
Further professional activities and functionsChairman of the Foundation Board of Lucerne Festival and of Friends of Lucerne Festival; Member of the Foundation Board of Ernst von Siemens Musikstiftung (all Switzerland)
Roman Boutellier
Member of the Board of Directors1950 (Switzerland)
Dr. sc. math. ETH Zurich (Switzerland)
Board Member since 1999
CommitteesMember of the Nomination Committee
Corporate GovernanceIndependent member
Professional background, careerKern AG (1981–1987); Member of the Executive Management of Leica AG (1987–1993); Professor at the University of St. Gallen (1993–1998); CEO and Delegate to the Board of Directors of SIG Holding AG (1999–2004); Professor of Innovation and Technology Management at the ETH in Zurich (2004–2015) and Member of the Executive Board of the ETH Zurich (2008–2015)
Other activities of governing bodies in listed corporations–
Further professional activities and functionsChairman of the Board of Directors of Appenzell Cantonal Bank; Board Member of Ammann Group Holding AG, of Rychiger AG Steffisburg and of Swiss Association Balgrist (all Switzerland)
Riet Cadonau
Member of the Board of Directors1961 (Switzerland)
BA of Arts in Business and Economics at the University of Basel (Switzerland); MA of Arts in Economics and Business Administration at the University of Zurich (Switzerland); INSEAD Advanced Management Program AMP (France)
Board Member since 2016
CommitteesMember of the Compensation Committee
Corporate GovernanceIndependent member
Professional background, careerSwiss Bank Corporation (now UBS) (1988–1989); various positions at IBM Switzerland (1990–2001), ultimately as Director of Global Services and Member of the Executive Committee; various positions as Member of the Executive Board at Ascom Group (2001–2005 and 2007–2011), since 2007 as CEO; 2005–2007 Managing Director and Senior Vice President at ACS Inc. (now Xerox); since 2011 CEO at Kaba Group resp. dormakaba Group; since 2018 Chairman at dormakaba Group
Other activities of governing bodies in listed corporationsMember of the Board of Directors at Zehnder Group (Switzerland)
Further professional activities and functions–

62 Corporate Governance
Roger Michaelis
Member of the Board of Directors 1959 (Brazil and Germany)
Studied business administration at the University of São Paulo (Brazil), post-graduate degree in management and strategy at Krupp Foundation, Munich (Germany), and Babson College (USA)
Board Member since 2012
CommitteesMember of the Audit Committee
Corporate GovernanceIndependent member
Professional background, careerVarious positions at Osram Group (1988–2012), ultimately as CEO at Osram Brazil and Head of Human Resources in Latin America (2004–2012); before CFO at Osram subsidiaries in India and Brazil; Partner and Director of Verocap Consulting, São Paulo, (Brazil) (since 2012)
Other activities of governing bodies in listed corporations–
Further professional activities and functionsManaging Director and owner of Verocap Consulting; Chairman of the Advisory Board of Bentonit União Ltd. São Paulo; CEO and Member of the Board of Directors of Celena S.A Solução em Iluminação e Eficiência Energética; Member of the Advisory Board of Mast Group Ltd. (all Brazil)
Eveline Saupper
Member of the Board of Directors 1958 (Switzerland)
Dr. iur, attorney and certified tax expert, graduated in law at the University of St. Gallen (Switzerland)
Board Member since 2015
CommitteesChairwoman of the Compensation Committee
Corporate GovernanceIndependent member
Professional background, careerLegal and tax Advisor at Peat Marwick Mitchell (now KPMG Fides) (1983–1985); Attorney at Baker & McKenzie (1985–1992); Employee (1992–1994), Partner (1994–2014) and of counsel at Homburger AG (2014–2017)
Other activities of governing bodies in listed corporationsMember of the Board of Directors of Flughafen Zurich AG and Clariant AG (both Switzerland)
Further professional activities and functionsChairwoman of Mentex Holding AG; Member of the Board of Directors of Stäubli Holding AG, of Tourismus Savognin Bivio Albula AG (all Switzerland) and of the Hoval Group (Principality of Liechtenstein); Member of the Board of Trustees of UZH Foundation and of Schweizer Berghilfe (both Switzerland)
Jasmin Staiblin
Member of the Board of Directors 1970 (Germany)
Double degree in electrical engineering and physics from the Technical University, Karlsruhe (Germany); Royal Institute of Technology, Stockholm (Sweden)
Board Member since 2011
CommitteesMember of the Compensation Committee
Corporate GovernanceIndependent member
Professional background, careerVarious positions at ABB, including in Switzerland, Sweden, and Australia (1997–2006); Country Manager of ABB Switzerland (2006–2012); CEO of Alpiq Holding AG (2013–2018)
Other activities of governing bodies in listed corporationsBoard member of Rolls-Royce Holdings Plc (Great Britain)
Further professional activities and functions–

63 Corporate Governance
Zhiqiang Zhang
Member of the Board of Directors 1961 (China)
Bachelor of Sciences from Northern Jiatong University, Beijing (China); MBA from Queen’s University, Kingston (Canada)
Board Member since 2005
CommitteesMember of the Nomination Committee
Corporate GovernanceIndependent member
Professional background, careerVarious positions at Siemens (1987–2012), including President of Siemens VDO Automotive China (1999–2005), President of Nokia Siemens Networks Greater China Region (2005–2012); Executive Vice President and Head of Emerging Markets (2012–2016), Senior Vice President of Sandvik Group, Head of APAC and President of Greater China Region (2016–2018), Country Managing Director of ABB China (since 2018)
Other activities of governing bodies in listed corporationsMember of the Board of Directors of Dätwyler Holding AG (Switzerland)
Further professional activities and functions–

64 Corporate Governance
Executive Committee
As of 31 December 2018
Mads Joergensen will succeed Andreas Müller as CFO and Head of Corporate Finance & Controlling.1
The Chief Executive Officer is responsible for the management of the Corporation. Under his leadership, the Executive Committee addresses all issues of relevance to the Corporation, takes decisions within its remit, and submits proposals to the Board of Directors. The Heads of the three Divisions and two Corporate Staff Units are responsible for drafting and achieving their business objectives and for managing their units autonomously. No management responsibility is delegated to third parties at the Executive Committee level (management contracts).
MembersOn 1 September 2018, Carlos Vasto succeeded Josef Edbauer as Head of the GF Casting Solutions division. As of 31 December 2018, the Executive Committee is composed of the following members: Yves Serra, CEO and at the same time Head of Corporate Development; Joost Geginat, Head of GF Piping Systems; Carlos Vasto, Head of GF Casting Solutions; Pascal Boillat, Head of GF Machining Solutions; Andreas Müller, CFO and Head of Corporate Finance & Controlling.
With the end of the Annual Shareholders’ Meeting on 17 April 2019, Andreas Müller will succeed Yves Serra as CEO of GF. On 21 February 2019, the Board of Directors appointed Mads Joergensen as new CFO and successor of Andreas Müller, effective as of 18 April 2019.
MandatePursuant to § 23a of the Articles of Association of Georg Fischer Ltd, a member of the Executive Committee may at one and the same time hold no more than one additional mandate as a member of the supreme managerial or governing body of listed legal entities and no more than five additional mandates as a member of the supreme managerial or governing body of unlisted legal entities. These mandates must be approved by the Board of Directors.
In addition, a member of the Executive Committee may not hold more than ten mandates that he or she exercises by order of the company, in legal entities belonging to the member’s own family, in a professional or industry association or in a charitable institution.
Mandates of associated companies or institutions and involvement in professional or industry associations, which are exercised in the function as a member of the supreme managerial or governing body of a legal entity, shall together count as one mandate.

65 Corporate Governance
Members of the Executive Committee
Yves Serra
Chief Executive Officer1953 (France/Switzerland)
Engineering degree from École Centrale de Paris (France) and MSc in civil engineering from the University of Wisconsin-Madison (USA)
Member of the Executive Committee since 2003, CEO since 2008
Professional background, careerDeputy Commercial Attaché at the French Embassy in Manila (1977–1979); Customer Service Engineer for Alstom in France and South Africa (1979–1982); various positions at Sulzer in France and Japan (1982–1992); various positions at GF (since 1991), Managing Director of Charmilles Technologies Japan and Regional Head of Sales Asia (1992–1997), Head of Charmilles (1998–2002), Head of GF Piping Systems (2003–2008); President and CEO of Georg Fischer Ltd (since 2008)
Other activities of governing bodies in listed corporations–
Further professional activities and functionsMember of the Board of Directors of Stäubli Holding AG; member of the Board of Swiss Chinese Chamber of Commerce and member of the Chapter Board “Doing Business in USA” of the Swiss American Chamber of Commerce (Switzerland)
Andreas Müller
CFO 1970 (Germany)
Graduate in Business Administration (Dipl.-Betriebswirt FH), University of Applied Sciences (HTWG), Konstanz (Germany)
Member of the Executive Committee since 2017
Professional background, careerVarious positions for GF (since 1995), including Head of Controlling of GF Piping Systems Schaffhausen (1998–2000), Head of Operations GF Piping System companies in Australia (2000–2002), Head of Controlling Business Unit Industry & Utility GF Piping Systems Schaffhausen (2002–2008); CFO of GF Automotive (2008–2016); CFO of Georg Fischer Ltd (since 2017)
Other activities of governing bodies in listed corporations–
Further professional activities and functions–
Joost Geginat
Head of GF Piping Systems 1966 (Germany/Switzerland)
Studies of Business Management at the University of Cologne (Germany) and at École des Hautes Études Commerciales (HEC) in Paris (France); Degree Dipl. Kaufmann and CEMS Master
Member of the Executive Committee since 2016
Professional background, careerVarious managing functions at Roland Berger Strategy Consultants in Germany, Switzerland and Asia (1995–2014); Senior Managing Director and Partner at AlixPartners in Switzerland (2014–2016); Head of GF Piping Systems (since 2016)
Other activities of governing bodies in listed corporations –
Further professional activities and functions–

66 Corporate Governance
Carlos Vasto
Head of GF Casting Solutions 1963 (Brazil/Italy)
University Degree Metallurgical Engineer Mackenzie University, São Paulo (Brazil); Bachelor of Business Administration GSBA Graduate school of Business Administration, Zurich (Switzerland)
Member of the Executive Committee since 2018
Professional background, careerVarious positions at GF Casting Solutions (1987–2000); Head of Production former site of GF Casting Solutions, Lincoln (Great Britain) (2000–2003); Managing Director GF Casting Solutions, Lincoln (Great Britain) (2003–2005); Executive Vice President Acotecnica SA (Brazil) (2005–2010), Managing Director Intra do Brazil (2011–2015); General Manager GF Linamar (USA) (2015–2018); Head of GF Casting Solutions (since September 2018)
Other activities of governing bodies in listed corporations–
Further professional activities and functions–
Pascal Boillat
Head of GF Machining Solutions 1955 (Switzerland)
Studies of Electrical Engineering at Engineering School in Bienne (Switzerland); Dipl.-El.-Ing. ETS
Member of the Executive Committee since 2013
Professional background, careerElectrical Engineer and responsible for the software department at Wahli Frères in Bévilard (1977–1984); various positions at General Electric Switzerland and GE Fanuc Switzerland (1984–2000), ultimately as Country Manager Switzerland; Vice President (2000–2002), President & CEO of GE Fanuc Europe (Luxembourg) (2002–2010); at GF Agie Charmilles as Head of Operations (2010–2012); Head of GF Machining Solutions (since 2013)
Other activities of governing bodies in listed corporations –
Further professional activities and functionsMember of the working group Machine Tools and Machining of Swissmem (Switzerland); Delegate of Swissmem to CECIMO

67 Corporate Governance
Auditors
MandateIn 2012, PricewaterhouseCoopers, Zurich (Switzerland), was elected as external auditor. Stefan Räbsamen is the auditor in charge since the Annual Shareholders’ Meeting 2012. He will assume the responsibility of the audit for no longer than seven years. The next change in the lead auditor will happen after the audit in the fiscal year 2018. The statutory auditor is elected at the Annual Shareholders’ Meeting for a term of one year.
Audit feesIn 2018, the Corporation spent about CHF 2.76 million (previous year: CHF 2.70 million) worldwide in connection with the annual audits conducted by PricewaterhouseCoopers at Georg Fischer Ltd, the Corporation, and the Corporate Companies. For additional services, PricewaterhouseCoopers received in 2018 fees of approximately CHF 1.26 million (previous year: CHF 0.56 million), thereof CHF 0.19 million (previous year: CHF 0.27 million) for consulting mandates in connection with accounting, CHF 0.21 million (previous year: CHF 0.07 million) for services related to tax advice and CHF 0.86 million (previous year: CHF 0.22 million) for transaction services.
Supervisory and control instrumentsThe external auditor informs the Audit Committee in writing about relevant auditing activities and findings as well as other important information regarding the audit of the Corporation. The auditor in charge of the external auditor attended the five ordinary meetings and one of the two extraordinary meetings of the Audit Committee.
The Audit Committee reviews and evaluates the effectiveness and independence of the external auditors annually. For this purpose, Internal Audit reviews all auditing services rendered by external auditors for the Corporation and their costs. The Audit Committee bases its evaluation on the following criteria:
– quality of the documents and reports provided to the Audit Committee and the management– time taken and costs – quality of oral and written reports on individual aspects and pertinent questions relating to accounting,
auditing, or additional consulting mandates
In cooperation with internal and external audit, the Audit Committee evaluates the potential for improvements regarding the collaboration, the processing of the assignments and the interfaces or overlapping of internal and external audit work.
For the evaluation, the members of the Audit Committee use first of all the knowledge and experience which they have acquired as a result of similar functions at other companies. Internal Audit also issues an annual list of all services rendered by external auditors for the Corporation and their costs. The costs for the annual audits of Georg Fischer Ltd, the Corporation, and of all Corporate Companies were approved by the Audit Committee. Further services from PricewaterhouseCoopers are examined by the Head of Internal Audit and, depending on the amount, approved either by the CFO or by the Managing Directors of the respective Corporate Companies.

68 Corporate Governance
Communication policy
Corporate Communications and Investor Relations are the two Service Centers responsible for activities relating to stakeholder information and communication. The communication strategy is based on GF’s business strategy and supports the positioning of both the Corporation and the divisions. Communication with all GF stakeholders is active, open, and timely. If possible and permissible, employees are notified first.
An important internal information platform is the multi-award-winning employee magazine “Globe”, that is published in eight languages. The publication was awarded the “Silver Feather” in 2018 by the Swiss Association for Internal Communication (SVIK). The jury rated the magazine as very reader-friendly and judges the online version as an enhancement to the printed one. Corporate Communications received another prize in 2018 – the “Golden Feather” in the Events category. The SVIK jury recognized the development project week carried out by GF apprentices in Bolivia in the summer and praised the exceptional commitment of the company.
Digital communication channels are increasingly displacing traditional communication channels – even in the external communication. GF therefore places great emphasis on its social media platforms, e.g. on LinkedIn, Xing, Facebook, and significantly increased the number of followers in 2018. Corporate Communications’ largest project, the relaunch and modernization of the GF website, will be finished in the current year.
The shares of Georg Fischer Ltd are listed on the SIX Swiss Exchange. Therefore, GF is subject to the requirements on ad hoc publicity stipulated in the listing rules and the directive on ad hoc publicity. This relates to the obligation to report any potential share-price-relevant information. GF also maintains a dialog with investors and journalists at events and roadshows.
Subscription to an e-mail service for GF news is free of charge. All media releases, Annual Reports, and Mid-Year Reports plus important publications go online at www.georgfischer.com at the same time as they are published. Shareholders receive the short version of the Annual Report and the Mid-Year Report automatically, and other interested parties can order them.www.georgfischer.com/mediareleases_en www.georgfischer.com/subscriptionservice
Daniel Bö[email protected]
Investor Relations
Beat Rö[email protected]
Corporate Communications

69 Corporate Governance
Changes after the balance sheet date
Between 1 January 2019 and the editorial deadline on 21 February 2019, the following changes occurred.
On 21 February 2019, the Board of Directors appointed Mads Joergensen as new CFO and successor of Andreas Müller, effective as of 18 April 2019.www.georgfischer.com/content/gf/com/en/investoren/Ad-hoc-Media-Releases.html

70 Compensation Report
Compensation Report
Introduction by the Chairwoman of the Compensation Committee
Dear shareholders,On behalf of the Board of Directors of GF and of the Compensation Committee, I am pleased to present the 2018 Compensation Report.
Although our shareholders approved the 2017 Compensation Report, but with a relatively weak majority, the year 2018 has been a year of intense dialogue. The Chairman of the Board and I consulted a significant number of shareholders and proxy advisors throughout 2018 to better understand their rational for their responses, both positive and negative, to GF’s LTI-Plan design.
During the reporting year, following last year’s amendments to the LTI-Plan and the introduction of a shareholding ownership guideline, the Board of Directors decided in December 2018 to amend the LTI-Plan once again, effective for the performance year 2019. The LTI-Plan design 2018 does not differ from the design 2017, as it would have contradicted an existing contractual commitment with the Executive Management by retroactively adjusting a running plan.
The LTI-Plan 2019 principles can be summarized as follows:
– The performance conditions include Earnings per Share (EPS) as internal measure and relative Total Shareholder Return (rTSR) as external measure. Therefore, the performance criteria are well balanced in terms of both internal and external views. Most shareholders and proxy advisors support this approach.
– The EPS value targets have been reviewed and are now better aligned with GF’s ambitious Strategy 2020.
– The rTSR targets continue to be linked to the SMI-Mid; however, the focus will be on performance at and above median, so there will be no payout below median performance.
Further details of the plan can be found in the chapter Changes for the Business Year 2019.
The Board of Directors trusts that the changes made to the LTI-Plan fulfill our shareholders’ expectations as they take into account their latest feedbacks.
As last year, the compensation report for 2018 provides an Executive Summary. In the chapter, Compensation structure you will find the Key Performance Indicators GF selected for the variable compensation elements and their rational. All other content does not differ from previous years’ and continues to provide a high level of transparency.
At the upcoming Annual Shareholders’ Meeting, we will ask you to approve, as last year, prospectively in a binding vote the maximum calculated amounts of compensation for the Board of Directors until the next Annual Shareholders’ Meeting, and the maximum calculated amount of compensation for the Executive Committee for the next business year. Further, you will have the opportunity to express your opinion on the Compensation Report in a consultative vote.
Looking ahead, we will continue to assess and review our compensation structure to ensure that it continues to fulfill its purpose in the evolving context in which GF operates and is aligned with the interests of our shareholders. However, we also hope to stabilize the remuneration structure for our Executive Committee until the new Strategy phase 2021 – 2025. At that point in time, the intention will be to review the remuneration system once more in depth and possibly align it with market trends in management compensation.
We trust that you will find this report interesting and informative.
Sincerely
Eveline SaupperChairwoman of the Compensation Committee

71 Compensation Report
Executive summary 2018
Overview of 2018 compensation structure for the Executive Committee (including CEO)
Fixed compensation elements
Variable compensation elements
Fixed base salary Benefits Short-term incentive
Performance year 2018 Long-term incentive
Performance year 2018
Purpose Ensure basic fixed
remuneration Ensure protection against risks such as death, disability, and old age
Pay for annual performance
Align to shareholders' interests Participate in long-term success and align with Strategy 2020
Drivers Scope and complexity of the functionProfile of the individual
Local legislation and market practice
Performance against business and individual objectives
Long-term value creation Supporting a high-performance culture
Performance /Vesting period
Year 2018 3 yearsGrant date: 1 January year 2019Vesting period: years 2019, 2020, 2021
Blocking period Additional 2 yearsYears 2022, 2023
Performance measures Skills, experience, and performance of the individual
Organic sales growthEBIT margin ROIC Individual objectives
All LTI-related shares are performance dependent;50% PS(EPS), 50% PS(rTSR)
EPS-related achievement determination:Ø (EPS value years 2019, 2020, 2021) divided byØ (EPS value years 2016, 2017, 2018) * 1.04
rTSR-related achievement determination:Ø (ranking in the years 2019, 2020, 2021 of GF within the SMI-Mid)
The performance measures will be amended for the LTI-Plan 2019. A detailed outline can be found in chapter Changes for the Business Year 2019.
Share ownership CEO: 200% of annual fixed base salaryEC: 100% of annual fixed base salary
CEOcompensation
100% Total remuneration dependent
Minimum: 0%Target: 100%Maximum: 150% of fixed base salary
Vesting:Minimum: 0 sharesTarget: 750 shares (375 PS(EPS), 375 PS(rTSR))Maximum: 1'500 shares
Subject to cap as defined in Articles of Association: The variable compensation (STI and LTI) is capped at 250 % of the fixed compensation for the calendar year in question

72 Compensation Report
EBIT = Earnings before interest and taxesEPS = Earnings per shareLTI = Long-term incentive planPS = Performance sharesPS(EPS) = EPS dependent performance sharesPS(rTSR) = rTSR dependent performance sharesROIC = Return on invested capitalSTI = Short-term incentive planØ = Average
EC committee membercompensation
100% Total remuneration dependent
Minimum: 0%Target: 60%Maximum: 90% of fixed base salary
Vesting:Minimum: 0 sharesTarget: 250 shares (125 PS(EPS), 125 PS(rTSR))Maximum: 500 shares
Subject to cap as defined in Articles of Association: The variable compensation (STI and LTI) is capped at 250 % of the fixed compensation for the calendar year in question

73 Compensation Report
Executive Committee compensation 2018 (including CEO)
(all financial figures in CHF 1'000, except number of shares and share price)PS = Performance shares
Fixed compensation elements
Variable compensation elements
Total 2018
Fixed base salary Benefits Short-term incentive
Performance year 2018 Long-term incentivePerformance year 2018
Performance year 2018
3'003 1'239 2'797 1'378 8'417
Delivery Monthly cash Contributions to social security, pension, and insurances
Cash payment in March 2019
1'752 PS with a total grant value of 1'378 based on share price of CHF 786.50 at 31 December 2018
Short-term incentive target
2'182
Short-term incentive 2018 in % of target
128.2%
At the Annual Shareholders’ Meeting of 19 April 2017, a maximum sum of CHF 10.298 million for remuneration of the members of the Executive Committee for the business year 2018 was approved.
Amounts in CHF 1’000Executive Committee Compensation 2018
in percentage of total compensationExecutive Committee Compensation 2018
8’4178’417
Fixed base salary
Short-term incentive
Long-term incentive
Benefits
100%
100%
Fixed base salary
Short-term incentive
Long-term incentive
Benefits

74 Compensation Report
CEO compensation 2018
(all financial figures in CHF 1'000, except number of shares and share price)PS = Performance shares
Fixed compensation elements
Variable compensation elements
Total 2018
Fixed base salary Benefits Short-term incentive
Performance year 2018 Long-term incentivePerformance year 2018
Performance year 2018
950 410 1'247 590 3'197
Delivery Monthly cash Contributions to social security, pension, and insurances
Cash payment in March 2019
750 PS with a total grant value of 590 based on share price of CHF 786.50 at 31 December 2018
Short-term incentive target
950
Short-term incentive 2018 in % of target
131.3%
Amounts in CHF 1’000CEO Compensation 2018
in percentage of total compensationCEO Compensation 2018
3’1973’197
Fixed base salary
Short-term incentive
Long-term incentive
Benefits
100%
100%
Fixed base salary
Short-term incentive
Long-term incentive
Benefits

75 Compensation Report
Contents
The Compensation Report provides information about the compensation policy, the compensation programs, and the process of determination of compensation applicable to the Board of Directors and to the Executive Committee of GF. It also includes details on the compensation payments related to 2018 and the foreseen changes to the LTI-Plan for the Executive Committee starting in 2019. Further details of these changes can be found in the chapter Changes for the Business Year 2019.
This report is written in accordance with the Swiss Ordinance against excessive pay in stock exchange listed companies, the standards related to information on Corporate Governance issued by the SIX Swiss Exchange, and the principles of the Swiss Code of Best Practice for Corporate Governance of Economiesuisse.

76 Compensation Report
Compensation policy 2018
Overarching principlesFor the Board of Directors, the compensation policy is designed to ensure their independence in exercising their supervisory duties and foresees a fixed compensation only.
For the Executive Committee, the compensation policy is designed to attract, motivate, and retain talented individuals, along the following principles:
– Fairness and transparency– Pay for performance and strategy implementation– Long-term orientation and alignment to shareholders’ interests– Market competitiveness
Compensation principles 2018
Fairness and transparency(internal equality)
Pay for performanceand strategy implementation
Long-term orientation and alignment with shareholders' interests
Market competitiveness(external equality)
Compensation programs are straightforward, clearly structured and transparent. They ensure fair remuneration based on the responsibilities and competencies required to perform the function.
A portion of compensation is directly linked to the company, its strategy and individual performance.
Portions of compensation are delivered in form of performance shares, ensuring participation in the long-term success of the company and a strong alignment to the shareholders' interests.
Compensation levels are competitive and in line with relevant market practice.

77 Compensation Report
Compensation Governance
Compensation CommitteeThe Compensation Committee consists of three non-executive Board members who are elected annually and individually by the Annual Shareholders’ Meeting for a one-year period until the next Annual Shareholders’ Meeting. At the 2018 Annual Shareholders’ Meeting, Riet Cadonau, Eveline Saupper, and Jasmin Staiblin were confirmed as members of the Compensation Committee. The Committee supports the Board of Directors in setting the compensation policy at the highest corporate level and regularly reviews the guidelines governing compensation of the executives. The Committee also proposes the amount of compensation to be paid to the Board of Directors, to the Chief Executive Officer, and to the other members of the Executive Committee, and prepares the related motions for the Annual Shareholders’ Meeting.
The Compensation Committee convenes as often as necessary, but at least twice per year. In 2018, the Committee held six meetings of approximately two hours each:
During the year 2018, the Committee evaluated the business performance for the 2017 business year against the preset objectives, and prepared a proposal to the Board of Directors on the short-term incentive to be paid to the Chief Executive Officer and to the Executive Committee members. The Committee determined the business objectives for the 2018 business year for the Chief Executive Officer and reviewed those of the Executive Committee members, before submitting them to the Board of Directors for approval. The Committee reviewed the Compensation Report 2017.
Based on the small majority in favor in the vote on the Compensation Report 2017 and also on the findings from the various discussions with proxy advisors and investors, the Compensation Committee recommended to the Board of Directors to amend the long-term incentive plan as of 1 January 2019. Further details on the amended plan can be found in the chapter Changes for the Business Year 2019.
The Committee annually reviews the benchmarking analysis of the compensation of the Chief Executive Officer and the members of the Executive Committee; it determined the target compensation of the Chief Executive Officer for the year 2018 and next business years based on a proposal from the Chairman of the Board. It also reviewed the target compensation for the year 2018 and following years for the members of the Executive Committee based on a proposal from the Chief Executive Officer. The Committee submitted the proposals to the Board of Directors for approval.
Overview of meetings’ schedule 2018
February June July November December
CEO and EC compensation
Business performance 2017; STI 2017 for CEO and EC
Business objectives for the year 2018
Review Compensation Report 2017
Determination of the maximum amounts of compensation for the Board of Directors until the next Annual Shareholders' Meeting
Determination of the maximum amounts of compensation for the Executive Committee for the business year 2019
Analysis of the Compensation Report voting results of the Annual Shareholders' Meeting
Analysis of possible LTI-Plan adjustments
Review of feedback received from various proxy advisors and investors on potential adaptations of the LTI-Plan
2 Meetings
Review of feedback received from various proxy advisors and investors on potential adaptations of the LTI-Plan
LTI-Plan fine-tuning for 2019
Review compensation for the Board of Directors for the years 2018 and 2019
Review target compensation for the CEO and EC members for 2019

78 Compensation Report
In 2018, all Committee members attended all meetings. The Chairman of the Board, the CEO and the Head of Corporate Human Resources attended the Committee meetings in an advisory capacity. The CEO did not attend the meeting when his own compensation or performance was discussed. The Chairwoman of the Committee reported to the Board of Directors after each meeting on the activities of the Committee. The minutes of the Committee meetings are available to all members of the Board of Directors.
The compensation proposals and decisions are made based on the following levels of authority:
Levels of authorityApproval framework
Subject > Recommendation from > Final approval from >Aggregate compensation amount of Board of Directors
Board of Directors based on proposal by Compensation Committee
Annual Shareholders’ Meeting
Individual compensation of Board of Directors Compensation Committee Board of DirectorsAggregate compensation amount of Executive Committee including CEO
Board of Directors based on proposal by Compensation Committee
Annual Shareholders’ Meeting
Compensation of the CEO Compensation Committee based on proposal by the Chairman of the Board
Board of Directors
Individual compensation of Executive Committee members
Compensation Committee based on proposals by the CEO
Board of Directors
On behalf of the Board of Directors, Internal and External Audit annually reviews the compliance of the compensation decisions made with the compensation regulations for the Executive Committee and the Board of Directors, the Organizational Rules, and the Articles of Association.
The Committee may call in external compensation specialists to obtain independent advice and/or to get benchmarking compensation data. In the year under review, no external compensation specialists were mandated.
Method of determination of compensationThe elements and levels of the compensation of the Board of Directors and the Executive Committee are reviewed in principle every two to three years and are tailored to the relevant sectors and labor markets in which GF competes for talent. For the purpose of comparison, the Compensation Committee relies on compensation surveys published by independent consulting firms and on publicly available information, such as compensation disclosures from comparable companies. Comparable companies are defined as companies listed on the Swiss stock exchange (SIX) with similar size in terms of market capitalization, sales, number of employees, complexity and geographic scope, are headquartered in Switzerland and, if available, operate in similar business segments.
The Compensation Committee also takes into consideration the effective business and individual performance while determining the compensation amounts to be paid to the Chief Executive Officer and to the other members of the Executive Committee. Individual performance is assessed through the annual Management By Objectives (MBO) process, where individual objectives are defined at the beginning of the year and the achievement against those objectives is evaluated at the end of the year. The objective setting and the performance assessment of the members of the Executive Committee are conducted by the Chief Executive Officer and are approved by the Chairman of the Board. The Chairman of the Board determines the objectives and evaluates the performance of the Chief Executive Officer; the objectives and evaluation are approved by the full Board of Directors.

79 Compensation Report
Compensation structure
Compensation related Key Performance IndicatorsShort-term incentive planIn accordance with the long-term strategy 2020, the Board of Directors selected the following Key Performance Indicators (KPI) for the short-term incentive scheme:
Key Performance Indicator Rational / Driver
Organic sales growth Maximizing growth from within (innovations, improved services,
etc.)
EBIT margin Operating profitability Return on invested capital (ROIC) Efficiency at allocating the capital to profitable investments
Long-term incentive planIn order to align the interests of the Executive Committee with those of GF’s shareholders, the Board of Directors selected the following KPIs for the long-term incentive scheme:
Key Performance Indicator Rational / Driver
Earnings per Share (EPS) Internal measure
Reflects GF's profitabilityReflects how efficient the Strategy is implemented
Relative Total Shareholder Return (rTSR) External measureReflects GF's relative value compared to the SMI-Mid market
SMI-Mid Benchmark group
As there is no obvious peer group for GF given its diversified portfolio, the SMI-Mid has been selected as the benchmark group for comparability reasons.
Companies belonging to the SMI-Mid are broadly comparable in terms of organizational size, complexity and market capitalization; in addition, this index reflects best the economic environment for companies listed in Switzerland.
The benchmark group is subject to review for each strategic period for comparability reasons.
Each year the Compensation Committee has the responsibility to evaluate whether there are extraordinary, one-time events that have significantly influenced any of the key performance indicators and to make any adjustment recommendations to the Board of Directors as necessary. The explanations for such adjustments would be included in the Compensation Report in the relevant year. For 2018, no adjustments were necessary.
Compensation of the Board of DirectorsThe compensation regulation applicable to the Board of Directors is reviewed every two to three years based on competitive market practice and its basic structure is kept as constant as possible.
In order to guarantee the independence of the members of the Board of Directors in executing their supervisory duties, their compensation is fixed and does not contain any performance-related component. The annual overall compensation for each member of the Board of Directors depends on the responsibilities carried out in the year under review. The compensation is partially delivered in cash (fee) and in restricted shares.

80 Compensation Report
Compensation model 2018: Board of Directors
Responsibility Fee Restricted shares
Basis fee Board Membership CHF 70'000 150 shares
Additional fees Board Chairmanship CHF 200'000 150 sharesBoard Vice-Chairmanship CHF 22'500 Audit Committee Chairmanship CHF 80'000 Audit Committee Membership CHF 30'000 Other Committee Chairmanship CHF 40'000 Other Committee Membership CHF 20'000
Members of the Board receive a fixed fee and additional fees for special tasks such as vice-chairmanship of the Board, committee chairmanship or committee membership. The fees are paid in cash in January for the previous calendar year. Actual expenditures are reimbursed against receipts.
In addition, each member of the Board receives a fixed number of GF shares. The value of the share-related compensation is calculated based on the closing share price on the last trading day of the reporting year. Those shares are granted at the end of December and are blocked for a period of five years.
The compensation of the Board of Directors is subject to regular social security contributions and is not pensionable.
Compensation of the Executive CommitteeThe principles of compensation of the Executive Committee members, as described in the chapter Principles of compensation, are set out in a regulation and retain their validity for several years. They were last reviewed by the Compensation Committee in 2018.
The compensation of the Executive Committee includes the following elements:
– Fixed base salary in cash– Benefits such as pension and social insurance funds– Performance-related short-term incentive in cash – Share-based remuneration (long-term incentive)

81 Compensation Report
Compensation model 2018: Executive Committee (including CEO)
EBIT = Earnings before interest and taxesEPS = Earnings per sharePS = Performance sharesPS(EPS) = EPS dependent performance sharesPS(rTSR) = rTSR dependent performance sharesROIC = Return on invested capitalØ = Average
Fixed compensation elements
Variable compensation elements
Fixed base salary Benefits Short-term incentive
Performance year 2018 Long-term incentive
Performance year 2018Purpose Ensure basic fixed
remuneration Ensure protection against risks such as death, disability and old age
Pay for annual performance
Align to shareholders' interests Participate in long-term success and align with Strategy 2020
Drivers Scope and complexity of the functionProfile of the individual
Local legislation and market practice
Performance against business and individual objectives
Long-term value creation Supporting a high performance culture
Performance /Vesting period
Year 2018 3 yearsGrant date: 1 January year 2019Vesting period: years 2019, 2020, 2021
Blocking period Additional 2 yearsYears 2022, 2023
Performance measures Skills, experience and performance of the individual
Organic sales growthEBIT margin ROIC Individual objectives
All LTI-related shares are performance dependent;50% PS(EPS), 50% PS(rTSR)
EPS-related achievement determination:Ø (EPS value years 2019, 2020, 2021) divided byØ (EPS value years 2016, 2017, 2018) * 1.04
rTSR-related achievement determination:Ø (ranking in the years 2019, 2020, 2021 of GF within the SMI-Mid)
The performance measures will be amended for the LTI-Plan 2019. A detailed outline can be found in chapter Changes for the Business Year 2019.
Delivery Monthly cash Contributions to social security, pension, and insurances
Cash, one-off payment in March year 2019
Number of PS, of which50% PS(EPS), 50% PS(rTSR)
Subject to cap as defined in Articles of Association: The variable compensation (STI and LTI) is capped at 250 % of the fixed compensation for the calendar year in question
Fixed base salaryThe fixed base salary is determined primarily based on the following factors:
– Scope and complexity of the role, as well as the skills required to perform the function;– Skills, experience and performance of the individual in the function;– External market value of the function.
Fixed base salaries of the Executive Committee members are reviewed every year based on those factors and adjustments are made according to market developments.

82 Compensation Report
Short-term incentiveThe short-term incentive is a variable incentive designed to reward the achievement of business objectives of the Corporation and its divisions, as well as the fulfillment of individual performance objectives as defined within the MBO process, over a time horizon of one year.
The business objectives are set by the Board of Directors in accordance with the published mid-term strategy goals. They include absolute financial figures and are set for a period of several years in order to ensure sustainable and long-term performance. The business objectives are: organic sales growth (excluding acquisitions and divestitures), EBIT margin (EBIT in relation to sales), and Return on Invested Capital (ROIC). The following rules apply:
– The short-term incentives are expressed as a target in % of annual fixed base salary;– The maximum short-term incentive amounts to 150% of the target short-term incentive;– The achievement for each objective is capped at 150%;– The highest weight is on the organization the executive is responsible for;– These challenging weights, hurdles, and targets are defined on a divisional level to reflect the difference
in businesses.
For each objective, the Board of Directors sets a target level and a threshold level (hurdle) of achievement under which there is no payout. While the hurdles and the targets are valid for a period of several years, the achievement against those is measured on a yearly basis and leads to a payout factor for this portion of the variable incentive. The hurdle for the ROIC is set at a level clearly over the weighted average cost of capital (WACC) of the Corporation in order to maximize value creation.
The individual objectives are set within the MBO process at the beginning of the year. These objectives are clearly measurable, not duplicating the financial targets, and are set in three different categories:
– Non-financial strategic goals: such as, for example in 2018, the portfolio adaptation at GF Casting Solutions;
– Operational: such as, for example, the implementation of strategic topics like digitalization, launching of corporate training initiatives, acquisitions and divestments, large reorganizations;
– Environment – Social - Governance (ESG): for each individual Executive Committee member, at least one objective annually;
– Personal: such as, for example, personal improvements and/or trainings, succession planning.
Among the MBO-related objectives, at least one is related to Sustainability (for example ensuring 0% accident rate).
At the end of the year, the achievement against each individual objective is assessed and leads to a payout factor for this portion of the variable short-term incentive.
The short-term incentive plan regulation includes the provision of forfeiture in case of dismissal based on fraud.
Short-term incentive in % of annual fixed base salaryThe target short-term incentive amounts to 100% of the annual fixed base salary for the Chief Executive Officer and to 60% of the annual fixed base salary for the other members of the Executive Committee. Short-term incentive payouts are capped at 150% of target level.
Target Minimum MaximumCEO 100% 0% 150%Executive Committee 60% 0% 90%
The weighting of the business and individual objectives for the Chief Executive Officer and the other Executive Committee members is described in the following table:

83 Compensation Report
Weighting of the business and individual objectives (target level of performance/payout factor)
CEO Head Division Staff functions
Business objectives Corporation level Organic sales growth (20%) 15% 5% 15%EBIT margin (40%) 30% 10% 30%ROIC (40%) 30% 10% 30%
Division level Organic sales growth (20%) 10% EBIT margin (40%) 20% ROIC (40%) 20%
Individual objectives MBO 25% 25% 25%
Total 100% 100% 100%
Thresholds and targets for the corporate business objectives
1 Achievements below the hurdle result in zero payout for the respective business objective; for the objectives EBIT margin and ROIC, hurdle achievements result in 50% payout for the respective target
Business objectives Hurdle 1 Strategy targets
2016–2020Organic sales growth (at constant currencies) 1% 3–5%EBIT margin 6% 8–9%ROIC 14% 18–22%
Long-term incentive (share-based remuneration) GF introduced as per 1 January 2017 a new long-term, performance-based plan, the so-called Long-Term Incentive Plan (LTI-Plan) which has been proposed by the Compensation Committee and approved by the Board of Directors.
The metrics of the LTI-Plan have been designed to fit with GF’s Strategy targets, focusing on long-term sustainable value creation for employees, company, customers, and shareholders.
The Board of Directors decided to amend the LTI-Plan structure for the LTI-Plan 2019. Details to can be found in the chapter Changes for the business year 2019.
The CEO and members of the Executive Committee are granted performance shares (PS). The vesting of the PS is subject to meeting two specific performance achievements over prospective three years, followed by a two-year blocking period. The incentive is based on two Key Performance Indicators, Earnings per Share (EPS) and relative Total Shareholder Return (rTSR), both measured in relation to defined benchmarks, in order to:
– Align the interests with those of GF’s shareholders;– Allow to participate in the long-term success of GF;– Foster and support a high-performance culture.

84 Compensation Report
The initial grant is expressed as a number of shares for the CEO and for members of the Executive Committee, based on the length of employment in the year prior to the grant.
The number of granted shares is split as follows:
– 50% EPS dependent performance shares PS(EPS);– 50% rTSR dependent performance shares PS(rTSR).
Performance shares
PS(EPS)EPS - Performance
shares
PS(rTSR)rTSR - Performance
shares
Totalnumber
of shares
CEO Grant: 375
Vesting: 0% - 200% Grant: 375
Vesting: 0% - 200% Grant: 750
Vesting: 0% - 200%
Executive Committee Grant: 125
Vesting: 0% - 200% Grant: 125
Vesting: 0% - 200% Grant: 250
Vesting: 0% - 200%
General vesting provisionsBoth KPIs, EPS and rTSR, are measured individually; hence, the vesting of the PS(EPS) cannot be compensated by the vesting of PS(rTSR) and vice-versa.
The shares of the share-based compensation program either are treasury shares or are repurchased on the market. No issuance of shares is foreseen for the LTI-plan in order to avoid shareholder dilution.
Share buybacks, major acquisitions/divestitures or capital increases will be neutralized and will have no impact on the EPS value. The Compensation Committee is responsible for evaluating each year if extraordinary, one-time events have significantly influenced any of the KPIs, EPS and rTSR, and, if so, to make adjustment recommendations to the Board of Directors. The explanations for such adjustments, if any, will be included in the Compensation Report of the relevant year.
In case of dismissal by GF due to cause, the vested shares will remain blocked until the end of the respective blocking periods; the unvested PS as well as the grant for the year the employment ends will forfeit.
Vesting of the PS(EPS) for the LTI-Plan 2018 Vesting of the PS(EPS) for the LTI-Plan 2019 can be found in Chapter Changes for the Business Year 2019.
For the year 2018, the PS are granted on 1 January 2019. The grant value of the shares is based on the closing share price on the last trading day of 2018. The vesting of the PS is subject to meeting the following performance criteria:
The Key Performance Indicator (KPI) for the EPS-related performance shares for the LTI-Plan year 2018 is defined as follows:
The factor 1.04 reflects the average of the growth rate of 3% to 5% outlined in the GF Strategy 2020.
The vesting conditions are as follows:
– If KPI(EPS) = 100%, 100% of the granted PS(EPS) will vest at the vesting date;– If KPI(EPS) = 125%, 150% of the granted PS(EPS) will vest at the vesting date;– If KPI(EPS) = 150%, 200% of the granted PS(EPS) will vest at the vesting date (cap);– If KPI(EPS) = 70%, 50% of the granted PS(EPS) will vest at the vesting date (threshold);– If KPI(EPS) < 70%,all granted PS(EPS) will forfeit (threshold;– For values in between the calculation is linear.

85 Compensation Report
After the vesting period of three years, the PS will be blocked for two years (blocking period).
The vesting date of the granted PS(EPS) is defined as the day three years after the grant date and five working days after the official disclosure of the EPS value of the relevant last business year.
Vesting of the PS(rTSR) for the LTI-Plan 2018Vesting of the PS(rTSR) for the LTI-Plan 2019 can be found in Chapter Changes for the Business Year 2019.
TSR is measured with a starting value of the Volume Weighted Average Share price (VWAP) over the first 30 trading days of the year and an ending value of the VWAP over the last 30 trading days of the year. Relativity is measured against the SMI-Mid group of companies (benchmark group).
The ranking is evaluated on an annual basis. At the end of the vesting period, the final ranking of GF amongst the benchmark group results from the average annual rankings over the three-year vesting period.
The vesting conditions are as follows:
– Ranking at the median of the benchmark group leads to 100% vesting of the granted PS(rTSR);– Ranking as number 1 within the benchmark group leads to 200% vesting of the granted PS(rTSR);– Ranking at the lower end of the 2nd quartile of the benchmark group leads to 50% vesting of the granted
PS(rTSR);– Ranking in the 1st quartile of the benchmark group leads to a forfeiting of the granted PS(rTSR);– For results in between the calculation is linear.

86 Compensation Report
The vesting date of the granted PS(rTSR) is coincidental with the vesting date of the granted PS(EPS).
BenefitsBenefits consist primarily of retirement and insurance plans that are designed to provide reasonable retirement remuneration as well as a reasonable level of protection against risks such as death and disability. All members of the Executive Committee have a Swiss employment contract and participate in the pension fund of GF offered to all Swiss-based employees, in which only the fixed base salary is insured. The pension fund exceeds the minimum legal requirement of the Swiss Federal Law on Occupational Retirement, Survivors and Disability Pension Plans (BVG) and is in line with commensurate market practice. For top-management positions, including the members of the Executive Committee, an early retirement plan is in place. The plan is entirely financed by the employer and is administered by a Swiss foundation. Beneficiaries may opt for early retirement from the age of 60, if they are enrolled with the Swiss Social Security and have been employed by GF at least for ten years. Ordinary retirement is at age 65.
Members of the Executive Management do not receive special benefits. They are entitled to a representation lump-sum allowance and to reimbursement of business expenses in accordance to the expense rules applicable to all employees at management levels employed in Switzerland. The expense regulation has been approved by the relevant cantonal tax authorities.
Contractual termsThe contractual agreements with the Chief Executive Officer and the Executive Committee members foresee a notice period of maximum twelve months. There are no entitlements to severance payments.

87 Compensation Report
Remuneration for the 2018 business year
Board of DirectorsThe members of the Board of Directors received cash compensation of CHF 1.159 million in the year under review. In addition, a total of 1’500 GF registered shares with a total market value of CHF 1.18 million were allocated as share-related compensation. In the previous year, and due to the cap of the total remuneration of the Board of Directors approved by the shareholders in 2016 for 2017, the allocation had been 1’390 GF registered shares only, equivalent to a total market value of CHF 1.79 million. Together with other benefits, the total compensation paid to the Board of Directors in 2018 amounted to CHF 2.449 million (previous year: CHF 3.085 million) compared to a total amount approved by the shareholders of CHF 3.750 million.
The detailed disclosure of compensation to the Board of Directors is as follows:
Compensation of the members of the Board of Directors 2018
(all in CHF 1'000, except column "Number of shares")1 The cash compensation includes reimbursements for international travel amounting to CHF 45'000.2 The share-based compensation consists in the allocation of a fixed number of shares. The amount of the share-related compensation is calculated based
on the full value of the shares at the year-end price of CHF 786.50 on 31 December 2018.3 Social insurance funds represent employer contributions to social insurance funds.4 The total compensation encompasses the cash compensation, the share-based compensation, and the contribution to social insurance funds.
Compensation Social
insurance
funds 3
Total compen-
sation
2018 4
Total compen-
sation
2017 4
Cash
compensation 1 Number of
shares
Share-based
compensation 2
Andreas Koopmann 270 300 236 22 528 655
Chairman Board of Directors Chairman Nomination Committee
Hubert Achermann 150 150 118 11 279 343
Chairman Audit Committee
Gerold Bührer 123 150 118 10 251 314
Vice Chairman Board of Directors Member Audit Committee
Roman Boutellier 90 150 118 8 216 286
Member Nomination Committee Riet Cadonau 90 150 118 11 219 276
Member Compensation Committee
Roger Michaelis 123 150 118 13 254 317
Member Audit Committee
Eveline Saupper 110 150 118 12 240 304
Chairwoman Compensation Committee
Jasmin Staiblin 90 150 118 11 219 283
Member Compensation Committee
Zhiqiang Zhang 113 150 118 12 243 307
Member Nomination Committee
Total 1'159 1'500 1'180 110 2'449 3'085

88 Compensation Report
The compensation paid to the Board of Directors for the year 2018 was below that of the previous year. The decrease is explained solely by the decreased value of the shares from CHF 1’288 in 2017 to CHF 786.50 in 2018. The compensation system for the Board of Directors remained unchanged.
In the year under review both Mr. Roger Michaelis and Mr. Zhiqiang Zhang received each CHF 22’500 for international travel time spent; these reimbursements are included in the cash compensation.
No further compensation was paid to members of the Board of Directors. No compensation was paid to parties closely related to members of the Board of Directors.
Executive CommitteeThe members of the Executive Committee received cash, share-related compensation, social security and pension contributions amounting to CHF 8.417 million for the year under review (previous year: CHF 9.123 million) compared to a total amount of CHF 10.298 million approved by the shareholders at the Annual Shareholders’ Meeting of 19 April 2017.
Under the long-term incentive plan, 1’752 performance shares with a total value at grant of CHF 1.378 million, based on a share price of CHF 786.50 at year-end 2018, were granted to members of the Executive Committee for the year under review (previous year: 1’750 performance shares with a total value of CHF 2.254 million).
The detailed disclosure of compensation to the Executive Committee in accordance with the Swiss “Ordinance against excessive pay in stock exchange listed companies” is as follows:
Compensation of the members of the Executive Committee 2018
(all in CHF 1'000, except rows "EPS dependent performance shares" and "rTSR dependent performance shares")* The Executive Compensation includes the compensation for Josef Edbauer (Executive Committee member until 31 August 2018) and includes the
compensation for Carlos Vasto (Executive Committee member since 1 September 2018).1 The short-term incentive is based on the short-term incentive plan. The amount is determined by the fulfillment of personal performance objectives and
by the financial results of the divisions and the Corporation. The short-term incentive for the 2018 financial year was approved by the Board of Directors on 21 February 2019. Payment will be made in March 2019.
2 The share-based remuneration is based on the long-term incentive plan: Each year, fixed numbers of performance shares (PS) are allocated. The amount of the PS-based compensation is calculated based on the grant value of the PS at the year-end price of CHF 786.50 on 31 December 2018. The number of PS vesting after the vesting period of three years depends on meeting the respective performance criteria.
3 The social insurance funds expenses represent employer contributions to social security.4 The pension funds expenses represent employer contributions to pension funds.5 The total compensation is comprised of the fixed salary, the short-term incentive, the share-based remuneration, and the social and pension
contributions.
Fixed salary in
cash
Short-term
incentive
in cash 1
EPS dependent
performance shares
PS(EPS)
rTSR dependent
performance shares
PS(rTSR)
Share-based
remune-
ration 2
Social insu-rance
funds 3
Pension
funds 4
Total com-pen-
sation
2018 5
Total compen-
sation 2017
Executive Committee * 3'003 2'797 876 876 1'378 375 864 8'417 9'123
Of whom Yves Serra, CEO (highest individual compensation) 950 1'247 375 375 590 132 278 3'197 3'471

89 Compensation Report
Total compensation for the Chief Executive Officer and the other members of the Executive Committee in 2018 was lower than in 2017, mainly due to the lower share price. The change in compensation is explained by the following factors:
– The Executive Committee compensation includes the compensation for Josef Edbauer (Executive Committee member until 31 August 2018) and includes the compensation for Carlos Vasto (Executive Committee member since 1 September 2018).
– The share price decreased from CHF 1’288 in 2017 to CHF 786.50 in 2018.– The short-term incentive related to the financial results of the Corporation and the divisions and to the
individual performance was higher than in 2017, based on the results achieved. Consequently, the overall short-term incentive percentage ranges from 56.3% to 83.1% of the base salary for the Executive Committee members and amounts to 131.3% of the base salary for the Chief Executive Officer.
– The fixed salaries were slightly adjusted in order to keep competitive levels in line with the market practice of GF’s industrial sector.
– The employer’s contributions to social security have increased due to the slightly increased fixed salaries and the higher short-term incentive payout. Please note that a significant portion of the social security payments of the employer to the Swiss social security system represents a solidarity payment as the individuals will never get any return or benefit due to these payments.
Achievement of the corporate business objectivesThe achievement of the corporate business objectives for the year 2018 is as follows:
1 Achievements below the hurdle result in zero payout for the respective business objective; for the objectives EBIT margin and ROIC, hurdle achievements result in 50% payout for the respective target
Business objectives Hurdle 1
Strategy targets
2016–2020 Result
2018
Organic sales growth (at constant currencies) 1% 3–5% 6.5%
EBIT margin 6% 8–9% 8.4%
ROIC 14% 18–22% 22.4%
For a former Executive Committee member who continued his employment as non-Executive Committee member, a compensation amounting to CHF 471’655 was paid for the year 2018.
In the year under review, no further compensation was paid to former members of the Executive Committee. No compensation was paid to parties closely related to members of the Executive Committee.

90 Compensation Report
Shareholding ownership guidelineThe Board of Directors approved the implementation of a shareholding ownership guideline as per 1 January 2017, as follows:
– Members of the Board are required to hold 200% of the basis fee in GF shares. – The CEO is required to hold 200% of the fixed base salary in GF shares.– Members of the Executive Committee are required to hold 100% of the fixed base salary in GF shares.– Newly appointed members shall build up the required ownership within five years of their appointment.
In the event of a substantial rise or drop in the share price, the Board of Directors may, at its discretion, amend that time period accordingly.
To calculate whether the minimum holding requirement is met, all vested shares are considered regardless of whether they are blocked or not. However, unvested PS are excluded. The Compensation Committee reviews compliance with the share ownership guideline on an annual basis.
Shareholdings of the members of the Board of Directors and of the Executive CommitteeThe information on shareholdings of the members of the Board of Directors and of the Executive Committee is included in the notes 6 Compensation and shareholdings of GF Ltd.
Loans to members of governing bodiesNeither GF Ltd nor its Corporate Companies granted any guarantees, loans, advances, or credit facilities to members of the Board of Directors or the Executive Committee or related parties in the year under review. As of 31 December 2018, no loans were outstanding.

91 Compensation Report
Changes for the Business Year 2019
LTI-Plan design changes as of 1 January 2019Based on the input seeked from numerous shareholders and proxy advisors after the approval of the 2017 Compensation report, the Board of Directors amended the LTI-Plan effective for the performance year 2019.
The LTI-Plan 2019 rules can be summarized as follows:
– The entirety of the award will remain to be granted as performance shares. The vesting of the performance shares is conditional upon the fulfillment of future performance conditions.
– The performance conditions include for 50% Earnings per Share (EPS) as internal measure and for 50% relative Total Shareholder Return (rTSR) as external measure. Therefore, the performance criteria are well balanced in terms of both internal and external views.
– The EPS value targets are aligned with the ambitious Strategy 2020 goals of GF.– The rTSR targets are linked to the SMI-Mid and focuses on performance at and above median; hence
there will be no payout below median performance.– The vesting period is three years, followed by a further blocking period of two years on the vested
shares. The plan is truly long-term performance focused.
Summary LTI-Plan 2019: KPI(EPS)
EPS = Earnings per shareØ = Average
KPI (EPS) Ø (EPS value years x+1, x+2, x+3) divided by
Ø (EPS value years x, x-1, x-2) * 1.2
100% payout 20% EPS growth over 3 years 150% payout 30% EPS growth over 3 years 200% payout 38% EPS growth over 3 years 50% payout 0% EPS growth over 3 years 0% payout EPS decline over 3 years
PS(EPS) payout curve for the LTI-Plan 2019

92 Compensation Report
Summary LTI-Plan 2019: KPI(rTSR)
KPI (rTSR) Average annual ranking within the benchmark group over prospective 3 yearsBenchmark group SMI - Mid100% payout Ranking at the median200% payout Ranking at the top0% payout No pay-out if ranking below median
PS(rTSR) payout curve for the LTI-Plan 2019

93 Compensation Report
Report of the statutory auditor to the Annual Shareholders’ Meeting of Georg Fischer Ltd, Schaffhausen
We have audited the content marked as “audited by PwC Switzerland” of the compensation report of Georg Fischer Ltd for the year ended 31 December 2018.
Board of Directors’ responsibilityThe Board of Directors is responsible for the preparation and overall fair presentation of the compensation report in accordance with Swiss law and the Ordinance against Excessive Compensation in Stock Exchange Listed Companies (Ordinance). The Board of Directors is also responsible for designing the compensation system and defining individual compensation packages.
Auditor’s responsibilityOur responsibility is to express an opinion on the accompanying compensation report. We conducted our audit in accordance with Swiss Auditing Standards. Those standards require that we comply with ethical requirements and plan and perform the audit to obtain reasonable assurance about whether the compensation report complies with Swiss law and articles 14–16 of the Ordinance.
An audit involves performing procedures to obtain audit evidence on the disclosures made in the compensation report with regard to compensation, loans and credits in accordance with articles 14–16 of the Ordinance. The procedures selected depend on the auditor’s judgment, including the assessment of the risks of material misstatements in the compensation report, whether due to fraud or error. This audit also includes evaluating the reasonableness of the methods applied to value components of compensation, as well as assessing the overall presentation of the compensation report.
We believe that the audit evidence we have obtained is sufficient and appropriate to provide a basis for our opinion.
OpinionIn our opinion, the compensation report of Georg Fischer AG for the year ended 31 December 2018 complies with Swiss law and articles 14–16 of the Ordinance.
PricewaterhouseCoopers Ltd
Stefan RäbsamenAudit expertAuditor in charge
Diego J. AlvarezAudit expert
Zurich, 21 February 2019

4

Financial Report 2018
Consolidated financial statements
96 Consolidated income statement97 Consolidated balance sheet98 Consolidated statement of changes in equity99 Consolidated cash flow statement
100 Notes to the consolidated financial statements100 Information to the report102 1. Performance108 2. Operating assets and liabilities117 3. Capital and financial risk management127 4. Corporate structure134 5. Other information137 Report of the statutory auditor
Financial statements Georg Fischer Ltd
142 Income statement143 Balance sheet144 Statement of changes in equity145 Notes to the financial statements152 Proposal by the Board of Directors153 Report of the statutory auditor
Key figures
156 Five-year overview of the Corporation
95

96 Consolidated financial statements
Consolidated income statement
For the years ended 31 December 2018 and 2017, CHF million Notes 2018 % 2017 %
Sales (1.2.1) 4'572 100 4'150 100
Other operating income (1.2.2) 56 43 Income 4'628 101 4'193 101
Cost of materials and products –2'255 –1'991 Changes in inventory of unfinished and finished goods 71 37 Operating expenses (1.3.1) –776 –700 Gross value added 1'668 36 1'539 37
Personnel expenses (1.3.2) –1'139 –1'048 Depreciation on tangible fixed assets (2.4) –142 –131 Amortization on intangible assets (2.5) –5 –8 Operating result (EBIT) 382 8.4 352 8.5
Interest income (3.2) 2 2 Interest expense (3.2) –31 –28 Other financial result (3.2) –6 –5 Ordinary result 347 8 321 8
Non-operating result 1 1 Extraordinary result Profit before taxes 348 8 322 8
Income taxes (1.4) –69 –64 Net profit 279 6 258 6– Thereof attributable to shareholders of Georg Fischer Ltd 281 252 – Thereof attributable to non-controlling interests –2 6
Basic earnings per share in CHF (1.5) 69 62 Diluted earnings per share in CHF (1.5) 69 62

97 Consolidated financial statements
Consolidated balance sheet
As of 31 December 2018 and 2017, CHF million Notes 2018 % 2017 %
Cash and cash equivalents 533 624 Marketable securities (2.3.2) 9 9 Trade accounts receivable (2.1.1) 697 754 Inventories (2.2) 779 773 Income taxes receivable (2.1.2) 11 9 Other accounts receivable (2.1.3) 62 62 Prepayments to creditors 22 30 Accrued income 15 16 Current assets 2'128 62 2'277 63
Property, plant, and equipment for own use (2.4) 1'046 1'170 Investment properties (2.4) 84 36 Intangible assets (2.5) 34 29 Deferred tax assets (5.3) 53 85 Other financial assets (5.2) 99 13 Non-current assets 1'316 38 1'333 37
Assets 3'444 100 3'610 100
Trade accounts payable 498 593 Bonds (3.1.1) 150 Other financial liabilities (3.1.1) 144 147 Loans from pension fund institutions (3.1.1, 5.1) 4 28 Other liabilities (2.3.1, 2.3.2) 56 69 Prepayments from customers 74 65 Current tax liabilities 57 63 Provisions (2.6.1) 38 45 Accrued liabilities and deferred income (2.6.2) 253 258 Current liabilities 1'124 33 1'418 39
Bonds (3.1.1) 574 374 Other financial liabilities (3.1.1) 58 117 Pension benefit obligations (5.1) 47 127 Other liabilities (2.3.1) 39 38 Provisions (2.6.1) 111 120 Deferred tax liabilities (5.3) 63 47 Non-current liabilities 892 26 823 23
Liabilities 2'016 59 2'241 62
Share capital (3.4) 4 4 Capital reserves 26 26 Treasury shares (3.5) –9 –8 Retained earnings 1'361 1'295 Equity attributable to shareholders of Georg Fischer Ltd 1'382 40 1'317 37
Non-controlling interests 46 1 52 1Equity (3.4) 1'428 41 1'369 38
Liabilities and equity 3'444 100 3'610 100

98 Consolidated financial statements
Consolidated statement of changes in equity
For the years ended 31 December 2018 and 2017, CHF million Notes
Sharecapital
Capitalreserves
Trea-sury
shares Goodwill
offset
Cum-ulativetrans-lation
adjust-ments
Cashflow
hedging
Otherretainedearnings
Re-tained
earnings
Equityattribut-
ableto
share-holders
of Georg
Fischer Ltd
Non-con-
trollinginterests Equity
Balance as of 31 December 2018 4 26 –9 –537 –97 –3 1'998 1'361 1'382 46 1'428 Net profit 281 281 281 –2 279Translation adjustments recognizedin the reporting period –57 –57 –57 –1 –58Changes in cash flow hedges (2.3.2, 2.3.3) 10 10 10 10Goodwill offset via equity (2.5, 4.1.2) –73 –73 –73 –73Capital increase/acquisition of non-controlling interests (4.1.2) 4 4Purchase of treasury shares (3.5) –12 –12 –12Disposal of treasury shares (3.5) 3 3 3Share-based compensation – Transfers (3.5, 4.3.2) 8 –8 –8 – Granted (3.5, 4.3.2) 7 7 7 7Dividends (3.4) –94 –94 –94 –7 –101Balance as of 31 December 2017 4 26 –8 –464 –40 –13 1'812 1'295 1'317 52 1'369 Net profit 252 252 252 6 258Translation adjustments recognizedin the reporting period 44 44 44 1 45Changes in cash flow hedges (2.3.2, 2.3.3) 2 2 2 2Goodwill offset via equity (2.5, 4.1.2) –63 –63 –63 –63Capital increase/acquisition of non-controlling interests 8 8Purchase of treasury shares (3.5) –18 –18 –18Disposal of treasury shares (3.5) 1 14 15 15Share-based compensation – Transfers (3.5, 4.3.2) 1 6 –7 –7 – Granted (3.5, 4.3.2) 11 11 11 11Dividends (3.4) –82 –82 –82 –7 –89Balance as of 31 December 2016 4 24 –10 –401 –84 –15 1'638 1'138 1'156 44 1'200

99 Consolidated financial statements
Consolidated cash flow statement
1 Cash, postal and bank accounts: CHF 504 million (previous year: CHF 592 million), fixed-term deposits: CHF 29 million (previous year: CHF 32 million).
For the years ended 31 December 2018 and 2017, CHF million Notes 2018 2017 Net profit 279 258Income taxes (1.4) 69 64Financial result (3.2) 35 31Depreciation and amortization (2.4, 2.5) 147 139Other non-cash income and expenses –11 –2Increase in provisions, net (2.6.1) 29 30Use of provisions (2.6.1) –27 –22Changes in – Inventories –46 –71– Trade accounts receivable –55 –56– Prepayments to creditors 6 –10– Other receivables and accrued income –4 2– Trade accounts payable 10 94– Prepayments from customers 8 13– Other liabilities and accrued liabilities and deferred income 36 22Interest paid –21 –25Income taxes paid –58 –57Cash flow from operating activities 397 410 Additions to – Property, plant, and equipment (2.4) –234 –207– Intangible assets (2.5) –10 –4– Other financial assets –16 –5Disposals of – Property, plant, and equipment (2.4) 7 4– Other financial assets 3 2Purchase/disposal of marketable securities –3 2Cash flow from acquisitions (4.1.2) –154 –74Interest received 3 2Cash flow from investing activities –404 –280 Free cash flow –7 130 Purchase of treasury shares –12 –18Disposal of treasury shares 3 15Dividend payments to shareholders of Georg Fischer Ltd –94 –82Dividend payments to non-controlling interests –7 –7Inflows from or outflows for shares from non-controlling interests 4 7Issuance of bonds (3.1.1) 200 Repayment of bonds (3.1.1) –150 Issuance of long-term financial liabilities (3.1.1) 2 21Repayment of long-term financial liabilities (3.1.1) –15 –15Changes in short-term financial liabilities 4 –1Cash flow from financing activities –65 –80 Translation adjustment on cash and cash equivalents –19 3Net cash flow –91 53 Cash and cash equivalents at beginning of year 624 571
Cash and cash equivalents at year-end 1 533 624

100 Consolidated financial statements
Notes to the consolidated financial statements
Information to the report
This section explains the basis for the preparation of the consolidated financial statements and provides a summary of the main general accounting principles as well as management assumptions and estimates.
About this reportThe consolidated financial statements of Georg Fischer Ltd (“GF”) have been prepared in accordance with all of the current guidelines of Swiss GAAP FER (Swiss Generally Accepted Accounting Principles Accounting and Reporting Recommendations) and, furthermore, with the provisions of the Listing Rules of SIX Swiss Exchange and with Swiss company law. The consolidated financial statements are based on the financial statements of the GF Corporate Companies for the year ended 31 December, prepared in accordance with uniform corporate accounting principles.
Accounting policies The consolidated financial statements have been prepared in accordance with the historical cost method with the exception of marketable securities, participations under 20%, and derivative financial instruments, which are measured at fair value. The preparation of the consolidated financial statements requires management to make estimates and assumptions that affect the reported amounts of revenues, expenses, assets, liabilities, and contingent liabilities at the balance sheet date. If in the future such estimates and assumptions, which are based on management’s best judgment at the balance sheet date, deviate from the actual circumstances, the original estimates and assumptions will be modified as appropriate in the year in which the circumstances change.
Changes in accounting principles In the year under review the Swiss GAAP FER accounting principles remained unchanged.
Scope and principles of consolidation The scope of consolidation includes GF and all GF Corporate Companies which GF controls directly or indirectly by either holding more than 50% of the voting rights or by otherwise having the power to control their operating and financial policies (with GF and these GF Corporate Companies also referred to as the Corporation). These GF Corporate Companies are fully consolidated; assets, liabilities, income, and expenses are incorporated in the consolidated financial statements. Intercompany balances and transactions are eliminated upon consolidation. Non-controlling interests are presented as a component of consolidated equity in the consolidated balance sheet and consolidated net income in the consolidated income statement. Gains arising from intercompany transactions are eliminated in full. Capital consolidation is based on the purchase method, whereby the acquisition cost of a GF Corporate Company is eliminated at the time of acquisition against the fair value of net assets acquired with the remainder recorded as goodwill that is subsequently offset within equity of the Corporation.
Joint ventures in which the GF Corporation exercises joint control together with a joint venture partner are proportionately consolidated.
Companies in which GF has a non-controlling interest of at least 20% but less than 50%, or over which it otherwise has significant influence, are accounted for using the equity method and included in the consolidated financial statements as investments in associates. Investments with less than 20% voting rights are accounted for at fair value and presented under other financial assets.
Foreign currencies GF Corporate Companies prepare their financial statements in their functional currency. Assets and liabilities held in other currencies are translated at the spot rate on the balance sheet date. Foreign exchange gains and losses resulting from transactions and from the conversion of balance sheet items into the functional currency are reported in the income statement.

101 Consolidated financial statements
The consolidated financial statements are prepared and presented in Swiss francs. For consolidation purposes, the financial statements of the GF Corporate Companies that report in another currency than Swiss francs are translated into Swiss francs as follows: balance sheets at year-end rates, income and cash flow statements at average rates for the year under review. Any translation differences resulting from the different translation of the balance sheets and income statements or from the translation of corporate loans with equity character denominated in foreign currencies are recognized in equity, including deferred tax. Upon the divestment of a foreign GF Corporate Company, the related cumulative exchange differences are recycled to the income statement.
Other evaluation principlesOther relevant valuation principles, if relevant for the understanding of the valuation of the respective asset or liability, are reflected in the notes.
Management assumptions and estimatesThe preparation of the consolidated financial statements requires management to make estimates and assumptions that could materially affect the financial position of the Corporation. The management of GF has identified following assumptions and estimates to be of special relevance to the presentation of the consolidated financial statements:
Management assumptions and estimates NotesIncome taxes 1.4Impairment of non-current assets 2.4Impairment of intangible assets 2.5Provisions for warranties and onerous contracts 2.6
Key figures not defined by Swiss GAAP FER The subtotal “Gross value added” includes all operating income less cost of materials and products, changes in inventory, and operating expenses. As the subtotal “Gross value added” is an important key figure to GF, it is reported separately in the income statement.
The EBITDA corresponds to the operating result (EBIT) before depreciation on tangible fixed assets and amortization on intangible assets. For GF, the EBITDA is an important operational key figure, which, on the one hand, displays a harmonization to the cash flow from operating activities, and, on the other hand, is used as a reference for multiples.
“Free cash flow” consists of cash flow from operating activities together with cash flow from investing activities and is reported separately in the cash flow statement. “Free cash flow” is not only an important performance indicator for GF but is also a generally accepted and widely used performance figure in the financial sector.

102 Consolidated financial statements
1. Performance
This section includes the segment results, which are reported on the same basis as GF’s internal management structure. It also provides details on selected income and expense items and shows the earnings per share for the period.
1.1 Segment information Segment information
1 Order intake and orders on hand at year-end were not in scope of the audit by the statutory auditor.2 Sales between other divisions are not material.3 The amount of investments in associates accounted for by the equity method is not material.
GF
Piping Systems GF
Casting Solutions GF
Machining Solutions Total
segmentsCHF million 2018 2017 2018 2017 2018 2017 2018 2017 Order intake 1 1'865 1'718 1'617 1'527 1'042 1'030 4'524 4'275
Orders on hand at year-end 1 134 107 289 439 200 227 623 773 Sales 2 1'821 1'678 1'687 1'482 1'066 992 4'574 4'152 Sales by region Europe 631 579 1'380 1'227 484 442 2'495 2'248– Thereof Germany 165 151 792 749 160 146 1'117 1'046– Thereof Switzerland 110 111 25 3 70 59 205 173– Thereof Austria 26 23 59 52 15 19 100 94– Thereof Rest of Europe 330 294 504 423 239 218 1'073 935Americas 427 363 61 42 214 187 702 592Asia 590 553 226 197 315 311 1'131 1'061– Thereof China 457 436 216 196 142 186 815 818Rest of world 173 183 20 16 53 52 246 251Sales 1'821 1'678 1'687 1'482 1'066 992 4'574 4'152 EBITDA 269 245 160 158 102 96 531 499 Depreciation on tangible fixed assets –50 –50 –73 –65 –12 –12 –135 –127Amortization on intangible assets –2 –6 –1 –2 –2 –5 –8Operating result (EBIT) 217 189 86 93 88 82 391 364 Assets 3 1'417 1'404 1'023 1'304 763 758 3'203 3'466– Thereof current assets 865 868 417 465 552 560 1'834 1'893– Thereof non-current assets 552 536 606 839 211 198 1'369 1'573 Investments by region Europe 35 23 51 44 19 14 105 81– Thereof Germany 2 3 16 22 1 19 25– Thereof Switzerland 24 13 3 16 11 43 24– Thereof Austria 4 5 25 22 29 27– Thereof Rest of Europe 5 2 7 2 3 14 5Americas 15 11 35 48 2 1 52 60Asia 14 14 7 11 11 2 32 27– Thereof China 12 10 7 11 10 1 29 22Rest of world 4 4 4 4Investments 68 52 93 103 32 17 193 172– Thereof capital expenditures 65 50 92 102 26 16 183 168– Thereof investments in intangible assets 3 2 1 1 6 1 10 4 Liabilities 754 759 647 910 498 502 1'899 2'171– Thereof current liabilities 439 443 288 459 313 305 1'040 1'207– Thereof non-current liabilities 315 316 359 451 185 197 859 964 Research and development 47 43 22 19 58 50 127 112

103 Consolidated financial statements
Reconciliation to the segment information
CHF million 2018 2017 Sales Sales of reportable segments 4'574 4'152Elimination of intercompany sales –2 –2Consolidated sales 4'572 4'150 Operating result (EBIT) Total EBIT for reportable segments 391 364Total EBIT Corporate Center and Corporate Services –9 –12Consolidated operating result (EBIT) 382 352 Interest income 2 2Interest expense –31 –28Other financial result –6 –5Ordinary result 347 321 Non-operating result 1 1Extraordinary result Profit before taxes 348 322 Income taxes –69 –64Net profit 279 258 Assets Assets of reportable segments 3'203 3'466Elimination of intercompany positions –353 –454Other assets – Current assets (mainly cash and cash equivalents) 320 413– Non-current assets 274 186Other unallocated amounts –1Consolidated assets 3'444 3'610 Investments Investments of reportable segments 193 172Other investments – Germany 6 4– Switzerland 45 35– Rest of Europe 4 Investments of Corporation 248 211 Liabilities Liabilities of reportable segments 1'899 2'171Elimination of intercompany positions –613 –666Other liabilities – Current liabilities 94 227– Non-current liabilities 613 481Other unallocated amounts 24 28Consolidated liabilities 2'016 2'241
Geographical information
Non-current assets SalesCHF million 2018 2017 2018 2017 Total 1'316 1'333 4'572 4'150 Europe 883 924 2'494 2'247– Thereof Germany 240 364 1'116 1'046– Thereof Switzerland 347 274 205 173– Thereof Austria 215 229 99 93– Thereof Rest of Europe 81 57 1'074 935Americas 190 152 702 592Asia 214 219 1'130 1'060– Thereof China 201 207 815 817Rest of world 29 38 246 251
Information about major customersThere are no single customers whose sales amount to 10% or more of the sales of the Corporation.

104 Consolidated financial statements
Accounting principlesIn accordance with the management structure and the reporting to the Executive Committee and the Board of Directors, the reportable segments are the three operating divisions GF Piping Systems, GF Casting Solutions, and GF Machining Solutions.
GF Piping Systems is a leading supplier of piping systems made of plastics and metal. The division focuses on system solutions, high-quality components for the safe transport of water, chemicals, and gas, as well as corresponding services.
GF Casting Solutions is a technologically pioneering development partner and manufacturer of cast components and systems for the global automotive industry, the aerospace and energy market, off-highway vehicles as well as for industrial applications.
GF Machining Solutions is one of the world’s leading providers of complete solutions to the tool and mold making industry and to manufacturers of precision components. The portfolio includes milling, wire cutting and electric discharge machines (EDM), spindle systems, laser texturing, additive manufacturing, as well as automation and digitalization solutions.
Business units within these segments have been aggregated as a single reportable segment because they manufacture similar products with comparable production processes and supply them to similar customer groups using similar distribution methods. Segment accounting is prepared up to the level of operating result (EBIT) as this is the key figure used for management purposes. All operating assets and liabilities that are directly attributable or can be allocated on a reasonable basis to the segments are reported in the corresponding divisions. There are no differences in the accounting policies of the segment reporting and those of the consolidated financial statements.
1.2 Sales and other operating income1.2.1 Products, services and most important revenue sources
1 Products for the supply of gas and water.2 Products for the treatment and transport of water and other media for industrial applications.3 Products for the supply of water und floor-heating systems in buildings.4 Sales disclosed for the full year in 2017 and for eleven months in 2018, see note 4.1 (4.1.1 Changes in scope of consolidation).
SalesCHF million 2018 2017
GF Piping Systems 1'821 1'678
Utility 1 733 667
Industry 2 643 578
Building technology 3 445 433
GF Casting Solutions 1'687 1'482
Automotive (remaining) 884 785
Automotive (divested) 4 617 613Industrial applications 109 84Aerospace/Energy 77 GF Machining Solutions 1'066 992
Milling 335 318EDM 308 293Customer service 289 269Automation/Tooling/Laser 134 112
Accounting principlesBillings for goods and services are recognized as sales when they are delivered or when the principal risks and benefits incidental to ownership are transferred.

105 Consolidated financial statements
An assessment as to whether the principal risks and opportunities were transferred for a particular delivery is made separately for each sales transaction on the basis of the contractual agreement underlying the transaction. The transfer of legal ownership alone does not necessarily result in the transfer of the principal risks and opportunities. This is the case, for instance, if:
– the recipient of the delivery makes a claim against insufficient quality of the delivered item that exceeds a normal warranty claim
– the receipt of the proceeds depends on the resale of the goods by the buyer – the installation of the goods at the recipient is an essential part of the contract – the buyer has the right to return the item for a contractually specified reason and the likelihood of such a
return cannot be assessed with any certainty
Services rendered are recognized as sales depending on the degree of their completion if the result of the service can be reliably assessed.
Sales are stated before value-added tax, sales tax, and after the deduction of discounts and credits. Appropriate warranty provisions are recognized for anticipated claims.
1.2.2 Other operating income
CHF million 2018 2017
Sales of material, waste, and scrap 18 11Income from insurance contracts 7 7Income from services 9 7Gains on disposals of property, plant, and equipment 1 2Foreign exchange gains/losses –5 Other operating income 26 16Total 56 43
1.3 Expenses1.3.1 Operating expenses
1 External services include e.g. temporary employees, IT costs, R&D, insurance costs as well as consulting services.2 Other expenses include compensation to the members of the Board of Directors of CHF 2.4 million (previous year: CHF 3.1 million)
CHF million 2018 2017
External services 1 196 170Selling costs, commissions 130 123Repair, maintenance 118 108Advertisements, communication 108 98External energy supply 107 95Rent, leases 54 50
Other expenses 2 63 56Total 776 700
1.3.2 Personnel expenses
CHF million 2018 2017
Salaries and wages 935 853Employee benefits 32 24Social security 172 171Total 1'139 1'048
In accordance with a plan defined by the Board of Directors, Georg Fischer registered shares are granted to members of the Executive Committee and members of the Senior Management as a long-term financial incentive. Taking into account the registered shares granted to members who left the firm during the year under review, the expenses related to the long-term incentive plan recognized in the personnel expenses amount to CHF 5.6 million (previous year: CHF 9.7 million).

106 Consolidated financial statements
1.4 Income taxes
2018 2017
CHF million Total Thereof
current taxes
Thereofdeferred
taxes Total Thereof
current taxes Thereof
deferred taxes
Tax rate reconciliation
Profit before taxes 348 322 Expected income tax rate in % (rounded) 21 20
Expected income tax expense 74 59 15 66 69 –3
Non-tax deductible expenses/tax exempted income 6 5 1 Use of unrecognized tax loss carryforwards –5 –6 1 –7 –9 2Effect of non-recognition of tax losses in current year 1 1 Recognition of previously unrecognizedtax loss carryforwards –2 –2 Tax charges and credits related to prior periods, net –6 –7 1 2 1 1Other effects 2 2 2 5 –3Effective income tax expense 69 51 18 64 67 –3
Effective income tax rate in % 20 20
The difference between the expected income tax expense and the effective income tax expense recorded in the financial statements can be explained as follows:
The expected income tax rate of the Corporation amounts to 21% (previous year: 20%) and corresponds to the weighted average tax rate which is based on the profit/loss before taxes and the income tax rate of each individual GF Corporate Company. The change of the expected income tax rate is due to the variation in profitability and the change of the tax rate of different GF Corporate Companies. The expected income tax rate based on the ordinary result also amounts to 21% (previous year: 20%).
The unrecognized tax loss carryforwards in 2018 totaling CHF 132 million (previous year: CHF 159 million) have a potential tax relief effect of CHF 35 million (previous year: CHF 44 million), whereof CHF 110 million (previous year: CHF 135 million) can be utilized for an indefinite period. CHF 1 million is to expire within one year.
As of 31 December 2018, tax loss carryforwards of CHF 22 million (previous year: CHF 18 million) were capitalized, resulting in a deferred tax asset of CHF 6 million (previous year: CHF 4 million).

107 Consolidated financial statements
Management assumptions and estimatesCurrent tax liabilities are calculated based on an interpretation of the tax regulations in place in the relevant countries. The adequacy of such an interpretation is assessed by the tax authorities in the course of the final assessment or tax audits. This can result in material changes to tax expense. Furthermore, in order to determine whether tax loss carryforwards may be capitalized, it is necessary to assess critically the probability that there will be future taxable profits which can offset them. This assessment depends on a variety of influencing factors and developments.
Accounting principlesIncome taxes include current and deferred taxes. Current income taxes are calculated on the taxable profit. Deferred taxes are calculated by applying the balance sheet liability method for any temporary difference between the carrying amount according to Swiss GAAP FER and the tax basis of assets and liabilities. Tax loss carryforwards are recognized only to the extent that it is probable that future taxable profits or deferred tax liabilities will be available against which they can be offset. The calculation of deferred taxes is based on the country-specific tax rates. Tax assets and liabilities are offset if they concern the same taxable entity and tax authority and if there is an offset entitlement for current taxes. No deferred tax is provided for temporary differences on investments in subsidiaries where the timing of the reversal of the temporary difference is controlled by the Corporation and whether it is probable that the temporary difference will not reverse in the foreseeable future.
1.5 Earnings per share
2018 2017
Earnings per share (CHF) 69 62Number of shares (Ø) 4'093'613 4'091'237
There was no dilution of earnings per share in either the year under review or the previous year.
Accounting principlesEarnings per share is calculated by dividing the portion of net profit attributable to Georg Fischer Ltd shareholders by the weighted average number of shares outstanding in the reporting period. Diluted earnings per share takes into account any potential additional shares that may result, for instance, from exercised options or conversion rights.

108 Consolidated financial statements
2. Operating assets and liabilities
This section provides additional information on current assets and liabilities that support the ongoing operational liquidity of the Corporation. The section further describes the non-current tangible and intangible assets required at the GF Corporate Companies to provide products and services to their customers. Finally, it provides a summary on the different items of goodwill and the theoretical impact of a capitalization and subsequent amortization of goodwill.
2.1 Accounts receivable 2.1.1 Trade accounts receivable
CHF million 2018 2017
Gross values 725 784
Individual value adjustments –5 –6Overall value adjustments –23 –24Net values 697 754
Europe 295 349– Thereof Germany 88 105– Thereof Switzerland 35 31– Thereof Austria 10 14– Thereof Rest of Europe 162 199Americas 104 85Asia 259 271– Thereof China 194 211Rest of world 39 49Total 697 754
As of the balance sheet date, the aging structure of the trade accounts receivable, which are not subject to individual value adjustments, was as follows:
2018 2017
CHF million
Receivable afterindividual value
adjustments Overall value
adjustment
Receivable afterindividual value
adjustments Overall value
adjustment
Not yet due 557 624 1 to 30 days overdue 76 84 31 to 90 days overdue 52 34 91 to 180 days overdue 19 8 17 8More than 180 days overdue 16 15 19 16Total 720 23 778 24
The individual value adjustments amounted to CHF 5 million (previous year: CHF 6 million). It is assumed that part of the underlying receivables will be paid. Receivables not due are mainly receivables arising from long lasting customer relationships. Based on experience, GF does not anticipate any significant defaults. For further information on credit management and trade accounts receivable, see note 3.6 (Risk management).
Accounting principlesAccounts receivable are stated at nominal value. Value adjustments for doubtful accounts are established based on maturity structure and identifiable solvency risks. Besides individual value adjustments with respect to specific known risks, other value adjustments are recognized based on statistical surveys of default risk.
2.1.2 Income taxes receivableOf the total income taxes receivable of CHF 11 million, CHF 4 million relate to Sweden, CHF 3 million to the USA, CHF 1 million each to Switzerland, Austria, Turkey, and CHF 1 million to other countries.

109 Consolidated financial statements
2.1.3 Other accounts receivable
CHF million 2018 2017
Tax credits from indirect taxes 30 31Other current accounts receivable 32 31Total 62 62
2.2 Inventories
CHF million 2018 2017
Finished goods 495 499Raw materials and components 242 271Work in progress 180 163Gross value of inventories on hand 917 933
Valuation adjustments –138 –160Inventories 779 773
Accounting principlesGoods held for trading are generally stated at average cost and internally manufactured products at standard cost, including direct labor and materials used, as well as a commensurate share of the related overhead costs. Cash discount deductions are treated as reductions in the purchase cost. If the net realizable value is lower than the above, a corresponding valuation adjustment is made. Inventories with an insufficient turnover rate are partly or fully value-adjusted.
2.3 Liabilities2.3.1 Other liabilities
CHF million 2018 2017
Social security 17 18Other non-interest-bearing liabilities 39 43Derivative financial instruments 2 17Other tax liabilities (e.g. withholding tax) 37 29Total 95 107- Thereof current 56 69- Thereof non-current 39 38
2.3.2 Derivative financial instruments
2018 2017
CHF million
Contract- or nominal
value Positive
market value Negative
market value Contract- or
nominal value Positive
market value Negative
market value
Derivative financial instruments
Foreign exchange(e.g. forward exchange contracts) 463 3 –2 474 5 –3Other underlyings 2 60 –14Total 465 3 –2 534 5 –17
GF uses derivative financial instruments as part of its Corporation-wide risk management approach. Currency risks from accounts receivable, accounts payable, and financing in foreign currencies are partially hedged. The only hedging instruments employed are forward exchange contracts and currency swaps with a maximum maturity of twelve months. The hedging of other underlying assets consists of hedging against price fluctuations relating to the purchase of raw materials and energy.

110 Consolidated financial statements
Accounting principlesDerivative financial instruments are stated at market values. Positive market values are reported in the balance sheet under the item “Marketable securities”, while negative values are recognized under “Other liabilities”. Foreign currency and interest rate risks are hedged by the Corporation using forward exchange contracts and swaps. Foreign currency risks related to highly probable future cash flows from sales in foreign currencies are hedged, using cash flow hedges in particular.
2.3.3 Categories of financial instrumentsThe following table shows the carrying amount of all financial instruments per category. For details on the market values of the bonds, see note 3.1 (3.1.1 Interest-bearing financial liabilities).
1 The balance sheet item "Other accounts receivable" includes tax credits. For more details, see note 2.1 (2.1.3 Other accounts receivable).2 Relates to loans to third parties, security deposits, and long-term-invested securities for the settlement of pension liabilities. For more
details, see note 5.2.3 For more details, see note 2.6 (2.6.2 Accrued liabilities and deferred income).4 The balance sheet item "Other current/non-current liabilities" includes derivative financial instruments. For more details, see note 2.3
(2.3.1 Other liabilities).
CHF million 2018 2017
Financial instruments (assets)
Cash and cash equivalents (excluding fixed-term deposits) 504 592
Trade accounts receivable 697 754Fixed-term deposits 29 32
Other accounts receivable 1 32 31Accrued income 15 16
Other financial assets 2 91 12Loans and receivables stated at amortized cost 864 845
Marketable securities and funds 6 4Financial assets recognized in income statement at market value 6 4
Derivative financial instruments for hedging purposes 3 5
Financial instruments (liabilities)
Trade accounts payable 498 593Bonds 574 524Other financial liabilities 202 264
Accrued liabilities and deferred income 3 253 258
Other current/non-current liabilities 4 93 90Liabilities stated at amortized cost 1'620 1'729
Derivative financial instruments 2 17
The carrying amount of the securities and listed non-controlling interests recognized at their fair value is determined on the basis of the share prices at the balance sheet date. Derivative financial instruments are stated at their replacement value (market value) at the balance sheet date.

111 Consolidated financial statements
2.4 Movements in property, plant, and equipment
CHF million
Invest-ment
properties
Machineryand
productionequipment Buildings
Buildingcom-
ponents Other
equipment
Assets under
construction Land
Un-developed
property
Assetsheld
under finance leases
Property, plant, and
equipment for own
use
Cost As of31 December 2018 200 1'441 563 132 211 182 45 4 24 2'602
Additions 2 44 7 5 11 160 5 4 236Disposals –2 –159 –5 –3 –10 –1 –178Changes in scope of consolidation –493 3 –27 –19 –4 –540Other changes, reclassifications 140 52 –93 10 11 –127 –1 4 –144Translation adjustment –5 –54 –16 –3 –6 –2 –2 –1 –84As of31 December 2017 65 2'051 667 150 224 155 43 4 18 3'312
Additions 41 2 5 8 150 1 207Disposals –1 –34 –1 –1 –12 –48Changes in scope of consolidation 11 9 2 2 4 28Other changes, reclassifications –6 60 17 4 6 –83 –1 1 4Translation adjustment 3 106 26 6 8 2 148As of 31 December 2016 69 1'867 614 136 212 84 40 3 17 2'973
Accumulated depreciation As of31 December 2018 –116 –999 –311 –81 –155 –10 –1'556
Additions –1 –102 –18 –7 –13 –2 –142Disposals 93 4 3 10 1 111Changes in scope of consolidation 444 –1 17 15 475Other changes, reclassifications –89 3 86 3 92Translation adjustment 3 36 7 2 4 1 50As of31 December 2017 –29 –1'473 –389 –99 –171 –10 –2'142
Additions –1 –94 –17 –6 –12 –2 –131Disposals 1 32 1 1 11 45Other changes, reclassifications 4 2 –3 –2 1 –2Translation adjustment –1 –80 –16 –4 –7 –107As of 31 December 2016 –32 –1'333 –354 –88 –164 –8 –1'947
Carrying amount As of31 December 2018 84 442 252 51 56 182 45 4 14 1'046As of31 December 2017 36 578 278 51 53 155 43 4 8 1'170As of 31 December 2016 37 534 260 48 48 84 40 3 9 1'026
The overall net carrying amount of property, plant, and equipment decreased by CHF 124 million to CHF 1’046 million (previous year. CHF 1’170 million) due to the divestment of the two iron casting plants in Singen and Mettmann (Germany) including the subsequent asset sale of a relating production equipment.

112 Consolidated financial statements
Additions to property, plant, and equipment are mainly due to the acquisition of Precicast Industrial Holding SA (Switzerland). These movements are shown in the line “Changes in scope of consolidation” and explained in more detail in note 4.1.
In the course of the divestments in Singen and Mettmann, land and buildings that were not part of the divestment were reclassified from property, plant, and equipment for own use to investment properties. Also subsequently to the divestment, production equipment in the amount of CHF 58 million was sold to the acquirer of these production entities.
The fair value of investment properties, as determined by internal assessments on the basis of capitalized and current market values, is CHF 101 million (previous year: CHF 62 million).
The movement in assets under construction is mainly due to ongoing investment projects, including a new innovation and production center in Biel (Switzerland) for GF Machining Solutions in the amount of CHF 43 million, the refurbishment of an administration building in Schaffhausen (Switzerland) for GF Piping Systems in the amount of CHF 7 million, ongoing investment into the light metal die-casting plant in Mills River (USA) of the joint venture with GF Casting Solutions and Linamar Corporation in the amount of CHF 35 million, as well as the transfer of completed projects to other categories of property, plant, and equipment.
Management assumptions and estimatesThe values of non-current assets and intangible assets are reviewed whenever there are indications that their carrying amount may no longer be recoverable, due to changed circumstances or events. If such a situation arises, the recoverable amount is determined on the basis of expected future cash flows. It corresponds to the higher of the discounted value of expected future net cash flows and the expected net selling price. If the recoverable amount is lower than the carrying amount, a corresponding impairment loss is recognized in the income statement. The main assumptions on which these measurements are based include growth rates, margins, and discount rates. The actual future cash flows can differ considerably from discounted projections.
Accounting principlesProperty, plant, and equipment are stated at cost or manufacturing cost less depreciation and impairment. Financing costs of assets under construction are part of the costs of the asset if material. Assets held under finance lease contracts are capitalized at the lower of the present value of the minimum lease payments and fair value. The related outstanding finance lease obligations are presented as liabilities.
Assets are depreciated on a straight-line basis over their estimated useful lives or lease terms:
– Investment properties and buildings: 30–40 years– Building components: 8–20 years– Machinery and production equipment: 6–20 years– Other equipment (vehicles, IT systems, etc.): 1–5 years– Assets under construction are usually not depreciated
When components of larger assets have different useful lives, these are depreciated separately. Useful lives and residual values are reviewed annually on the balance sheet date and adjustments are recognized in the income statement. Any gains or losses on the disposal of items of property, plant, and equipment are recognized in the income statement.
Assets held under the terms of a finance lease are described in note 3.3.
2.5 Movements in the intangible assetsThe major categories of the intangible assets are subdivided into “Land use rights”, “Software”, and “Royalties, patents, others”.
In the period under review, the intangible assets amounted to CHF 34 million (previous year: CHF 29 million).
Land use rights increased to CHF 13 million (previous year: CHF 10 million). The main reason was the increase in land use rights for the new plant in Changzhou at GF Machining Solutions. Software also amounted to CHF 13 million (previous year: CHF 10 million). The main reason for this increase was

113 Consolidated financial statements
the industrial software and SAP implementation in various companies by GF Piping Systems and GF Machining Solutions.
Royalties, patents, others in the amount of CHF 8 million (previous year: CHF 9 million), remained almost unchanged compared to the previous year.
GoodwillThe theoretical capitalization of the goodwill would affect the result of the consolidated financial statements as follows:
Theoretical movements in goodwill
CHF million 2018 2017
Cost As of 31 December 655 608
Additions from acquisitions 77 64Adjustments –4 –1Translation adjustment –26 As of 1 January 608 545
Accumulated amortization As of 31 December –526 –510
Additions regular –38 –33Translation adjustment 22 –2As of 1 January –510 –475
Theoretical book values, net As of 31 December 129 98As of 1 January 98 70
Effect on income statement
CHF million 2018 2017
Operating result (EBIT) 382 352Return on sales (EBIT margin) % 8.4 8.5Amortization goodwill –38 –33Theoretical operating result (EBIT) incl. amortization of goodwill 344 319Theoretical return on sales (EBIT margin) % 7.5 7.7
Net profit 279 258Amortization goodwill –38 –33Theoretical net profit incl. amortization of goodwill 241 225
Effect on balance sheet
CHF million 2018 2017
Equity according to balance sheet 1'428 1'369Theoretical capitalization of net book value of goodwill 129 98Theoretical equity incl. net book value of goodwill 1'557 1'467
Equity as % of balance sheet total 41.5 37.9Theoretical equity incl. net book value of goodwill as % of balance sheet total (incl. goodwill) 43.6 39.6
Goodwill from acquisitions is offset against the Corporation’s equity at the acquisition date. The theoretical amortization is based on the straight-line method over the useful life of five years. The adjustment in the year under review in the amount of CHF –4 million (previous year: CHF –1 million) is due to the adjustments of the conditional purchase price of GF Casting Solutions SRL, Pitesti of CHF –3.3 million and of Microlution Inc of CHF –0.2 million. The adjustments will be amortized together with the goodwill over the remaining period of amortization.

114 Consolidated financial statements
At the balance sheet date no indications of impairment were found except for the goodwill of Symmedia GmbH and Microlution Inc. These goodwill items were tested for impairment. Both impairment tests revealed that the resulting recoverable amounts based on value in use calculations, exceeded the carrying amounts.
By applying the capital asset pricing model, individual costs of capital were calculated for Symmedia GmbH and Microlution Inc. The calculation required an assessment of the relative market risk of different peer groups as well as the determination of specific risk-free interest rates, an equity market risk premium, the borrowing costs and relevant tax rates.
Since the cash flow projections were based on cash flows after tax, the discount rate has also been determined after tax. The discount rate for Symmedia GmbH was calculated at 7.0% and for Microlution Inc at 9.5%.
It was confirmed that the theoretical goodwill of both companies retained its carrying amount.
Management assumptions and estimatesFor goodwill positions, that are listed in the theoretical movements, an impairment test is performed if there is any indication that these goodwill positions could be affected from such an impairment. If such indications exist, an impairment test is performed for the goodwill positions offset against equity to determine the recoverable amount. As a basis for the calculation, business plans for the next five years are used. Subsequent years are included in the calculation using a perpetual annuity with a growth assumption of zero. The projections are based on knowledge and experience as well as on current judgments made by management as to the probable economic development of the relevant markets. It is assumed that there are no significant planned changes in the organization of any of the divisions, except for the measures already decided and announced.
Accounting principles: intangible assetsAcquired licenses, patents, and similar rights are capitalized and, with the exception of land use rights, amortized on a straight-line basis over their estimated useful lives of 3 to 15 years. Land use rights are amortized over the duration of the usage rights granted. For this item, useful lives can be up to 50 years. Software is amortized on a straight-line basis over the estimated useful lives of 1 to 5 years.
In the event of business combination, goodwill at the date of acquisition is calculated as follows: the acquisition price plus transaction costs incurred in connection with the business combination less the value of the acquired and re-valued net assets on the balance sheet.
The positive or negative goodwill resulting from acquisitions is offset in equity against retained earnings at the date of acquisition. Upon the disposal of a GF Corporate Company, the goodwill previously offset in equity is transferred to the income statement. If parts of the purchase price are dependent on future results, they are estimated as accurately as possible at the acquisition date and recognized in the balance sheet. In the event of disparities when the definitive purchase price is settled, the goodwill offset in equity is adjusted accordingly.
The carrying amount of non-current assets (especially property, plant, and equipment, intangible assets, financial asssets as well as the goodwill reported in the sample accounting) is reviewed at least once a year. If there is any indication of an impairment, an impairment test is performed immediately. If the carrying amount exceeds the recoverable amount, an impairment loss is recognized in the income statement. As the goodwill is already offset with equity at the date of the acquisition, an impairment of the goodwill does not affect the income statement, but leads to a disclosure in the notes only.

115 Consolidated financial statements
Accounting principles: research and developmentAll research costs are recognized in the income statement in the period in which they were incurred. Development costs are recognized as an asset only to the extent that the following specific recognition criteria are all met cumulatively:
– costs are clearly defined, clearly attributable to the product or process, and can be separately identified and measured reliably
– the technical feasibility can be demonstrated – the company intends to produce and market the product or to use the process – a market exists– the required internal resources are available – the amount recognized is covered by future cash flows
2.6 Movements in provisions, accrued liabilities and deferred income and contingent liabilities2.6.1 Movements in provisions
CHF million
Personnel and
social security Warranties
Legal cases
Onerous contracts
Restruc-turing
provisions Other
provisions Provisions
Deferred tax
liabilities
Provisions and
deferred tax
liabilities
As of31 December 2018 62 33 18 16 20 149 63 212
Reclassifications Increase 11 23 8 7 11 60 17 77Use –5 –15 –2 –4 –1 –27 –27Release –1 –8 –8 –5 –9 –31 –3 –34Changes in scope of consolidation –16 6 –4 –14 2 –12Translation adjustment –2 –2 –4 –4As of31 December 2017 75 35 20 12 23 165 47 212
Reclassifications –1 1 Increase 10 18 8 7 1 3 47 5 52Use –5 –11 –1 –3 –1 –1 –22 –22Release –2 –5 –5 –3 –2 –17 –6 –23Changes in scope of consolidation 1 1 2 3Translation adjustment 5 1 1 1 8 1 9As of31 December 2016 67 31 17 10 23 148 45 193
Maturity structure of the provisions 2018 – current 4 21 2 6 5 38 38– non-current 58 12 16 10 15 111 63 174
Maturity structure of the provisions 2017 – current 4 22 2 11 6 45 45– non-current 71 13 18 1 17 120 47 167
The valuation of provisions in all categories is based on actual data if available (e.g. claims that have occurred or been reported) or on the experience of recent years and management estimates. The deferred tax liabilities are based on temporary valuation differences, which are reported in the balance sheet at the level of GF Corporate Companies.

116 Consolidated financial statements
Expenditures not connected with pension plans in the narrow sense, such as awards for length of service and anniversary bonuses are recognized in the “Personnel and social security” category and amounted to CHF 62 million (previous year: CHF 75 million).
Personnel and social security provision
The non-current provisions in the “Personnel and social security” category in the amount of CHF 58 million (previous year: CHF 71 million) are expected to result in a cash outflow in an average of ten years, the non-current provisions in the other categories are expected to result in a cash outflow within the next two to three years.
Warranty provisions amounted to CHF 33 million (previous year: CHF 35 million). Due to the favorable claims outcome, it was possible to release CHF 8 million. At the same time, new warranty provisions of CHF 23 million had to be set aside, and CHF 15 million were utilized.
Warranty provision
38.5% of the warranty provisions are for GF Machining Solutions and 24.0% for GF Casting Solutions. They derive from complaints and claims for damages made to the various locations.
Provisions in the “Legal cases” category relate to a number of individual cases involving the divisions. For none of the existing legal cases is an estimated cash outflow of more than CHF 6 million expected.
Legal cases
The “Other provisions” category contains provisions for pension plans in the amount of CHF 3 million (previous year: CHF 11 million) and for other operating risks.
Other provisions
2.6.2 Accrued liabilities and deferred income
CHF million 2018 2017
Overtime, holiday, bonuses, and sales-related premiums 113 112Accrued liabilities/deferred income for commissions and discounts 33 32Accrued liabilities/deferred income for annual audit fees 4 4Other accrued liabilities and deferred income 103 110Total 253 258
2.6.3 Contingent liabilitiesContingent liabilities amounted to CHF 125 million (previous year: CHF 0 million) and include guarantees to related parties in favor of third parties. The increase compared to the previous year is explained by the reclassification from guarantees in favor of GF Corporate Companies to guarantees in favor of related parties in relation to the divestments in 2018. The contingent liabilities will continously be reduced over a period of five years.
Management assumptions and estimates In the course of their ordinary operating activities, GF Corporate Companies can become involved in litigation. Provisions for pending legal proceedings are measured on the basis of the information available and a realistic estimate of the expected outflow of resources. The outcome of these proceedings may result in claims against the Corporation that cannot be met or cannot be met in full through provisions or insurance cover. If there are any contractual obligations for which the unavoidable costs of meeting the obligations exceed the expected economic benefits (e.g. onerous delivery contracts), provisions are made for the agreed amounts over the entire period or over a prudently estimated period. These provisions are based on management assumptions.

117 Consolidated financial statements
3. Capital and financial risk management
This section sets out the policies and procedures applied to manage the capital structure and the financial risks. The total capital is defined as equity and net debt. GF manages its capital structure in order to maximize shareholders’ return, maintain optimal cost of capital and provide flexibility for strategic investments.
3.1 Interest-bearing financial liabilities and pledged or assigned assets3.1.1 Interest-bearing financial liabilities
1 This category comprises other financial liabilities with a fixed interest period of more than three months.
CHF million Within1 year
Up to5 years
Maturityover
5 years 2018 2017
Bonds (at fixed interest rates) 149 425 574 524Other financial liabilities
(at fixed interest rates) 1 46 56 102 136Other financial liabilities(at variable interest rates) 98 2 100 128Loans from pension fund institutions 4 4 28Total 148 207 425 780 816
Net debt, which is calculated as the difference between interest-bearing liabilities and cash and cash equivalents and marketable securities, increased by CHF 55 million to CHF 238 million in the year under review (previous year: CHF 183 million). The reason for this increase was primarily the use of the free cash flow before acquisitions (CHF 147 million) for acquisitions and the payout of a dividend of CHF 94 million to the shareholders. A counter effect of CHF 69 million stems from the deconsolidation of loans in the course of the divestment of the two iron foundries in Singen and Mettmann (Germany).
In the year under review the maturity profile was improved by the placement of a CHF 200 million bond with a maturity of 10 years.

118 Consolidated financial statements
The following table shows in detail the various categories of other financial liabilities by currency and interest rate:
1 This category comprises other financial liabilities with a fixed interest period of more than three months.
CHF million Issuing
currency Range
interest rate % 2018 Issuing
currency Range
interest rate % 2017
Bonds(at fixed interest rates) 574 524
Bond (Georg Fischer Finanz AG)1.5% 2013-2018 (12 September)Nominal value: CHF 150 million CHF 1.6 150Bond (Georg Fischer Finanz AG)2.5% 2013-2022 (12 September)Nominal value: CHF 150 million CHF 2.6 149 CHF 2.6 149Bond (Georg Fischer Finanz AG)0.875% 2016-2026 (12 May)Nominal value: CHF 225 million CHF 0.9 225 CHF 0.9 225Bond (Georg Fischer AG)1.05% 2018-2028 (12 April)Nominal value: CHF 200 million CHF 1.06 200
Other financial liabilities
(at fixed interest rates) 1 102 136
USD 5.0 46 USD 5.0–7.2 25
CHF 1.1–1.5 29 CHF 1.1–1.5 21
EUR 1.9–5.0 17 EUR 2.5–5.0 72
CNY 6.1–7.6 7 CNY 6.1–7.6 11 Other 5.0 3 Other 5.0–13.3 7
Other financial liabilities(at variable interest rates) 100 128
CNY 3.9–4.8 58 CNY 3.9–4.6 70
EUR 1.5–1.6 27 EUR 1.0–2.0 28
TRY 25.0 6 TRY 13.5–13.9 8 Other 0.0–4.3 9 Other 0.0–4.6 22
Loans from pension fund institutions 4 28
CHF 1.0 4 CHF 1.0 2 EUR EUR 6.0 26
Total 780 816
GF has the following syndicated credit line:
Debtors Term Credit Thereof utilizedGeorg Fischer Ltd/Georg Fischer Finanz AG 2015–2020 CHF 250 million CHF 0 million
The syndicated credit line provides the Corporation with the necessary financial flexibility to swiftly act as for instance in the case of acquisitions and was not drawn at the end of the year. In addition to other terms, the syndicated credit line is subject to covenants with respect to the net debt ratio (ratio of net debt to EBITDA), the interest-coverage ratio (ratio of EBITDA to net interest expense), and the equity ratio (ratio of equity to total assets). The conditions of the syndicated credit line are considered to represent standard conditions for such types of arrangements.
The bonds placed on the market as well as the syndicated credit line are subject to standard cross-default clauses, whereby the outstanding amounts may all become due if early repayment of another loan is demanded of the company or one of its main GF Corporate Companies owing to a failure to meet the credit terms. As of the balance sheet date, the effective credit terms had been met.

119 Consolidated financial statements
The interest-bearing financial liabilities also include loans payable to employee benefit plans in the amount of CHF 4 million (previous year: CHF 28 million). The decrease stems from the deconsolidation of loans payable to employee benefit plans in the course of the divestment of the two iron casting plants in Singen and Mettmann (CHF 26 million).
Accounting principlesFinancial liabilities comprise bank loans, mortgages, and bonds. They are recognized at their amortized cost. Borrowing costs are recognized in the income statement using the effective interest method. Borrowing costs that can be allocated directly to the construction, build-up, or purchase of a qualifying asset are capitalized as part of the acquisition or manufacturing costs of the asset.
3.1.2 Pledged or assigned assetsAssets pledged or restricted on title in part or whole amounted to CHF 16 million (previous year: CHF 36 million).
In the year under review, CHF 8 million (previous year: CHF 28 million) of pledged assets related to land and buildings.The decrease of CHF 20 million mainly arose from Hakan Plastik AS and Urecon Ltd in the GF Piping Systems division. Both companies adjusted their financing structures.
CHF 2 million related to machinery and equipment (previous year: CHF 3 million), while CHF 6 million related to accounts receivable (previous year: CHF 5 million). There are no pledged or assigned inventories.
The assets are pledged or restricted on title as collateral for bank loans.
3.2 Financial result
CHF million 2018 2017
Interest income 2 2Financial income 2 2
Interest expenses 31 28Net losses on financial instruments at market value recognized in income statement 3 3Other financial expenses 3 2Financial expenses 37 33
3.3 Leasing
CHF million 2018 2017
Leasing obligations up to 1 year 20 18Leasing obligations 1 to 5 years 58 42Leasing obligations over 5 years 11 10Operating leases (nominal values) 89 70
Liabilities relating to financial lease contracts in the amount of CHF 14 million (previous year: CHF 8 million) were mainly due to the leasing of the machines by GF Piping Systems and GF Casting Solutions. The leasing obligations are included in “Other financial liabilities at fixed interest rates” and are disclosed in note 3.1 (3.1.1 Interest-bearing financial liabilities).
Accounting principlesThe present value of finance leases is recognized in the non-current assets and in the other financial liabilities on the balance sheet when most of the contractual risks and rewards have been transferred to the GF Corporate Company. Lease installments are divided into an interest and a repayment component based on the annuity method. Assets held under such finance leases are depreciated over the shorter of their estimated useful life and lease term. Operating lease installments are reported in the income statement under operating expenses.

120 Consolidated financial statements
3.4 Share capital/capital managementShare capitalAs of 31 December 2018, the share capital comprised 4’100’898 registered shares with a par value of CHF 1 each. Total dividend-bearing nominal capital amounted to CHF 4’100’898.
Capital managementThe capital managed by the Corporation consists of the consolidated equity. The ratios are shown in the following table:
CHF million 2018 2017
Equity attributable to shareholders of Georg Fischer Ltd 1'382 1'317Non-controlling interests 46 52Equity 1'428 1'369
Total assets 3'444 3'610Equity ratio as % 41.5 37.9
Theoretical equity incl. net value of goodwill 1'557 1'467Theoretical equity ratio incl. net value of goodwill as %,total assets incl. goodwill 43.6 39.6
Average reported equity 1'399 1'284Net profit 279 258Return on average reported equity as % 19.9 20.1
The Corporation has set the following goals for the management of its capital:
– maintain a healthy and sound balance sheet structure based on going concern values – ensure the necessary financial scope in order to make investments and acquisitions in the future – realize a return for investors commensurate with the risk
The Corporation uses two ratios to monitor equity: the equity ratio and the return on equity. The equity ratio represents equity as a percentage of total assets. Return on equity is net profit expressed as a percentage of average equity. These ratios are reported to the Executive Committee and the Board of Directors at regular intervals through the internal financial reporting. While the total equity increased the balance sheet total was reduced in the financial year, resulting in an increased equity ratio of 41.5% as of 31 December 2018.
As an industrial group, GF strives to maintain a strong balance sheet with a high portion of equity. In the medium term, the Corporation aims to achieve an equity ratio of 35% to 40%. The medium-term target for return on equity is above 15%.
The Corporation does not have any financial covenants with minimal capital requirements (absolute CHF measure). There is one financial covenant concerning the equity ratio (relative measure).

121 Consolidated financial statements
The Board of Directors presents a proposal for the appropriation of retained earnings to the Annual Shareholders’ Meeting of GF. GF pursues a results-oriented dividend policy and usually distributes about 30% to 40% of the Corporation’s consolidated net profit to shareholders. The payment is distributed out of the retained earnings. The Board of Directors is proposing to the Annual Shareholders’ Meeting a dividend payment out of the retained earnings of CHF 25 in total per registered share for the fiscal year 2018 (previous year: CHF 23 in total per registered share). As of 31 December 2018, the par value of the Georg Fischer registered share amounts to CHF 1.
The authorized capital and the conditional capital consists of a maximum of 600’000 shares. The maximum amount of the authorized or conditional capital is reduced by the amount that authorized or conditional capital is created through the issue of bonds or similar debt instruments or new shares.
By no later than 17 April 2020, the maximum authorized share capital will be CHF 600’000 divided into no more than 600’000 registered shares each with a par value of CHF 1.
The reserves which are not disposable respectively distributable amount to CHF 90 million as of 31 December 2018 (previous year: CHF 84 million).
3.5 Treasury shares
2018 2017
Quantity
Transactionprice (Ø) in
CHF
Purchase cost (Ø)in CHF million Quantity
Transactionprice (Ø) in
CHF
Purchase cost (Ø)in CHF million
As of 31 December 7'586 1'145.92 9 6'984 1'114.63 8
Purchases 10'460 1'185.02 12 19'020 967.68 18Disposals –2'629 1'302.79 –3 –16'959 908.08 –15Transfers (share-based compensation) –7'229 1'161.47 –8 –7'415 920.16 –7Changes in share price 2As of 1 January 6'984 1'114.63 8 12'338 834.00 10
As of year-end 2018, GF held 7’586 treasury shares (previous year: 6’984 registered shares) with a par value of CHF 1. In the year under review, 10’460 treasury shares were purchased on the stock market at an average transaction price of CHF 1’185.02, and 2’629 treasury shares were sold on the stock market at an average transaction price of CHF 1’302.79.
According to the compensation model for the Board of Directors, members receive a fixed number of Georg Fischer registered shares. In accordance with the long-term incentive plan, members of the Executive Committee are entitled to a number of Georg Fischer performance shares (PS). The vesting of the performance shares (PS) is based on assumptions of Earnings per Share (EPS) and relative Total Shareholder Return (rTSR) – values over prospective three years. Based on a plan defined by the Board of Directors, a fixed number of Georg Fischer registered shares are granted to members of the Senior Management as a long-term financial incentive see Compensation Report.
7’136 registered shares are estimated to be required for share-based compensation for Executive Committee and members of the Senior Management.
The allocation for the share-based compensation is based on the relevant plan regulations. The share-based compensation for members of the Board of Directors, for the Executive Committee as well as the registered shares for the members of the Senior Management are stated at fair value and recognized as an expense at the allocation date. Such compensation is recorded under “Operating expenses” see note 1.3 (1.3.1 Operating expenses) for the Board of Directors and under “Personnel expenses” see note 1.3 (1.3.2 Personnel expenses) for the Executive Committee and the Senior Management. The total expense for the share-based compensation plans is CHF 7 million (previous year: CHF 11 million).

122 Consolidated financial statements
Accounting principlesTreasury shares are stated at cost as a separate negative position in equity. Gains or losses arising from the disposal of treasury shares are respectively credited to or deducted from the corresponding capital reserves.
3.6 Risk management Enterprise risk management as a fully integrated risk management process was systematically applied in 2018 at all levels of the Corporation. The three Divisions, the Corporate Staff, and all significant Corporate Companies prepared a risk map in May and November of the key risks with regard to strategy, markets, operations, management and resources, financials as well as sustainability. The likelihood of the risk occurring was classified into four categories. Where possible and appropriate, the identified risks were subject to a quantifiable assessment, taking into consideration any measures already implemented. Alternatively, a qualitative assessment of the risk exposure was applied.
The Risk Council, consisting of representatives of the Divisions and the Corporate Staff and headed by the Chief Risk Officer, held two meetings. The topics of these meetings were the optimization of the risk reporting of sustainability risks, the reporting and valuation of IT risks as well as the analysis of the risk maps.
In accordance with the semi-annual risk reporting process, the Executive Committee and the management of the Divisions discussed the risk maps twice during the year under review. They defined at the appropriate level the key risks of the Corporation, the Divisions and the GF Corporate Companies, and determined adequate measures to mitigate those risks. The Board of Directors tabled the topic of enterprise risk management in September 2018 to analyze the corporate and divisional risk maps as well as to define the key risks and the risk mitigation measures.
The multi-stage procedure, including workshops at division management, Executive Committee and Board of Directors level, has proven to be effective, as has having Internal Audit assess the risk maps prepared by the GF Corporate Companies.
Key risks were identified as follows: slow-down of the economic growth in China, political and economic uncertainties due to the trade dispute between the US and China, and the insufficient profitability of some GF Casting Solutions plants in Europe. Measures to reduce these and other risks were defined and are being implemented in line with the strategic targets of the Corporation and the three divisions.
Financial risk management
Financial risks overview Risk source Risk management
a) Credit risk default of a counterparty:
from trade accounts receivable or from bank deposits
diversification and credit assessments
b) Market risk - Currency risk sales and purchases as well as financing
Corporate Companies in foreign currencies selling and producing in functional currency
("congruency" rule) and hedging by means of forward exchange contracts
- Interest rate risk insignificant not necessary- Price risk insignificant not necessaryc) Liquidity risk not enough liquidity to pay due liabilities constant monitoring of liquidity, liquidity
reserves and unused credit lines
The Board of Directors bears ultimate responsibility for financial risk management. The Board of Directors has tasked the Audit Committee with monitoring the development and implementation of the risk management principles. The Audit Committee reports regularly to the Board of Directors on this matter.

123 Consolidated financial statements
The risk management principles are geared to identifying and analyzing the risks to which the Corporation is exposed and to establishing the appropriate control mechanisms. The principles of risk management and the processes applied are regularly reviewed, taking due regard of changes in the market and in the Corporation’s activities. The ultimate goal is to develop controls, based on the existing training and management guidelines and processes, that ensure a disciplined and conscious approach to risks. The Audit Committee is supported by the Head of Finance & Controlling in this task.
Owing to its business activities, GF is exposed to various financial risks such as credit risk, market risk (including currency risk, interest rate risk, and price risk), and liquidity risk. The following sections provide an overview of the extent of the individual risks as well as the goals, principles, and processes employed for measuring, monitoring, and hedging the financial risks.
Credit risk The maximum credit risk as of the balance sheet date was as follows:
1 Without tax credits.2 Relates to loans to third parties, security deposit and long-term invested securities for the settlement of pension liabilities.
CHF million 2018 2017
Trade accounts receivable 697 754Cash and cash equivalents 533 624
Other accounts receivable 1 32 31Accrued income 15 16
Other financial assets 2 91 12Derivative financial instruments 3 5Total 1'371 1'442
GF invests its cash worldwide and predominantly as deposits in leading Swiss and German banks with at least a BBB– rating. In accordance with the investment policy of GF, these transactions are entered into only with creditworthy commercial institutions. Generally, the investments have a maturity of less than three months. In addition, GF Corporate Companies have current bank accounts. Cash is allocated to several banks to limit counterparty risk. The maximum amount per bank is defined in relation to the ratings of the respective banks.

124 Consolidated financial statements
Transactions involving derivative financial instruments are also entered into only with major counterparties with at least a BBB– rating. The purpose of such transactions is to hedge against currency risks and price fluctuations for the purchase of raw materials and electric power for the Corporation.
The danger of cluster risks on trade accounts receivable is limited due to the large number and wide geographic spread of customers. The extent of the credit risk is determined mainly by the individual characteristics of each customer. Assessment of this risk involves a review of a customer’s creditworthiness based on its financial situation and past experience. In monitoring default risk, customers are classified according to relevant factors, such as geographic location, sector, and past financial difficulties.
The maximum credit risk on financial instruments corresponds to the carrying amounts of the relevant financial assets. GF has not entered into appreciable guarantees or similar obligations that would increase the risk over and above the carrying amounts.
Currency risk
Foreign exchange rates
Average rates Spot ratesCHF 2018 2017 2018 2017
1 AED 0.267 0.268 0.268 0.2651 ARS 0.037 0.060 0.026 0.0521 AUD 0.731 0.755 0.695 0.7631 BRL 0.269 0.309 0.254 0.2951 CAD 0.755 0.759 0.722 0.7781 CNY 0.148 0.146 0.143 0.1501 EUR 1.155 1.112 1.127 1.1701 GBP 1.306 1.268 1.260 1.3191 HKD 0.125 0.126 0.126 0.1251 INR 0.014 0.015 0.014 0.0151 MXN 0.051 0.052 0.050 0.0501 MYR 0.243 0.229 0.238 0.2411 NZD 0.677 0.700 0.661 0.6951 RON 0.248 0.251 0.242 0.2511 SGD 0.725 0.713 0.723 0.7301 TRY 0.208 0.270 0.186 0.2571 USD 0.979 0.985 0.984 0.976100 CZK 4.504 4.227 4.381 4.583100 DKK 15.496 14.944 15.091 15.718100 JPY 0.886 0.878 0.895 0.867100 KRW 0.089 0.087 0.088 0.092100 NOK 12.036 11.920 11.328 11.892100 PLN 27.111 26.122 26.198 28.015100 SEK 11.264 11.537 10.989 11.888100 THB 3.027 2.903 3.041 2.991100 TWD 3.245 3.236 3.217 3.293
The table below shows the contract values and market values of the foreign exchange contracts (net) as of the balance sheet date:
1 Corresponds to the carrying amount recognized as marketable securities or other liabilities.
CHF million Fair value hedges Cash flow hedges 2018 2017
Net value 394 68 462 472
Market value 1 2 –1 1 2Contract value 396 67 463 474
Owing to its international activities, GF is exposed to currency risks. These financial risks occur in connection with transactions (in particular the purchase and sale of goods) which are effected in currencies different from the functional currency of the company in question. Such transactions are

125 Consolidated financial statements
effected mainly in euros and US dollars. Currency risks can be reduced by purchasing and producing goods in the functional currency (“congruency” rule). In some cases, the remaining currency risks are hedged, generally for a maximum of twelve months, by means of forward exchange contracts.
The fair value hedges include foreign exchange contracts that serve to hedge loans to GF Corporate Companies in foreign currencies. Unrealized gains and losses from changes to the fair value are reported for these contracts in the financial result. The fair value hedges also include foreign exchange contracts that serve to hedge currency risks on receivables and liabilities. Like the currency effects on the underlying balance sheet item, gains and losses from changes to the fair value of these contracts are recognized in “Other operating income”.
The cash flow hedges mainly serve to hedge currency risks on future sales in foreign currencies. The volume of the foreign exchange contracts is limited to a maximum 75% of the expected sales. This results in a fully effective hedge. In individual cases, a higher ratio of the cash flows is hedged, e.g. for certain orders. Unrealized gains and losses from changes to the fair value are recognized directly in equity. They are transferred to the income statement when the service is performed and invoiced; as a result, the foreign exchange contracts become fair value hedges. To a lesser extent, currency risks with respect to future inventory purchases were also hedged during the reporting period.
The fair value hedges cover not only US dollar contracts but also contracts for the euro, the Turkish lira, the British pound, and the other currencies. All open foreign exchange contracts fall due and have an effect on liquidity and the income statement within twelve months of the balance sheet date. Assuming unchanged exchange rates, a cash outflow of CHF 462 million (gross) would be offset by a cash inflow of CHF 463 million (gross), giving a positive market value of CHF 1 million. Cash flow hedges account for cash outflows of CHF 68 million (gross) and cash inflows of CHF 67 million (gross).
Contract values, net by currencies
CHF million 2018 2017
USD/CHF 360 330EUR/CHF 27 81TRY/USD 13 10GBP/EUR 4 10CNY/USD 9USD/SEK 9 7SEK/CHF 7 7GBP/CHF 4 7JPY/CHF 7 6SGD/CHF 8 4EUR/TRY 5 Other 19 3Total 463 474
Accounting principlesDerivative financial instruments used to hedge such balance sheet items are stated at fair value. In hedging contractually agreed future cash flows (hedge accounting), the effective portion of changes in the derivative financial instruments’ fair value is recognized in equity with no effect on the income statement. Any ineffective portion is recognized immediately in the income statement. As soon as an asset or liability results from the hedged underlying transaction, the gains and losses previously recognized in equity are derecognized and transferred to the income statement along with the valuation effect from the hedged underlying transaction.

126 Consolidated financial statements
Interest rate risk The interest rate risk may involve either changes in future interest payments owing to fluctuations in market interest rates or the risk of a change in market value, i.e. the risk that the market value of a financial instrument will change owing to fluctuations in market interest rates.
Market value sensitivity analysis for interest-bearing financial instruments with a fixed interest rate: Market value fluctuations of fixed-interest financial instruments are not recognized in the Corporation’s income statement. Therefore, a change in interest rates would not have any effect on the income statement. Hedge accounting was not applied for interest rate hedging.
Cash flow sensitivity analysis for financial instruments with variable interest rates: a one-percentage-point increase in interest rates would have increased net income by CHF 4.2 million (previous year: CHF 5.0 million). A reduction in the interest rate by the same percentage would have reduced net income by the same amount. The underlying assumption for this analysis is that all other variables remain unchanged.
Price risk The securities held for trading in the amount of CHF 6 million are exposed to price risks (on the stock market). Since the value of the securities held for trading is modest, there is no great sensitivity to changes in share prices. The securities held are mainly shares in Swiss blue chip companies.
Liquidity risk The following table shows the contractual maturities (including interest rates) of the financial liabilities held by GF:
1 For more details, see note 2.3 (2.3.1 Other liabilities).
CHF million Carryingamount
Contractualcash flows
Up to1 year
1 to 5years
More than5 years
Trade accounts payable 498 498 498 Bonds 574 631 8 181 442Other financial liabilities 202 227 155 72 Accrued liabilities and deferred income 253 253 253 Other liabilities current/non-
current 1 95 95 56 35 4Total 1'622 1'704 970 288 446
The liquidity risk is the risk that GF is unable to meet its obligations when they fall due.
Liquidity is constantly monitored to ensure that it remains adequate. Liquidity reserves are held in order to offset the usual fluctuations in liquidity requirements. At the same time, the Corporation has unused credit lines in case more serious fluctuations occur. The total amount of unused credit lines as of 31 December 2018 was CHF 591 million (previous year: CHF 577 million). The credit lines are spread over several banks so that there is no excessive dependence on any one institution.

127 Consolidated financial statements
4. Corporate structure
This section provides information on how the Corporate structure affects the financial position and performance of the Corporation as a whole. In particular, information about changes to the structure that occurred during the year as a result of additions and disposals is provided.
4.1 Additions and disposals4.1.1 Changes in scope of consolidationDuring the year under review, the scope of consolidation changed as follows:
Additions (acquisitions) 2018– As of 1 April 2018, Precicast Industrial Holding SA, Novazzano, Switzerland
Pro rata sales 2018: CHF 77.3 millionDivision: GF Casting Solutions
Additions (foundations) 2018– As of 1 April 2018, PT Georg Fischer Indonesia (Trading), Karawang, Indonesia Division: GF Piping Systems
Disposals (divestments) 2018– As of 1 December 2018, iron casting plants Singen and Mettmann, Germany
Division: GF Casting Solutions
Iron casting plant Singen:GF Casting Solutions Singen GmbH, Singen, GermanyGF Casting Solutions Machining Singen GmbH, Singen, Germany
Iron casting plant Mettmann:GF Casting Solutions Mettmann GmbH, Mettmann, GermanyGF Casting Solutions Services GmbH, Mettmann, Germany
Pro rata sales 2018: CHF 617.3 million
During the previous year, the scope of consolidation changed as follows:
Additions (foundations) 2017– As of 29 June 2017, 9362-6877 Québec Inc, Montreal, Canada
Division: Corporate Management– As of 9 August 2017, GF Machining Solutions, S.A. de C.V., Monterrey, Mexico
Division: GF Machining Solutions– As of 26 September 2017, Chinaust Plastics Ltd, Haining, China
Division: GF Piping Systems
Additions (acquisitions) 2017– As of 31 July 2017, Urecon Ltd, Coteau-du-Lac, Quebec, Canada
Pro rata sales: CHF 10.7 millionDivision: GF Piping Systems
– As of 29 August 2017, PEM Zerspanungstechnik GmbH, Schwarzenberg, GermanyPro rata sales: CHF 0.5 millionDivision: GF Casting Solutions
– As of 26 September 2017, Symmedia GmbH, Bielefeld, GermanyPro rata sales: CHF 1.8 millionDivision: GF Machining Solutions
– As of 23 November 2017, Eucasting Ro SRL, Pitesti, RomaniaPro rata sales: CHF 7.1 millionDivision: GF Casting Solutions

128 Consolidated financial statements
4.1.2 Acquisitions and divestitures of Affiliated Companies
CHF million
Divestmentiron casting plant
Singen
Divestmentiron casting
plantMettmann
Totaldivestments
2018
Acquisition 2018Precicast Industrial Holding
SA
Total acquisitions
2017
Cash and cash equivalents 19 3Trade accounts receivable –53 –42 –95 27 15Inventories –40 –24 –64 43 10Other accounts receivable –9 –22 –31 4 2Property, plant, and equipment –40 –47 –87 22 28Intangible assets 1 7Deferred tax assets –11 –12 –23 1Other financial assets 9 Total assets –153 –147 –300 125 66
Deferred tax liabilities 5 2Non-interest bearing liabilities –117 –116 –233 36 21Interest-bearing liabilities –17 –17 –34 15Net assets –19 –14 –33 84 28
The table shows the value of the balance sheet items acquired at fair value at the time control was obtained as well as the carrying amounts of the balance sheet items deconsolidated at the time control was lost.
Total net cash-out for acquisitions inclusive earn-out payments amounted to CHF 154 million (previous year: CHF 74 million) in the year under review while divestment was cash neutral as explained below.
Additions (acquisitions) 2018
Acquisition of Precicast Industrial Holding SAIn the period under review, 100% of the shares of the Swiss precision casting specialist, Precicast Industrial Holding SA, Novazzano (Switzerland), control of the acquired company was assumed on 1 April 2018.
Precicast Industrial Holding SA (Precicast) is one of the few independent precision casting companies in Europe, specializing in super alloy components for aero engines and industrial gas turbines. In addition, the company produces components out of additive manufacturing (3D printing) through Precicast Additive SA.
The company generated a turnover of approx. CHF 120 million in 2017 with a workforce of 730 employees in Switzerland and in Romania.
Disposals (divestitures) 2018
Divestment of iron casting plants Singen and MettmannThe two iron casting plants in Singen and Mettmann (Germany) supplying the automotive industry with a dedicated workforce of around 2’000 employees and combined annual sales of CHF 617 million (for the eleven months in 2018) were deconsolidated on 1 December 2018. As a result of the divestment, all assets and liabilities of the formerly fully owned entities were deconsolidated.
GF retains a share of 20% in the equity of the divested GF Corporate Companies and also exercises a certain degree of influence on the divested entities. Consequently, GF records its share on the entities as investments in associates on the balance sheet as of 31 December 2018 and applies the equity accounting method, see note 5.2.
For the acquisition of the two iron casting plants and the subsequent acquisition of production equipment GF provided vendor financing in the amount of CHF 62 million, see note 5.2 for further details. After taking into account the deconsolidation of the assets and liabilities, the accumulated currency translation effects

129 Consolidated financial statements
as well as the related transaction costs and accruals, the transaction resulted in an even result in the income statement.
Additions (acquisitions) 2017The totals of assets and liabilities of the previous year’s acquisitions are presented in the table on the previous page. During the previous year the following affiliated companies were acquired:
Acquisition of Urecon Ltd9362-6877 Québec Inc, Montreal (Canada), acquired 49% of the capital of Urecon Ltd, Quebec (Canada). This acquisition includes an option to acquire the remaining 51% of the shares 24 months after the closing. Urecon is fully consolidated without minority interests as GF took the commercial and operational lead. The closing date was 31 July 2017.
Urecon, founded in 1969, generated sales of about CHF 20 million with a workforce of approximately 100 employees, in 2016. Urecon Ltd holds a strong market position with a focus on high-quality pre-insulated piping systems for freeze protection, chilled water, and district heating markets. Its two state-of-the-art production sites are located in the provinces of Quebec, Coteau-du-Lac (Canada), and Alberta, Calmar (Canada).
Acquisition of PEM Zerspanungstechnik GmbHMeco Eckel GmbH & Co KG, Biedenkopf-Wallau (Germany), acquired 51% of the capital of PEM Zerspanungstechnik GmbH, Schwarzenberg (Germany), and obtained full control of the acquired company. The closing date was 29 August 2017.
PEM is a small company with a dedicated, experienced workforce. This specialized engineering and machining company produces state-of-the-art HPDC tools and molds. PEM has been a major supplier to Meco Eckel for years.
Acquisition of Symmedia GmbHGeorg Fischer B.V. & Co KG, Singen (Germany), acquired 100% of the capital of Symmedia GmbH, Bielefeld (Germany). The closing date was 26 September 2017.
Symmedia was founded in 1997 and has a workforce of approximately 60 employees. The company has been specializing in software for secure machine connectivity solutions, commonly described as Industry 4.0, and is a key player in factory digitalization. The Symmedia technology will be used by GF to offer complete solutions for factory connectivity in industrial environments.
Acquisition of Eucasting Ro SRLGeorg Fischer Ltd, Schaffhausen (Switzerland), acquired 100% of the capital of Eucasting Ro SRL, Pitesti (Romania). The closing date was 23 November 2017.
Eucasting, founded in 1960 in Italy, generated sales of about CHF 50 million with a workforce of approximately 500 employees, in 2016. Eucasting is a high pressure aluminum die casting specialist. 60% of the sales are achieved in the automotive segment followed by lighting solutions and further industrial applications. Besides the die casting foundry in Pitesti (Romania) the company has a second plant in Scornicesti (Romania).
Accounting principlesCompanies acquired are consolidated from the date on which control is obtained, while companies sold are excluded from the scope of consolidation as of the date on which control is relinquished, with any gain or loss recognized in income.
Assets and liabilities of acquired companies are assessed at fair value at the time control is acquired. The translation of the original values into Swiss francs is calculated using the exchange rates of the respective transaction date. Assets and liabilities of divested companies are deconsolidated at their carrying amount.

130 Consolidated financial statements
4.2 Affiliated companies
Country Division Company
Func-tional
currency
Sharecapitalmillion
Partici-pation
%
Con-soli-
dation Func-tion
Europe
Austria PS Georg Fischer Fittings GmbH, Traisen EUR 3.7 51 C P
PS Georg Fischer Rohrleitungssysteme GmbH, Herzogenburg EUR 0,2 100 C S
CS GF Casting Solutions Services GmbH, Herzogenburg 1 EUR 4,6 100 C H
CS GF Casting Solutions Herzogenburg HPDC GmbH, Herzogenburg EUR 0,1 100 C P
CS GF Casting Solutions Herzogenburg Iron GmbH, Herzogenburg EUR 0,1 100 C P
CS GF Casting Solutions Altenmarkt GmbH & Co KG, Altenmarkt EUR 2,4 100 C P CS GF Casting Solutions Altenmarkt GmbH, Altenmarkt EUR 0,1 100 C M
Belgium PS Georg Fischer NV-SA, Bruxelles 1 EUR 0,5 100 C S
Czech MS GF Machining Solutions sro, Brno 1 CZK 12,3 100 C S
Denmark PS Georg Fischer A/S, Taastrup 1 DKK 0,5 100 C S
France CM Georg Fischer Holding SAS, Palaiseau 1 EUR 6,4 100 C H
PS Georg Fischer SAS, Villepinte EUR 1,1 100 C S MS GF Machining Solutions SAS, Palaiseau EUR 4,0 100 C S
Germany CM Georg Fischer BV & Co KG, Singen 1 EUR 25,6 100 C H
CM Georg Fischer Geschäftsführungs-GmbH, Singen 1 EUR 0,1 100 C M
CM Georg Fischer Giessereitechnologie GmbH, Singen EUR 0,5 100 C M
CM MGH Verwaltungs GmbH, Biedenkopf-Wallau EUR 0,1 51 C M
PS Georg Fischer DEKA GmbH, Dautphetal-Mornshausen EUR 2,6 100 C P
PS Georg Fischer GmbH, Albershausen EUR 2,6 100 C S
PS Georg Fischer Fluorpolymer Products GmbH, Ettenheim EUR 4,0 100 C P
PS Chinaust Automotive GmbH, Düsseldorf EUR 0,1 50 F S
CS GF Casting Solutions Singen GmbH, Singen EUR 0,1 20 E P
CS GF Casting Solutions Machining Singen GmbH, Singen EUR 12,8 20 E P
CS GF Casting Solutions Mettman GmbH, Mettmann EUR 0,1 20 E P
CS GF Casting Solutions Leipzig GmbH, Leipzig EUR 0,9 100 C P
CS GF Casting Solutions Werdohl GmbH, Werdohl EUR 0,3 100 C P
CS GF Casting Solutions Services GmbH, Mettmann EUR 0,1 20 E M
CS MECO Eckel GmbH & Co KG, Biedenkopf-Wallau EUR 0,2 51 C P
CS Eckel & Co GmbH, Biedenkopf-Wallau EUR 0,1 51 C M
CS PEM Zerspanungstechnik GmbH, Schwarzenberg EUR 0,1 51 C P
MS GF Machining Solutions GmbH, Schorndorf EUR 2,6 100 C S MS Symmedia GmbH, Bielefeld EUR 1,4 100 C P
Great Britain PS George Fischer Sales Ltd, Coventry 1 GBP 4,0 100 C S
MS GF Machining Solutions Ltd, Coventry 1 GBP 2,0 100 C S
Italy CM Georg Fischer Holding Srl, Caselle di Selvazzano 1 EUR 0,5 100 C H
PS Georg Fischer TPA Srl, Busalla EUR 0,7 100 C P
PS Georg Fischer Omicron Srl, Caselle di Selvazzano EUR 0,1 100 C P
PS Georg Fischer Pfci Srl, Valeggio sul Mincio EUR 0,5 100 C P
PS Georg Fischer SpA, Cernusco sul Naviglio EUR 1,3 100 C S MS GF Machining Solutions SpA, Cusano Milanino EUR 3,0 100 C S
Netherlands CM Georg Fischer Holding NV, Epe 1 EUR 0,9 100 C H
CM Georg Fischer Management BV, Epe 1 EUR 0,1 100 C M
PS Georg Fischer NV, Epe EUR 0,9 100 C S PS Georg Fischer WAGA NV, Epe EUR 0,4 100 C P
Norway PS Georg Fischer AS, Rud 1 NOK 1,0 100 C S
Poland PS Georg Fischer Sp.z.o.o., Sękocin Nowy 1 PLN 18,5 100 C S
MS GF Machining Solutions Sp.z.o.o., Sękocin Nowy 1 PLN 1,3 100 C S
Romania CS GF Casting Solutions SRL, Pitești 1 RON 6,5 100 C P CS GF Precicast SRL, Arad RON 24,5 100 C P
Spain PS Georg Fischer SA, Madrid 1 EUR 1,5 100 C S
MS GF Machining Solutions SAU, Barcelona 1 EUR 2,7 100 C S
Sweden PS Georg Fischer AB, Stockholm 1 SEK 1,6 100 C S
MS System 3R International AB, Vällingby 1 SEK 17,1 100 C P
Switzerland CM WIBILEA AG, Neuhausen 1 CHF 1,0 43 E M

131 Consolidated financial statements
CM Eisenbergwerk Gonzen AG, Sargans 1 CHF 0,5 49 F M
CM Georg Fischer AG, Schaffhausen CHF 4,1 C H
CM Munot Re AG, Schaffhausen 1 EUR 3,0 100 C M
CM Georg Fischer Finanz AG, Schaffhausen 1 CHF 4,0 100 C M
CM GF Precicast Industrial Holding SA, Novazzano 1 CHF 1,0 100 C H
PS Georg Fischer Rohrleitungssysteme AG, Schaffhausen 1 CHF 20,0 100 C P
PS
Georg Fischer Rohrleitungssysteme (Schweiz) AG,
Schaffhausen 1 CHF 0,5 100 C S
PS Georg Fischer Wavin AG, Schaffhausen 1 CHF 17,8 60 C P
PS Georg Fischer JRG AG, Sissach 1 CHF 1,8 100 C P
CS GF Casting Solutions AG, Schaffhausen 1 CHF 1,0 100 C M
CS GF Precicast SA, Novazzano CHF 1,0 100 C P
CS GF Precicast Ceramics SA, Novazzano CHF 1,2 100 C P
MS GF Precicast Additive SA, Novazzano CHF 0,2 50 C P
MS Agie Charmilles SA, Losone 1 CHF 10,0 100 C P
MS Agie Charmilles Services SA, Meyrin 1 CHF 3,6 100 C S
MS GF Machining Solutions Management SA, Meyrin 1 CHF 0,5 100 C M
MS GF Machining Solutions International SA, Losone 1 CHF 2,6 100 C S
MS Agie Charmilles New Technologies SA, Meyrin 1 CHF 2,0 100 C P
MS Mecartex SA, Losone CHF 0,4 30 E P
MS GF Machining Solutions AG, Nidau 1 CHF 3,5 100 C P
MS Step-Tec AG, Luterbach 1 CHF 1,3 100 C P Near East
UAE PS Georg Fischer Corys LLC, Dubai 1 AED 0,3 49 E P
Turkey PS Georg Fischer Hakan Plastik AS, Cerkezköy 1 TRY 270,0 100 C P
MS GF Imalat Cözümleri Ticaret Ltd Sti, Istanbul 1 TRY 2,9 100 C S Americas
Argentina PS Georg Fischer Central Plastics Sudamerica SRL, Buenos Aires 1 ARS 16,2 100 C S PS Polytherm Central Sudamericana SA, Buenos Aires ARS 0,1 49 E S
Brazil PS Georg Fischer Sistemas de Tubulacoes Ltda, São Paulo 1 BRL 11,5 100 C S
MS GF Machining Solutions Máquinas Ltda, São Paulo 1 BRL 60,9 100 C S
Canada CM 9362-6877 Québec Inc, Montreal 1 CAD 23,2 100 C H
PS Georg Fischer Piping Systems Ltd, Mississauga 1 CAD 1,3 100 C S PS GF Urecon Ltd, Coteau-du-Lac, Québec CAD 10,9 49 C P
Mexico PS Georg Fischer SA de CV Mexico, Monterrey 1 MXN 0,1 100 C S
MS GF Machining Solutions LLC, Monterrey 1 MXN 0,1 100 C S
USA CM George Fischer Corporation, El Monte, CA 1 USD 0,1 100 C H
CM Georg Fischer Export Inc, El Monte, CA 1 USD 0,1 100 C M
PS Georg Fischer LLC, Irvine, CA USD 3,8 100 C S
PS Georg Fischer Signet LLC, El Monte, CA USD 0,1 100 C P
PS Georg Fischer Central Plastics LLC, Shawnee, OK USD 1,1 100 C P
PS Georg Fischer Harvel LLC, Easton, PA USD 0,1 100 C P
PS Chinaust Automotive LLC, Troy, MI USD 0,1 50 F S
CS GF Linamar LLC, Mills River, NC USD 23,3 50 C P
MS GF Machining Solutions LLC, Lincolnshire, IL USD 0,1 100 C S MS Microlution Inc, Chicago, IL USD 2,6 100 C P Asia/Australia
Australia CM George Fischer IPS Pty Ltd, Riverwood 1 AUD 7,1 100 C H PS George Fischer Pty Ltd, Riverwood AUD 3,8 100 C S
China CM Georg Fischer Business Services (Shanghai) Co Ltd, Shanghai 1 CNY 1,1 100 C M
PS Changchun Chinaust Automobile Parts Corp Ltd, Changchun CNY 10,0 50 P P
PS Chinaust Plastics Corp Ltd, Zhuozhou CNY 100,0 50 P P
PS Chinaust Plastics (Shenzhen) Co Ltd, Shenzhen 1 CNY 80,0 50 P P
PS Chinaust Plastics (Sichuan) Corp Ltd, Dujiangyan 1 CNY 80,0 50 P P
PS Hebei Chinaust Automotive Plastics Corp Ltd, Zhuozhou 1 CNY 58,2 50 P P
PS Shanghai Chinaust Automotive Plastics Corp Ltd, Shanghai 1 CNY 40,3 50 P P

132 Consolidated financial statements
PS Shanghai Chinaust Plastics Corp Ltd, Shanghai CNY 66,0 50 P P
PS
Shanghai Georg Fischer Chinaust Plastics Fittings Corp Ltd,
Shanghai 1 CNY 52,0 51 C P
PS Georg Fischer Piping Systems Ltd, Shanghai 1 CNY 41,4 100 C P
PS Georg Fischer Piping Systems (Trading) Ltd, Shanghai 1 CNY 1,7 100 C S
PS Georg Fischer Piping Systems Ltd, Beijing 1 CNY 36,7 100 C P
PS Beijing Jingran Lingyun Gas Equipment Co Ltd, Langfang 1 CNY 6,0 40 P P
PS Langfang Shuchang Auto Parts Co Ltd, Langfang 1 CNY 10,0 40 P P
PS Chinaust Plastics Ltd, Haining CNY 100,0 50 P P
PS Chinaust Plastics Ltd, Xian CNY 73,0 50 P P
CS GF Casting Solutions Suzhou Co Ltd, Suzhou 1 CNY 209,5 100 C P
CS GF Casting Solutions Kunshan Co Ltd, Kunshan 1 CNY 149,5 100 C P
MS GF Machining Solutions Ltd, Hongkong 1 HKD 3,5 100 C S
MS Agie Charmilles China (Shanghai) Co Ltd, Shanghai CNY 2,5 100 C S
MS Agie Charmilles China (Shenzhen) Ltd, Shenzhen CNY 2,5 100 C S
MS Agie Charmilles China (Tianjin) Ltd, Tianjin CNY 1,7 100 C S
MS Beijing Agie Charmilles Industrial Electronics Co Ltd, Beijing 1 CNY 80,3 78 C P
MS Beijing Agie Charmilles Technology & Service Ltd, Beijing CNY 4,5 78 C S
MS Changzhou Agie Charmilles Machine Tool Co Ltd, Changzhou 1 CNY 138,1 100 C P
MS Liechti (Shanghai) Engineering Co Ltd, Shanghai 1 CNY 0,1 100 F M
India PS Georg Fischer Piping Systems PVT Ltd, Mumbai 1 INR 215,4 100 C P
Indonesia PS PT GF Piping Systems Indonesia, Karawang IDR 12,7 100 C P PS Georg Fischer Indonesia (Trading), Karawang IDR 3,4 100 C S
Japan PS Georg Fischer Ltd, Osaka 1 JPY 480,0 81 C S
MS GF Machining Solutions Ltd, Tokyo 1 JPY 50,0 100 C S
Korea PS Georg Fischer Korea Co. Ltd., Yongin-si 1 KRW 600,0 100 C S
MS GF Machining Solutions Co Ltd, Seoul 1 KRW 975,0 100 C S
Malaysia PS George Fischer (M) SDN BHD, Klang 1 MYR 10,0 100 C P
New Zealand PS Georg Fischer Ltd, Wellington 1 NZD 0,1 100 C S
Singapore CM Eurapipe Holdings Ptd Ltd, Singapore 1 SGD 6,2 100 C H
PS George Fischer Pte Ltd, Singapore SGD 9,2 100 C S MS GF Machining Solutions Pte Ltd, Singapore SGD 2,1 100 C S
Taiwan PS Georg Fischer Co Ltd, New Taipei City 1 TWD 1,0 100 C S
MS GF Machining Solutions Ltd, San Chung, Taipei Hsien 1 TWD 10,0 100 C S
Vietnam MS GF Machining Solutions Co Ltd, Hanoi 1 VND 5000,0 100 F S
1 Directly held by Georg Fischer Ltd.
CM = Corporate ManagementPS = GF Piping SystemsCS = GF Casting SolutionsMS = GF Machining Solutions
Division
C = Fully consolidatedP = Proportionately consolidatedE = Stated based on the equity methodF = Stated at estimated fair value
Consolidation
H = HoldingP = ProductionM = Management and ServicesS = Sales
Function
Status as of 31 December 2018

133 Consolidated financial statements
4.3 Related PartiesRelated parties include associated companies, members of the Board of Directors and the Executive Committee, pension funds and major shareholders as well as companies under their control. Transactions with related parties are generally conducted at arms’ length.
4.3.1 Transactions with related partiesAs of 31 December 2018, the “Other financial assets” included CHF 62 million of loans to related companies which were granted in the financial year, see note 5.2. Contingent liabilities to related companies in favor of third parties in the maximum amount of CHF 125 million existed, see note 2.6 (2.6.3 Categories of financial instruments). In addition, a credit line of CHF 23 million existed towards a related party, of which CHF 1 million was used per 31 December 2018.
4.3.2 Compensation of related partiesTotal compensation paid to the Board of Directors and Executive Committee breaks down as follows (see Compensation Report):
CHF 1'000 2018 2017
Cash compensation 6'959 6'812Pension funds 864 857Social security 485 495Share-based compensation 2'558 4'044Total compensation 10'866 12'208
The members of the Board of Directors are compensated by a fixed number of Georg Fischer registered shares blocked for a period of five years and a fixed fee paid in cash. Compensation corresponds to the respective function (Chairman, member of committees, etc.). The total compensation of the Board of Directors is recognized as operating expenses, see note 1.3 (1.3.1 Operating expenses).
The compensation for the Executive Committee consists of a long-term share-based incentive, a short-term cash incentive and a fixed base salary. The share-based incentive is granted to members of the Executive Committee in the form of performance shares (PS). The vesting is subject to two specific performance measures followed by a two-year blocking period. The total compensation of the Executive Committee is recognized accordingly in personnel expenses, see note 1.3 (1.3.2 Personnel expenses).
Share-based compensation is calculated based on the year-end share price of CHF 786.50 CHF (previous year: CHF 1’288.00). In the financial year, 1’500 restricted shares were granted to the Board of Directors (previous year: 1’390) and 1’752 performance shares were allotted to the Executive Committee (previous year: 1’750 shares). Share-based compensation to the Board of Directors and Executive Committee amounted to CHF 2.6 million (previous year: CHF 4.0 million).
No member of the Executive Committee or the Board of Directors or any persons related to them received any fees or other compensation for additional services to Georg Fischer Ltd or its Corporate Companies in the 2018 financial year.
The detailed disclosure of the compensation and shareholdings of the members of the Board of Directors and the Executive Committee in accordance with Swiss law can be found in the Compensation report, respectively in the financial statements of Georg Fischer Ltd in note 6 Compensation and shareholdings.
4.3.3 Loans to members of governing bodiesNeither Georg Fischer Ltd nor its GF Corporate Companies granted any guarantees, loans, advances, or credit facilities to members of the Executive Committee or the Board of Directors or to any persons related to them.

134 Consolidated financial statements
5. Other information
This section provides other information and disclosures not included in other sections for example information about the employee benefits obligations. It also includes an overview of the balance-sheet related deferred tax assets and liabilities and then significant events occurring after the reporting date.
5.1 Employee benefit liabilitiesEconomic benefit/economic obligation and pension benefit expenses
2018 2017 2018 2017
CHF million
Surplus/deficit
according to
FER 26
Economic part
of theCorporation
Economic part
of theCorporation
Translationdifferences
Change to prior-year
period or
recognized in the
current result of the
period, respectively
Contri-butions
concering the
business period
Pension benefit
expenses within
personnelexpenses
Pension benefit
expenses within
personnelexpenses
Patronage funds 20 9 1 1 1Employee benefit plans w/o surplus/deficit 15 15 13Employee benefit plans with surplus 32 10 10 9Employee benefit plans with deficit –20 –14 –20 –1 –5 2 –3 Employee benefit plans without own assets –33 –107 –2 7 2 9 1Loans from pension fund institutions –4 –28 2 Total 32 –42 –155 –1 2 30 32 24
GF maintains mostly defined benefit pension plans in Switzerland, Germany, Great Britain and the USA, with the employee benefit plan in the USA intended to be closed in the second half of 2019. With the exception of pension plans in Germany, the employee pension plans have their own assets in addition to the respective pension obligations.
The table shows the economic benefit and the economic obligation at the end of the year under review and for the previous year, as well as the changes in pension benefit expenses.
The economic proportion in the patronage fund in the amount of CHF 9 million is attributable to the acquisition of Precicast Industrial Holding SA and represents long-term investments in securities as collateral for pension liabilities, which are included under “Other financial assets” see note 5.2.
The pension plans overfunded in the amount of CHF 32 million (previous year: CHF 24 million) are attributable to the Georg Fischer Pension Fund. The assets developed positively in the year under review thanks to the revaluation of the real estate. However, the GF Machining Solutions Pension Fund is no longer overfunded (previous year: CHF 24 million), partly due to the loss made on assets and changes in technical parameters.
The pension plans underfunded in the amount of CHF 20 million (previous year: CHF 24 million) are based on the defined benefit plans in Great Britain and the USA. The amount of the underfunding depends significantly on the value of the securities and on the discount rate and the expected mortality rate used in the calculation of the pension liabilities. The total economic obligation, which represents the expected cash outflow in the medium term, amounts to CHF 14 million (previous year: CHF 20 million). Due to the upcoming liquidation of the pension fund in the USA as at the end of 2019, which is expected to have a slightly positive outcome, and the favourable trend in the discount rate in Great Britain, the economic

135 Consolidated financial statements
obligation was reduced by CHF 5 million. The income is included in the pension fund expenses for the period.
The recognized economic obligation from the pension plans with no assets of their own, i.e. unfunded plans, amounted to CHF 33 million (previous year: CHF 107 million) and concerns primarily the employee pension plans in Germany. The CHF 74 million decrease was largely due to the divestment of the two iron casting plants in Singen and in Mettmann in the amount of CHF 79 million. In addition, the mortality tables in Germany were adjusted. This led to a corresponding increase in the economic obligation in the amount of CHF 7 million and is included in the pension fund expenses for the period.
Loans from pension funds in the amount of CHF 4 million (previous year: CHF 28 million) are current account balances of patronage foundations at Georg Fischer AG. In the previous year, these loans mainly originated from pension funds in Germany that had invested their fund assets in Group companies. The CHF 24 million decrease is due to the divestment of the two iron casting plants in Singen and Mettmann.
The following table summarizes the pension benefit expenses in the year under review and for the previous year:
CHF million 2018 2017
Contributions to employee benefit plans from Corporate Companies 30 26Contributions to employee benefit plans from employer contribution reserves Total contributions 30 26+/- Change in ECR from asset developments, value adjustments, etc. Contributions and change in employer contribution reserves (ECR) 30 26
Decrease/increase in economic benefit of the Corporation from surplus Increase/decrease in economic obligation of the Corporation from deficit –1Increase/decrease in economic obligation of the Corporation (employee benefit plans without own assets) 2 –1Total change in economic effect of surplus/deficit 2 –2Pension benefit expenses within personnel expenses in the period under review 32 24
Movements in the recognized economic obligations from pension plans and the employer-paid contributions for the year under review amounted to CHF 32 million (previous year: CHF 24 million) and are included in “Personnel expenses”.
Accounting principlesThe employee benefit plans of the Corporation comply with the legislation in force in each country. Employee benefit plans are mostly institutions and foundations that are independent of the Corporation. They are usually financed by both, employee and employer contributions.
The economic impact of the employee benefit plans is assessed each year. Surpluses or deficits are determined by means of the annual statements of each specific benefit plan, which are based either on Swiss GAAP FER 26 (Swiss benefit plans) or on the accepted methods in each foreign country (foreign plans). An economic benefit is capitalized if it is permitted and intended to use the surplus to reduce the employee contributions. If employer contribution reserves exist, they are also capitalized. An economic obligation is recognized as a liability if the conditions for an accrual are met. They are reported under “Employee benefit obligations”. Changes in the economic benefit or economic obligation, as well as the contributions incurred for the period, are recognized in “Personnel expenses” in the income statement.
5.2 Other financial assetsOther financial assets amounted to CHF 99 million (previous year: CHF 13 million) and included non-current loans and receivables in the amount of CHF 79 million (previous year: CHF 9 million), securities for the settlement of pension liabilities in the amount of CHF 12 million (previous year: CHF 3 million) as well as investments in associates of CHF 8 million (previous year: CHF 1 million).
At the beginning of December 2018, GF divested two iron-casting plants in a management buy-out transaction. Through the divestment GF granted a loan in the amount of CHF 52 million and recognized investments in associates in the amount of CHF 6 million, see note 4.1 for further details.

136 Consolidated financial statements
The loan amount was subsequently increased by CHF 10 million following the of sale production equipment. CHF 9 million of the increase was recorded as non-current loan. The total of CHF 10 million represents the net amount of the production equipment sold after taking into consideration related financing arrangements that were also part of the sale transaction, see note 2.4 for further details.
The loan agreement has an expected maturity of up to 5 years and includes stepped-up interest rates (3%–5%).
Accounting principlesNon-current loans and receivables are initially recorded at fair value and subsequently accounted for at amortized cost. Investments in associates are accounted for under the equity method or stated at fair value.
5.3 Deferred tax assets and liabilities
CHF million Tax assets Tax
liabilities 2018
net Tax assets Tax
liabilities 2017
net
Investment properties 23 –23 7 –7Property, plant, and equipment for own use 25 45 –20 11 34 –23Intangible assets 2 2 2 2 Tax loss carryforwards 6 6 4 4Inventories 23 16 7 24 14 10Provisions 10 3 7 14 4 10Other interest-bearing liabilities 3 2 1 2 2Other non-interest-bearing liabilities 19 7 12 41 9 32Other balance sheet items 5 5 14 4 10Total 93 103 –10 112 74 38
Offsetting –40 –40 –27 –27 Deferred tax assets/liabilities 53 63 –10 85 47 38
Deferred tax assets and liabilities are offset within GF Corporate Companies when there is a legally enforceable right to offset current tax assets against current tax liabilities and the deferred taxes related to the same fiscal authority. The effect of offsetting at the GF Corporate Company level amounted to CHF 40 million (previous year: CHF 27 million). Deferred tax assets and liabilities are calculated based on the actually expected income tax rates for each GF Corporate Company. For further information on the recognition of tax loss carryforwards, see note 1.4.
Temporary differences associated with investments in subsidiaries, for which no deferred tax liabilities have been recognized, amounted to CHF 449 million as of 31 December 2018 (previous year: CHF 437 million).
5.4 Events after the balance sheet dateThe consolidated financial statements were approved and released for publication by the Board of Directors on 21 February 2019. They must also be approved at the Annual Shareholders’ Meeting.
There were no events between 31 December 2018 and 21 February 2019 that would require an adjustment to the carrying amounts of assets and liabilities and equity or would need to be disclosed under this heading.

137 Consolidated financial statements
Report of the statutory auditor to the Annual Shareholders’ Meeting of Georg Fischer Ltd, Schaffhausen
Report on the audit of the consolidated financial statementsOpinionWe have audited the consolidated financial statements of Georg Fischer Ltd and its subsidiaries (the Group), which comprise the consolidated income statement for 2018, the consolidated balance sheet as at 31 December 2018 and the consolidated statement of changes in equity and consolidated cash flow statement for the year then ended, and notes to the consolidated financial statements, including a summary of significant accounting policies. In our opinion, the accompanying consolidated financial statements give a true and fair view of the consolidated financial position of the Group as at 31 December 2018 and its consolidated financial performance and its consolidated cash flows for the year then ended in accordance with Swiss GAAP FER and comply with Swiss law.
Basis for opinionWe conducted our audit in accordance with Swiss law and Swiss Auditing Standards. Our responsibilities under those provisions and standards are further described in the “Auditor’s responsibilities for the audit of the consolidated financial statements” section of our report.
We are independent of the Group in accordance with the provisions of Swiss law and the requirements of the Swiss audit profession and we have fulfilled our other ethical responsibilities in accordance with these requirements. We believe that the audit evidence we have obtained is sufficient and appropriate to provide a basis for our opinion.
Our audit approach

138 Consolidated financial statements
MaterialityThe scope of our audit was influenced by our application of materiality. Our audit opinion aims to provide reasonable assurance that the consolidated financial statements are free from material misstatement. Misstatements may arise due to fraud or error. They are considered material if, individually or in aggregate, they could reasonably be expected to influence the economic decisions of users taken on the basis of the consolidated financial statements.
On the basis of our professional judgement, we determined certain quantitative thresholds for materiality, including the overall Group materiality for the consolidated financial statements as a whole as set out in the table below. These, together with qualitative considerations, helped us to determine the scope of our audit and the nature, timing and extent of our audit procedures and to evaluate the effect of misstatements, both individually and in aggregate, on the consolidated financial statements as a whole.
Overall materiality CHF 17'250'000How we determined it 5% of profit before taxRationale for the materiality benchmark applied
We chose profit before tax as the benchmark because, in our view, it is the benchmark against which the performance of the Group is most commonly measured, and it is a generally accepted benchmark.
Audit scopeWe tailored the scope of our audit in order to perform sufficient work to enable us to provide an opinion on the consolidated financial statements as a whole, taking into account the structure of the Group, the accounting processes and controls, and the industry in which the Group operates.
The Group is structured along three divisions, GF Piping Systems, GF Casting Solutions and GF Machining Solutions, operating across three key geographical locations – Europe, North & South America and Asia. The Group’s financial statements are a consolidation of 145 reporting units, each of which, including both the Group’s operating businesses and the central service functions, is considered a component.
We identified 46 reporting units that, in our view, required a full scope audit and three reporting units that required specified procedures due to their size and or risk characteristics. These full scope audits addressed over 69% of the Group’s revenue and 70% of the Group’s total assets, while the specified procedures addressed 6% of the Group’s revenue and 3% of the Group’s total assets.
The remaining 25% of the Group’s revenue and 27% of the Group’s total assets was represented by a large number of smaller reporting units. None of these reporting units individually contributed more than 3.5% to consolidated revenue or total assets.
Where the work was performed by component auditors, we determined in addition to our instructions the necessary level of our involvement in the audit work, which consisted of visiting component audit teams, inspecting their work performed, conducting planning and closing calls, or reviewing their final reporting.
Where component audits were conducted by an auditor outside of the PwC network, the work performed was discussed and reviewed by PwC on a sample basis.
Further specific audit procedures on central service functions, the Group consolidation and areas of significant judgement (including M&A transactions, taxation, treasury and litigation) were led by the Group audit team.
Report on key audit matters based on the circular 1/2015 of the Federal Audit Oversight AuthorityKey audit matters are those matters that, in our professional judgement, were of most significance in our audit of the consolidated financial statements of the current period. These matters were addressed in the context of our audit of the consolidated financial statements as a whole, and in forming our opinion thereon, and we do not provide a separate opinion on these matters.

139 Consolidated financial statements
Accounting for business combinations
Key audit matter How our audit addressed the key audit matterDuring the financial year, the Group made one acquisition, which we considered to have a material impact on the Group’s assets and liabilities and its income statement items.
Accounting for business combinations is considered a key audit matter as it involves significant judgement by management.
Management needs to determine the date of first consolidation as well as the consolidation method to be applied. Further, management may need to apply judgement when estimating the fair value of the assets and liabilities acquired.
Management determined that the fair value of the net identifiable assets acquired is CHF 84 million. The goodwill arising from the acquisition amounts to CHF 73 million.
To assess the appropriateness of the accounting for business combinations, we assessed the procedures performed by management to identify the assets and liabilities acquired, and reviewed the relevant legal documents such as the share purchase agreement.
In particular, we performed the following audit procedures:
• We considered the appropriateness of the acquisition date determined by management by reviewing the relevant clauses of the related share purchase agreement.
• We performed various substantive audit procedures to ensure the completeness of the identified assets and liabilities acquired and the reasonableness of the valuation methodologies applied by management.
• This included, amongst other audit procedures, reviewing the valuation and accounting of the purchase consideration, the identification and valuation performed by management or its experts of the assets and liabilities acquired.
• We verified the accuracy of the calculations performed, including their mathematical correctness.
• We assessed whether the transaction was accounted for and disclosed in the consolidated financial statements in accordance with the provisions of Swiss GAAP FER 30.
Based on the procedures performed, the valuation of the opening balances of the acquired company is reasonable and the related disclosures are appropriate.
Impairment of goodwill
Key audit matter How our audit addressed the key audit matterThe impairment assessment for goodwill is considered a key audit matter due to the size of the balance (carrying amount: CHF 129 million) and the significant assumptions management has to apply. The main estimation uncertainty relates to the projection of future free cash flows.
In line with the Georg Fischer accounting policy, the goodwill is fully offset against equity. The consequence of a theoretical recognition on the balance sheet and the subsequent amortisation is disclosed in the notes to the consolidated financial statements.
We obtained all impairment models prepared by management and performed the following audit procedures:
• We ensured that the models are based on the latest business plans. Management follows a clearly documented process for estimating future cash flows. The forecast period used for future cash flows covers the years 2019 to 2023. The estimates are based on the latest budgets approved by the Board of Directors.
• We assessed the reasonableness of the business plan by comparing the implicit growth rates with the market and analyst forecasts. Further, we verified whether the assumptions made by management in their models are internally consistent.
• We compared the current year actual results with the forecast figures included in the prior year impairment tests.
• We developed our own expectations of the risk adjusted weighted average cost of capital and the long-term growth rate.
• We performed our own sensitivity analyses to obtain a better understanding of how strongly the current valuation of goodwill is supported.
Overall, on the basis of our review of the impairment models, the supporting evidence obtained as well as the results of our own sensitivity analyses, we concluded that the impairment models used are appropriate, that results of the impairment tests are reasonable and that there is no impairment of goodwill.

140 Consolidated financial statements
Accounting for divestments
Key audit matter How our audit addressed the key audit matterAs at 1 December 2018, Georg Fischer Group divested two automotive iron-casting plants in Germany (Singen and Mettmann) with a dedicated workforce of 2'000 employees and combined sales of approximately CHF 617 million (for the eleven months in 2018). The plants were acquired by Fondium B.V. & Co. KG, Mettmann, which is controlled by three former members of GF Casting Solutions management. Georg Fischer Group retains a share of 20% in the equity of the divested entities.
The divestment of a subsidiary is not an everyday occurrence within the Group. Hence, there is a risk that not all related deconsolidation entries as well as disclosures, as required under Swiss GAAP FER, are correct and complete.
The divestment of the two iron-casting plants is described in note 4.1 “Additions and disposals”.
Our audit work included the following procedures:
• We read thoroughly the underlying share purchase agreement and performed an assessment of the contract’s key features on the accounting implications, including the appropriateness of the deconsolidation date.
• We audited the pro-rata consolidation of the income statements of the two plants up to the date of the divestment.
• We tested the deconsolidation entries. In particular, we tested the recycling from equity to income of the associated currency translation adjustments and the calculation of the respective results of the divestment of the two plants.
• We assessed whether the presentation and disclosure were in accordance with the requirements of Swiss GAAP FER.
On the basis of the work performed, we consider the accounting, presentation and disclosure of the divestment as reasonable.
Responsibilities of the Board of Directors for the consolidated financial statementsThe Board of Directors is responsible for the preparation of the consolidated financial statements that give a true and fair view in accordance with Swiss GAAP FER and the provisions of Swiss law, and for such internal control as the Board of Directors determines is necessary to enable the preparation of consolidated financial statements that are free from material misstatement, whether due to fraud or error.
In preparing the consolidated financial statements, the Board of Directors is responsible for assessing the Group’s ability to continue as a going concern, disclosing, as applicable, matters related to going concern and using the going concern basis of accounting unless the Board of Directors either intends to liquidate the Group or to cease operations, or has no realistic alternative but to do so.
Auditor’s responsibilities for the audit of the consolidated financial statementsOur objectives are to obtain reasonable assurance about whether the consolidated financial statements as a whole are free from material misstatement, whether due to fraud or error, and to issue an auditor’s report that includes our opinion. Reasonable assurance is a high level of assurance, but is not a guarantee that an audit conducted in accordance with Swiss law and Swiss Auditing Standards will always detect a material misstatement when it exists. Misstatements can arise from fraud or error and are considered material if, individually or in the aggregate, they could reasonably be expected to influence the economic decisions of users taken on the basis of these consolidated financial statements.
A further description of our responsibilities for the audit of the consolidated financial statements is located at the website of EXPERTsuisse: http://expertsuisse.ch/en/audit-report-for-public-companies. This description forms part of our auditor’s report.

141 Consolidated financial statements
Report on other legal and regulatory requirementsIn accordance with article 728a paragraph 1 item 3 CO and Swiss Auditing Standard 890, we confirm that an internal control system exists which has been designed for the preparation of consolidated financial statements according to the instructions of the Board of Directors.
We recommend that the consolidated financial statements submitted to you be approved.
PricewaterhouseCoopers AG
Stefan RäbsamenAudit expertAuditor in charge
Diego J. AlvarezAudit expert
Zurich, 21 February 2019

142 Financial statements Georg Fischer Ltd
Income statement
For the years ended 31 December 2018 and 2017, CHF 1'000 Notes 2018 2017
Dividend income 2.1 155'731 126'581Income from services provided to Corporate Companies 2.2 67'407 62'360Financial income 2.3 7'280 23'695Commission income from Corporate Companies 2.4 11'167 12'118Other income 2'945 2'087Income 244'530 226'841
Value adjustment on investments 2.5 20'000 30'000Other expenses for investments 2'128 2'207Financial expenses 2.6 13'378 1'531Cost of services provided by Corporate Companies 2'239 2'241Personnel expenses 20'619 20'661Other operating expenses 2.7 16'452 15'835Direct taxes 2.8 5'346 9'707Expenses 80'162 82'182
Net profit for the year 164'368 144'659

143 Financial statements Georg Fischer Ltd
Balance sheet
As of 31 December 2018 and 2017, CHF 1'000 Notes 2018 2017
Cash and cash equivalents and short-term investments with a quoted market price 3.1 157'050 181'508Other current receivables due from third parties 1'804 3'605Other current receivables due from Corporate Companies 3.2 19'785 24'697Accrued income and prepaid expenses 2'147 5'257Current assets 180'786 215'067
Loans to Corporate Companies 3.3 246'944 129'823Other financial assets 8'148 1'899Investments 3.4 1'278'312 1'111'485Equipment 132 Non-current assets 1'533'536 1'243'207
Assets 1'714'322 1'458'274
Current liabilities with third parties 12'982 12'066Short-term interest-bearing liabilities due to Corporate Companies 3.5 123'659 124'386Accrued expenses and deferred income 3.6 11'137 27'196Current liabilities 147'778 163'648
Long-term interest-bearing liabilities 3.7 206'048 3'790Long-term provisions 3.8 24'218 24'114Non-current liabilities 230'266 27'904
Liabilities 378'044 191'552
Share capital 3.9 4'101 4'101Legal capital reserves − Other capital reserves 89'506 89'506Legal reserves − Other legal reserves 59'234 59'234Statutory retained earnings − Available earnings carried forward 1'027'762 977'007− Net profit for the year 164'368 144'659Treasury shares 3.10 –8'693 –7'785Equity 1'336'278 1'266'722
Liabilities and equity 1'714'322 1'458'274

144 Financial statements Georg Fischer Ltd
Statement of changes in equity
1 Legal reserves.2 For more details, see note 1.8 and note 3.10.
For the years ended 31
December 2018 and 2017, CHF 1'000 Share capital
General
reserves 1
Treasury
shares 2 Retainedearnings Equity
Balance as of 31 December 2018 4'101 148'740 –8'693 1'192'130 1'336'278
Net profit for the year 164'368 164'368Dividend payment –94'238 –94'238
Acquisition of treasury shares 2 –12'395 –12'395
Disposal of treasury shares 2 11'487 334 11'821Balance as of 31 December 2017 4'101 148'740 –7'785 1'121'666 1'266'722
Net profit for the year 144'659 144'659Dividend payment –82'018 –82'018Reversal of reserve for
treasury shares 2 –10'355 10'355
Acquisition of treasury shares 2 –11'293 –11'293
Disposal of treasury shares 2 3'508 253 3'761Balance as of 31 December 2016 4'101 148'740 10'355 1'048'417 1'211'613

145 Financial statements Georg Fischer Ltd
Notes to the financial statements
1 Principles1.1 GeneralThese annual financial statements were prepared in accordance with the provisions of the Swiss accounting law (Title 32 of the Swiss Code of Obligations). The main valuation principles applied that are not prescribed by law are described below.
Georg Fischer Ltd, Schaffhausen (Switzerland), reports its consolidated financial statements based on a recognized standard (Swiss GAAP FER) and, in accordance with the legal provisions, the company has decided not to provide notes on the audit fees, a cash flow statement or a report on the business situation.
1.2 Securities with market priceSecurities held for the short term are valued at the market price on the balance sheet date. No equalization reserve has been created.
1.3 Loans to Corporate Companies and other financial assetsLoans granted to Corporate Companies and other financial investments in foreign currencies are valued at the market rate on the actual closing date. Unrealized currency losses are recognized, whereas unrealized gains are deferred (imparity principle). The valuation is at nominal values, taking into consideration any value adjustments required.
1.4 InvestmentsInvestments are valued in line with the principle of individual valuation. In addition, further flat-rate value adjustments can be applied.
1.5 Dividend incomeDividend income is recognized when paid out.
1.6 Share-based compensationMore information about share-based compensation is available in the Compensation Report as well as in note 6.
1.7 Long-term interest-bearing liabilitiesInterest-bearing liabilities are recognized at nominal value.
1.8 Treasury sharesTreasury shares are recognized at cost and deducted from shareholder’s equity. The gain or loss from the sale of treasury shares is recognized in shareholder’s equity as an increase or reduction in retained earnings.
2 Information on the income statement 2.1 Dividend incomeThe dividend income for the year under review was CHF 156 million (previous year: CHF 127 million).
2.2 Income from services provided to Corporate CompaniesThe income from Corporate Companies consisted primarily of licensing income for the use of the corporate brand +GF+ as well as income for services provided.
2.3 Financial incomeThe financial income comes from interest income on the loans granted to Corporate Companies.
2.4 Commission income from Corporate CompaniesThis position contains commission income from Corporate Companies for issued guarantees.

146 Financial statements Georg Fischer Ltd
2.5 Value adjustment on investmentsThis position includes value adjustments of investments held by Georg Fischer Ltd. The principles for the valuation of investments are found in note 1.4.
2.6 Financial expensesThis position includes interest expense for a bond of CHF 200 million issued in the year under review as well as losses on foreign currencies. More information on the bond issue can be found in note 3.7.
2.7 Other operating expensesThe main expense items related to external consulting services, marketing expenses, fees for the Board of Directors, and IT costs.
2.8 Direct taxesIncome taxes in the period under review concerned not only the income taxes of Georg Fischer Ltd, but also the corporation taxes of Georg Fischer BV & Co KG, Singen (Germany), acting as the German fiscal unity parent of GF. Georg Fischer Ltd, as the associate of Georg Fischer BV & Co KG is liable for German corporation taxes.
3 Information on balance sheet items 3.1 Cash and cash equivalents and short-term investments with a quoted market priceThis balance sheet item contains securities in the amount of CHF 3.1 million (previous year: CHF 3.6 million).
3.2 Other current receivables due from Corporate CompaniesThe balance sheet item includes short-term receivables and loans to Corporate Companies and items from cash pooling with Corporate Companies. These are reported as a gross amount under “Other current receivables due from Corporate Companies” and “Short-term interest-bearing liabilities due to Corporate Companies”.
3.3 Loans to Corporate CompaniesThe activities of Corporate Companies are, whenever possible and suitable, financed by loans from the Corporation instead of credit facilities from local banks.
3.4 InvestmentsDirect and indirect investments in Corporate Companies of Georg Fischer Ltd include the companies listed in note 4.2 in the consolidated financial statements.
3.5 Short-term interest-bearing liabilities due to Corporate CompaniesThis balance sheet item includes short-term liabilities and loans from Corporate Companies and items from cash pooling with Corporate Companies. These are reported as a gross amount under “Other current receivables due from Corporate Companies” and “Short-term interest-bearing liabilities due to Corporate Companies”.
3.6 Accrued expenses and deferred incomeAccrued expenses and deferred income comprises variable compensation for employees and fees for the Board of Directors as well as other deferred items.
3.7 Long-term interest-bearing liabilitiesOn 20 April 2018, Georg Fischer Ltd issued a bond of CHF 200 million on the Swiss capital market. The bond has a duration of 10 years and carries a coupon of 1.05%.
3.8 Long-term provisionsThis provision mainly concerns currency risks.

147 Financial statements Georg Fischer Ltd
3.9 Share capitalAs of 31 December 2018, the share capital amounted to 4’100’898 registered shares at a par value of CHF 1.
Conditional capital: As of 31 December 2018, the conditional capital amounted to CHF 0.6 million and can be created by exercising conversion or option rights granted in connection with debenture loans or similar bonds of Georg Fischer Ltd or its Corporate Companies that were issued on the capital markets.
Authorized capital: In accordance with the resolution of the Annual General Meeting of 18 April 2018, the Board of Directors is authorized to increase the share capital, until no later than 17 April 2020, by a maximum amount of CHF 0.6 million, by issuing a maximum of 600’000 fully paid-in registered shares with a nominal value of CHF 1 each. The increase may be made in partial amounts.
The maximum amount of the authorized or conditional capital is reduced by the amount that authorized or conditional capital is created through the issue of bonds or similar debt instruments or new shares.
3.10 Treasury sharesGeorg Fischer Ltd held 7’586 own shares on the balance sheet date. The principles for the valuation of treasury shares are found in note 1.8.
Before 2017, treasury shares were held by a fully consolidated subsidiary of Georg Fischer Ltd and accordingly, a reserve for treasury shares was set up at Georg Fischer Ltd. As of 31 December 2017, this reserve was reversed to retained earnings.
4 Additional information4.1 Full-time equivalentsAs of 31 December 2018, Georg Fischer Ltd employed 76 people including trainees.
4.2 Contingent liabilities
CHF 1'000 2018 2017
Guarantees and pledges to Corporate Companies in favor of third parties 1'490'080 1'831'005Guarantees to related parties in favor of third parties 125'251 Guaranteed maximum amount 1'615'331 1'831'005Thereof utilized 811'479 961'328
In addition, Georg Fischer Ltd bears joint liability with regard to the Swiss Federal Tax Administration for the amounts due of value-added tax of all the Swiss Corporate Companies.
4.3 Pension fund obligationsAt year-end 2018, pension fund obligations amounted to CHF 4.2 million (previous year: CHF 2.2 million).
4.4 Significant shareholdersAn overview can be found in the chapter Corporate Governance (GF share and GF shareholders).
4.5 Shareholdings of members of the Board of Directors, Executive Committee, or persons related to themInformation on the shareholdings of members of the Board of Directors, Executive Committee, or persons related to them is provided in note 4.2 in the consolidated financial statements.
5 Events after the balance sheet dateThere were no events between 31 December 2018 and 21 February 2019 that would require an adjustment to the carrying amounts of assets and liabilities and equity or would need to be disclosed under this heading.

148 Financial statements Georg Fischer Ltd
6 Compensation and shareholdingsBoard of DirectorsThe members of the Board of Directors received cash compensation of CHF 1.159 million in the year under review. In addition, a total of 1’500 GF registered shares with a total market value of CHF 1.18 million were allocated as share-related compensation. In the previous year, and due to the cap of the total remuneration of the Board of Directors approved by the shareholders in 2016 for 2017, the allocation had been 1’390 GF registered shares only, equivalent to a total market value of CHF 1.79 million. Together with other benefits, the total compensation paid to the Board of Directors in 2018 amounted to CHF 2.449 million (previous year: CHF 3.085 million) compared to a total amount approved by the shareholders of CHF 3.750 million.
The detailed disclosure of compensation to the Board of Directors is as follows:
Compensation of the members of the Board of Directors 2018
(all in CHF 1'000, except column "Number of shares")1 The cash compensation includes reimbursements for international travel amounting to CHF 45'000.2 The share-based compensation consists in the allocation of a fixed number of shares. The amount of the share-related compensation is
calculated based on the full value of the shares at the year-end price of CHF 786.50 on 31 December 2018.3 Social insurance funds represent employer contributions to social insurance funds.4 The total compensation encompasses the cash compensation, the share-based compensation, and the contribution to social insurance
funds.
Compensation Social
insurance
funds 3
Total compen-
sation
2018 4
Total compen-
sation
2017 4
Cash
compensation 1 Number of
shares
Share-based
compensation 2
Andreas Koopmann 270 300 236 22 528 655Chairman Board of Directors Chairman Nomination Committee Hubert Achermann 150 150 118 11 279 343Chairman Audit Committee Gerold Bührer 123 150 118 10 251 314Vice Chairman Board of Directors Member Audit Committee Roman Boutellier 90 150 118 8 216 286Member Nomination Committee Riet Cadonau 90 150 118 11 219 276Member Compensation Committee Roger Michaelis 123 150 118 13 254 317Member Audit Committee Eveline Saupper 110 150 118 12 240 304Chairwoman Compensation Committee Jasmin Staiblin 90 150 118 11 219 283Member Compensation Committee Zhiqiang Zhang 113 150 118 12 243 307Member Nomination Committee Total 1'159 1'500 1'180 110 2'449 3'085
The compensation paid to the Board of Directors for the year 2018 was below that of the previous year. The decrease is explained solely by the decreased value of the shares from CHF 1’288 in 2017 to CHF 786.50 in 2018. The compensation system for the Board of Directors remained unchanged.
In the year under review both Mr. Roger Michaelis and Mr. Zhiqiang Zhang received each CHF 22’500 for international travel time spent; these reimbursements are included in the cash compensation.
No further compensation was paid to members of the Board of Directors. No compensation was paid to parties closely related to members of the Board of Directors.

149 Financial statements Georg Fischer Ltd
Executive CommitteeThe members of the Executive Committee received cash, share-related compensation, social security and pension contributions amounting to CHF 8.417 million for the year under review (previous year: CHF 9.123 million) compared to a total amount of CHF 10.298 million approved by the shareholders at the Annual Shareholders’ Meeting of 19 April 2017.
Under the long-term incentive plan, 1’752 performance shares with a total value at grant of CHF 1.378 million, based on a share price of CHF 786.50 at year-end 2018, were granted to members of the Executive Committee for the year under review (previous year: 1’750 performance shares with a total value of CHF 2.254 million).
The detailed disclosure of compensation to the Executive Committee in accordance with the Swiss “Ordinance against excessive pay in stock exchange listed companies” is as follows:
Compensation of the members of the Executive Committee 2018
(all in CHF 1'000, except rows "EPS dependent performance shares" and "rTSR dependent performance shares")* The Executive Compensation includes the compensation for Josef Edbauer (Executive Committee member until 31 August 2018) and
includes the compensation for Carlos Vasto (Executive Committee member since 1 September 2018).1 The short-term incentive is based on the short-term incentive plan. The amount is determined by the fulfillment of personal performance
objectives and by the financial results of the divisions and the Corporation. The short-term incentive for the 2018 financial year was approved by the Board of Directors on 21 February 2019. Payment will be made in March 2019.
2 The share-based remuneration is based on the long-term incentive plan: Each year, fixed numbers of performance shares (PS) are allocated. The amount of the PS-based compensation is calculated based on the grant value of the PS at the year-end price of CHF 786.50 on 31 December 2018. The number of PS vesting after the vesting period of three years depends on meeting the respective performance criteria.
3 The social insurance funds expenses represent employer contributions to social security.4 The pension funds expenses represent employer contributions to pension funds.5 The total compensation is comprised of the fixed salary, the short-term incentive, the share-based remuneration, and the social and
pension contributions.
Fixed salary in
cash
Short-term
incentive
in cash 1
EPS dependent
performance shares
PS(EPS)
rTSR dependent
performance shares
PS(rTSR)
Share-based
remune-
ration 2
Social insu-rance
funds 3
Pension
funds 4
Total com-pen-
sation
2018 5
Total compen-
sation 2017
Executive Committee * 3'003 2'797 876 876 1'378 375 864 8'417 9'123Of whom Yves Serra, CEO (highest individual compensation) 950 1'247 375 375 590 132 278 3'197 3'471
Total compensation for the Chief Executive Officer and the other members of the Executive Committee in 2018 was lower than in 2017, mainly due to the lower share price. The change in compensation is explained by the following factors:
– The Executive Committee compensation includes the compensation for Josef Edbauer (Executive Committee member until 31 August 2018) and includes the compensation for Carlos Vasto (Executive Committee member since 1 September 2018).
– The share price decreased from CHF 1’288 in 2017 to CHF 786.50 in 2018.– The short-term incentive related to the financial results of the Corporation and the divisions and to the
individual performance was higher than in 2017, based on the results achieved. Consequently, the overall short-term incentive percentage ranges from 56.3% to 83.1% of the base salary for the Executive Committee members and amounts to 131.3% of the base salary for the Chief Executive Officer.
– The fixed salaries were slightly adjusted in order to keep competitive levels in line with the market practice of GF’s industrial sector.
– The employer’s contributions to social security have increased due to the slightly increased fixed salaries and the higher short-term incentive payout. Please note that a significant portion of the social security payments of the employer to the Swiss social security system represents a solidarity payment as the individuals will never get any return or benefit due to these payments.

150 Financial statements Georg Fischer Ltd
Achievement of the corporate business objectivesThe achievement of the corporate business objectives for the year 2018 is as follows:
1 Achievements below the hurdle result in zero payout for the respective business objective; for the objectives EBIT margin and ROIC, hurdle achievements result in 50% payout for the respective target
Business objectives Hurdle 1
Strategy targets
2016–2020 Result
2018Organic sales growth (at constant currencies) 1% 3–5% 6.5%EBIT margin 6% 8–9% 8.4%ROIC 14% 18–22% 22.4%
For a former Executive Committee member who continued his employment as non-Executive Committee member, a compensation amounting to CHF 471’655 was paid for the year 2018.
In the year under review, no further compensation was paid to former members of the Executive Committee. No compensation was paid to parties closely related to members of the Executive Committee.
Shareholdings of members of the Board of Directors, Executive Committee, or persons related to themRelated persons and companies are defined as family members and persons or companies over which a significant influence can be exercised. Transactions with related persons and companies must be settled on prevailing market terms.
Apart from the compensation paid to the Board of Directors and the Executive Committee and the regular contributions to the various pension fund institutions, no transactions with related persons or companies took place.
Shareholdings Board of Directors
Number ofGeorg Fischer
registered shares as
of 31 Dec. 2018
Number ofGeorg Fischer
registered shares asof 31 Dec. 2017
Andreas Koopmann Chairman Board of DirectorsChairman Nomination Committee 2'759 2'459
Hubert Achermann Chairman Audit Committee 706 556
Gerold Bührer Vice Chairman Board of DirectorsMember Audit Committee 3'161 3'011
Roman Boutellier Member Nomination Committee 3'238 3'088
Riet Cadonau 1 Member Compensation Committee 405 255Roger Michaelis Member Audit Committee 1'006 856Eveline Saupper Chairwoman Compensation Committee 1'067 917Jasmin Staiblin Member Compensation Committee 1'184 1'034Zhiqiang Zhang Member Nomination Committee 2'226 2'076Total Directors 15'752 14'252

151 Financial statements Georg Fischer Ltd
Shareholdings Executive Committee
Number ofGeorg Fischer
registered shares as
of 31 Dec. 2018
Number ofGeorg Fischer
registered shares asof 31 Dec. 2017
Yves Serra President and CEO 5'003 5'003Andreas Müller CFO, Head of Corporate Finance & Controlling 410 410Joost Geginat Head of GF Piping Systems 100 100Josef Edbauer Head of GF Casting Solutions 2'182 2'182Vasto Carlos Head of GF Casting Solutions 63 Pascal Boillat Head of GF Machining Solutions 1'000 1'070Total Executive Committee 8'758 8'765
The registered shares transferred as part of share-based compensation to the Executive Committee are blocked for at least five years.
As of 31 December 2018, members of the Senior Management registered a total of 18’994 shares of Georg Fischer Ltd. A total of 43’504 Georg Fischer shares were held by the Board of Directors, the Executive Committee, and the Senior Management as of 31 December 2018, corresponding to 1.06% of issued shares.
Neither Georg Fischer Ltd nor its Corporate Companies granted any guarantees, loans, advances, or credit facilities to members of the Executive Committee or the Board of Directors or related parties.
Compensation has not involved the allocation of options to current or past members of the Executive Committee or Board of Directors. Neither they nor any related persons possess option rights allocated by GF. As of 31 December 2018, the members of the Executive Committee held no option rights for Georg Fischer registered shares.
In 2018, GF did not make any severance payments to members of the Board of Directors or Executive Committee who left the company in the period under review or earlier.

152 Financial statements Georg Fischer Ltd
Proposal by the Board of Directors for the appropriation of retained earnings 2018
1 For more details, see note 1.8 and note 3.10.2 No distribution will be made for treasury shares held by Georg Fischer Ltd. The amount distributed will be reduced accordingly at the
time of distribution.
CHF 1'000 2018 2017
Net profit for the year 164'368 144'659Earnings carried forward 1'027'428 966'399
Allocation to/reduction in reserves for treasury shares 1 10'355
Profit from treasury shares 1 334 253Retained earnings 1'192'130 1'121'666
Dividend payment CHF 25 per registered share 2 –102'522 –94'321To be carried forward 1'089'608 1'027'345
The Board of Directors will propose to the Annual Shareholders’ Meeting of 17 April 2019 to pay out a dividend of CHF 25 per registered share out of retained earnings.
In the previous year, a dividend of CHF 23 per registered share out of retained earnings was paid out according to the decision of the Annual Shareholders’ Meeting of 18 April 2018. Schaffhausen, 21 February 2019
For the Board of DirectorsThe Chairman
Andreas Koopmann

153 Financial statements Georg Fischer Ltd
Report of the statutory auditor to the Annual Shareholders’ Meeting of Georg Fischer Ltd, Schaffhausen
Report on the audit of the financial statementsOpinionWe have audited the financial statements of Georg Fischer Ltd, which comprise the income statement for the year 2018, balance sheet as at 31 December 2018, statement of changes in equity and notes for the year then ended, including a summary of significant accounting policies.
In our opinion, the accompanying financial statements as at 31 December 2018 comply with Swiss law and the company’s articles of incorporation.
Basis for opinionWe conducted our audit in accordance with Swiss law and Swiss Auditing Standards. Our responsibilities under those provisions and standards are further described in the “Auditor’s responsibilities for the audit of the financial statements” section of our report.
We are independent of the entity in accordance with the provisions of Swiss law and the requirements of the Swiss audit profession and we have fulfilled our other ethical responsibilities in accordance with these requirements. We believe that the audit evidence we have obtained is sufficient and appropriate to provide a basis for our opinion.
Our audit approach

154 Financial statements Georg Fischer Ltd
MaterialityThe scope of our audit was influenced by our application of materiality. Our audit opinion aims to provide reasonable assurance that the financial statements are free from material misstatement. Misstatements may arise due to fraud or error. They are considered material if, individually or in aggregate, they could reasonably be expected to influence the economic decisions of users taken on the basis of the financial statements.
On the basis of our professional judgement, we determined certain quantitative thresholds for materiality, including the overall materiality for the financial statements as a whole as set out in the table below. These, together with qualitative considerations, helped us to determine the scope of our audit and the nature, timing and extent of our audit procedures and to evaluate the effect of misstatements, both individually and in aggregate, on the financial statements as a whole.
Overall materiality CHF 2'000'000How we determined it 0.2% of total assetsRationale for the materiality benchmark applied
We chose total assets as the benchmark because, in our view, it is a relevant benchmark against which a holding company can be assessed, and it is a generally accepted benchmark.
Audit scopeWe designed our audit by determining materiality and assessing the risks of material misstatement in the financial statements. In particular, we considered where subjective judgements were made; for example, in respect of significant accounting estimates that involved making assumptions and considering future events that are inherently uncertain. As in all of our audits, we also addressed the risk of management override of internal controls, including among other matters consideration of whether there was evidence of bias that represented a risk of material misstatement due to fraud.
Report on key audit matters based on the circular 1/2015 of the Federal Audit Oversight AuthorityKey audit matters are those matters that, in our professional judgement, were of most significance in our audit of the financial statements of the current period. These matters were addressed in the context of our audit of the financial statements as a whole, and in forming our opinion thereon, and we do not provide a separate opinion on these matters.
Valuation of investments in subsidiaries
Key audit matter How our audit addressed the key audit matterAs at 31 December 2018, the Company had investments in subsidiaries in the amount of CHF 1,278 million (prior year: CHF 1,111 million). Of the 139 subsidiaries in 33 different countries, 78 were held directly and 61 were held indirectly by the Company.
These investments are stated at acquisition cost in accordance with the commercial accounting and financial reporting provisions of the Swiss Code of Obligations.
The investments are valued on an individual basis. Where necessary, impairment charges are recognised for a loss in value. Moreover, general impairment allowances may be created in addition (see accounting principles in the notes to the financial statements).
We consider the impairment assessment of investments in subsidiaries as a key audit matter due to its significance on the balance sheet.
Management calculates the valuation of each subsidiary on the basis of the value of the underlying net assets at book value (for one third of the valuation) and the value of capitalised earnings (for the remaining two thirds). To verify the appropriateness of the assessment, we performed the following:
• We compared the book value of the investments in subsidiaries as at year-end 2018 to the companies’ valuations as determined by Management.
• We compared the underlying value of the net assets with the value of the shareholder’s equity of the company concerned.
• We compared the earnings used for the capitalised earnings estimate with the prior year’s figures and with the actual figures.
• We verified the capitalisation rate used against country-specific, long-term interest rate forecasts and a company-specific risk premium.
As a result of our audit procedures, we obtained adequate assurance with regard to the impairment assessment of the investments in subsidiaries.

155 Financial statements Georg Fischer Ltd
Impairment testing of loans to Corporate Companies
Key audit matter How our audit addressed the key audit matterAs of 31 December 2018, the Company had non-current loans to Corporate Companies of CHF 247 million.
These loans to Corporate Companies were stated at nominal value in accordance with the commercial accounting and financial reporting provisions of the Swiss Code of Obligations.
The loans are valued on an individual basis. Where necessary, impairment charges are recognised for a loss in value.
We consider the impairment testing of loans to Corporate Companies to be a key audit matter due to the significance of these assets.
Management checks whether the Corporate Companies concerned have positive equity. If this is not the case, an impairment test is performed on the individual asset concerned and, if necessary, an impairment charge is recognised.
We compared the companies’ equity values as used by Management with the values used for Group consolidation purposes. We re-performed the individual impairment tests, discussed them in detail with Management and checked them for plausibility.
Based on our results-oriented audit procedures, we obtained adequate assurance with regard to the impairment testing of loans to Corporate Companies.
Responsibilities of the Board of Directors for the financial statementsThe Board of Directors is responsible for the preparation of the financial statements in accordance with the provisions of Swiss law and the company’s articles of incorporation, and for such internal control as the Board of Directors determines is necessary to enable the preparation of financial statements that are free from material misstatement, whether due to fraud or error.
In preparing the financial statements, the Board of Directors is responsible for assessing the entity’s ability to continue as a going concern, disclosing, as applicable, matters related to going concern and using the going concern basis of accounting unless the Board of Directors either intends to liquidate the entity or to cease operations, or has no realistic alternative but to do so.
Auditor’s responsibilities for the audit of the financial statementsOur objectives are to obtain reasonable assurance about whether the financial statements as a whole are free from material misstatement, whether due to fraud or error, and to issue an auditor’s report that includes our opinion. Reasonable assurance is a high level of assurance, but is not a guarantee that an audit conducted in accordance with Swiss law and Swiss Auditing Standards will always detect a material misstatement when it exists. Misstatements can arise from fraud or error and are considered material if, individually or in the aggregate, they could reasonably be expected to influence the economic decisions of users taken on the basis of these financial statements.
A further description of our responsibilities for the audit of the financial statements is located at the website of EXPERTsuisse: http://expertsuisse.ch/en/audit-report-for-public-companies. This description forms part of our auditor’s report.
Report on other legal and regulatory requirementsIn accordance with article 728a paragraph 1 item 3 CO and Swiss Auditing Standard 890, we confirm that an internal control system exists which has been designed for the preparation of financial statements according to the instructions of the Board of Directors.
We further confirm that the proposed appropriation of available earnings complies with Swiss law and the company’s articles of incorporation. We recommend that the financial statements submitted to you be approved.
PricewaterhouseCoopers AG
Stefan RäbsamenAudit expertAuditor in charge
Diego J. AlvarezAudit expert
Zurich, 21 February 2019

156 Key figures
Five-year overview of the Corporation
CHF million 2018 2017 2016 2015 2014
Order intake 4'521 4'274 3'749 3'662 3'836Orders on hand at year-end 623 773 614 612 634Income statement Sales 4'572 4'150 3'744 3'640 3'795EBITDA 529 491 443 422 399Operating result (EBIT) 382 352 311 296 274Net profit/loss after minorities 281 252 216 188 184Cash flow Cash flow from operating activities 397 410 400 328 248Depreciation on tangible fixed assets 142 131 126 122 122Amortization on intangible assets 5 8 6 4 3Additions to property, plant, and equipment –234 –207 –174 –167 –152Cash flow from acquisitions and divestitures –154 –74 –96 –2 –20Free cash flow before acquisitions/divestitures 147 204 231 190 110Free cash flow –7 130 135 188 90Balance sheet Current assets 2'128 2'277 2'024 1'934 1'801Non-current assets 1'316 1'333 1'178 1'149 1'188Assets 3'444 3'610 3'202 3'083 2'989Current liabilities 1'124 1'418 1'067 1'221 981Non-current liabilities 892 823 935 732 904Equity 1'428 1'369 1'200 1'130 1'104Net working capital 926 899 838 819 864Invested capital (IC) 1'494 1'466 1'333 1'279 1'354Net debt 238 183 214 238 354Asset structure – Current assets % 62 63 63 63 60– Non-current assets % 38 37 37 37 40Capital structure – Current liabilities % 33 39 34 39 33– Non-current liabilities % 26 23 29 24 30– Equity % 41 38 37 37 37Key figures Return on equity (ROE) % 19.9 20.1 19.3 17.7 18.7Return on invested capital (ROIC) % 22.4 20.3 19.3 18.9 17.9Return on sales (EBIT margin) % 8.4 8.5 8.3 8.1 7.2Asset turnover 3.1 3.0 2.9 2.8 2.9Cash flow from operating activities in % of sales 8.7 9.9 10.7 9.0 6.5Employees Employees at year-end 15'027 15'835 14'808 14'424 14'140Europe 8'721 9'658 8'845 8'783 8'676– Thereof Germany 1'450 3'392 3'312 3'382 3'383– Thereof Switzerland 3'406 2'783 2'700 2'642 2'686– Thereof Austria 1'940 1'936 1'885 1'830 1'719– Thereof Rest of Europe 1'925 1'547 948 929 888Asia 3'725 3'807 3'713 3'502 3'455– Thereof China 3'199 3'287 3'216 3'131 3'085Americas 1'740 1'503 1'348 1'262 1'259Rest of world 841 867 902 877 750

Important dates
Online Annual Report 2018 Find out more about financial figures, information on GF’s strategy and business segments at www.annualreport.georgfischer.com/2018/en
ContactsInvestor RelationsDaniel BösigerPhone: +41 (0) 52 631 21 [email protected]
Corporate CommunicationsBeat RömerPhone: +41 (0) 52 631 26 [email protected]
Georg Fischer LtdAmsler-Laffon-Strasse 98201 SchaffhausenSwitzerland
Phone: +41 (0) 52 631 11 11www.georgfischer.com
ImprintPublished by: Georg Fischer Ltd Edited by: Georg Fischer Ltd, Corporate Development Proof-read by: LionbridgeDesigned by: NeidhartSchön AGPhotos by: Alberto Bernasconi, Anna Schroll, Anna Stöcher, Christoph Papsch, Conrad von Schubert, Cory Morton, Dave Tacon, Roy Cruz, Scott Gable, Senevita AG, Shawn Koh All other photos: Georg Fischer Ltd Printed by: Neidhart + Schön Group AG
Cover: GF employee, GF Casting Solutions Novazzano (Switzerland)
DisclaimerThe statements in this publication relating to matters that are not historical facts are forward-looking statements that are not guarantees of future performance and involve risks, uncertainties, and other factors beyond the control of the company.
The Financial Report 2018 of GF is also available in German. In the event of any discrepancy, the English version shall prevail.
We thank our customers for their consent to publish the joint success stories.
Shareholders’ Meeting for fiscal year 2018
Publication of Mid-Year Report 2019
17 April 18 July