Keahoulu Final Environmental Impact Statement -...
200
Transcript of Keahoulu Final Environmental Impact Statement -...

Appendix F

F-1 January 2008

TRAFFIC STUDYFOR THE
KEAHUOLU AFFORDABLE HOUSING MASTER PLANNORTH KONA, ISLAND OF HAWAII, HAWAII
JANUARY 2008
PREPARED FOR
HAWAII HOUSING FINANCE & DEVELOPMENT CORP.
PREPARED BY

TRAFFIC STUDY FOR THE
KEAHUOLU AFFORDABLE HOUSING MASTER PLAN NORTH KONA, ISLAND OF HAWAII, HAWAII
January 2008
Prepared for:
HAWAII HOUSING FINANCE & DEVELOPMENT CORP.
Prepared by:
FEHR & PEERS/KAKU ASSOCIATES 201 Santa Monica Boulevard, Suite 500
Santa Monica, California 90401 (310) 458-9916
Ref: 2145

TABLE OF CONTENTS I. Introduction ................................................................................................................. 1 Project Description.............................................................................................. 1 Study Scope........................................................................................................ 3 Organization of Report........................................................................................ 5 II. Existing Conditions.......................................................................................................... 6 Existing Roadway System.................................................................................. 6 Existing Traffic Volumes and Operating Conditions........................................... 6 III. Future Traffic Projections................................................................................................ 14 Cumulative Base Traffic Projections .................................................................. 14 Project Traffic Projections................................................................................... 18 Cumulative plus Project Traffic Projections........................................................ 24 IV. Intersection Traffic Impact Analysis ................................................................................ 37 Intersection Significant Impact Criteria............................................................... 37 Cumulative Base Traffic Conditions ................................................................... 37 Cumulative plus Project Traffic Conditions ........................................................ 41 Proposed Mitigation Measures........................................................................... 42 V. Street Segment Traffic Impact Analysis ......................................................................... 44 VI. Summary and Conclusions............................................................................................. 50 References Appendix A: Intersection Lane Configurations Appendix B: Intersection and Daily Traffic Counts Appendix C: Intersection Level of Service Worksheets Appendix D: Excerpts from Keahole to Honaunau Regional Circulation Plan County
Action Plan Appendix E: Signal Warrant Analysis

LIST OF FIGURES NO. 1 Site Plan for Keahuolu Affordable Housing Master Plan............................................ 2 2 Study Area and Analyzed Locations .......................................................................... 4 3 Existing Peak Hour Traffic Volumes........................................................................... 8
4 Cumulative Base (2020) Peak Hour Traffic Volumes................................................. 16 5 Project Trip Distribution .............................................................................................. 23
6 Project Only (2020) Peak Hour Traffic Volumes – Scenario A ................................... 25 7 Project Only (2020) Peak Hour Traffic Volumes – Scenario B................................... 27 8 Project Only (2020) Peak Hour Traffic Volumes – Scenario C................................... 29 9 Cumulative plus Project (2020) Peak Hour Traffic Volumes – Scenario A................. 31 10 Cumulative plus Project (2020) Peak Hour Traffic Volumes – Scenario B................. 33 11 Cumulative plus Project (2020) Peak Hour Traffic Volumes – Scenario C ................ 35
LIST OF TABLES NO. 1 Level of Service Definitions for Signalized Intersections............................................ 10 2 Level of Service Definitions for Unsignalized Intersections........................................ 11 3 Year 2006 Existing Conditions Peak Hour Levels of Service..................................... 13 4 Preliminary Trip Generation Estimates – Keahuolu Affordable Housing Master Plan – Concept A.................................................................. 20 5 Preliminary Trip Generation Estimates – Keahuolu Affordable Housing Master Plan – Concept B.................................................................. 21 6 Preliminary Trip Generation Estimates – Keahuolu Affordable Housing Master Plan – Concept C ................................................................. 22 7 Intersection Level of Service Analysis Summary – Keahuolu Affordable Housing Master Plan – Future Conditions (2020) – Concept A ........................................................... 38 8 Intersection Level of Service Analysis Summary – Keahuolu Affordable Housing Master Plan – Future Conditions (2020) – Concept B ........................................................... 39 9 Intersection Level of Service Analysis Summary – Keahuolu Affordable Housing Master Plan – Future Conditions (2020) – Concept C........................................................... 40 10 Street Segment Impact Analysis – Concept A.............................................................. 45 11 Street Segment Impact Analysis – Concept B.............................................................. 46 12 Street Segment Impact Analysis – Concept C............................................................... 47 13 Capacity of Facilities ....................................................................................................... 48

1
I. INTRODUCTION
This report documents the results of a traffic study conducted by Fehr & Peers/Kaku Associates
to evaluate the potential traffic impacts associated with the proposed Keahuolu Affordable
Housing Master Plan development (project) located in the North Kona area on the island of
Hawaii. It includes a description of the assumptions and methods used to conduct the study as
well as a discussion of the results.
PROJECT DESCRIPTION
The project would construct a new mixed-use neighborhood on vacant land in the area northeast
of the intersection of Palani Road (SR 190) and Henry Street. Three project alternatives, as well
as the No Action alternative, were assessed in this report. Each of the alternatives would have
identical street and land use patterns but would vary in the overall intensity of development.
Figure 1 presents the proposed land use plan for the project. Each alternative development
concept would be focused on a mixed-use town center and would include 197,000 square feet of
commercial/retail space, 25 acres of neighborhood parks, a seven-acre archeological preserve, a
12-acre site reserved for a school and between 1,020 and 2,330 housing units.
Concept A would construct 1,020 dwelling units, including 620 multi-family units and 400 single-
family units in increments of 300 dwelling units per year from 2010-2012 and 120 additional
dwelling units in 2013. Concept B would construct 1,840 dwelling units, including 1,240 multi-
family units and 600 single-family units in increments of 300 dwelling units per year from 2010-
2015 and 40 additional dwelling units in 2016. Concept C, illustrated in Figure 1, would construct
2,330 multi-family dwelling units in increments of 300 dwelling units from 2010-2016 and 230
additional dwelling units in 2017. Completion of the residential component of the project is
anticipated by 2014 under Concept A, by 2015 under Concept B, and 2016 under Concept C.
Each concept assumes that the entire project would be completed by the end of 2020.

F I G U R E 1
S I T E P L A N F O R K E A H U O L U A F F O R D A B L E H O U S I N G M A S T E R P L A N
N O T T O S C A L E
S o u r c e : B e l t C o l l i n s , 2 0 0 7
3
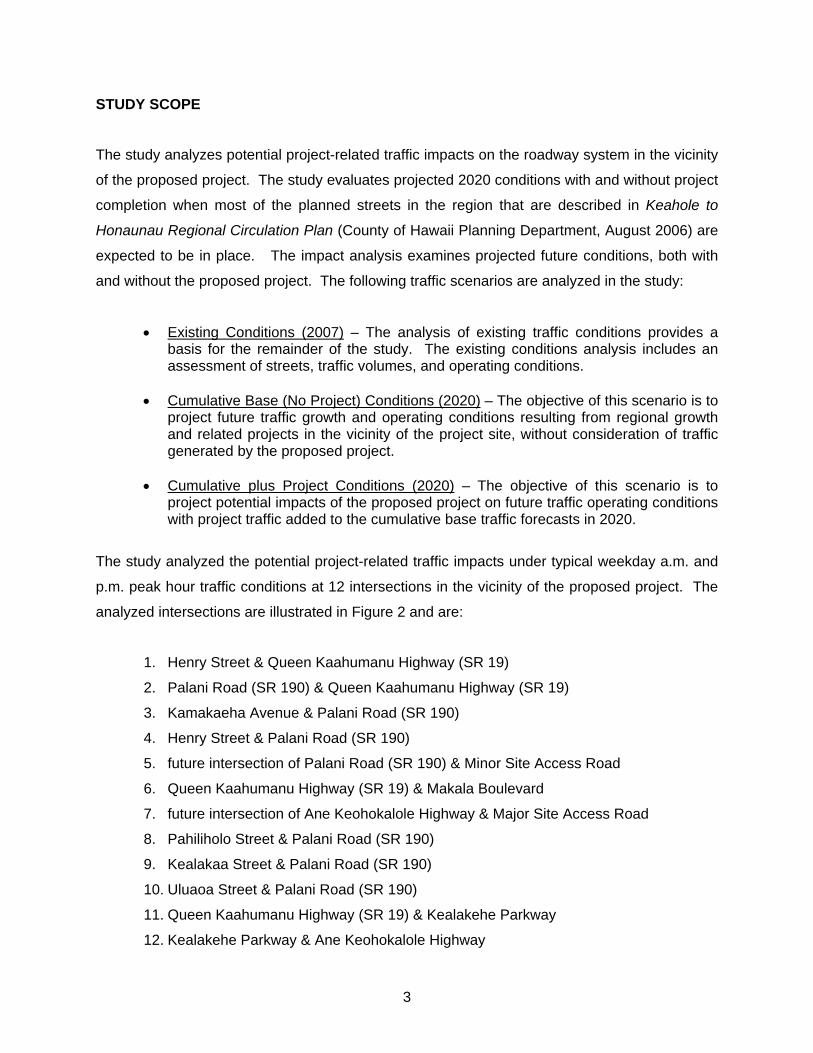
STUDY SCOPE
The study analyzes potential project-related traffic impacts on the roadway system in the vicinity
of the proposed project. The study evaluates projected 2020 conditions with and without project
completion when most of the planned streets in the region that are described in Keahole to
Honaunau Regional Circulation Plan (County of Hawaii Planning Department, August 2006) are
expected to be in place. The impact analysis examines projected future conditions, both with
and without the proposed project. The following traffic scenarios are analyzed in the study:
• Existing Conditions (2007) – The analysis of existing traffic conditions provides a basis for the remainder of the study. The existing conditions analysis includes an assessment of streets, traffic volumes, and operating conditions.
• Cumulative Base (No Project) Conditions (2020) – The objective of this scenario is to
project future traffic growth and operating conditions resulting from regional growth and related projects in the vicinity of the project site, without consideration of traffic generated by the proposed project.
• Cumulative plus Project Conditions (2020) – The objective of this scenario is to
project potential impacts of the proposed project on future traffic operating conditions with project traffic added to the cumulative base traffic forecasts in 2020.
The study analyzed the potential project-related traffic impacts under typical weekday a.m. and
p.m. peak hour traffic conditions at 12 intersections in the vicinity of the proposed project. The
analyzed intersections are illustrated in Figure 2 and are:
1. Henry Street & Queen Kaahumanu Highway (SR 19)
2. Palani Road (SR 190) & Queen Kaahumanu Highway (SR 19)
3. Kamakaeha Avenue & Palani Road (SR 190)
4. Henry Street & Palani Road (SR 190)
5. future intersection of Palani Road (SR 190) & Minor Site Access Road
6. Queen Kaahumanu Highway (SR 19) & Makala Boulevard
7. future intersection of Ane Keohokalole Highway & Major Site Access Road
8. Pahiliholo Street & Palani Road (SR 190)
9. Kealakaa Street & Palani Road (SR 190)
10. Uluaoa Street & Palani Road (SR 190)
11. Queen Kaahumanu Highway (SR 19) & Kealakehe Parkway
12. Kealakehe Parkway & Ane Keohokalole Highway

OLUWALU ST
KAUHOLA ST
MAIAU ST
HINA LANI ST
ALLIED QUARRY RD
KEALAK
EHE
OLD DUMP ACCESS RDKEALAKEHE ST
KEALAKAA ST
PALA
NI R
D
KUAKINI
ANE KEOHOKALOLE HWY
PUOHUL
IHULI
KANALANI ST
QUEEN KAAHUMANU HWY
KAMANU ST
12
2
1
4
PALA
NI R
D
3
KAMAKAEHA A
VM
AKALA B
L
KONA B
AY DR
KAIWI S
TALA
PA ST
LUHIA ST
HIONA ST
PKWY
OLOLI RD
KOPIKO OLD
HENRY ST
HUALALAI R
D
KEALAPUA ST
HUAALA ST
ULUA'O'A ST
HALE-KAPILI
MALULANI DR
PACIFIC OCEAN
ALII D
R
9
7
68
10
3
2
1
QUEE
N K
AAHUMANU H
WY
4
5
11
PAHILIHOLO ST
11
9
KEANALEHU DR
MANAWALE'A ST
19
190
180
190
10
6
8
7
5
BOAT PARK RD
HOLOHOLO ST
HWY
KUAK
INI H
WY
KAMALANI ST
FIGURE 2
STUDY AREA AND ANALYZED LOCATIONS
MAMALAHOA HWY
LEGEND
- Analyzed Segment
- Planned Street Extension
- Analyzed Intersection
#
NOT TO SCALE
#
- Proposed Keahuolu Affordable Housing Project
- Planned Street Widening

5
The effect of the proposed project options on daily traffic volumes was also measured on 10
street segments, also shown in Figure 2:
1. Henry Street south of Palani Road (SR 190)
2. Palani Road (SR 190) makai (west) of Henry Street
3. Palani Road (SR 190) mauka (east) of Henry Street
4. Kealakaa Street north of Palani Road (SR 190)
5. Uluaoa Street north of Palani Road (SR 190)
6. Queen Kaahumanu Highway (SR 19) south of Kealakehe Parkway
7. Kealakehe Parkway makai (west) of Ane Keohokalole Highway
8. Ane Keohokalole Highway south of Kealakehe Parkway
9. Queen Kaahumanu Highway (SR 19) north of Kealakehe Parkway
10. Palani Road (SR 190) south of Mamalahoa Highway
New baseline traffic counts were collected at these locations in August 2007 except at study
intersections #5 and #7, both of which are future intersections.
ORGANIZATION OF REPORT
This report is divided into six chapters, including this introduction. Chapter II describes the
existing circulation system, traffic volumes, and operating conditions in the study area as well as
describes currently planned transportation improvements. The methodologies used to forecast
future cumulative and project traffic volumes and the resultant forecasts are described in
Chapter III. Chapter IV presents an assessment of future traffic impacts at intersections in the
surrounding area and identifies mitigation measures to address both cumulative and project-
specific impacts. Chapter V contains an assessment of potential future street segment impacts
and discusses potential mitigation measures. Finally, the conclusions of the study are
summarized in Chapter VI.

6
II. EXISTING CONDITIONS
A comprehensive data collection effort was undertaken to identify existing transportation
conditions in the vicinity of the proposed project. The assessment of existing conditions relevant
to this study includes an inventory of the street and highway system, traffic volumes on these
facilities, and operating conditions at key intersections and street segments.
EXISTING ROADWAY SYSTEM
The study area, as shown in Figure 2, is generally bounded by Kealakehe Parkway on the
north, Queen Kaahumanu Highway (SR 19) on the west (makai), and Palani Road (SR 190) on
the southeast. The street system in the study area is illustrated in Figure 2. Primary regional
access to the area is provided by Queen Kaahumanu Highway, which runs north-south
approximately one mile makai of the project site and by Mamalahoa Highway, which runs
northeast-southwest approximately two miles mauka of the project site. Henry Street, currently
running between Queen Kaahumanu Highway and Palani Road, also provides access to the
project site. The proposed Ane Keohokahole Highway (Mid-Level Road) extension will extend
Henry Street northward to Hina Lani Street and will serve the project site by providing direct
access to Palani Road and Kealakehe Parkway. Diagrams of the existing intersection lane
configurations at the ten existing study intersections are provided in Appendix A.
EXISTING TRAFFIC VOLUMES AND OPERATING CONDITIONS
The following sections present the existing peak hour traffic volumes at the study intersections,
daily street segment traffic volumes, a description of the methodology used to analyze operating
conditions, and the resulting level of service (LOS) at each location under existing conditions.

7
Existing Peak Hour Traffic Volumes
New weekday peak period intersection turning movement counts were collected between 6:00
and 9:00 a.m. and between 3:00 and 6:00 p.m. at the 10 existing study intersections on Tuesday,
August 12, Wednesday, August 13, and Thursday, August 14, 2007. Existing weekday peak hour
volumes at these intersections are illustrated in Figure 3 and the traffic count data sheets are
provided in Appendix B.
Existing Daily Street Segment Traffic Volumes
24-hour machine counts were conducted at the 10 street segments listed in Chapter I for analysis
of impacts of the proposed project on Tuesday, August 12, Wednesday, August 13, and Thursday,
August 14, 2007. The existing daily traffic volume data are available in Appendix B.
Level of Service Methodology
LOS is a qualitative measure used to describe the condition of traffic flow ranging from excellent
conditions at LOS A to overload conditions at LOS F. LOS definitions for signalized and
unsignalized intersections are provided in Tables 1 and 2, respectively. LOS D is considered to
be the minimum desirable level of service in this area.
LOS analyses were conducted at each of the existing study intersections to determine their
current operating conditions using the operations methodology for signalized intersections and
the two-way stop-controlled methodology for unsignalized intersections from 2000 Highway
Capacity Manual (2000 HCM) (Transportation Research Board, 2000).
Existing Peak Hour Intersection Levels of Service
The existing weekday a.m. and p.m. peak hour turning movements depicted in Figure 3 were
used in conjunction with the LOS methodologies described above to determine existing operating
conditions at each study intersection. Detailed LOS calculation worksheets are included in

OLUWALU ST
KAUHOLA ST
MAIAU ST
HINA LANI ST
ALLIED QUARRY RD
KEALAK
EHE
OLD DUMP ACCESS RDKEALAKEHE ST
KEALAKAA ST
PALA
NI R
D
KUAKINI
ANE KEOHOKALOLE HWY
PUOHUL
IHULI
KANALANI ST
QUEEN KAAHUMANU HWY
KAMANU ST
12
2
1
4
PALA
NI R
D
3
KAMAKAEH
A AVM
AKALA B
L
KONA BA
Y DR
KAIWI S
TALAPA ST
LUHIA ST
HIONA ST
PKWY
OLOLI RD
KOPIKO OLD
HENRY ST
HUALALA
I RD
KEALAPUA ST
HUAALA ST
ULUA'O'A ST
HALE-KAPILI
MALULANI DR
PACIFIC OCEAN
ALII DR
QUEEN
KAAHUMANU H
WY
11
PAHILIHOLO ST
11
9
KEANALEHU DR
MANAWALE'A ST
19
190
190
10
6
8
7
5
BOAT PARK RD
HOLOHOLO ST
HWY
KUAK
INI H
WY
FIGURE 3
EXISTING PEAK HOUR TRAFFIC VOLUMES
Queen Kaahumanu Hwy (SR 19)
& Henry St
1. Queen Kaahumanu Hwy (SR 19)
& Palani Rd (SR 190) &
2. Kamakaeha Ave &
Palani Rd (SR 190)
3.
Henry St &
Palani Rd (SR 190)
4.
Minor Site Access Rd &
Palani Rd (SR 190)
5.
Queen Kaahumanu Hwy (SR 19)
& Makala Blvd
6.
NOT TO SCALE
193(269)15(15)
18(51)
144(293)99(219)
593(524)
71(28)
374(434)29(44)
257(294)
453(580)
87(170)
61(67)459(418)
359(436)
275(406)25(107)
534(331)
187(169)
330(390)62(179)
100(109)
384(609)
98(166)
240(498)
453(474)141(161)
13(63)
47(127)
185(484)
650(484)
37(149) 399(377)
122(110)
550(501)
309(417)22(65)
7(21)
72(126)32(41)
652(569)
7(11)
21(71)143(104)
138(240)
580(938)
47(70)
INTERSECTION DOES NOT
CURRENTLY EXIST
* - Negligible Volume
X(X) - A.M.(P.M.) Peak Hour Traffic Volumes
- Analyzed Intersection
Housing Project- Proposed Keahuolu Affordable
- Planned Street Extension
LEGEND
#
- Planned Street Widening

OLUWALU ST
KAUHOLA ST
MAIAU ST
HINA LANI ST
ALLIED QUARRY RD
KEALAK
EHE
OLD DUMP ACCESS RDKEALAKEHE ST
KEALAKAA ST
PALA
NI R
D
KUAKINI
ANE KEOHOKALOLE HWY
PUOHUL
IHULI
KANALANI ST
QUEEN KAAHUMANU HWY
KAMANU ST
12
2
1
4
PALA
NI R
D
3
KAMAKAEH
A AVM
AKALA B
L
KONA BA
Y DR
KAIWI S
TALAPA ST
LUHIA ST
HIONA ST
PKWY
OLOLI RD
KOPIKO OLD
HENRY ST
HUALALA
I RD
KEALAPUA ST
HUAALA ST
ULUA'O'A ST
HALE-KAPILI
MALULANI DR
PACIFIC OCEAN
ALII DR
QUEEN
KAAHUMANU H
WY
11
PAHILIHOLO ST
11
9
KEANALEHU DR
MANAWALE'A ST
19
190
190
10
6
8
7
5
BOAT PARK RD
HOLOHOLO ST
HWY
KUAK
INI H
WY
FIGURE 3 (CONT.)
EXISTING PEAK HOUR TRAFFIC VOLUMES
Kealakaa St &
Palani Rd (SR 190)
9.
Palani Rd (SR 190) &
Uluaoa St
10.
Queen Kaahumanu Hwy
(SR 19) & Kealakehe Pkwy
11.
Ane Keohokalole Hwy &
Kealakehe Pkwy
12.
41(63)262(143)
214(60)
20(7)7(57)
733(907)
85(56)
11(6)74(55)
80(65)
720(777)
135(44)
25(6)
321(225)
369(557)295(224)
49(18)775(795)
*(*)3(*)
2(5)
44(114)306(123)
*(*)
169(58)
65(72)*(*)
*(*)
*(*)
*(*)
176(71)200(32) 3
20(556)
44(23)
257(145)
598(789)
Ane Keohokalole Hwy &
Major Site Access Rd
7. Pahiliholo St &
Palani Rd (SR 190)
8.
INTERSECTION DOES NOT
CURRENTLY EXIST25(23)
5(11)674(798)
32(26)
1,088(1,009)17(39)
NOT TO SCALE
* - Negligible Volume
X(X) - A.M.(P.M.) Peak Hour Traffic Volumes
- Analyzed Intersection
Housing Project- Proposed Keahuolu Affordable
- Planned Street Extension
LEGEND
#
- Planned Street Widening

TABLE 1
LEVEL OF SERVICE DEFINITIONS FOR SIGNALIZED INTERSECTIONS
A 0.000 - 0.600 <10
B >0.600 - 0.700 >10 and <20
C >0.700 - 0.800 >20 and <35
D >0.800 - 0.900 >35 and <55
E >0.900 - 1.000 >55 and <80
F > 1.000 >80
Source: Highway Capacity Manual , Transportation Research Board, 2000.
Average Stopped Delay
per Vehicle (seconds)*Volume/CapacityLevel of Service

TABLE 2
LEVEL OF SERVICE DEFINITIONS FOR
UNSIGNALIZED INTERSECTIONS
A < 10.0
B > 10.0 and < 15.0
C > 15.0 and < 25.0
D > 25.0 and < 35.0
E > 35.0 and < 50.0
F > 50.0
Source: Highway Capacity Manual , Transportation Research Board,
2000.
Average Total Delay
(seconds/vehicle)Level of Service

12
Appendix C. Table 3 summarizes the results of this analysis, including the average control
delay and corresponding LOS during the a.m. and p.m. peak hours. Calculated volume-to-
capacity (V/C) ratios are also shown in Table 3. As indicated in Table 3, three of the 10 existing
study intersections are operating at LOS E or F during both the a.m. and p.m. peak hours:
8. Palani Road (SR 190) & Pahiliholo Street
9. Kealakaa Street & Palani Road (SR 190)
10. Uluaoa Street & Palani Road (SR 190)
The other seven existing study intersections are operating at LOS D or better during the a.m. and
p.m. peak hours.

1 Queen Kaahumanu Hwy (SR 19) A.M. 0.634 23 C
& Henry St P.M. 0.626 25 C
2 Queen Kaahumanu Hwy (SR 19) A.M. 0.777 26 C
& Palani Rd (SR 190)/Alii Dr P.M. 0.874 31 C
3 Kamakaeha Av A.M. NC 15 B
& Palani Rd (SR 190) [a] P.M. NC 25 D
4 Henry St A.M. 0.659 12 B
& Palani Rd (SR 190) P.M. 0.804 19 B
5 Project Minor Access A.M. NA NA NA
& Palani Rd (SR 190) [b] P.M. NA NA NA
6 Queen Kaahumanu Hwy (SR 19) A.M. 0.748 23 C
& Makala Bl P.M. 0.973 36 D
7 Ane Keohokahole Hwy A.M. NA NA NA
& Major Site Access Road [b] P.M. NA NA NA
8 Palihiolo St A.M. NC 48 E
& Palani Rd (SR 190) [a] P.M. NC ** F
9 Kealakaa St A.M. NC ** F
& Palani Rd (SR 190) [a] P.M. NC 33 D
10 Palani Rd A.M. NC ** F
& Uluaoa St (SR 190) [a] P.M. NC ** F
11 Queen Kaahumanu Hwy (SR 19) A.M. 0.742 20 B
& Kealakehe Hwy P.M. 0.652 11 B
12 Ane Keohokalole Hwy A.M. NC 12 B
& Kealakehe Hwy [a] P.M. NC 11 B
Note:
*
** Indicates oversaturated conditions. Delay cannot be calculated.
NA = Not Applicable
NC = Not Calculated
[a] Intersection is controlled by stop signs on the minor approaches.
[b] Future intersection.
Delay indicates average stopped delay per vehicle in seconds for signalized
intersections. The worst case vehicular delay is reported for stop-controlled
intersections.
TABLE 3
YEAR 2006 EXISTING CONDITIONS
PEAK HOUR LEVELS OF SERVICE
LOSIntersectionsPeak
HourDel/Veh*V/C
14
III. FUTURE TRAFFIC PROJECTIONS
In order to evaluate the potential impact of traffic generated by the proposed project on the
surrounding street system, it was necessary to develop estimates of future traffic conditions in
the area both with and without the project. Future traffic conditions without the proposed project
reflect traffic increases due to general regional growth and development as well as traffic
increases generated by other specific developments near the project site. These conditions are
referred to as the cumulative base condition (i.e., no project conditions). The sum of the
cumulative base and project-generated traffic represents the cumulative plus project conditions.
Development of these future 2020 traffic scenarios conditions is described in this chapter.
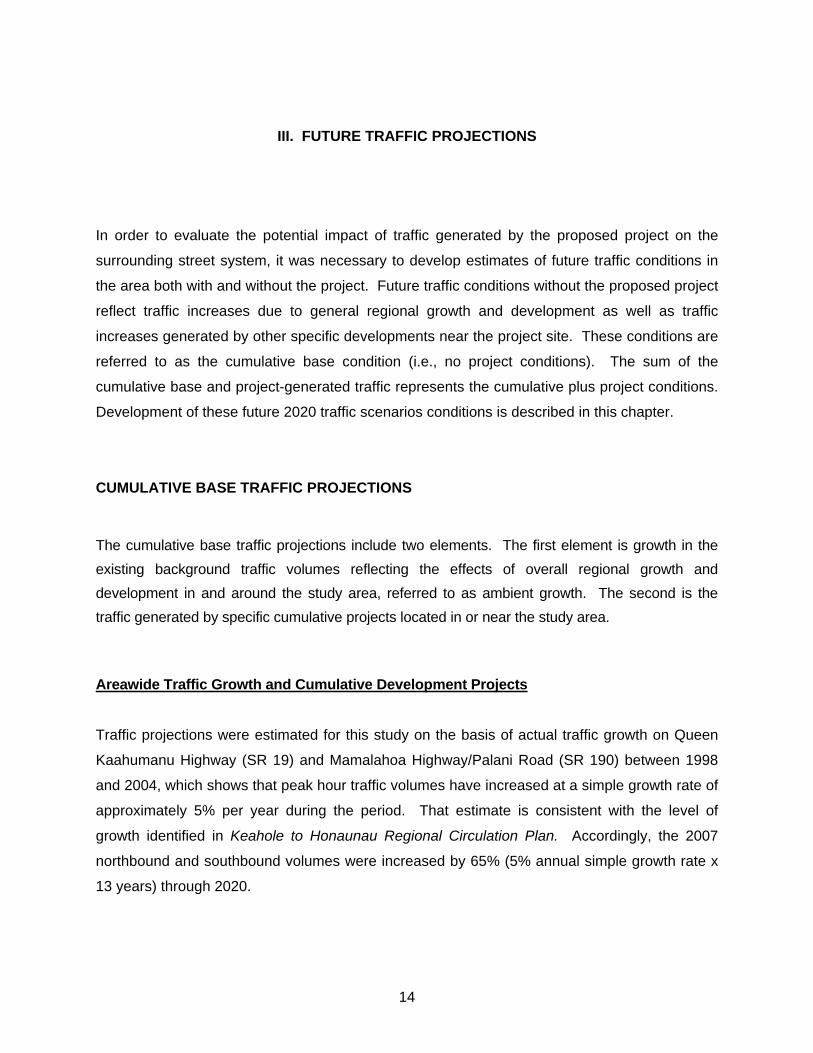
CUMULATIVE BASE TRAFFIC PROJECTIONS
The cumulative base traffic projections include two elements. The first element is growth in the existing background traffic volumes reflecting the effects of overall regional growth and development in and around the study area, referred to as ambient growth. The second is the traffic generated by specific cumulative projects located in or near the study area.
Areawide Traffic Growth and Cumulative Development Projects
Traffic projections were estimated for this study on the basis of actual traffic growth on Queen
Kaahumanu Highway (SR 19) and Mamalahoa Highway/Palani Road (SR 190) between 1998
and 2004, which shows that peak hour traffic volumes have increased at a simple growth rate of
approximately 5% per year during the period. That estimate is consistent with the level of
growth identified in Keahole to Honaunau Regional Circulation Plan. Accordingly, the 2007
northbound and southbound volumes were increased by 65% (5% annual simple growth rate x
13 years) through 2020.

15
Available information regarding potential future projects either under construction, planned, or
proposed for development within or near the study area was obtained from the project team.
Estimated trips from the related projects were assigned to the roadway system based on their
anticipated distribution patterns. The geographic distribution of traffic generated by new
developments depends on several factors, such as the type and density of the proposed land
uses, the geographic distribution of the population from which employees and/or patrons may be
drawn, the geographic distribution of activity centers (employment, commercial, and other) to
which residents of proposed residential projects may be drawn, and its location in relation to the
surrounding street system.
The resulting cumulative base traffic volumes, representing future conditions without the project
for year 2020, are presented in Figure 4. These future projections take into account the
estimated overall growth in the surrounding area without the addition of traffic generated by the
proposed Keahuolu Affordable Housing Master Plan project.
Baseline Street System Improvements
Discussions were held with agency staff regarding the roadway improvements in or near the
study area planned for completion by 2020. These improvements, whether the result of local
capital improvement programs or in connection with planned or approved projects, would result
in dramatically improved mobility options for residents and visitors and in capacity changes at
various locations throughout the study area as shown in Figure 2 and discussed below.
Relevant information from Keahole to Honaunau Regional Circulation Plan is presented in
Appendix D. It shows that the following roadway system improvements are planned:
• Queen Kaahumanu Highway – The main arterial highway through Kailua-Kona is being widened from two to four lanes (two in each direction) with a median from Kona International Airport to Henry Street in Kailua.
• Main Street (Kamanu Street) – Kamanu Street will be extended to connect with
Kealakehe Parkway and north to the proposed University Drive.
• Ane Keohokalole (Mid-Level Road) – This project will extend Henry Street from Palani Road to the existing segment of Ane Keohokalole Highway and northward to Hina Lani Street.

OLUWALU ST
KAUHOLA ST
MAIAU ST
HINA LANI ST
ALLIED QUARRY RD
KEALAK
EHE
OLD DUMP ACCESS RDKEALAKEHE ST
KEALAKAA ST
PALA
NI R
D
KUAKINI
ANE KEOHOKALOLE HWY
PUOHUL
IHULI
KANALANI ST
QUEEN KAAHUMANU HWY
KAMANU ST
12
2
1
4
PALA
NI R
D
3
KAMAKAEH
A AVM
AKALA B
L
KONA BA
Y DR
KAIWI S
TALAPA ST
LUHIA ST
HIONA ST
PKWY
OLOLI RD
KOPIKO OLD
HENRY ST
HUALALA
I RD
KEALAPUA ST
HUAALA ST
ULUA'O'A ST
HALE-KAPILI
MALULANI DR
PACIFIC OCEAN
ALII DR
QUEEN
KAAHUMANU H
WY
11
PAHILIHOLO ST
11
9
KEANALEHU DR
MANAWALE'A ST
19
190
190
10
6
8
7
5
BOAT PARK RD
HOLOHOLO ST
HWY
KUAK
INI H
WY
Queen Kaahumanu Hwy (SR 19)
& Henry St
1. Queen Kaahumanu Hwy (SR 19)
& Palani Rd (SR 190) &
2. Kamakaeha Ave &
Palani Rd (SR 190)
3.
Henry St &
Palani Rd (SR 190)
4.
Minor Site Access Rd &
Palani Rd (SR 190)
5.
Queen Kaahumanu Hwy (SR 19)
& Makala Blvd
6.
NOT TO SCALE
FIGURE 4
CUMULATIVE BASE (2020) PEAK HOUR TRAFFIC VOLUMES
32(41)72(126)
309(417)
*(*)
*(*)1,800(1,853)
670(827)
290(520)
130(183)
509(673)
132(121)
99(211)529(460)
320(282)
749(464)
25(107)286(444)
577(514)
878(768)
76(76)
126(207)
655(707)
372(358)
51(74)658(732)
97(38)
807(706)
99(219)144(293)
32(86)
20(20)
193(269)
68(86)
840(1,148)
200(294)
143(104)21(71)
10(14)
902(699)
7(21)
30(80)
47(127)
15(63)
240(281)775(829)
31(17)
372(203)
217(118)
90(93)810(927)
122(110)
234(182)
37(129)185(416)
900(834)
454(394)
123(170)
* - Negligible Volume
X(X) - A.M.(P.M.) Peak Hour Traffic Volumes
- Analyzed Intersection
Housing Project- Proposed Keahuolu Affordable
- Planned Street Extension
LEGEND
#
- Planned Street Widening

OLUWALU ST
KAUHOLA ST
MAIAU ST
HINA LANI ST
ALLIED QUARRY RD
KEALAK
EHE
OLD DUMP ACCESS RDKEALAKEHE ST
KEALAKAA ST
PALA
NI R
D
KUAKINI
ANE KEOHOKALOLE HWY
PUOHUL
IHULI
KANALANI ST
QUEEN KAAHUMANU HWY
KAMANU ST
12
2
1
4
PALA
NI R
D
3
KAMAKAEH
A AVM
AKALA B
L
KONA BA
Y DR
KAIWI S
TALAPA ST
LUHIA ST
HIONA ST
PKWY
OLOLI RD
KOPIKO OLD
HENRY ST
HUALALA
I RD
KEALAPUA ST
HUAALA ST
ULUA'O'A ST
HALE-KAPILI
MALULANI DR
PACIFIC OCEAN
ALII DR
QUEEN
KAAHUMANU H
WY
11
PAHILIHOLO ST
11
9
KEANALEHU DR
MANAWALE'A ST
19
190
190
10
6
8
7
5
BOAT PARK RD
HOLOHOLO ST
HWY
KUAK
INI H
WY
Kealakaa St &
Palani Rd (SR 190)
9.
Palani Rd (SR 190) &
Uluaoa St
10.
Queen Kaahumanu Hwy
(SR 19) & Kealakehe Pkwy
11.
Ane Keohokalole Hwy &
Kealakehe Pkwy
12.
FIGURE 4 (CONT.)
CUMULATIVE BASE (2020) PEAK HOUR TRAFFIC VOLUMES
723(964)
311(177)
58(29)
422(690)
200(32)176(71)
12(50)
295(257)
45(369)
50(23)115(128)
124(78)
320(288)
323(76)94(194)
2(5)
3(*)
369(165)
171(55)
910(974)
249(232)
115(66)
10(67)107(97)81(106)
81(60)61(66)
995(1,061)
231(242)
422(239)
Ane Keohokalole Hwy &
Major Site Access Rd
7.
20(49)1,254(1,265)56(23)
32(26)
20(19)
438(506)476(681)
521(565)
15(4)
5(4)6(13)
10(2)
*(*)
620(338)
*(*)
447(445)
*(*)
*(*)
NOT TO SCALE
SEE INTERSECTION 8
Palani Rd (SR 190)
8. Kealakaa St/Pahiliholo St &
* - Negligible Volume
X(X) - A.M.(P.M.) Peak Hour Traffic Volumes
- Analyzed Intersection
Housing Project- Proposed Keahuolu Affordable
- Planned Street Extension
LEGEND
#
- Planned Street Widening

18
• Kealakaa Street/Holoholo Street Extension – This planned street would extend Kealakaa Street northward to Holoholo Street and the planned Kealakehe Parkway.
• Kuakini Highway – Kuakini Highway will be extended northward to connect to Kealakehe
Parkway, forming a new north-south roadway on the makai side of Queen Kaahumanu Highway.
• Intersection of Kealakaa Street and Palani Road – Two T-intersections, Kealakaa Street
& Palani Road and Palihiolo Street & Palani Road, are being merged into a signalized intersection with additional turn lanes. This will result in the existing intersection of Kealakaa Street & Palani Road (Intersection 9) being limited to right turns in, with all other turning movements focused at Pahiliholo Street & Palani Road (Intersection 8). For this reason, only the latter of these locations is analyzed in the future scenarios.
• Keanalehu Drive and Manawale’a Street – These streets are currently being constructed
just north of the project site to create a new mauka-makai connection.
Cumulative Base Traffic Volumes Forecasts of cumulative base traffic volumes were developed by adding the total projected traffic
growth to the background existing volumes and distributing it over the future street network.
Estimated traffic shifts for the 2020 horizon year were developed based on field observations
and current and future land use patterns. Approximately 20% of the vehicles traveling through
Queen Kaahumanu Highway and Mamalahoa Highway/Palani Road are expected to divert to
the planned new roads described above that will be parallel to these existing highways. The
resulting projected traffic volumes at the analyzed intersections, illustrated in Figure 4, represent
the 2020 cumulative base conditions, i.e., future conditions without the project.
PROJECT TRAFFIC PROJECTIONS
Development of future traffic projections for the proposed project involved a three-step process.
This process included the estimation of project trip generation, trip distribution, and trip
assignment.

19
Project Trip Generation
Trip generation rates found in Trip Generation, 7th Edition (Institute of Transportation Engineers,
2003) were used to estimate number of trips to and from the proposed project. The trip
generation rates used in this study and the estimated new trips generated by the proposed
project Concepts A, B and C are summarized in Tables 4, 5, and 6, respectively.
As shown in Table 4, Concept A is estimated to generate about 9,953 daily trips, including
approximately 1,178 trips during the morning peak hour (631 inbound and 547 outbound) and
approximately 1,046 trips during the evening peak hour (543 inbound and 503 outbound).
As shown in Table 5, Concept B is estimated to generate about 16,034 daily trips, including
approximately 1,511 trips during the morning peak hour (665 inbound and 846 outbound) and
approximately 1,629 trips during the evening peak hour (918 inbound and 711 outbound).
As shown in Table 6, Concept C is estimated to generate about 17,617 daily trips, including
approximately 1,580 trips during the morning peak hour (646 inbound and 934 outbound) and
approximately 1,695 trips during the evening peak hour (973 inbound and 722 outbound).
Project Trip Distribution and Trip Assignment
Factors considered in the development of the project trip distribution include a review of historic
traffic volume data in the area, observations of existing traffic patterns and discussions with
residents, the geographic distribution of employment and commercial activity in the vicinity, and
the proposed street extension program described in Keahole to Honaunau Regional Circulation
Plan. Based on these factors, the following trip distribution pattern was estimated for the
project-generated traffic and is illustrated in Figure 5:
• Northwest 40% • Northeast 20% • Southwest 40%

A.M. Peak Hour P.M. Peak Hour
Trip Gen In Out Trip Gen In Out
Trips Generation Rates [b]
Single Family Housing 210 per Dwelling Unit 1 9.57 0.75 25% 75% 1.01 63% 37%
Apartments 220 per Dwelling Unit 1 6.72 0.51 20% 80% 0.62 65% 35%
Commercial/Retail 710 per 1,000 square feet 2 11.01 1.55 88% 12% 1.49 17% 83%
High School 530 per ksf 12.89 3.06 71% 29% 0.97 54% 46%
A.M. Peak Hour P.M. Peak Hour
In Out Total In Out Total
Single Family Housing 210 400 DU 3,828 75 225 300 255 149 404
Apartments 220 620 DU 4,166 63 253 316 250 134 384
Commercial/Retail 710 197 ksf 2,169 268 37 305 50 244 294
High School 530 150 ksf [c] 1,934 326 133 459 79 67 146
TOTAL PROJECT 12,097 732 648 1,380 634 594 1,228Less: Internal Capture [d] -2,144 -101 -101 -202 -91 -91 -182
Net New Trips 9,953 631 547 1,178 543 503 1,046
Notes:1 Dwelling Unit = DU
2 1,000 square feet = ksf
[a] Source: Keahuolu Affordable Housing Project Master Plan, Kailua-Kona, Hawaii, Belt Collins Hawaii Ltd., June 2007.
[b] Source: Trip Generation, 7th Edition, Institute of Transportation Engineers (ITE), 2003.
[c] Assume that approximately 30% of the total school site (12 acres) is occupied by building area.
[d] Internal trip caputre estimates were based on methodology described in Trip Generation Handbook, 2nd Edition, ITE, 2004.
KEAHUOLU AFFORDABLE HOUSING MASTER PLAN
TABLE 4
Land Use ITE# Rate Daily
PRELIMINARY TRIP GENERATION ESTIMATES
CONCEPT A [a]
Land Use ITE# Size Daily

A.M. Peak Hour P.M. Peak Hour
Trip Gen In Out Trip Gen In Out
Trips Generation Rates [b]
Single Family Housing 210 per Dwelling Unit 1 9.57 0.75 25% 75% 1.01 63% 37%
Apartments 220 per Dwelling Unit 1 6.72 0.51 20% 80% 0.62 65% 35%
Commercial/Retail 710 per 1,000 square feet 2 11.01 1.55 88% 12% 1.49 17% 83%
High School 530 per ksf 12.89 3.06 71% 29% 0.97 54% 46%
A.M. Peak Hour P.M. Peak Hour
In Out Total In Out Total
Single Family Housing 210 600 DU 5,742 113 338 450 382 224 606
Apartments 220 1,240 DU 8,333 126 506 632 500 269 769
Commercial/Retail 710 197 ksf 2,169 268 37 305 50 244 294
High School 530 150 ksf [c] 1,934 326 133 459 79 67 146
TOTAL PROJECT 18,178 833 1,014 1,846 1,011 804 1,815Less: Internal Capture [d] -2,144 -168 -168 -335 -93 -93 -186
Net New Trips 16,034 665 846 1,511 918 711 1,629
Notes:1 Dwelling Unit = DU
2 1,000 square feet = ksf
[a] Source: Keahuolu Affordable Housing Project Master Plan, Kailua-Kona, Hawaii, Belt Collins Hawaii Ltd., June 2007.
[b] Source: Trip Generation, 7th Edition, Institute of Transportation Engineers (ITE), 2003.
[c] Assume that approximately 30% of the total school site (12 acres) is occupied by building area.
Land Use ITE# Size Daily
[d] Internal trip caputre estimates were based on methodology described in Trip Generation Handbook, 2nd Edition, ITE, 2004.
KEAHUOLU AFFORDABLE HOUSING MASTER PLAN
TABLE 5
Land Use ITE# Rate Daily
PRELIMINARY TRIP GENERATION ESTIMATES
CONCEPT B [a]
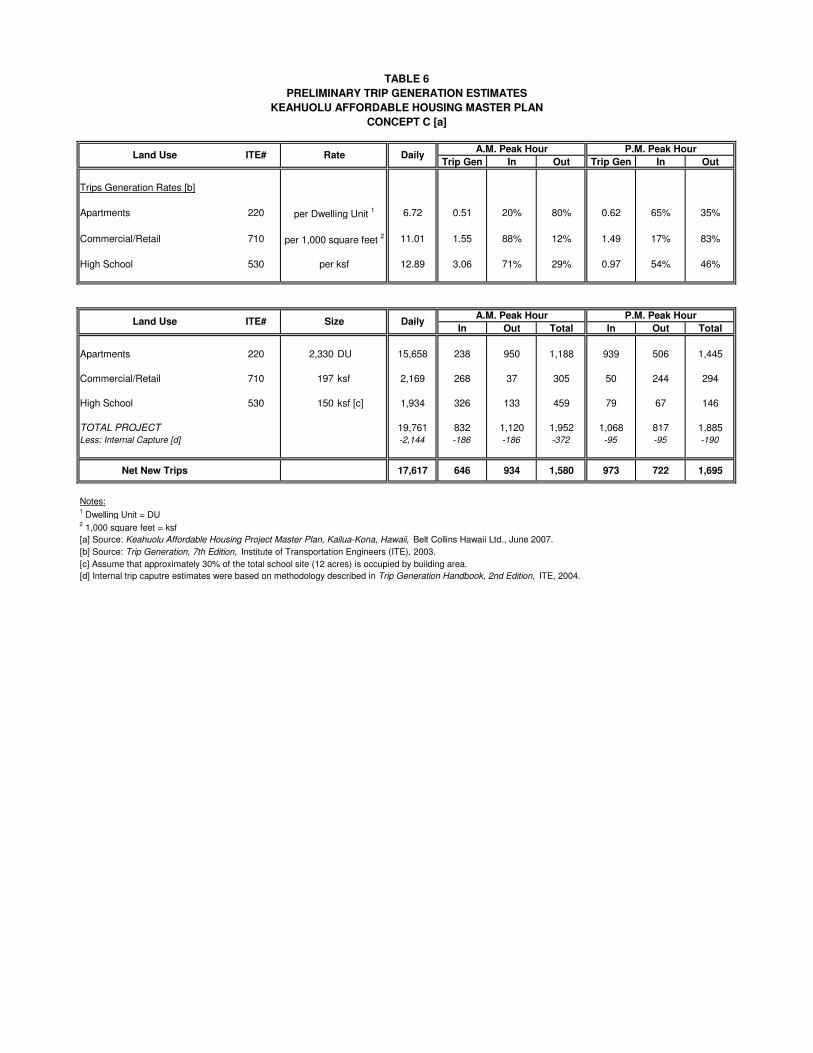
A.M. Peak Hour P.M. Peak Hour
Trip Gen In Out Trip Gen In Out
Trips Generation Rates [b]
Apartments 220 per Dwelling Unit 1 6.72 0.51 20% 80% 0.62 65% 35%
Commercial/Retail 710 per 1,000 square feet 2 11.01 1.55 88% 12% 1.49 17% 83%
High School 530 per ksf 12.89 3.06 71% 29% 0.97 54% 46%
A.M. Peak Hour P.M. Peak Hour
In Out Total In Out Total
Apartments 220 2,330 DU 15,658 238 950 1,188 939 506 1,445
Commercial/Retail 710 197 ksf 2,169 268 37 305 50 244 294
High School 530 150 ksf [c] 1,934 326 133 459 79 67 146
TOTAL PROJECT 19,761 832 1,120 1,952 1,068 817 1,885Less: Internal Capture [d] -2,144 -186 -186 -372 -95 -95 -190
Net New Trips 17,617 646 934 1,580 973 722 1,695
Notes:1 Dwelling Unit = DU
2 1,000 square feet = ksf
[a] Source: Keahuolu Affordable Housing Project Master Plan, Kailua-Kona, Hawaii, Belt Collins Hawaii Ltd., June 2007.
[b] Source: Trip Generation, 7th Edition, Institute of Transportation Engineers (ITE), 2003.
[c] Assume that approximately 30% of the total school site (12 acres) is occupied by building area.
[d] Internal trip caputre estimates were based on methodology described in Trip Generation Handbook, 2nd Edition, ITE, 2004.
KEAHUOLU AFFORDABLE HOUSING MASTER PLAN
TABLE 6
Land Use ITE# Rate Daily
PRELIMINARY TRIP GENERATION ESTIMATES
CONCEPT C [a]
Land Use ITE# Size Daily

OLUWALU ST
KAUHOLA ST
MAIAU ST
HINA LANI ST
ALLIED QUARRY RD
KEALAK
EHE
OLD DUMP ACCESS RDKEALAKEHE ST
KEALAKAA ST
PALA
NI R
D
KUAKINI
ANE KEOHOKALOLE HWY
PUOHUL
IHULI
KANALANI ST
QUEEN KAAHUMANU HWY
KAMANU ST
PALA
NI R
D
KAMAKAEHA A
VM
AKALA B
L
KONA B
AY DR
KAIWI S
TALA
PA ST
LUHIA ST
HIONA ST
PKWY
OLOLI RD
KOPIKO OLD
HENRY ST
HUALALAI R
D
KEALAPUA ST
HUAALA ST
ULUA'O'A ST
HALE-KAPILI
MALULANI DR
PACIFIC OCEAN
ALII D
R
QUEE
N K
AAHUMANU H
WY
PAHILIHOLO ST
11
KEANALEHU DR
MANAWALE'A ST
19
190
180
190
20%
40%
40%
BOAT PARK RD
HOLOHOLO ST
HWY
KUAK
INI H
WY
KAMALANI ST
MAMALAHOA HWY
NOT TO SCALE
PROJECT TRIP DISTRIBUTION
FIGURE 5
LEGEND
- Planned Street Extension
- Proposed Keahuolu Affordable Housing Project
%
- Planned Street Widening
- Project Trip Distribution

24
The project trip assignment took into account the roadway network anticipated to be in place by
2020, when the project would be fully built out. Figures 6, 7, and 8 illustrate the assignment of
new project-related traffic at each study intersection.
CUMULATIVE PLUS PROJECT TRAFFIC PROJECTIONS
The project-generated traffic volumes were added to the cumulative base traffic projections to
develop the cumulative plus project traffic forecasts for 2020. Figures 9, 10, and 11 illustrate
the projected cumulative plus project a.m. and p.m. peak hour traffic volumes at each of the 12
study intersections. Appendix A depicts the anticipated future lane configurations at the study
intersections, including assumptions regarding the future intersections of Palani Road (SR 190)
& Minor Site Access Road and Ane Keohokalole Highway & Major Site Access Road and the
north leg of Henry Street & Palani Road.

OLUWALU ST
KAUHOLA ST
MAIAU ST
HINA LANI ST
ALLIED QUARRY RD
KEALAK
EHE
OLD DUMP ACCESS RDKEALAKEHE ST
KEALAKAA ST
PALA
NI R
D
KUAKINI
ANE KEOHOKALOLE HWY
PUOHUL
IHULI
KANALANI ST
QUEEN KAAHUMANU HWY
KAMANU ST
12
2
1
4
PALA
NI R
D
3
KAMAKAEH
A AVM
AKALA B
L
KONA BA
Y DR
KAIWI S
TALAPA ST
LUHIA ST
HIONA ST
PKWY
OLOLI RD
KOPIKO OLD
HENRY ST
HUALALA
I RD
KEALAPUA ST
HUAALA ST
ULUA'O'A ST
HALE-KAPILI
MALULANI DR
PACIFIC OCEAN
ALII DR
QUEEN
KAAHUMANU H
WY
11
PAHILIHOLO ST
11
9
KEANALEHU DR
MANAWALE'A ST
19
190
190
10
6
8
7
5
BOAT PARK RD
HOLOHOLO ST
HWY
KUAK
INI H
WY
Queen Kaahumanu Hwy (SR 19)
& Henry St
1. Queen Kaahumanu Hwy (SR 19)
& Palani Rd (SR 190) &
2. Kamakaeha Ave &
Palani Rd (SR 190)
3.
Henry St &
Palani Rd (SR 190)
4.
Minor Site Access Rd &
Palani Rd (SR 190)
5.
Queen Kaahumanu Hwy (SR 19)
& Makala Blvd
6.
NOT TO SCALE
PROJECT ONLY (2020) PEAK HOUR TRAFFIC VOLUMES - SCENARIO A
FIGURE 6
71(65)*(*)
*(*)
*(*)
*(*)
*(*)
27(25)
*(*)
*(*)*(*)
*(*)
63(54)
*(*)
*(*)50(43)
44(40)
*(*)*(*)
*(*)
*(*)
*(*)27(25)
*(*)
*(*)
63(54)
*(*)44(38)
38(35)
126(109)*(*)
50(43)
*(*)
109(101)*(*)
*(*)
44(40)
*(*)
114(98)
*
**
*
55(50)
*(*)95(81)
27(25)
*(*)*(*)*(*)
114(98)*(*)
27(25)
*(*)*(*)
170(147)
*(*)
*(*)*(*)
71(65)
120(111)
55(50)
* - Negligible Volume
X(X) - A.M.(P.M.) Peak Hour Traffic Volumes
- Analyzed Intersection
Housing Project- Proposed Keahuolu Affordable
- Planned Street Extension
LEGEND
#
- Planned Street Widening

OLUWALU ST
KAUHOLA ST
MAIAU ST
HINA LANI ST
ALLIED QUARRY RD
KEALAK
EHE
OLD DUMP ACCESS RDKEALAKEHE ST
KEALAKAA ST
PALA
NI R
D
KUAKINI
ANE KEOHOKALOLE HWY
PUOHUL
IHULI
KANALANI ST
QUEEN KAAHUMANU HWY
KAMANU ST
12
2
1
4
PALA
NI R
D
3
KAMAKAEH
A AVM
AKALA B
L
KONA BA
Y DR
KAIWI S
TALAPA ST
LUHIA ST
HIONA ST
PKWY
OLOLI RD
KOPIKO OLD
HENRY ST
HUALALA
I RD
KEALAPUA ST
HUAALA ST
ULUA'O'A ST
HALE-KAPILI
MALULANI DR
PACIFIC OCEAN
ALII DR
QUEEN
KAAHUMANU H
WY
11
PAHILIHOLO ST
11
9
KEANALEHU DR
MANAWALE'A ST
19
190
190
10
6
8
7
5
BOAT PARK RD
HOLOHOLO ST
HWY
KUAK
INI H
WY
Kealakaa St &
Palani Rd (SR 190)
9.
Palani Rd (SR 190) &
Uluaoa St
10.
Queen Kaahumanu Hwy
(SR 19) & Kealakehe Pkwy
11.
Ane Keohokalole Hwy &
Kealakehe Pkwy
12.
PROJECT ONLY (2020) PEAK HOUR TRAFFIC VOLUMES - SCENARIO A
FIGURE 6 (CONT.)
*(*)
*(*)
27(25)
*(*)82(75)
*(*)*(*)*(*)
*(*)
*(*)
63(54)
95(81)
*(*)*(*)
*(*)
*(*)126(109)
82(75)
109(101)
*(*)*(*)
*(*)
63(54)
*(*)
*(*)*(*) 5
5(50)
*(*)
*(*)
63(54)
Ane Keohokalole Hwy &
Major Site Access Rd
7.
*(*)
284(244)
*(*)
*(*)
189(163)
191(176)
*(*)
*(*)
*(*)
*(*)
32(27)
55(50)*(*)
*(*)
*(*)
*(*)63(54)*(*)
NOT TO SCALE
SEE INTERSECTION 8
Palani Rd (SR 190)
8. Kealakaa St/Pahiliholo St &
* - Negligible Volume
X(X) - A.M.(P.M.) Peak Hour Traffic Volumes
- Analyzed Intersection
Housing Project- Proposed Keahuolu Affordable
- Planned Street Extension
LEGEND
#
- Planned Street Widening

OLUWALU ST
KAUHOLA ST
MAIAU ST
HINA LANI ST
ALLIED QUARRY RD
KEALAK
EHE
OLD DUMP ACCESS RDKEALAKEHE ST
KEALAKAA ST
PALA
NI R
D
KUAKINI
ANE KEOHOKALOLE HWY
PUOHUL
IHULI
KANALANI ST
QUEEN KAAHUMANU HWY
KAMANU ST
12
2
1
4
PALA
NI R
D
3
KAMAKAEH
A AVM
AKALA B
L
KONA BA
Y DR
KAIWI S
TALAPA ST
LUHIA ST
HIONA ST
PKWY
OLOLI RD
KOPIKO OLD
HENRY ST
HUALALA
I RD
KEALAPUA ST
HUAALA ST
ULUA'O'A ST
HALE-KAPILI
MALULANI DR
PACIFIC OCEAN
ALII DR
QUEEN
KAAHUMANU H
WY
11
PAHILIHOLO ST
11
9
KEANALEHU DR
MANAWALE'A ST
19
190
190
10
6
8
7
5
BOAT PARK RD
HOLOHOLO ST
HWY
KUAK
INI H
WY
Queen Kaahumanu Hwy (SR 19)
& Henry St
1. Queen Kaahumanu Hwy (SR 19)
& Palani Rd (SR 190) &
2. Kamakaeha Ave &
Palani Rd (SR 190)
3.
Henry St &
Palani Rd (SR 190)
4.
Minor Site Access Rd &
Palani Rd (SR 190)
5.
Queen Kaahumanu Hwy (SR 19)
& Makala Blvd
6.
NOT TO SCALE
* - Negligible Volume
X(X) - A.M.(P.M.) Peak Hour Traffic Volumes
- Analyzed Intersection
Housing Project- Proposed Keahuolu Affordable
- Planned Street Extension
LEGEND
#
FIGURE 7
PROJECT ONLY (2020) PEAK HOUR TRAFFIC VOLUMES - SCENARIO B
85(71)
186(156)
110(92)
*(*)
*(*)*(*) *
(*)
120(165)
*(*)*(*)*(*)
42(36)
100(138)*(*)
85(71)
*(*)
*(*)
180(248)
42(36)
120(165)
*(*)
68(57)
*(*)
*(*)169(142)
*(*)
53(73)
*(*)133(184)
59(50)
47(64)
*(*)
67(92)
*(*)
*(*)
42(36)*(*)
*(*)
*(*)*(*)
*(*)
68(57)
53(73)
*(*)
*(*)
67(92)
*(*)
*(*)*(*)
*(*)
42(36)
*(*)
*(*)
*(*)
*(*)
*(*)110(92)
- Planned Street Widening

OLUWALU ST
KAUHOLA ST
MAIAU ST
HINA LANI ST
ALLIED QUARRY RD
KEALAK
EHE
OLD DUMP ACCESS RDKEALAKEHE ST
KEALAKAA ST
PALA
NI R
D
KUAKINI
ANE KEOHOKALOLE HWY
PUOHUL
IHULI
KANALANI ST
QUEEN KAAHUMANU HWY
KAMANU ST
12
2
1
4
PALA
NI R
D
3
KAMAKAEH
A AVM
AKALA B
L
KONA BA
Y DR
KAIWI S
TALAPA ST
LUHIA ST
HIONA ST
PKWY
OLOLI RD
KOPIKO OLD
HENRY ST
HUALALA
I RD
KEALAPUA ST
HUAALA ST
ULUA'O'A ST
HALE-KAPILI
MALULANI DR
PACIFIC OCEAN
ALII DR
QUEEN
KAAHUMANU H
WY
11
PAHILIHOLO ST
11
9
KEANALEHU DR
MANAWALE'A ST
19
190
190
10
6
8
7
5
BOAT PARK RD
HOLOHOLO ST
HWY
KUAK
INI H
WY
Kealakaa St &
Palani Rd (SR 190)
9.
Palani Rd (SR 190) &
Uluaoa St
10.
Queen Kaahumanu Hwy
(SR 19) & Kealakehe Pkwy
11.
Ane Keohokalole Hwy &
Kealakehe Pkwy
12.
FIGURE 7 (CONT.)
PROJECT ONLY (2020) PEAK HOUR TRAFFIC VOLUMES - SCENARIO B
67(92)
*(*)
*(*)
85(71)
*(*)*(*)
*(*)
67(92)
*(*)
*(*)*(*)
169(142)
127(107)
133(184)*(*)
*(*)
*(*)
*(*)
100(138)
67(92)
*(*)
*(*)*(*)
*(*)*(*)
127(107)*(*)
42(36)
*(*)
*(*)
Ane Keohokalole Hwy &
Major Site Access Rd
7.
*(*)67(92)*(*)
*(*)
*(*)
*(*)85(71)
33(46)
*(*)
*(*)*(*)
*(*)
200(275)
*(*)
296(249)
*(*)
381(320)
299(413)
NOT TO SCALE
SEE INTERSECTION 8
Palani Rd (SR 190)
8. Kealakaa St/Pahiliholo St &
* - Negligible Volume
X(X) - A.M.(P.M.) Peak Hour Traffic Volumes
- Analyzed Intersection
Housing Project- Proposed Keahuolu Affordable
- Planned Street Extension
LEGEND
#
- Planned Street Widening

OLUWALU ST
KAUHOLA ST
MAIAU ST
HINA LANI ST
ALLIED QUARRY RD
KEALAK
EHE
OLD DUMP ACCESS RDKEALAKEHE ST
KEALAKAA ST
PALA
NI R
D
KUAKINI
ANE KEOHOKALOLE HWY
PUOHUL
IHULI
KANALANI ST
QUEEN KAAHUMANU HWY
KAMANU ST
12
2
1
4
PALA
NI R
D
3
KAMAKAEH
A AVM
AKALA B
L
KONA BA
Y DR
KAIWI S
TALAPA ST
LUHIA ST
HIONA ST
PKWY
OLOLI RD
KOPIKO OLD
HENRY ST
HUALALA
I RD
KEALAPUA ST
HUAALA ST
ULUA'O'A ST
HALE-KAPILI
MALULANI DR
PACIFIC OCEAN
ALII DR
QUEEN
KAAHUMANU H
WY
11
PAHILIHOLO ST
11
9
KEANALEHU DR
MANAWALE'A ST
19
190
190
10
6
8
7
5
BOAT PARK RD
HOLOHOLO ST
HWY
KUAK
INI H
WY
Queen Kaahumanu Hwy (SR 19)
& Henry St
1. Queen Kaahumanu Hwy (SR 19)
& Palani Rd (SR 190) &
2. Kamakaeha Ave &
Palani Rd (SR 190)
3.
Henry St &
Palani Rd (SR 190)
4.
Minor Site Access Rd &
Palani Rd (SR 190)
5.
Queen Kaahumanu Hwy (SR 19)
& Makala Blvd
6.
NOT TO SCALE
* - Negligible Volume
X(X) - A.M.(P.M.) Peak Hour Traffic Volumes
- Analyzed Intersection
Housing Project- Proposed Keahuolu Affordable
- Planned Street Extension
LEGEND
#
FIGURE 8
PROJECT ONLY (2020) PEAK HOUR TRAFFIC VOLUMES - SCENARIO C
93(72)
205(159)
121(94)
*(*)
*(*)*(*) *
(*)
116(175)
*(*)*(*)*(*)
47(36)
97(146)*(*)
93(72)
*(*)
*(*)
174(263)
47(36)
116(175)
*(*)
75(58)
*(*)
*(*)187(144)
*(*)
52(78)
*(*)129(195)
65(51)
45(68)
*(*)
65(97)
*(*)
*(*)
47(36)*(*)
*(*)
*(*)*(*)
*(*)
75(58)
52(78)
*(*)
*(*)
65(97)
*(*)
*(*)*(*)
*(*)
47(36)
*(*)
*(*)
*(*)
*(*)
*(*)121(94)
- Planned Street Widening

OLUWALU ST
KAUHOLA ST
MAIAU ST
HINA LANI ST
ALLIED QUARRY RD
KEALAK
EHE
OLD DUMP ACCESS RDKEALAKEHE ST
KEALAKAA ST
PALA
NI R
D
KUAKINI
ANE KEOHOKALOLE HWY
PUOHUL
IHULI
KANALANI ST
QUEEN KAAHUMANU HWY
KAMANU ST
12
2
1
4
PALA
NI R
D
3
KAMAKAEH
A AVM
AKALA B
L
KONA BA
Y DR
KAIWI S
TALAPA ST
LUHIA ST
HIONA ST
PKWY
OLOLI RD
KOPIKO OLD
HENRY ST
HUALALA
I RD
KEALAPUA ST
HUAALA ST
ULUA'O'A ST
HALE-KAPILI
MALULANI DR
PACIFIC OCEAN
ALII DR
QUEEN
KAAHUMANU H
WY
11
PAHILIHOLO ST
11
9
KEANALEHU DR
MANAWALE'A ST
19
190
190
10
6
8
7
5
BOAT PARK RD
HOLOHOLO ST
HWY
KUAK
INI H
WY
Kealakaa St &
Palani Rd (SR 190)
9.
Palani Rd (SR 190) &
Uluaoa St
10.
Queen Kaahumanu Hwy
(SR 19) & Kealakehe Pkwy
11.
Ane Keohokalole Hwy &
Kealakehe Pkwy
12.
FIGURE 8 (CONT.)
PROJECT ONLY (2020) PEAK HOUR TRAFFIC VOLUMES - SCENARIO C
65(97)
*(*)
*(*)
93(72)
*(*)*(*)
*(*)
65(97)
*(*)
*(*)*(*)
187(144)
140(108)
129(195)*(*)
*(*)
*(*)
*(*)
97(146)
65(97)
*(*)
*(*)*(*)
*(*)*(*)
140(108)*(*)
47(36)
*(*)
*(*)
Ane Keohokalole Hwy &
Major Site Access Rd
7.
*(*)65(97)*(*)
*(*)
*(*)
*(*)93(72)
32(49)
*(*)
*(*)*(*)
*(*)
194(292)
*(*)
327(253)
*(*)
420(325)
291(438)
NOT TO SCALE
SEE INTERSECTION 8
Palani Rd (SR 190)
8. Kealakaa St/Pahiliholo St &
* - Negligible Volume
X(X) - A.M.(P.M.) Peak Hour Traffic Volumes
- Analyzed Intersection
Housing Project- Proposed Keahuolu Affordable
- Planned Street Extension
LEGEND
#
- Planned Street Widening

OLUWALU ST
KAUHOLA ST
MAIAU ST
HINA LANI ST
ALLIED QUARRY RD
KEALAK
EHE
OLD DUMP ACCESS RDKEALAKEHE ST
KEALAKAA ST
PALA
NI R
D
KUAKINI
ANE KEOHOKALOLE HWY
PUOHUL
IHULI
KANALANI ST
QUEEN KAAHUMANU HWY
KAMANU ST
12
2
1
4
PALA
NI R
D
3
KAMAKAEH
A AVM
AKALA B
L
KONA BA
Y DR
KAIWI S
TALAPA ST
LUHIA ST
HIONA ST
PKWY
OLOLI RD
KOPIKO OLD
HENRY ST
HUALALA
I RD
KEALAPUA ST
HUAALA ST
ULUA'O'A ST
HALE-KAPILI
MALULANI DR
PACIFIC OCEAN
ALII DR
QUEEN
KAAHUMANU H
WY
11
PAHILIHOLO ST
11
9
KEANALEHU DR
MANAWALE'A ST
19
190
190
10
6
8
7
5
BOAT PARK RD
HOLOHOLO ST
HWY
KUAK
INI H
WY
Queen Kaahumanu Hwy (SR 19)
& Henry St
1. Queen Kaahumanu Hwy (SR 19)
& Palani Rd (SR 190) &
2. Kamakaeha Ave &
Palani Rd (SR 190)
3.
Henry St &
Palani Rd (SR 190)
4.
Minor Site Access Rd &
Palani Rd (SR 190)
5.
Queen Kaahumanu Hwy (SR 19)
& Makala Blvd
6.
NOT TO SCALE
CUMULATIVE PLUS PROJECT (2020) PEAK HOUR TRAFFIC VOLUMESFIGURE 9
846(894)240(281)
15(63)
47(127)
30(80)
7(21)
929(724)
10(14)
21(71)143(104)
200(294)
903(1,202)
68(86)
193(269)70(63)
76(126)
144(293)99(219)
807(706)
97(38)
658(732)*
372(358)
655(707)
78(99)
76(76)922(806)
615(549)
412(553)25(107)
799(507)
320(282)
638(561)99(211)
132(121)
553(713)
130(183)
404(618)
*
**
*
725(877)
1,800(1,853)95(81)
27(25)
309(417)72(126)32(41)
237(268)454(394)
927(859)
185(416)37(129)
404(329)
122(110)
810(927)90(93)
288(183)
492(314)
86(67)
* - Negligible Volume
X(X) - A.M.(P.M.) Peak Hour Traffic Volumes
- Analyzed Intersection
Housing Project- Proposed Keahuolu Affordable
- Planned Street Extension
LEGEND
#
SCENARIO A
- Planned Street Widening

OLUWALU ST
KAUHOLA ST
MAIAU ST
HINA LANI ST
ALLIED QUARRY RD
KEALAK
EHE
OLD DUMP ACCESS RDKEALAKEHE ST
KEALAKAA ST
PALA
NI R
D
KUAKINI
ANE KEOHOKALOLE HWY
PUOHUL
IHULI
KANALANI ST
QUEEN KAAHUMANU HWY
KAMANU ST
12
2
1
4
PALA
NI R
D
3
KAMAKAEH
A AVM
AKALA B
L
KONA BA
Y DR
KAIWI S
TALAPA ST
LUHIA ST
HIONA ST
PKWY
OLOLI RD
KOPIKO OLD
HENRY ST
HUALALA
I RD
KEALAPUA ST
HUAALA ST
ULUA'O'A ST
HALE-KAPILI
MALULANI DR
PACIFIC OCEAN
ALII DR
QUEEN
KAAHUMANU H
WY
11
PAHILIHOLO ST
11
9
KEANALEHU DR
MANAWALE'A ST
19
190
190
10
6
8
7
5
BOAT PARK RD
HOLOHOLO ST
HWY
KUAK
INI H
WY
Kealakaa St &
Palani Rd (SR 190)
9.
Palani Rd (SR 190) &
Uluaoa St
10.
Queen Kaahumanu Hwy
(SR 19) & Kealakehe Pkwy
11.
Ane Keohokalole Hwy &
Kealakehe Pkwy
12.
422(239)
231(242)
1,022(1,086)
61(66)163(135)
81(106)107(97)10(67)
115(66)
249(232)
973(1,028)
266(136)
369(165)3(*)
2(5)
94(194)449(185)
402(363)
233(179)
115(128)50(23)
45(369)
358(311)
12(50)
176(71)200(32) 4
77(740)
58(29)
311(177)
786(1,018)
CUMULATIVE PLUS PROJECT (2020) PEAK HOUR TRAFFIC VOLUMESFIGURE 9 (CONT.)
SCENARIO A
Ane Keohokalole Hwy &
Major Site Access Rd
7.
284(244)
246(226)
447(445)
191(176)
620(338)
189(163)
10(2)
6(13)
5(4)
15(4)
553(592)
531(731)438(506)
20(19)
32(26)
56(23)1,317(1,319)20(49)
NOT TO SCALE
SEE INTERSECTION 8
Palani Rd (SR 190)
8. Kealakaa St/Pahiliholo St &
* - Negligible Volume
X(X) - A.M.(P.M.) Peak Hour Traffic Volumes
- Analyzed Intersection
Housing Project- Proposed Keahuolu Affordable
- Planned Street Extension
LEGEND
#
- Planned Street Widening

OLUWALU ST
KAUHOLA ST
MAIAU ST
HINA LANI ST
ALLIED QUARRY RD
KEALAK
EHE
OLD DUMP ACCESS RDKEALAKEHE ST
KEALAKAA ST
PALA
NI R
D
KUAKINI
ANE KEOHOKALOLE HWY
PUOHUL
IHULI
KANALANI ST
QUEEN KAAHUMANU HWY
KAMANU ST
12
2
1
4
PALA
NI R
D
3
KAMAKAEH
A AVM
AKALA B
L
KONA BA
Y DR
KAIWI S
TALAPA ST
LUHIA ST
HIONA ST
PKWY
OLOLI RD
KOPIKO OLD
HENRY ST
HUALALA
I RD
KEALAPUA ST
HUAALA ST
ULUA'O'A ST
HALE-KAPILI
MALULANI DR
PACIFIC OCEAN
ALII DR
QUEEN
KAAHUMANU H
WY
11
PAHILIHOLO ST
11
9
KEANALEHU DR
MANAWALE'A ST
19
190
190
10
6
8
7
5
BOAT PARK RD
HOLOHOLO ST
HWY
KUAK
INI H
WY
Queen Kaahumanu Hwy (SR 19)
& Henry St
1. Queen Kaahumanu Hwy (SR 19)
& Palani Rd (SR 190) &
2. Kamakaeha Ave &
Palani Rd (SR 190)
3.
Henry St &
Palani Rd (SR 190)
4.
Minor Site Access Rd &
Palani Rd (SR 190)
5.
Queen Kaahumanu Hwy (SR 19)
& Makala Blvd
6.
NOT TO SCALE
* - Negligible Volume
X(X) - A.M.(P.M.) Peak Hour Traffic Volumes
- Analyzed Intersection
Housing Project- Proposed Keahuolu Affordable
- Planned Street Extension
LEGEND
#
SCENARIO B
FIGURE 10CUMULATIVE PLUS PROJECT (2020) PEAK HOUR TRAFFIC VOLUMES
116(88)
558(359)
327(210)
90(93)
37(129)185(416) 4
54(394)
243(335)
32(41)72(126)
309(417)
42(36)
100(138)1,800(1,853)
755(898)
810(927)
122(110)
414(430)
942(870)
410(685)
130(183)
577(730)
132(121)
99(211)698(602)
320(282)
802(537)
25(107)419(628)
636(564)
925(832)
76(76)
193(299)
655(707)
372(358)
93(110)658(732)
97(38)
807(706)
99(219)144(293)
100(143)
73(93)
193(269)
68(86)
907(1,240)
200(294)
143(104)21(71)
10(14)
944(735)
7(21)
30(80)
47(127)
15(63)
240(281)885(921)
- Planned Street Widening

OLUWALU ST
KAUHOLA ST
MAIAU ST
HINA LANI ST
ALLIED QUARRY RD
KEALAK
EHE
OLD DUMP ACCESS RDKEALAKEHE ST
KEALAKAA ST
PALA
NI R
D
KUAKINI
ANE KEOHOKALOLE HWY
PUOHUL
IHULI
KANALANI ST
QUEEN KAAHUMANU HWY
KAMANU ST
12
2
1
4
PALA
NI R
D
3
KAMAKAEH
A AVM
AKALA B
L
KONA BA
Y DR
KAIWI S
TALAPA ST
LUHIA ST
HIONA ST
PKWY
OLOLI RD
KOPIKO OLD
HENRY ST
HUALALA
I RD
KEALAPUA ST
HUAALA ST
ULUA'O'A ST
HALE-KAPILI
MALULANI DR
PACIFIC OCEAN
ALII DR
QUEEN
KAAHUMANU H
WY
11
PAHILIHOLO ST
11
9
KEANALEHU DR
MANAWALE'A ST
19
190
190
10
6
8
7
5
BOAT PARK RD
HOLOHOLO ST
HWY
KUAK
INI H
WY
Kealakaa St &
Palani Rd (SR 190)
9.
Palani Rd (SR 190) &
Uluaoa St
10.
Queen Kaahumanu Hwy
(SR 19) & Kealakehe Pkwy
11.
Ane Keohokalole Hwy &
Kealakehe Pkwy
12.
SCENARIO B
FIGURE 10 (CONT.)CUMULATIVE PLUS PROJECT (2020) PEAK HOUR TRAFFIC VOLUMES
790(1,056)
311(177)
58(29)
507(761)
200(32)176(71)
12(50)
362(349)
45(369)
50(23)115(128)
293(220)
447(395)
456(260)94(194)
2(5)
3(*)
369(165)
271(193)
977(1,066)
249(232)
115(66)
10(67)107(97)81(106)
208(167)61(66)
1,037(1,097)
231(242)
422(239)
Ane Keohokalole Hwy &
Major Site Access Rd
7.
20(49)1,321(1,357)56(23)
32(26)
20(19)
438(506)561(752)
554(611)
15(4)
5(4)6(13)
10(2)
200(275)
620(338)
296(249)
447(445)
381(320)
299(413)
NOT TO SCALE
SEE INTERSECTION 8
Palani Rd (SR 190)
8. Kealakaa St/Pahiliholo St &
* - Negligible Volume
X(X) - A.M.(P.M.) Peak Hour Traffic Volumes
- Analyzed Intersection
Housing Project- Proposed Keahuolu Affordable
- Planned Street Extension
LEGEND
#
- Planned Street Widening

OLUWALU ST
KAUHOLA ST
MAIAU ST
HINA LANI ST
ALLIED QUARRY RD
KEALAK
EHE
OLD DUMP ACCESS RDKEALAKEHE ST
KEALAKAA ST
PALA
NI R
D
KUAKINI
ANE KEOHOKALOLE HWY
PUOHUL
IHULI
KANALANI ST
QUEEN KAAHUMANU HWY
KAMANU ST
12
2
1
4
PALA
NI R
D
3
KAMAKAEH
A AVM
AKALA B
L
KONA BA
Y DR
KAIWI S
TALAPA ST
LUHIA ST
HIONA ST
PKWY
OLOLI RD
KOPIKO OLD
HENRY ST
HUALALA
I RD
KEALAPUA ST
HUAALA ST
ULUA'O'A ST
HALE-KAPILI
MALULANI DR
PACIFIC OCEAN
ALII DR
QUEEN
KAAHUMANU H
WY
11
PAHILIHOLO ST
11
9
KEANALEHU DR
MANAWALE'A ST
19
190
190
10
6
8
7
5
BOAT PARK RD
HOLOHOLO ST
HWY
KUAK
INI H
WY
Queen Kaahumanu Hwy (SR 19)
& Henry St
1. Queen Kaahumanu Hwy (SR 19)
& Palani Rd (SR 190) &
2. Kamakaeha Ave &
Palani Rd (SR 190)
3.
Henry St &
Palani Rd (SR 190)
4.
Minor Site Access Rd &
Palani Rd (SR 190)
5.
Queen Kaahumanu Hwy (SR 19)
& Makala Blvd
6.
NOT TO SCALE
* - Negligible Volume
X(X) - A.M.(P.M.) Peak Hour Traffic Volumes
- Analyzed Intersection
Housing Project- Proposed Keahuolu Affordable
- Planned Street Extension
LEGEND
#
SCENARIO C
FIGURE 11CUMULATIVE PLUS PROJECT (2020) PEAK HOUR TRAFFIC VOLUMES
124(89)
577(362)
338(212)
90(93)
37(129)185(416) 4
54(394)
239(345)
32(41)72(126)
309(417)
47(36)
97(146)1,800(1,853)
763(899)
810(927)
122(110)
408(445)
947(870)
406(695)
130(183)
584(731)
132(121)
99(211)716(604)
320(282)
801(542)
25(107)415(639)
642(565)
923(836)
76(76)
191(304)
655(707)
372(358)
98(110)658(732)
97(38)
807(706)
99(219)144(293)
107(144)
72(98)
193(269)
68(86)
905(1,245)
200(294)
143(104)21(71)
10(14)
949(735)
7(21)
30(80)
47(127)
15(63)
240(281)896(923)
- Planned Street Widening

OLUWALU ST
KAUHOLA ST
MAIAU ST
HINA LANI ST
ALLIED QUARRY RD
KEALAK
EHE
OLD DUMP ACCESS RDKEALAKEHE ST
KEALAKAA ST
PALA
NI R
D
KUAKINI
ANE KEOHOKALOLE HWY
PUOHUL
IHULI
KANALANI ST
QUEEN KAAHUMANU HWY
KAMANU ST
12
2
1
4
PALA
NI R
D
3
KAMAKAEH
A AVM
AKALA B
L
KONA BA
Y DR
KAIWI S
TALAPA ST
LUHIA ST
HIONA ST
PKWY
OLOLI RD
KOPIKO OLD
HENRY ST
HUALALA
I RD
KEALAPUA ST
HUAALA ST
ULUA'O'A ST
HALE-KAPILI
MALULANI DR
PACIFIC OCEAN
ALII DR
QUEEN
KAAHUMANU H
WY
11
PAHILIHOLO ST
11
9
KEANALEHU DR
MANAWALE'A ST
19
190
190
10
6
8
7
5
BOAT PARK RD
HOLOHOLO ST
HWY
KUAK
INI H
WY
Kealakaa St &
Palani Rd (SR 190)
9.
Palani Rd (SR 190) &
Uluaoa St
10.
Queen Kaahumanu Hwy
(SR 19) & Kealakehe Pkwy
11.
Ane Keohokalole Hwy &
Kealakehe Pkwy
12.
SCENARIO C
FIGURE 11 (CONT.)CUMULATIVE PLUS PROJECT (2020) PEAK HOUR TRAFFIC VOLUMES
788(1,061)
311(177)
58(29)
515(762)
200(32)176(71)
12(50)
360(354)
45(369)
50(23)115(128)
311(222)
460(396)
452(271)94(194)
2(5)
3(*)
369(165)
268(201)
975(1,071)
249(232)
115(66)
10(67)107(97)81(106)
221(168)61(66)
1,042(1,097)
231(242)
422(239)
Ane Keohokalole Hwy &
Major Site Access Rd
7.
20(49)1,319(1,362)56(23)
32(26)
20(19)
438(506)569(753)
553(614)
15(4)
5(4)6(13)
10(2)
194(292)
620(338)
327(253)
447(445)
420(325)
291(438)
NOT TO SCALE
SEE INTERSECTION 8
Palani Rd (SR 190)
8. Kealakaa St/Pahiliholo St &
* - Negligible Volume
X(X) - A.M.(P.M.) Peak Hour Traffic Volumes
- Analyzed Intersection
Housing Project- Proposed Keahuolu Affordable
- Planned Street Extension
LEGEND
#
- Planned Street Widening

37
IV. INTERSECTION TRAFFIC IMPACT ANALYSIS
This chapter presents an analysis of the potential impacts on the roadway system due to
projected increase in traffic, including traffic generated by the proposed project under each of
the three project development concepts. The analysis compares the projected levels of service
at each study intersection under cumulative conditions for 2020 both with and without the
proposed project to determine potential project impacts.
INTERSECTION SIGNIFICANT IMPACT CRITERIA
The levels of service range from excellent conditions at LOS A to overloaded conditions at LOS
F. LOS D is considered the minimum desirable LOS in this area. If LOS E or F were projected
under cumulative base conditions, this would be characterized as a cumulative impact. If the
addition of project-generated traffic were to result in LOS E or F, this would be characterized as a
project-specific impact.
CUMULATIVE BASE TRAFFIC CONDITIONS
This section presents an analysis of potential future traffic conditions under projected for the
year 2020. The cumulative base traffic volumes projected in Chapter III were analyzed using
the methodologies described in Chapter II to forecast cumulative base peak hour LOS at the
study intersections. The first columns in Tables 7, 8, and 9 summarize the results of this
analysis.
Future operations at the Intersections 8 and 9 are presented in the analysis of Intersection 8, as
the ongoing safety improvements discussed previously will focus traffic at that location. The
following five intersections are projected to operate at LOS E or F during one or both peak hours
in 2020:

1 Queen Kaahumanu Hwy (SR 19) A.M. 0.813 26 C 0.885 29 C YES No mitigation necessary YES
& Henry St P.M. 0.819 27 C 0.881 29 C YES YES
2 Queen Kaahumanu Hwy (SR 19) A.M. 0.873 33 C 0.914 35 D YES No mitigation necessary YES
& Palani Rd (SR 190)/Alii Dr P.M. 0.988 40 D 1.015 43 D YES YES
3 Kamakaeha Av A.M. NC 23 C NC 29 D YES 0.558 5 A YES
& Palani Rd (SR 190) P.M. NC ** F NC ** F NO 0.652 10 B YES
4 Henry St A.M. 1.099 81 F 1.677 ** F NO 0.833 32 C YES
& Palani Rd (SR 190) P.M. 1.248 ** F 1.340 ** F NO 0.926 33 C YES
5 Minor Site Access Road A.M. NC NC NC NC ** F NO - - A YES
& Palani Rd (SR 190) [a] P.M. NC NC NC NC ** F NO - - A YES
6 Queen Kaahumanu Hwy (SR 19) A.M. 0.653 22 C 0.661 22 C YES No mitigation necessary YES
& Makala Bl P.M. 0.769 25 C 0.787 25 C YES YES
7 Ane Keohokahole Hwy A.M. NC NC NC NC ** F NO 0.579 16 B YES
& Major Site Access Road P.M. NC NC NC NC ** F NO 0.455 16 B YES
8 Kealakaa St/Palihiolo St A.M. 1.522 ** F 1.638 ** F NO 0.982 33 C YES
& Palani Rd (SR 190) [b] P.M. 1.734 ** F 1.837 ** F NO 1.023 41 D YES
10 Palani Rd (SR 190) A.M. NC ** F NC ** F NO 0.757 14 B YES
& Uluaoa St [a] P.M. NC ** F NC ** F NO 0.725 5 A YES
11 Queen Kaahumanu Hwy (SR 19) A.M. 0.748 26 C 0.825 28 C YES No mitigation necessary YES
& Kealakehe Hwy P.M. 0.713 24 C 0.781 25 C YES YES
12 Ane Keohokalole Hwy A.M. NC ** F NC ** F NO 0.686 19 B YES
& Kealakehe Hwy [a] P.M. NC ** F NC ** F NO 0.583 15 B YES
Note:
*
** Indicates oversaturated conditions. Delay cannot be calculated.
NC = Not Calculated
[a] Intersection is controlled by stop signs on the minor approaches.
CONCEPT A
FUTURE CONDITIONS (2020)
TABLE 7
INTERSECTION LEVEL OF SERVICE ANALYSIS SUMMARY
KEAHUOLU AFFORDABLE HOUSING MASTER PLAN
Del/Veh* LOS
LOS D
OR
BETTERV/C Del/Veh* LOS
CUMULATIVE PLUS PROJECT
WITH MITIGATION (2020)
Delay indicates average stopped delay per vehicle in seconds for signalized intersections. The worst case vehicular delay is reported for stop-controlled intersections.
Peak
HourIntersections
CUMULATIVE BASE (2020)CUMULATIVE
PLUS PROJECT (2020)
LOSDel/Veh*V/C
LOS D
OR
BETTERV/C

1 Queen Kaahumanu Hwy (SR 19) A.M. 0.813 26 C 0.890 29 C YES No mitigation necessary YES
& Henry St P.M. 0.819 27 C 0.925 32 C YES YES
2 Queen Kaahumanu Hwy (SR 19) A.M. 0.873 33 C 0.917 35 D YES No mitigation necessary YES
& Palani Rd (SR 190)/Alii Dr P.M. 0.988 40 D 1.031 46 D YES YES
3 Kamakaeha Av A.M. NC 23 C NC 31 D YES 0.582 5 A YES
& Palani Rd (SR 190) P.M. NC ** F NC ** F NO 0.669 10 B YES
4 Henry St A.M. 1.099 81 F 1.691 ** F NO 0.899 37 D YES
& Palani Rd (SR 190) P.M. 1.248 ** F 1.328 ** F NO 1.009 41 D YES
5 Minor Site Access Road A.M. NC NC NC NC ** F NO - - A YES
& Palani Rd (SR 190) [a] P.M. NC NC NC NC ** F NO - - A YES
6 Queen Kaahumanu Hwy (SR 19) A.M. 0.653 22 C 0.666 22 C YES No mitigation necessary YES
& Makala Bl P.M. 0.769 25 C 0.799 25 C YES YES
7 Ane Keohokahole Hwy A.M. NC NC NC NC ** F NO 0.687 21 C YES
& Major Site Access Road P.M. NC NC NC NC ** F NO 0.679 19 B YES
8 Kealakaa St/Palihiolo St A.M. 1.522 ** F 1.647 ** F NO 0.984 34 C YES
& Palani Rd (SR 190) [b] P.M. 1.734 ** F 1.905 ** F NO 1.045 45 D YES
10 Palani Rd (SR 190) A.M. NC ** F NC ** F NO 0.759 14 B YES
& Uluaoa St [a] P.M. NC ** F NC ** F NO 0.746 5 A YES
11 Queen Kaahumanu Hwy (SR 19) A.M. 0.748 26 C 0.834 28 C YES No mitigation necessary YES
& Kealakehe Hwy P.M. 0.713 24 C 0.826 26 C YES YES
12 Ane Keohokalole Hwy A.M. NC ** F NC ** F NO 0.760 20 C YES
& Kealakehe Hwy [a] P.M. NC ** F NC ** F NO 0.634 16 B YES
Note:
*
** Indicates oversaturated conditions. Delay cannot be calculated.
NC = Not Calculated
[a] Intersection is controlled by stop signs on the minor approaches.
CONCEPT B
FUTURE CONDITIONS (2020)
TABLE 8
INTERSECTION LEVEL OF SERVICE ANALYSIS SUMMARY
KEAHUOLU AFFORDABLE HOUSING MASTER PLAN
Del/Veh* LOS
LOS D
OR
BETTERV/C Del/Veh* LOS
CUMULATIVE PLUS PROJECT
WITH MITIGATION (2020)
Delay indicates average stopped delay per vehicle in seconds for signalized intersections. The worst case vehicular delay is reported for stop-controlled intersections.
Peak
HourIntersections
CUMULATIVE BASE (2020)CUMULATIVE
PLUS PROJECT (2020)
LOSDel/Veh*V/C
LOS D
OR
BETTERV/C

1 Queen Kaahumanu Hwy (SR 19) A.M. 0.813 26 C 0.887 29 C YES No mitigation necessary YES
& Henry St P.M. 0.819 27 C 0.931 32 C YES YES
2 Queen Kaahumanu Hwy (SR 19) A.M. 0.873 33 C 0.915 35 D YES No mitigation necessary YES
& Palani Rd (SR 190)/Alii Dr P.M. 0.988 40 D 1.033 46 D YES YES
3 Kamakaeha Av A.M. NC 23 C NC 37 E NO 0.589 5 A YES
& Palani Rd (SR 190) P.M. NC ** F NC ** F NO 0.670 10 B YES
4 Henry St A.M. 1.099 81 F 1.726 ** F NO 0.923 39 D YES
& Palani Rd (SR 190) P.M. 1.248 ** F 1.326 ** F NO 1.014 42 D YES
5 Minor Site Access Road A.M. NC NC NC NC ** F NO - - A YES
& Palani Rd (SR 190) [a] P.M. NC NC NC NC ** F NO - - A YES
6 Queen Kaahumanu Hwy (SR 19) A.M. 0.653 22 C 0.668 22 C YES No mitigation necessary YES
& Makala Bl P.M. 0.769 25 C 0.801 25 C YES YES
7 Ane Keohokahole Hwy A.M. NC NC NC NC ** F NO 0.718 22 C YES
& Major Site Access Road P.M. NC NC NC NC ** F NO 0.706 19 B YES
8 Kealakaa St/Palihiolo St A.M. 1.522 ** F 1.644 ** F NO 0.983 33 C YES
& Palani Rd (SR 190) [b] P.M. 1.734 ** F 1.914 ** F NO 1.048 46 D YES
10 Palani Rd (SR 190) A.M. NC ** F NC ** F NO 0.758 14 B YES
& Uluaoa St [a] P.M. NC ** F NC ** F NO 0.749 5 A YES
11 Queen Kaahumanu Hwy (SR 19) A.M. 0.748 26 C 0.834 28 C YES No mitigation necessary YES
& Kealakehe Hwy P.M. 0.713 24 C 0.832 26 C YES YES
12 Ane Keohokalole Hwy A.M. NC ** F NC ** F NO 0.779 21 C YES
& Kealakehe Hwy [a] P.M. NC ** F NC ** F NO 0.640 16 B YES
Note:
*
** Indicates oversaturated conditions. Delay cannot be calculated.
NC = Not Calculated
[a] Intersection is controlled by stop signs on the minor approaches.
Delay indicates average stopped delay per vehicle in seconds for signalized intersections. The worst case vehicular delay is reported for stop-controlled intersections.
Peak
HourIntersections
CUMULATIVE BASE (2020)CUMULATIVE
PLUS PROJECT (2020)
LOSDel/Veh*V/C
LOS D
OR
BETTERV/C Del/Veh* LOS
LOS D
OR
BETTERV/C Del/Veh* LOS
CUMULATIVE PLUS PROJECT
WITH MITIGATION (2020)
CONCEPT C
FUTURE CONDITIONS (2020)
TABLE 9
INTERSECTION LEVEL OF SERVICE ANALYSIS SUMMARY
KEAHUOLU AFFORDABLE HOUSING MASTER PLAN

41
3. Kamakaeha Avenue & Palani Road (SR 190)
4. Henry Street & Palani Road (SR 190)
8. Palani Road (SR 190) & Kealakaa Street/Pahiliholo Street
10. Uluaoa Street & Palani Road (SR 190)
12. Kealakehe Parkway & Ane Keohokalole Highway
The remaining study intersections are expected to continue operating at a desirable LOS (LOS
D or better) during both peak hours.
CUMULATIVE PLUS PROJECT TRAFFIC CONDITIONS
The cumulative plus project Concept A, B, and C peak hour traffic volumes illustrated in Figures 8,
9 and 10 respectively were analyzed to determine 2020 operating conditions with the addition of
project-related traffic. The results of the cumulative plus project analysis are presented in Tables
7, 8 and 9. The proposed project would contribute to cumulative impacts (LOS E or F conditions)
during one or both peak hours at five study intersections:
3. Kamakaeha Avenue & Palani Road (SR 190)
4. Henry Street & Palani Road (SR 190)
8. Palani Road (SR 190) & Kealakaa Street/Pahiliholo Street
10. Uluaoa Street & Palani Road (SR 190)
12. Kealakehe Parkway & Ane Keohokalole Highway
In addition, project-specific impacts are identified at two future intersections listed below, as the
addition of project-generated traffic there would cause them to decline below LOS D in the peak
hours:
5. Palani Road (SR 190) & Minor Site Access Road
7. Ane Keohokalole Highway & Major Site Access Road
The number of traffic impacts would be the same under Concepts A, B and C; however, the
magnitude of those impacts would be greatest with Concept C.

42
PROPOSED MITIGATION MEASURES
The mitigation program for the project developed measures to increase the capacity and/or
efficiency of the roadway system at the locations where the addition of project-related traffic
would cause or contribute to projected poor operating conditions. The primary emphasis was to
identify physical and/or operational improvements that could be implemented within the existing
or planned roadway rights-of-way. The recommended intersection improvement measures are
illustrated in Appendix A. Tables 7, 8 and 9 summarize the projected LOS in 2020 at the
impacted locations with these mitigation measures in place.
The recommended mitigation measures to address the identified traffic impacts, both project-
related and cumulative, are described below. Each of the identified project-related impacts
would be fully mitigated (i.e., the recommended improvements would result in LOS D or better).
• Intersection 3: Kamakaeha Avenue & Palani Road (SR 190) - The intersection of Kamakaeha Avenue & Palani Road (SR 190) could be fully mitigated by installing a traffic signal with the existing lane configuration. Signal warrant analysis was conducted based on the Peak Hour Warrant found in Manual on Uniform Traffic Control Devices (MUTCD) (National Committee on Uniform Traffic Control Devices, 2003) and is included in Appendix E. It indicates that a traffic signal at the intersection of Kamakaeha Avenue and Palani Road (SR 190) would be warranted under future plus project conditions. Because this intersection is approximately 750 feet mauka of Queen Kaahumanu Highway and approximately 1,400 feet makai of Henry Street, the proposed traffic signal would need to be coordinated with the existing signals at the two adjacent intersections. With the installation of the traffic signal, the intersection of Kamakaeha Avenue and Palani Road (SR 190) would operate at LOS A.
• Intersection 4: Henry Street & Palani Road (SR 190) – The intersection of Henry Street & Palani Road (SR 190) could be fully mitigated by widening the makai-bound approach to provide two left-turn lanes, one through lane and one shared through/right-turn lane, widening the northbound approach to provide one left-turn lane, one through lane and one shared through/right-turn lane and constructing the southbound approach with one left-turn lane, one through lane and one shared through/right-turn lane. With this configuration, the intersection of Henry Street and Palani Road (SR 190) would operate at LOS D.
• Intersection 5: Palani Road (SR 190) & Minor Site Access Road – The future intersection
of Palani Road & Minor Site Access Road would be approximately 1,250 feet mauka of Henry Street and could be fully mitigated by adding a makai-bound deceleration lane into the project site and a makai-bound acceleration lane out from the project, separated by a raised island to channelize traffic. A second makai-bound lane would be added to receive traffic exiting the project site. With this configuration, the intersection would operate at LOS A.

43
• Intersection 7: Ane Keohokahole Highway & Major Site Access Road – The intersection of Ane Keohokahole Highway & Major Site Access Road could be fully mitigated by installing a traffic signal. The future lane configuration would provide one left-turn lane and one right-turn lane on the makai-bound approach, one through lane and one right-turn lane on the northbound approach and one left-turn lane and one through lane on the southbound approach. Signal warrant analysis was conducted based on the Peak Hour Warrant found in the MUTCD and is included in Appendix E. It indicates that a traffic signal installation at the intersection of Ane Keohokahole Highway & Major Site Access Road would be warranted under future plus project conditions. With the installation of a traffic signal, the intersection of Ane Keohokahole Highway & Major Site Access Road would operate at LOS C or better.
• Intersection 8: Kealakaa Street/Pahiliholo Street & Palani Road (SR 190) – The
intersection of Kealakaa Street/Pahiliholo Street & Palani Road (SR 190) is under construction and the future lane configuration is shown in Palani Road Safety Improvements (County of Hawaii, August 2005). With the lane configuration shown in that report, the intersection of Kealakaa Street/Pahiliholo Street and Palani Road is projected to operate at LOS F during both peak hours in 2020. A mitigation measure was developed that would widen Palani Road to provide one left-turn lane, one through lane and one shared through/right-turn lane on the southbound approach and two left-turn lanes and one shared through/right-turn lane on the northbound approach. The southbound departure would also be widened to two lanes, which would merge into a single lane downstream of the intersection. While additional right-of-way may be needed to implement this measure, it does not appear that existing development would preclude its implementation. With these improvements, the intersection is projected to operate at LOS C during the a.m. peak hour and LOS D during the p.m. peak hour.
• Intersection 10: Uluaoa Street & Palani Road (SR 190) – The intersection of Uluaoa
Street & Palani Road could be fully mitigated by installing a traffic signal within the existing lane configuration. Signal warrant analysis was conducted based on the Peak Hour Warrant found in the MUTCD is included in Appendix E. It indicates that a traffic signal at the intersection of would be warranted under future plus project conditions. With this improvement, the intersection would operate at LOS B and A during the a.m. and p.m. peak hours, respectively.
• Intersection 12: Kealakehe Parkway & Ane Keohokalole Highway – The intersection of Kealakehe Parkway & Ane Keohokalole Highway could be fully mitigated by installing a traffic signal within the existing lane configuration. Signal warrant analysis was conducted based on the Peak Hour Warrant found in the MUTCD and is included in Appendix E. It indicates that a traffic signal at the intersection of would be warranted under future plus project conditions. With this improvement, the intersection would operate at LOS C or better in both peak hours.

44
V. STREET SEGMENT TRAFFIC IMPACT ANALYSIS
This chapter presents an analysis of the proposed project’s potential impacts on several key
street segments in the project vicinity. The analysis was conducted for the following 10 street
segments, shown in Figure 2:
1. Henry Street south of Palani Road (SR 190)
2. Palani Road (SR 190) makai (west) of Henry Street
3. Palani Road (SR 190) mauka (east) of Henry Street
4. Kealakaa Street north of Palani Road (SR 190)
5. Uluaoa Street north of Palani Road (SR 190)
6. Queen Kaahumanu Highway (SR 19) south of Kealakehe Parkway
7. Kealakehe Parkway makai (west) of Ane Keohokalole Highway
8. Ane Keohokalole Highway south of Kealakehe Parkway
9. Queen Kaahumanu Highway (SR 19) north of Kealakehe Parkway
10. Palani Road (SR 190) south of Mamalahoa Highway
The existing peak hour volumes at each location were based on traffic counts conducted at
adjacent intersections in August 2007, as well as new 24-hour machine counts. The peak hour
traffic volumes on the 10 study street segments under existing conditions are shown in Tables
10, 11, and 12.
The roadway facility types were based on their physical characteristics as defined in the County
of Hawaii General Plan and described in Table 13. The capacity of each facility was defined as
the maximum hourly rate at which vehicles can reasonably be expected to traverse a point or
uniform section of a lane or roadway during a given time period under prevailing roadway, traffic,
and control conditions.
Estimates of future peak hour traffic volumes for the 10 street segments were developed by
increasing the existing peak hour traffic volumes to reflect the ambient growth and related
development projects on the street system in the study area (cumulative base conditions) and

Volumes V/C LOS Volumes V/C LOS Volumes V/C LOS
1. Henry Street south of Secondary Arterial NB 602 0.24 A 891 0.36 A 1,061 0.42 A YES
Palani Road (SR 190) SB 720 0.29 A 1,342 0.54 A 1,489 0.60 A YES
EB 646 0.26 A 845 0.34 A 992 0.40 A YES
WB 670 0.27 A 1,223 0.49 A 1,359 0.54 A YES
2. Palani Road (SR 190) makai (west) of Secondary Arterial EB 309 0.25 A 359 0.29 A 473 0.38 A YES
Henry Street WB 636 0.51 A 1,057 0.85 D 1,128 0.90 E NO
WB With Mitigation (Second Westbound Lane) 1,128 0.45 A YES
EB 617 0.49 A 639 0.51 A 737 0.59 A YES
WB 658 0.53 A 1,133 0.91 E 1,198 0.96 E NO
WB With Mitigation (Second Westbound Lane) 1,198 0.48 A YES
3. Palani Road (SR 190) mauka (east) of Secondary Arterial EB 716 0.57 A 802 0.64 B 857 0.69 B YES
Henry Street WB 1,215 0.97 E 1,815 1.45 F 1,911 1.53 F NO
WB With Mitigation (Second Westbound Lane) 1,911 0.76 C YES
EB 982 0.79 C 982 0.79 C 1,032 0.83 D YES
WB 949 0.76 C 1,817 1.45 F 1,898 1.52 F NO
WB With Mitigation (Second Westbound Lane) 1,898 0.76 C YES
4. Kealakaa Street north of Local Street (Existing) NB 520 0.87 D 1,034 0.86 D 1,034 0.86 D YES
Palani Road (SR 190) Secondary Arterial (Future) SB 403 0.67 B 949 0.79 C 981 0.82 D YES
NB 280 0.47 A 828 0.69 B 828 0.69 B YES
SB 305 0.51 A 876 0.73 C 903 0.75 C YES
5. Uluaoa Street makai (west) of Local Street EB 376 0.63 B 376 0.63 B 376 0.63 B YES
Palani Road (SR 190) WB 301 0.50 A 369 0.62 B 369 0.62 B YES
EB 113 0.19 A 113 0.19 A 113 0.19 A YES
WB 179 0.30 A 217 0.36 A 217 0.36 A YES
6. Queen Kaahumanu south of Primary Arterial NB 1,093 0.64 B 1,545 0.48 A 1,572 0.49 A YES
Highway (SR 19) Kealakehe Parkway 2 Lanes (Existing) SB 1,124 0.66 B 1,334 0.42 A 1,397 0.44 A YES
4 Lanes (Future) NB 1,013 0.60 A 1,273 0.40 A 1,298 0.41 A YES
SB 987 0.58 A 1,376 0.43 A 1,430 0.45 A YES
7. Kealakehe Parkway makai (west) of Secondary Arterial EB 424 0.34 A 707 0.57 A 802 0.64 B YES
Ane Keohokalole Highway WB 348 0.28 A 422 0.34 A 504 0.40 A YES
EB 221 0.18 A 418 0.33 A 499 0.40 A YES
WB 382 0.31 A 629 0.50 A 704 0.56 A YES
8. Ane Keohokalole south of Secondary Arterial NB 241 0.19 A 561 0.45 A 752 0.60 B YES
Highway Kealakehe Parkway SB 432 0.35 A 744 0.60 A 933 0.75 C YES
NB 203 0.16 A 511 0.41 A 687 0.55 A YES
SB 150 0.12 A 407 0.33 A 570 0.46 A YES
9. Queen Kaahumanu north of Primary Arterial NB 1,093 0.87 D 1,402 0.44 A 1,511 0.47 A YES
Highway (SR 19) Kealakehe Parkway 2 Lanes (Existing) SB 1,124 0.90 D 1,519 0.47 A 1,677 0.52 A YES
4 Lanes (Future) NB 1,013 0.81 D 1,215 0.38 A 1,315 0.41 A YES
SB 987 0.79 C 1,362 0.43 A 1,497 0.47 A YES
10. Palani Road (SR 190) south of Secondary Arterial NB 541 0.43 A 643 0.51 A 698 0.56 A YES
Mamalahoa Highway SB 938 0.75 C 1,117 0.89 D 1,180 0.94 E NO
SB With Mitigation (Second Southbound Lane) 1,180 0.47 A YES
NB 659 0.53 A 793 0.63 B 843 0.67 B YES
SB 929 0.74 C 1,136 0.91 E 1,190 0.95 E NO
SB With Mitigation (Second Southbound Lane) 1,190 0.48 A YES
Note: Roadway Capacity for each facility types were assumed in Table 8.
P.M.
Dir.
P.M.
LOS D
OR
BETTER
A.M.
P.M.
A.M.
A.M.
P.M.
P.M.
A.M.
A.M.
A.M.
TABLE 10
STREET SEGMENT IMPACT ANALYSIS - CONCEPT A
EXISTING (2006) CUMULATIVE BASE (2020)CUMULATIVE PLUS PROJECT
(2020)Segment Location Peak Hour
A.M.
Facility Type
P.M.
P.M.
A.M.
P.M.
A.M.
P.M.
A.M.
P.M.

Volumes V/C LOS Volumes V/C LOS Volumes V/C LOS
1. Henry Street south of Secondary Arterial NB 602 0.24 A 891 0.36 A 1,071 0.43 A YES
Palani Road (SR 190) SB 720 0.29 A 1,342 0.54 A 1,570 0.63 B YES
EB 646 0.26 A 845 0.34 A 1,093 0.44 A YES
WB 670 0.27 A 1,223 0.49 A 1,415 0.57 A YES
2. Palani Road (SR 190) makai (west) of Secondary Arterial EB 309 0.25 A 359 0.29 A 479 0.38 A YES
Henry Street WB 636 0.51 A 1,057 0.85 D 1,167 0.93 E NO
WB With Mitigation (Second Westbound Lane) 1,167 0.47 A YES
EB 617 0.49 A 639 0.51 A 804 0.64 B YES
WB 658 0.53 A 1,133 0.91 E 1,225 0.98 E NO
WB With Mitigation (Second Westbound Lane) 1,225 0.49 A YES
3. Palani Road (SR 190) mauka (east) of Secondary Arterial EB 716 0.57 A 802 0.64 B 887 0.71 C YES
Henry Street WB 1,215 0.97 E 1,815 1.45 F 1,915 1.53 F NO
WB With Mitigation (Second Westbound Lane) 1,915 0.77 C YES
EB 982 0.79 C 982 0.79 C 1,053 0.84 D YES
WB 949 0.76 C 1,817 1.45 F 1,955 1.56 F NO
WB With Mitigation (Second Westbound Lane) 1,955 0.78 C YES
4. Kealakaa Street north of Local Street (Existing) NB 520 0.87 D 1,034 0.86 D 1,034 0.86 D YES
Palani Road (SR 190) Secondary Arterial (Future) SB 403 0.67 B 949 0.79 C 982 0.82 D YES
NB 280 0.47 A 828 0.69 B 828 0.69 B YES
SB 305 0.51 A 876 0.73 C 922 0.77 C YES
5. Uluaoa Street makai (west) of Local Street EB 376 0.63 B 376 0.63 B 376 0.63 B YES
Palani Road (SR 190) WB 301 0.50 A 369 0.62 B 369 0.62 B YES
EB 113 0.19 A 113 0.19 A 113 0.19 A YES
WB 179 0.30 A 217 0.36 A 217 0.36 A YES
6. Queen Kaahumanu south of Primary Arterial NB 1,093 0.64 B 1,545 0.48 A 1,587 0.50 A YES
Highway (SR 19) Kealakehe Parkway 2 Lanes (Existing) SB 1,124 0.66 B 1,334 0.42 A 1,401 0.44 A YES
4 Lanes (Future) NB 1,013 0.60 A 1,273 0.40 A 1,309 0.41 A YES
SB 987 0.58 A 1,376 0.43 A 1,468 0.46 A YES
7. Kealakehe Parkway makai (west) of Secondary Arterial EB 424 0.34 A 707 0.57 A 807 0.65 B YES
Ane Keohokalole Highway WB 348 0.28 A 422 0.34 A 549 0.44 A YES
EB 221 0.18 A 418 0.33 A 556 0.44 A YES
WB 382 0.31 A 629 0.50 A 736 0.59 A YES
8. Ane Keohokalole south of Secondary Arterial NB 241 0.19 A 561 0.45 A 857 0.69 B YES
Highway Kealakehe Parkway SB 432 0.35 A 744 0.60 A 944 0.76 C YES
NB 203 0.16 A 511 0.41 A 760 0.61 B YES
SB 150 0.12 A 407 0.33 A 683 0.55 A YES
9. Queen Kaahumanu north of Primary Arterial NB 1,093 0.87 D 1,402 0.44 A 1,571 0.49 A YES
Highway (SR 19) Kealakehe Parkway 2 Lanes (Existing) SB 1,124 0.90 D 1,519 0.47 A 1,686 0.53 A YES
4 Lanes (Future) NB 1,013 0.81 D 1,215 0.38 A 1,358 0.42 A YES
SB 987 0.79 C 1,362 0.43 A 1,592 0.50 A YES
10. Palani Road (SR 190) south of Secondary Arterial NB 541 0.43 A 643 0.51 A 728 0.58 A YES
Mamalahoa Highway SB 938 0.75 C 1,117 0.89 D 1,184 0.95 E NO
SB With Mitigation (Second Southbound Lane) 1,184 0.47 A YES
NB 659 0.53 A 793 0.63 B 864 0.69 B YES
SB 929 0.74 C 1,136 0.91 E 1,228 0.98 E NO
SB With Mitigation (Second Southbound Lane) 1,228 0.49 A YES
Note: Roadway Capacity for each facility types were assumed in Table 8.
LOS D
OR
BETTER
A.M.
P.M.
A.M.
A.M.
P.M.
Dir.
P.M.
A.M.
P.M.
A.M.
A.M.
TABLE 11
STREET SEGMENT IMPACT ANALYSIS - CONCEPT B
EXISTING (2006) CUMULATIVE BASE (2020)CUMULATIVE PLUS PROJECT
(2020)Segment Location Peak HourFacility Type
P.M.
A.M.
P.M.
P.M.
A.M.
P.M.
A.M.
P.M.
A.M.
P.M.

Volumes V/C LOS Volumes V/C LOS Volumes V/C LOS
1. Henry Street south of Secondary Arterial NB 602 0.24 A 891 0.36 A 1,065 0.43 A YES
Palani Road (SR 190) SB 720 0.29 A 1,342 0.54 A 1,594 0.64 B YES
EB 646 0.26 A 845 0.34 A 1,108 0.44 A YES
WB 670 0.27 A 1,223 0.49 A 1,418 0.57 A YES
2. Palani Road (SR 190) makai (west) of Secondary Arterial EB 309 0.25 A 359 0.29 A 475 0.38 A YES
Henry Street WB 636 0.51 A 1,057 0.42 A 1,178 0.94 E NO
WB With Mitigation (Second Westbound Lane) 1,178 0.47 A YES
EB 617 0.49 A 639 0.51 A 814 0.65 B YES
WB 658 0.53 A 1,133 0.45 A 1,227 0.98 E NO
WB With Mitigation (Second Westbound Lane) 1,227 0.49 A YES
3. Palani Road (SR 190) mauka (east) of Secondary Arterial EB 716 0.57 A 802 0.64 B 895 0.72 C YES
Henry Street WB 1,215 0.97 E 1,815 0.73 C 1,912 1.53 F NO
WB With Mitigation (Second Westbound Lane) 1,912 0.76 C YES
EB 982 0.79 C 982 0.79 C 1,054 0.84 D YES
WB 949 0.76 C 1,817 0.73 C 1,963 1.57 F NO
WB With Mitigation (Second Westbound Lane) 1,963 0.79 C YES
4. Kealakaa Street north of Local Street (Existing) NB 520 0.87 D 1,034 0.83 D 1,034 0.83 D YES
Palani Road (SR 190) Secondary Arterial (Future) SB 403 0.67 B 949 0.76 C 981 0.78 C YES
NB 280 0.47 A 828 0.66 B 828 0.66 B YES
SB 305 0.51 A 876 0.70 C 925 0.74 C YES
5. Uluaoa Street makai (west) of Local Street EB 376 0.63 B 376 0.63 B 376 0.63 B YES
Palani Road (SR 190) WB 301 0.50 A 369 0.62 B 369 0.62 B YES
EB 113 0.19 A 113 0.19 A 113 0.19 A YES
WB 179 0.30 A 217 0.36 A 217 0.36 A YES
6. Queen Kaahumanu south of Primary Arterial NB 1,093 0.64 B 1,545 0.48 A 1,592 0.50 A YES
Highway (SR 19) Kealakehe Parkway 2 Lanes (Existing) SB 1,124 0.66 B 1,334 0.42 A 1,399 0.44 A YES
4 Lanes (Future) NB 1,013 0.60 A 1,273 0.40 A 1,309 0.41 A YES
SB 987 0.58 A 1,376 0.43 A 1,473 0.46 A YES
7. Kealakehe Parkway makai (west) of Secondary Arterial EB 424 0.34 A 707 0.57 A 804 0.64 B YES
Ane Keohokalole Highway WB 348 0.28 A 422 0.34 A 562 0.45 A YES
EB 221 0.18 A 418 0.33 A 564 0.45 A YES
WB 382 0.31 A 629 0.50 A 737 0.59 A YES
8. Ane Keohokalole south of Secondary Arterial NB 241 0.19 A 561 0.45 A 888 0.71 C YES
Highway Kealakehe Parkway SB 432 0.35 A 744 0.60 A 938 0.75 C YES
NB 203 0.16 A 511 0.41 A 763 0.61 B YES
SB 150 0.12 A 407 0.33 A 699 0.56 A YES
9. Queen Kaahumanu north of Primary Arterial NB 1,093 0.87 D 1,402 0.44 A 1,589 0.50 A YES
Highway (SR 19) Kealakehe Parkway 2 Lanes (Existing) SB 1,124 0.90 D 1,519 0.47 A 1,681 0.53 A YES
4 Lanes (Future) NB 1,013 0.81 D 1,215 0.38 A 1,359 0.42 A YES
SB 987 0.79 C 1,362 0.43 A 1,605 0.50 A YES
10. Palani Road (SR 190) south of Secondary Arterial NB 541 0.43 A 643 0.51 A 736 0.59 A YES
Mamalahoa Highway SB 938 0.75 C 1,117 0.89 D 1,182 0.95 E NO
SB With Mitigation (Second Southbound Lane) 1,182 0.47 A YES
NB 659 0.53 A 793 0.63 B 865 0.69 B YES
SB 929 0.74 C 1,136 0.91 E 1,233 0.99 E NO
SB With Mitigation (Second Southbound Lane) 1,233 0.49 A YES
Note: Roadway Capacity for each facility types were assumed in Table 8.
LOS D
OR
BETTER
A.M.
A.M.
P.M.
Dir.
P.M.
A.M.
P.M.
A.M.
TABLE 12
STREET SEGMENT IMPACT ANALYSIS - CONCEPT C
EXISTING (2006) CUMULATIVE BASE (2020)CUMULATIVE PLUS PROJECT
(2020)Segment Location Peak HourFacility Type
P.M.
A.M.
P.M.
A.M.
P.M.
A.M.
P.M.
A.M.
P.M.
A.M.
P.M.
A.M.
P.M.

TABLE 13
CAPACITY OF FACILITIES
1,700
1,250
800
600
450
*Source: County of Hawaii General Plan Appendix A (County of Hawaii, February 2005)
** Capacity is based on HCM 2000 methodology.
A street of considerable continuity that is primarily a traffic artery between or through
large areas; interconncect with and augment primary system. Designed as a limited
access roadwa. Secondary arterials shall have a minium right-of-way of 80 feet.
Any street supplementary to the arterial street system that is a means of transit between
this system and smaller areas; used to some extent for through traffic and to access
abutting properties; collect and distribute traffic between nieghborhood and arterial
system. Major coleectors shall have a minimum right-of-way of 60 feet.
Minor collectors are used at times as through streets and for access to abutting
properties. The principal purpose of a local street is to provide access to property
abutting the public right-of-way.
Local streets within commercial and industrial areas shall have a minimum right-of-way
of 60 feet.
Capacity
per lane per hour**Definition*Facility Type*
Includes major highways, parkways, and primary arterials that move vehicles in large
volumes and at higher speeds from one geographic area to another; highest traffic
volumes corridor. Designed as a limited access roadway. Primary arterials shall have a
minimum right-of-way of 120 feet.
Primary Arterial
Secondary Arterial
Major Collector
Local Streets -
Commercial/Industrial
Minor Collector & Local
Street

49
then assigning the new project-generated trips using the same geographic distribution pattern
described in Chapter III. The existing and forecast peak hour street segment traffic volumes are
presented in Tables 10, 11 and 12 for Concepts A, B, and C, respectively.
As shown, three of the analyzed directional street segments are projected to operate at LOS E
or F under cumulative base conditions, and the project would contribute to cumulative impacts
at these three locations:
2. Palani Road (SR 190) makai (west) of Henry Street in the makai-bound direction
3. Palani Road (SR 190) mauka (east) of Henry Street in the makai-bound direction
10. Palani Road (SR 190) south of Mamalahoa Highway in the southbound direction
The number of traffic impacts would be the same under Concepts A, B and C; however, the
magnitude of those impacts would be greatest with Concept C. The mitigation measures
described in Chapter IV for study intersections #3 and #4 (Henry Street & Palani Road and
Minor Site Access Road & Palani Road) would also fully mitigate the identified impacts at street
segments #2 and #3 by constructing an additional makai-bound lane on Palani Road.
The southbound segment of street segment #10 (Palani Road south of Mamalahoa Highway) is
projected to operate at LOS E during both a.m. and p.m. peak hours in the future. As mitigation
to address this cumulative impact, to which the project would contribute, the southbound
roadway could be widened to provide two lanes. This improvement could be coordinated with
and would complement the proposed widening of southbound Palani Road immediately north of
this location (between Hina Lani Street and Mamalahoa Highway) identified in Final
Environmental Impact Statement for the Kula Nei Project (Belt Collins Hawaii Ltd., September
2007). This widening could be extended to Hao Kuni Street, a distance of approximately 2,000
feet, where the two lanes would merge into the single existing southbound lane. While
additional right-of-way may be needed to implement this measure, it does not appear that
existing development would necessarily preclude its implementation, although it is noted that
there are three private driveways on the makai side of Palani Road on this segment. With this
improvement, the segment of Palani Road south of Mamalahoa Highway would be fully
mitigated.

50
VI. SUMMARY AND CONCLUSIONS
This study was undertaken to analyze potential traffic impacts of the proposed Keahuolu
Affordable Housing Master Plan project in North Kona on the island of Hawaii. The following
summarizes the key findings of the study:
• The proposed project would be completed by 2020 and has three alternative development scenarios, varying in the amount of new housing that would be constructed. Each of the alternatives would be focused on a mixed-use town center and would include 197,000 square feet of commercial/retail space, 25 acres of neighborhood parks, a seven-acre archeological preserve, and a 12-acre site reserved for a school. In addition, Concept A would provide 1,020 dwelling units, Concept B would provide 1,840 dwelling units, and Concept C would provide 2,330 dwelling units.
• Peak hour capacity analyses were conducted for 10 existing and two future intersections
in the vicinity of the project site. Seven of 10 existing intersections currently operate at LOS D or better during the weekday peak hours.
• Street segment analysis was conducted for 10 street segments. Nine of 10 segments
currently operate at LOS D or better during the weekday peak hours.
• Concept A is expected to generate approximately 9,953 weekday daily trips, including 1,178 trips during the weekday morning peak hour, and 1,046 trips during the weekday afternoon peak hour. Concept B is expected to generate approximately 16,034 weekday daily trips, including 1,511 trips during the weekday morning peak hour, and 1,629 trips during the weekday afternoon peak hour. Concept C is expected to generate approximately 17,617 weekday daily trips, including 1,580 trips during the weekday morning peak hour, and 1,695 trips during the weekday afternoon peak hour.
• Analysis of projected year 2020 cumulative base conditions, representing future
conditions without the proposed project, indicates that five of the analyzed intersections would operate at LOS E or F during the a.m. peak hour, the p.m. peak hour, or both.
• Analysis of projected year 2020 cumulative base plus project conditions indicates that
seven of the analyzed intersections would operate at LOS E or F during one or both peak hours. The project would result in two project-specific traffic impacts and would contribute to five cumulative traffic impacts. The number of traffic impacts would be the same under Concepts A, B and C; however, the magnitude of those impacts would be greatest with Concept C.
• Mitigation strategies were developed to address the identified deficiencies at the seven
study intersections with projected poor levels of service (LOS E or F). Each of the

51
identified cumulative and project-related impacts could be fully mitigated with the recommended improvements.
• Future increases in peak hour traffic volumes were evaluated for 10 street segments.
Street segment analysis of projected year 2020 cumulative base plus project conditions indicates that seven of those street segments could adequately accommodate the projected increase in volumes during the peak hours. The mitigation measures proposed to address at two study intersections would also fully mitigate the identified impacts on two of the three impacted street segments. An additional mitigation measure was developed to mitigate the third location. With these improvements, the identified cumulative street segment impacts, to which the project would contribute, would be fully mitigated.

REFERENCES
2000 Highway Capacity Manual, Transportation Research Board, 2000. County of Hawaii General Plan, County of Hawaii, February 2005. Final Environmental Impact Statement for the Kula Nei Project, Belt Collins Hawaii Ltd., September 2007. Keahuolu Affordable Housing Master Plan, Kailua-Kona, Hawaii, Belt Collins Hawaii Ltd., June 2007. Keahole to Honaunau Regional Circulation Plan, County of Hawaii Planning Department, August 2006. Manual on Uniform Traffic Control Devices, National Committee on Uniform Traffic Control Devices, 2003. Trip Generation, 7th Edition, Institute of Transportation Engineers, 2003. Trip Generation Handbook, 2nd Edition, Institute of Transportation Engineers, 2004.

APPENDIX A
INTERSECTION LANE CONFIGURATIONS


APPENDIX B
INTERSECTION AND DAILY TRAFFIC COUNTS

WILTEC Phone: (626) 564-1944 Fax: (626) 564-0969
24-HOUR ADT COUNT SUMMARY
CLIENT: FEHR AND PEERS / KAKU ASSOCAITES
PROJECT: BIG ISLAND OF HAWAII TRAFFIC COUNTS
LOCATION: HENRY STREET SOUTH OF PALANI ROAD
DATE: TUESDAY, AUGUST 21, 2007
DIRECTION: NB DIRECTION: SB
TIME 00-15 15-30 30-45 45-60 HOUR TIME 00-15 15-30 30-45 45-60 HOUR
TOTALS TOTALS
0:00 20 12 9 3 44 0:00 7 3 6 7 23
1:00 5 1 5 5 16 1:00 4 3 3 5 15
2:00 4 3 3 2 12 2:00 5 3 2 3 13
3:00 1 3 5 4 13 3:00 7 4 4 3 18
4:00 5 8 2 10 25 4:00 7 5 17 18 47
5:00 14 14 19 25 72 5:00 21 22 41 45 129
6:00 54 82 104 110 350 6:00 67 92 108 120 387
7:00 166 160 158 118 602 7:00 198 172 174 176 720
8:00 100 116 114 99 429 8:00 170 202 138 134 644
9:00 74 98 68 107 347 9:00 109 112 123 118 462
10:00 114 100 113 106 433 10:00 114 129 114 126 483
11:00 104 110 94 98 406 11:00 113 110 112 119 454
12:00 97 102 114 113 426 12:00 124 124 114 136 498
13:00 106 118 103 116 443 13:00 107 126 107 134 474
14:00 158 154 132 118 562 14:00 126 160 196 199 681
15:00 112 144 170 159 585 15:00 176 169 167 176 688
16:00 156 148 150 134 588 16:00 155 174 176 182 687
17:00 174 188 136 126 624 17:00 142 170 124 126 562
18:00 138 113 102 104 457 18:00 130 99 107 87 423
19:00 91 98 108 94 391 19:00 82 71 73 61 287
20:00 71 71 81 64 287 20:00 63 51 60 45 219
21:00 71 74 59 64 268 21:00 48 52 49 36 185
22:00 62 62 44 23 191 22:00 37 26 28 23 114
23:00 33 17 21 17 88 23:00 18 13 15 12 58
TOTAL 7659 TOTAL 8271
AM PEAK HOUR 0700-0800 AM PEAK HOUR 0730-0830
VOLUME 602 VOLUME 722
PM PEAK HOUR 1630-1730 PM PEAK HOUR 1430-1530
VOLUME 646 VOLUME 740
TOTAL BI-DIRECTIONAL VOLUME 15930

WILTEC Phone: (626) 564-1944 Fax: (626) 564-0969
24-HOUR ADT COUNT SUMMARY
CLIENT: FEHR AND PEERS / KAKU ASSOCAITES
PROJECT: BIG ISLAND OF HAWAII TRAFFIC COUNTS
LOCATION: PALANI ROAD MAKAI (WEST) OF HENRY STREET
DATE: THURSDAY, AUGUST 23, 2007
DIRECTION: EB DIRECTION: WB
TIME 00-15 15-30 30-45 45-60 HOUR TIME 00-15 15-30 30-45 45-60 HOUR
TOTALS TOTALS
0:00 14 16 12 9 51 0:00 2 3 6 5 16
1:00 6 11 2 5 24 1:00 3 4 4 3 14
2:00 18 6 1 3 28 2:00 1 4 5 4 14
3:00 3 4 2 2 11 3:00 3 6 3 7 19
4:00 2 2 3 6 13 4:00 4 10 13 21 48
5:00 6 7 9 10 32 5:00 24 40 43 56 163
6:00 20 30 54 50 154 6:00 92 113 138 136 479
7:00 44 57 68 76 245 7:00 139 145 152 162 598
8:00 64 85 84 100 333 8:00 189 135 150 134 608
9:00 94 70 78 92 334 9:00 108 104 116 112 440
10:00 88 72 90 84 334 10:00 102 133 94 131 460
11:00 116 104 110 114 444 11:00 108 122 117 123 470
12:00 108 116 108 120 452 12:00 137 122 104 116 479
13:00 108 96 108 118 430 13:00 102 116 110 112 440
14:00 126 97 120 102 445 14:00 134 175 162 174 645
15:00 128 119 128 146 521 15:00 166 145 152 182 645
16:00 150 153 168 142 613 16:00 180 164 132 166 642
17:00 150 162 154 126 592 17:00 180 150 142 111 583
18:00 120 146 108 129 503 18:00 108 78 79 96 361
19:00 117 108 88 90 403 19:00 78 71 49 60 258
20:00 82 82 66 79 309 20:00 44 37 38 45 164
21:00 88 72 62 48 270 21:00 35 38 37 25 135
22:00 64 35 32 22 153 22:00 22 12 8 8 50
23:00 24 9 26 21 80 23:00 12 5 3 3 23
TOTAL 6774 TOTAL 7754
AM PEAK HOUR 1100-1200 AM PEAK HOUR 0715-0815
VOLUME 444 VOLUME 648
PM PEAK HOUR 1630-1730 PM PEAK HOUR 1530-1630
VOLUME 622 VOLUME 678
TOTAL BI-DIRECTIONAL VOLUME 14528

WILTEC Phone: (626) 564-1944 Fax: (626) 564-0969
24-HOUR ADT COUNT SUMMARY
CLIENT: FEHR AND PEERS / KAKU ASSOCAITES
PROJECT: BIG ISLAND OF HAWAII TRAFFIC COUNTS
LOCATION: PALANI ROAD MAUKA (EAST) OF HENRY STREET
DATE: TUESDAY, AUGUST 21, 2007
DIRECTION: EB DIRECTION: WB
TIME 00-15 15-30 30-45 45-60 HOUR TIME 00-15 15-30 30-45 45-60 HOUR
TOTALS TOTALS
0:00 33 28 24 14 99 0:00 11 6 5 13 35
1:00 12 4 8 12 36 1:00 5 5 5 3 18
2:00 10 6 5 4 25 2:00 4 8 2 5 19
3:00 1 4 13 5 23 3:00 10 5 2 9 26
4:00 5 9 4 11 29 4:00 16 17 28 30 91
5:00 19 16 25 32 92 5:00 44 44 82 107 277
6:00 62 72 114 130 378 6:00 121 170 195 212 698
7:00 126 161 212 161 660 7:00 297 280 309 310 1196
8:00 137 174 138 144 593 8:00 326 294 198 214 1032
9:00 116 134 95 140 485 9:00 184 172 160 172 688
10:00 130 122 131 126 509 10:00 164 160 142 170 636
11:00 132 150 146 145 573 11:00 144 144 146 140 574
12:00 136 153 160 142 591 12:00 144 153 146 170 613
13:00 143 138 160 186 627 13:00 150 156 144 162 612
14:00 201 236 178 176 791 14:00 174 242 264 278 958
15:00 180 228 224 238 870 15:00 238 230 250 244 962
16:00 252 242 214 250 958 16:00 244 268 234 240 986
17:00 256 212 226 230 924 17:00 242 216 170 169 797
18:00 210 232 194 173 809 18:00 182 149 144 137 612
19:00 165 174 162 153 654 19:00 118 89 92 98 397
20:00 134 108 143 113 498 20:00 85 70 88 69 312
21:00 112 123 102 92 429 21:00 42 66 52 40 200
22:00 94 83 66 48 291 22:00 50 34 28 26 138
23:00 53 30 32 33 148 23:00 23 21 15 10 69
TOTAL 11092 TOTAL 11946
AM PEAK HOUR 0730-0830 AM PEAK HOUR 0730-0830
VOLUME 684 VOLUME 1239
PM PEAK HOUR 1615-1715 PM PEAK HOUR 1415-1515
VOLUME 962 VOLUME 1022
TOTAL BI-DIRECTIONAL VOLUME 23038

WILTEC Phone: (626) 564-1944 Fax: (626) 564-0969
24-HOUR ADT COUNT SUMMARY
CLIENT: FEHR AND PEERS / KAKU ASSOCAITES
PROJECT: BIG ISLAND OF HAWAII TRAFFIC COUNTS
LOCATION: PALANI ROAD MAUKA (EAST) OF HENRY STREET
DATE: WEDNESDAY, AUGUST 22, 2007
DIRECTION: EB DIRECTION: WB
TIME 00-15 15-30 30-45 45-60 HOUR TIME 00-15 15-30 30-45 45-60 HOUR
TOTALS TOTALS
0:00 26 24 19 17 86 0:00 8 6 9 13 36
1:00 13 11 8 10 42 1:00 4 5 4 5 18
2:00 10 13 6 7 36 2:00 4 9 6 7 26
3:00 4 5 8 6 23 3:00 10 5 6 12 33
4:00 8 9 6 11 34 4:00 14 15 33 34 96
5:00 20 15 24 35 94 5:00 40 51 87 103 281
6:00 73 76 123 142 414 6:00 133 165 186 232 716
7:00 137 178 227 169 711 7:00 280 276 292 316 1164
8:00 142 116 113 146 517 8:00 332 292 206 180 1010
9:00 134 117 132 112 495 9:00 210 186 178 175 749
10:00 126 114 150 124 514 10:00 148 162 156 162 628
11:00 151 128 130 136 545 11:00 155 186 140 138 619
12:00 140 174 146 144 604 12:00 159 162 160 160 641
13:00 146 172 146 190 654 13:00 176 185 192 162 715
14:00 190 210 194 192 786 14:00 165 238 281 270 954
15:00 188 222 223 238 871 15:00 249 236 258 273 1016
16:00 220 213 240 259 932 16:00 242 253 240 276 1011
17:00 274 289 226 202 991 17:00 183 190 186 160 719
18:00 210 220 167 150 747 18:00 153 131 122 112 518
19:00 139 180 157 126 602 19:00 94 106 121 141 462
20:00 117 118 118 121 474 20:00 105 82 71 69 327
21:00 136 108 107 91 442 21:00 77 58 42 52 229
22:00 100 71 49 37 257 22:00 43 25 23 24 115
23:00 54 52 29 32 167 23:00 24 20 10 14 68
TOTAL 11038 TOTAL 12151
AM PEAK HOUR 0715-0815 AM PEAK HOUR 0730-0830
VOLUME 716 VOLUME 1232
PM PEAK HOUR 1630-1730 PM PEAK HOUR 1415-1515
VOLUME 1062 VOLUME 1038
TOTAL BI-DIRECTIONAL VOLUME 23189

WILTEC Phone: (626) 564-1944 Fax: (626) 564-0969
24-HOUR ADT COUNT SUMMARY
CLIENT: FEHR AND PEERS / KAKU ASSOCAITES
PROJECT: BIG ISLAND OF HAWAII TRAFFIC COUNTS
LOCATION: PALANI ROAD MAUKA (EAST) OF HENRY STREET
DATE: THURSDAY, AUGUST 23, 2007
DIRECTION: EB DIRECTION: WB
TIME 00-15 15-30 30-45 45-60 HOUR TIME 00-15 15-30 30-45 45-60 HOUR
TOTALS TOTALS
0:00 18 19 14 20 71 0:00 4 5 13 12 34
1:00 14 18 7 7 46 1:00 2 4 3 6 15
2:00 10 20 7 10 47 2:00 3 9 9 8 29
3:00 6 6 3 8 23 3:00 10 4 10 15 39
4:00 11 8 7 11 37 4:00 12 12 38 38 100
5:00 20 13 22 38 93 5:00 35 58 92 99 284
6:00 83 81 132 155 451 6:00 145 160 176 252 733
7:00 148 196 242 177 763 7:00 263 272 274 321 1130
8:00 146 167 149 122 584 8:00 338 290 212 216 1056
9:00 132 126 116 128 502 9:00 186 178 162 166 692
10:00 127 128 127 151 533 10:00 128 156 150 160 594
11:00 137 116 143 134 530 11:00 163 184 152 149 648
12:00 148 152 180 194 674 12:00 154 166 154 174 648
13:00 162 144 169 174 649 13:00 207 246 185 201 839
14:00 219 224 184 184 811 14:00 182 202 274 244 902
15:00 225 224 238 236 923 15:00 233 254 259 243 989
16:00 228 227 256 265 976 16:00 261 237 258 213 969
17:00 251 226 216 210 903 17:00 203 178 165 168 714
18:00 226 181 162 152 721 18:00 140 133 125 106 504
19:00 177 160 140 126 603 19:00 98 107 120 95 420
20:00 113 131 117 124 485 20:00 76 80 69 60 285
21:00 116 105 92 97 410 21:00 62 47 46 47 202
22:00 77 58 43 54 232 22:00 30 26 25 24 105
23:00 41 31 33 32 137 23:00 21 13 12 14 60
TOTAL 11204 TOTAL 11991
AM PEAK HOUR 0700-0800 AM PEAK HOUR 0730-0830
VOLUME 763 VOLUME 1223
PM PEAK HOUR 1615-1715 PM PEAK HOUR 1515-1615
VOLUME 999 VOLUME 1017
TOTAL BI-DIRECTIONAL VOLUME 23195

WILTEC Phone: (626) 564-1944 Fax: (626) 564-0969
24-HOUR ADT COUNT SUMMARY
CLIENT: FEHR AND PEERS / KAKU ASSOCAITES
PROJECT: BIG ISLAND OF HAWAII TRAFFIC COUNTS
LOCATION: KEALAKAA STREET MAKAI (WEST) OF PALANI ROAD
DATE: TUESDAY, AUGUST 21, 2007
DIRECTION: EB DIRECTION: WB
TIME 00-15 15-30 30-45 45-60 HOUR TIME 00-15 15-30 30-45 45-60 HOUR
TOTALS TOTALS
0:00 2 2 0 2 6 0:00 12 10 7 10 39
1:00 2 2 1 0 5 1:00 5 0 3 1 9
2:00 2 3 1 2 8 2:00 5 2 2 0 9
3:00 0 3 4 3 10 3:00 3 4 12 5 24
4:00 1 10 9 6 26 4:00 1 4 3 4 12
5:00 13 10 24 28 75 5:00 2 7 8 14 31
6:00 31 38 38 64 171 6:00 24 26 28 60 138
7:00 100 105 158 136 499 7:00 88 92 134 107 421
8:00 121 91 48 44 304 8:00 70 50 34 45 199
9:00 42 40 42 48 172 9:00 28 25 17 29 99
10:00 35 32 24 29 120 10:00 36 21 23 28 108
11:00 34 40 32 36 142 11:00 28 26 34 36 124
12:00 18 30 28 45 121 12:00 24 46 36 38 144
13:00 34 26 42 40 142 13:00 30 39 60 94 223
14:00 92 126 123 98 439 14:00 86 83 83 58 310
15:00 69 92 79 100 340 15:00 54 60 60 58 232
16:00 48 67 78 72 265 16:00 60 72 61 61 254
17:00 74 80 62 64 280 17:00 75 78 74 78 305
18:00 44 55 42 48 189 18:00 73 51 49 56 229
19:00 34 38 32 23 127 19:00 42 50 48 47 187
20:00 42 30 20 22 114 20:00 40 40 42 38 160
21:00 11 16 20 12 59 21:00 25 30 36 37 128
22:00 23 8 10 8 49 22:00 26 30 28 13 97
23:00 4 6 3 6 19 23:00 20 12 11 15 58
TOTAL 3682 TOTAL 3540
AM PEAK HOUR 0715-0815 AM PEAK HOUR 0700-0800
VOLUME 520 VOLUME 421
PM PEAK HOUR 1400-1500 PM PEAK HOUR 1345-1445
VOLUME 439 VOLUME 346
TOTAL BI-DIRECTIONAL VOLUME 7222

WILTEC Phone: (626) 564-1944 Fax: (626) 564-0969
24-HOUR ADT COUNT SUMMARY
CLIENT: FEHR AND PEERS / KAKU ASSOCAITES
PROJECT: BIG ISLAND OF HAWAII TRAFFIC COUNTS
LOCATION: ULUAOA STREET MAKAI (WEST) OF PALANI ROAD
DATE: TUESDAY, AUGUST 21, 2007
DIRECTION: EB DIRECTION: WB
TIME 00-15 15-30 30-45 45-60 HOUR TIME 00-15 15-30 30-45 45-60 HOUR
TOTALS TOTALS
0:00 5 2 0 2 9 0:00 2 2 1 2 7
1:00 0 1 1 2 4 1:00 3 0 5 2 10
2:00 1 1 3 2 7 2:00 0 1 1 0 2
3:00 2 1 2 4 9 3:00 0 0 0 0 0
4:00 1 7 10 5 23 4:00 0 1 0 0 1
5:00 12 12 26 19 69 5:00 3 0 8 4 15
6:00 31 27 38 51 147 6:00 13 13 4 13 43
7:00 43 50 72 108 273 7:00 24 56 92 109 281
8:00 104 92 31 24 251 8:00 54 46 28 14 142
9:00 16 17 10 14 57 9:00 6 12 8 12 38
10:00 9 8 15 16 48 10:00 18 11 11 6 46
11:00 12 8 24 20 64 11:00 9 15 15 11 50
12:00 10 12 20 18 60 12:00 18 18 20 13 69
13:00 28 14 18 28 88 13:00 8 21 26 29 84
14:00 42 108 86 50 286 14:00 59 68 42 46 215
15:00 34 38 30 29 131 15:00 32 44 24 36 136
16:00 34 33 26 37 130 16:00 37 38 36 42 153
17:00 25 25 26 19 95 17:00 43 54 40 36 173
18:00 16 12 18 22 68 18:00 28 26 18 14 86
19:00 20 24 29 50 123 19:00 13 22 15 14 64
20:00 23 18 13 8 62 20:00 14 5 1 12 32
21:00 12 14 12 9 47 21:00 16 8 8 5 37
22:00 12 6 7 6 31 22:00 10 7 5 9 31
23:00 3 3 0 3 9 23:00 2 5 1 3 11
TOTAL 2091 TOTAL 1726
AM PEAK HOUR 0730-0830 AM PEAK HOUR 0715-0815
VOLUME 376 VOLUME 311
PM PEAK HOUR 1400-1500 PM PEAK HOUR 1400-1500
VOLUME 286 VOLUME 215
TOTAL BI-DIRECTIONAL VOLUME 3817

WILTEC Phone: (626) 564-1944 Fax: (626) 564-0969
24-HOUR ADT COUNT SUMMARY
CLIENT: FEHR AND PEERS / KAKU ASSOCAITES
PROJECT: BIG ISLAND OF HAWAII TRAFFIC COUNTS
LOCATION: QUEEN KAAHUMANU HIGHWAY SOUTH OF KEALAKEHE PARKWAY
DATE: TUESDAY, AUGUST 21, 2007
DIRECTION: NB DIRECTION: SB
TIME 00-15 15-30 30-45 45-60 HOUR TIME 00-15 15-30 30-45 45-60 HOUR
TOTALS TOTALS
0:00 16 14 14 13 57 0:00 18 17 9 11 55
1:00 8 6 0 5 19 1:00 8 7 1 6 22
2:00 6 7 6 14 33 2:00 0 4 4 3 11
3:00 13 14 17 22 66 3:00 6 2 4 12 24
4:00 18 32 47 66 163 4:00 6 20 12 23 61
5:00 88 144 193 207 632 5:00 20 28 26 71 145
6:00 246 220 232 224 922 6:00 84 120 151 147 502
7:00 248 278 268 256 1050 7:00 192 252 265 272 981
8:00 278 270 258 250 1056 8:00 264 273 306 270 1113
9:00 268 256 264 240 1028 9:00 251 240 270 256 1017
10:00 282 241 268 271 1062 10:00 246 268 268 242 1024
11:00 283 250 264 248 1045 11:00 275 283 282 228 1068
12:00 277 261 282 261 1081 12:00 260 268 290 247 1065
13:00 248 274 258 296 1076 13:00 256 268 250 254 1028
14:00 226 246 268 253 993 14:00 264 283 255 256 1058
15:00 278 255 266 228 1027 15:00 258 244 244 226 972
16:00 240 270 236 267 1013 16:00 246 248 239 247 980
17:00 248 235 236 198 917 17:00 242 212 250 220 924
18:00 176 186 174 182 718 18:00 228 221 163 194 806
19:00 146 138 125 158 567 19:00 213 156 163 148 680
20:00 82 92 107 82 363 20:00 123 137 112 106 478
21:00 98 101 80 46 325 21:00 102 94 82 78 356
22:00 48 52 28 32 160 22:00 80 50 65 58 253
23:00 28 23 15 12 78 23:00 58 32 32 20 142
TOTAL 15451 TOTAL 14765
AM PEAK HOUR 0715-0815 AM PEAK HOUR 0745-0845
VOLUME 1080 VOLUME 1115
PM PEAK HOUR 1200-1300 PM PEAK HOUR 1200-1300
VOLUME 1081 VOLUME 1065
TOTAL BI-DIRECTIONAL VOLUME 30216
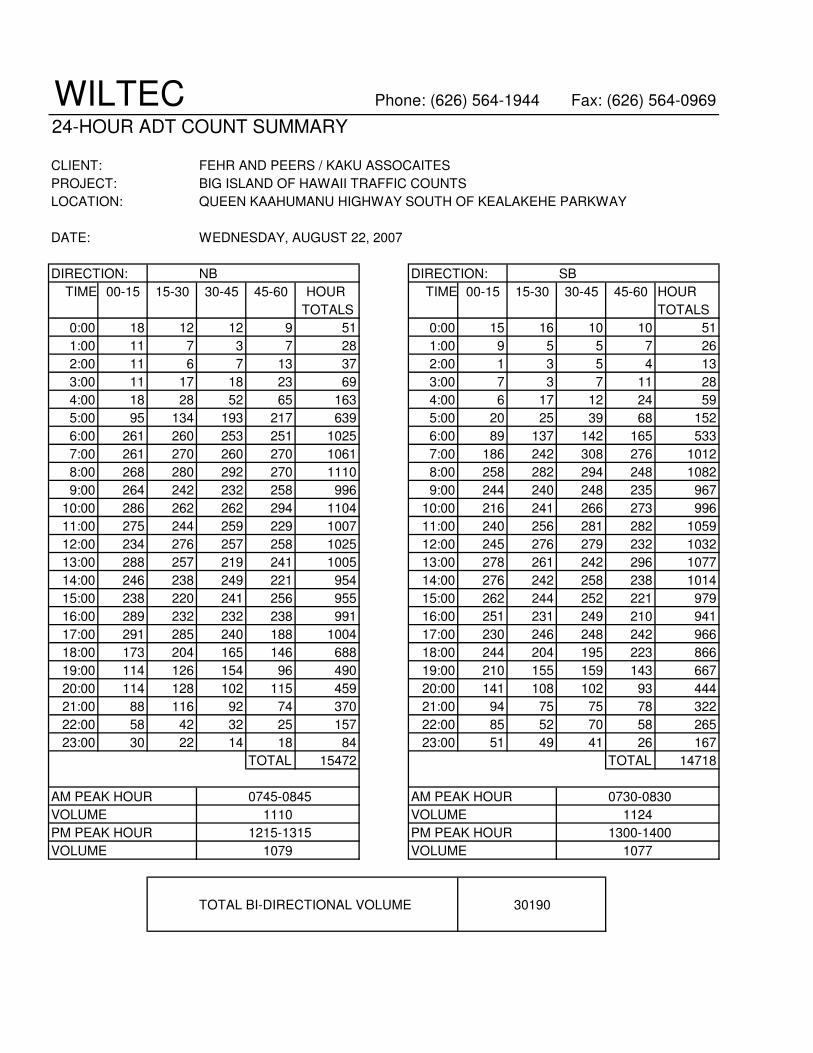
WILTEC Phone: (626) 564-1944 Fax: (626) 564-0969
24-HOUR ADT COUNT SUMMARY
CLIENT: FEHR AND PEERS / KAKU ASSOCAITES
PROJECT: BIG ISLAND OF HAWAII TRAFFIC COUNTS
LOCATION: QUEEN KAAHUMANU HIGHWAY SOUTH OF KEALAKEHE PARKWAY
DATE: WEDNESDAY, AUGUST 22, 2007
DIRECTION: NB DIRECTION: SB
TIME 00-15 15-30 30-45 45-60 HOUR TIME 00-15 15-30 30-45 45-60 HOUR
TOTALS TOTALS
0:00 18 12 12 9 51 0:00 15 16 10 10 51
1:00 11 7 3 7 28 1:00 9 5 5 7 26
2:00 11 6 7 13 37 2:00 1 3 5 4 13
3:00 11 17 18 23 69 3:00 7 3 7 11 28
4:00 18 28 52 65 163 4:00 6 17 12 24 59
5:00 95 134 193 217 639 5:00 20 25 39 68 152
6:00 261 260 253 251 1025 6:00 89 137 142 165 533
7:00 261 270 260 270 1061 7:00 186 242 308 276 1012
8:00 268 280 292 270 1110 8:00 258 282 294 248 1082
9:00 264 242 232 258 996 9:00 244 240 248 235 967
10:00 286 262 262 294 1104 10:00 216 241 266 273 996
11:00 275 244 259 229 1007 11:00 240 256 281 282 1059
12:00 234 276 257 258 1025 12:00 245 276 279 232 1032
13:00 288 257 219 241 1005 13:00 278 261 242 296 1077
14:00 246 238 249 221 954 14:00 276 242 258 238 1014
15:00 238 220 241 256 955 15:00 262 244 252 221 979
16:00 289 232 232 238 991 16:00 251 231 249 210 941
17:00 291 285 240 188 1004 17:00 230 246 248 242 966
18:00 173 204 165 146 688 18:00 244 204 195 223 866
19:00 114 126 154 96 490 19:00 210 155 159 143 667
20:00 114 128 102 115 459 20:00 141 108 102 93 444
21:00 88 116 92 74 370 21:00 94 75 75 78 322
22:00 58 42 32 25 157 22:00 85 52 70 58 265
23:00 30 22 14 18 84 23:00 51 49 41 26 167
TOTAL 15472 TOTAL 14718
AM PEAK HOUR 0745-0845 AM PEAK HOUR 0730-0830
VOLUME 1110 VOLUME 1124
PM PEAK HOUR 1215-1315 PM PEAK HOUR 1300-1400
VOLUME 1079 VOLUME 1077
TOTAL BI-DIRECTIONAL VOLUME 30190

WILTEC Phone: (626) 564-1944 Fax: (626) 564-0969
24-HOUR ADT COUNT SUMMARY
CLIENT: FEHR AND PEERS / KAKU ASSOCAITES
PROJECT: BIG ISLAND OF HAWAII TRAFFIC COUNTS
LOCATION: QUEEN KAAHUMANU HIGHWAY SOUTH OF KEALAKEHE PARKWAY
DATE: THURSDAY, AUGUST 23, 2007
DIRECTION: NB DIRECTION: SB
TIME 00-15 15-30 30-45 45-60 HOUR TIME 00-15 15-30 30-45 45-60 HOUR
TOTALS TOTALS
0:00 20 9 9 4 42 0:00 12 14 11 8 45
1:00 14 8 5 8 35 1:00 9 2 8 8 27
2:00 15 5 8 12 40 2:00 2 1 5 5 13
3:00 9 20 18 24 71 3:00 7 4 9 9 29
4:00 17 24 56 64 161 4:00 6 13 12 24 55
5:00 102 123 192 226 643 5:00 20 22 51 65 158
6:00 275 300 274 278 1127 6:00 94 154 132 182 562
7:00 274 274 266 268 1082 7:00 180 235 266 290 971
8:00 280 280 278 284 1122 8:00 264 301 292 268 1125
9:00 276 257 251 258 1042 9:00 258 256 258 270 1042
10:00 272 246 273 285 1076 10:00 262 252 231 275 1020
11:00 230 264 288 284 1066 11:00 235 230 244 230 939
12:00 286 272 236 252 1046 12:00 252 228 270 272 1022
13:00 268 238 276 275 1057 13:00 218 228 190 210 846
14:00 232 272 258 271 1033 14:00 228 210 208 217 863
15:00 271 255 266 266 1058 15:00 252 254 229 276 1011
16:00 239 232 260 240 971 16:00 278 260 246 254 1038
17:00 258 268 224 194 944 17:00 251 240 230 212 933
18:00 173 194 172 169 708 18:00 216 158 262 228 864
19:00 138 171 163 127 599 19:00 208 172 156 146 682
20:00 98 110 105 99 412 20:00 132 123 107 100 462
21:00 93 109 86 60 348 21:00 98 85 79 78 340
22:00 53 47 30 29 159 22:00 83 51 68 58 260
23:00 29 23 15 15 82 23:00 55 41 37 23 156
TOTAL 15924 TOTAL 14463
AM PEAK HOUR 0600-0700 AM PEAK HOUR 0745-0845
VOLUME 1127 VOLUME 1147
PM PEAK HOUR 1415-1515 PM PEAK HOUR 1545-1645
VOLUME 1072 VOLUME 1060
TOTAL BI-DIRECTIONAL VOLUME 30387

WILTEC Phone: (626) 564-1944 Fax: (626) 564-0969
24-HOUR ADT COUNT SUMMARY
CLIENT: FEHR AND PEERS / KAKU ASSOCAITES
PROJECT: BIG ISLAND OF HAWAII TRAFFIC COUNTS
LOCATION: KEALAKEHE PARKWAY MAKEI (WEST) OF ANE KEOHOKALOLE HIGHWAY
DATE: THURSDAY, AUGUST 23, 2007
DIRECTION: EB DIRECTION: WB
TIME 00-15 15-30 30-45 45-60 HOUR TIME 00-15 15-30 30-45 45-60 HOUR
TOTALS TOTALS
0:00 4 1 3 0 8 0:00 0 0 1 0 1
1:00 0 1 3 3 7 1:00 0 0 1 1 2
2:00 1 1 0 2 4 2:00 0 1 1 2 4
3:00 1 1 0 0 2 3:00 2 0 4 3 9
4:00 2 0 2 1 5 4:00 2 6 4 6 18
5:00 2 4 3 10 19 5:00 6 13 20 20 59
6:00 11 16 10 26 63 6:00 20 25 30 38 113
7:00 32 50 62 78 222 7:00 38 71 69 70 248
8:00 120 115 111 49 395 8:00 94 96 88 43 321
9:00 14 16 16 17 63 9:00 24 19 22 20 85
10:00 14 18 18 15 65 10:00 12 14 24 14 64
11:00 16 14 24 26 80 11:00 20 18 11 48 97
12:00 24 10 16 17 67 12:00 67 19 20 11 117
13:00 21 23 17 14 75 13:00 16 34 28 29 107
14:00 30 31 45 70 176 14:00 17 14 23 35 89
15:00 79 52 44 46 221 15:00 182 94 52 54 382
16:00 34 30 52 43 159 16:00 46 34 30 24 134
17:00 40 36 38 32 146 17:00 26 50 25 22 123
18:00 30 32 36 28 126 18:00 26 37 77 46 186
19:00 22 20 10 10 62 19:00 23 5 20 14 62
20:00 20 11 30 12 73 20:00 11 18 16 23 68
21:00 8 12 13 10 43 21:00 32 8 18 10 68
22:00 10 7 6 4 27 22:00 12 3 3 4 22
23:00 10 7 1 3 21 23:00 6 1 6 4 17
TOTAL 2129 TOTAL 2396
AM PEAK HOUR 0745-0845 AM PEAK HOUR 0745-0845
VOLUME 424 VOLUME 348
PM PEAK HOUR 1430-1530 PM PEAK HOUR 1500-1600
VOLUME 246 VOLUME 382
TOTAL BI-DIRECTIONAL VOLUME 4525

WILTEC Phone: (626) 564-1944 Fax: (626) 564-0969
24-HOUR ADT COUNT SUMMARY
CLIENT: FEHR AND PEERS / KAKU ASSOCAITES
PROJECT: BIG ISLAND OF HAWAII TRAFFIC COUNTS
LOCATION: ANE KEOHOKALOLE HIGHWAY SOUTH OF KEALAKEHE PARKWAY
DATE: THURSDAY, AUGUST 23, 2007
DIRECTION: NB DIRECTION: SB
TIME 00-15 15-30 30-45 45-60 HOUR TIME 00-15 15-30 30-45 45-60 HOUR
TOTALS TOTALS
0:00 0 0 0 0 0 0:00 0 0 1 0 1
1:00 0 0 0 0 0 1:00 0 0 0 0 0
2:00 0 0 0 1 1 2:00 1 0 0 0 1
3:00 0 0 0 0 0 3:00 0 0 0 0 0
4:00 0 0 0 2 2 4:00 0 0 0 0 0
5:00 1 1 1 0 3 5:00 0 2 1 4 7
6:00 2 5 5 7 19 6:00 10 10 7 15 42
7:00 15 16 36 42 109 7:00 22 48 60 78 208
8:00 67 68 64 34 233 8:00 122 116 116 52 406
9:00 10 8 8 5 31 9:00 10 6 8 4 28
10:00 6 3 5 4 18 10:00 7 4 4 3 18
11:00 9 10 2 29 50 11:00 6 5 9 14 34
12:00 46 11 6 6 69 12:00 17 4 7 7 35
13:00 17 14 12 13 56 13:00 12 14 10 4 40
14:00 5 5 16 22 48 14:00 10 16 26 56 108
15:00 88 54 27 34 203 15:00 66 40 27 17 150
16:00 31 15 17 11 74 16:00 12 12 19 16 59
17:00 19 35 13 10 77 17:00 15 16 20 21 72
18:00 12 22 61 23 118 18:00 18 16 18 10 62
19:00 9 0 5 4 18 19:00 3 1 0 2 6
20:00 4 10 7 20 41 20:00 4 4 7 3 18
21:00 26 2 14 7 49 21:00 4 2 1 1 8
22:00 4 0 0 1 5 22:00 2 0 0 1 3
23:00 1 0 0 0 1 23:00 1 0 0 0 1
TOTAL 1225 TOTAL 1307
AM PEAK HOUR 0745-0845 AM PEAK HOUR 0745-0845
VOLUME 241 VOLUME 432
PM PEAK HOUR 1500-1600 PM PEAK HOUR 1445-1545
VOLUME 203 VOLUME 189
TOTAL BI-DIRECTIONAL VOLUME 2532

WILTEC Phone: (626) 564-1944 Fax: (626) 564-0969
24-HOUR ADT COUNT SUMMARY
CLIENT: FEHR AND PEERS / KAKU ASSOCAITES
PROJECT: BIG ISLAND OF HAWAII TRAFFIC COUNTS
LOCATION: QUEEN KAAHUMANU HIGHWAY NORTH OF KEALAKEHE PARKWAY
DATE: THURSDAY, AUGUST 23, 2007
DIRECTION: NB DIRECTION: SB
TIME 00-15 15-30 30-45 45-60 HOUR TIME 00-15 15-30 30-45 45-60 HOUR
TOTALS TOTALS
0:00 14 5 10 4 33 0:00 12 14 11 7 44
1:00 9 9 5 4 27 1:00 6 3 8 7 24
2:00 13 6 8 7 34 2:00 4 1 12 4 21
3:00 7 15 18 24 64 3:00 2 0 8 2 12
4:00 14 26 46 65 151 4:00 12 12 23 20 67
5:00 96 111 159 203 569 5:00 24 28 53 96 201
6:00 214 294 262 250 1020 6:00 134 158 158 182 632
7:00 253 236 242 210 941 7:00 203 252 272 270 997
8:00 215 202 245 241 903 8:00 298 308 302 237 1145
9:00 242 236 234 244 956 9:00 232 238 227 275 972
10:00 236 244 258 271 1009 10:00 260 227 242 248 977
11:00 229 230 228 236 923 11:00 246 209 276 256 987
12:00 252 260 224 226 962 12:00 215 224 240 262 941
13:00 242 208 230 266 946 13:00 236 215 167 204 822
14:00 199 254 224 216 893 14:00 208 235 214 209 866
15:00 252 296 258 281 1087 15:00 228 236 204 275 943
16:00 254 236 246 252 988 16:00 223 222 260 237 942
17:00 264 260 224 188 936 17:00 212 229 208 178 827
18:00 180 180 188 185 733 18:00 180 128 258 170 736
19:00 152 170 159 151 632 19:00 176 142 128 130 576
20:00 84 88 90 90 352 20:00 117 114 116 102 449
21:00 104 102 77 48 331 21:00 76 83 61 62 282
22:00 44 54 18 29 145 22:00 77 42 63 56 238
23:00 20 22 14 14 70 23:00 60 24 23 17 124
TOTAL 14705 TOTAL 13825
AM PEAK HOUR 0615-0715 AM PEAK HOUR 0745-0845
VOLUME 1059 VOLUME 1178
PM PEAK HOUR 1515-1615 PM PEAK HOUR 1545-1645
VOLUME 1089 VOLUME 980
TOTAL BI-DIRECTIONAL VOLUME 28530

WILTEC Phone: (626) 564-1944 Fax: (626) 564-0969
24-HOUR ADT COUNT SUMMARY
CLIENT: FEHR AND PEERS / KAKU ASSOCAITES
PROJECT: BIG ISLAND OF HAWAII TRAFFIC COUNTS
LOCATION: PALANI ROAD SOUTH OF MAMALAHOA HIGHWAY
DATE: TUESDAY, AUGUST 21, 2007
DIRECTION: NB DIRECTION: SB
TIME 00-15 15-30 30-45 45-60 HOUR TIME 00-15 15-30 30-45 45-60 HOUR
TOTALS TOTALS
0:00 15 11 15 6 47 0:00 10 3 7 12 32
1:00 6 3 5 12 26 1:00 2 4 7 0 13
2:00 4 4 5 3 16 2:00 2 7 4 6 19
3:00 2 1 4 8 15 3:00 5 2 2 9 18
4:00 6 9 21 16 52 4:00 9 9 14 11 43
5:00 32 20 32 43 127 5:00 22 31 52 76 181
6:00 82 87 124 137 430 6:00 85 96 159 184 524
7:00 103 120 124 114 461 7:00 224 250 256 208 938
8:00 170 133 125 113 541 8:00 146 162 138 150 596
9:00 114 108 77 107 406 9:00 147 130 109 116 502
10:00 100 99 98 106 403 10:00 133 106 129 121 489
11:00 84 100 110 111 405 11:00 105 135 98 106 444
12:00 90 94 109 96 389 12:00 124 116 140 121 501
13:00 112 92 78 102 384 13:00 132 137 120 148 537
14:00 109 154 166 182 611 14:00 168 178 183 188 717
15:00 128 124 167 150 569 15:00 188 206 238 238 870
16:00 186 156 158 136 636 16:00 228 225 225 236 914
17:00 142 147 138 171 598 17:00 174 202 138 152 666
18:00 170 132 148 118 568 18:00 128 122 106 91 447
19:00 115 101 115 88 419 19:00 80 61 66 65 272
20:00 93 84 83 80 340 20:00 44 52 50 40 186
21:00 78 87 63 48 276 21:00 51 38 29 36 154
22:00 60 56 32 34 182 22:00 25 24 29 22 100
23:00 34 13 17 15 79 23:00 22 12 14 17 65
TOTAL 7980 TOTAL 9228
AM PEAK HOUR 0745-0845 AM PEAK HOUR 0700-0800
VOLUME 542 VOLUME 938
PM PEAK HOUR 1530-1630 PM PEAK HOUR 1530-1630
VOLUME 659 VOLUME 929
TOTAL BI-DIRECTIONAL VOLUME 17208

WILTEC Phone: (626) 564-1944 Fax: (626) 564-0969
INTERSECTION TURNING MOVEMENT COUNT SUMMARY
CLIENT: FEHR AND PEERS / KAKU ASSOCIATES
PROJECT: KONA TRAFFIC COUNTS
DATE: WEDNESDAY AUGUST 22, 2007
PERIOD: 6:00 AM TO 9:00 AM
INTERSECTION: N/S QUEEN KAAHUMANU HIGHWAY
E/W HIINA LANI STREET
15 MIN COUNTS
1 2 3 4 5 6 7 8 9 10 11 12
PERIOD SBRT SBTH SBLT WBRT WBTH WBLT NBRT NBTH NBLT EBRT EBTH EBLT TOTAL
600-615 0 66 34 55 0 30 35 151 0 0 0 0 371
615-630 0 87 33 78 0 52 36 190 0 0 0 0 476
630-645 0 106 40 73 0 41 44 177 0 0 0 0 481
645-700 0 92 39 54 0 43 48 135 0 0 0 0 411
700-715 0 155 44 82 0 44 58 156 0 0 0 0 539
715-730 0 135 65 92 0 61 61 184 0 0 0 0 598
730-745 0 165 62 68 0 52 67 180 0 0 0 0 594
745-800 0 168 74 45 0 67 92 156 0 0 0 0 602
800-815 0 154 43 70 0 93 78 135 0 0 0 0 573
815-830 0 156 64 58 0 77 53 140 0 0 0 0 548
830-845 0 181 69 82 0 93 77 146 0 0 0 0 648
845-900 0 85 36 48 0 68 60 108 0 0 0 0 405
HOUR TOTALS
1 2 3 4 5 6 7 8 9 10 11 12
TIME SBRT SBTH SBLT WBRT WBTH WBLT NBRT NBTH NBLT EBRT EBTH EBLT TOTAL
600-700 0 351 146 260 0 166 163 653 0 0 0 0 1739
615-715 0 440 156 287 0 180 186 658 0 0 0 0 1907
630-730 0 488 188 301 0 189 211 652 0 0 0 0 2029
645-745 0 547 210 296 0 200 234 655 0 0 0 0 2142
700-800 0 623 245 287 0 224 278 676 0 0 0 0 2333
715-815 0 622 244 275 0 273 298 655 0 0 0 0 2367
730-830 0 643 243 241 0 289 290 611 0 0 0 0 2317
745-845 0 659 250 255 0 330 300 577 0 0 0 0 2371
800-900 0 576 212 258 0 331 268 529 0 0 0 0 2174
A.M. PEAK HOUR
745-845 255
0 659 250 0
330
0
HIINA LANI STREET 0 0 577 300
0
QUEEN KAAHUMANU HIGHWAY

APPENDIX C
INTERSECTION LEVEL OF SERVICE WORKSHEETS

EXISTING CONDITIONS

Existing AM Tue Nov 6, 2007 11:05:11 Page 3-1 -------------------------------------------------------------------------------- Palani Affordable Housing Existing Conditions AM Peak Hour -------------------------------------------------------------------------------- Level Of Service Computation Report 2000 HCM Operations Method (Base Volume Alternative) ********************************************************************************Intersection #1 Queen Kaahumanu Hwy / Henry St ********************************************************************************Cycle (sec): 100 Critical Vol./Cap.(X): 0.634Loss Time (sec): 10 (Y+R=4.0 sec) Average Delay (sec/veh): 23.4Optimal Cycle: 47 Level Of Service: C********************************************************************************Street Name: Queen Kaahumanu Hwy Henry St Approach: North Bound South Bound East Bound West Bound Movement: L - T - R L - T - R L - T - R L - T - R ------------|---------------||---------------||---------------||---------------|Control: Prot+Permit Prot+Permit Prot+Permit Prot+Permit Rights: Ovl Ovl Ovl Ovl Min. Green: 0 0 0 0 0 0 0 0 0 0 0 0 Lanes: 1 0 1 0 1 1 0 2 0 1 1 0 2 0 1 1 1 1 0 1 ------------|---------------||---------------||---------------||---------------|Volume Module:Base Vol: 187 534 459 98 384 100 61 275 25 359 330 62 Growth Adj: 1.00 1.00 1.00 1.00 1.00 1.00 1.00 1.00 1.00 1.00 1.00 1.00 Initial Bse: 187 534 459 98 384 100 61 275 25 359 330 62 User Adj: 1.00 1.00 1.00 1.00 1.00 1.00 1.00 1.00 1.00 1.00 1.00 1.00 PHF Adj: 0.95 0.95 0.95 0.95 0.95 0.95 0.95 0.95 0.95 0.95 0.95 0.95 PHF Volume: 197 562 483 103 404 105 64 289 26 378 347 65 Reduct Vol: 0 0 0 0 0 0 0 0 0 0 0 0 Reduced Vol: 197 562 483 103 404 105 64 289 26 378 347 65 PCE Adj: 1.00 1.00 1.00 1.00 1.00 1.00 1.00 1.00 1.00 1.00 1.00 1.00 MLF Adj: 1.00 1.00 1.00 1.00 1.00 1.00 1.00 1.00 1.00 1.00 1.00 1.00 FinalVolume: 197 562 483 103 404 105 64 289 26 378 347 65 ------------|---------------||---------------||---------------||---------------|Saturation Flow Module:Sat/Lane: 1900 1900 1900 1900 1900 1900 1900 1900 1900 1900 1900 1900 Adjustment: 0.95 1.00 0.85 0.95 0.95 0.85 0.95 0.95 0.85 0.93 0.93 0.85 Lanes: 1.00 1.00 1.00 1.00 2.00 1.00 1.00 2.00 1.00 1.56 1.44 1.00 Final Sat.: 1805 1900 1615 1805 3610 1615 1805 3610 1615 2751 2529 1615 ------------|---------------||---------------||---------------||---------------|Capacity Analysis Module:Vol/Sat: 0.11 0.30 0.30 0.06 0.11 0.07 0.04 0.08 0.02 0.14 0.14 0.04 Crit Moves: **** **** **** **** Green/Cycle: 0.58 0.47 0.68 0.37 0.28 0.35 0.20 0.13 0.40 0.36 0.27 0.36 Volume/Cap: 0.28 0.63 0.44 0.29 0.40 0.18 0.25 0.63 0.04 0.48 0.50 0.11 Delay/Veh: 10.5 21.7 7.4 21.5 29.3 22.6 33.9 44.4 18.2 23.8 31.0 21.2 User DelAdj: 1.00 1.00 1.00 1.00 1.00 1.00 1.00 1.00 1.00 1.00 1.00 1.00 AdjDel/Veh: 10.5 21.7 7.4 21.5 29.3 22.6 33.9 44.4 18.2 23.8 31.0 21.2 LOS by Move: B C A C C C C D B C C C HCM2kAvgQ: 3 13 7 2 5 2 2 6 0 6 7 1 ********************************************************************************Note: Queue reported is the number of cars per lane.********************************************************************************

********************************************************************************
Existing AM Tue Nov 6, 2007 11:05:11 Page 4-1 -------------------------------------------------------------------------------- Palani Affordable Housing Existing Conditions AM Peak Hour -------------------------------------------------------------------------------- Level Of Service Computation Report 2000 HCM Operations Method (Base Volume Alternative) ********************************************************************************Intersection #2 Queen Kaahumanu Hwy / Alli Dr ********************************************************************************Cycle (sec): 100 Critical Vol./Cap.(X): 0.777Loss Time (sec): 10 (Y+R=4.0 sec) Average Delay (sec/veh): 25.8Optimal Cycle: 66 Level Of Service: C********************************************************************************Street Name: Queen Kaahumanu Hwy Alli Dr Approach: North Bound South Bound East Bound West Bound Movement: L - T - R L - T - R L - T - R L - T - R ------------|---------------||---------------||---------------||---------------|Control: Prot+Permit Prot+Permit Prot+Permit Prot+Permit Rights: Ovl Ovl Ovl Ovl Min. Green: 0 0 0 0 0 0 0 0 0 0 0 0 Lanes: 1 0 1 0 1 1 0 1 0 1 1 0 1 0 1 1 0 1 0 1 ------------|---------------||---------------||---------------||---------------|Volume Module:Base Vol: 71 593 15 87 453 257 193 144 99 18 374 29 Growth Adj: 1.00 1.00 1.00 1.00 1.00 1.00 1.00 1.00 1.00 1.00 1.00 1.00 Initial Bse: 71 593 15 87 453 257 193 144 99 18 374 29 User Adj: 1.00 1.00 1.00 1.00 1.00 1.00 1.00 1.00 1.00 1.00 1.00 1.00 PHF Adj: 0.95 0.95 0.95 0.95 0.95 0.95 0.95 0.95 0.95 0.95 0.95 0.95 PHF Volume: 75 624 16 92 477 271 203 152 104 19 394 31 Reduct Vol: 0 0 0 0 0 0 0 0 0 0 0 0 Reduced Vol: 75 624 16 92 477 271 203 152 104 19 394 31 PCE Adj: 1.00 1.00 1.00 1.00 1.00 1.00 1.00 1.00 1.00 1.00 1.00 1.00 MLF Adj: 1.00 1.00 1.00 1.00 1.00 1.00 1.00 1.00 1.00 1.00 1.00 1.00 FinalVolume: 75 624 16 92 477 271 203 152 104 19 394 31 ------------|---------------||---------------||---------------||---------------|Saturation Flow Module:Sat/Lane: 1900 1900 1900 1900 1900 1900 1900 1900 1900 1900 1900 1900 Adjustment: 0.95 1.00 0.85 0.95 1.00 0.85 0.95 1.00 0.85 0.95 1.00 0.85 Lanes: 1.00 1.00 1.00 1.00 1.00 1.00 1.00 1.00 1.00 1.00 1.00 1.00 Final Sat.: 1805 1900 1615 1805 1900 1615 1805 1900 1615 1805 1900 1615 ------------|---------------||---------------||---------------||---------------|Capacity Analysis Module:Vol/Sat: 0.04 0.33 0.01 0.05 0.25 0.17 0.11 0.08 0.06 0.01 0.21 0.02 Crit Moves: **** **** **** **** Green/Cycle: 0.51 0.42 0.47 0.48 0.42 0.56 0.43 0.36 0.43 0.31 0.27 0.33 Volume/Cap: 0.22 0.78 0.02 0.39 0.60 0.30 0.59 0.22 0.15 0.05 0.78 0.06 Delay/Veh: 15.1 29.6 14.1 19.4 23.8 11.6 23.1 22.2 17.3 23.8 41.4 22.8 User DelAdj: 1.00 1.00 1.00 1.00 1.00 1.00 1.00 1.00 1.00 1.00 1.00 1.00 AdjDel/Veh: 15.1 29.6 14.1 19.4 23.8 11.6 23.1 22.2 17.3 23.8 41.4 22.8 LOS by Move: B C B B C B C C B C D C HCM2kAvgQ: 1 18 0 2 12 4 6 3 2 0 13 1 ********************************************************************************Note: Queue reported is the number of cars per lane.
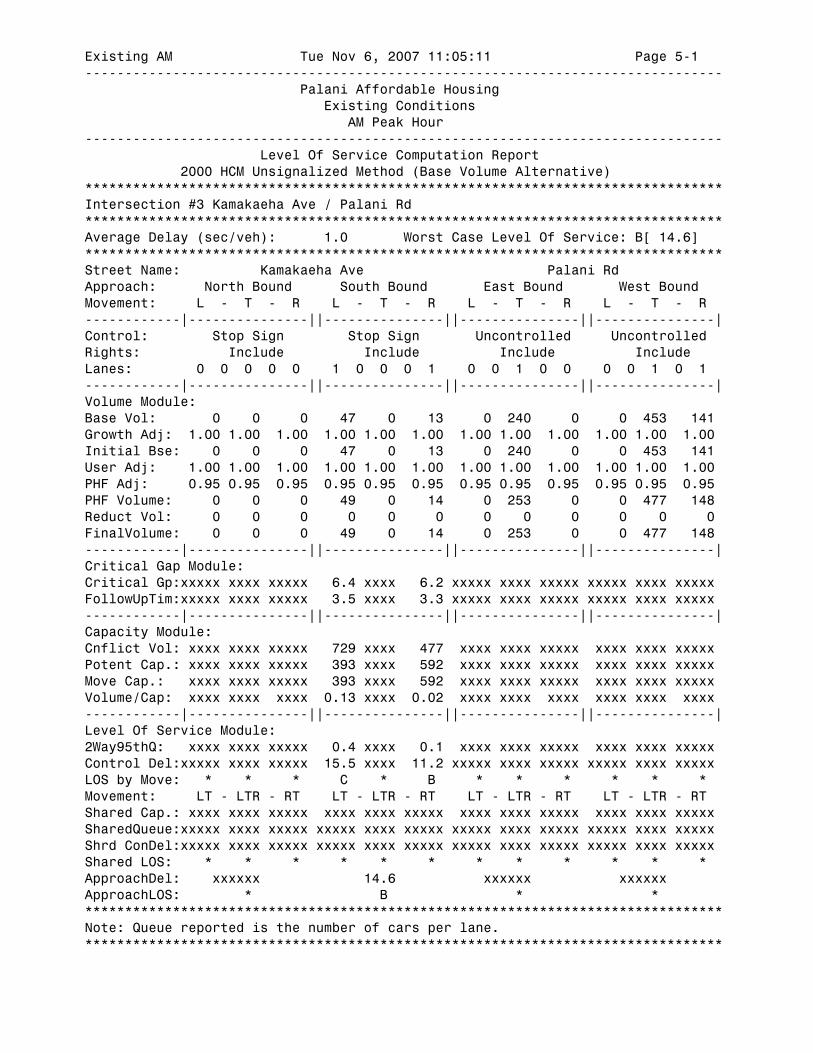
********************************************************************************
Existing AM Tue Nov 6, 2007 11:05:11 Page 5-1 -------------------------------------------------------------------------------- Palani Affordable Housing Existing Conditions AM Peak Hour -------------------------------------------------------------------------------- Level Of Service Computation Report 2000 HCM Unsignalized Method (Base Volume Alternative) ********************************************************************************Intersection #3 Kamakaeha Ave / Palani Rd ********************************************************************************Average Delay (sec/veh): 1.0 Worst Case Level Of Service: B[ 14.6]********************************************************************************Street Name: Kamakaeha Ave Palani Rd Approach: North Bound South Bound East Bound West Bound Movement: L - T - R L - T - R L - T - R L - T - R ------------|---------------||---------------||---------------||---------------|Control: Stop Sign Stop Sign Uncontrolled UncontrolledRights: Include Include Include Include Lanes: 0 0 0 0 0 1 0 0 0 1 0 0 1 0 0 0 0 1 0 1 ------------|---------------||---------------||---------------||---------------|Volume Module:Base Vol: 0 0 0 47 0 13 0 240 0 0 453 141 Growth Adj: 1.00 1.00 1.00 1.00 1.00 1.00 1.00 1.00 1.00 1.00 1.00 1.00 Initial Bse: 0 0 0 47 0 13 0 240 0 0 453 141 User Adj: 1.00 1.00 1.00 1.00 1.00 1.00 1.00 1.00 1.00 1.00 1.00 1.00 PHF Adj: 0.95 0.95 0.95 0.95 0.95 0.95 0.95 0.95 0.95 0.95 0.95 0.95 PHF Volume: 0 0 0 49 0 14 0 253 0 0 477 148 Reduct Vol: 0 0 0 0 0 0 0 0 0 0 0 0 FinalVolume: 0 0 0 49 0 14 0 253 0 0 477 148 ------------|---------------||---------------||---------------||---------------|Critical Gap Module:Critical Gp:xxxxx xxxx xxxxx 6.4 xxxx 6.2 xxxxx xxxx xxxxx xxxxx xxxx xxxxx FollowUpTim:xxxxx xxxx xxxxx 3.5 xxxx 3.3 xxxxx xxxx xxxxx xxxxx xxxx xxxxx ------------|---------------||---------------||---------------||---------------|Capacity Module:Cnflict Vol: xxxx xxxx xxxxx 729 xxxx 477 xxxx xxxx xxxxx xxxx xxxx xxxxx Potent Cap.: xxxx xxxx xxxxx 393 xxxx 592 xxxx xxxx xxxxx xxxx xxxx xxxxx Move Cap.: xxxx xxxx xxxxx 393 xxxx 592 xxxx xxxx xxxxx xxxx xxxx xxxxx Volume/Cap: xxxx xxxx xxxx 0.13 xxxx 0.02 xxxx xxxx xxxx xxxx xxxx xxxx ------------|---------------||---------------||---------------||---------------|Level Of Service Module:2Way95thQ: xxxx xxxx xxxxx 0.4 xxxx 0.1 xxxx xxxx xxxxx xxxx xxxx xxxxx Control Del:xxxxx xxxx xxxxx 15.5 xxxx 11.2 xxxxx xxxx xxxxx xxxxx xxxx xxxxx LOS by Move: * * * C * B * * * * * * Movement: LT - LTR - RT LT - LTR - RT LT - LTR - RT LT - LTR - RT Shared Cap.: xxxx xxxx xxxxx xxxx xxxx xxxxx xxxx xxxx xxxxx xxxx xxxx xxxxx SharedQueue:xxxxx xxxx xxxxx xxxxx xxxx xxxxx xxxxx xxxx xxxxx xxxxx xxxx xxxxx Shrd ConDel:xxxxx xxxx xxxxx xxxxx xxxx xxxxx xxxxx xxxx xxxxx xxxxx xxxx xxxxx Shared LOS: * * * * * * * * * * * * ApproachDel: xxxxxx 14.6 xxxxxx xxxxxxApproachLOS: * B * * ********************************************************************************Note: Queue reported is the number of cars per lane.

********************************************************************************
Existing AM Tue Nov 6, 2007 11:05:11 Page 6-1 -------------------------------------------------------------------------------- Palani Affordable Housing Existing Conditions AM Peak Hour -------------------------------------------------------------------------------- Level Of Service Computation Report 2000 HCM Operations Method (Base Volume Alternative) ********************************************************************************Intersection #4 Henry St / Palani Rd ********************************************************************************Cycle (sec): 100 Critical Vol./Cap.(X): 0.659Loss Time (sec): 10 (Y+R=4.0 sec) Average Delay (sec/veh): 12.3Optimal Cycle: 49 Level Of Service: B********************************************************************************Street Name: Henry St Palani Rd Approach: North Bound South Bound East Bound West Bound Movement: L - T - R L - T - R L - T - R L - T - R ------------|---------------||---------------||---------------||---------------|Control: Permitted Permitted Permitted Prot+Permit Rights: Ovl Include Include Include Min. Green: 0 0 0 0 0 0 0 0 0 0 0 0 Lanes: 1 0 0 0 1 0 0 0 0 0 0 0 0 1 0 1 0 1 0 0 ------------|---------------||---------------||---------------||---------------|Volume Module:Base Vol: 122 0 399 0 0 0 0 185 37 650 550 0 Growth Adj: 1.00 1.00 1.00 1.00 1.00 1.00 1.00 1.00 1.00 1.00 1.00 1.00 Initial Bse: 122 0 399 0 0 0 0 185 37 650 550 0 User Adj: 1.00 1.00 1.00 1.00 1.00 1.00 1.00 1.00 1.00 1.00 1.00 1.00 PHF Adj: 0.95 0.95 0.95 0.95 0.95 0.95 0.95 0.95 0.95 0.95 0.95 0.95 PHF Volume: 128 0 420 0 0 0 0 195 39 684 579 0 Reduct Vol: 0 0 0 0 0 0 0 0 0 0 0 0 Reduced Vol: 128 0 420 0 0 0 0 195 39 684 579 0 PCE Adj: 1.00 1.00 1.00 1.00 1.00 1.00 1.00 1.00 1.00 1.00 1.00 1.00 MLF Adj: 1.00 1.00 1.00 1.00 1.00 1.00 1.00 1.00 1.00 1.00 1.00 1.00 FinalVolume: 128 0 420 0 0 0 0 195 39 684 579 0 ------------|---------------||---------------||---------------||---------------|Saturation Flow Module:Sat/Lane: 1900 1900 1900 1900 1900 1900 1900 1900 1900 1900 1900 1900 Adjustment: 0.77 1.00 0.85 1.00 1.00 1.00 1.00 0.98 0.98 0.95 1.00 1.00 Lanes: 1.00 0.00 1.00 0.00 0.00 0.00 0.00 0.83 0.17 1.00 1.00 0.00 Final Sat.: 1461 0 1615 0 0 0 0 1547 309 1805 1900 0 ------------|---------------||---------------||---------------||---------------|Capacity Analysis Module:Vol/Sat: 0.09 0.00 0.26 0.00 0.00 0.00 0.00 0.13 0.13 0.38 0.30 0.00 Crit Moves: **** **** **** Green/Cycle: 0.13 0.00 0.71 0.00 0.00 0.00 0.00 0.19 0.19 0.77 0.77 0.00 Volume/Cap: 0.66 0.00 0.37 0.00 0.00 0.00 0.00 0.66 0.66 0.50 0.40 0.00 Delay/Veh: 49.2 0.0 5.9 0.0 0.0 0.0 0.0 41.9 41.9 6.1 4.1 0.0 User DelAdj: 1.00 1.00 1.00 1.00 1.00 1.00 1.00 1.00 1.00 1.00 1.00 1.00 AdjDel/Veh: 49.2 0.0 5.9 0.0 0.0 0.0 0.0 41.9 41.9 6.1 4.1 0.0 LOS by Move: D A A A A A A D D A A A HCM2kAvgQ: 5 0 5 0 0 0 0 8 8 8 6 0 ********************************************************************************Note: Queue reported is the number of cars per lane.

********************************************************************************
Existing AM Tue Nov 6, 2007 11:05:11 Page 7-1 -------------------------------------------------------------------------------- Palani Affordable Housing Existing Conditions AM Peak Hour -------------------------------------------------------------------------------- Level Of Service Computation Report 2000 HCM Operations Method (Base Volume Alternative) ********************************************************************************Intersection #6 Queen Kaahumanu Hwy / Makala Blvd ********************************************************************************Cycle (sec): 100 Critical Vol./Cap.(X): 0.748Loss Time (sec): 10 (Y+R=4.0 sec) Average Delay (sec/veh): 23.3Optimal Cycle: 61 Level Of Service: C********************************************************************************Street Name: Queen Kaahumanu Hwy Makala Blvd Approach: North Bound South Bound East Bound West Bound Movement: L - T - R L - T - R L - T - R L - T - R ------------|---------------||---------------||---------------||---------------|Control: Prot+Permit Prot+Permit Prot+Permit Prot+Permit Rights: Ovl Ovl Include Include Min. Green: 0 0 0 0 0 0 0 0 0 0 0 0 Lanes: 1 0 1 0 1 1 0 1 0 1 1 0 0 1 0 1 0 0 1 0 ------------|---------------||---------------||---------------||---------------|Volume Module:Base Vol: 7 652 22 47 580 138 309 72 32 7 21 143 Growth Adj: 1.00 1.00 1.00 1.00 1.00 1.00 1.00 1.00 1.00 1.00 1.00 1.00 Initial Bse: 7 652 22 47 580 138 309 72 32 7 21 143 User Adj: 1.00 1.00 1.00 1.00 1.00 1.00 1.00 1.00 1.00 1.00 1.00 1.00 PHF Adj: 0.95 0.95 0.95 0.95 0.95 0.95 0.95 0.95 0.95 0.95 0.95 0.95 PHF Volume: 7 686 23 49 611 145 325 76 34 7 22 151 Reduct Vol: 0 0 0 0 0 0 0 0 0 0 0 0 Reduced Vol: 7 686 23 49 611 145 325 76 34 7 22 151 PCE Adj: 1.00 1.00 1.00 1.00 1.00 1.00 1.00 1.00 1.00 1.00 1.00 1.00 MLF Adj: 1.00 1.00 1.00 1.00 1.00 1.00 1.00 1.00 1.00 1.00 1.00 1.00 FinalVolume: 7 686 23 49 611 145 325 76 34 7 22 151 ------------|---------------||---------------||---------------||---------------|Saturation Flow Module:Sat/Lane: 1900 1900 1900 1900 1900 1900 1900 1900 1900 1900 1900 1900 Adjustment: 0.95 1.00 0.85 0.95 1.00 0.85 0.95 0.95 0.95 0.95 0.87 0.87 Lanes: 1.00 1.00 1.00 1.00 1.00 1.00 1.00 0.69 0.31 1.00 0.13 0.87 Final Sat.: 1805 1900 1615 1805 1900 1615 1805 1255 558 1805 211 1440 ------------|---------------||---------------||---------------||---------------|Capacity Analysis Module:Vol/Sat: 0.00 0.36 0.01 0.03 0.32 0.09 0.18 0.06 0.06 0.00 0.10 0.10 Crit Moves: **** **** **** **** Green/Cycle: 0.49 0.48 0.51 0.54 0.51 0.75 0.40 0.36 0.36 0.16 0.14 0.14 Volume/Cap: 0.03 0.75 0.03 0.24 0.63 0.12 0.62 0.17 0.17 0.03 0.75 0.75 Delay/Veh: 15.1 24.4 12.3 16.7 18.8 3.4 24.5 22.2 22.2 35.2 54.0 54.0 User DelAdj: 1.00 1.00 1.00 1.00 1.00 1.00 1.00 1.00 1.00 1.00 1.00 1.00 AdjDel/Veh: 15.1 24.4 12.3 16.7 18.8 3.4 24.5 22.2 22.2 35.2 54.0 54.0 LOS by Move: B C B B B A C C C D D D HCM2kAvgQ: 0 18 0 1 14 1 9 2 2 0 7 7 ********************************************************************************Note: Queue reported is the number of cars per lane.

********************************************************************************
Existing AM Tue Nov 6, 2007 11:05:12 Page 8-1 -------------------------------------------------------------------------------- Palani Affordable Housing Existing Conditions AM Peak Hour -------------------------------------------------------------------------------- Level Of Service Computation Report 2000 HCM Unsignalized Method (Base Volume Alternative) ********************************************************************************Intersection #8 Palihiolo St/Palani Rd ********************************************************************************Average Delay (sec/veh): 1.6 Worst Case Level Of Service: E[ 47.5]********************************************************************************Street Name: Palihiolo St Palani Rd Approach: North Bound South Bound East Bound West Bound Movement: L - T - R L - T - R L - T - R L - T - R ------------|---------------||---------------||---------------||---------------|Control: Stop Sign Stop Sign Uncontrolled UncontrolledRights: Include Include Include Include Lanes: 0 0 1! 0 0 0 0 0 0 0 0 0 0 1 0 0 1 0 0 0 ------------|---------------||---------------||---------------||---------------|Volume Module:Base Vol: 25 0 32 0 0 0 0 674 5 17 1088 0 Growth Adj: 1.00 1.00 1.00 1.00 1.00 1.00 1.00 1.00 1.00 1.00 1.00 1.00 Initial Bse: 25 0 32 0 0 0 0 674 5 17 1088 0 User Adj: 1.00 1.00 1.00 1.00 1.00 1.00 1.00 1.00 1.00 1.00 1.00 1.00 PHF Adj: 0.95 0.95 0.95 0.95 0.95 0.95 0.95 0.95 0.95 0.95 0.95 0.95 PHF Volume: 26 0 34 0 0 0 0 709 5 18 1145 0 Reduct Vol: 0 0 0 0 0 0 0 0 0 0 0 0 FinalVolume: 26 0 34 0 0 0 0 709 5 18 1145 0 ------------|---------------||---------------||---------------||---------------|Critical Gap Module:Critical Gp: 6.4 6.5 6.2 xxxxx xxxx xxxxx xxxxx xxxx xxxxx 4.1 xxxx xxxxx FollowUpTim: 3.5 4.0 3.3 xxxxx xxxx xxxxx xxxxx xxxx xxxxx 2.2 xxxx xxxxx ------------|---------------||---------------||---------------||---------------|Capacity Module:Cnflict Vol: 1893 1893 712 xxxx xxxx xxxxx xxxx xxxx xxxxx 715 xxxx xxxxx Potent Cap.: 78 71 436 xxxx xxxx xxxxx xxxx xxxx xxxxx 895 xxxx xxxxx Move Cap.: 77 69 436 xxxx xxxx xxxxx xxxx xxxx xxxxx 895 xxxx xxxxx Volume/Cap: 0.34 0.00 0.08 xxxx xxxx xxxx xxxx xxxx xxxx 0.02 xxxx xxxx ------------|---------------||---------------||---------------||---------------|Level Of Service Module:2Way95thQ: xxxx xxxx xxxxx xxxx xxxx xxxxx xxxx xxxx xxxxx 0.1 xxxx xxxxx Control Del:xxxxx xxxx xxxxx xxxxx xxxx xxxxx xxxxx xxxx xxxxx 9.1 xxxx xxxxx LOS by Move: * * * * * * * * * A * * Movement: LT - LTR - RT LT - LTR - RT LT - LTR - RT LT - LTR - RT Shared Cap.: xxxx 142 xxxxx xxxx xxxx xxxxx xxxx xxxx xxxxx xxxx xxxx xxxxx SharedQueue:xxxxx 1.9 xxxxx xxxxx xxxx xxxxx xxxxx xxxx xxxxx 0.1 xxxx xxxxx Shrd ConDel:xxxxx 47.5 xxxxx xxxxx xxxx xxxxx xxxxx xxxx xxxxx 9.1 xxxx xxxxx Shared LOS: * E * * * * * * * A * * ApproachDel: 47.5 xxxxxx xxxxxx xxxxxxApproachLOS: E * * * ********************************************************************************Note: Queue reported is the number of cars per lane.

********************************************************************************
Existing AM Tue Nov 6, 2007 11:05:12 Page 9-1 -------------------------------------------------------------------------------- Palani Affordable Housing Existing Conditions AM Peak Hour -------------------------------------------------------------------------------- Level Of Service Computation Report 2000 HCM Unsignalized Method (Base Volume Alternative) ********************************************************************************Intersection #9 Kealakaa St/Palani ********************************************************************************Average Delay (sec/veh): 14.8 Worst Case Level Of Service: F[ 68.0]********************************************************************************Street Name: Kealakaa St Palani Rd Approach: North Bound South Bound East Bound West Bound Movement: L - T - R L - T - R L - T - R L - T - R ------------|---------------||---------------||---------------||---------------|Control: Stop Sign Stop Sign Uncontrolled UncontrolledRights: Include Include Include Include Lanes: 0 0 0 0 0 1 0 0 0 1 0 1 0 0 0 0 0 0 1 0 ------------|---------------||---------------||---------------||---------------|Volume Module:Base Vol: 0 0 0 25 0 321 295 369 0 0 775 49 Growth Adj: 1.00 1.00 1.00 1.00 1.00 1.00 1.00 1.00 1.00 1.00 1.00 1.00 Initial Bse: 0 0 0 25 0 321 295 369 0 0 775 49 User Adj: 1.00 1.00 1.00 1.00 1.00 1.00 1.00 1.00 1.00 1.00 1.00 1.00 PHF Adj: 0.95 0.95 0.95 0.95 0.95 0.95 0.95 0.95 0.95 0.95 0.95 0.95 PHF Volume: 0 0 0 26 0 338 311 388 0 0 816 52 Reduct Vol: 0 0 0 0 0 0 0 0 0 0 0 0 FinalVolume: 0 0 0 26 0 338 311 388 0 0 816 52 ------------|---------------||---------------||---------------||---------------|Critical Gap Module:Critical Gp:xxxxx xxxx xxxxx 6.4 xxxx 6.2 4.1 xxxx xxxxx xxxxx xxxx xxxxx FollowUpTim:xxxxx xxxx xxxxx 3.5 xxxx 3.3 2.2 xxxx xxxxx xxxxx xxxx xxxxx ------------|---------------||---------------||---------------||---------------|Capacity Module:Cnflict Vol: xxxx xxxx xxxxx 1851 xxxx 842 867 xxxx xxxxx xxxx xxxx xxxxx Potent Cap.: xxxx xxxx xxxxx 83 xxxx 367 785 xxxx xxxxx xxxx xxxx xxxxx Move Cap.: xxxx xxxx xxxxx 52 xxxx 367 785 xxxx xxxxx xxxx xxxx xxxxx Volume/Cap: xxxx xxxx xxxx 0.51 xxxx 0.92 0.40 xxxx xxxx xxxx xxxx xxxx ------------|---------------||---------------||---------------||---------------|Level Of Service Module:2Way95thQ: xxxx xxxx xxxxx 1.9 xxxx 9.6 1.9 xxxx xxxxx xxxx xxxx xxxxx Control Del:xxxxx xxxx xxxxx 132.5 xxxx 62.9 12.6 xxxx xxxxx xxxxx xxxx xxxxx LOS by Move: * * * F * F B * * * * * Movement: LT - LTR - RT LT - LTR - RT LT - LTR - RT LT - LTR - RT Shared Cap.: xxxx xxxx xxxxx xxxx xxxx xxxxx xxxx xxxx xxxxx xxxx xxxx xxxxx SharedQueue:xxxxx xxxx xxxxx xxxxx xxxx xxxxx 1.9 xxxx xxxxx xxxxx xxxx xxxxx Shrd ConDel:xxxxx xxxx xxxxx xxxxx xxxx xxxxx 12.6 xxxx xxxxx xxxxx xxxx xxxxx Shared LOS: * * * * * * B * * * * * ApproachDel: xxxxxx 68.0 xxxxxx xxxxxxApproachLOS: * F * * ********************************************************************************Note: Queue reported is the number of cars per lane.

Note: Queue reported is the number of cars per lane.********************************************************************************
Existing AM Tue Nov 6, 2007 11:05:12 Page 10-1 -------------------------------------------------------------------------------- Palani Affordable Housing Existing Conditions AM Peak Hour -------------------------------------------------------------------------------- Level Of Service Computation Report 2000 HCM Unsignalized Method (Base Volume Alternative) ********************************************************************************Intersection #10 Palani Rd / Uluaoa St ********************************************************************************Average Delay (sec/veh): 13.9 Worst Case Level Of Service: F[ 57.7]********************************************************************************Street Name: Palani Rd Uluaoa St Approach: North Bound South Bound East Bound West Bound Movement: L - T - R L - T - R L - T - R L - T - R ------------|---------------||---------------||---------------||---------------|Control: Uncontrolled Uncontrolled Stop Sign Stop Sign Rights: Include Include Include Include Lanes: 0 1 0 0 0 0 0 0 1 0 1 0 0 0 1 0 0 0 0 0 ------------|---------------||---------------||---------------||---------------|Volume Module:Base Vol: 44 320 0 0 598 257 176 0 200 0 0 0 Growth Adj: 1.00 1.00 1.00 1.00 1.00 1.00 1.00 1.00 1.00 1.00 1.00 1.00 Initial Bse: 44 320 0 0 598 257 176 0 200 0 0 0 User Adj: 1.00 1.00 1.00 1.00 1.00 1.00 1.00 1.00 1.00 1.00 1.00 1.00 PHF Adj: 0.95 0.95 0.95 0.95 0.95 0.95 0.95 0.95 0.95 0.95 0.95 0.95 PHF Volume: 46 337 0 0 629 271 185 0 211 0 0 0 Reduct Vol: 0 0 0 0 0 0 0 0 0 0 0 0 FinalVolume: 46 337 0 0 629 271 185 0 211 0 0 0 ------------|---------------||---------------||---------------||---------------|Critical Gap Module:Critical Gp: 4.1 xxxx xxxxx xxxxx xxxx xxxxx 6.4 xxxx 6.2 xxxxx xxxx xxxxx FollowUpTim: 2.2 xxxx xxxxx xxxxx xxxx xxxxx 3.5 xxxx 3.3 xxxxx xxxx xxxxx ------------|---------------||---------------||---------------||---------------|Capacity Module:Cnflict Vol: 900 xxxx xxxxx xxxx xxxx xxxxx 1194 xxxx 765 xxxx xxxx xxxxx Potent Cap.: 763 xxxx xxxxx xxxx xxxx xxxxx 208 xxxx 407 xxxx xxxx xxxxx Move Cap.: 763 xxxx xxxxx xxxx xxxx xxxxx 198 xxxx 407 xxxx xxxx xxxxx Volume/Cap: 0.06 xxxx xxxx xxxx xxxx xxxx 0.93 xxxx 0.52 xxxx xxxx xxxx ------------|---------------||---------------||---------------||---------------|Level Of Service Module:2Way95thQ: 0.2 xxxx xxxxx xxxx xxxx xxxxx 7.6 xxxx 2.9 xxxx xxxx xxxxx Control Del: 10.0 xxxx xxxxx xxxxx xxxx xxxxx 97.2 xxxx 23.0 xxxxx xxxx xxxxx LOS by Move: B * * * * * F * C * * * Movement: LT - LTR - RT LT - LTR - RT LT - LTR - RT LT - LTR - RT Shared Cap.: xxxx xxxx xxxxx xxxx xxxx xxxxx xxxx xxxx xxxxx xxxx xxxx xxxxx SharedQueue: 0.2 xxxx xxxxx xxxxx xxxx xxxxx xxxxx xxxx xxxxx xxxxx xxxx xxxxx Shrd ConDel: 10.0 xxxx xxxxx xxxxx xxxx xxxxx xxxxx xxxx xxxxx xxxxx xxxx xxxxx Shared LOS: B * * * * * * * * * * * ApproachDel: xxxxxx xxxxxx 57.7 xxxxxxApproachLOS: * * F * ********************************************************************************

Note: Queue reported is the number of cars per lane.********************************************************************************
Existing AM Tue Nov 6, 2007 11:05:12 Page 11-1 -------------------------------------------------------------------------------- Palani Affordable Housing Existing Conditions AM Peak Hour -------------------------------------------------------------------------------- Level Of Service Computation Report 2000 HCM Operations Method (Base Volume Alternative) ********************************************************************************Intersection #11 Queen Kaahumanu Hwy / Kealakehe Pkwy ********************************************************************************Cycle (sec): 100 Critical Vol./Cap.(X): 0.742Loss Time (sec): 10 (Y+R=4.0 sec) Average Delay (sec/veh): 19.7Optimal Cycle: 60 Level Of Service: B********************************************************************************Street Name: Queen Kaahumanu Hwy Kaalakehe Pkwy Approach: North Bound South Bound East Bound West Bound Movement: L - T - R L - T - R L - T - R L - T - R ------------|---------------||---------------||---------------||---------------|Control: Prot+Permit Prot+Permit Permitted Permitted Rights: Ovl Ovl Ovl Ovl Min. Green: 0 0 0 0 0 0 0 0 0 0 0 0 Lanes: 1 0 1 0 1 1 0 1 0 1 0 1 0 0 1 0 1 0 0 1 ------------|---------------||---------------||---------------||---------------|Volume Module:Base Vol: 85 733 262 135 720 80 41 20 7 214 11 74 Growth Adj: 1.00 1.00 1.00 1.00 1.00 1.00 1.00 1.00 1.00 1.00 1.00 1.00 Initial Bse: 85 733 262 135 720 80 41 20 7 214 11 74 User Adj: 1.00 1.00 1.00 1.00 1.00 1.00 1.00 1.00 1.00 1.00 1.00 1.00 PHF Adj: 0.95 0.95 0.95 0.95 0.95 0.95 0.95 0.95 0.95 0.95 0.95 0.95 PHF Volume: 89 772 276 142 758 84 43 21 7 225 12 78 Reduct Vol: 0 0 0 0 0 0 0 0 0 0 0 0 Reduced Vol: 89 772 276 142 758 84 43 21 7 225 12 78 PCE Adj: 1.00 1.00 1.00 1.00 1.00 1.00 1.00 1.00 1.00 1.00 1.00 1.00 MLF Adj: 1.00 1.00 1.00 1.00 1.00 1.00 1.00 1.00 1.00 1.00 1.00 1.00 FinalVolume: 89 772 276 142 758 84 43 21 7 225 12 78 ------------|---------------||---------------||---------------||---------------|Saturation Flow Module:Sat/Lane: 1900 1900 1900 1900 1900 1900 1900 1900 1900 1900 1900 1900 Adjustment: 0.95 1.00 0.85 0.95 1.00 0.85 0.67 0.67 0.85 0.68 0.68 0.85 Lanes: 1.00 1.00 1.00 1.00 1.00 1.00 0.67 0.33 1.00 0.95 0.05 1.00 Final Sat.: 1805 1900 1615 1805 1900 1615 849 414 1615 1229 63 1615 ------------|---------------||---------------||---------------||---------------|Capacity Analysis Module:Vol/Sat: 0.05 0.41 0.17 0.08 0.40 0.05 0.05 0.05 0.00 0.18 0.18 0.05 Crit Moves: **** **** **** Green/Cycle: 0.62 0.55 0.55 0.68 0.58 0.58 0.25 0.25 0.32 0.25 0.25 0.35 Volume/Cap: 0.26 0.74 0.31 0.40 0.69 0.09 0.21 0.21 0.01 0.74 0.74 0.14 Delay/Veh: 11.3 20.2 12.6 13.3 16.4 9.3 30.2 30.2 23.3 43.8 43.8 22.1 User DelAdj: 1.00 1.00 1.00 1.00 1.00 1.00 1.00 1.00 1.00 1.00 1.00 1.00 AdjDel/Veh: 11.3 20.2 12.6 13.3 16.4 9.3 30.2 30.2 23.3 43.8 43.8 22.1 LOS by Move: B C B B B A C C C D D C HCM2kAvgQ: 1 19 5 2 17 1 2 2 0 8 8 2 ********************************************************************************

Note: Queue reported is the number of cars per lane.********************************************************************************
Existing AM Tue Nov 6, 2007 11:05:12 Page 12-1 -------------------------------------------------------------------------------- Palani Affordable Housing Existing Conditions AM Peak Hour -------------------------------------------------------------------------------- Level Of Service Computation Report 2000 HCM Unsignalized Method (Base Volume Alternative) ********************************************************************************Intersection #12 Ane Keohokalole Hwy / Kealakehe Pkwy ********************************************************************************Average Delay (sec/veh): 3.4 Worst Case Level Of Service: B[ 11.7]********************************************************************************Street Name: Ane Jeohokalole Hwy Kealakehe Pkwy Approach: North Bound South Bound East Bound West Bound Movement: L - T - R L - T - R L - T - R L - T - R ------------|---------------||---------------||---------------||---------------|Control: Stop Sign Stop Sign Uncontrolled UncontrolledRights: Include Include Include Include Lanes: 1 0 1 0 1 1 0 0 1 0 1 0 1 1 0 1 0 1 0 1 ------------|---------------||---------------||---------------||---------------|Volume Module:Base Vol: 169 0 3 0 0 0 0 44 306 2 65 0 Growth Adj: 1.00 1.00 1.00 1.00 1.00 1.00 1.00 1.00 1.00 1.00 1.00 1.00 Initial Bse: 169 0 3 0 0 0 0 44 306 2 65 0 User Adj: 1.00 1.00 1.00 1.00 1.00 1.00 1.00 1.00 1.00 1.00 1.00 1.00 PHF Adj: 0.95 0.95 0.95 0.95 0.95 0.95 0.95 0.95 0.95 0.95 0.95 0.95 PHF Volume: 178 0 3 0 0 0 0 46 322 2 68 0 Reduct Vol: 0 0 0 0 0 0 0 0 0 0 0 0 FinalVolume: 178 0 3 0 0 0 0 46 322 2 68 0 ------------|---------------||---------------||---------------||---------------|Critical Gap Module:Critical Gp: 6.4 6.5 6.2 7.1 6.5 6.2 xxxxx xxxx xxxxx 4.1 xxxx xxxxx FollowUpTim: 3.5 4.0 3.3 3.5 4.0 3.3 xxxxx xxxx xxxxx 2.2 xxxx xxxxx ------------|---------------||---------------||---------------||---------------|Capacity Module:Cnflict Vol: 280 280 184 96 441 68 xxxx xxxx xxxxx 368 xxxx xxxxx Potent Cap.: 714 632 863 892 513 1000 xxxx xxxx xxxxx 1201 xxxx xxxxx Move Cap.: 713 631 863 887 513 1000 xxxx xxxx xxxxx 1201 xxxx xxxxx Volume/Cap: 0.25 0.00 0.00 0.00 0.00 0.00 xxxx xxxx xxxx 0.00 xxxx xxxx ------------|---------------||---------------||---------------||---------------|Level Of Service Module:2Way95thQ: 1.0 xxxx 0.0 xxxx xxxx xxxxx xxxx xxxx xxxxx 0.0 xxxx xxxxx Control Del: 11.7 xxxx 9.2 xxxxx xxxx xxxxx xxxxx xxxx xxxxx 8.0 xxxx xxxxx LOS by Move: B * A * * * * * * A * * Movement: LT - LTR - RT LT - LTR - RT LT - LTR - RT LT - LTR - RT Shared Cap.: xxxx xxxx xxxxx xxxx xxxx 0 xxxx xxxx xxxxx xxxx xxxx xxxxx SharedQueue:xxxxx xxxx xxxxx xxxxx xxxx xxxxx xxxxx xxxx xxxxx xxxxx xxxx xxxxx Shrd ConDel:xxxxx xxxx xxxxx xxxxx xxxx xxxxx xxxxx xxxx xxxxx xxxxx xxxx xxxxx Shared LOS: * * * * * * * * * * * * ApproachDel: 11.7 xxxxxx xxxxxx xxxxxxApproachLOS: B * * * ********************************************************************************

Existing PM Tue Nov 6, 2007 11:05:19 Page 3-1 -------------------------------------------------------------------------------- Palani Affordable Housing Existing Conditions PM Peak Hour -------------------------------------------------------------------------------- Level Of Service Computation Report 2000 HCM Operations Method (Base Volume Alternative) ********************************************************************************Intersection #1 Queen Kaahumanu Hwy / Henry St ********************************************************************************Cycle (sec): 100 Critical Vol./Cap.(X): 0.626Loss Time (sec): 10 (Y+R=4.0 sec) Average Delay (sec/veh): 24.9Optimal Cycle: 45 Level Of Service: C********************************************************************************Street Name: Queen Kaahumanu Hwy Henry St Approach: North Bound South Bound East Bound West Bound Movement: L - T - R L - T - R L - T - R L - T - R ------------|---------------||---------------||---------------||---------------|Control: Prot+Permit Prot+Permit Prot+Permit Prot+Permit Rights: Ovl Ovl Ovl Ovl Min. Green: 0 0 0 0 0 0 0 0 0 0 0 0 Lanes: 1 0 1 0 1 1 0 2 0 1 1 0 2 0 1 1 1 1 0 1 ------------|---------------||---------------||---------------||---------------|Volume Module:Base Vol: 169 331 418 166 609 109 67 406 107 436 390 179 Growth Adj: 1.00 1.00 1.00 1.00 1.00 1.00 1.00 1.00 1.00 1.00 1.00 1.00 Initial Bse: 169 331 418 166 609 109 67 406 107 436 390 179 User Adj: 1.00 1.00 1.00 1.00 1.00 1.00 1.00 1.00 1.00 1.00 1.00 1.00 PHF Adj: 0.95 0.95 0.95 0.95 0.95 0.95 0.95 0.95 0.95 0.95 0.95 0.95 PHF Volume: 178 348 440 175 641 115 71 427 113 459 411 188 Reduct Vol: 0 0 0 0 0 0 0 0 0 0 0 0 Reduced Vol: 178 348 440 175 641 115 71 427 113 459 411 188 PCE Adj: 1.00 1.00 1.00 1.00 1.00 1.00 1.00 1.00 1.00 1.00 1.00 1.00 MLF Adj: 1.00 1.00 1.00 1.00 1.00 1.00 1.00 1.00 1.00 1.00 1.00 1.00 FinalVolume: 178 348 440 175 641 115 71 427 113 459 411 188 ------------|---------------||---------------||---------------||---------------|Saturation Flow Module:Sat/Lane: 1900 1900 1900 1900 1900 1900 1900 1900 1900 1900 1900 1900 Adjustment: 0.95 1.00 0.85 0.95 0.95 0.85 0.95 0.95 0.85 0.93 0.93 0.85 Lanes: 1.00 1.00 1.00 1.00 2.00 1.00 1.00 2.00 1.00 1.58 1.42 1.00 Final Sat.: 1805 1900 1615 1805 3610 1615 1805 3610 1615 2784 2490 1615 ------------|---------------||---------------||---------------||---------------|Capacity Analysis Module:Vol/Sat: 0.10 0.18 0.27 0.10 0.18 0.07 0.04 0.12 0.07 0.16 0.16 0.12 Crit Moves: **** **** **** **** Green/Cycle: 0.46 0.29 0.56 0.44 0.29 0.37 0.28 0.19 0.35 0.48 0.37 0.52 Volume/Cap: 0.44 0.63 0.49 0.42 0.62 0.19 0.21 0.62 0.20 0.47 0.45 0.22 Delay/Veh: 17.9 33.2 14.0 19.5 32.2 21.3 27.4 38.9 23.0 17.2 24.0 13.1 User DelAdj: 1.00 1.00 1.00 1.00 1.00 1.00 1.00 1.00 1.00 1.00 1.00 1.00 AdjDel/Veh: 17.9 33.2 14.0 19.5 32.2 21.3 27.4 38.9 23.0 17.2 24.0 13.1 LOS by Move: B C B B C C C D C B C B HCM2kAvgQ: 4 10 8 4 10 2 2 7 2 7 7 3 ********************************************************************************Note: Queue reported is the number of cars per lane.********************************************************************************

********************************************************************************
Existing PM Tue Nov 6, 2007 11:05:19 Page 4-1 -------------------------------------------------------------------------------- Palani Affordable Housing Existing Conditions PM Peak Hour -------------------------------------------------------------------------------- Level Of Service Computation Report 2000 HCM Operations Method (Base Volume Alternative) ********************************************************************************Intersection #2 Queen Kaahumanu Hwy / Alli Dr ********************************************************************************Cycle (sec): 100 Critical Vol./Cap.(X): 0.874Loss Time (sec): 10 (Y+R=4.0 sec) Average Delay (sec/veh): 30.9Optimal Cycle: 94 Level Of Service: C********************************************************************************Street Name: Queen Kaahumanu Hwy Alli Dr Approach: North Bound South Bound East Bound West Bound Movement: L - T - R L - T - R L - T - R L - T - R ------------|---------------||---------------||---------------||---------------|Control: Prot+Permit Prot+Permit Prot+Permit Prot+Permit Rights: Ovl Ovl Ovl Ovl Min. Green: 0 0 0 0 0 0 0 0 0 0 0 0 Lanes: 1 0 1 0 1 1 0 1 0 1 1 0 1 0 1 1 0 1 0 1 ------------|---------------||---------------||---------------||---------------|Volume Module:Base Vol: 28 524 15 170 580 294 269 293 219 51 434 44 Growth Adj: 1.00 1.00 1.00 1.00 1.00 1.00 1.00 1.00 1.00 1.00 1.00 1.00 Initial Bse: 28 524 15 170 580 294 269 293 219 51 434 44 User Adj: 1.00 1.00 1.00 1.00 1.00 1.00 1.00 1.00 1.00 1.00 1.00 1.00 PHF Adj: 0.95 0.95 0.95 0.95 0.95 0.95 0.95 0.95 0.95 0.95 0.95 0.95 PHF Volume: 29 552 16 179 611 309 283 308 231 54 457 46 Reduct Vol: 0 0 0 0 0 0 0 0 0 0 0 0 Reduced Vol: 29 552 16 179 611 309 283 308 231 54 457 46 PCE Adj: 1.00 1.00 1.00 1.00 1.00 1.00 1.00 1.00 1.00 1.00 1.00 1.00 MLF Adj: 1.00 1.00 1.00 1.00 1.00 1.00 1.00 1.00 1.00 1.00 1.00 1.00 FinalVolume: 29 552 16 179 611 309 283 308 231 54 457 46 ------------|---------------||---------------||---------------||---------------|Saturation Flow Module:Sat/Lane: 1900 1900 1900 1900 1900 1900 1900 1900 1900 1900 1900 1900 Adjustment: 0.95 1.00 0.85 0.95 1.00 0.85 0.95 1.00 0.85 0.95 1.00 0.85 Lanes: 1.00 1.00 1.00 1.00 1.00 1.00 1.00 1.00 1.00 1.00 1.00 1.00 Final Sat.: 1805 1900 1615 1805 1900 1615 1805 1900 1615 1805 1900 1615 ------------|---------------||---------------||---------------||---------------|Capacity Analysis Module:Vol/Sat: 0.02 0.29 0.01 0.10 0.32 0.19 0.16 0.16 0.14 0.03 0.24 0.03 Crit Moves: **** **** **** **** Green/Cycle: 0.35 0.33 0.40 0.47 0.42 0.60 0.47 0.38 0.41 0.35 0.28 0.39 Volume/Cap: 0.18 0.87 0.02 0.64 0.76 0.32 0.71 0.42 0.35 0.13 0.87 0.07 Delay/Veh: 23.4 44.3 18.0 25.6 28.6 9.9 27.7 23.0 20.9 22.2 49.7 19.3 User DelAdj: 1.00 1.00 1.00 1.00 1.00 1.00 1.00 1.00 1.00 1.00 1.00 1.00 AdjDel/Veh: 23.4 44.3 18.0 25.6 28.6 9.9 27.7 23.0 20.9 22.2 49.7 19.3 LOS by Move: C D B C C A C C C C D B HCM2kAvgQ: 1 19 0 5 17 5 8 7 5 1 17 1 ********************************************************************************Note: Queue reported is the number of cars per lane.

********************************************************************************
Existing PM Tue Nov 6, 2007 11:05:19 Page 5-1 -------------------------------------------------------------------------------- Palani Affordable Housing Existing Conditions PM Peak Hour -------------------------------------------------------------------------------- Level Of Service Computation Report 2000 HCM Unsignalized Method (Base Volume Alternative) ********************************************************************************Intersection #3 Kamakaeha Ave / Palani Rd ********************************************************************************Average Delay (sec/veh): 3.6 Worst Case Level Of Service: D[ 25.4]********************************************************************************Street Name: Kamakaeha Ave Palani Rd Approach: North Bound South Bound East Bound West Bound Movement: L - T - R L - T - R L - T - R L - T - R ------------|---------------||---------------||---------------||---------------|Control: Stop Sign Stop Sign Uncontrolled UncontrolledRights: Include Include Include Include Lanes: 0 0 0 0 0 1 0 0 0 1 0 0 1 0 0 0 0 1 0 1 ------------|---------------||---------------||---------------||---------------|Volume Module:Base Vol: 0 0 0 127 0 63 0 498 0 0 474 161 Growth Adj: 1.00 1.00 1.00 1.00 1.00 1.00 1.00 1.00 1.00 1.00 1.00 1.00 Initial Bse: 0 0 0 127 0 63 0 498 0 0 474 161 User Adj: 1.00 1.00 1.00 1.00 1.00 1.00 1.00 1.00 1.00 1.00 1.00 1.00 PHF Adj: 0.95 0.95 0.95 0.95 0.95 0.95 0.95 0.95 0.95 0.95 0.95 0.95 PHF Volume: 0 0 0 134 0 66 0 524 0 0 499 169 Reduct Vol: 0 0 0 0 0 0 0 0 0 0 0 0 FinalVolume: 0 0 0 134 0 66 0 524 0 0 499 169 ------------|---------------||---------------||---------------||---------------|Critical Gap Module:Critical Gp:xxxxx xxxx xxxxx 6.4 xxxx 6.2 xxxxx xxxx xxxxx xxxxx xxxx xxxxx FollowUpTim:xxxxx xxxx xxxxx 3.5 xxxx 3.3 xxxxx xxxx xxxxx xxxxx xxxx xxxxx ------------|---------------||---------------||---------------||---------------|Capacity Module:Cnflict Vol: xxxx xxxx xxxxx 1023 xxxx 499 xxxx xxxx xxxxx xxxx xxxx xxxxx Potent Cap.: xxxx xxxx xxxxx 263 xxxx 576 xxxx xxxx xxxxx xxxx xxxx xxxxx Move Cap.: xxxx xxxx xxxxx 263 xxxx 576 xxxx xxxx xxxxx xxxx xxxx xxxxx Volume/Cap: xxxx xxxx xxxx 0.51 xxxx 0.12 xxxx xxxx xxxx xxxx xxxx xxxx ------------|---------------||---------------||---------------||---------------|Level Of Service Module:2Way95thQ: xxxx xxxx xxxxx 2.7 xxxx 0.4 xxxx xxxx xxxxx xxxx xxxx xxxxx Control Del:xxxxx xxxx xxxxx 32.0 xxxx 12.1 xxxxx xxxx xxxxx xxxxx xxxx xxxxx LOS by Move: * * * D * B * * * * * * Movement: LT - LTR - RT LT - LTR - RT LT - LTR - RT LT - LTR - RT Shared Cap.: xxxx xxxx xxxxx xxxx xxxx xxxxx xxxx xxxx xxxxx xxxx xxxx xxxxx SharedQueue:xxxxx xxxx xxxxx xxxxx xxxx xxxxx xxxxx xxxx xxxxx xxxxx xxxx xxxxx Shrd ConDel:xxxxx xxxx xxxxx xxxxx xxxx xxxxx xxxxx xxxx xxxxx xxxxx xxxx xxxxx Shared LOS: * * * * * * * * * * * * ApproachDel: xxxxxx 25.4 xxxxxx xxxxxxApproachLOS: * D * * ********************************************************************************Note: Queue reported is the number of cars per lane.

********************************************************************************
Existing PM Tue Nov 6, 2007 11:05:19 Page 6-1 -------------------------------------------------------------------------------- Palani Affordable Housing Existing Conditions PM Peak Hour -------------------------------------------------------------------------------- Level Of Service Computation Report 2000 HCM Operations Method (Base Volume Alternative) ********************************************************************************Intersection #4 Henry St / Palani Rd ********************************************************************************Cycle (sec): 100 Critical Vol./Cap.(X): 0.804Loss Time (sec): 10 (Y+R=4.0 sec) Average Delay (sec/veh): 18.5Optimal Cycle: 72 Level Of Service: B********************************************************************************Street Name: Henry St Palani Rd Approach: North Bound South Bound East Bound West Bound Movement: L - T - R L - T - R L - T - R L - T - R ------------|---------------||---------------||---------------||---------------|Control: Permitted Permitted Permitted Prot+Permit Rights: Ovl Include Include Include Min. Green: 0 0 0 0 0 0 0 0 0 0 0 0 Lanes: 1 0 0 0 1 0 0 0 0 0 0 0 0 1 0 1 0 1 0 0 ------------|---------------||---------------||---------------||---------------|Volume Module:Base Vol: 110 0 377 0 0 0 0 484 149 484 501 0 Growth Adj: 1.00 1.00 1.00 1.00 1.00 1.00 1.00 1.00 1.00 1.00 1.00 1.00 Initial Bse: 110 0 377 0 0 0 0 484 149 484 501 0 User Adj: 1.00 1.00 1.00 1.00 1.00 1.00 1.00 1.00 1.00 1.00 1.00 1.00 PHF Adj: 0.95 0.95 0.95 0.95 0.95 0.95 0.95 0.95 0.95 0.95 0.95 0.95 PHF Volume: 116 0 397 0 0 0 0 509 157 509 527 0 Reduct Vol: 0 0 0 0 0 0 0 0 0 0 0 0 Reduced Vol: 116 0 397 0 0 0 0 509 157 509 527 0 PCE Adj: 1.00 1.00 1.00 1.00 1.00 1.00 1.00 1.00 1.00 1.00 1.00 1.00 MLF Adj: 1.00 1.00 1.00 1.00 1.00 1.00 1.00 1.00 1.00 1.00 1.00 1.00 FinalVolume: 116 0 397 0 0 0 0 509 157 509 527 0 ------------|---------------||---------------||---------------||---------------|Saturation Flow Module:Sat/Lane: 1900 1900 1900 1900 1900 1900 1900 1900 1900 1900 1900 1900 Adjustment: 0.77 1.00 0.85 1.00 1.00 1.00 1.00 0.97 0.97 0.95 1.00 1.00 Lanes: 1.00 0.00 1.00 0.00 0.00 0.00 0.00 0.76 0.24 1.00 1.00 0.00 Final Sat.: 1461 0 1615 0 0 0 0 1406 433 1805 1900 0 ------------|---------------||---------------||---------------||---------------|Capacity Analysis Module:Vol/Sat: 0.08 0.00 0.25 0.00 0.00 0.00 0.00 0.36 0.36 0.28 0.28 0.00 Crit Moves: **** **** **** Green/Cycle: 0.10 0.00 0.45 0.00 0.00 0.00 0.00 0.45 0.45 0.80 0.80 0.00 Volume/Cap: 0.80 0.00 0.55 0.00 0.00 0.00 0.00 0.80 0.80 0.41 0.35 0.00 Delay/Veh: 71.1 0.0 21.0 0.0 0.0 0.0 0.0 29.4 29.4 6.5 2.9 0.0 User DelAdj: 1.00 1.00 1.00 1.00 1.00 1.00 1.00 1.00 1.00 1.00 1.00 1.00 AdjDel/Veh: 71.1 0.0 21.0 0.0 0.0 0.0 0.0 29.4 29.4 6.5 2.9 0.0 LOS by Move: E A C A A A A C C A A A HCM2kAvgQ: 6 0 9 0 0 0 0 19 19 5 5 0 ********************************************************************************Note: Queue reported is the number of cars per lane.

********************************************************************************
Existing PM Tue Nov 6, 2007 11:05:19 Page 7-1 -------------------------------------------------------------------------------- Palani Affordable Housing Existing Conditions PM Peak Hour -------------------------------------------------------------------------------- Level Of Service Computation Report 2000 HCM Operations Method (Base Volume Alternative) ********************************************************************************Intersection #6 Queen Kaahumanu Hwy / Makala Blvd ********************************************************************************Cycle (sec): 100 Critical Vol./Cap.(X): 0.973Loss Time (sec): 10 (Y+R=4.0 sec) Average Delay (sec/veh): 35.6Optimal Cycle: 161 Level Of Service: D********************************************************************************Street Name: Queen Kaahumanu Hwy Makala Blvd Approach: North Bound South Bound East Bound West Bound Movement: L - T - R L - T - R L - T - R L - T - R ------------|---------------||---------------||---------------||---------------|Control: Prot+Permit Prot+Permit Prot+Permit Prot+Permit Rights: Ovl Ovl Include Include Min. Green: 0 0 0 0 0 0 0 0 0 0 0 0 Lanes: 1 0 1 0 1 1 0 1 0 1 1 0 0 1 0 1 0 0 1 0 ------------|---------------||---------------||---------------||---------------|Volume Module:Base Vol: 11 569 65 70 938 240 417 126 41 21 71 104 Growth Adj: 1.00 1.00 1.00 1.00 1.00 1.00 1.00 1.00 1.00 1.00 1.00 1.00 Initial Bse: 11 569 65 70 938 240 417 126 41 21 71 104 User Adj: 1.00 1.00 1.00 1.00 1.00 1.00 1.00 1.00 1.00 1.00 1.00 1.00 PHF Adj: 0.95 0.95 0.95 0.95 0.95 0.95 0.95 0.95 0.95 0.95 0.95 0.95 PHF Volume: 12 599 68 74 987 253 439 133 43 22 75 109 Reduct Vol: 0 0 0 0 0 0 0 0 0 0 0 0 Reduced Vol: 12 599 68 74 987 253 439 133 43 22 75 109 PCE Adj: 1.00 1.00 1.00 1.00 1.00 1.00 1.00 1.00 1.00 1.00 1.00 1.00 MLF Adj: 1.00 1.00 1.00 1.00 1.00 1.00 1.00 1.00 1.00 1.00 1.00 1.00 FinalVolume: 12 599 68 74 987 253 439 133 43 22 75 109 ------------|---------------||---------------||---------------||---------------|Saturation Flow Module:Sat/Lane: 1900 1900 1900 1900 1900 1900 1900 1900 1900 1900 1900 1900 Adjustment: 0.95 1.00 0.85 0.95 1.00 0.85 0.95 0.96 0.96 0.95 0.91 0.91 Lanes: 1.00 1.00 1.00 1.00 1.00 1.00 1.00 0.75 0.25 1.00 0.41 0.59 Final Sat.: 1805 1900 1615 1805 1900 1615 1805 1380 449 1805 702 1029 ------------|---------------||---------------||---------------||---------------|Capacity Analysis Module:Vol/Sat: 0.01 0.32 0.04 0.04 0.52 0.16 0.24 0.10 0.10 0.01 0.11 0.11 Crit Moves: **** **** **** **** Green/Cycle: 0.49 0.48 0.52 0.56 0.53 0.78 0.38 0.32 0.32 0.15 0.11 0.11 Volume/Cap: 0.13 0.66 0.08 0.24 0.97 0.20 0.84 0.30 0.30 0.11 0.97 0.97 Delay/Veh: 25.5 21.6 12.1 13.9 44.4 2.8 37.0 26.0 26.0 36.8 102 101.7 User DelAdj: 1.00 1.00 1.00 1.00 1.00 1.00 1.00 1.00 1.00 1.00 1.00 1.00 AdjDel/Veh: 25.5 21.6 12.1 13.9 44.4 2.8 37.0 26.0 26.0 36.8 102 101.7 LOS by Move: C C B B D A D C C D F F HCM2kAvgQ: 0 15 1 1 36 2 15 4 4 1 10 10 ********************************************************************************Note: Queue reported is the number of cars per lane.

********************************************************************************
Existing PM Tue Nov 6, 2007 11:05:19 Page 8-1 -------------------------------------------------------------------------------- Palani Affordable Housing Existing Conditions PM Peak Hour -------------------------------------------------------------------------------- Level Of Service Computation Report 2000 HCM Unsignalized Method (Base Volume Alternative) ********************************************************************************Intersection #8 Palihiolo St/Palani Rd ********************************************************************************Average Delay (sec/veh): 1.7 Worst Case Level Of Service: F[ 59.5]********************************************************************************Street Name: Palihiolo St Palani Rd Approach: North Bound South Bound East Bound West Bound Movement: L - T - R L - T - R L - T - R L - T - R ------------|---------------||---------------||---------------||---------------|Control: Stop Sign Stop Sign Uncontrolled UncontrolledRights: Include Include Include Include Lanes: 0 0 1! 0 0 0 0 0 0 0 0 0 0 1 0 0 1 0 0 0 ------------|---------------||---------------||---------------||---------------|Volume Module:Base Vol: 23 0 26 0 0 0 0 798 11 39 1009 0 Growth Adj: 1.00 1.00 1.00 1.00 1.00 1.00 1.00 1.00 1.00 1.00 1.00 1.00 Initial Bse: 23 0 26 0 0 0 0 798 11 39 1009 0 User Adj: 1.00 1.00 1.00 1.00 1.00 1.00 1.00 1.00 1.00 1.00 1.00 1.00 PHF Adj: 0.95 0.95 0.95 0.95 0.95 0.95 0.95 0.95 0.95 0.95 0.95 0.95 PHF Volume: 24 0 27 0 0 0 0 840 12 41 1062 0 Reduct Vol: 0 0 0 0 0 0 0 0 0 0 0 0 FinalVolume: 24 0 27 0 0 0 0 840 12 41 1062 0 ------------|---------------||---------------||---------------||---------------|Critical Gap Module:Critical Gp: 6.4 6.5 6.2 xxxxx xxxx xxxxx xxxxx xxxx xxxxx 4.1 xxxx xxxxx FollowUpTim: 3.5 4.0 3.3 xxxxx xxxx xxxxx xxxxx xxxx xxxxx 2.2 xxxx xxxxx ------------|---------------||---------------||---------------||---------------|Capacity Module:Cnflict Vol: 1990 1990 846 xxxx xxxx xxxxx xxxx xxxx xxxxx 852 xxxx xxxxx Potent Cap.: 68 61 365 xxxx xxxx xxxxx xxxx xxxx xxxxx 796 xxxx xxxxx Move Cap.: 65 58 365 xxxx xxxx xxxxx xxxx xxxx xxxxx 796 xxxx xxxxx Volume/Cap: 0.37 0.00 0.07 xxxx xxxx xxxx xxxx xxxx xxxx 0.05 xxxx xxxx ------------|---------------||---------------||---------------||---------------|Level Of Service Module:2Way95thQ: xxxx xxxx xxxxx xxxx xxxx xxxxx xxxx xxxx xxxxx 0.2 xxxx xxxxx Control Del:xxxxx xxxx xxxxx xxxxx xxxx xxxxx xxxxx xxxx xxxxx 9.8 xxxx xxxxx LOS by Move: * * * * * * * * * A * * Movement: LT - LTR - RT LT - LTR - RT LT - LTR - RT LT - LTR - RT Shared Cap.: xxxx 115 xxxxx xxxx xxxx xxxxx xxxx xxxx xxxxx xxxx xxxx xxxxx SharedQueue:xxxxx 2.0 xxxxx xxxxx xxxx xxxxx xxxxx xxxx xxxxx 0.2 xxxx xxxxx Shrd ConDel:xxxxx 59.5 xxxxx xxxxx xxxx xxxxx xxxxx xxxx xxxxx 9.8 xxxx xxxxx Shared LOS: * F * * * * * * * A * * ApproachDel: 59.5 xxxxxx xxxxxx xxxxxxApproachLOS: F * * * ********************************************************************************Note: Queue reported is the number of cars per lane.

********************************************************************************
Existing PM Tue Nov 6, 2007 11:05:19 Page 9-1 -------------------------------------------------------------------------------- Palani Affordable Housing Existing Conditions PM Peak Hour -------------------------------------------------------------------------------- Level Of Service Computation Report 2000 HCM Unsignalized Method (Base Volume Alternative) ********************************************************************************Intersection #9 Kealakaa St/Palani ********************************************************************************Average Delay (sec/veh): 5.5 Worst Case Level Of Service: D[ 32.5]********************************************************************************Street Name: Kealakaa St Palani Rd Approach: North Bound South Bound East Bound West Bound Movement: L - T - R L - T - R L - T - R L - T - R ------------|---------------||---------------||---------------||---------------|Control: Stop Sign Stop Sign Uncontrolled UncontrolledRights: Include Include Include Include Lanes: 0 0 0 0 0 1 0 0 0 1 0 1 0 0 0 0 0 0 1 0 ------------|---------------||---------------||---------------||---------------|Volume Module:Base Vol: 0 0 0 6 0 225 224 557 0 0 795 18 Growth Adj: 1.00 1.00 1.00 1.00 1.00 1.00 1.00 1.00 1.00 1.00 1.00 1.00 Initial Bse: 0 0 0 6 0 225 224 557 0 0 795 18 User Adj: 1.00 1.00 1.00 1.00 1.00 1.00 1.00 1.00 1.00 1.00 1.00 1.00 PHF Adj: 0.95 0.95 0.95 0.95 0.95 0.95 0.95 0.95 0.95 0.95 0.95 0.95 PHF Volume: 0 0 0 6 0 237 236 586 0 0 837 19 Reduct Vol: 0 0 0 0 0 0 0 0 0 0 0 0 FinalVolume: 0 0 0 6 0 237 236 586 0 0 837 19 ------------|---------------||---------------||---------------||---------------|Critical Gap Module:Critical Gp:xxxxx xxxx xxxxx 6.4 xxxx 6.2 4.1 xxxx xxxxx xxxxx xxxx xxxxx FollowUpTim:xxxxx xxxx xxxxx 3.5 xxxx 3.3 2.2 xxxx xxxxx xxxxx xxxx xxxxx ------------|---------------||---------------||---------------||---------------|Capacity Module:Cnflict Vol: xxxx xxxx xxxxx 1904 xxxx 846 856 xxxx xxxxx xxxx xxxx xxxxx Potent Cap.: xxxx xxxx xxxxx 77 xxxx 365 793 xxxx xxxxx xxxx xxxx xxxxx Move Cap.: xxxx xxxx xxxxx 56 xxxx 365 793 xxxx xxxxx xxxx xxxx xxxxx Volume/Cap: xxxx xxxx xxxx 0.11 xxxx 0.65 0.30 xxxx xxxx xxxx xxxx xxxx ------------|---------------||---------------||---------------||---------------|Level Of Service Module:2Way95thQ: xxxx xxxx xxxxx 0.4 xxxx 4.4 1.2 xxxx xxxxx xxxx xxxx xxxxx Control Del:xxxxx xxxx xxxxx 77.0 xxxx 31.3 11.5 xxxx xxxxx xxxxx xxxx xxxxx LOS by Move: * * * F * D B * * * * * Movement: LT - LTR - RT LT - LTR - RT LT - LTR - RT LT - LTR - RT Shared Cap.: xxxx xxxx xxxxx xxxx xxxx xxxxx xxxx xxxx xxxxx xxxx xxxx xxxxx SharedQueue:xxxxx xxxx xxxxx xxxxx xxxx xxxxx 1.2 xxxx xxxxx xxxxx xxxx xxxxx Shrd ConDel:xxxxx xxxx xxxxx xxxxx xxxx xxxxx 11.5 xxxx xxxxx xxxxx xxxx xxxxx Shared LOS: * * * * * * B * * * * * ApproachDel: xxxxxx 32.5 xxxxxx xxxxxxApproachLOS: * D * * ********************************************************************************Note: Queue reported is the number of cars per lane.

Note: Queue reported is the number of cars per lane.********************************************************************************
Existing PM Tue Nov 6, 2007 11:05:19 Page 10-1 -------------------------------------------------------------------------------- Palani Affordable Housing Existing Conditions PM Peak Hour -------------------------------------------------------------------------------- Level Of Service Computation Report 2000 HCM Unsignalized Method (Base Volume Alternative) ********************************************************************************Intersection #10 Palani Rd / Uluaoa St ********************************************************************************Average Delay (sec/veh): 3.5 Worst Case Level Of Service: F[ 53.3]********************************************************************************Street Name: Palani Rd Uluaoa St Approach: North Bound South Bound East Bound West Bound Movement: L - T - R L - T - R L - T - R L - T - R ------------|---------------||---------------||---------------||---------------|Control: Uncontrolled Uncontrolled Stop Sign Stop Sign Rights: Include Include Include Include Lanes: 0 1 0 0 0 0 0 0 1 0 1 0 0 0 1 0 0 0 0 0 ------------|---------------||---------------||---------------||---------------|Volume Module:Base Vol: 23 556 0 0 789 145 71 0 32 0 0 0 Growth Adj: 1.00 1.00 1.00 1.00 1.00 1.00 1.00 1.00 1.00 1.00 1.00 1.00 Initial Bse: 23 556 0 0 789 145 71 0 32 0 0 0 User Adj: 1.00 1.00 1.00 1.00 1.00 1.00 1.00 1.00 1.00 1.00 1.00 1.00 PHF Adj: 0.95 0.95 0.95 0.95 0.95 0.95 0.95 0.95 0.95 0.95 0.95 0.95 PHF Volume: 24 585 0 0 831 153 75 0 34 0 0 0 Reduct Vol: 0 0 0 0 0 0 0 0 0 0 0 0 FinalVolume: 24 585 0 0 831 153 75 0 34 0 0 0 ------------|---------------||---------------||---------------||---------------|Critical Gap Module:Critical Gp: 4.1 xxxx xxxxx xxxxx xxxx xxxxx 6.4 xxxx 6.2 xxxxx xxxx xxxxx FollowUpTim: 2.2 xxxx xxxxx xxxxx xxxx xxxxx 3.5 xxxx 3.3 xxxxx xxxx xxxxx ------------|---------------||---------------||---------------||---------------|Capacity Module:Cnflict Vol: 983 xxxx xxxxx xxxx xxxx xxxxx 1541 xxxx 907 xxxx xxxx xxxxx Potent Cap.: 710 xxxx xxxxx xxxx xxxx xxxxx 128 xxxx 337 xxxx xxxx xxxxx Move Cap.: 710 xxxx xxxxx xxxx xxxx xxxxx 125 xxxx 337 xxxx xxxx xxxxx Volume/Cap: 0.03 xxxx xxxx xxxx xxxx xxxx 0.60 xxxx 0.10 xxxx xxxx xxxx ------------|---------------||---------------||---------------||---------------|Level Of Service Module:2Way95thQ: 0.1 xxxx xxxxx xxxx xxxx xxxxx 3.0 xxxx 0.3 xxxx xxxx xxxxx Control Del: 10.2 xxxx xxxxx xxxxx xxxx xxxxx 69.7 xxxx 16.9 xxxxx xxxx xxxxx LOS by Move: B * * * * * F * C * * * Movement: LT - LTR - RT LT - LTR - RT LT - LTR - RT LT - LTR - RT Shared Cap.: xxxx xxxx xxxxx xxxx xxxx xxxxx xxxx xxxx xxxxx xxxx xxxx xxxxx SharedQueue: 0.1 xxxx xxxxx xxxxx xxxx xxxxx xxxxx xxxx xxxxx xxxxx xxxx xxxxx Shrd ConDel: 10.2 xxxx xxxxx xxxxx xxxx xxxxx xxxxx xxxx xxxxx xxxxx xxxx xxxxx Shared LOS: B * * * * * * * * * * * ApproachDel: xxxxxx xxxxxx 53.3 xxxxxxApproachLOS: * * F * ********************************************************************************

Note: Queue reported is the number of cars per lane.********************************************************************************
Existing PM Tue Nov 6, 2007 11:05:20 Page 11-1 -------------------------------------------------------------------------------- Palani Affordable Housing Existing Conditions PM Peak Hour -------------------------------------------------------------------------------- Level Of Service Computation Report 2000 HCM Operations Method (Base Volume Alternative) ********************************************************************************Intersection #11 Queen Kaahumanu Hwy / Kealakehe Pkwy ********************************************************************************Cycle (sec): 100 Critical Vol./Cap.(X): 0.652Loss Time (sec): 10 (Y+R=4.0 sec) Average Delay (sec/veh): 10.5Optimal Cycle: 48 Level Of Service: B********************************************************************************Street Name: Queen Kaahumanu Hwy Kaalakehe Pkwy Approach: North Bound South Bound East Bound West Bound Movement: L - T - R L - T - R L - T - R L - T - R ------------|---------------||---------------||---------------||---------------|Control: Prot+Permit Prot+Permit Permitted Permitted Rights: Ovl Ovl Ovl Ovl Min. Green: 0 0 0 0 0 0 0 0 0 0 0 0 Lanes: 1 0 1 0 1 1 0 1 0 1 0 1 0 0 1 0 1 0 0 1 ------------|---------------||---------------||---------------||---------------|Volume Module:Base Vol: 56 907 143 44 777 65 63 7 57 60 6 55 Growth Adj: 1.00 1.00 1.00 1.00 1.00 1.00 1.00 1.00 1.00 1.00 1.00 1.00 Initial Bse: 56 907 143 44 777 65 63 7 57 60 6 55 User Adj: 1.00 1.00 1.00 1.00 1.00 1.00 1.00 1.00 1.00 1.00 1.00 1.00 PHF Adj: 0.95 0.95 0.95 0.95 0.95 0.95 0.95 0.95 0.95 0.95 0.95 0.95 PHF Volume: 59 955 151 46 818 68 66 7 60 63 6 58 Reduct Vol: 0 0 0 0 0 0 0 0 0 0 0 0 Reduced Vol: 59 955 151 46 818 68 66 7 60 63 6 58 PCE Adj: 1.00 1.00 1.00 1.00 1.00 1.00 1.00 1.00 1.00 1.00 1.00 1.00 MLF Adj: 1.00 1.00 1.00 1.00 1.00 1.00 1.00 1.00 1.00 1.00 1.00 1.00 FinalVolume: 59 955 151 46 818 68 66 7 60 63 6 58 ------------|---------------||---------------||---------------||---------------|Saturation Flow Module:Sat/Lane: 1900 1900 1900 1900 1900 1900 1900 1900 1900 1900 1900 1900 Adjustment: 0.95 1.00 0.85 0.95 1.00 0.85 0.67 0.67 0.85 0.64 0.64 0.85 Lanes: 1.00 1.00 1.00 1.00 1.00 1.00 0.90 0.10 1.00 0.91 0.09 1.00 Final Sat.: 1805 1900 1615 1805 1900 1615 1137 126 1615 1104 110 1615 ------------|---------------||---------------||---------------||---------------|Capacity Analysis Module:Vol/Sat: 0.03 0.50 0.09 0.03 0.43 0.04 0.06 0.06 0.04 0.06 0.06 0.04 Crit Moves: **** **** **** Green/Cycle: 0.84 0.77 0.77 0.79 0.75 0.75 0.09 0.09 0.15 0.09 0.09 0.13 Volume/Cap: 0.12 0.65 0.12 0.12 0.57 0.06 0.65 0.65 0.25 0.64 0.64 0.28 Delay/Veh: 3.7 6.3 2.9 4.7 5.9 3.2 56.8 56.8 38.4 56.1 56.1 40.1 User DelAdj: 1.00 1.00 1.00 1.00 1.00 1.00 1.00 1.00 1.00 1.00 1.00 1.00 AdjDel/Veh: 3.7 6.3 2.9 4.7 5.9 3.2 56.8 56.8 38.4 56.1 56.1 40.1 LOS by Move: A A A A A A E E D E E D HCM2kAvgQ: 0 14 1 0 11 1 3 3 2 3 3 2 ********************************************************************************

Note: Queue reported is the number of cars per lane.********************************************************************************
Existing PM Tue Nov 6, 2007 11:05:20 Page 12-1 -------------------------------------------------------------------------------- Palani Affordable Housing Existing Conditions PM Peak Hour -------------------------------------------------------------------------------- Level Of Service Computation Report 2000 HCM Unsignalized Method (Base Volume Alternative) ********************************************************************************Intersection #12 Ane Keohokalole Hwy / Kealakehe Pkwy ********************************************************************************Average Delay (sec/veh): 1.7 Worst Case Level Of Service: B[ 10.5]********************************************************************************Street Name: Ane Jeohokalole Hwy Kealakehe Pkwy Approach: North Bound South Bound East Bound West Bound Movement: L - T - R L - T - R L - T - R L - T - R ------------|---------------||---------------||---------------||---------------|Control: Stop Sign Stop Sign Uncontrolled UncontrolledRights: Include Include Include Include Lanes: 1 0 1 0 1 1 0 0 1 0 1 0 1 1 0 1 0 1 0 1 ------------|---------------||---------------||---------------||---------------|Volume Module:Base Vol: 58 0 0 0 0 0 0 114 123 5 72 0 Growth Adj: 1.00 1.00 1.00 1.00 1.00 1.00 1.00 1.00 1.00 1.00 1.00 1.00 Initial Bse: 58 0 0 0 0 0 0 114 123 5 72 0 User Adj: 1.00 1.00 1.00 1.00 1.00 1.00 1.00 1.00 1.00 1.00 1.00 1.00 PHF Adj: 0.95 0.95 0.95 0.95 0.95 0.95 0.95 0.95 0.95 0.95 0.95 0.95 PHF Volume: 61 0 0 0 0 0 0 120 129 5 76 0 Reduct Vol: 0 0 0 0 0 0 0 0 0 0 0 0 FinalVolume: 61 0 0 0 0 0 0 120 129 5 76 0 ------------|---------------||---------------||---------------||---------------|Critical Gap Module:Critical Gp: 6.4 6.5 6.2 7.1 6.5 6.2 xxxxx xxxx xxxxx 4.1 xxxx xxxxx FollowUpTim: 3.5 4.0 3.3 3.5 4.0 3.3 xxxxx xxxx xxxxx 2.2 xxxx xxxxx ------------|---------------||---------------||---------------||---------------|Capacity Module:Cnflict Vol: 271 271 125 146 336 76 xxxx xxxx xxxxx 249 xxxx xxxxx Potent Cap.: 723 639 931 827 588 991 xxxx xxxx xxxxx 1328 xxxx xxxxx Move Cap.: 720 636 931 824 586 991 xxxx xxxx xxxxx 1328 xxxx xxxxx Volume/Cap: 0.08 0.00 0.00 0.00 0.00 0.00 xxxx xxxx xxxx 0.00 xxxx xxxx ------------|---------------||---------------||---------------||---------------|Level Of Service Module:2Way95thQ: 0.3 xxxx xxxxx xxxx xxxx xxxxx xxxx xxxx xxxxx 0.0 xxxx xxxxx Control Del: 10.5 xxxx xxxxx xxxxx xxxx xxxxx xxxxx xxxx xxxxx 7.7 xxxx xxxxx LOS by Move: B * * * * * * * * A * * Movement: LT - LTR - RT LT - LTR - RT LT - LTR - RT LT - LTR - RT Shared Cap.: xxxx xxxx xxxxx xxxx xxxx 0 xxxx xxxx xxxxx xxxx xxxx xxxxx SharedQueue:xxxxx xxxx xxxxx xxxxx xxxx xxxxx xxxxx xxxx xxxxx xxxxx xxxx xxxxx Shrd ConDel:xxxxx xxxx xxxxx xxxxx xxxx xxxxx xxxxx xxxx xxxxx xxxxx xxxx xxxxx Shared LOS: * * * * * * * * * * * * ApproachDel: 10.5 xxxxxx xxxxxx xxxxxxApproachLOS: B * * * ********************************************************************************

CUMULATIVE BASE CONDITIONS

CB_AM Tue Nov 6, 2007 11:34:21 Page 3-1 ---------------------------------------------------------------------------------------------------------------------------------------------------------------- Level Of Service Computation Report 2000 HCM Operations Method (Base Volume Alternative) ********************************************************************************Intersection #1 Queen Kaahumanu Hwy / Henry St ********************************************************************************Cycle (sec): 100 Critical Vol./Cap.(X): 0.813Loss Time (sec): 10 (Y+R=4.0 sec) Average Delay (sec/veh): 26.1Optimal Cycle: 74 Level Of Service: C********************************************************************************Street Name: Queen Kaahumanu Hwy Henry St Approach: North Bound South Bound East Bound West Bound Movement: L - T - R L - T - R L - T - R L - T - R ------------|---------------||---------------||---------------||---------------|Control: Prot+Permit Prot+Permit Prot+Permit Prot+Permit Rights: Ovl Ovl Ovl Ovl Min. Green: 0 0 0 0 0 0 0 0 0 0 0 0 Lanes: 1 0 2 0 1 1 0 3 0 1 1 0 2 0 1 1 1 1 0 1 ------------|---------------||---------------||---------------||---------------|Volume Module:Base Vol: 320 749 878 130 509 132 76 286 25 577 529 99 Growth Adj: 1.00 1.00 1.00 1.00 1.00 1.00 1.00 1.00 1.00 1.00 1.00 1.00 Initial Bse: 320 749 878 130 509 132 76 286 25 577 529 99 User Adj: 1.00 1.00 1.00 1.00 1.00 1.00 1.00 1.00 1.00 1.00 1.00 1.00 PHF Adj: 0.95 0.95 0.95 0.95 0.95 0.95 0.95 0.95 0.95 0.95 0.95 0.95 PHF Volume: 337 788 924 137 536 139 80 301 26 607 557 104 Reduct Vol: 0 0 0 0 0 0 0 0 0 0 0 0 Reduced Vol: 337 788 924 137 536 139 80 301 26 607 557 104 PCE Adj: 1.00 1.00 1.00 1.00 1.00 1.00 1.00 1.00 1.00 1.00 1.00 1.00 MLF Adj: 1.00 1.00 1.00 1.00 1.00 1.00 1.00 1.00 1.00 1.00 1.00 1.00 FinalVolume: 337 788 924 137 536 139 80 301 26 607 557 104 ------------|---------------||---------------||---------------||---------------|Saturation Flow Module:Sat/Lane: 1900 1900 1900 1900 1900 1900 1900 1900 1900 1900 1900 1900 Adjustment: 0.95 0.95 0.85 0.95 0.91 0.85 0.95 0.95 0.85 0.92 0.93 0.85 Lanes: 1.00 2.00 1.00 1.00 3.00 1.00 1.00 2.00 1.00 1.57 1.43 1.00 Final Sat.: 1805 3610 1615 1805 5187 1615 1805 3610 1615 2754 2525 1615 ------------|---------------||---------------||---------------||---------------|Capacity Analysis Module:Vol/Sat: 0.19 0.22 0.57 0.08 0.10 0.09 0.04 0.08 0.02 0.22 0.22 0.06 Crit Moves: **** **** **** **** Green/Cycle: 0.55 0.43 0.70 0.28 0.19 0.25 0.17 0.10 0.44 0.39 0.31 0.40 Volume/Cap: 0.47 0.50 0.81 0.47 0.55 0.34 0.40 0.81 0.04 0.64 0.71 0.16 Uniform Del: 13.1 20.6 10.2 28.0 36.8 30.8 36.5 43.9 15.9 23.6 30.4 18.9 IncremntDel: 0.5 0.3 4.6 1.2 0.7 0.5 1.3 12.8 0.0 0.8 1.5 0.1 InitQueuDel: 0.0 0.0 0.0 0.0 0.0 0.0 0.0 0.0 0.0 0.0 0.0 0.0 Delay Adj: 1.00 1.00 1.00 1.00 1.00 1.00 1.00 1.00 1.00 1.00 1.00 1.00 Delay/Veh: 13.6 20.8 14.8 29.2 37.5 31.3 37.8 56.8 15.9 24.4 31.9 19.1 User DelAdj: 1.00 1.00 1.00 1.00 1.00 1.00 1.00 1.00 1.00 1.00 1.00 1.00 AdjDel/Veh: 13.6 20.8 14.8 29.2 37.5 31.3 37.8 56.8 15.9 24.4 31.9 19.1 LOS by Move: B C B C D C D E B C C B HCM2kAvgQ: 7 9 22 4 6 4 3 7 0 11 12 2 ********************************************************************************Note: Queue reported is the number of cars per lane.********************************************************************************

********************************************************************************
CB_AM Tue Nov 6, 2007 11:34:21 Page 4-1 ---------------------------------------------------------------------------------------------------------------------------------------------------------------- Level Of Service Computation Report 2000 HCM Operations Method (Base Volume Alternative) ********************************************************************************Intersection #2 Queen Kaahumanu Hwy / Alli Dr ********************************************************************************Cycle (sec): 100 Critical Vol./Cap.(X): 0.873Loss Time (sec): 10 (Y+R=4.0 sec) Average Delay (sec/veh): 33.3Optimal Cycle: 93 Level Of Service: C********************************************************************************Street Name: Queen Kaahumanu Hwy Alli Dr Approach: North Bound South Bound East Bound West Bound Movement: L - T - R L - T - R L - T - R L - T - R ------------|---------------||---------------||---------------||---------------|Control: Prot+Permit Prot+Permit Prot+Permit Prot+Permit Rights: Ovl Ovl Ovl Ovl Min. Green: 0 0 0 0 0 0 0 0 0 0 0 0 Lanes: 1 0 2 0 1 1 0 2 0 1 1 0 1 0 1 1 0 1 0 1 ------------|---------------||---------------||---------------||---------------|Volume Module:Base Vol: 97 807 20 126 655 372 193 144 99 32 658 51 Growth Adj: 1.00 1.00 1.00 1.00 1.00 1.00 1.00 1.00 1.00 1.00 1.00 1.00 Initial Bse: 97 807 20 126 655 372 193 144 99 32 658 51 User Adj: 1.00 1.00 1.00 1.00 1.00 1.00 1.00 1.00 1.00 1.00 1.00 1.00 PHF Adj: 0.95 0.95 0.95 0.95 0.95 0.95 0.95 0.95 0.95 0.95 0.95 0.95 PHF Volume: 102 849 21 133 689 392 203 152 104 34 693 54 Reduct Vol: 0 0 0 0 0 0 0 0 0 0 0 0 Reduced Vol: 102 849 21 133 689 392 203 152 104 34 693 54 PCE Adj: 1.00 1.00 1.00 1.00 1.00 1.00 1.00 1.00 1.00 1.00 1.00 1.00 MLF Adj: 1.00 1.00 1.00 1.00 1.00 1.00 1.00 1.00 1.00 1.00 1.00 1.00 FinalVolume: 102 849 21 133 689 392 203 152 104 34 693 54 ------------|---------------||---------------||---------------||---------------|Saturation Flow Module:Sat/Lane: 1900 1900 1900 1900 1900 1900 1900 1900 1900 1900 1900 1900 Adjustment: 0.95 0.95 0.85 0.95 0.95 0.85 0.95 1.00 0.85 0.95 1.00 0.85 Lanes: 1.00 2.00 1.00 1.00 2.00 1.00 1.00 1.00 1.00 1.00 1.00 1.00 Final Sat.: 1805 3610 1615 1805 3610 1615 1805 1900 1615 1805 1900 1615 ------------|---------------||---------------||---------------||---------------|Capacity Analysis Module:Vol/Sat: 0.06 0.24 0.01 0.07 0.19 0.24 0.11 0.08 0.06 0.02 0.36 0.03 Crit Moves: **** **** **** **** Green/Cycle: 0.35 0.27 0.37 0.37 0.27 0.40 0.57 0.44 0.52 0.52 0.42 0.50 Volume/Cap: 0.45 0.87 0.03 0.59 0.70 0.60 0.66 0.18 0.12 0.05 0.87 0.07 Uniform Del: 23.8 34.9 19.9 24.0 32.7 23.6 22.0 16.9 12.1 11.7 26.7 12.8 IncremntDel: 1.4 8.8 0.0 3.9 2.3 1.6 5.2 0.1 0.1 0.0 10.5 0.0 InitQueuDel: 0.0 0.0 0.0 0.0 0.0 0.0 0.0 0.0 0.0 0.0 0.0 0.0 Delay Adj: 1.00 1.00 1.00 1.00 1.00 1.00 1.00 1.00 1.00 1.00 1.00 1.00 Delay/Veh: 25.2 43.7 19.9 28.0 34.9 25.2 27.2 17.0 12.2 11.7 37.2 12.9 User DelAdj: 1.00 1.00 1.00 1.00 1.00 1.00 1.00 1.00 1.00 1.00 1.00 1.00 AdjDel/Veh: 25.2 43.7 19.9 28.0 34.9 25.2 27.2 17.0 12.2 11.7 37.2 12.9 LOS by Move: C D B C C C C B B B D B HCM2kAvgQ: 3 16 0 4 11 10 6 3 2 1 23 1 ********************************************************************************Note: Queue reported is the number of cars per lane.

********************************************************************************
CB_AM Tue Nov 6, 2007 11:34:21 Page 5-1 ---------------------------------------------------------------------------------------------------------------------------------------------------------------- Level Of Service Computation Report 2000 HCM Unsignalized Method (Base Volume Alternative) ********************************************************************************Intersection #3 Kamakaeha Ave / Palani Rd ********************************************************************************Average Delay (sec/veh): 1.2 Worst Case Level Of Service: C[ 22.5]********************************************************************************Street Name: Kamakaeha Ave Palani Rd Approach: North Bound South Bound East Bound West Bound Movement: L - T - R L - T - R L - T - R L - T - R ------------|---------------||---------------||---------------||---------------|Control: Stop Sign Stop Sign Uncontrolled UncontrolledRights: Include Include Include Ignore Lanes: 0 0 0 0 0 1 0 0 0 1 0 0 1 0 0 0 0 1 0 1 ------------|---------------||---------------||---------------||---------------|Volume Module:Base Vol: 0 0 0 47 0 15 0 290 0 0 775 240 Growth Adj: 1.00 1.00 1.00 1.00 1.00 1.00 1.00 1.00 1.00 1.00 1.00 1.00 Initial Bse: 0 0 0 47 0 15 0 290 0 0 775 240 User Adj: 1.00 1.00 1.00 1.00 1.00 1.00 1.00 1.00 1.00 1.00 1.00 0.00 PHF Adj: 0.95 0.95 0.95 0.95 0.95 0.95 0.95 0.95 0.95 0.95 0.95 0.00 PHF Volume: 0 0 0 49 0 16 0 305 0 0 816 0 Reduct Vol: 0 0 0 0 0 0 0 0 0 0 0 0 FinalVolume: 0 0 0 49 0 16 0 305 0 0 816 0 ------------|---------------||---------------||---------------||---------------|Critical Gap Module:Critical Gp:xxxxx xxxx xxxxx 6.4 xxxx 6.2 xxxxx xxxx xxxxx xxxxx xxxx xxxxx FollowUpTim:xxxxx xxxx xxxxx 3.5 xxxx 3.3 xxxxx xxxx xxxxx xxxxx xxxx xxxxx ------------|---------------||---------------||---------------||---------------|Capacity Module:Cnflict Vol: xxxx xxxx xxxxx 1121 xxxx 816 xxxx xxxx xxxxx xxxx xxxx xxxxx Potent Cap.: xxxx xxxx xxxxx 230 xxxx 380 xxxx xxxx xxxxx xxxx xxxx xxxxx Move Cap.: xxxx xxxx xxxxx 230 xxxx 380 xxxx xxxx xxxxx xxxx xxxx xxxxx Volume/Cap: xxxx xxxx xxxx 0.21 xxxx 0.04 xxxx xxxx xxxx xxxx xxxx xxxx ------------|---------------||---------------||---------------||---------------|Level Of Service Module:2Way95thQ: xxxx xxxx xxxxx 0.8 xxxx 0.1 xxxx xxxx xxxxx xxxx xxxx xxxxx Control Del:xxxxx xxxx xxxxx 24.9 xxxx 14.9 xxxxx xxxx xxxxx xxxxx xxxx xxxxx LOS by Move: * * * C * B * * * * * * Movement: LT - LTR - RT LT - LTR - RT LT - LTR - RT LT - LTR - RT Shared Cap.: xxxx xxxx xxxxx xxxx xxxx xxxxx xxxx xxxx xxxxx xxxx xxxx xxxxx SharedQueue:xxxxx xxxx xxxxx xxxxx xxxx xxxxx xxxxx xxxx xxxxx xxxxx xxxx xxxxx Shrd ConDel:xxxxx xxxx xxxxx xxxxx xxxx xxxxx xxxxx xxxx xxxxx xxxxx xxxx xxxxx Shared LOS: * * * * * * * * * * * * ApproachDel: xxxxxx 22.5 xxxxxx xxxxxxApproachLOS: * C * * ********************************************************************************Note: Queue reported is the number of cars per lane.

********************************************************************************
CB_AM Tue Nov 6, 2007 11:34:22 Page 6-1 ---------------------------------------------------------------------------------------------------------------------------------------------------------------- Level Of Service Computation Report 2000 HCM Operations Method (Base Volume Alternative) ********************************************************************************Intersection #4 Henry St / Palani Rd ********************************************************************************Cycle (sec): 100 Critical Vol./Cap.(X): 1.099Loss Time (sec): 10 (Y+R=4.0 sec) Average Delay (sec/veh): 81.1Optimal Cycle: 180 Level Of Service: F********************************************************************************Street Name: Henry St Palani Rd Approach: North Bound South Bound East Bound West Bound Movement: L - T - R L - T - R L - T - R L - T - R ------------|---------------||---------------||---------------||---------------|Control: Permitted Permitted Permitted Prot+Permit Rights: Ovl Include Include Include Min. Green: 0 0 0 0 0 0 0 0 0 0 0 0 Lanes: 1 0 0 1 0 1 0 0 1 0 1 0 0 1 0 1 0 0 1 0 ------------|---------------||---------------||---------------||---------------|Volume Module:Base Vol: 122 234 454 31 372 217 123 185 37 900 810 90 Growth Adj: 1.00 1.00 1.00 1.00 1.00 1.00 1.00 1.00 1.00 1.00 1.00 1.00 Initial Bse: 122 234 454 31 372 217 123 185 37 900 810 90 User Adj: 1.00 1.00 1.00 1.00 1.00 1.00 1.00 1.00 1.00 1.00 1.00 1.00 PHF Adj: 0.95 0.95 0.95 0.95 0.95 0.95 0.95 0.95 0.95 0.95 0.95 0.95 PHF Volume: 128 246 478 33 392 228 129 195 39 947 853 95 Reduct Vol: 0 0 0 0 0 0 0 0 0 0 0 0 Reduced Vol: 128 246 478 33 392 228 129 195 39 947 853 95 PCE Adj: 1.00 1.00 1.00 1.00 1.00 1.00 1.00 1.00 1.00 1.00 1.00 1.00 MLF Adj: 1.00 1.00 1.00 1.00 1.00 1.00 1.00 1.00 1.00 1.00 1.00 1.00 FinalVolume: 128 246 478 33 392 228 129 195 39 947 853 95 ------------|---------------||---------------||---------------||---------------|Saturation Flow Module:Sat/Lane: 1900 1900 1900 1900 1900 1900 1900 1900 1900 1900 1900 1900 Adjustment: 0.16 0.90 0.90 0.09 0.95 0.95 0.95 0.98 0.98 0.96 0.99 0.99 Lanes: 1.00 0.34 0.66 1.00 0.63 0.37 1.00 0.83 0.17 1.00 0.90 0.10 Final Sat.: 312 582 1130 177 1134 661 1805 1544 309 1820 1684 187 ------------|---------------||---------------||---------------||---------------|Capacity Analysis Module:Vol/Sat: 0.41 0.42 0.42 0.18 0.35 0.35 0.07 0.13 0.13 0.52 0.51 0.51 Crit Moves: **** **** **** Green/Cycle: 0.35 0.35 0.79 0.35 0.35 0.35 0.07 0.11 0.11 0.48 0.48 0.48 Volume/Cap: 1.16 1.19 0.53 0.45 0.97 0.97 1.06 1.19 1.19 1.09 1.06 1.06 Uniform Del: 32.3 32.3 3.7 24.8 31.8 31.8 46.6 44.7 44.7 26.9 26.1 26.1 IncremntDel:135.9 103 0.4 4.5 29.1 29.1 98.2 126 126.2 59.5 47.1 47.1 InitQueuDel: 0.0 0.0 0.0 0.0 0.0 0.0 0.0 0.0 0.0 0.0 0.0 0.0 Delay Adj: 1.00 1.00 1.00 1.00 1.00 1.00 1.00 1.00 1.00 1.00 1.00 1.00 Delay/Veh: 168.2 135 4.1 29.3 61.0 61.0 144.8 171 170.9 86.3 73.2 73.2 User DelAdj: 1.00 1.00 1.00 1.00 1.00 1.00 1.00 1.00 1.00 1.00 1.00 1.00 AdjDel/Veh: 168.2 135 4.1 29.3 61.0 61.0 144.8 171 170.9 86.3 73.2 73.2 LOS by Move: F F A C E E F F F F E E HCM2kAvgQ: 9 39 8 1 25 25 8 15 15 43 41 41 ********************************************************************************Note: Queue reported is the number of cars per lane.

********************************************************************************
CB_AM Tue Nov 6, 2007 11:34:22 Page 8-1 ---------------------------------------------------------------------------------------------------------------------------------------------------------------- Level Of Service Computation Report 2000 HCM Operations Method (Base Volume Alternative) ********************************************************************************Intersection #6 Queen Kaahumanu Hwy / Makala Blvd ********************************************************************************Cycle (sec): 100 Critical Vol./Cap.(X): 0.653Loss Time (sec): 10 (Y+R=4.0 sec) Average Delay (sec/veh): 22.0Optimal Cycle: 48 Level Of Service: C********************************************************************************Street Name: Queen Kaahumanu Hwy Makala Blvd Approach: North Bound South Bound East Bound West Bound Movement: L - T - R L - T - R L - T - R L - T - R ------------|---------------||---------------||---------------||---------------|Control: Prot+Permit Prot+Permit Prot+Permit Prot+Permit Rights: Ovl Ovl Include Include Min. Green: 0 0 0 0 0 0 0 0 0 0 0 0 Lanes: 1 0 2 0 1 1 0 2 0 1 1 0 0 1 0 1 0 0 1 0 ------------|---------------||---------------||---------------||---------------|Volume Module:Base Vol: 10 902 30 68 840 200 309 72 32 7 21 143 Growth Adj: 1.00 1.00 1.00 1.00 1.00 1.00 1.00 1.00 1.00 1.00 1.00 1.00 Initial Bse: 10 902 30 68 840 200 309 72 32 7 21 143 User Adj: 1.00 1.00 1.00 1.00 1.00 1.00 1.00 1.00 1.00 1.00 1.00 1.00 PHF Adj: 0.95 0.95 0.95 0.95 0.95 0.95 0.95 0.95 0.95 0.95 0.95 0.95 PHF Volume: 11 949 32 72 884 211 325 76 34 7 22 151 Reduct Vol: 0 0 0 0 0 0 0 0 0 0 0 0 Reduced Vol: 11 949 32 72 884 211 325 76 34 7 22 151 PCE Adj: 1.00 1.00 1.00 1.00 1.00 1.00 1.00 1.00 1.00 1.00 1.00 1.00 MLF Adj: 1.00 1.00 1.00 1.00 1.00 1.00 1.00 1.00 1.00 1.00 1.00 1.00 FinalVolume: 11 949 32 72 884 211 325 76 34 7 22 151 ------------|---------------||---------------||---------------||---------------|Saturation Flow Module:Sat/Lane: 1900 1900 1900 1900 1900 1900 1900 1900 1900 1900 1900 1900 Adjustment: 0.95 0.95 0.85 0.95 0.95 0.85 0.95 0.95 0.95 0.95 0.87 0.87 Lanes: 1.00 2.00 1.00 1.00 2.00 1.00 1.00 0.69 0.31 1.00 0.13 0.87 Final Sat.: 1805 3610 1615 1805 3610 1615 1805 1255 558 1805 211 1440 ------------|---------------||---------------||---------------||---------------|Capacity Analysis Module:Vol/Sat: 0.01 0.26 0.02 0.04 0.24 0.13 0.18 0.06 0.06 0.00 0.10 0.10 Crit Moves: **** **** **** **** Green/Cycle: 0.41 0.40 0.43 0.48 0.45 0.73 0.46 0.41 0.41 0.19 0.16 0.16 Volume/Cap: 0.05 0.65 0.05 0.32 0.54 0.18 0.53 0.15 0.15 0.03 0.65 0.65 Uniform Del: 18.0 24.2 16.5 16.6 19.8 4.2 18.2 18.6 18.6 33.1 39.4 39.4 IncremntDel: 0.1 1.1 0.0 0.8 0.4 0.1 0.9 0.1 0.1 0.0 5.7 5.7 InitQueuDel: 0.0 0.0 0.0 0.0 0.0 0.0 0.0 0.0 0.0 0.0 0.0 0.0 Delay Adj: 1.00 1.00 1.00 1.00 1.00 1.00 1.00 1.00 1.00 1.00 1.00 1.00 Delay/Veh: 18.1 25.3 16.6 17.4 20.2 4.3 19.1 18.7 18.7 33.2 45.1 45.1 User DelAdj: 1.00 1.00 1.00 1.00 1.00 1.00 1.00 1.00 1.00 1.00 1.00 1.00 AdjDel/Veh: 18.1 25.3 16.6 17.4 20.2 4.3 19.1 18.7 18.7 33.2 45.1 45.1 LOS by Move: B C B B C A B B B C D D HCM2kAvgQ: 0 13 1 2 11 2 8 2 2 0 6 6 ********************************************************************************Note: Queue reported is the number of cars per lane.

Note: Queue reported is the number of cars per lane.********************************************************************************
CB_AM Tue Nov 6, 2007 11:34:22 Page 10-1 ---------------------------------------------------------------------------------------------------------------------------------------------------------------- Level Of Service Computation Report 2000 HCM Operations Method (Base Volume Alternative) ********************************************************************************Intersection #8 Palihiolo St/Palani Rd ********************************************************************************Cycle (sec): 100 Critical Vol./Cap.(X): 1.522Loss Time (sec): 10 (Y+R=4.0 sec) Average Delay (sec/veh): 171.2Optimal Cycle: 180 Level Of Service: F********************************************************************************Street Name: Palihiolo St Palani Rd Approach: North Bound South Bound East Bound West Bound Movement: L - T - R L - T - R L - T - R L - T - R ------------|---------------||---------------||---------------||---------------|Control: Permitted Permitted Prot+Permit Permitted Rights: Include Include Include Ignore Min. Green: 0 0 0 0 0 0 0 0 0 0 0 0 Lanes: 0 1 0 0 1 1 0 0 1 0 1 0 0 1 0 1 0 1 0 1 ------------|---------------||---------------||---------------||---------------|Volume Module:Base Vol: 5 20 32 10 15 521 438 476 6 20 1254 56 Growth Adj: 1.00 1.00 1.00 1.00 1.00 1.00 1.00 1.00 1.00 1.00 1.00 1.00 Initial Bse: 5 20 32 10 15 521 438 476 6 20 1254 56 User Adj: 1.00 1.00 1.00 1.00 1.00 1.00 1.00 1.00 1.00 1.00 1.00 0.00 PHF Adj: 0.95 0.95 0.95 0.95 0.95 0.95 0.95 0.95 0.95 0.95 0.95 0.00 PHF Volume: 5 21 34 11 16 548 461 501 6 21 1320 0 Reduct Vol: 0 0 0 0 0 0 0 0 0 0 0 0 Reduced Vol: 5 21 34 11 16 548 461 501 6 21 1320 0 PCE Adj: 1.00 1.00 1.00 1.00 1.00 1.00 1.00 1.00 1.00 1.00 1.00 0.00 MLF Adj: 1.00 1.00 1.00 1.00 1.00 1.00 1.00 1.00 1.00 1.00 1.00 0.00 FinalVolume: 5 21 34 11 16 548 461 501 6 21 1320 0 ------------|---------------||---------------||---------------||---------------|Saturation Flow Module:Sat/Lane: 1900 1900 1900 1900 1900 1900 1900 1900 1900 1900 1900 1900 Adjustment: 0.64 0.64 0.85 0.75 0.85 0.85 0.24 1.00 1.00 0.95 1.00 1.00 Lanes: 0.20 0.80 1.00 1.00 0.03 0.97 1.00 0.99 0.01 1.00 1.00 1.00 Final Sat.: 243 973 1615 1419 45 1577 451 1873 24 1805 1900 1900 ------------|---------------||---------------||---------------||---------------|Capacity Analysis Module:Vol/Sat: 0.02 0.02 0.02 0.01 0.35 0.35 1.02 0.27 0.27 0.01 0.69 0.00 Crit Moves: **** **** Green/Cycle: 0.24 0.24 0.24 0.24 0.24 0.24 0.63 0.63 0.63 0.03 0.48 0.00 Volume/Cap: 0.09 0.09 0.09 0.03 1.44 1.44 1.17 0.42 0.42 0.42 1.44 0.00 Uniform Del: 29.4 29.4 29.4 29.0 37.9 37.9 8.7 9.3 9.3 47.8 25.9 0.0 IncremntDel: 0.1 0.1 0.1 0.0 213 213.0 98.5 0.2 0.2 5.7 205 0.0 InitQueuDel: 0.0 0.0 0.0 0.0 0.0 0.0 0.0 0.0 0.0 0.0 0.0 0.0 Delay Adj: 1.00 1.00 1.00 1.00 1.00 1.00 1.00 1.00 1.00 1.00 1.00 0.00 Delay/Veh: 29.6 29.6 29.5 29.0 251 250.9 107.2 9.5 9.5 53.6 231 0.0 User DelAdj: 1.00 1.00 1.00 1.00 1.00 1.00 1.00 1.00 1.00 1.00 1.00 1.00 AdjDel/Veh: 29.6 29.6 29.5 29.0 251 250.9 107.2 9.5 9.5 53.6 231 0.0 LOS by Move: C C C C F F F A A D F A HCM2kAvgQ: 1 1 1 0 40 40 26 8 8 1 90 0 ********************************************************************************

Note: Queue reported is the number of cars per lane.********************************************************************************
CB_AM Tue Nov 6, 2007 11:34:22 Page 11-1 ---------------------------------------------------------------------------------------------------------------------------------------------------------------- Level Of Service Computation Report 2000 HCM Unsignalized Method (Base Volume Alternative) ********************************************************************************Intersection #10 Palani Rd / Uluaoa St ********************************************************************************Average Delay (sec/veh): 32.4 Worst Case Level Of Service: F[161.1]********************************************************************************Street Name: Palani Rd Uluaoa St Approach: North Bound South Bound East Bound West Bound Movement: L - T - R L - T - R L - T - R L - T - R ------------|---------------||---------------||---------------||---------------|Control: Uncontrolled Uncontrolled Stop Sign Stop Sign Rights: Include Include Include Include Lanes: 0 1 0 0 0 0 0 0 1 0 1 0 0 0 1 0 0 0 0 0 ------------|---------------||---------------||---------------||---------------|Volume Module:Base Vol: 58 422 0 0 723 311 176 0 200 0 0 0 Growth Adj: 1.00 1.00 1.00 1.00 1.00 1.00 1.00 1.00 1.00 1.00 1.00 1.00 Initial Bse: 58 422 0 0 723 311 176 0 200 0 0 0 User Adj: 1.00 1.00 1.00 1.00 1.00 1.00 1.00 1.00 1.00 1.00 1.00 1.00 PHF Adj: 0.95 0.95 0.95 0.95 0.95 0.95 0.95 0.95 0.95 0.95 0.95 0.95 PHF Volume: 61 444 0 0 761 327 185 0 211 0 0 0 Reduct Vol: 0 0 0 0 0 0 0 0 0 0 0 0 FinalVolume: 61 444 0 0 761 327 185 0 211 0 0 0 ------------|---------------||---------------||---------------||---------------|Critical Gap Module:Critical Gp: 4.1 xxxx xxxxx xxxxx xxxx xxxxx 6.4 xxxx 6.2 xxxxx xxxx xxxxx FollowUpTim: 2.2 xxxx xxxxx xxxxx xxxx xxxxx 3.5 xxxx 3.3 xxxxx xxxx xxxxx ------------|---------------||---------------||---------------||---------------|Capacity Module:Cnflict Vol: 1088 xxxx xxxxx xxxx xxxx xxxxx 1491 xxxx 925 xxxx xxxx xxxxx Potent Cap.: 649 xxxx xxxxx xxxx xxxx xxxxx 138 xxxx 329 xxxx xxxx xxxxx Move Cap.: 649 xxxx xxxxx xxxx xxxx xxxxx 127 xxxx 329 xxxx xxxx xxxxx Volume/Cap: 0.09 xxxx xxxx xxxx xxxx xxxx 1.46 xxxx 0.64 xxxx xxxx xxxx ------------|---------------||---------------||---------------||---------------|Level Of Service Module:2Way95thQ: 0.3 xxxx xxxxx xxxx xxxx xxxxx 12.7 xxxx 4.2 xxxx xxxx xxxxx Control Del: 11.1 xxxx xxxxx xxxxx xxxx xxxxx 306.2 xxxx 33.5 xxxxx xxxx xxxxx LOS by Move: B * * * * * F * D * * * Movement: LT - LTR - RT LT - LTR - RT LT - LTR - RT LT - LTR - RT Shared Cap.: xxxx xxxx xxxxx xxxx xxxx xxxxx xxxx xxxx xxxxx xxxx xxxx xxxxx SharedQueue: 0.3 xxxx xxxxx xxxxx xxxx xxxxx xxxxx xxxx xxxxx xxxxx xxxx xxxxx Shrd ConDel: 11.1 xxxx xxxxx xxxxx xxxx xxxxx xxxxx xxxx xxxxx xxxxx xxxx xxxxx Shared LOS: B * * * * * * * * * * * ApproachDel: xxxxxx xxxxxx 161.1 xxxxxxApproachLOS: * * F * ********************************************************************************

Note: Queue reported is the number of cars per lane.********************************************************************************
CB_AM Tue Nov 6, 2007 11:34:22 Page 12-1 ---------------------------------------------------------------------------------------------------------------------------------------------------------------- Level Of Service Computation Report 2000 HCM Operations Method (Base Volume Alternative) ********************************************************************************Intersection #11 Queen Kaahumanu Hwy / Kealakehe Pkwy ********************************************************************************Cycle (sec): 100 Critical Vol./Cap.(X): 0.748Loss Time (sec): 10 (Y+R=4.0 sec) Average Delay (sec/veh): 25.9Optimal Cycle: 61 Level Of Service: C********************************************************************************Street Name: Queen Kaahumanu Hwy Kaalakehe Pkwy Approach: North Bound South Bound East Bound West Bound Movement: L - T - R L - T - R L - T - R L - T - R ------------|---------------||---------------||---------------||---------------|Control: Prot+Permit Prot+Permit Permitted Permitted Rights: Ovl Ovl Ovl Ovl Min. Green: 0 0 0 0 0 0 0 0 0 0 0 0 Lanes: 1 0 2 0 1 1 0 2 0 1 0 1 0 0 1 0 1 0 0 1 ------------|---------------||---------------||---------------||---------------|Volume Module:Base Vol: 115 995 422 171 910 249 81 107 10 231 61 81 Growth Adj: 1.00 1.00 1.00 1.00 1.00 1.00 1.00 1.00 1.00 1.00 1.00 1.00 Initial Bse: 115 995 422 171 910 249 81 107 10 231 61 81 User Adj: 1.00 1.00 1.00 1.00 1.00 1.00 1.00 1.00 1.00 1.00 1.00 1.00 PHF Adj: 0.95 0.95 0.95 0.95 0.95 0.95 0.95 0.95 0.95 0.95 0.95 0.95 PHF Volume: 121 1047 444 180 958 262 85 113 11 243 64 85 Reduct Vol: 0 0 0 0 0 0 0 0 0 0 0 0 Reduced Vol: 121 1047 444 180 958 262 85 113 11 243 64 85 PCE Adj: 1.00 1.00 1.00 1.00 1.00 1.00 1.00 1.00 1.00 1.00 1.00 1.00 MLF Adj: 1.00 1.00 1.00 1.00 1.00 1.00 1.00 1.00 1.00 1.00 1.00 1.00 FinalVolume: 121 1047 444 180 958 262 85 113 11 243 64 85 ------------|---------------||---------------||---------------||---------------|Saturation Flow Module:Sat/Lane: 1900 1900 1900 1900 1900 1900 1900 1900 1900 1900 1900 1900 Adjustment: 0.95 0.95 0.85 0.95 0.95 0.85 0.64 0.64 0.85 0.57 0.57 0.85 Lanes: 1.00 2.00 1.00 1.00 2.00 1.00 0.43 0.57 1.00 0.79 0.21 1.00 Final Sat.: 1805 3610 1615 1805 3610 1615 526 694 1615 858 227 1615 ------------|---------------||---------------||---------------||---------------|Capacity Analysis Module:Vol/Sat: 0.07 0.29 0.28 0.10 0.27 0.16 0.16 0.16 0.01 0.28 0.28 0.05 Crit Moves: **** **** **** Green/Cycle: 0.49 0.39 0.39 0.55 0.42 0.42 0.38 0.38 0.48 0.38 0.38 0.51 Volume/Cap: 0.38 0.75 0.71 0.57 0.64 0.39 0.43 0.43 0.01 0.75 0.75 0.10 Uniform Del: 15.5 26.4 25.8 16.6 23.2 20.4 23.0 23.0 13.4 26.9 26.9 12.6 IncremntDel: 0.8 2.3 3.8 2.4 0.9 0.4 0.6 0.6 0.0 7.4 7.4 0.1 InitQueuDel: 0.0 0.0 0.0 0.0 0.0 0.0 0.0 0.0 0.0 0.0 0.0 0.0 Delay Adj: 1.00 1.00 1.00 1.00 1.00 1.00 1.00 1.00 1.00 1.00 1.00 1.00 Delay/Veh: 16.3 28.7 29.6 19.0 24.1 20.7 23.7 23.7 13.4 34.3 34.3 12.6 User DelAdj: 1.00 1.00 1.00 1.00 1.00 1.00 1.00 1.00 1.00 1.00 1.00 1.00 AdjDel/Veh: 16.3 28.7 29.6 19.0 24.1 20.7 23.7 23.7 13.4 34.3 34.3 12.6 LOS by Move: B C C B C C C C B C C B HCM2kAvgQ: 3 16 13 4 13 6 5 5 0 10 10 1 ********************************************************************************

Note: Queue reported is the number of cars per lane.********************************************************************************
CB_AM Tue Nov 6, 2007 11:34:22 Page 13-1 ---------------------------------------------------------------------------------------------------------------------------------------------------------------- Level Of Service Computation Report 2000 HCM Unsignalized Method (Base Volume Alternative) ********************************************************************************Intersection #12 Ane Keohokalole Hwy / Kealakehe Pkwy ********************************************************************************Average Delay (sec/veh): OVERFLOW Worst Case Level Of Service: F[xxxxx]********************************************************************************Street Name: Ane Keohokalole Hwy Kealakehe Pkwy Approach: North Bound South Bound East Bound West Bound Movement: L - T - R L - T - R L - T - R L - T - R ------------|---------------||---------------||---------------||---------------|Control: Stop Sign Stop Sign Uncontrolled UncontrolledRights: Include Include Include Include Lanes: 1 0 1 0 1 1 0 0 1 0 1 0 1 1 0 1 0 1 0 1 ------------|---------------||---------------||---------------||---------------|Volume Module:Base Vol: 124 320 3 12 295 45 369 94 323 2 115 50 Growth Adj: 1.00 1.00 1.00 1.00 1.00 1.00 1.00 1.00 1.00 1.00 1.00 1.00 Initial Bse: 124 320 3 12 295 45 369 94 323 2 115 50 User Adj: 1.00 1.00 1.00 1.00 1.00 1.00 1.00 1.00 1.00 1.00 1.00 1.00 PHF Adj: 0.95 0.95 0.95 0.95 0.95 0.95 0.95 0.95 0.95 0.95 0.95 0.95 PHF Volume: 131 337 3 13 311 47 388 99 340 2 121 53 Reduct Vol: 0 0 0 0 0 0 0 0 0 0 0 0 FinalVolume: 131 337 3 13 311 47 388 99 340 2 121 53 ------------|---------------||---------------||---------------||---------------|Critical Gap Module:Critical Gp: 7.1 6.5 6.2 7.1 6.5 6.2 4.1 xxxx xxxxx 4.1 xxxx xxxxx FollowUpTim: 3.5 4.0 3.3 3.5 4.0 3.3 2.2 xxxx xxxxx 2.2 xxxx xxxxx ------------|---------------||---------------||---------------||---------------|Capacity Module:Cnflict Vol: 1376 1224 219 1120 1341 121 174 xxxx xxxxx 439 xxxx xxxxx Potent Cap.: 124 181 825 185 154 936 1415 xxxx xxxxx 1132 xxxx xxxxx Move Cap.: 0 131 825 0 111 936 1415 xxxx xxxxx 1132 xxxx xxxxx Volume/Cap: xxxx 2.57 0.00 xxxx 2.79 0.05 0.27 xxxx xxxx 0.00 xxxx xxxx ------------|---------------||---------------||---------------||---------------|Level Of Service Module:2Way95thQ: xxxx 30.0 0.0 xxxx xxxx xxxxx 1.1 xxxx xxxxx 0.0 xxxx xxxxx Control Del:xxxxx 783 9.4 xxxxx xxxx xxxxx 8.5 xxxx xxxxx 8.2 xxxx xxxxx LOS by Move: * F A * * * A * * A * * Movement: LT - LTR - RT LT - LTR - RT LT - LTR - RT LT - LTR - RT Shared Cap.: xxxx xxxx xxxxx xxxx xxxx 126 xxxx xxxx xxxxx xxxx xxxx xxxxx SharedQueue:xxxxx xxxx xxxxx xxxxx xxxx 33.0 xxxxx xxxx xxxxx xxxxx xxxx xxxxx Shrd ConDel:xxxxx xxxx xxxxx xxxxx xxxx 903.4 xxxxx xxxx xxxxx xxxxx xxxx xxxxx Shared LOS: * * * * * F * * * * * * ApproachDel: xxxxxx xxxxxx xxxxxx xxxxxxApproachLOS: F F * * ********************************************************************************

CB_PM Tue Nov 6, 2007 11:34:32 Page 3-1 ---------------------------------------------------------------------------------------------------------------------------------------------------------------- Level Of Service Computation Report 2000 HCM Operations Method (Base Volume Alternative) ********************************************************************************Intersection #1 Queen Kaahumanu Hwy / Henry St ********************************************************************************Cycle (sec): 100 Critical Vol./Cap.(X): 0.819Loss Time (sec): 10 (Y+R=4.0 sec) Average Delay (sec/veh): 27.2Optimal Cycle: 76 Level Of Service: C********************************************************************************Street Name: Queen Kaahumanu Hwy Henry St Approach: North Bound South Bound East Bound West Bound Movement: L - T - R L - T - R L - T - R L - T - R ------------|---------------||---------------||---------------||---------------|Control: Prot+Permit Prot+Permit Prot+Permit Prot+Permit Rights: Ovl Ovl Ovl Ovl Min. Green: 0 0 0 0 0 0 0 0 0 0 0 0 Lanes: 1 0 2 0 1 1 0 3 0 1 1 0 2 0 1 1 1 1 0 1 ------------|---------------||---------------||---------------||---------------|Volume Module:Base Vol: 282 464 768 183 673 121 76 444 107 514 460 211 Growth Adj: 1.00 1.00 1.00 1.00 1.00 1.00 1.00 1.00 1.00 1.00 1.00 1.00 Initial Bse: 282 464 768 183 673 121 76 444 107 514 460 211 User Adj: 1.00 1.00 1.00 1.00 1.00 1.00 1.00 1.00 1.00 1.00 1.00 1.00 PHF Adj: 0.95 0.95 0.95 0.95 0.95 0.95 0.95 0.95 0.95 0.95 0.95 0.95 PHF Volume: 297 488 808 193 708 127 80 467 113 541 484 222 Reduct Vol: 0 0 0 0 0 0 0 0 0 0 0 0 Reduced Vol: 297 488 808 193 708 127 80 467 113 541 484 222 PCE Adj: 1.00 1.00 1.00 1.00 1.00 1.00 1.00 1.00 1.00 1.00 1.00 1.00 MLF Adj: 1.00 1.00 1.00 1.00 1.00 1.00 1.00 1.00 1.00 1.00 1.00 1.00 FinalVolume: 297 488 808 193 708 127 80 467 113 541 484 222 ------------|---------------||---------------||---------------||---------------|Saturation Flow Module:Sat/Lane: 1900 1900 1900 1900 1900 1900 1900 1900 1900 1900 1900 1900 Adjustment: 0.95 0.95 0.85 0.95 0.91 0.85 0.95 0.95 0.85 0.93 0.93 0.85 Lanes: 1.00 2.00 1.00 1.00 3.00 1.00 1.00 2.00 1.00 1.58 1.42 1.00 Final Sat.: 1805 3610 1615 1805 5187 1615 1805 3610 1615 2783 2491 1615 ------------|---------------||---------------||---------------||---------------|Capacity Analysis Module:Vol/Sat: 0.16 0.14 0.50 0.11 0.14 0.08 0.04 0.13 0.07 0.19 0.19 0.14 Crit Moves: **** **** **** **** Green/Cycle: 0.52 0.37 0.61 0.36 0.23 0.30 0.23 0.16 0.43 0.42 0.32 0.45 Volume/Cap: 0.50 0.36 0.82 0.44 0.60 0.26 0.29 0.82 0.16 0.59 0.60 0.30 Uniform Del: 14.6 22.7 15.1 23.0 34.4 26.4 30.9 40.7 17.2 21.8 28.5 17.4 IncremntDel: 0.7 0.2 5.5 0.7 0.8 0.3 0.6 9.1 0.1 0.6 0.6 0.2 InitQueuDel: 0.0 0.0 0.0 0.0 0.0 0.0 0.0 0.0 0.0 0.0 0.0 0.0 Delay Adj: 1.00 1.00 1.00 1.00 1.00 1.00 1.00 1.00 1.00 1.00 1.00 1.00 Delay/Veh: 15.3 22.8 20.6 23.7 35.3 26.7 31.5 49.8 17.3 22.4 29.1 17.6 User DelAdj: 1.00 1.00 1.00 1.00 1.00 1.00 1.00 1.00 1.00 1.00 1.00 1.00 AdjDel/Veh: 15.3 22.8 20.6 23.7 35.3 26.7 31.5 49.8 17.3 22.4 29.1 17.6 LOS by Move: B C C C D C C D B C C B HCM2kAvgQ: 6 6 21 5 8 3 2 10 2 9 10 4 ********************************************************************************Note: Queue reported is the number of cars per lane.********************************************************************************

********************************************************************************
CB_PM Tue Nov 6, 2007 11:34:32 Page 4-1 ---------------------------------------------------------------------------------------------------------------------------------------------------------------- Level Of Service Computation Report 2000 HCM Operations Method (Base Volume Alternative) ********************************************************************************Intersection #2 Queen Kaahumanu Hwy / Alli Dr ********************************************************************************Cycle (sec): 100 Critical Vol./Cap.(X): 0.988Loss Time (sec): 10 (Y+R=4.0 sec) Average Delay (sec/veh): 39.8Optimal Cycle: 180 Level Of Service: D********************************************************************************Street Name: Queen Kaahumanu Hwy Alli Dr Approach: North Bound South Bound East Bound West Bound Movement: L - T - R L - T - R L - T - R L - T - R ------------|---------------||---------------||---------------||---------------|Control: Prot+Permit Prot+Permit Prot+Permit Prot+Permit Rights: Ovl Ovl Ovl Ovl Min. Green: 0 0 0 0 0 0 0 0 0 0 0 0 Lanes: 1 0 2 0 1 1 0 2 0 1 1 0 1 0 1 1 0 1 0 1 ------------|---------------||---------------||---------------||---------------|Volume Module:Base Vol: 38 706 20 207 707 358 269 293 219 86 732 74 Growth Adj: 1.00 1.00 1.00 1.00 1.00 1.00 1.00 1.00 1.00 1.00 1.00 1.00 Initial Bse: 38 706 20 207 707 358 269 293 219 86 732 74 User Adj: 1.00 1.00 1.00 1.00 1.00 1.00 1.00 1.00 1.00 1.00 1.00 1.00 PHF Adj: 0.95 0.95 0.95 0.95 0.95 0.95 0.95 0.95 0.95 0.95 0.95 0.95 PHF Volume: 40 743 21 218 744 377 283 308 231 91 771 78 Reduct Vol: 0 0 0 0 0 0 0 0 0 0 0 0 Reduced Vol: 40 743 21 218 744 377 283 308 231 91 771 78 PCE Adj: 1.00 1.00 1.00 1.00 1.00 1.00 1.00 1.00 1.00 1.00 1.00 1.00 MLF Adj: 1.00 1.00 1.00 1.00 1.00 1.00 1.00 1.00 1.00 1.00 1.00 1.00 FinalVolume: 40 743 21 218 744 377 283 308 231 91 771 78 ------------|---------------||---------------||---------------||---------------|Saturation Flow Module:Sat/Lane: 1900 1900 1900 1900 1900 1900 1900 1900 1900 1900 1900 1900 Adjustment: 0.95 0.95 0.85 0.95 0.95 0.85 0.95 1.00 0.85 0.95 1.00 0.85 Lanes: 1.00 2.00 1.00 1.00 2.00 1.00 1.00 1.00 1.00 1.00 1.00 1.00 Final Sat.: 1805 3610 1615 1805 3610 1615 1805 1900 1615 1805 1900 1615 ------------|---------------||---------------||---------------||---------------|Capacity Analysis Module:Vol/Sat: 0.02 0.21 0.01 0.12 0.21 0.23 0.16 0.16 0.14 0.05 0.41 0.05 Crit Moves: **** **** **** **** Green/Cycle: 0.24 0.21 0.34 0.35 0.30 0.46 0.59 0.43 0.47 0.54 0.41 0.53 Volume/Cap: 0.27 0.99 0.04 0.74 0.69 0.51 0.78 0.37 0.31 0.15 0.99 0.09 Uniform Del: 29.8 39.5 21.9 26.1 31.0 19.2 9.8 19.1 16.6 11.1 29.2 11.5 IncremntDel: 1.0 29.7 0.0 9.5 1.9 0.6 10.6 0.3 0.2 0.1 29.1 0.0 InitQueuDel: 0.0 0.0 0.0 0.0 0.0 0.0 0.0 0.0 0.0 0.0 0.0 0.0 Delay Adj: 1.00 1.00 1.00 1.00 1.00 1.00 1.00 1.00 1.00 1.00 1.00 1.00 Delay/Veh: 30.8 69.1 21.9 35.6 32.9 19.8 20.4 19.3 16.8 11.3 58.3 11.5 User DelAdj: 1.00 1.00 1.00 1.00 1.00 1.00 1.00 1.00 1.00 1.00 1.00 1.00 AdjDel/Veh: 30.8 69.1 21.9 35.6 32.9 19.8 20.4 19.3 16.8 11.3 58.3 11.5 LOS by Move: C E C D C B C B B B E B HCM2kAvgQ: 1 18 0 8 12 8 9 6 4 1 30 1 ********************************************************************************Note: Queue reported is the number of cars per lane.

********************************************************************************
CB_PM Tue Nov 6, 2007 11:34:32 Page 5-1 ---------------------------------------------------------------------------------------------------------------------------------------------------------------- Level Of Service Computation Report 2000 HCM Unsignalized Method (Base Volume Alternative) ********************************************************************************Intersection #3 Kamakaeha Ave / Palani Rd ********************************************************************************Average Delay (sec/veh): 9.2 Worst Case Level Of Service: F[ 74.1]********************************************************************************Street Name: Kamakaeha Ave Palani Rd Approach: North Bound South Bound East Bound West Bound Movement: L - T - R L - T - R L - T - R L - T - R ------------|---------------||---------------||---------------||---------------|Control: Stop Sign Stop Sign Uncontrolled UncontrolledRights: Include Include Include Ignore Lanes: 0 0 0 0 0 1 0 0 0 1 0 0 1 0 0 0 0 1 0 1 ------------|---------------||---------------||---------------||---------------|Volume Module:Base Vol: 0 0 0 127 0 63 0 520 0 0 829 281 Growth Adj: 1.00 1.00 1.00 1.00 1.00 1.00 1.00 1.00 1.00 1.00 1.00 1.00 Initial Bse: 0 0 0 127 0 63 0 520 0 0 829 281 User Adj: 1.00 1.00 1.00 1.00 1.00 1.00 1.00 1.00 1.00 1.00 1.00 0.00 PHF Adj: 0.95 0.95 0.95 0.95 0.95 0.95 0.95 0.95 0.95 0.95 0.95 0.00 PHF Volume: 0 0 0 134 0 66 0 547 0 0 873 0 Reduct Vol: 0 0 0 0 0 0 0 0 0 0 0 0 FinalVolume: 0 0 0 134 0 66 0 547 0 0 873 0 ------------|---------------||---------------||---------------||---------------|Critical Gap Module:Critical Gp:xxxxx xxxx xxxxx 6.4 xxxx 6.2 xxxxx xxxx xxxxx xxxxx xxxx xxxxx FollowUpTim:xxxxx xxxx xxxxx 3.5 xxxx 3.3 xxxxx xxxx xxxxx xxxxx xxxx xxxxx ------------|---------------||---------------||---------------||---------------|Capacity Module:Cnflict Vol: xxxx xxxx xxxxx 1420 xxxx 873 xxxx xxxx xxxxx xxxx xxxx xxxxx Potent Cap.: xxxx xxxx xxxxx 152 xxxx 353 xxxx xxxx xxxxx xxxx xxxx xxxxx Move Cap.: xxxx xxxx xxxxx 152 xxxx 353 xxxx xxxx xxxxx xxxx xxxx xxxxx Volume/Cap: xxxx xxxx xxxx 0.88 xxxx 0.19 xxxx xxxx xxxx xxxx xxxx xxxx ------------|---------------||---------------||---------------||---------------|Level Of Service Module:2Way95thQ: xxxx xxxx xxxxx 6.0 xxxx 0.7 xxxx xxxx xxxxx xxxx xxxx xxxxx Control Del:xxxxx xxxx xxxxx 102.2 xxxx 17.6 xxxxx xxxx xxxxx xxxxx xxxx xxxxx LOS by Move: * * * F * C * * * * * * Movement: LT - LTR - RT LT - LTR - RT LT - LTR - RT LT - LTR - RT Shared Cap.: xxxx xxxx xxxxx xxxx xxxx xxxxx xxxx xxxx xxxxx xxxx xxxx xxxxx SharedQueue:xxxxx xxxx xxxxx xxxxx xxxx xxxxx xxxxx xxxx xxxxx xxxxx xxxx xxxxx Shrd ConDel:xxxxx xxxx xxxxx xxxxx xxxx xxxxx xxxxx xxxx xxxxx xxxxx xxxx xxxxx Shared LOS: * * * * * * * * * * * * ApproachDel: xxxxxx 74.1 xxxxxx xxxxxxApproachLOS: * F * * ********************************************************************************Note: Queue reported is the number of cars per lane.

********************************************************************************
CB_PM Tue Nov 6, 2007 11:34:32 Page 6-1 ---------------------------------------------------------------------------------------------------------------------------------------------------------------- Level Of Service Computation Report 2000 HCM Operations Method (Base Volume Alternative) ********************************************************************************Intersection #4 Henry St / Palani Rd ********************************************************************************Cycle (sec): 100 Critical Vol./Cap.(X): 1.248Loss Time (sec): 10 (Y+R=4.0 sec) Average Delay (sec/veh): 94.8Optimal Cycle: 180 Level Of Service: F********************************************************************************Street Name: Henry St Palani Rd Approach: North Bound South Bound East Bound West Bound Movement: L - T - R L - T - R L - T - R L - T - R ------------|---------------||---------------||---------------||---------------|Control: Permitted Permitted Permitted Prot+Permit Rights: Ovl Include Include Include Min. Green: 0 0 0 0 0 0 0 0 0 0 0 0 Lanes: 1 0 0 1 0 1 0 0 1 0 1 0 0 1 0 1 0 0 1 0 ------------|---------------||---------------||---------------||---------------|Volume Module:Base Vol: 110 182 394 17 203 118 170 416 129 834 927 93 Growth Adj: 1.00 1.00 1.00 1.00 1.00 1.00 1.00 1.00 1.00 1.00 1.00 1.00 Initial Bse: 110 182 394 17 203 118 170 416 129 834 927 93 User Adj: 1.00 1.00 1.00 1.00 1.00 1.00 1.00 1.00 1.00 1.00 1.00 1.00 PHF Adj: 0.95 0.95 0.95 0.95 0.95 0.95 0.95 0.95 0.95 0.95 0.95 0.95 PHF Volume: 116 192 415 18 214 124 179 438 136 878 976 98 Reduct Vol: 0 0 0 0 0 0 0 0 0 0 0 0 Reduced Vol: 116 192 415 18 214 124 179 438 136 878 976 98 PCE Adj: 1.00 1.00 1.00 1.00 1.00 1.00 1.00 1.00 1.00 1.00 1.00 1.00 MLF Adj: 1.00 1.00 1.00 1.00 1.00 1.00 1.00 1.00 1.00 1.00 1.00 1.00 FinalVolume: 116 192 415 18 214 124 179 438 136 878 976 98 ------------|---------------||---------------||---------------||---------------|Saturation Flow Module:Sat/Lane: 1900 1900 1900 1900 1900 1900 1900 1900 1900 1900 1900 1900 Adjustment: 0.29 0.90 0.90 0.14 0.95 0.95 0.95 0.96 0.96 0.60 0.99 0.99 Lanes: 1.00 0.32 0.68 1.00 0.63 0.37 1.00 0.76 0.24 1.00 0.91 0.09 Final Sat.: 543 539 1166 274 1135 660 1805 1398 434 1144 1703 171 ------------|---------------||---------------||---------------||---------------|Capacity Analysis Module:Vol/Sat: 0.21 0.36 0.36 0.07 0.19 0.19 0.10 0.31 0.31 0.77 0.57 0.57 Crit Moves: **** **** Green/Cycle: 0.28 0.28 0.66 0.28 0.28 0.28 0.09 0.24 0.24 0.53 0.53 0.53 Volume/Cap: 0.77 1.28 0.54 0.24 0.68 0.68 1.08 1.28 1.28 1.16 1.08 1.08 Uniform Del: 33.2 36.1 9.2 28.0 32.2 32.2 45.4 37.8 37.8 19.0 23.4 23.4 IncremntDel: 21.0 143 0.5 1.6 3.8 3.8 92.6 144 143.8 84.5 52.4 52.4 InitQueuDel: 0.0 0.0 0.0 0.0 0.0 0.0 0.0 0.0 0.0 0.0 0.0 0.0 Delay Adj: 1.00 1.00 1.00 1.00 1.00 1.00 1.00 1.00 1.00 1.00 1.00 1.00 Delay/Veh: 54.3 179 9.7 29.6 36.0 36.0 138.0 182 181.6 103.5 75.9 75.9 User DelAdj: 1.00 1.00 1.00 1.00 1.00 1.00 1.00 1.00 1.00 1.00 1.00 1.00 AdjDel/Veh: 54.3 179 9.7 29.6 36.0 36.0 138.0 182 181.6 103.5 75.9 75.9 LOS by Move: D F A C D D F F F F E E HCM2kAvgQ: 5 37 10 1 10 10 11 35 35 45 47 47 ********************************************************************************Note: Queue reported is the number of cars per lane.

********************************************************************************
CB_PM Tue Nov 6, 2007 11:34:32 Page 8-1 ---------------------------------------------------------------------------------------------------------------------------------------------------------------- Level Of Service Computation Report 2000 HCM Operations Method (Base Volume Alternative) ********************************************************************************Intersection #6 Queen Kaahumanu Hwy / Makala Blvd ********************************************************************************Cycle (sec): 100 Critical Vol./Cap.(X): 0.769Loss Time (sec): 10 (Y+R=4.0 sec) Average Delay (sec/veh): 24.5Optimal Cycle: 65 Level Of Service: C********************************************************************************Street Name: Queen Kaahumanu Hwy Makala Blvd Approach: North Bound South Bound East Bound West Bound Movement: L - T - R L - T - R L - T - R L - T - R ------------|---------------||---------------||---------------||---------------|Control: Prot+Permit Prot+Permit Prot+Permit Prot+Permit Rights: Ovl Ovl Include Include Min. Green: 0 0 0 0 0 0 0 0 0 0 0 0 Lanes: 1 0 2 0 1 1 0 2 0 1 1 0 0 1 0 1 0 0 1 0 ------------|---------------||---------------||---------------||---------------|Volume Module:Base Vol: 14 699 80 86 1148 294 417 126 41 21 71 104 Growth Adj: 1.00 1.00 1.00 1.00 1.00 1.00 1.00 1.00 1.00 1.00 1.00 1.00 Initial Bse: 14 699 80 86 1148 294 417 126 41 21 71 104 User Adj: 1.00 1.00 1.00 1.00 1.00 1.00 1.00 1.00 1.00 1.00 1.00 1.00 PHF Adj: 0.95 0.95 0.95 0.95 0.95 0.95 0.95 0.95 0.95 0.95 0.95 0.95 PHF Volume: 15 736 84 91 1208 309 439 133 43 22 75 109 Reduct Vol: 0 0 0 0 0 0 0 0 0 0 0 0 Reduced Vol: 15 736 84 91 1208 309 439 133 43 22 75 109 PCE Adj: 1.00 1.00 1.00 1.00 1.00 1.00 1.00 1.00 1.00 1.00 1.00 1.00 MLF Adj: 1.00 1.00 1.00 1.00 1.00 1.00 1.00 1.00 1.00 1.00 1.00 1.00 FinalVolume: 15 736 84 91 1208 309 439 133 43 22 75 109 ------------|---------------||---------------||---------------||---------------|Saturation Flow Module:Sat/Lane: 1900 1900 1900 1900 1900 1900 1900 1900 1900 1900 1900 1900 Adjustment: 0.95 0.95 0.85 0.95 0.95 0.85 0.95 0.96 0.96 0.95 0.91 0.91 Lanes: 1.00 2.00 1.00 1.00 2.00 1.00 1.00 0.75 0.25 1.00 0.41 0.59 Final Sat.: 1805 3610 1615 1805 3610 1615 1805 1380 449 1805 702 1029 ------------|---------------||---------------||---------------||---------------|Capacity Analysis Module:Vol/Sat: 0.01 0.20 0.05 0.05 0.33 0.19 0.24 0.10 0.10 0.01 0.11 0.11 Crit Moves: **** **** **** **** Green/Cycle: 0.37 0.36 0.41 0.47 0.44 0.75 0.47 0.40 0.40 0.19 0.14 0.14 Volume/Cap: 0.15 0.57 0.13 0.30 0.77 0.26 0.68 0.24 0.24 0.08 0.77 0.77 Uniform Del: 22.3 25.9 18.4 16.5 24.0 3.8 18.7 19.7 19.7 33.2 41.5 41.5 IncremntDel: 0.8 0.6 0.1 0.6 2.4 0.1 2.9 0.2 0.2 0.1 14.1 14.1 InitQueuDel: 0.0 0.0 0.0 0.0 0.0 0.0 0.0 0.0 0.0 0.0 0.0 0.0 Delay Adj: 1.00 1.00 1.00 1.00 1.00 1.00 1.00 1.00 1.00 1.00 1.00 1.00 Delay/Veh: 23.1 26.5 18.5 17.1 26.4 3.9 21.6 19.9 19.9 33.4 55.6 55.6 User DelAdj: 1.00 1.00 1.00 1.00 1.00 1.00 1.00 1.00 1.00 1.00 1.00 1.00 AdjDel/Veh: 23.1 26.5 18.5 17.1 26.4 3.9 21.6 19.9 19.9 33.4 55.6 55.6 LOS by Move: C C B B C A C B B C E E HCM2kAvgQ: 0 10 2 2 18 3 11 4 4 1 7 7 ********************************************************************************Note: Queue reported is the number of cars per lane.

Note: Queue reported is the number of cars per lane.********************************************************************************
CB_PM Tue Nov 6, 2007 11:34:32 Page 10-1 ---------------------------------------------------------------------------------------------------------------------------------------------------------------- Level Of Service Computation Report 2000 HCM Operations Method (Base Volume Alternative) ********************************************************************************Intersection #8 Palihiolo St/Palani Rd ********************************************************************************Cycle (sec): 100 Critical Vol./Cap.(X): 1.734Loss Time (sec): 10 (Y+R=4.0 sec) Average Delay (sec/veh): 185.8Optimal Cycle: 180 Level Of Service: F********************************************************************************Street Name: Palihiolo St Palani Rd Approach: North Bound South Bound East Bound West Bound Movement: L - T - R L - T - R L - T - R L - T - R ------------|---------------||---------------||---------------||---------------|Control: Permitted Permitted Prot+Permit Permitted Rights: Include Include Include Ignore Min. Green: 0 0 0 0 0 0 0 0 0 0 0 0 Lanes: 0 1 0 0 1 1 0 0 1 0 1 0 0 1 0 1 0 1 0 1 ------------|---------------||---------------||---------------||---------------|Volume Module:Base Vol: 4 19 26 2 4 565 506 681 13 49 1265 23 Growth Adj: 1.00 1.00 1.00 1.00 1.00 1.00 1.00 1.00 1.00 1.00 1.00 1.00 Initial Bse: 4 19 26 2 4 565 506 681 13 49 1265 23 User Adj: 1.00 1.00 1.00 1.00 1.00 1.00 1.00 1.00 1.00 1.00 1.00 0.00 PHF Adj: 0.95 0.95 0.95 0.95 0.95 0.95 0.95 0.95 0.95 0.95 0.95 0.00 PHF Volume: 4 20 27 2 4 595 533 717 14 52 1332 0 Reduct Vol: 0 0 0 0 0 0 0 0 0 0 0 0 Reduced Vol: 4 20 27 2 4 595 533 717 14 52 1332 0 PCE Adj: 1.00 1.00 1.00 1.00 1.00 1.00 1.00 1.00 1.00 1.00 1.00 0.00 MLF Adj: 1.00 1.00 1.00 1.00 1.00 1.00 1.00 1.00 1.00 1.00 1.00 0.00 FinalVolume: 4 20 27 2 4 595 533 717 14 52 1332 0 ------------|---------------||---------------||---------------||---------------|Saturation Flow Module:Sat/Lane: 1900 1900 1900 1900 1900 1900 1900 1900 1900 1900 1900 1900 Adjustment: 0.67 0.67 0.85 0.75 0.85 0.85 0.24 1.00 1.00 0.95 1.00 1.00 Lanes: 0.17 0.83 1.00 1.00 0.01 0.99 1.00 0.98 0.02 1.00 1.00 1.00 Final Sat.: 221 1048 1615 1423 11 1606 447 1859 35 1805 1900 1900 ------------|---------------||---------------||---------------||---------------|Capacity Analysis Module:Vol/Sat: 0.02 0.02 0.02 0.00 0.37 0.37 1.19 0.39 0.39 0.03 0.70 0.00 Crit Moves: **** **** Green/Cycle: 0.24 0.24 0.24 0.24 0.24 0.24 0.61 0.61 0.61 0.05 0.46 0.00 Volume/Cap: 0.08 0.08 0.07 0.01 1.52 1.52 1.25 0.63 0.63 0.63 1.52 0.00 Uniform Del: 29.1 29.1 29.1 28.6 37.8 37.8 9.9 12.3 12.3 46.9 26.9 0.0 IncremntDel: 0.1 0.1 0.1 0.0 246 245.9 129.8 1.1 1.1 14.9 239 0.0 InitQueuDel: 0.0 0.0 0.0 0.0 0.0 0.0 0.0 0.0 0.0 0.0 0.0 0.0 Delay Adj: 1.00 1.00 1.00 1.00 1.00 1.00 1.00 1.00 1.00 1.00 1.00 0.00 Delay/Veh: 29.2 29.2 29.1 28.6 284 283.7 139.7 13.5 13.5 61.8 266 0.0 User DelAdj: 1.00 1.00 1.00 1.00 1.00 1.00 1.00 1.00 1.00 1.00 1.00 1.00 AdjDel/Veh: 29.2 29.2 29.1 28.6 284 283.7 139.7 13.5 13.5 61.8 266 0.0 LOS by Move: C C C C F F F B B E F A HCM2kAvgQ: 1 1 1 0 45 45 32 15 15 3 97 0 ********************************************************************************

Note: Queue reported is the number of cars per lane.********************************************************************************
CB_PM Tue Nov 6, 2007 11:34:32 Page 11-1 ---------------------------------------------------------------------------------------------------------------------------------------------------------------- Level Of Service Computation Report 2000 HCM Unsignalized Method (Base Volume Alternative) ********************************************************************************Intersection #10 Palani Rd / Uluaoa St ********************************************************************************Average Delay (sec/veh): 7.8 Worst Case Level Of Service: F[146.1]********************************************************************************Street Name: Palani Rd Uluaoa St Approach: North Bound South Bound East Bound West Bound Movement: L - T - R L - T - R L - T - R L - T - R ------------|---------------||---------------||---------------||---------------|Control: Uncontrolled Uncontrolled Stop Sign Stop Sign Rights: Include Include Include Include Lanes: 0 1 0 0 0 0 0 0 1 0 1 0 0 0 1 0 0 0 0 0 ------------|---------------||---------------||---------------||---------------|Volume Module:Base Vol: 29 690 0 0 964 177 71 0 32 0 0 0 Growth Adj: 1.00 1.00 1.00 1.00 1.00 1.00 1.00 1.00 1.00 1.00 1.00 1.00 Initial Bse: 29 690 0 0 964 177 71 0 32 0 0 0 User Adj: 1.00 1.00 1.00 1.00 1.00 1.00 1.00 1.00 1.00 1.00 1.00 1.00 PHF Adj: 0.95 0.95 0.95 0.95 0.95 0.95 0.95 0.95 0.95 0.95 0.95 0.95 PHF Volume: 31 726 0 0 1015 186 75 0 34 0 0 0 Reduct Vol: 0 0 0 0 0 0 0 0 0 0 0 0 FinalVolume: 31 726 0 0 1015 186 75 0 34 0 0 0 ------------|---------------||---------------||---------------||---------------|Critical Gap Module:Critical Gp: 4.1 xxxx xxxxx xxxxx xxxx xxxxx 6.4 xxxx 6.2 xxxxx xxxx xxxxx FollowUpTim: 2.2 xxxx xxxxx xxxxx xxxx xxxxx 3.5 xxxx 3.3 xxxxx xxxx xxxxx ------------|---------------||---------------||---------------||---------------|Capacity Module:Cnflict Vol: 1201 xxxx xxxxx xxxx xxxx xxxxx 1895 xxxx 1108 xxxx xxxx xxxxx Potent Cap.: 588 xxxx xxxxx xxxx xxxx xxxxx 77 xxxx 258 xxxx xxxx xxxxx Move Cap.: 588 xxxx xxxxx xxxx xxxx xxxxx 74 xxxx 258 xxxx xxxx xxxxx Volume/Cap: 0.05 xxxx xxxx xxxx xxxx xxxx 1.00 xxxx 0.13 xxxx xxxx xxxx ------------|---------------||---------------||---------------||---------------|Level Of Service Module:2Way95thQ: 0.2 xxxx xxxxx xxxx xxxx xxxxx 5.3 xxxx 0.4 xxxx xxxx xxxxx Control Del: 11.5 xxxx xxxxx xxxxx xxxx xxxxx 202.5 xxxx 21.1 xxxxx xxxx xxxxx LOS by Move: B * * * * * F * C * * * Movement: LT - LTR - RT LT - LTR - RT LT - LTR - RT LT - LTR - RT Shared Cap.: xxxx xxxx xxxxx xxxx xxxx xxxxx xxxx xxxx xxxxx xxxx xxxx xxxxx SharedQueue: 0.2 xxxx xxxxx xxxxx xxxx xxxxx xxxxx xxxx xxxxx xxxxx xxxx xxxxx Shrd ConDel: 11.5 xxxx xxxxx xxxxx xxxx xxxxx xxxxx xxxx xxxxx xxxxx xxxx xxxxx Shared LOS: B * * * * * * * * * * * ApproachDel: xxxxxx xxxxxx 146.1 xxxxxxApproachLOS: * * F * ********************************************************************************

Note: Queue reported is the number of cars per lane.********************************************************************************
CB_PM Tue Nov 6, 2007 11:34:32 Page 12-1 ---------------------------------------------------------------------------------------------------------------------------------------------------------------- Level Of Service Computation Report 2000 HCM Operations Method (Base Volume Alternative) ********************************************************************************Intersection #11 Queen Kaahumanu Hwy / Kealakehe Pkwy ********************************************************************************Cycle (sec): 100 Critical Vol./Cap.(X): 0.713Loss Time (sec): 10 (Y+R=4.0 sec) Average Delay (sec/veh): 23.5Optimal Cycle: 56 Level Of Service: C********************************************************************************Street Name: Queen Kaahumanu Hwy Kaalakehe Pkwy Approach: North Bound South Bound East Bound West Bound Movement: L - T - R L - T - R L - T - R L - T - R ------------|---------------||---------------||---------------||---------------|Control: Prot+Permit Prot+Permit Permitted Permitted Rights: Ovl Ovl Ovl Ovl Min. Green: 0 0 0 0 0 0 0 0 0 0 0 0 Lanes: 1 0 2 0 1 1 0 2 0 1 0 1 0 0 1 0 1 0 0 1 ------------|---------------||---------------||---------------||---------------|Volume Module:Base Vol: 66 1061 239 55 974 232 106 97 67 242 66 60 Growth Adj: 1.00 1.00 1.00 1.00 1.00 1.00 1.00 1.00 1.00 1.00 1.00 1.00 Initial Bse: 66 1061 239 55 974 232 106 97 67 242 66 60 User Adj: 1.00 1.00 1.00 1.00 1.00 1.00 1.00 1.00 1.00 1.00 1.00 1.00 PHF Adj: 0.95 0.95 0.95 0.95 0.95 0.95 0.95 0.95 0.95 0.95 0.95 0.95 PHF Volume: 69 1117 252 58 1025 244 112 102 71 255 69 63 Reduct Vol: 0 0 0 0 0 0 0 0 0 0 0 0 Reduced Vol: 69 1117 252 58 1025 244 112 102 71 255 69 63 PCE Adj: 1.00 1.00 1.00 1.00 1.00 1.00 1.00 1.00 1.00 1.00 1.00 1.00 MLF Adj: 1.00 1.00 1.00 1.00 1.00 1.00 1.00 1.00 1.00 1.00 1.00 1.00 FinalVolume: 69 1117 252 58 1025 244 112 102 71 255 69 63 ------------|---------------||---------------||---------------||---------------|Saturation Flow Module:Sat/Lane: 1900 1900 1900 1900 1900 1900 1900 1900 1900 1900 1900 1900 Adjustment: 0.95 0.95 0.85 0.95 0.95 0.85 0.58 0.58 0.85 0.57 0.57 0.85 Lanes: 1.00 2.00 1.00 1.00 2.00 1.00 0.52 0.48 1.00 0.79 0.21 1.00 Final Sat.: 1805 3610 1615 1805 3610 1615 572 524 1615 848 231 1615 ------------|---------------||---------------||---------------||---------------|Capacity Analysis Module:Vol/Sat: 0.04 0.31 0.16 0.03 0.28 0.15 0.19 0.19 0.04 0.30 0.30 0.04 Crit Moves: **** **** **** Green/Cycle: 0.51 0.43 0.43 0.47 0.42 0.42 0.42 0.42 0.48 0.42 0.42 0.47 Volume/Cap: 0.33 0.71 0.36 0.33 0.67 0.36 0.46 0.46 0.09 0.71 0.71 0.08 Uniform Del: 15.9 23.2 19.0 17.7 23.4 19.7 20.8 20.8 14.2 23.9 23.9 14.8 IncremntDel: 0.9 1.6 0.3 1.1 1.2 0.3 0.7 0.7 0.1 5.3 5.3 0.0 InitQueuDel: 0.0 0.0 0.0 0.0 0.0 0.0 0.0 0.0 0.0 0.0 0.0 0.0 Delay Adj: 1.00 1.00 1.00 1.00 1.00 1.00 1.00 1.00 1.00 1.00 1.00 1.00 Delay/Veh: 16.8 24.8 19.3 18.8 24.6 20.0 21.5 21.5 14.3 29.2 29.2 14.9 User DelAdj: 1.00 1.00 1.00 1.00 1.00 1.00 1.00 1.00 1.00 1.00 1.00 1.00 AdjDel/Veh: 16.8 24.8 19.3 18.8 24.6 20.0 21.5 21.5 14.3 29.2 29.2 14.9 LOS by Move: B C B B C C C C B C C B HCM2kAvgQ: 2 16 5 1 14 5 5 5 1 10 10 1 ********************************************************************************

Note: Queue reported is the number of cars per lane.********************************************************************************
CB_PM Tue Nov 6, 2007 11:34:32 Page 13-1 ---------------------------------------------------------------------------------------------------------------------------------------------------------------- Level Of Service Computation Report 2000 HCM Unsignalized Method (Base Volume Alternative) ********************************************************************************Intersection #12 Ane Keohokalole Hwy / Kealakehe Pkwy ********************************************************************************Average Delay (sec/veh): OVERFLOW Worst Case Level Of Service: F[xxxxx]********************************************************************************Street Name: Ane Keohokalole Hwy Kealakehe Pkwy Approach: North Bound South Bound East Bound West Bound Movement: L - T - R L - T - R L - T - R L - T - R ------------|---------------||---------------||---------------||---------------|Control: Stop Sign Stop Sign Uncontrolled UncontrolledRights: Include Include Include Include Lanes: 1 0 1 0 1 1 0 0 1 0 1 0 1 1 0 1 0 1 0 1 ------------|---------------||---------------||---------------||---------------|Volume Module:Base Vol: 78 288 0 50 257 369 165 194 76 5 128 23 Growth Adj: 1.00 1.00 1.00 1.00 1.00 1.00 1.00 1.00 1.00 1.00 1.00 1.00 Initial Bse: 78 288 0 50 257 369 165 194 76 5 128 23 User Adj: 1.00 1.00 1.00 1.00 1.00 1.00 1.00 1.00 1.00 1.00 1.00 1.00 PHF Adj: 0.95 0.95 0.95 0.95 0.95 0.95 0.95 0.95 0.95 0.95 0.95 0.95 PHF Volume: 82 303 0 53 271 388 174 204 80 5 135 24 Reduct Vol: 0 0 0 0 0 0 0 0 0 0 0 0 FinalVolume: 82 303 0 53 271 388 174 204 80 5 135 24 ------------|---------------||---------------||---------------||---------------|Critical Gap Module:Critical Gp: 7.1 6.5 6.2 7.1 6.5 6.2 4.1 xxxx xxxxx 4.1 xxxx xxxxx FollowUpTim: 3.5 4.0 3.3 3.5 4.0 3.3 2.2 xxxx xxxxx 2.2 xxxx xxxxx ------------|---------------||---------------||---------------||---------------|Capacity Module:Cnflict Vol: 1078 761 142 746 777 135 159 xxxx xxxxx 284 xxxx xxxxx Potent Cap.: 198 337 911 332 330 920 1433 xxxx xxxxx 1290 xxxx xxxxx Move Cap.: 18 295 911 0 289 920 1433 xxxx xxxxx 1290 xxxx xxxxx Volume/Cap: 4.46 1.03 0.00 xxxx 0.94 0.42 0.12 xxxx xxxx 0.00 xxxx xxxx ------------|---------------||---------------||---------------||---------------|Level Of Service Module:2Way95thQ: 10.8 11.2 xxxxx xxxx xxxx xxxxx 0.4 xxxx xxxxx 0.0 xxxx xxxxx Control Del: 1980 98.4 xxxxx xxxxx xxxx xxxxx 7.9 xxxx xxxxx 7.8 xxxx xxxxx LOS by Move: F F * * * * A * * A * * Movement: LT - LTR - RT LT - LTR - RT LT - LTR - RT LT - LTR - RT Shared Cap.: xxxx xxxx xxxxx xxxx xxxx 485 xxxx xxxx xxxxx xxxx xxxx xxxxx SharedQueue:xxxxx xxxx xxxxx xxxxx xxxx 30.0 xxxxx xxxx xxxxx xxxxx xxxx xxxxx Shrd ConDel:xxxxx xxxx xxxxx xxxxx xxxx 197.9 xxxxx xxxx xxxxx xxxxx xxxx xxxxx Shared LOS: * * * * * F * * * * * * ApproachDel: 499.3 xxxxxx xxxxxx xxxxxxApproachLOS: F F * * ********************************************************************************

CUMULATIVE PLUS PROJECT CONDITIONS – CONCEPT A

CP(A)_AM Tue Nov 6, 2007 11:57:18 Page 3-1 ---------------------------------------------------------------------------------------------------------------------------------------------------------------- Level Of Service Computation Report 2000 HCM Operations Method (Base Volume Alternative) ********************************************************************************Intersection #1 Queen Kaahumanu Hwy / Henry St ********************************************************************************Cycle (sec): 100 Critical Vol./Cap.(X): 0.885Loss Time (sec): 10 (Y+R=4.0 sec) Average Delay (sec/veh): 28.9Optimal Cycle: 98 Level Of Service: C********************************************************************************Street Name: Queen Kaahumanu Hwy Henry St Approach: North Bound South Bound East Bound West Bound Movement: L - T - R L - T - R L - T - R L - T - R ------------|---------------||---------------||---------------||---------------|Control: Prot+Permit Prot+Permit Prot+Permit Prot+Permit Rights: Ovl Ovl Ovl Ovl Min. Green: 0 0 0 0 0 0 0 0 0 0 0 0 Lanes: 1 0 2 0 1 1 0 3 0 1 1 0 2 0 1 1 1 1 0 1 ------------|---------------||---------------||---------------||---------------|Volume Module:Base Vol: 320 799 922 130 553 132 76 412 25 615 638 99 Growth Adj: 1.00 1.00 1.00 1.00 1.00 1.00 1.00 1.00 1.00 1.00 1.00 1.00 Initial Bse: 320 799 922 130 553 132 76 412 25 615 638 99 User Adj: 1.00 1.00 1.00 1.00 1.00 1.00 1.00 1.00 1.00 1.00 1.00 1.00 PHF Adj: 0.95 0.95 0.95 0.95 0.95 0.95 0.95 0.95 0.95 0.95 0.95 0.95 PHF Volume: 337 841 971 137 582 139 80 434 26 647 672 104 Reduct Vol: 0 0 0 0 0 0 0 0 0 0 0 0 Reduced Vol: 337 841 971 137 582 139 80 434 26 647 672 104 PCE Adj: 1.00 1.00 1.00 1.00 1.00 1.00 1.00 1.00 1.00 1.00 1.00 1.00 MLF Adj: 1.00 1.00 1.00 1.00 1.00 1.00 1.00 1.00 1.00 1.00 1.00 1.00 FinalVolume: 337 841 971 137 582 139 80 434 26 647 672 104 ------------|---------------||---------------||---------------||---------------|Saturation Flow Module:Sat/Lane: 1900 1900 1900 1900 1900 1900 1900 1900 1900 1900 1900 1900 Adjustment: 0.95 0.95 0.85 0.95 0.91 0.85 0.95 0.95 0.85 0.93 0.93 0.85 Lanes: 1.00 2.00 1.00 1.00 3.00 1.00 1.00 2.00 1.00 1.47 1.53 1.00 Final Sat.: 1805 3610 1615 1805 5187 1615 1805 3610 1615 2594 2691 1615 ------------|---------------||---------------||---------------||---------------|Capacity Analysis Module:Vol/Sat: 0.19 0.23 0.60 0.08 0.11 0.09 0.04 0.12 0.02 0.25 0.25 0.06 Crit Moves: **** **** **** **** Green/Cycle: 0.50 0.40 0.68 0.27 0.18 0.24 0.20 0.14 0.44 0.44 0.35 0.44 Volume/Cap: 0.54 0.59 0.89 0.52 0.62 0.35 0.37 0.89 0.04 0.68 0.70 0.15 Uniform Del: 15.8 23.7 12.9 29.1 37.8 31.3 33.6 42.5 16.1 21.6 27.8 16.8 IncremntDel: 1.0 0.6 8.8 1.8 1.3 0.5 1.1 17.4 0.0 1.0 1.2 0.1 InitQueuDel: 0.0 0.0 0.0 0.0 0.0 0.0 0.0 0.0 0.0 0.0 0.0 0.0 Delay Adj: 1.00 1.00 1.00 1.00 1.00 1.00 1.00 1.00 1.00 1.00 1.00 1.00 Delay/Veh: 16.8 24.4 21.8 30.8 39.0 31.8 34.7 59.8 16.1 22.6 29.0 16.8 User DelAdj: 1.00 1.00 1.00 1.00 1.00 1.00 1.00 1.00 1.00 1.00 1.00 1.00 AdjDel/Veh: 16.8 24.4 21.8 30.8 39.0 31.8 34.7 59.8 16.1 22.6 29.0 16.8 LOS by Move: B C C C D C C E B C C B HCM2kAvgQ: 8 11 27 4 7 4 3 10 0 12 13 2 ********************************************************************************Note: Queue reported is the number of cars per lane.********************************************************************************

CP(A)_AM Tue Nov 6, 2007 11:57:18 Page 4-1 ---------------------------------------------------------------------------------------------------------------------------------------------------------------- Level Of Service Computation Report 2000 HCM Operations Method (Base Volume Alternative) ********************************************************************************Intersection #2 Queen Kaahumanu Hwy / Alli Dr ********************************************************************************Cycle (sec): 100 Critical Vol./Cap.(X): 0.914Loss Time (sec): 10 (Y+R=4.0 sec) Average Delay (sec/veh): 35.0Optimal Cycle: 113 Level Of Service: D********************************************************************************Street Name: Queen Kaahumanu Hwy Alli Dr Approach: North Bound South Bound East Bound West Bound Movement: L - T - R L - T - R L - T - R L - T - R ------------|---------------||---------------||---------------||---------------|Control: Prot+Permit Prot+Permit Prot+Permit Prot+Permit Rights: Ovl Ovl Ovl Ovl Min. Green: 0 0 0 0 0 0 0 0 0 0 0 0 Lanes: 1 0 2 0 1 1 0 2 0 1 1 0 1 0 1 1 0 1 0 1 ------------|---------------||---------------||---------------||---------------|Volume Module:Base Vol: 97 807 70 189 655 372 193 144 99 76 658 78 Growth Adj: 1.00 1.00 1.00 1.00 1.00 1.00 1.00 1.00 1.00 1.00 1.00 1.00 Initial Bse: 97 807 70 189 655 372 193 144 99 76 658 78 User Adj: 1.00 1.00 1.00 1.00 1.00 1.00 1.00 1.00 1.00 1.00 1.00 1.00 PHF Adj: 0.95 0.95 0.95 0.95 0.95 0.95 0.95 0.95 0.95 0.95 0.95 0.95 PHF Volume: 102 849 74 199 689 392 203 152 104 80 693 82 Reduct Vol: 0 0 0 0 0 0 0 0 0 0 0 0 Reduced Vol: 102 849 74 199 689 392 203 152 104 80 693 82 PCE Adj: 1.00 1.00 1.00 1.00 1.00 1.00 1.00 1.00 1.00 1.00 1.00 1.00 MLF Adj: 1.00 1.00 1.00 1.00 1.00 1.00 1.00 1.00 1.00 1.00 1.00 1.00 FinalVolume: 102 849 74 199 689 392 203 152 104 80 693 82 ------------|---------------||---------------||---------------||---------------|Saturation Flow Module:Sat/Lane: 1900 1900 1900 1900 1900 1900 1900 1900 1900 1900 1900 1900 Adjustment: 0.95 0.95 0.85 0.95 0.95 0.85 0.95 1.00 0.85 0.95 1.00 0.85 Lanes: 1.00 2.00 1.00 1.00 2.00 1.00 1.00 1.00 1.00 1.00 1.00 1.00 Final Sat.: 1805 3610 1615 1805 3610 1615 1805 1900 1615 1805 1900 1615 ------------|---------------||---------------||---------------||---------------|Capacity Analysis Module:Vol/Sat: 0.06 0.24 0.05 0.11 0.19 0.24 0.11 0.08 0.06 0.04 0.36 0.05 Crit Moves: **** **** **** **** Green/Cycle: 0.34 0.26 0.44 0.40 0.29 0.41 0.46 0.34 0.42 0.54 0.40 0.52 Volume/Cap: 0.40 0.91 0.10 0.68 0.65 0.58 0.68 0.24 0.15 0.11 0.91 0.10 Uniform Del: 23.7 36.1 16.2 23.4 31.0 22.6 21.3 24.0 17.9 10.9 28.4 12.2 IncremntDel: 1.0 13.2 0.1 6.4 1.5 1.3 6.3 0.2 0.1 0.1 15.5 0.1 InitQueuDel: 0.0 0.0 0.0 0.0 0.0 0.0 0.0 0.0 0.0 0.0 0.0 0.0 Delay Adj: 1.00 1.00 1.00 1.00 1.00 1.00 1.00 1.00 1.00 1.00 1.00 1.00 Delay/Veh: 24.7 49.3 16.3 29.8 32.5 23.9 27.6 24.2 18.0 11.0 44.0 12.2 User DelAdj: 1.00 1.00 1.00 1.00 1.00 1.00 1.00 1.00 1.00 1.00 1.00 1.00 AdjDel/Veh: 24.7 49.3 16.3 29.8 32.5 23.9 27.6 24.2 18.0 11.0 44.0 12.2 LOS by Move: C D B C C C C C B B D B HCM2kAvgQ: 3 17 1 6 11 10 6 3 2 1 24 1 ********************************************************************************Note: Queue reported is the number of cars per lane.********************************************************************************

CP(A)_AM Tue Nov 6, 2007 11:57:18 Page 5-1 ---------------------------------------------------------------------------------------------------------------------------------------------------------------- Level Of Service Computation Report 2000 HCM Unsignalized Method (Base Volume Alternative) ********************************************************************************Intersection #3 Kamakaeha Ave / Palani Rd ********************************************************************************Average Delay (sec/veh): 1.4 Worst Case Level Of Service: D[ 29.1]********************************************************************************Street Name: Kamakaeha Ave Palani Rd Approach: North Bound South Bound East Bound West Bound Movement: L - T - R L - T - R L - T - R L - T - R ------------|---------------||---------------||---------------||---------------|Control: Stop Sign Stop Sign Uncontrolled UncontrolledRights: Include Include Include Ignore Lanes: 0 0 0 0 0 1 0 0 0 1 0 0 1 0 0 0 0 1 0 1 ------------|---------------||---------------||---------------||---------------|Volume Module:Base Vol: 0 0 0 47 0 15 0 404 0 0 846 240 Growth Adj: 1.00 1.00 1.00 1.00 1.00 1.00 1.00 1.00 1.00 1.00 1.00 1.00 Initial Bse: 0 0 0 47 0 15 0 404 0 0 846 240 User Adj: 1.00 1.00 1.00 1.00 1.00 1.00 1.00 1.00 1.00 1.00 1.00 0.00 PHF Adj: 0.95 0.95 0.95 0.95 0.95 0.95 0.95 0.95 0.95 0.95 0.95 0.00 PHF Volume: 0 0 0 49 0 16 0 425 0 0 891 0 Reduct Vol: 0 0 0 0 0 0 0 0 0 0 0 0 FinalVolume: 0 0 0 49 0 16 0 425 0 0 891 0 ------------|---------------||---------------||---------------||---------------|Critical Gap Module:Critical Gp:xxxxx xxxx xxxxx 6.4 xxxx 6.2 xxxxx xxxx xxxxx xxxxx xxxx xxxxx FollowUpTim:xxxxx xxxx xxxxx 3.5 xxxx 3.3 xxxxx xxxx xxxxx xxxxx xxxx xxxxx ------------|---------------||---------------||---------------||---------------|Capacity Module:Cnflict Vol: xxxx xxxx xxxxx 1316 xxxx 891 xxxx xxxx xxxxx xxxx xxxx xxxxx Potent Cap.: xxxx xxxx xxxxx 176 xxxx 344 xxxx xxxx xxxxx xxxx xxxx xxxxx Move Cap.: xxxx xxxx xxxxx 176 xxxx 344 xxxx xxxx xxxxx xxxx xxxx xxxxx Volume/Cap: xxxx xxxx xxxx 0.28 xxxx 0.05 xxxx xxxx xxxx xxxx xxxx xxxx ------------|---------------||---------------||---------------||---------------|Level Of Service Module:2Way95thQ: xxxx xxxx xxxxx 1.1 xxxx 0.1 xxxx xxxx xxxxx xxxx xxxx xxxxx Control Del:xxxxx xxxx xxxxx 33.3 xxxx 16.0 xxxxx xxxx xxxxx xxxxx xxxx xxxxx LOS by Move: * * * D * C * * * * * * Movement: LT - LTR - RT LT - LTR - RT LT - LTR - RT LT - LTR - RT Shared Cap.: xxxx xxxx xxxxx xxxx xxxx xxxxx xxxx xxxx xxxxx xxxx xxxx xxxxx SharedQueue:xxxxx xxxx xxxxx xxxxx xxxx xxxxx xxxxx xxxx xxxxx xxxxx xxxx xxxxx Shrd ConDel:xxxxx xxxx xxxxx xxxxx xxxx xxxxx xxxxx xxxx xxxxx xxxxx xxxx xxxxx Shared LOS: * * * * * * * * * * * * ApproachDel: xxxxxx 29.1 xxxxxx xxxxxxApproachLOS: * D * * ********************************************************************************Note: Queue reported is the number of cars per lane.********************************************************************************

CP(A)_AM Tue Nov 6, 2007 11:57:18 Page 6-1 ---------------------------------------------------------------------------------------------------------------------------------------------------------------- Level Of Service Computation Report 2000 HCM Operations Method (Base Volume Alternative) ********************************************************************************Intersection #4 Henry St / Palani Rd ********************************************************************************Cycle (sec): 100 Critical Vol./Cap.(X): 1.677Loss Time (sec): 10 (Y+R=4.0 sec) Average Delay (sec/veh): 220.8Optimal Cycle: 180 Level Of Service: F********************************************************************************Street Name: Henry St Palani Rd Approach: North Bound South Bound East Bound West Bound Movement: L - T - R L - T - R L - T - R L - T - R ------------|---------------||---------------||---------------||---------------|Control: Permitted Permitted Permitted Prot+Permit Rights: Ovl Include Include Include Min. Green: 0 0 0 0 0 0 0 0 0 0 0 0 Lanes: 1 0 0 1 0 1 0 0 1 0 1 0 0 1 0 1 0 0 1 0 ------------|---------------||---------------||---------------||---------------|Volume Module:Base Vol: 122 404 454 86 492 288 237 185 37 927 810 90 Growth Adj: 1.00 1.00 1.00 1.00 1.00 1.00 1.00 1.00 1.00 1.00 1.00 1.00 Initial Bse: 122 404 454 86 492 288 237 185 37 927 810 90 User Adj: 1.00 1.00 1.00 1.00 1.00 1.00 1.00 1.00 1.00 1.00 1.00 1.00 PHF Adj: 0.95 0.95 0.95 0.95 0.95 0.95 0.95 0.95 0.95 0.95 0.95 0.95 PHF Volume: 128 425 478 91 518 303 249 195 39 976 853 95 Reduct Vol: 0 0 0 0 0 0 0 0 0 0 0 0 Reduced Vol: 128 425 478 91 518 303 249 195 39 976 853 95 PCE Adj: 1.00 1.00 1.00 1.00 1.00 1.00 1.00 1.00 1.00 1.00 1.00 1.00 MLF Adj: 1.00 1.00 1.00 1.00 1.00 1.00 1.00 1.00 1.00 1.00 1.00 1.00 FinalVolume: 128 425 478 91 518 303 249 195 39 976 853 95 ------------|---------------||---------------||---------------||---------------|Saturation Flow Module:Sat/Lane: 1900 1900 1900 1900 1900 1900 1900 1900 1900 1900 1900 1900 Adjustment: 0.08 0.92 0.92 0.08 0.95 0.95 0.95 0.98 0.98 0.77 0.99 0.99 Lanes: 1.00 0.47 0.53 1.00 0.63 0.37 1.00 0.83 0.17 1.00 0.90 0.10 Final Sat.: 152 824 926 152 1133 663 1805 1544 309 1468 1684 187 ------------|---------------||---------------||---------------||---------------|Capacity Analysis Module:Vol/Sat: 0.84 0.52 0.52 0.60 0.46 0.46 0.14 0.13 0.13 0.66 0.51 0.51 Crit Moves: **** **** Green/Cycle: 0.50 0.50 0.82 0.50 0.50 0.50 0.09 0.08 0.08 0.31 0.31 0.31 Volume/Cap: 1.68 1.03 0.63 1.18 0.91 0.91 1.62 1.68 1.68 1.71 1.62 1.62 Uniform Del: 24.9 24.9 3.2 24.9 22.8 22.8 45.7 46.2 46.2 34.6 34.4 34.4 IncremntDel:355.5 37.2 0.9 161.0 13.0 13.0 308.0 335 334.7 328.3 288 288.0 InitQueuDel: 0.0 0.0 0.0 0.0 0.0 0.0 0.0 0.0 0.0 0.0 0.0 0.0 Delay Adj: 1.00 1.00 1.00 1.00 1.00 1.00 1.00 1.00 1.00 1.00 1.00 1.00 Delay/Veh: 380.4 62.1 4.0 185.9 35.7 35.7 353.7 381 381.0 362.9 322 322.4 User DelAdj: 1.00 1.00 1.00 1.00 1.00 1.00 1.00 1.00 1.00 1.00 1.00 1.00 AdjDel/Veh: 380.4 62.1 4.0 185.9 35.7 35.7 353.7 381 381.0 362.9 322 322.4 LOS by Move: F E A F D D F F F F F F HCM2kAvgQ: 12 37 11 7 27 27 21 20 20 80 74 74 ********************************************************************************Note: Queue reported is the number of cars per lane.********************************************************************************

CP(A)_AM Tue Nov 6, 2007 11:57:18 Page 7-1 ---------------------------------------------------------------------------------------------------------------------------------------------------------------- Level Of Service Computation Report 2000 HCM Unsignalized Method (Base Volume Alternative) ********************************************************************************Intersection #5 Gate 2/Palani ********************************************************************************Average Delay (sec/veh): 0.7 Worst Case Level Of Service: F[ 70.5]********************************************************************************Street Name: Gate 2 /Palani Rd Approach: North Bound South Bound East Bound West Bound Movement: L - T - R L - T - R L - T - R L - T - R ------------|---------------||---------------||---------------||---------------|Control: Stop Sign Yield Sign Uncontrolled UncontrolledRights: Include Include Include Include Lanes: 0 0 0 0 0 0 0 0 0 1 0 0 1 0 0 0 0 0 1 0 ------------|---------------||---------------||---------------||---------------|Volume Module:Base Vol: 0 0 0 0 0 27 0 725 0 0 1800 95 Growth Adj: 1.00 1.00 1.00 1.00 1.00 1.00 1.00 1.00 1.00 1.00 1.00 1.00 Initial Bse: 0 0 0 0 0 27 0 725 0 0 1800 95 User Adj: 1.00 1.00 1.00 1.00 1.00 1.00 1.00 1.00 1.00 1.00 1.00 1.00 PHF Adj: 0.95 0.95 0.95 0.95 0.95 0.95 0.95 0.95 0.95 0.95 0.95 0.95 PHF Volume: 0 0 0 0 0 28 0 763 0 0 1895 100 Reduct Vol: 0 0 0 0 0 0 0 0 0 0 0 0 FinalVolume: 0 0 0 0 0 28 0 763 0 0 1895 100 ------------|---------------||---------------||---------------||---------------|Critical Gap Module:Critical Gp:xxxxx xxxx xxxxx xxxxx xxxx 6.2 xxxxx xxxx xxxxx xxxxx xxxx xxxxx FollowUpTim:xxxxx xxxx xxxxx xxxxx xxxx 3.3 xxxxx xxxx xxxxx xxxxx xxxx xxxxx ------------|---------------||---------------||---------------||---------------|Capacity Module:Cnflict Vol: xxxx xxxx xxxxx xxxx xxxx 1945 xxxx xxxx xxxxx xxxx xxxx xxxxx Potent Cap.: xxxx xxxx xxxxx xxxx xxxx 82 xxxx xxxx xxxxx xxxx xxxx xxxxx Move Cap.: xxxx xxxx xxxxx xxxx xxxx 82 xxxx xxxx xxxxx xxxx xxxx xxxxx Volume/Cap: xxxx xxxx xxxx xxxx xxxx 0.35 xxxx xxxx xxxx xxxx xxxx xxxx ------------|---------------||---------------||---------------||---------------|Level Of Service Module:2Way95thQ: xxxx xxxx xxxxx xxxx xxxx 1.3 xxxx xxxx xxxxx xxxx xxxx xxxxx Control Del:xxxxx xxxx xxxxx xxxxx xxxx 70.5 xxxxx xxxx xxxxx xxxxx xxxx xxxxx LOS by Move: * * * * * F * * * * * * Movement: LT - LTR - RT LT - LTR - RT LT - LTR - RT LT - LTR - RT Shared Cap.: xxxx xxxx xxxxx xxxx xxxx xxxxx xxxx xxxx xxxxx xxxx xxxx xxxxx SharedQueue:xxxxx xxxx xxxxx xxxxx xxxx xxxxx xxxxx xxxx xxxxx xxxxx xxxx xxxxx Shrd ConDel:xxxxx xxxx xxxxx xxxxx xxxx xxxxx xxxxx xxxx xxxxx xxxxx xxxx xxxxx Shared LOS: * * * * * * * * * * * * ApproachDel: xxxxxx 70.5 xxxxxx xxxxxxApproachLOS: * F * * ********************************************************************************Note: Queue reported is the number of cars per lane.********************************************************************************

CP(A)_AM Tue Nov 6, 2007 11:57:18 Page 8-1 ---------------------------------------------------------------------------------------------------------------------------------------------------------------- Level Of Service Computation Report 2000 HCM Operations Method (Base Volume Alternative) ********************************************************************************Intersection #6 Queen Kaahumanu Hwy / Makala Blvd ********************************************************************************Cycle (sec): 100 Critical Vol./Cap.(X): 0.661Loss Time (sec): 10 (Y+R=4.0 sec) Average Delay (sec/veh): 22.1Optimal Cycle: 49 Level Of Service: C********************************************************************************Street Name: Queen Kaahumanu Hwy Makala Blvd Approach: North Bound South Bound East Bound West Bound Movement: L - T - R L - T - R L - T - R L - T - R ------------|---------------||---------------||---------------||---------------|Control: Prot+Permit Prot+Permit Prot+Permit Prot+Permit Rights: Ovl Ovl Include Include Min. Green: 0 0 0 0 0 0 0 0 0 0 0 0 Lanes: 1 0 2 0 1 1 0 2 0 1 1 0 0 1 0 1 0 0 1 0 ------------|---------------||---------------||---------------||---------------|Volume Module:Base Vol: 10 929 30 68 903 200 309 72 32 7 21 143 Growth Adj: 1.00 1.00 1.00 1.00 1.00 1.00 1.00 1.00 1.00 1.00 1.00 1.00 Initial Bse: 10 929 30 68 903 200 309 72 32 7 21 143 User Adj: 1.00 1.00 1.00 1.00 1.00 1.00 1.00 1.00 1.00 1.00 1.00 1.00 PHF Adj: 0.95 0.95 0.95 0.95 0.95 0.95 0.95 0.95 0.95 0.95 0.95 0.95 PHF Volume: 11 978 32 72 951 211 325 76 34 7 22 151 Reduct Vol: 0 0 0 0 0 0 0 0 0 0 0 0 Reduced Vol: 11 978 32 72 951 211 325 76 34 7 22 151 PCE Adj: 1.00 1.00 1.00 1.00 1.00 1.00 1.00 1.00 1.00 1.00 1.00 1.00 MLF Adj: 1.00 1.00 1.00 1.00 1.00 1.00 1.00 1.00 1.00 1.00 1.00 1.00 FinalVolume: 11 978 32 72 951 211 325 76 34 7 22 151 ------------|---------------||---------------||---------------||---------------|Saturation Flow Module:Sat/Lane: 1900 1900 1900 1900 1900 1900 1900 1900 1900 1900 1900 1900 Adjustment: 0.95 0.95 0.85 0.95 0.95 0.85 0.95 0.95 0.95 0.95 0.87 0.87 Lanes: 1.00 2.00 1.00 1.00 2.00 1.00 1.00 0.69 0.31 1.00 0.13 0.87 Final Sat.: 1805 3610 1615 1805 3610 1615 1805 1255 558 1805 211 1440 ------------|---------------||---------------||---------------||---------------|Capacity Analysis Module:Vol/Sat: 0.01 0.27 0.02 0.04 0.26 0.13 0.18 0.06 0.06 0.00 0.10 0.10 Crit Moves: **** **** **** **** Green/Cycle: 0.42 0.41 0.44 0.49 0.46 0.73 0.45 0.40 0.40 0.19 0.16 0.16 Volume/Cap: 0.06 0.66 0.04 0.33 0.57 0.18 0.54 0.15 0.15 0.03 0.66 0.66 Uniform Del: 17.8 23.9 16.2 16.5 19.8 4.1 18.6 18.9 18.9 33.3 39.6 39.6 IncremntDel: 0.1 1.1 0.0 0.9 0.5 0.1 1.0 0.1 0.1 0.0 6.2 6.2 InitQueuDel: 0.0 0.0 0.0 0.0 0.0 0.0 0.0 0.0 0.0 0.0 0.0 0.0 Delay Adj: 1.00 1.00 1.00 1.00 1.00 1.00 1.00 1.00 1.00 1.00 1.00 1.00 Delay/Veh: 18.0 25.0 16.2 17.4 20.3 4.2 19.6 19.0 19.0 33.4 45.8 45.8 User DelAdj: 1.00 1.00 1.00 1.00 1.00 1.00 1.00 1.00 1.00 1.00 1.00 1.00 AdjDel/Veh: 18.0 25.0 16.2 17.4 20.3 4.2 19.6 19.0 19.0 33.4 45.8 45.8 LOS by Move: B C B B C A B B B C D D HCM2kAvgQ: 0 13 1 2 12 2 8 2 2 0 6 6 ********************************************************************************Note: Queue reported is the number of cars per lane.********************************************************************************

CP(A)_AM Tue Nov 6, 2007 11:57:18 Page 9-1 ---------------------------------------------------------------------------------------------------------------------------------------------------------------- Level Of Service Computation Report 2000 HCM Unsignalized Method (Base Volume Alternative) ********************************************************************************Intersection #7 Ane Keohokahole/Main Gate ********************************************************************************Average Delay (sec/veh): 91.7 Worst Case Level Of Service: F[410.4]********************************************************************************Street Name: Ane Keohokahole Hwy Main Gate Approach: North Bound South Bound East Bound West Bound Movement: L - T - R L - T - R L - T - R L - T - R ------------|---------------||---------------||---------------||---------------|Control: Uncontrolled Uncontrolled Stop Sign Stop Sign Rights: Include Include Include Include Lanes: 0 0 1 0 1 1 0 1 0 0 0 0 0 0 0 1 0 0 0 1 ------------|---------------||---------------||---------------||---------------|Volume Module:Base Vol: 0 447 284 189 620 0 0 0 0 246 0 191 Growth Adj: 1.00 1.00 1.00 1.00 1.00 1.00 1.00 1.00 1.00 1.00 1.00 1.00 Initial Bse: 0 447 284 189 620 0 0 0 0 246 0 191 User Adj: 1.00 1.00 1.00 1.00 1.00 1.00 1.00 1.00 1.00 1.00 1.00 1.00 PHF Adj: 0.95 0.95 0.95 0.95 0.95 0.95 0.95 0.95 0.95 0.95 0.95 0.95 PHF Volume: 0 471 299 199 653 0 0 0 0 259 0 201 Reduct Vol: 0 0 0 0 0 0 0 0 0 0 0 0 FinalVolume: 0 471 299 199 653 0 0 0 0 259 0 201 ------------|---------------||---------------||---------------||---------------|Critical Gap Module:Critical Gp:xxxxx xxxx xxxxx 4.1 xxxx xxxxx xxxxx xxxx xxxxx 6.4 xxxx 6.2 FollowUpTim:xxxxx xxxx xxxxx 2.2 xxxx xxxxx xxxxx xxxx xxxxx 3.5 xxxx 3.3 ------------|---------------||---------------||---------------||---------------|Capacity Module:Cnflict Vol: xxxx xxxx xxxxx 769 xxxx xxxxx xxxx xxxx xxxxx 1521 xxxx 471 Potent Cap.: xxxx xxxx xxxxx 854 xxxx xxxxx xxxx xxxx xxxxx 132 xxxx 597 Move Cap.: xxxx xxxx xxxxx 854 xxxx xxxxx xxxx xxxx xxxxx 108 xxxx 597 Volume/Cap: xxxx xxxx xxxx 0.23 xxxx xxxx xxxx xxxx xxxx 2.39 xxxx 0.34 ------------|---------------||---------------||---------------||---------------|Level Of Service Module:2Way95thQ: xxxx xxxx xxxxx 0.9 xxxx xxxxx xxxx xxxx xxxxx 23.1 xxxx 1.5 Control Del:xxxxx xxxx xxxxx 10.5 xxxx xxxxx xxxxx xxxx xxxxx 718.2 xxxx 14.1 LOS by Move: * * * B * * * * * F * B Movement: LT - LTR - RT LT - LTR - RT LT - LTR - RT LT - LTR - RT Shared Cap.: xxxx xxxx xxxxx xxxx xxxx xxxxx xxxx xxxx xxxxx xxxx xxxx xxxxx SharedQueue:xxxxx xxxx xxxxx xxxxx xxxx xxxxx xxxxx xxxx xxxxx xxxxx xxxx xxxxx Shrd ConDel:xxxxx xxxx xxxxx xxxxx xxxx xxxxx xxxxx xxxx xxxxx xxxxx xxxx xxxxx Shared LOS: * * * * * * * * * * * * ApproachDel: xxxxxx xxxxxx xxxxxx 410.4ApproachLOS: * * * F ********************************************************************************Note: Queue reported is the number of cars per lane.********************************************************************************

CP(A)_AM Tue Nov 6, 2007 11:57:18 Page 10-1 ---------------------------------------------------------------------------------------------------------------------------------------------------------------- Level Of Service Computation Report 2000 HCM Operations Method (Base Volume Alternative) ********************************************************************************Intersection #8 Palihiolo St/Palani Rd ********************************************************************************Cycle (sec): 100 Critical Vol./Cap.(X): 1.638Loss Time (sec): 10 (Y+R=4.0 sec) Average Delay (sec/veh): 193.6Optimal Cycle: 180 Level Of Service: F********************************************************************************Street Name: Palihiolo St Palani Rd Approach: North Bound South Bound East Bound West Bound Movement: L - T - R L - T - R L - T - R L - T - R ------------|---------------||---------------||---------------||---------------|Control: Permitted Permitted Prot+Permit Permitted Rights: Include Include Include Ignore Min. Green: 0 0 0 0 0 0 0 0 0 0 0 0 Lanes: 0 1 0 0 1 1 0 0 1 0 1 0 0 1 0 1 0 1 0 1 ------------|---------------||---------------||---------------||---------------|Volume Module:Base Vol: 5 20 32 10 15 553 438 531 6 20 1317 56 Growth Adj: 1.00 1.00 1.00 1.00 1.00 1.00 1.00 1.00 1.00 1.00 1.00 1.00 Initial Bse: 5 20 32 10 15 553 438 531 6 20 1317 56 User Adj: 1.00 1.00 1.00 1.00 1.00 1.00 1.00 1.00 1.00 1.00 1.00 0.00 PHF Adj: 0.95 0.95 0.95 0.95 0.95 0.95 0.95 0.95 0.95 0.95 0.95 0.00 PHF Volume: 5 21 34 11 16 582 461 559 6 21 1386 0 Reduct Vol: 0 0 0 0 0 0 0 0 0 0 0 0 Reduced Vol: 5 21 34 11 16 582 461 559 6 21 1386 0 PCE Adj: 1.00 1.00 1.00 1.00 1.00 1.00 1.00 1.00 1.00 1.00 1.00 0.00 MLF Adj: 1.00 1.00 1.00 1.00 1.00 1.00 1.00 1.00 1.00 1.00 1.00 0.00 FinalVolume: 5 21 34 11 16 582 461 559 6 21 1386 0 ------------|---------------||---------------||---------------||---------------|Saturation Flow Module:Sat/Lane: 1900 1900 1900 1900 1900 1900 1900 1900 1900 1900 1900 1900 Adjustment: 0.64 0.64 0.85 0.75 0.85 0.85 0.22 1.00 1.00 0.95 1.00 1.00 Lanes: 0.20 0.80 1.00 1.00 0.03 0.97 1.00 0.99 0.01 1.00 1.00 1.00 Final Sat.: 244 977 1615 1419 43 1580 417 1875 21 1805 1900 1900 ------------|---------------||---------------||---------------||---------------|Capacity Analysis Module:Vol/Sat: 0.02 0.02 0.02 0.01 0.37 0.37 1.11 0.30 0.30 0.01 0.73 0.00 Crit Moves: **** **** Green/Cycle: 0.25 0.25 0.25 0.25 0.25 0.25 0.63 0.63 0.63 0.02 0.49 0.00 Volume/Cap: 0.09 0.09 0.09 0.03 1.50 1.50 1.21 0.47 0.47 0.47 1.50 0.00 Uniform Del: 29.1 29.1 29.1 28.7 37.7 37.7 32.5 9.7 9.7 48.1 25.7 0.0 IncremntDel: 0.1 0.1 0.1 0.0 240 239.6 114.6 0.3 0.3 7.7 232 0.0 InitQueuDel: 0.0 0.0 0.0 0.0 0.0 0.0 0.0 0.0 0.0 0.0 0.0 0.0 Delay Adj: 1.00 1.00 1.00 1.00 1.00 1.00 1.00 1.00 1.00 1.00 1.00 0.00 Delay/Veh: 29.3 29.3 29.2 28.7 277 277.3 147.1 10.0 10.0 55.9 258 0.0 User DelAdj: 1.00 1.00 1.00 1.00 1.00 1.00 1.00 1.00 1.00 1.00 1.00 1.00 AdjDel/Veh: 29.3 29.3 29.2 28.7 277 277.3 147.1 10.0 10.0 55.9 258 0.0 LOS by Move: C C C C F F F B B E F A HCM2kAvgQ: 1 1 1 0 44 44 27 9 9 1 99 0 ********************************************************************************Note: Queue reported is the number of cars per lane.********************************************************************************

CP(A)_AM Tue Nov 6, 2007 11:57:18 Page 11-1 ---------------------------------------------------------------------------------------------------------------------------------------------------------------- Level Of Service Computation Report 2000 HCM Unsignalized Method (Base Volume Alternative) ********************************************************************************Intersection #10 Palani Rd / Uluaoa St ********************************************************************************Average Delay (sec/veh): 42.9 Worst Case Level Of Service: F[227.2]********************************************************************************Street Name: Palani Rd Uluaoa St Approach: North Bound South Bound East Bound West Bound Movement: L - T - R L - T - R L - T - R L - T - R ------------|---------------||---------------||---------------||---------------|Control: Uncontrolled Uncontrolled Stop Sign Stop Sign Rights: Include Include Include Include Lanes: 0 1 0 0 0 0 0 0 1 0 1 0 0 0 1 0 0 0 0 0 ------------|---------------||---------------||---------------||---------------|Volume Module:Base Vol: 58 477 0 0 786 311 176 0 200 0 0 0 Growth Adj: 1.00 1.00 1.00 1.00 1.00 1.00 1.00 1.00 1.00 1.00 1.00 1.00 Initial Bse: 58 477 0 0 786 311 176 0 200 0 0 0 User Adj: 1.00 1.00 1.00 1.00 1.00 1.00 1.00 1.00 1.00 1.00 1.00 1.00 PHF Adj: 0.95 0.95 0.95 0.95 0.95 0.95 0.95 0.95 0.95 0.95 0.95 0.95 PHF Volume: 61 502 0 0 827 327 185 0 211 0 0 0 Reduct Vol: 0 0 0 0 0 0 0 0 0 0 0 0 FinalVolume: 61 502 0 0 827 327 185 0 211 0 0 0 ------------|---------------||---------------||---------------||---------------|Critical Gap Module:Critical Gp: 4.1 xxxx xxxxx xxxxx xxxx xxxxx 6.4 xxxx 6.2 xxxxx xxxx xxxxx FollowUpTim: 2.2 xxxx xxxxx xxxxx xxxx xxxxx 3.5 xxxx 3.3 xxxxx xxxx xxxxx ------------|---------------||---------------||---------------||---------------|Capacity Module:Cnflict Vol: 1155 xxxx xxxxx xxxx xxxx xxxxx 1615 xxxx 991 xxxx xxxx xxxxx Potent Cap.: 612 xxxx xxxxx xxxx xxxx xxxxx 115 xxxx 301 xxxx xxxx xxxxx Move Cap.: 612 xxxx xxxxx xxxx xxxx xxxxx 106 xxxx 301 xxxx xxxx xxxxx Volume/Cap: 0.10 xxxx xxxx xxxx xxxx xxxx 1.74 xxxx 0.70 xxxx xxxx xxxx ------------|---------------||---------------||---------------||---------------|Level Of Service Module:2Way95thQ: 0.3 xxxx xxxxx xxxx xxxx xxxxx 14.6 xxxx 4.9 xxxx xxxx xxxxx Control Del: 11.5 xxxx xxxxx xxxxx xxxx xxxxx 439.3 xxxx 40.6 xxxxx xxxx xxxxx LOS by Move: B * * * * * F * E * * * Movement: LT - LTR - RT LT - LTR - RT LT - LTR - RT LT - LTR - RT Shared Cap.: xxxx xxxx xxxxx xxxx xxxx xxxxx xxxx xxxx xxxxx xxxx xxxx xxxxx SharedQueue: 0.3 xxxx xxxxx xxxxx xxxx xxxxx xxxxx xxxx xxxxx xxxxx xxxx xxxxx Shrd ConDel: 11.5 xxxx xxxxx xxxxx xxxx xxxxx xxxxx xxxx xxxxx xxxxx xxxx xxxxx Shared LOS: B * * * * * * * * * * * ApproachDel: xxxxxx xxxxxx 227.2 xxxxxxApproachLOS: * * F * ********************************************************************************Note: Queue reported is the number of cars per lane.********************************************************************************

CP(A)_AM Tue Nov 6, 2007 11:57:18 Page 12-1 ---------------------------------------------------------------------------------------------------------------------------------------------------------------- Level Of Service Computation Report 2000 HCM Operations Method (Base Volume Alternative) ********************************************************************************Intersection #11 Queen Kaahumanu Hwy / Kealakehe Pkwy ********************************************************************************Cycle (sec): 100 Critical Vol./Cap.(X): 0.825Loss Time (sec): 10 (Y+R=4.0 sec) Average Delay (sec/veh): 28.1Optimal Cycle: 78 Level Of Service: C********************************************************************************Street Name: Queen Kaahumanu Hwy Kaalakehe Pkwy Approach: North Bound South Bound East Bound West Bound Movement: L - T - R L - T - R L - T - R L - T - R ------------|---------------||---------------||---------------||---------------|Control: Prot+Permit Prot+Permit Permitted Permitted Rights: Ovl Ovl Ovl Ovl Min. Green: 0 0 0 0 0 0 0 0 0 0 0 0 Lanes: 1 0 2 0 1 1 0 2 0 1 0 1 0 0 1 0 1 0 0 1 ------------|---------------||---------------||---------------||---------------|Volume Module:Base Vol: 115 1022 422 266 973 249 81 107 10 231 61 163 Growth Adj: 1.00 1.00 1.00 1.00 1.00 1.00 1.00 1.00 1.00 1.00 1.00 1.00 Initial Bse: 115 1022 422 266 973 249 81 107 10 231 61 163 User Adj: 1.00 1.00 1.00 1.00 1.00 1.00 1.00 1.00 1.00 1.00 1.00 1.00 PHF Adj: 0.95 0.95 0.95 0.95 0.95 0.95 0.95 0.95 0.95 0.95 0.95 0.95 PHF Volume: 121 1076 444 280 1024 262 85 113 11 243 64 172 Reduct Vol: 0 0 0 0 0 0 0 0 0 0 0 0 Reduced Vol: 121 1076 444 280 1024 262 85 113 11 243 64 172 PCE Adj: 1.00 1.00 1.00 1.00 1.00 1.00 1.00 1.00 1.00 1.00 1.00 1.00 MLF Adj: 1.00 1.00 1.00 1.00 1.00 1.00 1.00 1.00 1.00 1.00 1.00 1.00 FinalVolume: 121 1076 444 280 1024 262 85 113 11 243 64 172 ------------|---------------||---------------||---------------||---------------|Saturation Flow Module:Sat/Lane: 1900 1900 1900 1900 1900 1900 1900 1900 1900 1900 1900 1900 Adjustment: 0.95 0.95 0.85 0.95 0.95 0.85 0.61 0.61 0.85 0.56 0.56 0.85 Lanes: 1.00 2.00 1.00 1.00 2.00 1.00 0.43 0.57 1.00 0.79 0.21 1.00 Final Sat.: 1805 3610 1615 1805 3610 1615 499 659 1615 840 222 1615 ------------|---------------||---------------||---------------||---------------|Capacity Analysis Module:Vol/Sat: 0.07 0.30 0.28 0.16 0.28 0.16 0.17 0.17 0.01 0.29 0.29 0.11 Crit Moves: **** **** **** Green/Cycle: 0.47 0.36 0.36 0.58 0.44 0.44 0.35 0.35 0.46 0.35 0.35 0.54 Volume/Cap: 0.38 0.83 0.76 0.68 0.64 0.37 0.49 0.49 0.01 0.83 0.83 0.20 Uniform Del: 16.2 29.1 28.1 22.9 21.6 18.4 25.4 25.4 14.9 29.7 29.7 11.9 IncremntDel: 0.8 4.4 5.8 4.4 0.9 0.3 0.9 0.9 0.0 13.9 13.9 0.1 InitQueuDel: 0.0 0.0 0.0 0.0 0.0 0.0 0.0 0.0 0.0 0.0 0.0 0.0 Delay Adj: 1.00 1.00 1.00 1.00 1.00 1.00 1.00 1.00 1.00 1.00 1.00 1.00 Delay/Veh: 17.0 33.5 34.0 27.3 22.4 18.8 26.3 26.3 14.9 43.6 43.6 12.0 User DelAdj: 1.00 1.00 1.00 1.00 1.00 1.00 1.00 1.00 1.00 1.00 1.00 1.00 AdjDel/Veh: 17.0 33.5 34.0 27.3 22.4 18.8 26.3 26.3 14.9 43.6 43.6 12.0 LOS by Move: B C C C C B C C B D D B HCM2kAvgQ: 3 18 14 7 13 5 5 5 0 11 11 3 ********************************************************************************Note: Queue reported is the number of cars per lane.********************************************************************************

CP(A)_AM Tue Nov 6, 2007 11:57:18 Page 13-1 ---------------------------------------------------------------------------------------------------------------------------------------------------------------- Level Of Service Computation Report 2000 HCM Unsignalized Method (Base Volume Alternative) ********************************************************************************Intersection #12 Ane Keohokalole Hwy / Kealakehe Pkwy ********************************************************************************Average Delay (sec/veh): OVERFLOW Worst Case Level Of Service: F[xxxxx]********************************************************************************Street Name: Ane Keohokalole Hwy Kealakehe Pkwy Approach: North Bound South Bound East Bound West Bound Movement: L - T - R L - T - R L - T - R L - T - R ------------|---------------||---------------||---------------||---------------|Control: Stop Sign Stop Sign Uncontrolled UncontrolledRights: Include Include Include Include Lanes: 1 0 1 0 1 1 0 0 1 0 1 0 1 1 0 1 0 1 0 1 ------------|---------------||---------------||---------------||---------------|Volume Module:Base Vol: 233 402 3 12 358 45 369 94 449 2 115 50 Growth Adj: 1.00 1.00 1.00 1.00 1.00 1.00 1.00 1.00 1.00 1.00 1.00 1.00 Initial Bse: 233 402 3 12 358 45 369 94 449 2 115 50 User Adj: 1.00 1.00 1.00 1.00 1.00 1.00 1.00 1.00 1.00 1.00 1.00 1.00 PHF Adj: 0.95 0.95 0.95 0.95 0.95 0.95 0.95 0.95 0.95 0.95 0.95 0.95 PHF Volume: 245 423 3 13 377 47 388 99 473 2 121 53 Reduct Vol: 0 0 0 0 0 0 0 0 0 0 0 0 FinalVolume: 245 423 3 13 377 47 388 99 473 2 121 53 ------------|---------------||---------------||---------------||---------------|Critical Gap Module:Critical Gp: 7.1 6.5 6.2 7.1 6.5 6.2 4.1 xxxx xxxxx 4.1 xxxx xxxxx FollowUpTim: 3.5 4.0 3.3 3.5 4.0 3.3 2.2 xxxx xxxxx 2.2 xxxx xxxxx ------------|---------------||---------------||---------------||---------------|Capacity Module:Cnflict Vol: 1476 1290 286 1163 1474 121 174 xxxx xxxxx 572 xxxx xxxxx Potent Cap.: 105 165 758 173 128 936 1415 xxxx xxxxx 1011 xxxx xxxxx Move Cap.: 0 119 758 0 93 936 1415 xxxx xxxxx 1011 xxxx xxxxx Volume/Cap: xxxx 3.54 0.00 xxxx 4.07 0.05 0.27 xxxx xxxx 0.00 xxxx xxxx ------------|---------------||---------------||---------------||---------------|Level Of Service Module:2Way95thQ: xxxx 41.8 0.0 xxxx xxxx xxxxx 1.1 xxxx xxxxx 0.0 xxxx xxxxx Control Del:xxxxx 1220 9.8 xxxxx xxxx xxxxx 8.5 xxxx xxxxx 8.6 xxxx xxxxx LOS by Move: * F A * * * A * * A * * Movement: LT - LTR - RT LT - LTR - RT LT - LTR - RT LT - LTR - RT Shared Cap.: xxxx xxxx xxxxx xxxx xxxx 103 xxxx xxxx xxxxx xxxx xxxx xxxxx SharedQueue:xxxxx xxxx xxxxx xxxxx xxxx 43.8 xxxxx xxxx xxxxx xxxxx xxxx xxxxx Shrd ConDel:xxxxx xxxx xxxxx xxxxx xxxx 1489 xxxxx xxxx xxxxx xxxxx xxxx xxxxx Shared LOS: * * * * * F * * * * * * ApproachDel: xxxxxx xxxxxx xxxxxx xxxxxxApproachLOS: F F * * ********************************************************************************Note: Queue reported is the number of cars per lane.********************************************************************************

CP(A)_PM Tue Nov 6, 2007 11:57:28 Page 3-1 ---------------------------------------------------------------------------------------------------------------------------------------------------------------- Level Of Service Computation Report 2000 HCM Operations Method (Base Volume Alternative) ********************************************************************************Intersection #1 Queen Kaahumanu Hwy / Henry St ********************************************************************************Cycle (sec): 100 Critical Vol./Cap.(X): 0.881Loss Time (sec): 10 (Y+R=4.0 sec) Average Delay (sec/veh): 29.4Optimal Cycle: 97 Level Of Service: C********************************************************************************Street Name: Queen Kaahumanu Hwy Henry St Approach: North Bound South Bound East Bound West Bound Movement: L - T - R L - T - R L - T - R L - T - R ------------|---------------||---------------||---------------||---------------|Control: Prot+Permit Prot+Permit Prot+Permit Prot+Permit Rights: Ovl Ovl Ovl Ovl Min. Green: 0 0 0 0 0 0 0 0 0 0 0 0 Lanes: 1 0 2 0 1 1 0 3 0 1 1 0 2 0 1 1 1 1 0 1 ------------|---------------||---------------||---------------||---------------|Volume Module:Base Vol: 282 507 806 183 713 121 76 553 107 549 561 211 Growth Adj: 1.00 1.00 1.00 1.00 1.00 1.00 1.00 1.00 1.00 1.00 1.00 1.00 Initial Bse: 282 507 806 183 713 121 76 553 107 549 561 211 User Adj: 1.00 1.00 1.00 1.00 1.00 1.00 1.00 1.00 1.00 1.00 1.00 1.00 PHF Adj: 0.95 0.95 0.95 0.95 0.95 0.95 0.95 0.95 0.95 0.95 0.95 0.95 PHF Volume: 297 534 848 193 751 127 80 582 113 578 591 222 Reduct Vol: 0 0 0 0 0 0 0 0 0 0 0 0 Reduced Vol: 297 534 848 193 751 127 80 582 113 578 591 222 PCE Adj: 1.00 1.00 1.00 1.00 1.00 1.00 1.00 1.00 1.00 1.00 1.00 1.00 MLF Adj: 1.00 1.00 1.00 1.00 1.00 1.00 1.00 1.00 1.00 1.00 1.00 1.00 FinalVolume: 297 534 848 193 751 127 80 582 113 578 591 222 ------------|---------------||---------------||---------------||---------------|Saturation Flow Module:Sat/Lane: 1900 1900 1900 1900 1900 1900 1900 1900 1900 1900 1900 1900 Adjustment: 0.95 0.95 0.85 0.95 0.91 0.85 0.95 0.95 0.85 0.93 0.93 0.85 Lanes: 1.00 2.00 1.00 1.00 3.00 1.00 1.00 2.00 1.00 1.48 1.52 1.00 Final Sat.: 1805 3610 1615 1805 5187 1615 1805 3610 1615 2614 2671 1615 ------------|---------------||---------------||---------------||---------------|Capacity Analysis Module:Vol/Sat: 0.16 0.15 0.53 0.11 0.14 0.08 0.04 0.16 0.07 0.22 0.22 0.14 Crit Moves: **** **** **** **** Green/Cycle: 0.49 0.35 0.60 0.34 0.22 0.29 0.26 0.18 0.43 0.45 0.36 0.48 Volume/Cap: 0.57 0.43 0.88 0.48 0.66 0.27 0.29 0.88 0.16 0.63 0.61 0.29 Uniform Del: 17.1 25.2 17.2 24.4 35.7 27.3 29.0 39.8 17.4 20.3 26.2 15.5 IncremntDel: 1.5 0.2 9.6 0.9 1.5 0.3 0.6 13.2 0.1 0.7 0.6 0.2 InitQueuDel: 0.0 0.0 0.0 0.0 0.0 0.0 0.0 0.0 0.0 0.0 0.0 0.0 Delay Adj: 1.00 1.00 1.00 1.00 1.00 1.00 1.00 1.00 1.00 1.00 1.00 1.00 Delay/Veh: 18.5 25.4 26.7 25.3 37.2 27.6 29.6 53.0 17.5 21.0 26.8 15.7 User DelAdj: 1.00 1.00 1.00 1.00 1.00 1.00 1.00 1.00 1.00 1.00 1.00 1.00 AdjDel/Veh: 18.5 25.4 26.7 25.3 37.2 27.6 29.6 53.0 17.5 21.0 26.8 15.7 LOS by Move: B C C C D C C D B C C B HCM2kAvgQ: 7 7 25 5 9 3 2 12 2 10 11 4 ********************************************************************************Note: Queue reported is the number of cars per lane.********************************************************************************

CP(A)_PM Tue Nov 6, 2007 11:57:28 Page 4-1 ---------------------------------------------------------------------------------------------------------------------------------------------------------------- Level Of Service Computation Report 2000 HCM Operations Method (Base Volume Alternative) ********************************************************************************Intersection #2 Queen Kaahumanu Hwy / Alli Dr ********************************************************************************Cycle (sec): 100 Critical Vol./Cap.(X): 1.015Loss Time (sec): 10 (Y+R=4.0 sec) Average Delay (sec/veh): 43.4Optimal Cycle: 180 Level Of Service: D********************************************************************************Street Name: Queen Kaahumanu Hwy Alli Dr Approach: North Bound South Bound East Bound West Bound Movement: L - T - R L - T - R L - T - R L - T - R ------------|---------------||---------------||---------------||---------------|Control: Prot+Permit Prot+Permit Prot+Permit Prot+Permit Rights: Ovl Ovl Ovl Ovl Min. Green: 0 0 0 0 0 0 0 0 0 0 0 0 Lanes: 1 0 2 0 1 1 0 2 0 1 1 0 1 0 1 1 0 1 0 1 ------------|---------------||---------------||---------------||---------------|Volume Module:Base Vol: 38 706 63 261 707 358 269 293 219 126 732 99 Growth Adj: 1.00 1.00 1.00 1.00 1.00 1.00 1.00 1.00 1.00 1.00 1.00 1.00 Initial Bse: 38 706 63 261 707 358 269 293 219 126 732 99 User Adj: 1.00 1.00 1.00 1.00 1.00 1.00 1.00 1.00 1.00 1.00 1.00 1.00 PHF Adj: 0.95 0.95 0.95 0.95 0.95 0.95 0.95 0.95 0.95 0.95 0.95 0.95 PHF Volume: 40 743 66 275 744 377 283 308 231 133 771 104 Reduct Vol: 0 0 0 0 0 0 0 0 0 0 0 0 Reduced Vol: 40 743 66 275 744 377 283 308 231 133 771 104 PCE Adj: 1.00 1.00 1.00 1.00 1.00 1.00 1.00 1.00 1.00 1.00 1.00 1.00 MLF Adj: 1.00 1.00 1.00 1.00 1.00 1.00 1.00 1.00 1.00 1.00 1.00 1.00 FinalVolume: 40 743 66 275 744 377 283 308 231 133 771 104 ------------|---------------||---------------||---------------||---------------|Saturation Flow Module:Sat/Lane: 1900 1900 1900 1900 1900 1900 1900 1900 1900 1900 1900 1900 Adjustment: 0.95 0.95 0.85 0.87 0.95 0.85 0.81 1.00 0.85 0.95 1.00 0.85 Lanes: 1.00 2.00 1.00 1.00 2.00 1.00 1.00 1.00 1.00 1.00 1.00 1.00 Final Sat.: 1805 3610 1615 1645 3610 1615 1533 1900 1615 1805 1900 1615 ------------|---------------||---------------||---------------||---------------|Capacity Analysis Module:Vol/Sat: 0.02 0.21 0.04 0.17 0.21 0.23 0.18 0.16 0.14 0.07 0.41 0.06 Crit Moves: **** **** **** **** Green/Cycle: 0.24 0.20 0.37 0.37 0.32 0.47 0.53 0.38 0.41 0.57 0.40 0.55 Volume/Cap: 0.24 1.02 0.11 0.80 0.65 0.50 0.80 0.43 0.35 0.22 1.02 0.12 Uniform Del: 30.0 39.9 20.5 25.5 29.5 18.4 13.0 23.1 20.1 10.7 30.2 11.0 IncremntDel: 0.8 39.3 0.1 12.6 1.4 0.5 12.4 0.4 0.3 0.2 38.7 0.1 InitQueuDel: 0.0 0.0 0.0 0.0 0.0 0.0 0.0 0.0 0.0 0.0 0.0 0.0 Delay Adj: 1.00 1.00 1.00 1.00 1.00 1.00 1.00 1.00 1.00 1.00 1.00 1.00 Delay/Veh: 30.8 79.2 20.6 38.2 30.8 18.9 25.4 23.5 20.4 10.9 68.8 11.1 User DelAdj: 1.00 1.00 1.00 1.00 1.00 1.00 1.00 1.00 1.00 1.00 1.00 1.00 AdjDel/Veh: 30.8 79.2 20.6 38.2 30.8 18.9 25.4 23.5 20.4 10.9 68.8 11.1 LOS by Move: C E C D C B C C C B E B HCM2kAvgQ: 1 18 1 10 11 8 9 7 5 2 32 2 ********************************************************************************Note: Queue reported is the number of cars per lane.********************************************************************************

CP(A)_PM Tue Nov 6, 2007 11:57:28 Page 5-1 ---------------------------------------------------------------------------------------------------------------------------------------------------------------- Level Of Service Computation Report 2000 HCM Unsignalized Method (Base Volume Alternative) ********************************************************************************Intersection #3 Kamakaeha Ave / Palani Rd ********************************************************************************Average Delay (sec/veh): 14.8 Worst Case Level Of Service: F[132.2]********************************************************************************Street Name: Kamakaeha Ave Palani Rd Approach: North Bound South Bound East Bound West Bound Movement: L - T - R L - T - R L - T - R L - T - R ------------|---------------||---------------||---------------||---------------|Control: Stop Sign Stop Sign Uncontrolled UncontrolledRights: Include Include Include Ignore Lanes: 0 0 0 0 0 1 0 0 0 1 0 0 1 0 0 0 0 1 0 1 ------------|---------------||---------------||---------------||---------------|Volume Module:Base Vol: 0 0 0 127 0 63 0 618 0 0 894 281 Growth Adj: 1.00 1.00 1.00 1.00 1.00 1.00 1.00 1.00 1.00 1.00 1.00 1.00 Initial Bse: 0 0 0 127 0 63 0 618 0 0 894 281 User Adj: 1.00 1.00 1.00 1.00 1.00 1.00 1.00 1.00 1.00 1.00 1.00 0.00 PHF Adj: 0.95 0.95 0.95 0.95 0.95 0.95 0.95 0.95 0.95 0.95 0.95 0.00 PHF Volume: 0 0 0 134 0 66 0 651 0 0 941 0 Reduct Vol: 0 0 0 0 0 0 0 0 0 0 0 0 FinalVolume: 0 0 0 134 0 66 0 651 0 0 941 0 ------------|---------------||---------------||---------------||---------------|Critical Gap Module:Critical Gp:xxxxx xxxx xxxxx 6.4 xxxx 6.2 xxxxx xxxx xxxxx xxxxx xxxx xxxxx FollowUpTim:xxxxx xxxx xxxxx 3.5 xxxx 3.3 xxxxx xxxx xxxxx xxxxx xxxx xxxxx ------------|---------------||---------------||---------------||---------------|Capacity Module:Cnflict Vol: xxxx xxxx xxxxx 1592 xxxx 941 xxxx xxxx xxxxx xxxx xxxx xxxxx Potent Cap.: xxxx xxxx xxxxx 119 xxxx 322 xxxx xxxx xxxxx xxxx xxxx xxxxx Move Cap.: xxxx xxxx xxxxx 119 xxxx 322 xxxx xxxx xxxxx xxxx xxxx xxxxx Volume/Cap: xxxx xxxx xxxx 1.12 xxxx 0.21 xxxx xxxx xxxx xxxx xxxx xxxx ------------|---------------||---------------||---------------||---------------|Level Of Service Module:2Way95thQ: xxxx xxxx xxxxx 8.0 xxxx 0.8 xxxx xxxx xxxxx xxxx xxxx xxxxx Control Del:xxxxx xxxx xxxxx 188.3 xxxx 19.1 xxxxx xxxx xxxxx xxxxx xxxx xxxxx LOS by Move: * * * F * C * * * * * * Movement: LT - LTR - RT LT - LTR - RT LT - LTR - RT LT - LTR - RT Shared Cap.: xxxx xxxx xxxxx xxxx xxxx xxxxx xxxx xxxx xxxxx xxxx xxxx xxxxx SharedQueue:xxxxx xxxx xxxxx xxxxx xxxx xxxxx xxxxx xxxx xxxxx xxxxx xxxx xxxxx Shrd ConDel:xxxxx xxxx xxxxx xxxxx xxxx xxxxx xxxxx xxxx xxxxx xxxxx xxxx xxxxx Shared LOS: * * * * * * * * * * * * ApproachDel: xxxxxx 132.2 xxxxxx xxxxxxApproachLOS: * F * * ********************************************************************************Note: Queue reported is the number of cars per lane.********************************************************************************

CP(A)_PM Tue Nov 6, 2007 11:57:28 Page 6-1 ---------------------------------------------------------------------------------------------------------------------------------------------------------------- Level Of Service Computation Report 2000 HCM Operations Method (Base Volume Alternative) ********************************************************************************Intersection #4 Henry St / Palani Rd ********************************************************************************Cycle (sec): 100 Critical Vol./Cap.(X): 1.340Loss Time (sec): 10 (Y+R=4.0 sec) Average Delay (sec/veh): 157.3Optimal Cycle: 180 Level Of Service: F********************************************************************************Street Name: Henry St Palani Rd Approach: North Bound South Bound East Bound West Bound Movement: L - T - R L - T - R L - T - R L - T - R ------------|---------------||---------------||---------------||---------------|Control: Permitted Permitted Permitted Prot+Permit Rights: Ovl Include Include Include Min. Green: 0 0 0 0 0 0 0 0 0 0 0 0 Lanes: 1 0 0 1 0 1 0 0 1 0 1 0 0 1 0 1 0 0 1 0 ------------|---------------||---------------||---------------||---------------|Volume Module:Base Vol: 110 329 394 67 314 183 268 416 129 859 927 93 Growth Adj: 1.00 1.00 1.00 1.00 1.00 1.00 1.00 1.00 1.00 1.00 1.00 1.00 Initial Bse: 110 329 394 67 314 183 268 416 129 859 927 93 User Adj: 1.00 1.00 1.00 1.00 1.00 1.00 1.00 1.00 1.00 1.00 1.00 1.00 PHF Adj: 0.95 0.95 0.95 0.95 0.95 0.95 0.95 0.95 0.95 0.95 0.95 0.95 PHF Volume: 116 346 415 71 331 193 282 438 136 904 976 98 Reduct Vol: 0 0 0 0 0 0 0 0 0 0 0 0 Reduced Vol: 116 346 415 71 331 193 282 438 136 904 976 98 PCE Adj: 1.00 1.00 1.00 1.00 1.00 1.00 1.00 1.00 1.00 1.00 1.00 1.00 MLF Adj: 1.00 1.00 1.00 1.00 1.00 1.00 1.00 1.00 1.00 1.00 1.00 1.00 FinalVolume: 116 346 415 71 331 193 282 438 136 904 976 98 ------------|---------------||---------------||---------------||---------------|Saturation Flow Module:Sat/Lane: 1900 1900 1900 1900 1900 1900 1900 1900 1900 1900 1900 1900 Adjustment: 0.12 0.92 0.92 0.12 0.95 0.95 0.95 0.96 0.96 0.67 0.99 0.99 Lanes: 1.00 0.46 0.54 1.00 0.63 0.37 1.00 0.76 0.24 1.00 0.91 0.09 Final Sat.: 232 794 951 232 1134 661 1805 1398 434 1277 1703 171 ------------|---------------||---------------||---------------||---------------|Capacity Analysis Module:Vol/Sat: 0.50 0.44 0.44 0.30 0.29 0.29 0.16 0.31 0.31 0.71 0.57 0.57 Crit Moves: **** **** Green/Cycle: 0.34 0.34 0.69 0.34 0.34 0.34 0.12 0.21 0.21 0.44 0.44 0.44 Volume/Cap: 1.46 1.28 0.64 0.89 0.85 0.85 1.31 1.46 1.46 1.30 1.31 1.31 Uniform Del: 32.9 32.9 8.8 31.2 30.6 30.6 44.0 39.3 39.3 25.4 28.1 28.1 IncremntDel:262.8 137 1.2 65.6 11.1 11.1 167.2 220 219.8 146.5 147 146.7 InitQueuDel: 0.0 0.0 0.0 0.0 0.0 0.0 0.0 0.0 0.0 0.0 0.0 0.0 Delay Adj: 1.00 1.00 1.00 1.00 1.00 1.00 1.00 1.00 1.00 1.00 1.00 1.00 Delay/Veh: 295.7 170 9.9 96.7 41.7 41.7 211.2 259 259.1 171.8 175 174.7 User DelAdj: 1.00 1.00 1.00 1.00 1.00 1.00 1.00 1.00 1.00 1.00 1.00 1.00 AdjDel/Veh: 295.7 170 9.9 96.7 41.7 41.7 211.2 259 259.1 171.8 175 174.7 LOS by Move: F F A F D D F F F F F F HCM2kAvgQ: 10 46 14 4 18 18 19 41 41 55 65 65 ********************************************************************************Note: Queue reported is the number of cars per lane.********************************************************************************

CP(A)_PM Tue Nov 6, 2007 11:57:29 Page 7-1 ---------------------------------------------------------------------------------------------------------------------------------------------------------------- Level Of Service Computation Report 2000 HCM Unsignalized Method (Base Volume Alternative) ********************************************************************************Intersection #5 Gate 2/Palani ********************************************************************************Average Delay (sec/veh): 0.7 Worst Case Level Of Service: F[ 74.7]********************************************************************************Street Name: Gate 2 /Palani Rd Approach: North Bound South Bound East Bound West Bound Movement: L - T - R L - T - R L - T - R L - T - R ------------|---------------||---------------||---------------||---------------|Control: Stop Sign Yield Sign Uncontrolled UncontrolledRights: Include Include Include Include Lanes: 0 0 0 0 0 0 0 0 0 1 0 0 1 0 0 0 0 0 1 0 ------------|---------------||---------------||---------------||---------------|Volume Module:Base Vol: 0 0 0 0 0 25 0 877 0 0 1853 81 Growth Adj: 1.00 1.00 1.00 1.00 1.00 1.00 1.00 1.00 1.00 1.00 1.00 1.00 Initial Bse: 0 0 0 0 0 25 0 877 0 0 1853 81 User Adj: 1.00 1.00 1.00 1.00 1.00 1.00 1.00 1.00 1.00 1.00 1.00 1.00 PHF Adj: 0.95 0.95 0.95 0.95 0.95 0.95 0.95 0.95 0.95 0.95 0.95 0.95 PHF Volume: 0 0 0 0 0 26 0 923 0 0 1951 85 Reduct Vol: 0 0 0 0 0 0 0 0 0 0 0 0 FinalVolume: 0 0 0 0 0 26 0 923 0 0 1951 85 ------------|---------------||---------------||---------------||---------------|Critical Gap Module:Critical Gp:xxxxx xxxx xxxxx xxxxx xxxx 6.2 xxxxx xxxx xxxxx xxxxx xxxx xxxxx FollowUpTim:xxxxx xxxx xxxxx xxxxx xxxx 3.3 xxxxx xxxx xxxxx xxxxx xxxx xxxxx ------------|---------------||---------------||---------------||---------------|Capacity Module:Cnflict Vol: xxxx xxxx xxxxx xxxx xxxx 1993 xxxx xxxx xxxxx xxxx xxxx xxxxx Potent Cap.: xxxx xxxx xxxxx xxxx xxxx 77 xxxx xxxx xxxxx xxxx xxxx xxxxx Move Cap.: xxxx xxxx xxxxx xxxx xxxx 77 xxxx xxxx xxxxx xxxx xxxx xxxxx Volume/Cap: xxxx xxxx xxxx xxxx xxxx 0.34 xxxx xxxx xxxx xxxx xxxx xxxx ------------|---------------||---------------||---------------||---------------|Level Of Service Module:2Way95thQ: xxxx xxxx xxxxx xxxx xxxx 1.3 xxxx xxxx xxxxx xxxx xxxx xxxxx Control Del:xxxxx xxxx xxxxx xxxxx xxxx 74.7 xxxxx xxxx xxxxx xxxxx xxxx xxxxx LOS by Move: * * * * * F * * * * * * Movement: LT - LTR - RT LT - LTR - RT LT - LTR - RT LT - LTR - RT Shared Cap.: xxxx xxxx xxxxx xxxx xxxx xxxxx xxxx xxxx xxxxx xxxx xxxx xxxxx SharedQueue:xxxxx xxxx xxxxx xxxxx xxxx xxxxx xxxxx xxxx xxxxx xxxxx xxxx xxxxx Shrd ConDel:xxxxx xxxx xxxxx xxxxx xxxx xxxxx xxxxx xxxx xxxxx xxxxx xxxx xxxxx Shared LOS: * * * * * * * * * * * * ApproachDel: xxxxxx 74.7 xxxxxx xxxxxxApproachLOS: * F * * ********************************************************************************Note: Queue reported is the number of cars per lane.********************************************************************************

CP(A)_PM Tue Nov 6, 2007 11:57:29 Page 8-1 ---------------------------------------------------------------------------------------------------------------------------------------------------------------- Level Of Service Computation Report 2000 HCM Operations Method (Base Volume Alternative) ********************************************************************************Intersection #6 Queen Kaahumanu Hwy / Makala Blvd ********************************************************************************Cycle (sec): 100 Critical Vol./Cap.(X): 0.787Loss Time (sec): 10 (Y+R=4.0 sec) Average Delay (sec/veh): 24.7Optimal Cycle: 69 Level Of Service: C********************************************************************************Street Name: Queen Kaahumanu Hwy Makala Blvd Approach: North Bound South Bound East Bound West Bound Movement: L - T - R L - T - R L - T - R L - T - R ------------|---------------||---------------||---------------||---------------|Control: Prot+Permit Prot+Permit Prot+Permit Prot+Permit Rights: Ovl Ovl Include Include Min. Green: 0 0 0 0 0 0 0 0 0 0 0 0 Lanes: 1 0 2 0 1 1 0 2 0 1 1 0 0 1 0 1 0 0 1 0 ------------|---------------||---------------||---------------||---------------|Volume Module:Base Vol: 14 724 80 86 1202 294 417 126 41 21 71 104 Growth Adj: 1.00 1.00 1.00 1.00 1.00 1.00 1.00 1.00 1.00 1.00 1.00 1.00 Initial Bse: 14 724 80 86 1202 294 417 126 41 21 71 104 User Adj: 1.00 1.00 1.00 1.00 1.00 1.00 1.00 1.00 1.00 1.00 1.00 1.00 PHF Adj: 0.95 0.95 0.95 0.95 0.95 0.95 0.95 0.95 0.95 0.95 0.95 0.95 PHF Volume: 15 762 84 91 1265 309 439 133 43 22 75 109 Reduct Vol: 0 0 0 0 0 0 0 0 0 0 0 0 Reduced Vol: 15 762 84 91 1265 309 439 133 43 22 75 109 PCE Adj: 1.00 1.00 1.00 1.00 1.00 1.00 1.00 1.00 1.00 1.00 1.00 1.00 MLF Adj: 1.00 1.00 1.00 1.00 1.00 1.00 1.00 1.00 1.00 1.00 1.00 1.00 FinalVolume: 15 762 84 91 1265 309 439 133 43 22 75 109 ------------|---------------||---------------||---------------||---------------|Saturation Flow Module:Sat/Lane: 1900 1900 1900 1900 1900 1900 1900 1900 1900 1900 1900 1900 Adjustment: 0.95 0.95 0.85 0.95 0.95 0.85 0.95 0.96 0.96 0.95 0.91 0.91 Lanes: 1.00 2.00 1.00 1.00 2.00 1.00 1.00 0.75 0.25 1.00 0.41 0.59 Final Sat.: 1805 3610 1615 1805 3610 1615 1805 1380 449 1805 702 1029 ------------|---------------||---------------||---------------||---------------|Capacity Analysis Module:Vol/Sat: 0.01 0.21 0.05 0.05 0.35 0.19 0.24 0.10 0.10 0.01 0.11 0.11 Crit Moves: **** **** **** **** Green/Cycle: 0.38 0.37 0.42 0.48 0.45 0.75 0.46 0.39 0.39 0.19 0.14 0.14 Volume/Cap: 0.16 0.57 0.12 0.30 0.79 0.25 0.70 0.24 0.24 0.09 0.79 0.79 Uniform Del: 22.0 25.3 17.8 16.1 23.7 3.7 19.4 20.3 20.3 33.6 41.8 41.8 IncremntDel: 0.8 0.6 0.1 0.6 2.7 0.1 3.4 0.2 0.2 0.1 16.1 16.1 InitQueuDel: 0.0 0.0 0.0 0.0 0.0 0.0 0.0 0.0 0.0 0.0 0.0 0.0 Delay Adj: 1.00 1.00 1.00 1.00 1.00 1.00 1.00 1.00 1.00 1.00 1.00 1.00 Delay/Veh: 22.8 25.9 17.9 16.7 26.3 3.8 22.7 20.5 20.5 33.7 57.9 57.9 User DelAdj: 1.00 1.00 1.00 1.00 1.00 1.00 1.00 1.00 1.00 1.00 1.00 1.00 AdjDel/Veh: 22.8 25.9 17.9 16.7 26.3 3.8 22.7 20.5 20.5 33.7 57.9 57.9 LOS by Move: C C B B C A C C C C E E HCM2kAvgQ: 0 10 2 2 19 3 12 4 4 1 8 8 ********************************************************************************Note: Queue reported is the number of cars per lane.********************************************************************************

CP(A)_PM Tue Nov 6, 2007 11:57:29 Page 9-1 ---------------------------------------------------------------------------------------------------------------------------------------------------------------- Level Of Service Computation Report 2000 HCM Unsignalized Method (Base Volume Alternative) ********************************************************************************Intersection #7 Ane Keohokahole/Main Gate ********************************************************************************Average Delay (sec/veh): 33.3 Worst Case Level Of Service: F[127.7]********************************************************************************Street Name: Ane Keohokahole Hwy Main Gate Approach: North Bound South Bound East Bound West Bound Movement: L - T - R L - T - R L - T - R L - T - R ------------|---------------||---------------||---------------||---------------|Control: Uncontrolled Uncontrolled Stop Sign Stop Sign Rights: Include Include Include Include Lanes: 0 0 1 0 1 1 0 1 0 0 0 0 0 0 0 1 0 0 0 1 ------------|---------------||---------------||---------------||---------------|Volume Module:Base Vol: 0 445 244 163 338 0 0 0 0 226 0 176 Growth Adj: 1.00 1.00 1.00 1.00 1.00 1.00 1.00 1.00 1.00 1.00 1.00 1.00 Initial Bse: 0 445 244 163 338 0 0 0 0 226 0 176 User Adj: 1.00 1.00 1.00 1.00 1.00 1.00 1.00 1.00 1.00 1.00 1.00 1.00 PHF Adj: 0.95 0.95 0.95 0.95 0.95 0.95 0.95 0.95 0.95 0.95 0.95 0.95 PHF Volume: 0 468 257 172 356 0 0 0 0 238 0 185 Reduct Vol: 0 0 0 0 0 0 0 0 0 0 0 0 FinalVolume: 0 468 257 172 356 0 0 0 0 238 0 185 ------------|---------------||---------------||---------------||---------------|Critical Gap Module:Critical Gp:xxxxx xxxx xxxxx 4.1 xxxx xxxxx xxxxx xxxx xxxxx 6.4 xxxx 6.2 FollowUpTim:xxxxx xxxx xxxxx 2.2 xxxx xxxxx xxxxx xxxx xxxxx 3.5 xxxx 3.3 ------------|---------------||---------------||---------------||---------------|Capacity Module:Cnflict Vol: xxxx xxxx xxxxx 725 xxxx xxxxx xxxx xxxx xxxxx 1167 xxxx 468 Potent Cap.: xxxx xxxx xxxxx 887 xxxx xxxxx xxxx xxxx xxxxx 216 xxxx 599 Move Cap.: xxxx xxxx xxxxx 887 xxxx xxxxx xxxx xxxx xxxxx 184 xxxx 599 Volume/Cap: xxxx xxxx xxxx 0.19 xxxx xxxx xxxx xxxx xxxx 1.29 xxxx 0.31 ------------|---------------||---------------||---------------||---------------|Level Of Service Module:2Way95thQ: xxxx xxxx xxxxx 0.7 xxxx xxxxx xxxx xxxx xxxxx 13.4 xxxx 1.3 Control Del:xxxxx xxxx xxxxx 10.0 xxxx xxxxx xxxxx xxxx xxxxx 216.5 xxxx 13.7 LOS by Move: * * * B * * * * * F * B Movement: LT - LTR - RT LT - LTR - RT LT - LTR - RT LT - LTR - RT Shared Cap.: xxxx xxxx xxxxx xxxx xxxx xxxxx xxxx xxxx xxxxx xxxx xxxx xxxxx SharedQueue:xxxxx xxxx xxxxx xxxxx xxxx xxxxx xxxxx xxxx xxxxx xxxxx xxxx xxxxx Shrd ConDel:xxxxx xxxx xxxxx xxxxx xxxx xxxxx xxxxx xxxx xxxxx xxxxx xxxx xxxxx Shared LOS: * * * * * * * * * * * * ApproachDel: xxxxxx xxxxxx xxxxxx 127.7ApproachLOS: * * * F ********************************************************************************Note: Queue reported is the number of cars per lane.********************************************************************************

CP(A)_PM Tue Nov 6, 2007 11:57:29 Page 10-1 ---------------------------------------------------------------------------------------------------------------------------------------------------------------- Level Of Service Computation Report 2000 HCM Operations Method (Base Volume Alternative) ********************************************************************************Intersection #8 Palihiolo St/Palani Rd ********************************************************************************Cycle (sec): 100 Critical Vol./Cap.(X): 1.837Loss Time (sec): 10 (Y+R=4.0 sec) Average Delay (sec/veh): 204.9Optimal Cycle: 180 Level Of Service: F********************************************************************************Street Name: Palihiolo St Palani Rd Approach: North Bound South Bound East Bound West Bound Movement: L - T - R L - T - R L - T - R L - T - R ------------|---------------||---------------||---------------||---------------|Control: Permitted Permitted Prot+Permit Permitted Rights: Include Include Include Ignore Min. Green: 0 0 0 0 0 0 0 0 0 0 0 0 Lanes: 0 1 0 0 1 1 0 0 1 0 1 0 0 1 0 1 0 1 0 1 ------------|---------------||---------------||---------------||---------------|Volume Module:Base Vol: 4 19 26 2 4 592 506 731 13 49 1319 23 Growth Adj: 1.00 1.00 1.00 1.00 1.00 1.00 1.00 1.00 1.00 1.00 1.00 1.00 Initial Bse: 4 19 26 2 4 592 506 731 13 49 1319 23 User Adj: 1.00 1.00 1.00 1.00 1.00 1.00 1.00 1.00 1.00 1.00 1.00 0.00 PHF Adj: 0.95 0.95 0.95 0.95 0.95 0.95 0.95 0.95 0.95 0.95 0.95 0.00 PHF Volume: 4 20 27 2 4 623 533 769 14 52 1388 0 Reduct Vol: 0 0 0 0 0 0 0 0 0 0 0 0 Reduced Vol: 4 20 27 2 4 623 533 769 14 52 1388 0 PCE Adj: 1.00 1.00 1.00 1.00 1.00 1.00 1.00 1.00 1.00 1.00 1.00 0.00 MLF Adj: 1.00 1.00 1.00 1.00 1.00 1.00 1.00 1.00 1.00 1.00 1.00 0.00 FinalVolume: 4 20 27 2 4 623 533 769 14 52 1388 0 ------------|---------------||---------------||---------------||---------------|Saturation Flow Module:Sat/Lane: 1900 1900 1900 1900 1900 1900 1900 1900 1900 1900 1900 1900 Adjustment: 0.67 0.67 0.85 0.75 0.85 0.85 0.22 1.00 1.00 0.95 1.00 1.00 Lanes: 0.17 0.83 1.00 1.00 0.01 0.99 1.00 0.98 0.02 1.00 1.00 1.00 Final Sat.: 221 1052 1615 1423 11 1606 421 1861 33 1805 1900 1900 ------------|---------------||---------------||---------------||---------------|Capacity Analysis Module:Vol/Sat: 0.02 0.02 0.02 0.00 0.39 0.39 1.27 0.41 0.41 0.03 0.73 0.00 Crit Moves: **** **** Green/Cycle: 0.25 0.25 0.25 0.25 0.25 0.25 0.61 0.61 0.61 0.04 0.47 0.00 Volume/Cap: 0.08 0.08 0.07 0.01 1.57 1.57 1.28 0.68 0.68 0.68 1.57 0.00 Uniform Del: 28.9 28.9 28.8 28.4 37.7 37.7 31.8 12.9 12.9 47.2 26.7 0.0 IncremntDel: 0.1 0.1 0.1 0.0 269 268.8 144.8 1.6 1.6 21.7 262 0.0 InitQueuDel: 0.0 0.0 0.0 0.0 0.0 0.0 0.0 0.0 0.0 0.0 0.0 0.0 Delay Adj: 1.00 1.00 1.00 1.00 1.00 1.00 1.00 1.00 1.00 1.00 1.00 0.00 Delay/Veh: 29.0 29.0 28.9 28.4 306 306.4 176.5 14.5 14.5 68.9 289 0.0 User DelAdj: 1.00 1.00 1.00 1.00 1.00 1.00 1.00 1.00 1.00 1.00 1.00 1.00 AdjDel/Veh: 29.0 29.0 28.9 28.4 306 306.4 176.5 14.5 14.5 68.9 289 0.0 LOS by Move: C C C C F F F B B E F A HCM2kAvgQ: 1 1 1 0 48 48 33 16 16 3 104 0 ********************************************************************************Note: Queue reported is the number of cars per lane.********************************************************************************

CP(A)_PM Tue Nov 6, 2007 11:57:29 Page 11-1 ---------------------------------------------------------------------------------------------------------------------------------------------------------------- Level Of Service Computation Report 2000 HCM Unsignalized Method (Base Volume Alternative) ********************************************************************************Intersection #10 Palani Rd / Uluaoa St ********************************************************************************Average Delay (sec/veh): 10.1 Worst Case Level Of Service: F[200.1]********************************************************************************Street Name: Palani Rd Uluaoa St Approach: North Bound South Bound East Bound West Bound Movement: L - T - R L - T - R L - T - R L - T - R ------------|---------------||---------------||---------------||---------------|Control: Uncontrolled Uncontrolled Stop Sign Stop Sign Rights: Include Include Include Include Lanes: 0 1 0 0 0 0 0 0 1 0 1 0 0 0 1 0 0 0 0 0 ------------|---------------||---------------||---------------||---------------|Volume Module:Base Vol: 29 740 0 0 1018 177 71 0 32 0 0 0 Growth Adj: 1.00 1.00 1.00 1.00 1.00 1.00 1.00 1.00 1.00 1.00 1.00 1.00 Initial Bse: 29 740 0 0 1018 177 71 0 32 0 0 0 User Adj: 1.00 1.00 1.00 1.00 1.00 1.00 1.00 1.00 1.00 1.00 1.00 1.00 PHF Adj: 0.95 0.95 0.95 0.95 0.95 0.95 0.95 0.95 0.95 0.95 0.95 0.95 PHF Volume: 31 779 0 0 1072 186 75 0 34 0 0 0 Reduct Vol: 0 0 0 0 0 0 0 0 0 0 0 0 FinalVolume: 31 779 0 0 1072 186 75 0 34 0 0 0 ------------|---------------||---------------||---------------||---------------|Critical Gap Module:Critical Gp: 4.1 xxxx xxxxx xxxxx xxxx xxxxx 6.4 xxxx 6.2 xxxxx xxxx xxxxx FollowUpTim: 2.2 xxxx xxxxx xxxxx xxxx xxxxx 3.5 xxxx 3.3 xxxxx xxxx xxxxx ------------|---------------||---------------||---------------||---------------|Capacity Module:Cnflict Vol: 1258 xxxx xxxxx xxxx xxxx xxxxx 2005 xxxx 1165 xxxx xxxx xxxxx Potent Cap.: 560 xxxx xxxxx xxxx xxxx xxxxx 66 xxxx 239 xxxx xxxx xxxxx Move Cap.: 560 xxxx xxxxx xxxx xxxx xxxxx 63 xxxx 239 xxxx xxxx xxxxx Volume/Cap: 0.05 xxxx xxxx xxxx xxxx xxxx 1.18 xxxx 0.14 xxxx xxxx xxxx ------------|---------------||---------------||---------------||---------------|Level Of Service Module:2Way95thQ: 0.2 xxxx xxxxx xxxx xxxx xxxxx 6.0 xxxx 0.5 xxxx xxxx xxxxx Control Del: 11.8 xxxx xxxxx xxxxx xxxx xxxxx 280.1 xxxx 22.5 xxxxx xxxx xxxxx LOS by Move: B * * * * * F * C * * * Movement: LT - LTR - RT LT - LTR - RT LT - LTR - RT LT - LTR - RT Shared Cap.: xxxx xxxx xxxxx xxxx xxxx xxxxx xxxx xxxx xxxxx xxxx xxxx xxxxx SharedQueue: 0.2 xxxx xxxxx xxxxx xxxx xxxxx xxxxx xxxx xxxxx xxxxx xxxx xxxxx Shrd ConDel: 11.8 xxxx xxxxx xxxxx xxxx xxxxx xxxxx xxxx xxxxx xxxxx xxxx xxxxx Shared LOS: B * * * * * * * * * * * ApproachDel: xxxxxx xxxxxx 200.1 xxxxxxApproachLOS: * * F * ********************************************************************************Note: Queue reported is the number of cars per lane.********************************************************************************

CP(A)_PM Tue Nov 6, 2007 11:57:29 Page 12-1 ---------------------------------------------------------------------------------------------------------------------------------------------------------------- Level Of Service Computation Report 2000 HCM Operations Method (Base Volume Alternative) ********************************************************************************Intersection #11 Queen Kaahumanu Hwy / Kealakehe Pkwy ********************************************************************************Cycle (sec): 100 Critical Vol./Cap.(X): 0.781Loss Time (sec): 10 (Y+R=4.0 sec) Average Delay (sec/veh): 24.7Optimal Cycle: 67 Level Of Service: C********************************************************************************Street Name: Queen Kaahumanu Hwy Kaalakehe Pkwy Approach: North Bound South Bound East Bound West Bound Movement: L - T - R L - T - R L - T - R L - T - R ------------|---------------||---------------||---------------||---------------|Control: Prot+Permit Prot+Permit Permitted Permitted Rights: Ovl Ovl Ovl Ovl Min. Green: 0 0 0 0 0 0 0 0 0 0 0 0 Lanes: 1 0 2 0 1 1 0 2 0 1 0 1 0 0 1 0 1 0 0 1 ------------|---------------||---------------||---------------||---------------|Volume Module:Base Vol: 66 1086 239 136 1028 232 106 97 67 242 66 135 Growth Adj: 1.00 1.00 1.00 1.00 1.00 1.00 1.00 1.00 1.00 1.00 1.00 1.00 Initial Bse: 66 1086 239 136 1028 232 106 97 67 242 66 135 User Adj: 1.00 1.00 1.00 1.00 1.00 1.00 1.00 1.00 1.00 1.00 1.00 1.00 PHF Adj: 0.95 0.95 0.95 0.95 0.95 0.95 0.95 0.95 0.95 0.95 0.95 0.95 PHF Volume: 69 1143 252 143 1082 244 112 102 71 255 69 142 Reduct Vol: 0 0 0 0 0 0 0 0 0 0 0 0 Reduced Vol: 69 1143 252 143 1082 244 112 102 71 255 69 142 PCE Adj: 1.00 1.00 1.00 1.00 1.00 1.00 1.00 1.00 1.00 1.00 1.00 1.00 MLF Adj: 1.00 1.00 1.00 1.00 1.00 1.00 1.00 1.00 1.00 1.00 1.00 1.00 FinalVolume: 69 1143 252 143 1082 244 112 102 71 255 69 142 ------------|---------------||---------------||---------------||---------------|Saturation Flow Module:Sat/Lane: 1900 1900 1900 1900 1900 1900 1900 1900 1900 1900 1900 1900 Adjustment: 0.95 0.95 0.85 0.95 0.95 0.85 0.55 0.55 0.85 0.56 0.56 0.85 Lanes: 1.00 2.00 1.00 1.00 2.00 1.00 0.52 0.48 1.00 0.79 0.21 1.00 Final Sat.: 1805 3610 1615 1805 3610 1615 546 499 1615 830 226 1615 ------------|---------------||---------------||---------------||---------------|Capacity Analysis Module:Vol/Sat: 0.04 0.32 0.16 0.08 0.30 0.15 0.20 0.20 0.04 0.31 0.31 0.09 Crit Moves: **** **** **** Green/Cycle: 0.46 0.41 0.41 0.54 0.45 0.45 0.39 0.39 0.45 0.39 0.39 0.49 Volume/Cap: 0.32 0.78 0.38 0.55 0.67 0.34 0.52 0.52 0.10 0.78 0.78 0.18 Uniform Del: 16.8 25.9 20.9 17.5 21.7 17.9 23.2 23.2 15.8 26.6 26.6 14.0 IncremntDel: 0.8 2.8 0.4 2.6 1.1 0.3 1.2 1.2 0.1 9.2 9.2 0.1 InitQueuDel: 0.0 0.0 0.0 0.0 0.0 0.0 0.0 0.0 0.0 0.0 0.0 0.0 Delay Adj: 1.00 1.00 1.00 1.00 1.00 1.00 1.00 1.00 1.00 1.00 1.00 1.00 Delay/Veh: 17.7 28.6 21.3 20.1 22.7 18.1 24.4 24.4 15.8 35.8 35.8 14.1 User DelAdj: 1.00 1.00 1.00 1.00 1.00 1.00 1.00 1.00 1.00 1.00 1.00 1.00 AdjDel/Veh: 17.7 28.6 21.3 20.1 22.7 18.1 24.4 24.4 15.8 35.8 35.8 14.1 LOS by Move: B C C C C B C C B D D B HCM2kAvgQ: 2 18 6 4 14 5 6 6 1 11 11 2 ********************************************************************************Note: Queue reported is the number of cars per lane.********************************************************************************

CP(A)_PM Tue Nov 6, 2007 11:57:29 Page 13-1 ---------------------------------------------------------------------------------------------------------------------------------------------------------------- Level Of Service Computation Report 2000 HCM Unsignalized Method (Base Volume Alternative) ********************************************************************************Intersection #12 Ane Keohokalole Hwy / Kealakehe Pkwy ********************************************************************************Average Delay (sec/veh): OVERFLOW Worst Case Level Of Service: F[xxxxx]********************************************************************************Street Name: Ane Keohokalole Hwy Kealakehe Pkwy Approach: North Bound South Bound East Bound West Bound Movement: L - T - R L - T - R L - T - R L - T - R ------------|---------------||---------------||---------------||---------------|Control: Stop Sign Stop Sign Uncontrolled UncontrolledRights: Include Include Include Include Lanes: 1 0 1 0 1 1 0 0 1 0 1 0 1 1 0 1 0 1 0 1 ------------|---------------||---------------||---------------||---------------|Volume Module:Base Vol: 179 363 0 50 311 369 165 194 185 5 128 23 Growth Adj: 1.00 1.00 1.00 1.00 1.00 1.00 1.00 1.00 1.00 1.00 1.00 1.00 Initial Bse: 179 363 0 50 311 369 165 194 185 5 128 23 User Adj: 1.00 1.00 1.00 1.00 1.00 1.00 1.00 1.00 1.00 1.00 1.00 1.00 PHF Adj: 0.95 0.95 0.95 0.95 0.95 0.95 0.95 0.95 0.95 0.95 0.95 0.95 PHF Volume: 188 382 0 53 327 388 174 204 195 5 135 24 Reduct Vol: 0 0 0 0 0 0 0 0 0 0 0 0 FinalVolume: 188 382 0 53 327 388 174 204 195 5 135 24 ------------|---------------||---------------||---------------||---------------|Critical Gap Module:Critical Gp: 7.1 6.5 6.2 7.1 6.5 6.2 4.1 xxxx xxxxx 4.1 xxxx xxxxx FollowUpTim: 3.5 4.0 3.3 3.5 4.0 3.3 2.2 xxxx xxxxx 2.2 xxxx xxxxx ------------|---------------||---------------||---------------||---------------|Capacity Module:Cnflict Vol: 1164 818 199 786 892 135 159 xxxx xxxxx 399 xxxx xxxxx Potent Cap.: 173 313 847 312 284 920 1433 xxxx xxxxx 1171 xxxx xxxxx Move Cap.: 0 274 847 0 248 920 1433 xxxx xxxxx 1171 xxxx xxxxx Volume/Cap: xxxx 1.40 0.00 xxxx 1.32 0.42 0.12 xxxx xxxx 0.00 xxxx xxxx ------------|---------------||---------------||---------------||---------------|Level Of Service Module:2Way95thQ: xxxx 20.5 xxxxx xxxx xxxx xxxxx 0.4 xxxx xxxxx 0.0 xxxx xxxxx Control Del:xxxxx 235 xxxxx xxxxx xxxx xxxxx 7.9 xxxx xxxxx 8.1 xxxx xxxxx LOS by Move: * F * * * * A * * A * * Movement: LT - LTR - RT LT - LTR - RT LT - LTR - RT LT - LTR - RT Shared Cap.: xxxx xxxx xxxxx xxxx xxxx 411 xxxx xxxx xxxxx xxxx xxxx xxxxx SharedQueue:xxxxx xxxx xxxxx xxxxx xxxx 44.2 xxxxx xxxx xxxxx xxxxx xxxx xxxxx Shrd ConDel:xxxxx xxxx xxxxx xxxxx xxxx 367.2 xxxxx xxxx xxxxx xxxxx xxxx xxxxx Shared LOS: * * * * * F * * * * * * ApproachDel: xxxxxx xxxxxx xxxxxx xxxxxxApproachLOS: F F * * ********************************************************************************Note: Queue reported is the number of cars per lane.********************************************************************************

CUMULATIVE PLUS PROJECT CONDITIONS – CONCEPT B

CP(B)_AM Tue Nov 6, 2007 12:00:37 Page 3-1 ---------------------------------------------------------------------------------------------------------------------------------------------------------------- Level Of Service Computation Report 2000 HCM Operations Method (Base Volume Alternative) ********************************************************************************Intersection #1 Queen Kaahumanu Hwy / Henry St ********************************************************************************Cycle (sec): 100 Critical Vol./Cap.(X): 0.890Loss Time (sec): 10 (Y+R=4.0 sec) Average Delay (sec/veh): 29.3Optimal Cycle: 100 Level Of Service: C********************************************************************************Street Name: Queen Kaahumanu Hwy Henry St Approach: North Bound South Bound East Bound West Bound Movement: L - T - R L - T - R L - T - R L - T - R ------------|---------------||---------------||---------------||---------------|Control: Prot+Permit Prot+Permit Prot+Permit Prot+Permit Rights: Ovl Ovl Ovl Ovl Min. Green: 0 0 0 0 0 0 0 0 0 0 0 0 Lanes: 1 0 2 0 1 1 0 3 0 1 1 0 2 0 1 1 1 1 0 1 ------------|---------------||---------------||---------------||---------------|Volume Module:Base Vol: 320 802 925 130 577 132 76 419 25 636 698 99 Growth Adj: 1.00 1.00 1.00 1.00 1.00 1.00 1.00 1.00 1.00 1.00 1.00 1.00 Initial Bse: 320 802 925 130 577 132 76 419 25 636 698 99 User Adj: 1.00 1.00 1.00 1.00 1.00 1.00 1.00 1.00 1.00 1.00 1.00 1.00 PHF Adj: 0.95 0.95 0.95 0.95 0.95 0.95 0.95 0.95 0.95 0.95 0.95 0.95 PHF Volume: 337 844 974 137 607 139 80 441 26 669 735 104 Reduct Vol: 0 0 0 0 0 0 0 0 0 0 0 0 Reduced Vol: 337 844 974 137 607 139 80 441 26 669 735 104 PCE Adj: 1.00 1.00 1.00 1.00 1.00 1.00 1.00 1.00 1.00 1.00 1.00 1.00 MLF Adj: 1.00 1.00 1.00 1.00 1.00 1.00 1.00 1.00 1.00 1.00 1.00 1.00 FinalVolume: 337 844 974 137 607 139 80 441 26 669 735 104 ------------|---------------||---------------||---------------||---------------|Saturation Flow Module:Sat/Lane: 1900 1900 1900 1900 1900 1900 1900 1900 1900 1900 1900 1900 Adjustment: 0.95 0.95 0.85 0.95 0.91 0.85 0.95 0.95 0.85 0.93 0.93 0.85 Lanes: 1.00 2.00 1.00 1.00 3.00 1.00 1.00 2.00 1.00 1.43 1.57 1.00 Final Sat.: 1805 3610 1615 1805 5187 1615 1805 3610 1615 2522 2768 1615 ------------|---------------||---------------||---------------||---------------|Capacity Analysis Module:Vol/Sat: 0.19 0.23 0.60 0.08 0.12 0.09 0.04 0.12 0.02 0.27 0.27 0.06 Crit Moves: **** **** **** **** Green/Cycle: 0.48 0.38 0.68 0.26 0.18 0.24 0.20 0.14 0.42 0.46 0.37 0.46 Volume/Cap: 0.57 0.62 0.89 0.52 0.65 0.36 0.38 0.89 0.04 0.70 0.71 0.14 Uniform Del: 17.1 25.1 13.1 29.3 38.2 31.5 33.5 42.4 16.9 20.7 26.7 15.7 IncremntDel: 1.4 0.9 9.2 1.9 1.7 0.6 1.2 17.8 0.0 1.1 1.2 0.1 InitQueuDel: 0.0 0.0 0.0 0.0 0.0 0.0 0.0 0.0 0.0 0.0 0.0 0.0 Delay Adj: 1.00 1.00 1.00 1.00 1.00 1.00 1.00 1.00 1.00 1.00 1.00 1.00 Delay/Veh: 18.4 26.0 22.3 31.2 39.9 32.0 34.7 60.2 17.0 21.8 28.0 15.8 User DelAdj: 1.00 1.00 1.00 1.00 1.00 1.00 1.00 1.00 1.00 1.00 1.00 1.00 AdjDel/Veh: 18.4 26.0 22.3 31.2 39.9 32.0 34.7 60.2 17.0 21.8 28.0 15.8 LOS by Move: B C C C D C C E B C C B HCM2kAvgQ: 8 12 28 4 7 4 3 10 0 13 14 2 ********************************************************************************Note: Queue reported is the number of cars per lane.********************************************************************************

CP(B)_AM Tue Nov 6, 2007 12:00:37 Page 4-1 ---------------------------------------------------------------------------------------------------------------------------------------------------------------- Level Of Service Computation Report 2000 HCM Operations Method (Base Volume Alternative) ********************************************************************************Intersection #2 Queen Kaahumanu Hwy / Alli Dr ********************************************************************************Cycle (sec): 100 Critical Vol./Cap.(X): 0.917Loss Time (sec): 10 (Y+R=4.0 sec) Average Delay (sec/veh): 35.1Optimal Cycle: 114 Level Of Service: D********************************************************************************Street Name: Queen Kaahumanu Hwy Alli Dr Approach: North Bound South Bound East Bound West Bound Movement: L - T - R L - T - R L - T - R L - T - R ------------|---------------||---------------||---------------||---------------|Control: Prot+Permit Prot+Permit Prot+Permit Prot+Permit Rights: Ovl Ovl Ovl Ovl Min. Green: 0 0 0 0 0 0 0 0 0 0 0 0 Lanes: 1 0 2 0 1 1 0 2 0 1 1 0 1 0 1 1 0 1 0 1 ------------|---------------||---------------||---------------||---------------|Volume Module:Base Vol: 97 807 73 193 655 372 193 144 99 100 658 93 Growth Adj: 1.00 1.00 1.00 1.00 1.00 1.00 1.00 1.00 1.00 1.00 1.00 1.00 Initial Bse: 97 807 73 193 655 372 193 144 99 100 658 93 User Adj: 1.00 1.00 1.00 1.00 1.00 1.00 1.00 1.00 1.00 1.00 1.00 1.00 PHF Adj: 0.95 0.95 0.95 0.95 0.95 0.95 0.95 0.95 0.95 0.95 0.95 0.95 PHF Volume: 102 849 77 203 689 392 203 152 104 105 693 98 Reduct Vol: 0 0 0 0 0 0 0 0 0 0 0 0 Reduced Vol: 102 849 77 203 689 392 203 152 104 105 693 98 PCE Adj: 1.00 1.00 1.00 1.00 1.00 1.00 1.00 1.00 1.00 1.00 1.00 1.00 MLF Adj: 1.00 1.00 1.00 1.00 1.00 1.00 1.00 1.00 1.00 1.00 1.00 1.00 FinalVolume: 102 849 77 203 689 392 203 152 104 105 693 98 ------------|---------------||---------------||---------------||---------------|Saturation Flow Module:Sat/Lane: 1900 1900 1900 1900 1900 1900 1900 1900 1900 1900 1900 1900 Adjustment: 0.95 0.95 0.85 0.95 0.95 0.85 0.95 1.00 0.85 0.95 1.00 0.85 Lanes: 1.00 2.00 1.00 1.00 2.00 1.00 1.00 1.00 1.00 1.00 1.00 1.00 Final Sat.: 1805 3610 1615 1805 3610 1615 1805 1900 1615 1805 1900 1615 ------------|---------------||---------------||---------------||---------------|Capacity Analysis Module:Vol/Sat: 0.06 0.24 0.05 0.11 0.19 0.24 0.11 0.08 0.06 0.06 0.36 0.06 Crit Moves: **** **** **** **** Green/Cycle: 0.34 0.26 0.48 0.40 0.29 0.42 0.42 0.30 0.39 0.54 0.40 0.52 Volume/Cap: 0.40 0.92 0.10 0.69 0.65 0.58 0.68 0.27 0.17 0.15 0.92 0.12 Uniform Del: 23.6 36.1 14.4 23.3 30.9 22.5 22.4 26.6 20.1 11.2 28.5 12.2 IncremntDel: 1.0 13.6 0.1 6.5 1.5 1.3 6.4 0.3 0.1 0.1 15.9 0.1 InitQueuDel: 0.0 0.0 0.0 0.0 0.0 0.0 0.0 0.0 0.0 0.0 0.0 0.0 Delay Adj: 1.00 1.00 1.00 1.00 1.00 1.00 1.00 1.00 1.00 1.00 1.00 1.00 Delay/Veh: 24.7 49.7 14.4 29.9 32.4 23.9 28.8 26.8 20.2 11.3 44.5 12.3 User DelAdj: 1.00 1.00 1.00 1.00 1.00 1.00 1.00 1.00 1.00 1.00 1.00 1.00 AdjDel/Veh: 24.7 49.7 14.4 29.9 32.4 23.9 28.8 26.8 20.2 11.3 44.5 12.3 LOS by Move: C D B C C C C C C B D B HCM2kAvgQ: 3 17 1 7 11 10 6 4 2 2 24 2 ********************************************************************************Note: Queue reported is the number of cars per lane.********************************************************************************

CP(B)_AM Tue Nov 6, 2007 12:00:37 Page 5-1 ---------------------------------------------------------------------------------------------------------------------------------------------------------------- Level Of Service Computation Report 2000 HCM Unsignalized Method (Base Volume Alternative) ********************************************************************************Intersection #3 Kamakaeha Ave / Palani Rd ********************************************************************************Average Delay (sec/veh): 1.4 Worst Case Level Of Service: D[ 31.3]********************************************************************************Street Name: Kamakaeha Ave Palani Rd Approach: North Bound South Bound East Bound West Bound Movement: L - T - R L - T - R L - T - R L - T - R ------------|---------------||---------------||---------------||---------------|Control: Stop Sign Stop Sign Uncontrolled UncontrolledRights: Include Include Include Ignore Lanes: 0 0 0 0 0 1 0 0 0 1 0 0 1 0 0 0 0 1 0 1 ------------|---------------||---------------||---------------||---------------|Volume Module:Base Vol: 0 0 0 47 0 15 0 410 0 0 885 240 Growth Adj: 1.00 1.00 1.00 1.00 1.00 1.00 1.00 1.00 1.00 1.00 1.00 1.00 Initial Bse: 0 0 0 47 0 15 0 410 0 0 885 240 User Adj: 1.00 1.00 1.00 1.00 1.00 1.00 1.00 1.00 1.00 1.00 1.00 0.00 PHF Adj: 0.95 0.95 0.95 0.95 0.95 0.95 0.95 0.95 0.95 0.95 0.95 0.00 PHF Volume: 0 0 0 49 0 16 0 432 0 0 932 0 Reduct Vol: 0 0 0 0 0 0 0 0 0 0 0 0 FinalVolume: 0 0 0 49 0 16 0 432 0 0 932 0 ------------|---------------||---------------||---------------||---------------|Critical Gap Module:Critical Gp:xxxxx xxxx xxxxx 6.4 xxxx 6.2 xxxxx xxxx xxxxx xxxxx xxxx xxxxx FollowUpTim:xxxxx xxxx xxxxx 3.5 xxxx 3.3 xxxxx xxxx xxxxx xxxxx xxxx xxxxx ------------|---------------||---------------||---------------||---------------|Capacity Module:Cnflict Vol: xxxx xxxx xxxxx 1363 xxxx 932 xxxx xxxx xxxxx xxxx xxxx xxxxx Potent Cap.: xxxx xxxx xxxxx 165 xxxx 326 xxxx xxxx xxxxx xxxx xxxx xxxxx Move Cap.: xxxx xxxx xxxxx 165 xxxx 326 xxxx xxxx xxxxx xxxx xxxx xxxxx Volume/Cap: xxxx xxxx xxxx 0.30 xxxx 0.05 xxxx xxxx xxxx xxxx xxxx xxxx ------------|---------------||---------------||---------------||---------------|Level Of Service Module:2Way95thQ: xxxx xxxx xxxxx 1.2 xxxx 0.2 xxxx xxxx xxxxx xxxx xxxx xxxxx Control Del:xxxxx xxxx xxxxx 36.0 xxxx 16.6 xxxxx xxxx xxxxx xxxxx xxxx xxxxx LOS by Move: * * * E * C * * * * * * Movement: LT - LTR - RT LT - LTR - RT LT - LTR - RT LT - LTR - RT Shared Cap.: xxxx xxxx xxxxx xxxx xxxx xxxxx xxxx xxxx xxxxx xxxx xxxx xxxxx SharedQueue:xxxxx xxxx xxxxx xxxxx xxxx xxxxx xxxxx xxxx xxxxx xxxxx xxxx xxxxx Shrd ConDel:xxxxx xxxx xxxxx xxxxx xxxx xxxxx xxxxx xxxx xxxxx xxxxx xxxx xxxxx Shared LOS: * * * * * * * * * * * * ApproachDel: xxxxxx 31.3 xxxxxx xxxxxxApproachLOS: * D * * ********************************************************************************Note: Queue reported is the number of cars per lane.********************************************************************************

CP(B)_AM Tue Nov 6, 2007 12:00:37 Page 6-1 ---------------------------------------------------------------------------------------------------------------------------------------------------------------- Level Of Service Computation Report 2000 HCM Operations Method (Base Volume Alternative) ********************************************************************************Intersection #4 Henry St / Palani Rd ********************************************************************************Cycle (sec): 100 Critical Vol./Cap.(X): 1.691Loss Time (sec): 10 (Y+R=4.0 sec) Average Delay (sec/veh): 229.3Optimal Cycle: 180 Level Of Service: F********************************************************************************Street Name: Henry St Palani Rd Approach: North Bound South Bound East Bound West Bound Movement: L - T - R L - T - R L - T - R L - T - R ------------|---------------||---------------||---------------||---------------|Control: Permitted Permitted Permitted Prot+Permit Rights: Ovl Include Include Include Min. Green: 0 0 0 0 0 0 0 0 0 0 0 0 Lanes: 1 0 0 1 0 1 0 0 1 0 1 0 0 1 0 1 0 0 1 0 ------------|---------------||---------------||---------------||---------------|Volume Module:Base Vol: 122 414 454 116 558 327 243 185 37 942 810 90 Growth Adj: 1.00 1.00 1.00 1.00 1.00 1.00 1.00 1.00 1.00 1.00 1.00 1.00 Initial Bse: 122 414 454 116 558 327 243 185 37 942 810 90 User Adj: 1.00 1.00 1.00 1.00 1.00 1.00 1.00 1.00 1.00 1.00 1.00 1.00 PHF Adj: 0.95 0.95 0.95 0.95 0.95 0.95 0.95 0.95 0.95 0.95 0.95 0.95 PHF Volume: 128 436 478 122 587 344 256 195 39 992 853 95 Reduct Vol: 0 0 0 0 0 0 0 0 0 0 0 0 Reduced Vol: 128 436 478 122 587 344 256 195 39 992 853 95 PCE Adj: 1.00 1.00 1.00 1.00 1.00 1.00 1.00 1.00 1.00 1.00 1.00 1.00 MLF Adj: 1.00 1.00 1.00 1.00 1.00 1.00 1.00 1.00 1.00 1.00 1.00 1.00 FinalVolume: 128 436 478 122 587 344 256 195 39 992 853 95 ------------|---------------||---------------||---------------||---------------|Saturation Flow Module:Sat/Lane: 1900 1900 1900 1900 1900 1900 1900 1900 1900 1900 1900 1900 Adjustment: 0.08 0.92 0.92 0.08 0.95 0.95 0.95 0.98 0.98 0.77 0.99 0.99 Lanes: 1.00 0.48 0.52 1.00 0.63 0.37 1.00 0.83 0.17 1.00 0.90 0.10 Final Sat.: 152 836 916 152 1132 663 1805 1544 309 1465 1684 187 ------------|---------------||---------------||---------------||---------------|Capacity Analysis Module:Vol/Sat: 0.84 0.52 0.52 0.80 0.52 0.52 0.14 0.13 0.13 0.68 0.51 0.51 Crit Moves: **** **** Green/Cycle: 0.50 0.50 0.83 0.50 0.50 0.50 0.09 0.07 0.07 0.31 0.31 0.31 Volume/Cap: 1.69 1.04 0.63 1.61 1.04 1.04 1.62 1.69 1.69 1.73 1.62 1.62 Uniform Del: 25.0 25.0 3.2 25.0 25.0 25.0 45.6 46.3 46.3 34.6 34.4 34.4 IncremntDel:360.2 42.2 0.9 325.4 40.1 40.1 306.3 339 339.3 337.0 287 287.0 InitQueuDel: 0.0 0.0 0.0 0.0 0.0 0.0 0.0 0.0 0.0 0.0 0.0 0.0 Delay Adj: 1.00 1.00 1.00 1.00 1.00 1.00 1.00 1.00 1.00 1.00 1.00 1.00 Delay/Veh: 385.2 67.2 4.1 350.4 65.1 65.1 351.9 386 385.6 371.6 321 321.4 User DelAdj: 1.00 1.00 1.00 1.00 1.00 1.00 1.00 1.00 1.00 1.00 1.00 1.00 AdjDel/Veh: 385.2 67.2 4.1 350.4 65.1 65.1 351.9 386 385.6 371.6 321 321.4 LOS by Move: F E A F E E F F F F F F HCM2kAvgQ: 12 39 11 11 39 39 22 20 20 82 74 74 ********************************************************************************Note: Queue reported is the number of cars per lane.********************************************************************************

CP(B)_AM Tue Nov 6, 2007 12:00:37 Page 7-1 ---------------------------------------------------------------------------------------------------------------------------------------------------------------- Level Of Service Computation Report 2000 HCM Unsignalized Method (Base Volume Alternative) ********************************************************************************Intersection #5 Gate 2/Palani ********************************************************************************Average Delay (sec/veh): 1.4 Worst Case Level Of Service: F[ 91.9]********************************************************************************Street Name: Gate 2 /Palani Rd Approach: North Bound South Bound East Bound West Bound Movement: L - T - R L - T - R L - T - R L - T - R ------------|---------------||---------------||---------------||---------------|Control: Stop Sign Yield Sign Uncontrolled UncontrolledRights: Include Include Include Include Lanes: 0 0 0 0 0 0 0 0 0 1 0 0 1 0 0 0 0 0 1 0 ------------|---------------||---------------||---------------||---------------|Volume Module:Base Vol: 0 0 0 0 0 42 0 755 0 0 1800 100 Growth Adj: 1.00 1.00 1.00 1.00 1.00 1.00 1.00 1.00 1.00 1.00 1.00 1.00 Initial Bse: 0 0 0 0 0 42 0 755 0 0 1800 100 User Adj: 1.00 1.00 1.00 1.00 1.00 1.00 1.00 1.00 1.00 1.00 1.00 1.00 PHF Adj: 0.95 0.95 0.95 0.95 0.95 0.95 0.95 0.95 0.95 0.95 0.95 0.95 PHF Volume: 0 0 0 0 0 44 0 795 0 0 1895 105 Reduct Vol: 0 0 0 0 0 0 0 0 0 0 0 0 FinalVolume: 0 0 0 0 0 44 0 795 0 0 1895 105 ------------|---------------||---------------||---------------||---------------|Critical Gap Module:Critical Gp:xxxxx xxxx xxxxx xxxxx xxxx 6.2 xxxxx xxxx xxxxx xxxxx xxxx xxxxx FollowUpTim:xxxxx xxxx xxxxx xxxxx xxxx 3.3 xxxxx xxxx xxxxx xxxxx xxxx xxxxx ------------|---------------||---------------||---------------||---------------|Capacity Module:Cnflict Vol: xxxx xxxx xxxxx xxxx xxxx 1947 xxxx xxxx xxxxx xxxx xxxx xxxxx Potent Cap.: xxxx xxxx xxxxx xxxx xxxx 82 xxxx xxxx xxxxx xxxx xxxx xxxxx Move Cap.: xxxx xxxx xxxxx xxxx xxxx 82 xxxx xxxx xxxxx xxxx xxxx xxxxx Volume/Cap: xxxx xxxx xxxx xxxx xxxx 0.54 xxxx xxxx xxxx xxxx xxxx xxxx ------------|---------------||---------------||---------------||---------------|Level Of Service Module:2Way95thQ: xxxx xxxx xxxxx xxxx xxxx 2.4 xxxx xxxx xxxxx xxxx xxxx xxxxx Control Del:xxxxx xxxx xxxxx xxxxx xxxx 91.9 xxxxx xxxx xxxxx xxxxx xxxx xxxxx LOS by Move: * * * * * F * * * * * * Movement: LT - LTR - RT LT - LTR - RT LT - LTR - RT LT - LTR - RT Shared Cap.: xxxx xxxx xxxxx xxxx xxxx xxxxx xxxx xxxx xxxxx xxxx xxxx xxxxx SharedQueue:xxxxx xxxx xxxxx xxxxx xxxx xxxxx xxxxx xxxx xxxxx xxxxx xxxx xxxxx Shrd ConDel:xxxxx xxxx xxxxx xxxxx xxxx xxxxx xxxxx xxxx xxxxx xxxxx xxxx xxxxx Shared LOS: * * * * * * * * * * * * ApproachDel: xxxxxx 91.9 xxxxxx xxxxxxApproachLOS: * F * * ********************************************************************************Note: Queue reported is the number of cars per lane.********************************************************************************

CP(B)_AM Tue Nov 6, 2007 12:00:37 Page 8-1 ---------------------------------------------------------------------------------------------------------------------------------------------------------------- Level Of Service Computation Report 2000 HCM Operations Method (Base Volume Alternative) ********************************************************************************Intersection #6 Queen Kaahumanu Hwy / Makala Blvd ********************************************************************************Cycle (sec): 100 Critical Vol./Cap.(X): 0.666Loss Time (sec): 10 (Y+R=4.0 sec) Average Delay (sec/veh): 22.0Optimal Cycle: 50 Level Of Service: C********************************************************************************Street Name: Queen Kaahumanu Hwy Makala Blvd Approach: North Bound South Bound East Bound West Bound Movement: L - T - R L - T - R L - T - R L - T - R ------------|---------------||---------------||---------------||---------------|Control: Prot+Permit Prot+Permit Prot+Permit Prot+Permit Rights: Ovl Ovl Include Include Min. Green: 0 0 0 0 0 0 0 0 0 0 0 0 Lanes: 1 0 2 0 1 1 0 2 0 1 1 0 0 1 0 1 0 0 1 0 ------------|---------------||---------------||---------------||---------------|Volume Module:Base Vol: 10 944 30 68 907 200 309 72 32 7 21 143 Growth Adj: 1.00 1.00 1.00 1.00 1.00 1.00 1.00 1.00 1.00 1.00 1.00 1.00 Initial Bse: 10 944 30 68 907 200 309 72 32 7 21 143 User Adj: 1.00 1.00 1.00 1.00 1.00 1.00 1.00 1.00 1.00 1.00 1.00 1.00 PHF Adj: 0.95 0.95 0.95 0.95 0.95 0.95 0.95 0.95 0.95 0.95 0.95 0.95 PHF Volume: 11 994 32 72 955 211 325 76 34 7 22 151 Reduct Vol: 0 0 0 0 0 0 0 0 0 0 0 0 Reduced Vol: 11 994 32 72 955 211 325 76 34 7 22 151 PCE Adj: 1.00 1.00 1.00 1.00 1.00 1.00 1.00 1.00 1.00 1.00 1.00 1.00 MLF Adj: 1.00 1.00 1.00 1.00 1.00 1.00 1.00 1.00 1.00 1.00 1.00 1.00 FinalVolume: 11 994 32 72 955 211 325 76 34 7 22 151 ------------|---------------||---------------||---------------||---------------|Saturation Flow Module:Sat/Lane: 1900 1900 1900 1900 1900 1900 1900 1900 1900 1900 1900 1900 Adjustment: 0.95 0.95 0.85 0.95 0.95 0.85 0.95 0.95 0.95 0.95 0.87 0.87 Lanes: 1.00 2.00 1.00 1.00 2.00 1.00 1.00 0.69 0.31 1.00 0.13 0.87 Final Sat.: 1805 3610 1615 1805 3610 1615 1805 1255 558 1805 211 1440 ------------|---------------||---------------||---------------||---------------|Capacity Analysis Module:Vol/Sat: 0.01 0.28 0.02 0.04 0.26 0.13 0.18 0.06 0.06 0.00 0.10 0.10 Crit Moves: **** **** **** **** Green/Cycle: 0.42 0.41 0.44 0.49 0.46 0.73 0.45 0.40 0.40 0.18 0.16 0.16 Volume/Cap: 0.06 0.67 0.04 0.33 0.57 0.18 0.54 0.15 0.15 0.03 0.67 0.67 Uniform Del: 17.6 23.8 16.0 16.5 19.6 4.1 18.8 19.1 19.1 33.4 39.7 39.7 IncremntDel: 0.1 1.2 0.0 0.9 0.5 0.1 1.0 0.1 0.1 0.0 6.5 6.5 InitQueuDel: 0.0 0.0 0.0 0.0 0.0 0.0 0.0 0.0 0.0 0.0 0.0 0.0 Delay Adj: 1.00 1.00 1.00 1.00 1.00 1.00 1.00 1.00 1.00 1.00 1.00 1.00 Delay/Veh: 17.8 24.9 16.0 17.4 20.1 4.2 19.9 19.2 19.2 33.5 46.2 46.2 User DelAdj: 1.00 1.00 1.00 1.00 1.00 1.00 1.00 1.00 1.00 1.00 1.00 1.00 AdjDel/Veh: 17.8 24.9 16.0 17.4 20.1 4.2 19.9 19.2 19.2 33.5 46.2 46.2 LOS by Move: B C B B C A B B B C D D HCM2kAvgQ: 0 14 1 2 12 2 8 2 2 0 6 6 ********************************************************************************Note: Queue reported is the number of cars per lane.********************************************************************************

CP(B)_AM Tue Nov 6, 2007 12:00:37 Page 9-1 ---------------------------------------------------------------------------------------------------------------------------------------------------------------- Level Of Service Computation Report 2000 HCM Unsignalized Method (Base Volume Alternative) ********************************************************************************Intersection #7 Ane Keohokahole/Main Gate ********************************************************************************Average Delay (sec/veh): 238.9 Worst Case Level Of Service: F[788.3]********************************************************************************Street Name: Ane Keohokahole Hwy Main Gate Approach: North Bound South Bound East Bound West Bound Movement: L - T - R L - T - R L - T - R L - T - R ------------|---------------||---------------||---------------||---------------|Control: Uncontrolled Uncontrolled Stop Sign Stop Sign Rights: Include Include Include Include Lanes: 0 0 1 0 1 1 0 1 0 0 0 0 0 0 0 1 0 0 0 1 ------------|---------------||---------------||---------------||---------------|Volume Module:Base Vol: 0 447 299 200 620 0 0 0 0 381 0 296 Growth Adj: 1.00 1.00 1.00 1.00 1.00 1.00 1.00 1.00 1.00 1.00 1.00 1.00 Initial Bse: 0 447 299 200 620 0 0 0 0 381 0 296 User Adj: 1.00 1.00 1.00 1.00 1.00 1.00 1.00 1.00 1.00 1.00 1.00 1.00 PHF Adj: 0.95 0.95 0.95 0.95 0.95 0.95 0.95 0.95 0.95 0.95 0.95 0.95 PHF Volume: 0 471 315 211 653 0 0 0 0 401 0 312 Reduct Vol: 0 0 0 0 0 0 0 0 0 0 0 0 FinalVolume: 0 471 315 211 653 0 0 0 0 401 0 312 ------------|---------------||---------------||---------------||---------------|Critical Gap Module:Critical Gp:xxxxx xxxx xxxxx 4.1 xxxx xxxxx xxxxx xxxx xxxxx 6.4 xxxx 6.2 FollowUpTim:xxxxx xxxx xxxxx 2.2 xxxx xxxxx xxxxx xxxx xxxxx 3.5 xxxx 3.3 ------------|---------------||---------------||---------------||---------------|Capacity Module:Cnflict Vol: xxxx xxxx xxxxx 785 xxxx xxxxx xxxx xxxx xxxxx 1544 xxxx 471 Potent Cap.: xxxx xxxx xxxxx 842 xxxx xxxxx xxxx xxxx xxxxx 128 xxxx 597 Move Cap.: xxxx xxxx xxxxx 842 xxxx xxxxx xxxx xxxx xxxxx 103 xxxx 597 Volume/Cap: xxxx xxxx xxxx 0.25 xxxx xxxx xxxx xxxx xxxx 3.89 xxxx 0.52 ------------|---------------||---------------||---------------||---------------|Level Of Service Module:2Way95thQ: xxxx xxxx xxxxx 1.0 xxxx xxxxx xxxx xxxx xxxxx 40.9 xxxx 3.0 Control Del:xxxxx xxxx xxxxx 10.7 xxxx xxxxx xxxxx xxxx xxxxx 1387 xxxx 17.4 LOS by Move: * * * B * * * * * F * C Movement: LT - LTR - RT LT - LTR - RT LT - LTR - RT LT - LTR - RT Shared Cap.: xxxx xxxx xxxxx xxxx xxxx xxxxx xxxx xxxx xxxxx xxxx xxxx xxxxx SharedQueue:xxxxx xxxx xxxxx xxxxx xxxx xxxxx xxxxx xxxx xxxxx xxxxx xxxx xxxxx Shrd ConDel:xxxxx xxxx xxxxx xxxxx xxxx xxxxx xxxxx xxxx xxxxx xxxxx xxxx xxxxx Shared LOS: * * * * * * * * * * * * ApproachDel: xxxxxx xxxxxx xxxxxx 788.3ApproachLOS: * * * F ********************************************************************************Note: Queue reported is the number of cars per lane.********************************************************************************

CP(B)_AM Tue Nov 6, 2007 12:00:37 Page 10-1 ---------------------------------------------------------------------------------------------------------------------------------------------------------------- Level Of Service Computation Report 2000 HCM Operations Method (Base Volume Alternative) ********************************************************************************Intersection #8 Palihiolo St/Palani Rd ********************************************************************************Cycle (sec): 100 Critical Vol./Cap.(X): 1.647Loss Time (sec): 10 (Y+R=4.0 sec) Average Delay (sec/veh): 189.4Optimal Cycle: 180 Level Of Service: F********************************************************************************Street Name: Palihiolo St Palani Rd Approach: North Bound South Bound East Bound West Bound Movement: L - T - R L - T - R L - T - R L - T - R ------------|---------------||---------------||---------------||---------------|Control: Permitted Permitted Prot+Permit Permitted Rights: Include Include Include Ignore Min. Green: 0 0 0 0 0 0 0 0 0 0 0 0 Lanes: 0 1 0 0 1 1 0 0 1 0 1 0 0 1 0 1 0 1 0 1 ------------|---------------||---------------||---------------||---------------|Volume Module:Base Vol: 5 20 32 10 15 554 438 561 6 20 1321 56 Growth Adj: 1.00 1.00 1.00 1.00 1.00 1.00 1.00 1.00 1.00 1.00 1.00 1.00 Initial Bse: 5 20 32 10 15 554 438 561 6 20 1321 56 User Adj: 1.00 1.00 1.00 1.00 1.00 1.00 1.00 1.00 1.00 1.00 1.00 0.00 PHF Adj: 0.95 0.95 0.95 0.95 0.95 0.95 0.95 0.95 0.95 0.95 0.95 0.00 PHF Volume: 5 21 34 11 16 583 461 591 6 21 1391 0 Reduct Vol: 0 0 0 0 0 0 0 0 0 0 0 0 Reduced Vol: 5 21 34 11 16 583 461 591 6 21 1391 0 PCE Adj: 1.00 1.00 1.00 1.00 1.00 1.00 1.00 1.00 1.00 1.00 1.00 0.00 MLF Adj: 1.00 1.00 1.00 1.00 1.00 1.00 1.00 1.00 1.00 1.00 1.00 0.00 FinalVolume: 5 21 34 11 16 583 461 591 6 21 1391 0 ------------|---------------||---------------||---------------||---------------|Saturation Flow Module:Sat/Lane: 1900 1900 1900 1900 1900 1900 1900 1900 1900 1900 1900 1900 Adjustment: 0.64 0.64 0.85 0.75 0.85 0.85 0.22 1.00 1.00 0.95 1.00 1.00 Lanes: 0.20 0.80 1.00 1.00 0.03 0.97 1.00 0.99 0.01 1.00 1.00 1.00 Final Sat.: 244 977 1615 1419 43 1580 414 1876 20 1805 1900 1900 ------------|---------------||---------------||---------------||---------------|Capacity Analysis Module:Vol/Sat: 0.02 0.02 0.02 0.01 0.37 0.37 1.11 0.31 0.31 0.01 0.73 0.00 Crit Moves: **** **** Green/Cycle: 0.24 0.24 0.24 0.24 0.24 0.24 0.63 0.63 0.63 0.02 0.49 0.00 Volume/Cap: 0.09 0.09 0.09 0.03 1.51 1.51 1.21 0.50 0.50 0.50 1.51 0.00 Uniform Del: 29.1 29.1 29.1 28.7 37.8 37.8 8.6 9.9 9.9 48.2 25.7 0.0 IncremntDel: 0.1 0.1 0.1 0.0 241 241.0 115.4 0.3 0.3 9.0 234 0.0 InitQueuDel: 0.0 0.0 0.0 0.0 0.0 0.0 0.0 0.0 0.0 0.0 0.0 0.0 Delay Adj: 1.00 1.00 1.00 1.00 1.00 1.00 1.00 1.00 1.00 1.00 1.00 0.00 Delay/Veh: 29.3 29.3 29.2 28.8 279 278.7 124.0 10.2 10.2 57.2 260 0.0 User DelAdj: 1.00 1.00 1.00 1.00 1.00 1.00 1.00 1.00 1.00 1.00 1.00 1.00 AdjDel/Veh: 29.3 29.3 29.2 28.8 279 278.7 124.0 10.2 10.2 57.2 260 0.0 LOS by Move: C C C C F F F B B E F A HCM2kAvgQ: 1 1 1 0 45 45 27 10 10 1 100 0 ********************************************************************************Note: Queue reported is the number of cars per lane.********************************************************************************

CP(B)_AM Tue Nov 6, 2007 12:00:37 Page 11-1 ---------------------------------------------------------------------------------------------------------------------------------------------------------------- Level Of Service Computation Report 2000 HCM Unsignalized Method (Base Volume Alternative) ********************************************************************************Intersection #10 Palani Rd / Uluaoa St ********************************************************************************Average Delay (sec/veh): 45.9 Worst Case Level Of Service: F[247.6]********************************************************************************Street Name: Palani Rd Uluaoa St Approach: North Bound South Bound East Bound West Bound Movement: L - T - R L - T - R L - T - R L - T - R ------------|---------------||---------------||---------------||---------------|Control: Uncontrolled Uncontrolled Stop Sign Stop Sign Rights: Include Include Include Include Lanes: 0 1 0 0 0 0 0 0 1 0 1 0 0 0 1 0 0 0 0 0 ------------|---------------||---------------||---------------||---------------|Volume Module:Base Vol: 58 507 0 0 790 311 176 0 200 0 0 0 Growth Adj: 1.00 1.00 1.00 1.00 1.00 1.00 1.00 1.00 1.00 1.00 1.00 1.00 Initial Bse: 58 507 0 0 790 311 176 0 200 0 0 0 User Adj: 1.00 1.00 1.00 1.00 1.00 1.00 1.00 1.00 1.00 1.00 1.00 1.00 PHF Adj: 0.95 0.95 0.95 0.95 0.95 0.95 0.95 0.95 0.95 0.95 0.95 0.95 PHF Volume: 61 534 0 0 832 327 185 0 211 0 0 0 Reduct Vol: 0 0 0 0 0 0 0 0 0 0 0 0 FinalVolume: 61 534 0 0 832 327 185 0 211 0 0 0 ------------|---------------||---------------||---------------||---------------|Critical Gap Module:Critical Gp: 4.1 xxxx xxxxx xxxxx xxxx xxxxx 6.4 xxxx 6.2 xxxxx xxxx xxxxx FollowUpTim: 2.2 xxxx xxxxx xxxxx xxxx xxxxx 3.5 xxxx 3.3 xxxxx xxxx xxxxx ------------|---------------||---------------||---------------||---------------|Capacity Module:Cnflict Vol: 1159 xxxx xxxxx xxxx xxxx xxxxx 1651 xxxx 995 xxxx xxxx xxxxx Potent Cap.: 610 xxxx xxxxx xxxx xxxx xxxxx 110 xxxx 300 xxxx xxxx xxxxx Move Cap.: 610 xxxx xxxxx xxxx xxxx xxxxx 101 xxxx 300 xxxx xxxx xxxxx Volume/Cap: 0.10 xxxx xxxx xxxx xxxx xxxx 1.83 xxxx 0.70 xxxx xxxx xxxx ------------|---------------||---------------||---------------||---------------|Level Of Service Module:2Way95thQ: 0.3 xxxx xxxxx xxxx xxxx xxxxx 15.1 xxxx 4.9 xxxx xxxx xxxxx Control Del: 11.6 xxxx xxxxx xxxxx xxxx xxxxx 482.3 xxxx 41.1 xxxxx xxxx xxxxx LOS by Move: B * * * * * F * E * * * Movement: LT - LTR - RT LT - LTR - RT LT - LTR - RT LT - LTR - RT Shared Cap.: xxxx xxxx xxxxx xxxx xxxx xxxxx xxxx xxxx xxxxx xxxx xxxx xxxxx SharedQueue: 0.3 xxxx xxxxx xxxxx xxxx xxxxx xxxxx xxxx xxxxx xxxxx xxxx xxxxx Shrd ConDel: 11.6 xxxx xxxxx xxxxx xxxx xxxxx xxxxx xxxx xxxxx xxxxx xxxx xxxxx Shared LOS: B * * * * * * * * * * * ApproachDel: xxxxxx xxxxxx 247.6 xxxxxxApproachLOS: * * F * ********************************************************************************Note: Queue reported is the number of cars per lane.********************************************************************************

CP(B)_AM Tue Nov 6, 2007 12:00:37 Page 12-1 ---------------------------------------------------------------------------------------------------------------------------------------------------------------- Level Of Service Computation Report 2000 HCM Operations Method (Base Volume Alternative) ********************************************************************************Intersection #11 Queen Kaahumanu Hwy / Kealakehe Pkwy ********************************************************************************Cycle (sec): 100 Critical Vol./Cap.(X): 0.834Loss Time (sec): 10 (Y+R=4.0 sec) Average Delay (sec/veh): 28.2Optimal Cycle: 80 Level Of Service: C********************************************************************************Street Name: Queen Kaahumanu Hwy Kaalakehe Pkwy Approach: North Bound South Bound East Bound West Bound Movement: L - T - R L - T - R L - T - R L - T - R ------------|---------------||---------------||---------------||---------------|Control: Prot+Permit Prot+Permit Permitted Permitted Rights: Ovl Ovl Ovl Ovl Min. Green: 0 0 0 0 0 0 0 0 0 0 0 0 Lanes: 1 0 2 0 1 1 0 2 0 1 0 1 0 0 1 0 1 0 0 1 ------------|---------------||---------------||---------------||---------------|Volume Module:Base Vol: 115 1037 422 271 977 249 81 107 10 231 61 208 Growth Adj: 1.00 1.00 1.00 1.00 1.00 1.00 1.00 1.00 1.00 1.00 1.00 1.00 Initial Bse: 115 1037 422 271 977 249 81 107 10 231 61 208 User Adj: 1.00 1.00 1.00 1.00 1.00 1.00 1.00 1.00 1.00 1.00 1.00 1.00 PHF Adj: 0.95 0.95 0.95 0.95 0.95 0.95 0.95 0.95 0.95 0.95 0.95 0.95 PHF Volume: 121 1092 444 285 1028 262 85 113 11 243 64 219 Reduct Vol: 0 0 0 0 0 0 0 0 0 0 0 0 Reduced Vol: 121 1092 444 285 1028 262 85 113 11 243 64 219 PCE Adj: 1.00 1.00 1.00 1.00 1.00 1.00 1.00 1.00 1.00 1.00 1.00 1.00 MLF Adj: 1.00 1.00 1.00 1.00 1.00 1.00 1.00 1.00 1.00 1.00 1.00 1.00 FinalVolume: 121 1092 444 285 1028 262 85 113 11 243 64 219 ------------|---------------||---------------||---------------||---------------|Saturation Flow Module:Sat/Lane: 1900 1900 1900 1900 1900 1900 1900 1900 1900 1900 1900 1900 Adjustment: 0.95 0.95 0.85 0.95 0.95 0.85 0.61 0.61 0.85 0.56 0.56 0.85 Lanes: 1.00 2.00 1.00 1.00 2.00 1.00 0.43 0.57 1.00 0.79 0.21 1.00 Final Sat.: 1805 3610 1615 1805 3610 1615 495 654 1615 837 221 1615 ------------|---------------||---------------||---------------||---------------|Capacity Analysis Module:Vol/Sat: 0.07 0.30 0.28 0.16 0.28 0.16 0.17 0.17 0.01 0.29 0.29 0.14 Crit Moves: **** **** **** Green/Cycle: 0.47 0.36 0.36 0.58 0.45 0.45 0.35 0.35 0.45 0.35 0.35 0.54 Volume/Cap: 0.38 0.83 0.76 0.68 0.64 0.36 0.49 0.49 0.01 0.83 0.83 0.25 Uniform Del: 16.1 29.1 28.0 23.3 21.4 18.3 25.7 25.7 15.0 29.9 29.9 12.4 IncremntDel: 0.8 4.8 5.7 4.6 0.9 0.3 1.0 1.0 0.0 15.0 15.0 0.2 InitQueuDel: 0.0 0.0 0.0 0.0 0.0 0.0 0.0 0.0 0.0 0.0 0.0 0.0 Delay Adj: 1.00 1.00 1.00 1.00 1.00 1.00 1.00 1.00 1.00 1.00 1.00 1.00 Delay/Veh: 16.9 33.9 33.8 27.9 22.3 18.6 26.6 26.6 15.1 45.0 45.0 12.5 User DelAdj: 1.00 1.00 1.00 1.00 1.00 1.00 1.00 1.00 1.00 1.00 1.00 1.00 AdjDel/Veh: 16.9 33.9 33.8 27.9 22.3 18.6 26.6 26.6 15.1 45.0 45.0 12.5 LOS by Move: B C C C C B C C B D D B HCM2kAvgQ: 3 19 14 7 13 5 5 5 0 11 11 4 ********************************************************************************Note: Queue reported is the number of cars per lane.********************************************************************************

CP(B)_AM Tue Nov 6, 2007 12:00:37 Page 13-1 ---------------------------------------------------------------------------------------------------------------------------------------------------------------- Level Of Service Computation Report 2000 HCM Unsignalized Method (Base Volume Alternative) ********************************************************************************Intersection #12 Ane Keohokalole Hwy / Kealakehe Pkwy ********************************************************************************Average Delay (sec/veh): OVERFLOW Worst Case Level Of Service: F[xxxxx]********************************************************************************Street Name: Ane Keohokalole Hwy Kealakehe Pkwy Approach: North Bound South Bound East Bound West Bound Movement: L - T - R L - T - R L - T - R L - T - R ------------|---------------||---------------||---------------||---------------|Control: Stop Sign Stop Sign Uncontrolled UncontrolledRights: Include Include Include Include Lanes: 1 0 1 0 1 1 0 0 1 0 1 0 1 1 0 1 0 1 0 1 ------------|---------------||---------------||---------------||---------------|Volume Module:Base Vol: 293 447 3 12 362 45 369 94 456 2 115 50 Growth Adj: 1.00 1.00 1.00 1.00 1.00 1.00 1.00 1.00 1.00 1.00 1.00 1.00 Initial Bse: 293 447 3 12 362 45 369 94 456 2 115 50 User Adj: 1.00 1.00 1.00 1.00 1.00 1.00 1.00 1.00 1.00 1.00 1.00 1.00 PHF Adj: 0.95 0.95 0.95 0.95 0.95 0.95 0.95 0.95 0.95 0.95 0.95 0.95 PHF Volume: 308 471 3 13 381 47 388 99 480 2 121 53 Reduct Vol: 0 0 0 0 0 0 0 0 0 0 0 0 FinalVolume: 308 471 3 13 381 47 388 99 480 2 121 53 ------------|---------------||---------------||---------------||---------------|Critical Gap Module:Critical Gp: 7.1 6.5 6.2 7.1 6.5 6.2 4.1 xxxx xxxxx 4.1 xxxx xxxxx FollowUpTim: 3.5 4.0 3.3 3.5 4.0 3.3 2.2 xxxx xxxxx 2.2 xxxx xxxxx ------------|---------------||---------------||---------------||---------------|Capacity Module:Cnflict Vol: 1482 1294 289 1187 1481 121 174 xxxx xxxxx 579 xxxx xxxxx Potent Cap.: 104 164 754 167 127 936 1415 xxxx xxxxx 1005 xxxx xxxxx Move Cap.: 0 119 754 0 92 936 1415 xxxx xxxxx 1005 xxxx xxxxx Volume/Cap: xxxx 3.96 0.00 xxxx 4.16 0.05 0.27 xxxx xxxx 0.00 xxxx xxxx ------------|---------------||---------------||---------------||---------------|Level Of Service Module:2Way95thQ: xxxx 47.7 0.0 xxxx xxxx xxxxx 1.1 xxxx xxxxx 0.0 xxxx xxxxx Control Del:xxxxx 1407 9.8 xxxxx xxxx xxxxx 8.5 xxxx xxxxx 8.6 xxxx xxxxx LOS by Move: * F A * * * A * * A * * Movement: LT - LTR - RT LT - LTR - RT LT - LTR - RT LT - LTR - RT Shared Cap.: xxxx xxxx xxxxx xxxx xxxx 102 xxxx xxxx xxxxx xxxx xxxx xxxxx SharedQueue:xxxxx xxxx xxxxx xxxxx xxxx 44.4 xxxxx xxxx xxxxx xxxxx xxxx xxxxx Shrd ConDel:xxxxx xxxx xxxxx xxxxx xxxx 1530 xxxxx xxxx xxxxx xxxxx xxxx xxxxx Shared LOS: * * * * * F * * * * * * ApproachDel: xxxxxx xxxxxx xxxxxx xxxxxxApproachLOS: F F * * ********************************************************************************Note: Queue reported is the number of cars per lane.********************************************************************************

CP(B)_PM Tue Nov 6, 2007 12:00:40 Page 3-1 ---------------------------------------------------------------------------------------------------------------------------------------------------------------- Level Of Service Computation Report 2000 HCM Operations Method (Base Volume Alternative) ********************************************************************************Intersection #1 Queen Kaahumanu Hwy / Henry St ********************************************************************************Cycle (sec): 100 Critical Vol./Cap.(X): 0.925Loss Time (sec): 10 (Y+R=4.0 sec) Average Delay (sec/veh): 31.6Optimal Cycle: 119 Level Of Service: C********************************************************************************Street Name: Queen Kaahumanu Hwy Henry St Approach: North Bound South Bound East Bound West Bound Movement: L - T - R L - T - R L - T - R L - T - R ------------|---------------||---------------||---------------||---------------|Control: Prot+Permit Prot+Permit Prot+Permit Prot+Permit Rights: Ovl Ovl Ovl Ovl Min. Green: 0 0 0 0 0 0 0 0 0 0 0 0 Lanes: 1 0 2 0 1 1 0 3 0 1 1 0 2 0 1 1 1 1 0 1 ------------|---------------||---------------||---------------||---------------|Volume Module:Base Vol: 282 537 832 183 730 121 76 628 107 564 602 211 Growth Adj: 1.00 1.00 1.00 1.00 1.00 1.00 1.00 1.00 1.00 1.00 1.00 1.00 Initial Bse: 282 537 832 183 730 121 76 628 107 564 602 211 User Adj: 1.00 1.00 1.00 1.00 1.00 1.00 1.00 1.00 1.00 1.00 1.00 1.00 PHF Adj: 0.95 0.95 0.95 0.95 0.95 0.95 0.95 0.95 0.95 0.95 0.95 0.95 PHF Volume: 297 565 876 193 768 127 80 661 113 594 634 222 Reduct Vol: 0 0 0 0 0 0 0 0 0 0 0 0 Reduced Vol: 297 565 876 193 768 127 80 661 113 594 634 222 PCE Adj: 1.00 1.00 1.00 1.00 1.00 1.00 1.00 1.00 1.00 1.00 1.00 1.00 MLF Adj: 1.00 1.00 1.00 1.00 1.00 1.00 1.00 1.00 1.00 1.00 1.00 1.00 FinalVolume: 297 565 876 193 768 127 80 661 113 594 634 222 ------------|---------------||---------------||---------------||---------------|Saturation Flow Module:Sat/Lane: 1900 1900 1900 1900 1900 1900 1900 1900 1900 1900 1900 1900 Adjustment: 0.95 0.95 0.85 0.95 0.91 0.85 0.95 0.95 0.85 0.93 0.93 0.85 Lanes: 1.00 2.00 1.00 1.00 3.00 1.00 1.00 2.00 1.00 1.45 1.55 1.00 Final Sat.: 1805 3610 1615 1805 5187 1615 1805 3610 1615 2556 2729 1615 ------------|---------------||---------------||---------------||---------------|Capacity Analysis Module:Vol/Sat: 0.16 0.16 0.54 0.11 0.15 0.08 0.04 0.18 0.07 0.23 0.23 0.14 Crit Moves: **** **** **** **** Green/Cycle: 0.47 0.34 0.59 0.33 0.21 0.29 0.27 0.20 0.44 0.47 0.38 0.49 Volume/Cap: 0.59 0.47 0.92 0.51 0.69 0.28 0.28 0.92 0.16 0.64 0.62 0.28 Uniform Del: 18.0 26.2 18.7 25.2 36.3 27.7 27.9 39.4 17.1 20.0 25.3 14.9 IncremntDel: 1.9 0.3 14.4 1.1 1.9 0.3 0.6 17.8 0.1 0.8 0.6 0.2 InitQueuDel: 0.0 0.0 0.0 0.0 0.0 0.0 0.0 0.0 0.0 0.0 0.0 0.0 Delay Adj: 1.00 1.00 1.00 1.00 1.00 1.00 1.00 1.00 1.00 1.00 1.00 1.00 Delay/Veh: 19.9 26.5 33.1 26.3 38.2 28.0 28.4 57.2 17.3 20.7 25.8 15.1 User DelAdj: 1.00 1.00 1.00 1.00 1.00 1.00 1.00 1.00 1.00 1.00 1.00 1.00 AdjDel/Veh: 19.9 26.5 33.1 26.3 38.2 28.0 28.4 57.2 17.3 20.7 25.8 15.1 LOS by Move: B C C C D C C E B C C B HCM2kAvgQ: 7 7 29 5 9 3 2 15 2 11 11 4 ********************************************************************************Note: Queue reported is the number of cars per lane.********************************************************************************

CP(B)_PM Tue Nov 6, 2007 12:00:40 Page 4-1 ---------------------------------------------------------------------------------------------------------------------------------------------------------------- Level Of Service Computation Report 2000 HCM Operations Method (Base Volume Alternative) ********************************************************************************Intersection #2 Queen Kaahumanu Hwy / Alli Dr ********************************************************************************Cycle (sec): 100 Critical Vol./Cap.(X): 1.031Loss Time (sec): 10 (Y+R=4.0 sec) Average Delay (sec/veh): 46.2Optimal Cycle: 180 Level Of Service: D********************************************************************************Street Name: Queen Kaahumanu Hwy Alli Dr Approach: North Bound South Bound East Bound West Bound Movement: L - T - R L - T - R L - T - R L - T - R ------------|---------------||---------------||---------------||---------------|Control: Prot+Permit Prot+Permit Prot+Permit Prot+Permit Rights: Ovl Ovl Ovl Ovl Min. Green: 0 0 0 0 0 0 0 0 0 0 0 0 Lanes: 1 0 2 0 1 1 0 2 0 1 1 0 1 0 1 1 0 1 0 1 ------------|---------------||---------------||---------------||---------------|Volume Module:Base Vol: 38 706 93 299 707 358 269 293 219 143 732 110 Growth Adj: 1.00 1.00 1.00 1.00 1.00 1.00 1.00 1.00 1.00 1.00 1.00 1.00 Initial Bse: 38 706 93 299 707 358 269 293 219 143 732 110 User Adj: 1.00 1.00 1.00 1.00 1.00 1.00 1.00 1.00 1.00 1.00 1.00 1.00 PHF Adj: 0.95 0.95 0.95 0.95 0.95 0.95 0.95 0.95 0.95 0.95 0.95 0.95 PHF Volume: 40 743 98 315 744 377 283 308 231 151 771 116 Reduct Vol: 0 0 0 0 0 0 0 0 0 0 0 0 Reduced Vol: 40 743 98 315 744 377 283 308 231 151 771 116 PCE Adj: 1.00 1.00 1.00 1.00 1.00 1.00 1.00 1.00 1.00 1.00 1.00 1.00 MLF Adj: 1.00 1.00 1.00 1.00 1.00 1.00 1.00 1.00 1.00 1.00 1.00 1.00 FinalVolume: 40 743 98 315 744 377 283 308 231 151 771 116 ------------|---------------||---------------||---------------||---------------|Saturation Flow Module:Sat/Lane: 1900 1900 1900 1900 1900 1900 1900 1900 1900 1900 1900 1900 Adjustment: 0.95 0.95 0.85 0.80 0.95 0.85 0.71 1.00 0.85 0.95 1.00 0.85 Lanes: 1.00 2.00 1.00 1.00 2.00 1.00 1.00 1.00 1.00 1.00 1.00 1.00 Final Sat.: 1805 3610 1615 1513 3610 1615 1351 1900 1615 1805 1900 1615 ------------|---------------||---------------||---------------||---------------|Capacity Analysis Module:Vol/Sat: 0.02 0.21 0.06 0.21 0.21 0.23 0.21 0.16 0.14 0.08 0.41 0.07 Crit Moves: **** **** **** **** Green/Cycle: 0.23 0.20 0.38 0.38 0.33 0.48 0.50 0.35 0.39 0.56 0.39 0.55 Volume/Cap: 0.22 1.05 0.16 0.84 0.63 0.49 0.82 0.46 0.37 0.25 1.05 0.13 Uniform Del: 30.2 40.2 20.5 25.1 28.5 17.8 14.6 24.9 21.7 11.5 30.6 10.7 IncremntDel: 0.6 46.8 0.1 15.4 1.1 0.5 14.1 0.5 0.4 0.2 46.3 0.1 InitQueuDel: 0.0 0.0 0.0 0.0 0.0 0.0 0.0 0.0 0.0 0.0 0.0 0.0 Delay Adj: 1.00 1.00 1.00 1.00 1.00 1.00 1.00 1.00 1.00 1.00 1.00 1.00 Delay/Veh: 30.9 87.0 20.7 40.6 29.6 18.3 28.6 25.3 22.1 11.7 76.9 10.8 User DelAdj: 1.00 1.00 1.00 1.00 1.00 1.00 1.00 1.00 1.00 1.00 1.00 1.00 AdjDel/Veh: 30.9 87.0 20.7 40.6 29.6 18.3 28.6 25.3 22.1 11.7 76.9 10.8 LOS by Move: C F C D C B C C C B E B HCM2kAvgQ: 1 19 2 12 11 8 10 7 5 2 34 2 ********************************************************************************Note: Queue reported is the number of cars per lane.********************************************************************************

CP(B)_PM Tue Nov 6, 2007 12:00:40 Page 5-1 ---------------------------------------------------------------------------------------------------------------------------------------------------------------- Level Of Service Computation Report 2000 HCM Unsignalized Method (Base Volume Alternative) ********************************************************************************Intersection #3 Kamakaeha Ave / Palani Rd ********************************************************************************Average Delay (sec/veh): 19.1 Worst Case Level Of Service: F[180.7]********************************************************************************Street Name: Kamakaeha Ave Palani Rd Approach: North Bound South Bound East Bound West Bound Movement: L - T - R L - T - R L - T - R L - T - R ------------|---------------||---------------||---------------||---------------|Control: Stop Sign Stop Sign Uncontrolled UncontrolledRights: Include Include Include Ignore Lanes: 0 0 0 0 0 1 0 0 0 1 0 0 1 0 0 0 0 1 0 1 ------------|---------------||---------------||---------------||---------------|Volume Module:Base Vol: 0 0 0 127 0 63 0 685 0 0 921 281 Growth Adj: 1.00 1.00 1.00 1.00 1.00 1.00 1.00 1.00 1.00 1.00 1.00 1.00 Initial Bse: 0 0 0 127 0 63 0 685 0 0 921 281 User Adj: 1.00 1.00 1.00 1.00 1.00 1.00 1.00 1.00 1.00 1.00 1.00 0.00 PHF Adj: 0.95 0.95 0.95 0.95 0.95 0.95 0.95 0.95 0.95 0.95 0.95 0.00 PHF Volume: 0 0 0 134 0 66 0 721 0 0 969 0 Reduct Vol: 0 0 0 0 0 0 0 0 0 0 0 0 FinalVolume: 0 0 0 134 0 66 0 721 0 0 969 0 ------------|---------------||---------------||---------------||---------------|Critical Gap Module:Critical Gp:xxxxx xxxx xxxxx 6.4 xxxx 6.2 xxxxx xxxx xxxxx xxxxx xxxx xxxxx FollowUpTim:xxxxx xxxx xxxxx 3.5 xxxx 3.3 xxxxx xxxx xxxxx xxxxx xxxx xxxxx ------------|---------------||---------------||---------------||---------------|Capacity Module:Cnflict Vol: xxxx xxxx xxxxx 1691 xxxx 969 xxxx xxxx xxxxx xxxx xxxx xxxxx Potent Cap.: xxxx xxxx xxxxx 104 xxxx 310 xxxx xxxx xxxxx xxxx xxxx xxxxx Move Cap.: xxxx xxxx xxxxx 104 xxxx 310 xxxx xxxx xxxxx xxxx xxxx xxxxx Volume/Cap: xxxx xxxx xxxx 1.29 xxxx 0.21 xxxx xxxx xxxx xxxx xxxx xxxx ------------|---------------||---------------||---------------||---------------|Level Of Service Module:2Way95thQ: xxxx xxxx xxxxx 9.2 xxxx 0.8 xxxx xxxx xxxxx xxxx xxxx xxxxx Control Del:xxxxx xxxx xxxxx 260.5 xxxx 19.7 xxxxx xxxx xxxxx xxxxx xxxx xxxxx LOS by Move: * * * F * C * * * * * * Movement: LT - LTR - RT LT - LTR - RT LT - LTR - RT LT - LTR - RT Shared Cap.: xxxx xxxx xxxxx xxxx xxxx xxxxx xxxx xxxx xxxxx xxxx xxxx xxxxx SharedQueue:xxxxx xxxx xxxxx xxxxx xxxx xxxxx xxxxx xxxx xxxxx xxxxx xxxx xxxxx Shrd ConDel:xxxxx xxxx xxxxx xxxxx xxxx xxxxx xxxxx xxxx xxxxx xxxxx xxxx xxxxx Shared LOS: * * * * * * * * * * * * ApproachDel: xxxxxx 180.7 xxxxxx xxxxxxApproachLOS: * F * * ********************************************************************************Note: Queue reported is the number of cars per lane.********************************************************************************

CP(B)_PM Tue Nov 6, 2007 12:00:40 Page 6-1 ---------------------------------------------------------------------------------------------------------------------------------------------------------------- Level Of Service Computation Report 2000 HCM Operations Method (Base Volume Alternative) ********************************************************************************Intersection #4 Henry St / Palani Rd ********************************************************************************Cycle (sec): 100 Critical Vol./Cap.(X): 1.328Loss Time (sec): 10 (Y+R=4.0 sec) Average Delay (sec/veh): 188.3Optimal Cycle: 180 Level Of Service: F********************************************************************************Street Name: Henry St Palani Rd Approach: North Bound South Bound East Bound West Bound Movement: L - T - R L - T - R L - T - R L - T - R ------------|---------------||---------------||---------------||---------------|Control: Permitted Permitted Permitted Prot+Permit Rights: Ovl Include Include Include Min. Green: 0 0 0 0 0 0 0 0 0 0 0 0 Lanes: 1 0 0 1 0 1 0 0 1 0 1 0 0 1 0 1 0 0 1 0 ------------|---------------||---------------||---------------||---------------|Volume Module:Base Vol: 110 430 394 88 359 210 335 416 129 870 927 93 Growth Adj: 1.00 1.00 1.00 1.00 1.00 1.00 1.00 1.00 1.00 1.00 1.00 1.00 Initial Bse: 110 430 394 88 359 210 335 416 129 870 927 93 User Adj: 1.00 1.00 1.00 1.00 1.00 1.00 1.00 1.00 1.00 1.00 1.00 1.00 PHF Adj: 0.95 0.95 0.95 0.95 0.95 0.95 0.95 0.95 0.95 0.95 0.95 0.95 PHF Volume: 116 453 415 93 378 221 353 438 136 916 976 98 Reduct Vol: 0 0 0 0 0 0 0 0 0 0 0 0 Reduced Vol: 116 453 415 93 378 221 353 438 136 916 976 98 PCE Adj: 1.00 1.00 1.00 1.00 1.00 1.00 1.00 1.00 1.00 1.00 1.00 1.00 MLF Adj: 1.00 1.00 1.00 1.00 1.00 1.00 1.00 1.00 1.00 1.00 1.00 1.00 FinalVolume: 116 453 415 93 378 221 353 438 136 916 976 98 ------------|---------------||---------------||---------------||---------------|Saturation Flow Module:Sat/Lane: 1900 1900 1900 1900 1900 1900 1900 1900 1900 1900 1900 1900 Adjustment: 0.11 0.93 0.93 0.11 0.95 0.95 0.95 0.96 0.96 0.78 0.99 0.99 Lanes: 1.00 0.52 0.48 1.00 0.63 0.37 1.00 0.76 0.24 1.00 0.91 0.09 Final Sat.: 211 920 843 211 1133 663 1805 1398 434 1483 1703 171 ------------|---------------||---------------||---------------||---------------|Capacity Analysis Module:Vol/Sat: 0.55 0.49 0.49 0.44 0.33 0.33 0.20 0.31 0.31 0.62 0.57 0.57 Crit Moves: **** **** **** Green/Cycle: 0.36 0.36 0.69 0.36 0.36 0.36 0.14 0.21 0.21 0.40 0.40 0.40 Volume/Cap: 1.52 1.36 0.71 1.22 0.92 0.92 1.43 1.52 1.52 1.35 1.43 1.43 Uniform Del: 32.0 32.0 9.2 32.0 30.7 30.7 43.1 39.7 39.7 28.5 29.9 29.9 IncremntDel:290.5 174 1.9 172.8 19.2 19.2 213.2 248 247.9 167.7 199 199.0 InitQueuDel: 0.0 0.0 0.0 0.0 0.0 0.0 0.0 0.0 0.0 0.0 0.0 0.0 Delay Adj: 1.00 1.00 1.00 1.00 1.00 1.00 1.00 1.00 1.00 1.00 1.00 1.00 Delay/Veh: 322.5 206 11.2 204.8 49.8 49.8 256.3 288 287.6 196.1 229 228.9 User DelAdj: 1.00 1.00 1.00 1.00 1.00 1.00 1.00 1.00 1.00 1.00 1.00 1.00 AdjDel/Veh: 322.5 206 11.2 204.8 49.8 49.8 256.3 288 287.6 196.1 229 228.9 LOS by Move: F F B F D D F F F F F F HCM2kAvgQ: 10 56 17 7 22 22 26 43 43 59 73 73 ********************************************************************************Note: Queue reported is the number of cars per lane.********************************************************************************

CP(B)_PM Tue Nov 6, 2007 12:00:40 Page 7-1 ---------------------------------------------------------------------------------------------------------------------------------------------------------------- Level Of Service Computation Report 2000 HCM Unsignalized Method (Base Volume Alternative) ********************************************************************************Intersection #5 Gate 2/Palani ********************************************************************************Average Delay (sec/veh): 1.2 Worst Case Level Of Service: F[ 97.3]********************************************************************************Street Name: Gate 2 /Palani Rd Approach: North Bound South Bound East Bound West Bound Movement: L - T - R L - T - R L - T - R L - T - R ------------|---------------||---------------||---------------||---------------|Control: Stop Sign Yield Sign Uncontrolled UncontrolledRights: Include Include Include Include Lanes: 0 0 0 0 0 0 0 0 0 1 0 0 1 0 0 0 0 0 1 0 ------------|---------------||---------------||---------------||---------------|Volume Module:Base Vol: 0 0 0 0 0 36 0 898 0 0 1853 138 Growth Adj: 1.00 1.00 1.00 1.00 1.00 1.00 1.00 1.00 1.00 1.00 1.00 1.00 Initial Bse: 0 0 0 0 0 36 0 898 0 0 1853 138 User Adj: 1.00 1.00 1.00 1.00 1.00 1.00 1.00 1.00 1.00 1.00 1.00 1.00 PHF Adj: 0.95 0.95 0.95 0.95 0.95 0.95 0.95 0.95 0.95 0.95 0.95 0.95 PHF Volume: 0 0 0 0 0 38 0 945 0 0 1951 145 Reduct Vol: 0 0 0 0 0 0 0 0 0 0 0 0 FinalVolume: 0 0 0 0 0 38 0 945 0 0 1951 145 ------------|---------------||---------------||---------------||---------------|Critical Gap Module:Critical Gp:xxxxx xxxx xxxxx xxxxx xxxx 6.2 xxxxx xxxx xxxxx xxxxx xxxx xxxxx FollowUpTim:xxxxx xxxx xxxxx xxxxx xxxx 3.3 xxxxx xxxx xxxxx xxxxx xxxx xxxxx ------------|---------------||---------------||---------------||---------------|Capacity Module:Cnflict Vol: xxxx xxxx xxxxx xxxx xxxx 2023 xxxx xxxx xxxxx xxxx xxxx xxxxx Potent Cap.: xxxx xxxx xxxxx xxxx xxxx 74 xxxx xxxx xxxxx xxxx xxxx xxxxx Move Cap.: xxxx xxxx xxxxx xxxx xxxx 74 xxxx xxxx xxxxx xxxx xxxx xxxxx Volume/Cap: xxxx xxxx xxxx xxxx xxxx 0.52 xxxx xxxx xxxx xxxx xxxx xxxx ------------|---------------||---------------||---------------||---------------|Level Of Service Module:2Way95thQ: xxxx xxxx xxxxx xxxx xxxx 2.1 xxxx xxxx xxxxx xxxx xxxx xxxxx Control Del:xxxxx xxxx xxxxx xxxxx xxxx 97.3 xxxxx xxxx xxxxx xxxxx xxxx xxxxx LOS by Move: * * * * * F * * * * * * Movement: LT - LTR - RT LT - LTR - RT LT - LTR - RT LT - LTR - RT Shared Cap.: xxxx xxxx xxxxx xxxx xxxx xxxxx xxxx xxxx xxxxx xxxx xxxx xxxxx SharedQueue:xxxxx xxxx xxxxx xxxxx xxxx xxxxx xxxxx xxxx xxxxx xxxxx xxxx xxxxx Shrd ConDel:xxxxx xxxx xxxxx xxxxx xxxx xxxxx xxxxx xxxx xxxxx xxxxx xxxx xxxxx Shared LOS: * * * * * * * * * * * * ApproachDel: xxxxxx 97.3 xxxxxx xxxxxxApproachLOS: * F * * ********************************************************************************Note: Queue reported is the number of cars per lane.********************************************************************************

CP(B)_PM Tue Nov 6, 2007 12:00:40 Page 8-1 ---------------------------------------------------------------------------------------------------------------------------------------------------------------- Level Of Service Computation Report 2000 HCM Operations Method (Base Volume Alternative) ********************************************************************************Intersection #6 Queen Kaahumanu Hwy / Makala Blvd ********************************************************************************Cycle (sec): 100 Critical Vol./Cap.(X): 0.799Loss Time (sec): 10 (Y+R=4.0 sec) Average Delay (sec/veh): 24.8Optimal Cycle: 71 Level Of Service: C********************************************************************************Street Name: Queen Kaahumanu Hwy Makala Blvd Approach: North Bound South Bound East Bound West Bound Movement: L - T - R L - T - R L - T - R L - T - R ------------|---------------||---------------||---------------||---------------|Control: Prot+Permit Prot+Permit Prot+Permit Prot+Permit Rights: Ovl Ovl Include Include Min. Green: 0 0 0 0 0 0 0 0 0 0 0 0 Lanes: 1 0 2 0 1 1 0 2 0 1 1 0 0 1 0 1 0 0 1 0 ------------|---------------||---------------||---------------||---------------|Volume Module:Base Vol: 14 735 80 86 1240 294 417 126 41 21 71 104 Growth Adj: 1.00 1.00 1.00 1.00 1.00 1.00 1.00 1.00 1.00 1.00 1.00 1.00 Initial Bse: 14 735 80 86 1240 294 417 126 41 21 71 104 User Adj: 1.00 1.00 1.00 1.00 1.00 1.00 1.00 1.00 1.00 1.00 1.00 1.00 PHF Adj: 0.95 0.95 0.95 0.95 0.95 0.95 0.95 0.95 0.95 0.95 0.95 0.95 PHF Volume: 15 774 84 91 1305 309 439 133 43 22 75 109 Reduct Vol: 0 0 0 0 0 0 0 0 0 0 0 0 Reduced Vol: 15 774 84 91 1305 309 439 133 43 22 75 109 PCE Adj: 1.00 1.00 1.00 1.00 1.00 1.00 1.00 1.00 1.00 1.00 1.00 1.00 MLF Adj: 1.00 1.00 1.00 1.00 1.00 1.00 1.00 1.00 1.00 1.00 1.00 1.00 FinalVolume: 15 774 84 91 1305 309 439 133 43 22 75 109 ------------|---------------||---------------||---------------||---------------|Saturation Flow Module:Sat/Lane: 1900 1900 1900 1900 1900 1900 1900 1900 1900 1900 1900 1900 Adjustment: 0.95 0.95 0.85 0.95 0.95 0.85 0.95 0.96 0.96 0.95 0.91 0.91 Lanes: 1.00 2.00 1.00 1.00 2.00 1.00 1.00 0.75 0.25 1.00 0.41 0.59 Final Sat.: 1805 3610 1615 1805 3610 1615 1805 1380 449 1805 702 1029 ------------|---------------||---------------||---------------||---------------|Capacity Analysis Module:Vol/Sat: 0.01 0.21 0.05 0.05 0.36 0.19 0.24 0.10 0.10 0.01 0.11 0.11 Crit Moves: **** **** **** **** Green/Cycle: 0.39 0.37 0.42 0.48 0.45 0.76 0.46 0.39 0.39 0.18 0.13 0.13 Volume/Cap: 0.16 0.57 0.12 0.30 0.80 0.25 0.70 0.25 0.25 0.09 0.80 0.80 Uniform Del: 21.9 24.9 17.5 15.8 23.5 3.7 19.8 20.7 20.7 33.8 42.0 42.0 IncremntDel: 0.8 0.6 0.1 0.6 2.9 0.1 3.7 0.2 0.2 0.2 17.7 17.7 InitQueuDel: 0.0 0.0 0.0 0.0 0.0 0.0 0.0 0.0 0.0 0.0 0.0 0.0 Delay Adj: 1.00 1.00 1.00 1.00 1.00 1.00 1.00 1.00 1.00 1.00 1.00 1.00 Delay/Veh: 22.7 25.5 17.6 16.3 26.4 3.8 23.5 20.9 20.9 34.0 59.7 59.7 User DelAdj: 1.00 1.00 1.00 1.00 1.00 1.00 1.00 1.00 1.00 1.00 1.00 1.00 AdjDel/Veh: 22.7 25.5 17.6 16.3 26.4 3.8 23.5 20.9 20.9 34.0 59.7 59.7 LOS by Move: C C B B C A C C C C E E HCM2kAvgQ: 0 10 2 2 20 3 12 4 4 1 8 8 ********************************************************************************Note: Queue reported is the number of cars per lane.********************************************************************************

CP(B)_PM Tue Nov 6, 2007 12:00:40 Page 9-1 ---------------------------------------------------------------------------------------------------------------------------------------------------------------- Level Of Service Computation Report 2000 HCM Unsignalized Method (Base Volume Alternative) ********************************************************************************Intersection #7 Ane Keohokahole/Main Gate ********************************************************************************Average Delay (sec/veh): 163.3 Worst Case Level Of Service: F[579.5]********************************************************************************Street Name: Ane Keohokahole Hwy Main Gate Approach: North Bound South Bound East Bound West Bound Movement: L - T - R L - T - R L - T - R L - T - R ------------|---------------||---------------||---------------||---------------|Control: Uncontrolled Uncontrolled Stop Sign Stop Sign Rights: Include Include Include Include Lanes: 0 0 1 0 1 1 0 1 0 0 0 0 0 0 0 1 0 0 0 1 ------------|---------------||---------------||---------------||---------------|Volume Module:Base Vol: 0 445 413 275 338 0 0 0 0 320 0 249 Growth Adj: 1.00 1.00 1.00 1.00 1.00 1.00 1.00 1.00 1.00 1.00 1.00 1.00 Initial Bse: 0 445 413 275 338 0 0 0 0 320 0 249 User Adj: 1.00 1.00 1.00 1.00 1.00 1.00 1.00 1.00 1.00 1.00 1.00 1.00 PHF Adj: 0.95 0.95 0.95 0.95 0.95 0.95 0.95 0.95 0.95 0.95 0.95 0.95 PHF Volume: 0 468 435 289 356 0 0 0 0 337 0 262 Reduct Vol: 0 0 0 0 0 0 0 0 0 0 0 0 FinalVolume: 0 468 435 289 356 0 0 0 0 337 0 262 ------------|---------------||---------------||---------------||---------------|Critical Gap Module:Critical Gp:xxxxx xxxx xxxxx 4.1 xxxx xxxxx xxxxx xxxx xxxxx 6.4 xxxx 6.2 FollowUpTim:xxxxx xxxx xxxxx 2.2 xxxx xxxxx xxxxx xxxx xxxxx 3.5 xxxx 3.3 ------------|---------------||---------------||---------------||---------------|Capacity Module:Cnflict Vol: xxxx xxxx xxxxx 903 xxxx xxxxx xxxx xxxx xxxxx 1403 xxxx 468 Potent Cap.: xxxx xxxx xxxxx 761 xxxx xxxxx xxxx xxxx xxxxx 156 xxxx 599 Move Cap.: xxxx xxxx xxxxx 761 xxxx xxxxx xxxx xxxx xxxxx 110 xxxx 599 Volume/Cap: xxxx xxxx xxxx 0.38 xxxx xxxx xxxx xxxx xxxx 3.08 xxxx 0.44 ------------|---------------||---------------||---------------||---------------|Level Of Service Module:2Way95thQ: xxxx xxxx xxxxx 1.8 xxxx xxxxx xxxx xxxx xxxxx 32.3 xxxx 2.2 Control Del:xxxxx xxxx xxxxx 12.6 xxxx xxxxx xxxxx xxxx xxxxx 1018 xxxx 15.6 LOS by Move: * * * B * * * * * F * C Movement: LT - LTR - RT LT - LTR - RT LT - LTR - RT LT - LTR - RT Shared Cap.: xxxx xxxx xxxxx xxxx xxxx xxxxx xxxx xxxx xxxxx xxxx xxxx xxxxx SharedQueue:xxxxx xxxx xxxxx xxxxx xxxx xxxxx xxxxx xxxx xxxxx xxxxx xxxx xxxxx Shrd ConDel:xxxxx xxxx xxxxx xxxxx xxxx xxxxx xxxxx xxxx xxxxx xxxxx xxxx xxxxx Shared LOS: * * * * * * * * * * * * ApproachDel: xxxxxx xxxxxx xxxxxx 579.5ApproachLOS: * * * F ********************************************************************************Note: Queue reported is the number of cars per lane.********************************************************************************

CP(B)_PM Tue Nov 6, 2007 12:00:40 Page 10-1 ---------------------------------------------------------------------------------------------------------------------------------------------------------------- Level Of Service Computation Report 2000 HCM Operations Method (Base Volume Alternative) ********************************************************************************Intersection #8 Palihiolo St/Palani Rd ********************************************************************************Cycle (sec): 100 Critical Vol./Cap.(X): 1.905Loss Time (sec): 10 (Y+R=4.0 sec) Average Delay (sec/veh): 213.3Optimal Cycle: 180 Level Of Service: F********************************************************************************Street Name: Palihiolo St Palani Rd Approach: North Bound South Bound East Bound West Bound Movement: L - T - R L - T - R L - T - R L - T - R ------------|---------------||---------------||---------------||---------------|Control: Permitted Permitted Prot+Permit Permitted Rights: Include Include Include Ignore Min. Green: 0 0 0 0 0 0 0 0 0 0 0 0 Lanes: 0 1 0 0 1 1 0 0 1 0 1 0 0 1 0 1 0 1 0 1 ------------|---------------||---------------||---------------||---------------|Volume Module:Base Vol: 4 19 26 2 4 611 506 752 13 49 1357 23 Growth Adj: 1.00 1.00 1.00 1.00 1.00 1.00 1.00 1.00 1.00 1.00 1.00 1.00 Initial Bse: 4 19 26 2 4 611 506 752 13 49 1357 23 User Adj: 1.00 1.00 1.00 1.00 1.00 1.00 1.00 1.00 1.00 1.00 1.00 0.00 PHF Adj: 0.95 0.95 0.95 0.95 0.95 0.95 0.95 0.95 0.95 0.95 0.95 0.00 PHF Volume: 4 20 27 2 4 643 533 792 14 52 1428 0 Reduct Vol: 0 0 0 0 0 0 0 0 0 0 0 0 Reduced Vol: 4 20 27 2 4 643 533 792 14 52 1428 0 PCE Adj: 1.00 1.00 1.00 1.00 1.00 1.00 1.00 1.00 1.00 1.00 1.00 0.00 MLF Adj: 1.00 1.00 1.00 1.00 1.00 1.00 1.00 1.00 1.00 1.00 1.00 0.00 FinalVolume: 4 20 27 2 4 643 533 792 14 52 1428 0 ------------|---------------||---------------||---------------||---------------|Saturation Flow Module:Sat/Lane: 1900 1900 1900 1900 1900 1900 1900 1900 1900 1900 1900 1900 Adjustment: 0.67 0.67 0.85 0.75 0.85 0.85 0.21 1.00 1.00 0.95 1.00 1.00 Lanes: 0.17 0.83 1.00 1.00 0.01 0.99 1.00 0.98 0.02 1.00 1.00 1.00 Final Sat.: 222 1053 1615 1423 11 1606 405 1862 32 1805 1900 1900 ------------|---------------||---------------||---------------||---------------|Capacity Analysis Module:Vol/Sat: 0.02 0.02 0.02 0.00 0.40 0.40 1.31 0.43 0.43 0.03 0.75 0.00 Crit Moves: **** **** Green/Cycle: 0.25 0.25 0.25 0.25 0.25 0.25 0.61 0.61 0.61 0.04 0.47 0.00 Volume/Cap: 0.08 0.08 0.07 0.01 1.61 1.61 1.31 0.70 0.70 0.70 1.61 0.00 Uniform Del: 28.7 28.7 28.7 28.2 37.6 37.6 9.8 13.2 13.2 47.3 26.6 0.0 IncremntDel: 0.1 0.1 0.1 0.0 285 285.0 155.3 1.9 1.9 25.2 279 0.0 InitQueuDel: 0.0 0.0 0.0 0.0 0.0 0.0 0.0 0.0 0.0 0.0 0.0 0.0 Delay Adj: 1.00 1.00 1.00 1.00 1.00 1.00 1.00 1.00 1.00 1.00 1.00 0.00 Delay/Veh: 28.9 28.9 28.8 28.3 323 322.5 165.1 15.1 15.1 72.6 306 0.0 User DelAdj: 1.00 1.00 1.00 1.00 1.00 1.00 1.00 1.00 1.00 1.00 1.00 1.00 AdjDel/Veh: 28.9 28.9 28.8 28.3 323 322.5 165.1 15.1 15.1 72.6 306 0.0 LOS by Move: C C C C F F F B B E F A HCM2kAvgQ: 1 1 1 0 51 51 34 17 17 3 110 0 ********************************************************************************Note: Queue reported is the number of cars per lane.********************************************************************************

CP(B)_PM Tue Nov 6, 2007 12:00:40 Page 11-1 ---------------------------------------------------------------------------------------------------------------------------------------------------------------- Level Of Service Computation Report 2000 HCM Unsignalized Method (Base Volume Alternative) ********************************************************************************Intersection #10 Palani Rd / Uluaoa St ********************************************************************************Average Delay (sec/veh): 11.7 Worst Case Level Of Service: F[237.4]********************************************************************************Street Name: Palani Rd Uluaoa St Approach: North Bound South Bound East Bound West Bound Movement: L - T - R L - T - R L - T - R L - T - R ------------|---------------||---------------||---------------||---------------|Control: Uncontrolled Uncontrolled Stop Sign Stop Sign Rights: Include Include Include Include Lanes: 0 1 0 0 0 0 0 0 1 0 1 0 0 0 1 0 0 0 0 0 ------------|---------------||---------------||---------------||---------------|Volume Module:Base Vol: 29 761 0 0 1056 177 71 0 32 0 0 0 Growth Adj: 1.00 1.00 1.00 1.00 1.00 1.00 1.00 1.00 1.00 1.00 1.00 1.00 Initial Bse: 29 761 0 0 1056 177 71 0 32 0 0 0 User Adj: 1.00 1.00 1.00 1.00 1.00 1.00 1.00 1.00 1.00 1.00 1.00 1.00 PHF Adj: 0.95 0.95 0.95 0.95 0.95 0.95 0.95 0.95 0.95 0.95 0.95 0.95 PHF Volume: 31 801 0 0 1112 186 75 0 34 0 0 0 Reduct Vol: 0 0 0 0 0 0 0 0 0 0 0 0 FinalVolume: 31 801 0 0 1112 186 75 0 34 0 0 0 ------------|---------------||---------------||---------------||---------------|Critical Gap Module:Critical Gp: 4.1 xxxx xxxxx xxxxx xxxx xxxxx 6.4 xxxx 6.2 xxxxx xxxx xxxxx FollowUpTim: 2.2 xxxx xxxxx xxxxx xxxx xxxxx 3.5 xxxx 3.3 xxxxx xxxx xxxxx ------------|---------------||---------------||---------------||---------------|Capacity Module:Cnflict Vol: 1298 xxxx xxxxx xxxx xxxx xxxxx 2067 xxxx 1205 xxxx xxxx xxxxx Potent Cap.: 541 xxxx xxxxx xxxx xxxx xxxxx 61 xxxx 226 xxxx xxxx xxxxx Move Cap.: 541 xxxx xxxxx xxxx xxxx xxxxx 58 xxxx 226 xxxx xxxx xxxxx Volume/Cap: 0.06 xxxx xxxx xxxx xxxx xxxx 1.29 xxxx 0.15 xxxx xxxx xxxx ------------|---------------||---------------||---------------||---------------|Level Of Service Module:2Way95thQ: 0.2 xxxx xxxxx xxxx xxxx xxxxx 6.5 xxxx 0.5 xxxx xxxx xxxxx Control Del: 12.1 xxxx xxxxx xxxxx xxxx xxxxx 333.8 xxxx 23.7 xxxxx xxxx xxxxx LOS by Move: B * * * * * F * C * * * Movement: LT - LTR - RT LT - LTR - RT LT - LTR - RT LT - LTR - RT Shared Cap.: xxxx xxxx xxxxx xxxx xxxx xxxxx xxxx xxxx xxxxx xxxx xxxx xxxxx SharedQueue: 0.2 xxxx xxxxx xxxxx xxxx xxxxx xxxxx xxxx xxxxx xxxxx xxxx xxxxx Shrd ConDel: 12.1 xxxx xxxxx xxxxx xxxx xxxxx xxxxx xxxx xxxxx xxxxx xxxx xxxxx Shared LOS: B * * * * * * * * * * * ApproachDel: xxxxxx xxxxxx 237.4 xxxxxxApproachLOS: * * F * ********************************************************************************Note: Queue reported is the number of cars per lane.********************************************************************************

CP(B)_PM Tue Nov 6, 2007 12:00:40 Page 12-1 ---------------------------------------------------------------------------------------------------------------------------------------------------------------- Level Of Service Computation Report 2000 HCM Operations Method (Base Volume Alternative) ********************************************************************************Intersection #11 Queen Kaahumanu Hwy / Kealakehe Pkwy ********************************************************************************Cycle (sec): 100 Critical Vol./Cap.(X): 0.826Loss Time (sec): 10 (Y+R=4.0 sec) Average Delay (sec/veh): 26.1Optimal Cycle: 78 Level Of Service: C********************************************************************************Street Name: Queen Kaahumanu Hwy Kaalakehe Pkwy Approach: North Bound South Bound East Bound West Bound Movement: L - T - R L - T - R L - T - R L - T - R ------------|---------------||---------------||---------------||---------------|Control: Prot+Permit Prot+Permit Permitted Permitted Rights: Ovl Ovl Ovl Ovl Min. Green: 0 0 0 0 0 0 0 0 0 0 0 0 Lanes: 1 0 2 0 1 1 0 2 0 1 0 1 0 0 1 0 1 0 0 1 ------------|---------------||---------------||---------------||---------------|Volume Module:Base Vol: 66 1097 239 193 1066 232 106 97 67 242 66 167 Growth Adj: 1.00 1.00 1.00 1.00 1.00 1.00 1.00 1.00 1.00 1.00 1.00 1.00 Initial Bse: 66 1097 239 193 1066 232 106 97 67 242 66 167 User Adj: 1.00 1.00 1.00 1.00 1.00 1.00 1.00 1.00 1.00 1.00 1.00 1.00 PHF Adj: 0.95 0.95 0.95 0.95 0.95 0.95 0.95 0.95 0.95 0.95 0.95 0.95 PHF Volume: 69 1155 252 203 1122 244 112 102 71 255 69 176 Reduct Vol: 0 0 0 0 0 0 0 0 0 0 0 0 Reduced Vol: 69 1155 252 203 1122 244 112 102 71 255 69 176 PCE Adj: 1.00 1.00 1.00 1.00 1.00 1.00 1.00 1.00 1.00 1.00 1.00 1.00 MLF Adj: 1.00 1.00 1.00 1.00 1.00 1.00 1.00 1.00 1.00 1.00 1.00 1.00 FinalVolume: 69 1155 252 203 1122 244 112 102 71 255 69 176 ------------|---------------||---------------||---------------||---------------|Saturation Flow Module:Sat/Lane: 1900 1900 1900 1900 1900 1900 1900 1900 1900 1900 1900 1900 Adjustment: 0.95 0.95 0.85 0.95 0.95 0.85 0.53 0.53 0.85 0.55 0.55 0.85 Lanes: 1.00 2.00 1.00 1.00 2.00 1.00 0.52 0.48 1.00 0.79 0.21 1.00 Final Sat.: 1805 3610 1615 1805 3610 1615 528 483 1615 820 224 1615 ------------|---------------||---------------||---------------||---------------|Capacity Analysis Module:Vol/Sat: 0.04 0.32 0.16 0.11 0.31 0.15 0.21 0.21 0.04 0.31 0.31 0.11 Crit Moves: **** **** **** Green/Cycle: 0.45 0.39 0.39 0.55 0.47 0.47 0.38 0.38 0.43 0.38 0.38 0.51 Volume/Cap: 0.32 0.83 0.40 0.63 0.67 0.32 0.56 0.56 0.10 0.83 0.83 0.21 Uniform Del: 17.3 27.6 22.2 20.2 20.7 16.8 24.7 24.7 16.7 28.2 28.2 13.3 IncremntDel: 0.8 4.2 0.4 4.1 1.0 0.3 1.9 1.9 0.1 13.4 13.4 0.1 InitQueuDel: 0.0 0.0 0.0 0.0 0.0 0.0 0.0 0.0 0.0 0.0 0.0 0.0 Delay Adj: 1.00 1.00 1.00 1.00 1.00 1.00 1.00 1.00 1.00 1.00 1.00 1.00 Delay/Veh: 18.1 31.8 22.7 24.3 21.7 17.1 26.6 26.6 16.8 41.6 41.6 13.5 User DelAdj: 1.00 1.00 1.00 1.00 1.00 1.00 1.00 1.00 1.00 1.00 1.00 1.00 AdjDel/Veh: 18.1 31.8 22.7 24.3 21.7 17.1 26.6 26.6 16.8 41.6 41.6 13.5 LOS by Move: B C C C C B C C B D D B HCM2kAvgQ: 2 19 6 5 15 5 6 6 1 12 12 3 ********************************************************************************Note: Queue reported is the number of cars per lane.********************************************************************************

CP(B)_PM Tue Nov 6, 2007 12:00:40 Page 13-1 ---------------------------------------------------------------------------------------------------------------------------------------------------------------- Level Of Service Computation Report 2000 HCM Unsignalized Method (Base Volume Alternative) ********************************************************************************Intersection #12 Ane Keohokalole Hwy / Kealakehe Pkwy ********************************************************************************Average Delay (sec/veh): OVERFLOW Worst Case Level Of Service: F[xxxxx]********************************************************************************Street Name: Ane Keohokalole Hwy Kealakehe Pkwy Approach: North Bound South Bound East Bound West Bound Movement: L - T - R L - T - R L - T - R L - T - R ------------|---------------||---------------||---------------||---------------|Control: Stop Sign Stop Sign Uncontrolled UncontrolledRights: Include Include Include Include Lanes: 1 0 1 0 1 1 0 0 1 0 1 0 1 1 0 1 0 1 0 1 ------------|---------------||---------------||---------------||---------------|Volume Module:Base Vol: 220 395 0 50 349 369 165 194 260 5 128 23 Growth Adj: 1.00 1.00 1.00 1.00 1.00 1.00 1.00 1.00 1.00 1.00 1.00 1.00 Initial Bse: 220 395 0 50 349 369 165 194 260 5 128 23 User Adj: 1.00 1.00 1.00 1.00 1.00 1.00 1.00 1.00 1.00 1.00 1.00 1.00 PHF Adj: 0.95 0.95 0.95 0.95 0.95 0.95 0.95 0.95 0.95 0.95 0.95 0.95 PHF Volume: 232 416 0 53 367 388 174 204 274 5 135 24 Reduct Vol: 0 0 0 0 0 0 0 0 0 0 0 0 FinalVolume: 232 416 0 53 367 388 174 204 274 5 135 24 ------------|---------------||---------------||---------------||---------------|Critical Gap Module:Critical Gp: 7.1 6.5 6.2 7.1 6.5 6.2 4.1 xxxx xxxxx 4.1 xxxx xxxxx FollowUpTim: 3.5 4.0 3.3 3.5 4.0 3.3 2.2 xxxx xxxxx 2.2 xxxx xxxxx ------------|---------------||---------------||---------------||---------------|Capacity Module:Cnflict Vol: 1224 858 239 803 971 135 159 xxxx xxxxx 478 xxxx xxxxx Potent Cap.: 157 297 805 304 255 920 1433 xxxx xxxxx 1095 xxxx xxxxx Move Cap.: 0 259 805 0 223 920 1433 xxxx xxxxx 1095 xxxx xxxxx Volume/Cap: xxxx 1.60 0.00 xxxx 1.65 0.42 0.12 xxxx xxxx 0.00 xxxx xxxx ------------|---------------||---------------||---------------||---------------|Level Of Service Module:2Way95thQ: xxxx 25.6 xxxxx xxxx xxxx xxxxx 0.4 xxxx xxxxx 0.0 xxxx xxxxx Control Del:xxxxx 323 xxxxx xxxxx xxxx xxxxx 7.9 xxxx xxxxx 8.3 xxxx xxxxx LOS by Move: * F * * * * A * * A * * Movement: LT - LTR - RT LT - LTR - RT LT - LTR - RT LT - LTR - RT Shared Cap.: xxxx xxxx xxxxx xxxx xxxx 365 xxxx xxxx xxxxx xxxx xxxx xxxxx SharedQueue:xxxxx xxxx xxxxx xxxxx xxxx 54.1 xxxxx xxxx xxxxx xxxxx xxxx xxxxx Shrd ConDel:xxxxx xxxx xxxxx xxxxx xxxx 514.6 xxxxx xxxx xxxxx xxxxx xxxx xxxxx Shared LOS: * * * * * F * * * * * * ApproachDel: xxxxxx xxxxxx xxxxxx xxxxxxApproachLOS: F F * * ********************************************************************************Note: Queue reported is the number of cars per lane.********************************************************************************

CUMULATIVE PLUS PROJECT CONDITIONS – CONCEPT C

CP(C)_AM Tue Nov 6, 2007 12:05:13 Page 3-1 ---------------------------------------------------------------------------------------------------------------------------------------------------------------- Level Of Service Computation Report 2000 HCM Operations Method (Base Volume Alternative) ********************************************************************************Intersection #1 Queen Kaahumanu Hwy / Henry St ********************************************************************************Cycle (sec): 100 Critical Vol./Cap.(X): 0.887Loss Time (sec): 10 (Y+R=4.0 sec) Average Delay (sec/veh): 29.3Optimal Cycle: 99 Level Of Service: C********************************************************************************Street Name: Queen Kaahumanu Hwy Henry St Approach: North Bound South Bound East Bound West Bound Movement: L - T - R L - T - R L - T - R L - T - R ------------|---------------||---------------||---------------||---------------|Control: Prot+Permit Prot+Permit Prot+Permit Prot+Permit Rights: Ovl Ovl Ovl Ovl Min. Green: 0 0 0 0 0 0 0 0 0 0 0 0 Lanes: 1 0 2 0 1 1 0 3 0 1 1 0 2 0 1 1 1 1 0 1 ------------|---------------||---------------||---------------||---------------|Volume Module:Base Vol: 320 801 923 130 584 132 76 415 25 642 716 99 Growth Adj: 1.00 1.00 1.00 1.00 1.00 1.00 1.00 1.00 1.00 1.00 1.00 1.00 Initial Bse: 320 801 923 130 584 132 76 415 25 642 716 99 User Adj: 1.00 1.00 1.00 1.00 1.00 1.00 1.00 1.00 1.00 1.00 1.00 1.00 PHF Adj: 0.95 0.95 0.95 0.95 0.95 0.95 0.95 0.95 0.95 0.95 0.95 0.95 PHF Volume: 337 843 972 137 615 139 80 437 26 676 754 104 Reduct Vol: 0 0 0 0 0 0 0 0 0 0 0 0 Reduced Vol: 337 843 972 137 615 139 80 437 26 676 754 104 PCE Adj: 1.00 1.00 1.00 1.00 1.00 1.00 1.00 1.00 1.00 1.00 1.00 1.00 MLF Adj: 1.00 1.00 1.00 1.00 1.00 1.00 1.00 1.00 1.00 1.00 1.00 1.00 FinalVolume: 337 843 972 137 615 139 80 437 26 676 754 104 ------------|---------------||---------------||---------------||---------------|Saturation Flow Module:Sat/Lane: 1900 1900 1900 1900 1900 1900 1900 1900 1900 1900 1900 1900 Adjustment: 0.95 0.95 0.85 0.95 0.91 0.85 0.95 0.95 0.85 0.93 0.93 0.85 Lanes: 1.00 2.00 1.00 1.00 3.00 1.00 1.00 2.00 1.00 1.42 1.58 1.00 Final Sat.: 1805 3610 1615 1805 5187 1615 1805 3610 1615 2501 2789 1615 ------------|---------------||---------------||---------------||---------------|Capacity Analysis Module:Vol/Sat: 0.19 0.23 0.60 0.08 0.12 0.09 0.04 0.12 0.02 0.27 0.27 0.06 Crit Moves: **** **** **** **** Green/Cycle: 0.48 0.37 0.68 0.26 0.18 0.24 0.20 0.14 0.42 0.46 0.38 0.46 Volume/Cap: 0.58 0.63 0.89 0.52 0.66 0.36 0.39 0.89 0.04 0.70 0.71 0.14 Uniform Del: 17.4 25.6 13.0 29.3 38.3 31.6 33.6 42.4 17.3 20.4 26.4 15.3 IncremntDel: 1.5 0.9 9.0 1.9 1.8 0.6 1.2 17.5 0.0 1.1 1.2 0.1 InitQueuDel: 0.0 0.0 0.0 0.0 0.0 0.0 0.0 0.0 0.0 0.0 0.0 0.0 Delay Adj: 1.00 1.00 1.00 1.00 1.00 1.00 1.00 1.00 1.00 1.00 1.00 1.00 Delay/Veh: 18.9 26.5 22.0 31.2 40.1 32.1 34.8 59.9 17.3 21.5 27.7 15.4 User DelAdj: 1.00 1.00 1.00 1.00 1.00 1.00 1.00 1.00 1.00 1.00 1.00 1.00 AdjDel/Veh: 18.9 26.5 22.0 31.2 40.1 32.1 34.8 59.9 17.3 21.5 27.7 15.4 LOS by Move: B C C C D C C E B C C B HCM2kAvgQ: 8 12 28 4 8 4 3 10 0 13 14 2 ********************************************************************************Note: Queue reported is the number of cars per lane.********************************************************************************

CP(C)_AM Tue Nov 6, 2007 12:05:13 Page 4-1 ---------------------------------------------------------------------------------------------------------------------------------------------------------------- Level Of Service Computation Report 2000 HCM Operations Method (Base Volume Alternative) ********************************************************************************Intersection #2 Queen Kaahumanu Hwy / Alli Dr ********************************************************************************Cycle (sec): 100 Critical Vol./Cap.(X): 0.915Loss Time (sec): 10 (Y+R=4.0 sec) Average Delay (sec/veh): 35.0Optimal Cycle: 114 Level Of Service: D********************************************************************************Street Name: Queen Kaahumanu Hwy Alli Dr Approach: North Bound South Bound East Bound West Bound Movement: L - T - R L - T - R L - T - R L - T - R ------------|---------------||---------------||---------------||---------------|Control: Prot+Permit Prot+Permit Prot+Permit Prot+Permit Rights: Ovl Ovl Ovl Ovl Min. Green: 0 0 0 0 0 0 0 0 0 0 0 0 Lanes: 1 0 2 0 1 1 0 2 0 1 1 0 1 0 1 1 0 1 0 1 ------------|---------------||---------------||---------------||---------------|Volume Module:Base Vol: 97 807 72 191 655 372 193 144 99 107 658 98 Growth Adj: 1.00 1.00 1.00 1.00 1.00 1.00 1.00 1.00 1.00 1.00 1.00 1.00 Initial Bse: 97 807 72 191 655 372 193 144 99 107 658 98 User Adj: 1.00 1.00 1.00 1.00 1.00 1.00 1.00 1.00 1.00 1.00 1.00 1.00 PHF Adj: 0.95 0.95 0.95 0.95 0.95 0.95 0.95 0.95 0.95 0.95 0.95 0.95 PHF Volume: 102 849 76 201 689 392 203 152 104 113 693 103 Reduct Vol: 0 0 0 0 0 0 0 0 0 0 0 0 Reduced Vol: 102 849 76 201 689 392 203 152 104 113 693 103 PCE Adj: 1.00 1.00 1.00 1.00 1.00 1.00 1.00 1.00 1.00 1.00 1.00 1.00 MLF Adj: 1.00 1.00 1.00 1.00 1.00 1.00 1.00 1.00 1.00 1.00 1.00 1.00 FinalVolume: 102 849 76 201 689 392 203 152 104 113 693 103 ------------|---------------||---------------||---------------||---------------|Saturation Flow Module:Sat/Lane: 1900 1900 1900 1900 1900 1900 1900 1900 1900 1900 1900 1900 Adjustment: 0.95 0.95 0.85 0.95 0.95 0.85 0.95 1.00 0.85 0.95 1.00 0.85 Lanes: 1.00 2.00 1.00 1.00 2.00 1.00 1.00 1.00 1.00 1.00 1.00 1.00 Final Sat.: 1805 3610 1615 1805 3610 1615 1805 1900 1615 1805 1900 1615 ------------|---------------||---------------||---------------||---------------|Capacity Analysis Module:Vol/Sat: 0.06 0.24 0.05 0.11 0.19 0.24 0.11 0.08 0.06 0.06 0.36 0.06 Crit Moves: **** **** **** **** Green/Cycle: 0.34 0.26 0.49 0.40 0.29 0.42 0.42 0.29 0.38 0.54 0.40 0.52 Volume/Cap: 0.40 0.92 0.10 0.68 0.65 0.58 0.68 0.27 0.17 0.16 0.92 0.12 Uniform Del: 23.6 36.1 13.9 23.3 31.0 22.6 22.7 27.2 20.6 11.2 28.5 12.3 IncremntDel: 1.0 13.4 0.1 6.5 1.5 1.3 6.3 0.3 0.1 0.1 15.7 0.1 InitQueuDel: 0.0 0.0 0.0 0.0 0.0 0.0 0.0 0.0 0.0 0.0 0.0 0.0 Delay Adj: 1.00 1.00 1.00 1.00 1.00 1.00 1.00 1.00 1.00 1.00 1.00 1.00 Delay/Veh: 24.7 49.5 13.9 29.8 32.4 23.9 29.0 27.5 20.7 11.3 44.2 12.4 User DelAdj: 1.00 1.00 1.00 1.00 1.00 1.00 1.00 1.00 1.00 1.00 1.00 1.00 AdjDel/Veh: 24.7 49.5 13.9 29.8 32.4 23.9 29.0 27.5 20.7 11.3 44.2 12.4 LOS by Move: C D B C C C C C C B D B HCM2kAvgQ: 3 17 1 6 11 10 6 4 2 2 24 2 ********************************************************************************Note: Queue reported is the number of cars per lane.********************************************************************************

CP(C)_AM Tue Nov 6, 2007 12:05:13 Page 5-1 ---------------------------------------------------------------------------------------------------------------------------------------------------------------- Level Of Service Computation Report 2000 HCM Unsignalized Method (Base Volume Alternative) ********************************************************************************Intersection #3 Kamakaeha Ave / Palani Rd ********************************************************************************Average Delay (sec/veh): 1.4 Worst Case Level Of Service: D[ 31.7]********************************************************************************Street Name: Kamakaeha Ave Palani Rd Approach: North Bound South Bound East Bound West Bound Movement: L - T - R L - T - R L - T - R L - T - R ------------|---------------||---------------||---------------||---------------|Control: Stop Sign Stop Sign Uncontrolled UncontrolledRights: Include Include Include Ignore Lanes: 0 0 0 0 0 1 0 0 0 1 0 0 1 0 0 0 0 1 0 1 ------------|---------------||---------------||---------------||---------------|Volume Module:Base Vol: 0 0 0 47 0 15 0 406 0 0 896 240 Growth Adj: 1.00 1.00 1.00 1.00 1.00 1.00 1.00 1.00 1.00 1.00 1.00 1.00 Initial Bse: 0 0 0 47 0 15 0 406 0 0 896 240 User Adj: 1.00 1.00 1.00 1.00 1.00 1.00 1.00 1.00 1.00 1.00 1.00 0.00 PHF Adj: 0.95 0.95 0.95 0.95 0.95 0.95 0.95 0.95 0.95 0.95 0.95 0.00 PHF Volume: 0 0 0 49 0 16 0 427 0 0 943 0 Reduct Vol: 0 0 0 0 0 0 0 0 0 0 0 0 FinalVolume: 0 0 0 49 0 16 0 427 0 0 943 0 ------------|---------------||---------------||---------------||---------------|Critical Gap Module:Critical Gp:xxxxx xxxx xxxxx 6.4 xxxx 6.2 xxxxx xxxx xxxxx xxxxx xxxx xxxxx FollowUpTim:xxxxx xxxx xxxxx 3.5 xxxx 3.3 xxxxx xxxx xxxxx xxxxx xxxx xxxxx ------------|---------------||---------------||---------------||---------------|Capacity Module:Cnflict Vol: xxxx xxxx xxxxx 1371 xxxx 943 xxxx xxxx xxxxx xxxx xxxx xxxxx Potent Cap.: xxxx xxxx xxxxx 163 xxxx 321 xxxx xxxx xxxxx xxxx xxxx xxxxx Move Cap.: xxxx xxxx xxxxx 163 xxxx 321 xxxx xxxx xxxxx xxxx xxxx xxxxx Volume/Cap: xxxx xxxx xxxx 0.30 xxxx 0.05 xxxx xxxx xxxx xxxx xxxx xxxx ------------|---------------||---------------||---------------||---------------|Level Of Service Module:2Way95thQ: xxxx xxxx xxxxx 1.2 xxxx 0.2 xxxx xxxx xxxxx xxxx xxxx xxxxx Control Del:xxxxx xxxx xxxxx 36.5 xxxx 16.8 xxxxx xxxx xxxxx xxxxx xxxx xxxxx LOS by Move: * * * E * C * * * * * * Movement: LT - LTR - RT LT - LTR - RT LT - LTR - RT LT - LTR - RT Shared Cap.: xxxx xxxx xxxxx xxxx xxxx xxxxx xxxx xxxx xxxxx xxxx xxxx xxxxx SharedQueue:xxxxx xxxx xxxxx xxxxx xxxx xxxxx xxxxx xxxx xxxxx xxxxx xxxx xxxxx Shrd ConDel:xxxxx xxxx xxxxx xxxxx xxxx xxxxx xxxxx xxxx xxxxx xxxxx xxxx xxxxx Shared LOS: * * * * * * * * * * * * ApproachDel: xxxxxx 31.7 xxxxxx xxxxxxApproachLOS: * D * * ********************************************************************************Note: Queue reported is the number of cars per lane.********************************************************************************

CP(C)_AM Tue Nov 6, 2007 12:05:13 Page 6-1 ---------------------------------------------------------------------------------------------------------------------------------------------------------------- Level Of Service Computation Report 2000 HCM Operations Method (Base Volume Alternative) ********************************************************************************Intersection #4 Henry St / Palani Rd ********************************************************************************Cycle (sec): 100 Critical Vol./Cap.(X): 1.726Loss Time (sec): 10 (Y+R=4.0 sec) Average Delay (sec/veh): 236.5Optimal Cycle: 180 Level Of Service: F********************************************************************************Street Name: Henry St Palani Rd Approach: North Bound South Bound East Bound West Bound Movement: L - T - R L - T - R L - T - R L - T - R ------------|---------------||---------------||---------------||---------------|Control: Permitted Permitted Permitted Prot+Permit Rights: Ovl Include Include Include Min. Green: 0 0 0 0 0 0 0 0 0 0 0 0 Lanes: 1 0 0 1 0 1 0 0 1 0 1 0 0 1 0 1 0 0 1 0 ------------|---------------||---------------||---------------||---------------|Volume Module:Base Vol: 122 408 454 124 577 338 239 185 37 947 810 90 Growth Adj: 1.00 1.00 1.00 1.00 1.00 1.00 1.00 1.00 1.00 1.00 1.00 1.00 Initial Bse: 122 408 454 124 577 338 239 185 37 947 810 90 User Adj: 1.00 1.00 1.00 1.00 1.00 1.00 1.00 1.00 1.00 1.00 1.00 1.00 PHF Adj: 0.95 0.95 0.95 0.95 0.95 0.95 0.95 0.95 0.95 0.95 0.95 0.95 PHF Volume: 128 429 478 131 607 356 252 195 39 997 853 95 Reduct Vol: 0 0 0 0 0 0 0 0 0 0 0 0 Reduced Vol: 128 429 478 131 607 356 252 195 39 997 853 95 PCE Adj: 1.00 1.00 1.00 1.00 1.00 1.00 1.00 1.00 1.00 1.00 1.00 1.00 MLF Adj: 1.00 1.00 1.00 1.00 1.00 1.00 1.00 1.00 1.00 1.00 1.00 1.00 FinalVolume: 128 429 478 131 607 356 252 195 39 997 853 95 ------------|---------------||---------------||---------------||---------------|Saturation Flow Module:Sat/Lane: 1900 1900 1900 1900 1900 1900 1900 1900 1900 1900 1900 1900 Adjustment: 0.08 0.92 0.92 0.08 0.95 0.95 0.95 0.98 0.98 0.77 0.99 0.99 Lanes: 1.00 0.47 0.53 1.00 0.63 0.37 1.00 0.83 0.17 1.00 0.90 0.10 Final Sat.: 150 828 922 150 1132 663 1805 1544 309 1458 1684 187 ------------|---------------||---------------||---------------||---------------|Capacity Analysis Module:Vol/Sat: 0.86 0.52 0.52 0.87 0.54 0.54 0.14 0.13 0.13 0.68 0.51 0.51 Crit Moves: **** **** Green/Cycle: 0.51 0.51 0.83 0.51 0.51 0.51 0.09 0.07 0.07 0.31 0.31 0.31 Volume/Cap: 1.69 1.03 0.63 1.72 1.06 1.06 1.64 1.72 1.72 1.76 1.64 1.64 Uniform Del: 24.7 24.7 3.1 24.7 24.7 24.7 45.7 46.3 46.3 34.8 34.5 34.5 IncremntDel:361.5 36.9 0.9 373.2 47.4 47.4 314.0 353 353.0 349.8 294 294.3 InitQueuDel: 0.0 0.0 0.0 0.0 0.0 0.0 0.0 0.0 0.0 0.0 0.0 0.0 Delay Adj: 1.00 1.00 1.00 1.00 1.00 1.00 1.00 1.00 1.00 1.00 1.00 1.00 Delay/Veh: 386.2 61.7 4.0 397.9 72.1 72.1 359.8 399 399.4 384.6 329 328.9 User DelAdj: 1.00 1.00 1.00 1.00 1.00 1.00 1.00 1.00 1.00 1.00 1.00 1.00 AdjDel/Veh: 386.2 61.7 4.0 397.9 72.1 72.1 359.8 399 399.4 384.6 329 328.9 LOS by Move: F E A F E E F F F F F F HCM2kAvgQ: 12 37 11 12 42 42 21 21 21 84 75 75 ********************************************************************************Note: Queue reported is the number of cars per lane.********************************************************************************

CP(C)_AM Tue Nov 6, 2007 12:05:13 Page 7-1 ---------------------------------------------------------------------------------------------------------------------------------------------------------------- Level Of Service Computation Report 2000 HCM Unsignalized Method (Base Volume Alternative) ********************************************************************************Intersection #5 Gate 2/Palani ********************************************************************************Average Delay (sec/veh): 1.7 Worst Case Level Of Service: F[100.7]********************************************************************************Street Name: Gate 2 /Palani Rd Approach: North Bound South Bound East Bound West Bound Movement: L - T - R L - T - R L - T - R L - T - R ------------|---------------||---------------||---------------||---------------|Control: Stop Sign Yield Sign Uncontrolled UncontrolledRights: Include Include Include Include Lanes: 0 0 0 0 0 0 0 0 0 1 0 0 1 0 0 0 0 0 1 0 ------------|---------------||---------------||---------------||---------------|Volume Module:Base Vol: 0 0 0 0 0 47 0 763 0 0 1800 97 Growth Adj: 1.00 1.00 1.00 1.00 1.00 1.00 1.00 1.00 1.00 1.00 1.00 1.00 Initial Bse: 0 0 0 0 0 47 0 763 0 0 1800 97 User Adj: 1.00 1.00 1.00 1.00 1.00 1.00 1.00 1.00 1.00 1.00 1.00 1.00 PHF Adj: 0.95 0.95 0.95 0.95 0.95 0.95 0.95 0.95 0.95 0.95 0.95 0.95 PHF Volume: 0 0 0 0 0 49 0 803 0 0 1895 102 Reduct Vol: 0 0 0 0 0 0 0 0 0 0 0 0 FinalVolume: 0 0 0 0 0 49 0 803 0 0 1895 102 ------------|---------------||---------------||---------------||---------------|Critical Gap Module:Critical Gp:xxxxx xxxx xxxxx xxxxx xxxx 6.2 xxxxx xxxx xxxxx xxxxx xxxx xxxxx FollowUpTim:xxxxx xxxx xxxxx xxxxx xxxx 3.3 xxxxx xxxx xxxxx xxxxx xxxx xxxxx ------------|---------------||---------------||---------------||---------------|Capacity Module:Cnflict Vol: xxxx xxxx xxxxx xxxx xxxx 1946 xxxx xxxx xxxxx xxxx xxxx xxxxx Potent Cap.: xxxx xxxx xxxxx xxxx xxxx 82 xxxx xxxx xxxxx xxxx xxxx xxxxx Move Cap.: xxxx xxxx xxxxx xxxx xxxx 82 xxxx xxxx xxxxx xxxx xxxx xxxxx Volume/Cap: xxxx xxxx xxxx xxxx xxxx 0.60 xxxx xxxx xxxx xxxx xxxx xxxx ------------|---------------||---------------||---------------||---------------|Level Of Service Module:2Way95thQ: xxxx xxxx xxxxx xxxx xxxx 2.7 xxxx xxxx xxxxx xxxx xxxx xxxxx Control Del:xxxxx xxxx xxxxx xxxxx xxxx 100.7 xxxxx xxxx xxxxx xxxxx xxxx xxxxx LOS by Move: * * * * * F * * * * * * Movement: LT - LTR - RT LT - LTR - RT LT - LTR - RT LT - LTR - RT Shared Cap.: xxxx xxxx xxxxx xxxx xxxx xxxxx xxxx xxxx xxxxx xxxx xxxx xxxxx SharedQueue:xxxxx xxxx xxxxx xxxxx xxxx xxxxx xxxxx xxxx xxxxx xxxxx xxxx xxxxx Shrd ConDel:xxxxx xxxx xxxxx xxxxx xxxx xxxxx xxxxx xxxx xxxxx xxxxx xxxx xxxxx Shared LOS: * * * * * * * * * * * * ApproachDel: xxxxxx 100.7 xxxxxx xxxxxxApproachLOS: * F * * ********************************************************************************Note: Queue reported is the number of cars per lane.********************************************************************************

CP(C)_AM Tue Nov 6, 2007 12:05:13 Page 8-1 ---------------------------------------------------------------------------------------------------------------------------------------------------------------- Level Of Service Computation Report 2000 HCM Operations Method (Base Volume Alternative) ********************************************************************************Intersection #6 Queen Kaahumanu Hwy / Makala Blvd ********************************************************************************Cycle (sec): 100 Critical Vol./Cap.(X): 0.668Loss Time (sec): 10 (Y+R=4.0 sec) Average Delay (sec/veh): 22.0Optimal Cycle: 50 Level Of Service: C********************************************************************************Street Name: Queen Kaahumanu Hwy Makala Blvd Approach: North Bound South Bound East Bound West Bound Movement: L - T - R L - T - R L - T - R L - T - R ------------|---------------||---------------||---------------||---------------|Control: Prot+Permit Prot+Permit Prot+Permit Prot+Permit Rights: Ovl Ovl Include Include Min. Green: 0 0 0 0 0 0 0 0 0 0 0 0 Lanes: 1 0 2 0 1 1 0 2 0 1 1 0 0 1 0 1 0 0 1 0 ------------|---------------||---------------||---------------||---------------|Volume Module:Base Vol: 10 949 30 68 905 200 309 72 32 7 21 143 Growth Adj: 1.00 1.00 1.00 1.00 1.00 1.00 1.00 1.00 1.00 1.00 1.00 1.00 Initial Bse: 10 949 30 68 905 200 309 72 32 7 21 143 User Adj: 1.00 1.00 1.00 1.00 1.00 1.00 1.00 1.00 1.00 1.00 1.00 1.00 PHF Adj: 0.95 0.95 0.95 0.95 0.95 0.95 0.95 0.95 0.95 0.95 0.95 0.95 PHF Volume: 11 999 32 72 953 211 325 76 34 7 22 151 Reduct Vol: 0 0 0 0 0 0 0 0 0 0 0 0 Reduced Vol: 11 999 32 72 953 211 325 76 34 7 22 151 PCE Adj: 1.00 1.00 1.00 1.00 1.00 1.00 1.00 1.00 1.00 1.00 1.00 1.00 MLF Adj: 1.00 1.00 1.00 1.00 1.00 1.00 1.00 1.00 1.00 1.00 1.00 1.00 FinalVolume: 11 999 32 72 953 211 325 76 34 7 22 151 ------------|---------------||---------------||---------------||---------------|Saturation Flow Module:Sat/Lane: 1900 1900 1900 1900 1900 1900 1900 1900 1900 1900 1900 1900 Adjustment: 0.95 0.95 0.85 0.95 0.95 0.85 0.95 0.95 0.95 0.95 0.87 0.87 Lanes: 1.00 2.00 1.00 1.00 2.00 1.00 1.00 0.69 0.31 1.00 0.13 0.87 Final Sat.: 1805 3610 1615 1805 3610 1615 1805 1255 558 1805 211 1440 ------------|---------------||---------------||---------------||---------------|Capacity Analysis Module:Vol/Sat: 0.01 0.28 0.02 0.04 0.26 0.13 0.18 0.06 0.06 0.00 0.10 0.10 Crit Moves: **** **** **** **** Green/Cycle: 0.42 0.41 0.44 0.49 0.46 0.73 0.45 0.40 0.40 0.18 0.16 0.16 Volume/Cap: 0.06 0.67 0.04 0.33 0.57 0.18 0.55 0.15 0.15 0.03 0.67 0.67 Uniform Del: 17.6 23.7 15.9 16.4 19.6 4.1 18.9 19.2 19.2 33.5 39.7 39.7 IncremntDel: 0.1 1.2 0.0 0.9 0.5 0.1 1.1 0.1 0.1 0.0 6.6 6.6 InitQueuDel: 0.0 0.0 0.0 0.0 0.0 0.0 0.0 0.0 0.0 0.0 0.0 0.0 Delay Adj: 1.00 1.00 1.00 1.00 1.00 1.00 1.00 1.00 1.00 1.00 1.00 1.00 Delay/Veh: 17.7 24.9 15.9 17.4 20.0 4.2 20.0 19.3 19.3 33.5 46.3 46.3 User DelAdj: 1.00 1.00 1.00 1.00 1.00 1.00 1.00 1.00 1.00 1.00 1.00 1.00 AdjDel/Veh: 17.7 24.9 15.9 17.4 20.0 4.2 20.0 19.3 19.3 33.5 46.3 46.3 LOS by Move: B C B B C A B B B C D D HCM2kAvgQ: 0 14 1 2 11 2 8 2 2 0 6 6 ********************************************************************************Note: Queue reported is the number of cars per lane.********************************************************************************

CP(C)_AM Tue Nov 6, 2007 12:05:13 Page 9-1 ---------------------------------------------------------------------------------------------------------------------------------------------------------------- Level Of Service Computation Report 2000 HCM Unsignalized Method (Base Volume Alternative) ********************************************************************************Intersection #7 Ane Keohokahole/Main Gate ********************************************************************************Average Delay (sec/veh): 279.9 Worst Case Level Of Service: F[858.8]********************************************************************************Street Name: Ane Keohokahole Hwy Main Gate Approach: North Bound South Bound East Bound West Bound Movement: L - T - R L - T - R L - T - R L - T - R ------------|---------------||---------------||---------------||---------------|Control: Uncontrolled Uncontrolled Stop Sign Stop Sign Rights: Include Include Include Include Lanes: 0 0 1 0 1 1 0 1 0 0 0 0 0 0 0 1 0 0 0 1 ------------|---------------||---------------||---------------||---------------|Volume Module:Base Vol: 0 447 291 194 620 0 0 0 0 420 0 327 Growth Adj: 1.00 1.00 1.00 1.00 1.00 1.00 1.00 1.00 1.00 1.00 1.00 1.00 Initial Bse: 0 447 291 194 620 0 0 0 0 420 0 327 User Adj: 1.00 1.00 1.00 1.00 1.00 1.00 1.00 1.00 1.00 1.00 1.00 1.00 PHF Adj: 0.95 0.95 0.95 0.95 0.95 0.95 0.95 0.95 0.95 0.95 0.95 0.95 PHF Volume: 0 471 306 204 653 0 0 0 0 442 0 344 Reduct Vol: 0 0 0 0 0 0 0 0 0 0 0 0 FinalVolume: 0 471 306 204 653 0 0 0 0 442 0 344 ------------|---------------||---------------||---------------||---------------|Critical Gap Module:Critical Gp:xxxxx xxxx xxxxx 4.1 xxxx xxxxx xxxxx xxxx xxxxx 6.4 xxxx 6.2 FollowUpTim:xxxxx xxxx xxxxx 2.2 xxxx xxxxx xxxxx xxxx xxxxx 3.5 xxxx 3.3 ------------|---------------||---------------||---------------||---------------|Capacity Module:Cnflict Vol: xxxx xxxx xxxxx 777 xxxx xxxxx xxxx xxxx xxxxx 1532 xxxx 471 Potent Cap.: xxxx xxxx xxxxx 849 xxxx xxxxx xxxx xxxx xxxxx 130 xxxx 597 Move Cap.: xxxx xxxx xxxxx 849 xxxx xxxxx xxxx xxxx xxxxx 106 xxxx 597 Volume/Cap: xxxx xxxx xxxx 0.24 xxxx xxxx xxxx xxxx xxxx 4.18 xxxx 0.58 ------------|---------------||---------------||---------------||---------------|Level Of Service Module:2Way95thQ: xxxx xxxx xxxxx 0.9 xxxx xxxxx xxxx xxxx xxxxx 45.7 xxxx 3.7 Control Del:xxxxx xxxx xxxxx 10.6 xxxx xxxxx xxxxx xxxx xxxxx 1513 xxxx 18.9 LOS by Move: * * * B * * * * * F * C Movement: LT - LTR - RT LT - LTR - RT LT - LTR - RT LT - LTR - RT Shared Cap.: xxxx xxxx xxxxx xxxx xxxx xxxxx xxxx xxxx xxxxx xxxx xxxx xxxxx SharedQueue:xxxxx xxxx xxxxx xxxxx xxxx xxxxx xxxxx xxxx xxxxx xxxxx xxxx xxxxx Shrd ConDel:xxxxx xxxx xxxxx xxxxx xxxx xxxxx xxxxx xxxx xxxxx xxxxx xxxx xxxxx Shared LOS: * * * * * * * * * * * * ApproachDel: xxxxxx xxxxxx xxxxxx 858.8ApproachLOS: * * * F ********************************************************************************Note: Queue reported is the number of cars per lane.********************************************************************************

CP(C)_AM Tue Nov 6, 2007 12:05:13 Page 10-1 ---------------------------------------------------------------------------------------------------------------------------------------------------------------- Level Of Service Computation Report 2000 HCM Operations Method (Base Volume Alternative) ********************************************************************************Intersection #8 Palihiolo St/Palani Rd ********************************************************************************Cycle (sec): 100 Critical Vol./Cap.(X): 1.644Loss Time (sec): 10 (Y+R=4.0 sec) Average Delay (sec/veh): 188.2Optimal Cycle: 180 Level Of Service: F********************************************************************************Street Name: Palihiolo St Palani Rd Approach: North Bound South Bound East Bound West Bound Movement: L - T - R L - T - R L - T - R L - T - R ------------|---------------||---------------||---------------||---------------|Control: Permitted Permitted Prot+Permit Permitted Rights: Include Include Include Ignore Min. Green: 0 0 0 0 0 0 0 0 0 0 0 0 Lanes: 0 1 0 0 1 1 0 0 1 0 1 0 0 1 0 1 0 1 0 1 ------------|---------------||---------------||---------------||---------------|Volume Module:Base Vol: 5 20 32 10 15 553 438 569 6 20 1319 56 Growth Adj: 1.00 1.00 1.00 1.00 1.00 1.00 1.00 1.00 1.00 1.00 1.00 1.00 Initial Bse: 5 20 32 10 15 553 438 569 6 20 1319 56 User Adj: 1.00 1.00 1.00 1.00 1.00 1.00 1.00 1.00 1.00 1.00 1.00 0.00 PHF Adj: 0.95 0.95 0.95 0.95 0.95 0.95 0.95 0.95 0.95 0.95 0.95 0.00 PHF Volume: 5 21 34 11 16 582 461 599 6 21 1388 0 Reduct Vol: 0 0 0 0 0 0 0 0 0 0 0 0 Reduced Vol: 5 21 34 11 16 582 461 599 6 21 1388 0 PCE Adj: 1.00 1.00 1.00 1.00 1.00 1.00 1.00 1.00 1.00 1.00 1.00 0.00 MLF Adj: 1.00 1.00 1.00 1.00 1.00 1.00 1.00 1.00 1.00 1.00 1.00 0.00 FinalVolume: 5 21 34 11 16 582 461 599 6 21 1388 0 ------------|---------------||---------------||---------------||---------------|Saturation Flow Module:Sat/Lane: 1900 1900 1900 1900 1900 1900 1900 1900 1900 1900 1900 1900 Adjustment: 0.64 0.64 0.85 0.75 0.85 0.85 0.22 1.00 1.00 0.95 1.00 1.00 Lanes: 0.20 0.80 1.00 1.00 0.03 0.97 1.00 0.99 0.01 1.00 1.00 1.00 Final Sat.: 244 977 1615 1419 43 1580 415 1878 20 1805 1900 1900 ------------|---------------||---------------||---------------||---------------|Capacity Analysis Module:Vol/Sat: 0.02 0.02 0.02 0.01 0.37 0.37 1.11 0.32 0.32 0.01 0.73 0.00 Crit Moves: **** **** Green/Cycle: 0.24 0.24 0.24 0.24 0.24 0.24 0.63 0.63 0.63 0.02 0.49 0.00 Volume/Cap: 0.09 0.09 0.09 0.03 1.51 1.51 1.21 0.50 0.50 0.50 1.51 0.00 Uniform Del: 29.1 29.1 29.1 28.7 37.8 37.8 8.6 9.9 9.9 48.3 25.7 0.0 IncremntDel: 0.1 0.1 0.1 0.0 240 240.1 114.9 0.3 0.3 9.6 233 0.0 InitQueuDel: 0.0 0.0 0.0 0.0 0.0 0.0 0.0 0.0 0.0 0.0 0.0 0.0 Delay Adj: 1.00 1.00 1.00 1.00 1.00 1.00 1.00 1.00 1.00 1.00 1.00 0.00 Delay/Veh: 29.3 29.3 29.2 28.8 278 277.9 123.5 10.3 10.3 57.8 259 0.0 User DelAdj: 1.00 1.00 1.00 1.00 1.00 1.00 1.00 1.00 1.00 1.00 1.00 1.00 AdjDel/Veh: 29.3 29.3 29.2 28.8 278 277.9 123.5 10.3 10.3 57.8 259 0.0 LOS by Move: C C C C F F F B B E F A HCM2kAvgQ: 1 1 1 0 44 44 27 10 10 1 100 0 ********************************************************************************Note: Queue reported is the number of cars per lane.********************************************************************************

CP(C)_AM Tue Nov 6, 2007 12:05:13 Page 11-1 ---------------------------------------------------------------------------------------------------------------------------------------------------------------- Level Of Service Computation Report 2000 HCM Unsignalized Method (Base Volume Alternative) ********************************************************************************Intersection #10 Palani Rd / Uluaoa St ********************************************************************************Average Delay (sec/veh): 46.4 Worst Case Level Of Service: F[251.1]********************************************************************************Street Name: Palani Rd Uluaoa St Approach: North Bound South Bound East Bound West Bound Movement: L - T - R L - T - R L - T - R L - T - R ------------|---------------||---------------||---------------||---------------|Control: Uncontrolled Uncontrolled Stop Sign Stop Sign Rights: Include Include Include Include Lanes: 0 1 0 0 0 0 0 0 1 0 1 0 0 0 1 0 0 0 0 0 ------------|---------------||---------------||---------------||---------------|Volume Module:Base Vol: 58 515 0 0 788 311 176 0 200 0 0 0 Growth Adj: 1.00 1.00 1.00 1.00 1.00 1.00 1.00 1.00 1.00 1.00 1.00 1.00 Initial Bse: 58 515 0 0 788 311 176 0 200 0 0 0 User Adj: 1.00 1.00 1.00 1.00 1.00 1.00 1.00 1.00 1.00 1.00 1.00 1.00 PHF Adj: 0.95 0.95 0.95 0.95 0.95 0.95 0.95 0.95 0.95 0.95 0.95 0.95 PHF Volume: 61 542 0 0 829 327 185 0 211 0 0 0 Reduct Vol: 0 0 0 0 0 0 0 0 0 0 0 0 FinalVolume: 61 542 0 0 829 327 185 0 211 0 0 0 ------------|---------------||---------------||---------------||---------------|Critical Gap Module:Critical Gp: 4.1 xxxx xxxxx xxxxx xxxx xxxxx 6.4 xxxx 6.2 xxxxx xxxx xxxxx FollowUpTim: 2.2 xxxx xxxxx xxxxx xxxx xxxxx 3.5 xxxx 3.3 xxxxx xxxx xxxxx ------------|---------------||---------------||---------------||---------------|Capacity Module:Cnflict Vol: 1157 xxxx xxxxx xxxx xxxx xxxxx 1657 xxxx 993 xxxx xxxx xxxxx Potent Cap.: 611 xxxx xxxxx xxxx xxxx xxxxx 109 xxxx 300 xxxx xxxx xxxxx Move Cap.: 611 xxxx xxxxx xxxx xxxx xxxxx 100 xxxx 300 xxxx xxxx xxxxx Volume/Cap: 0.10 xxxx xxxx xxxx xxxx xxxx 1.85 xxxx 0.70 xxxx xxxx xxxx ------------|---------------||---------------||---------------||---------------|Level Of Service Module:2Way95thQ: 0.3 xxxx xxxxx xxxx xxxx xxxxx 15.2 xxxx 4.9 xxxx xxxx xxxxx Control Del: 11.5 xxxx xxxxx xxxxx xxxx xxxxx 489.9 xxxx 40.8 xxxxx xxxx xxxxx LOS by Move: B * * * * * F * E * * * Movement: LT - LTR - RT LT - LTR - RT LT - LTR - RT LT - LTR - RT Shared Cap.: xxxx xxxx xxxxx xxxx xxxx xxxxx xxxx xxxx xxxxx xxxx xxxx xxxxx SharedQueue: 0.3 xxxx xxxxx xxxxx xxxx xxxxx xxxxx xxxx xxxxx xxxxx xxxx xxxxx Shrd ConDel: 11.5 xxxx xxxxx xxxxx xxxx xxxxx xxxxx xxxx xxxxx xxxxx xxxx xxxxx Shared LOS: B * * * * * * * * * * * ApproachDel: xxxxxx xxxxxx 251.1 xxxxxxApproachLOS: * * F * ********************************************************************************Note: Queue reported is the number of cars per lane.********************************************************************************

CP(C)_AM Tue Nov 6, 2007 12:05:13 Page 12-1 ---------------------------------------------------------------------------------------------------------------------------------------------------------------- Level Of Service Computation Report 2000 HCM Operations Method (Base Volume Alternative) ********************************************************************************Intersection #11 Queen Kaahumanu Hwy / Kealakehe Pkwy ********************************************************************************Cycle (sec): 100 Critical Vol./Cap.(X): 0.834Loss Time (sec): 10 (Y+R=4.0 sec) Average Delay (sec/veh): 28.1Optimal Cycle: 80 Level Of Service: C********************************************************************************Street Name: Queen Kaahumanu Hwy Kaalakehe Pkwy Approach: North Bound South Bound East Bound West Bound Movement: L - T - R L - T - R L - T - R L - T - R ------------|---------------||---------------||---------------||---------------|Control: Prot+Permit Prot+Permit Permitted Permitted Rights: Ovl Ovl Ovl Ovl Min. Green: 0 0 0 0 0 0 0 0 0 0 0 0 Lanes: 1 0 2 0 1 1 0 2 0 1 0 1 0 0 1 0 1 0 0 1 ------------|---------------||---------------||---------------||---------------|Volume Module:Base Vol: 115 1042 422 268 975 249 81 107 10 231 61 221 Growth Adj: 1.00 1.00 1.00 1.00 1.00 1.00 1.00 1.00 1.00 1.00 1.00 1.00 Initial Bse: 115 1042 422 268 975 249 81 107 10 231 61 221 User Adj: 1.00 1.00 1.00 1.00 1.00 1.00 1.00 1.00 1.00 1.00 1.00 1.00 PHF Adj: 0.95 0.95 0.95 0.95 0.95 0.95 0.95 0.95 0.95 0.95 0.95 0.95 PHF Volume: 121 1097 444 282 1026 262 85 113 11 243 64 233 Reduct Vol: 0 0 0 0 0 0 0 0 0 0 0 0 Reduced Vol: 121 1097 444 282 1026 262 85 113 11 243 64 233 PCE Adj: 1.00 1.00 1.00 1.00 1.00 1.00 1.00 1.00 1.00 1.00 1.00 1.00 MLF Adj: 1.00 1.00 1.00 1.00 1.00 1.00 1.00 1.00 1.00 1.00 1.00 1.00 FinalVolume: 121 1097 444 282 1026 262 85 113 11 243 64 233 ------------|---------------||---------------||---------------||---------------|Saturation Flow Module:Sat/Lane: 1900 1900 1900 1900 1900 1900 1900 1900 1900 1900 1900 1900 Adjustment: 0.95 0.95 0.85 0.95 0.95 0.85 0.61 0.61 0.85 0.56 0.56 0.85 Lanes: 1.00 2.00 1.00 1.00 2.00 1.00 0.43 0.57 1.00 0.79 0.21 1.00 Final Sat.: 1805 3610 1615 1805 3610 1615 495 654 1615 837 221 1615 ------------|---------------||---------------||---------------||---------------|Capacity Analysis Module:Vol/Sat: 0.07 0.30 0.28 0.16 0.28 0.16 0.17 0.17 0.01 0.29 0.29 0.14 Crit Moves: **** **** **** Green/Cycle: 0.47 0.36 0.36 0.58 0.45 0.45 0.35 0.35 0.45 0.35 0.35 0.54 Volume/Cap: 0.38 0.83 0.75 0.68 0.64 0.36 0.49 0.49 0.01 0.83 0.83 0.27 Uniform Del: 16.0 29.0 27.9 23.3 21.4 18.3 25.7 25.7 15.0 29.9 29.9 12.6 IncremntDel: 0.8 4.7 5.5 4.6 0.9 0.3 1.0 1.0 0.0 15.0 15.0 0.2 InitQueuDel: 0.0 0.0 0.0 0.0 0.0 0.0 0.0 0.0 0.0 0.0 0.0 0.0 Delay Adj: 1.00 1.00 1.00 1.00 1.00 1.00 1.00 1.00 1.00 1.00 1.00 1.00 Delay/Veh: 16.8 33.8 33.4 27.9 22.3 18.6 26.6 26.6 15.0 44.9 44.9 12.8 User DelAdj: 1.00 1.00 1.00 1.00 1.00 1.00 1.00 1.00 1.00 1.00 1.00 1.00 AdjDel/Veh: 16.8 33.8 33.4 27.9 22.3 18.6 26.6 26.6 15.0 44.9 44.9 12.8 LOS by Move: B C C C C B C C B D D B HCM2kAvgQ: 3 19 14 7 13 5 5 5 0 11 11 4 ********************************************************************************Note: Queue reported is the number of cars per lane.********************************************************************************

CP(C)_AM Tue Nov 6, 2007 12:05:13 Page 13-1 ---------------------------------------------------------------------------------------------------------------------------------------------------------------- Level Of Service Computation Report 2000 HCM Unsignalized Method (Base Volume Alternative) ********************************************************************************Intersection #12 Ane Keohokalole Hwy / Kealakehe Pkwy ********************************************************************************Average Delay (sec/veh): OVERFLOW Worst Case Level Of Service: F[xxxxx]********************************************************************************Street Name: Ane Keohokalole Hwy Kealakehe Pkwy Approach: North Bound South Bound East Bound West Bound Movement: L - T - R L - T - R L - T - R L - T - R ------------|---------------||---------------||---------------||---------------|Control: Stop Sign Stop Sign Uncontrolled UncontrolledRights: Include Include Include Include Lanes: 1 0 1 0 1 1 0 0 1 0 1 0 1 1 0 1 0 1 0 1 ------------|---------------||---------------||---------------||---------------|Volume Module:Base Vol: 311 460 3 12 360 45 369 94 452 2 115 50 Growth Adj: 1.00 1.00 1.00 1.00 1.00 1.00 1.00 1.00 1.00 1.00 1.00 1.00 Initial Bse: 311 460 3 12 360 45 369 94 452 2 115 50 User Adj: 1.00 1.00 1.00 1.00 1.00 1.00 1.00 1.00 1.00 1.00 1.00 1.00 PHF Adj: 0.95 0.95 0.95 0.95 0.95 0.95 0.95 0.95 0.95 0.95 0.95 0.95 PHF Volume: 327 484 3 13 379 47 388 99 476 2 121 53 Reduct Vol: 0 0 0 0 0 0 0 0 0 0 0 0 FinalVolume: 327 484 3 13 379 47 388 99 476 2 121 53 ------------|---------------||---------------||---------------||---------------|Critical Gap Module:Critical Gp: 7.1 6.5 6.2 7.1 6.5 6.2 4.1 xxxx xxxxx 4.1 xxxx xxxxx FollowUpTim: 3.5 4.0 3.3 3.5 4.0 3.3 2.2 xxxx xxxxx 2.2 xxxx xxxxx ------------|---------------||---------------||---------------||---------------|Capacity Module:Cnflict Vol: 1478 1292 287 1194 1477 121 174 xxxx xxxxx 575 xxxx xxxxx Potent Cap.: 105 165 756 165 127 936 1415 xxxx xxxxx 1008 xxxx xxxxx Move Cap.: 0 119 756 0 92 936 1415 xxxx xxxxx 1008 xxxx xxxxx Volume/Cap: xxxx 4.06 0.00 xxxx 4.11 0.05 0.27 xxxx xxxx 0.00 xxxx xxxx ------------|---------------||---------------||---------------||---------------|Level Of Service Module:2Way95thQ: xxxx 49.3 0.0 xxxx xxxx xxxxx 1.1 xxxx xxxxx 0.0 xxxx xxxxx Control Del:xxxxx 1453 9.8 xxxxx xxxx xxxxx 8.5 xxxx xxxxx 8.6 xxxx xxxxx LOS by Move: * F A * * * A * * A * * Movement: LT - LTR - RT LT - LTR - RT LT - LTR - RT LT - LTR - RT Shared Cap.: xxxx xxxx xxxxx xxxx xxxx 102 xxxx xxxx xxxxx xxxx xxxx xxxxx SharedQueue:xxxxx xxxx xxxxx xxxxx xxxx 44.1 xxxxx xxxx xxxxx xxxxx xxxx xxxxx Shrd ConDel:xxxxx xxxx xxxxx xxxxx xxxx 1508 xxxxx xxxx xxxxx xxxxx xxxx xxxxx Shared LOS: * * * * * F * * * * * * ApproachDel: xxxxxx xxxxxx xxxxxx xxxxxxApproachLOS: F F * * ********************************************************************************Note: Queue reported is the number of cars per lane.********************************************************************************

CP(C)_PM Tue Nov 6, 2007 12:05:22 Page 3-1 ---------------------------------------------------------------------------------------------------------------------------------------------------------------- Level Of Service Computation Report 2000 HCM Operations Method (Base Volume Alternative) ********************************************************************************Intersection #1 Queen Kaahumanu Hwy / Henry St ********************************************************************************Cycle (sec): 100 Critical Vol./Cap.(X): 0.931Loss Time (sec): 10 (Y+R=4.0 sec) Average Delay (sec/veh): 31.9Optimal Cycle: 123 Level Of Service: C********************************************************************************Street Name: Queen Kaahumanu Hwy Henry St Approach: North Bound South Bound East Bound West Bound Movement: L - T - R L - T - R L - T - R L - T - R ------------|---------------||---------------||---------------||---------------|Control: Prot+Permit Prot+Permit Prot+Permit Prot+Permit Rights: Ovl Ovl Ovl Ovl Min. Green: 0 0 0 0 0 0 0 0 0 0 0 0 Lanes: 1 0 2 0 1 1 0 3 0 1 1 0 2 0 1 1 1 1 0 1 ------------|---------------||---------------||---------------||---------------|Volume Module:Base Vol: 282 542 836 183 731 121 76 639 107 565 604 211 Growth Adj: 1.00 1.00 1.00 1.00 1.00 1.00 1.00 1.00 1.00 1.00 1.00 1.00 Initial Bse: 282 542 836 183 731 121 76 639 107 565 604 211 User Adj: 1.00 1.00 1.00 1.00 1.00 1.00 1.00 1.00 1.00 1.00 1.00 1.00 PHF Adj: 0.95 0.95 0.95 0.95 0.95 0.95 0.95 0.95 0.95 0.95 0.95 0.95 PHF Volume: 297 571 880 193 769 127 80 673 113 595 636 222 Reduct Vol: 0 0 0 0 0 0 0 0 0 0 0 0 Reduced Vol: 297 571 880 193 769 127 80 673 113 595 636 222 PCE Adj: 1.00 1.00 1.00 1.00 1.00 1.00 1.00 1.00 1.00 1.00 1.00 1.00 MLF Adj: 1.00 1.00 1.00 1.00 1.00 1.00 1.00 1.00 1.00 1.00 1.00 1.00 FinalVolume: 297 571 880 193 769 127 80 673 113 595 636 222 ------------|---------------||---------------||---------------||---------------|Saturation Flow Module:Sat/Lane: 1900 1900 1900 1900 1900 1900 1900 1900 1900 1900 1900 1900 Adjustment: 0.95 0.95 0.85 0.95 0.91 0.85 0.95 0.95 0.85 0.93 0.93 0.85 Lanes: 1.00 2.00 1.00 1.00 3.00 1.00 1.00 2.00 1.00 1.45 1.55 1.00 Final Sat.: 1805 3610 1615 1805 5187 1615 1805 3610 1615 2554 2731 1615 ------------|---------------||---------------||---------------||---------------|Capacity Analysis Module:Vol/Sat: 0.16 0.16 0.54 0.11 0.15 0.08 0.04 0.19 0.07 0.23 0.23 0.14 Crit Moves: **** **** **** **** Green/Cycle: 0.47 0.34 0.59 0.33 0.21 0.29 0.27 0.20 0.44 0.47 0.38 0.49 Volume/Cap: 0.59 0.47 0.93 0.51 0.70 0.28 0.28 0.93 0.16 0.64 0.62 0.28 Uniform Del: 18.1 26.2 18.9 25.3 36.3 27.7 27.7 39.3 17.1 20.0 25.2 14.9 IncremntDel: 1.9 0.3 15.3 1.2 2.0 0.3 0.5 18.7 0.1 0.8 0.6 0.2 InitQueuDel: 0.0 0.0 0.0 0.0 0.0 0.0 0.0 0.0 0.0 0.0 0.0 0.0 Delay Adj: 1.00 1.00 1.00 1.00 1.00 1.00 1.00 1.00 1.00 1.00 1.00 1.00 Delay/Veh: 20.0 26.5 34.2 26.4 38.3 28.1 28.3 58.0 17.2 20.7 25.8 15.1 User DelAdj: 1.00 1.00 1.00 1.00 1.00 1.00 1.00 1.00 1.00 1.00 1.00 1.00 AdjDel/Veh: 20.0 26.5 34.2 26.4 38.3 28.1 28.3 58.0 17.2 20.7 25.8 15.1 LOS by Move: B C C C D C C E B C C B HCM2kAvgQ: 7 7 29 5 9 3 2 15 2 11 11 4 ********************************************************************************Note: Queue reported is the number of cars per lane.********************************************************************************

CP(C)_PM Tue Nov 6, 2007 12:05:22 Page 4-1 ---------------------------------------------------------------------------------------------------------------------------------------------------------------- Level Of Service Computation Report 2000 HCM Operations Method (Base Volume Alternative) ********************************************************************************Intersection #2 Queen Kaahumanu Hwy / Alli Dr ********************************************************************************Cycle (sec): 100 Critical Vol./Cap.(X): 1.033Loss Time (sec): 10 (Y+R=4.0 sec) Average Delay (sec/veh): 46.4Optimal Cycle: 180 Level Of Service: D********************************************************************************Street Name: Queen Kaahumanu Hwy Alli Dr Approach: North Bound South Bound East Bound West Bound Movement: L - T - R L - T - R L - T - R L - T - R ------------|---------------||---------------||---------------||---------------|Control: Prot+Permit Prot+Permit Prot+Permit Prot+Permit Rights: Ovl Ovl Ovl Ovl Min. Green: 0 0 0 0 0 0 0 0 0 0 0 0 Lanes: 1 0 2 0 1 1 0 2 0 1 1 0 1 0 1 1 0 1 0 1 ------------|---------------||---------------||---------------||---------------|Volume Module:Base Vol: 38 706 98 304 707 358 269 293 219 144 732 110 Growth Adj: 1.00 1.00 1.00 1.00 1.00 1.00 1.00 1.00 1.00 1.00 1.00 1.00 Initial Bse: 38 706 98 304 707 358 269 293 219 144 732 110 User Adj: 1.00 1.00 1.00 1.00 1.00 1.00 1.00 1.00 1.00 1.00 1.00 1.00 PHF Adj: 0.95 0.95 0.95 0.95 0.95 0.95 0.95 0.95 0.95 0.95 0.95 0.95 PHF Volume: 40 743 103 320 744 377 283 308 231 152 771 116 Reduct Vol: 0 0 0 0 0 0 0 0 0 0 0 0 Reduced Vol: 40 743 103 320 744 377 283 308 231 152 771 116 PCE Adj: 1.00 1.00 1.00 1.00 1.00 1.00 1.00 1.00 1.00 1.00 1.00 1.00 MLF Adj: 1.00 1.00 1.00 1.00 1.00 1.00 1.00 1.00 1.00 1.00 1.00 1.00 FinalVolume: 40 743 103 320 744 377 283 308 231 152 771 116 ------------|---------------||---------------||---------------||---------------|Saturation Flow Module:Sat/Lane: 1900 1900 1900 1900 1900 1900 1900 1900 1900 1900 1900 1900 Adjustment: 0.95 0.95 0.85 0.79 0.95 0.85 0.70 1.00 0.85 0.95 1.00 0.85 Lanes: 1.00 2.00 1.00 1.00 2.00 1.00 1.00 1.00 1.00 1.00 1.00 1.00 Final Sat.: 1805 3610 1615 1498 3610 1615 1332 1900 1615 1805 1900 1615 ------------|---------------||---------------||---------------||---------------|Capacity Analysis Module:Vol/Sat: 0.02 0.21 0.06 0.21 0.21 0.23 0.21 0.16 0.14 0.08 0.41 0.07 Crit Moves: **** **** **** **** Green/Cycle: 0.23 0.20 0.38 0.38 0.33 0.48 0.50 0.35 0.39 0.56 0.39 0.55 Volume/Cap: 0.22 1.05 0.17 0.84 0.63 0.49 0.82 0.46 0.37 0.26 1.05 0.13 Uniform Del: 30.3 40.2 20.6 22.6 28.3 17.7 14.7 25.0 21.8 11.6 30.7 10.7 IncremntDel: 0.6 47.9 0.1 15.8 1.1 0.5 14.3 0.5 0.4 0.2 47.3 0.1 InitQueuDel: 0.0 0.0 0.0 0.0 0.0 0.0 0.0 0.0 0.0 0.0 0.0 0.0 Delay Adj: 1.00 1.00 1.00 1.00 1.00 1.00 1.00 1.00 1.00 1.00 1.00 1.00 Delay/Veh: 30.9 88.1 20.8 38.5 29.4 18.2 29.0 25.5 22.2 11.8 78.0 10.7 User DelAdj: 1.00 1.00 1.00 1.00 1.00 1.00 1.00 1.00 1.00 1.00 1.00 1.00 AdjDel/Veh: 30.9 88.1 20.8 38.5 29.4 18.2 29.0 25.5 22.2 11.8 78.0 10.7 LOS by Move: C F C D C B C C C B E B HCM2kAvgQ: 1 19 2 12 11 8 10 7 5 3 34 2 ********************************************************************************Note: Queue reported is the number of cars per lane.********************************************************************************

CP(C)_PM Tue Nov 6, 2007 12:05:22 Page 5-1 ---------------------------------------------------------------------------------------------------------------------------------------------------------------- Level Of Service Computation Report 2000 HCM Unsignalized Method (Base Volume Alternative) ********************************************************************************Intersection #3 Kamakaeha Ave / Palani Rd ********************************************************************************Average Delay (sec/veh): 19.7 Worst Case Level Of Service: F[187.6]********************************************************************************Street Name: Kamakaeha Ave Palani Rd Approach: North Bound South Bound East Bound West Bound Movement: L - T - R L - T - R L - T - R L - T - R ------------|---------------||---------------||---------------||---------------|Control: Stop Sign Stop Sign Uncontrolled UncontrolledRights: Include Include Include Ignore Lanes: 0 0 0 0 0 1 0 0 0 1 0 0 1 0 0 0 0 1 0 1 ------------|---------------||---------------||---------------||---------------|Volume Module:Base Vol: 0 0 0 127 0 63 0 695 0 0 923 281 Growth Adj: 1.00 1.00 1.00 1.00 1.00 1.00 1.00 1.00 1.00 1.00 1.00 1.00 Initial Bse: 0 0 0 127 0 63 0 695 0 0 923 281 User Adj: 1.00 1.00 1.00 1.00 1.00 1.00 1.00 1.00 1.00 1.00 1.00 0.00 PHF Adj: 0.95 0.95 0.95 0.95 0.95 0.95 0.95 0.95 0.95 0.95 0.95 0.00 PHF Volume: 0 0 0 134 0 66 0 732 0 0 972 0 Reduct Vol: 0 0 0 0 0 0 0 0 0 0 0 0 FinalVolume: 0 0 0 134 0 66 0 732 0 0 972 0 ------------|---------------||---------------||---------------||---------------|Critical Gap Module:Critical Gp:xxxxx xxxx xxxxx 6.4 xxxx 6.2 xxxxx xxxx xxxxx xxxxx xxxx xxxxx FollowUpTim:xxxxx xxxx xxxxx 3.5 xxxx 3.3 xxxxx xxxx xxxxx xxxxx xxxx xxxxx ------------|---------------||---------------||---------------||---------------|Capacity Module:Cnflict Vol: xxxx xxxx xxxxx 1703 xxxx 972 xxxx xxxx xxxxx xxxx xxxx xxxxx Potent Cap.: xxxx xxxx xxxxx 102 xxxx 309 xxxx xxxx xxxxx xxxx xxxx xxxxx Move Cap.: xxxx xxxx xxxxx 102 xxxx 309 xxxx xxxx xxxxx xxxx xxxx xxxxx Volume/Cap: xxxx xxxx xxxx 1.31 xxxx 0.21 xxxx xxxx xxxx xxxx xxxx xxxx ------------|---------------||---------------||---------------||---------------|Level Of Service Module:2Way95thQ: xxxx xxxx xxxxx 9.3 xxxx 0.8 xxxx xxxx xxxxx xxxx xxxx xxxxx Control Del:xxxxx xxxx xxxxx 270.9 xxxx 19.8 xxxxx xxxx xxxxx xxxxx xxxx xxxxx LOS by Move: * * * F * C * * * * * * Movement: LT - LTR - RT LT - LTR - RT LT - LTR - RT LT - LTR - RT Shared Cap.: xxxx xxxx xxxxx xxxx xxxx xxxxx xxxx xxxx xxxxx xxxx xxxx xxxxx SharedQueue:xxxxx xxxx xxxxx xxxxx xxxx xxxxx xxxxx xxxx xxxxx xxxxx xxxx xxxxx Shrd ConDel:xxxxx xxxx xxxxx xxxxx xxxx xxxxx xxxxx xxxx xxxxx xxxxx xxxx xxxxx Shared LOS: * * * * * * * * * * * * ApproachDel: xxxxxx 187.6 xxxxxx xxxxxxApproachLOS: * F * * ********************************************************************************Note: Queue reported is the number of cars per lane.********************************************************************************

CP(C)_PM Tue Nov 6, 2007 12:05:22 Page 6-1 ---------------------------------------------------------------------------------------------------------------------------------------------------------------- Level Of Service Computation Report 2000 HCM Operations Method (Base Volume Alternative) ********************************************************************************Intersection #4 Henry St / Palani Rd ********************************************************************************Cycle (sec): 100 Critical Vol./Cap.(X): 1.326Loss Time (sec): 10 (Y+R=4.0 sec) Average Delay (sec/veh): 190.8Optimal Cycle: 180 Level Of Service: F********************************************************************************Street Name: Henry St Palani Rd Approach: North Bound South Bound East Bound West Bound Movement: L - T - R L - T - R L - T - R L - T - R ------------|---------------||---------------||---------------||---------------|Control: Permitted Permitted Permitted Prot+Permit Rights: Ovl Include Include Include Min. Green: 0 0 0 0 0 0 0 0 0 0 0 0 Lanes: 1 0 0 1 0 1 0 0 1 0 1 0 0 1 0 1 0 0 1 0 ------------|---------------||---------------||---------------||---------------|Volume Module:Base Vol: 110 445 394 89 362 212 345 416 129 870 927 93 Growth Adj: 1.00 1.00 1.00 1.00 1.00 1.00 1.00 1.00 1.00 1.00 1.00 1.00 Initial Bse: 110 445 394 89 362 212 345 416 129 870 927 93 User Adj: 1.00 1.00 1.00 1.00 1.00 1.00 1.00 1.00 1.00 1.00 1.00 1.00 PHF Adj: 0.95 0.95 0.95 0.95 0.95 0.95 0.95 0.95 0.95 0.95 0.95 0.95 PHF Volume: 116 468 415 94 381 223 363 438 136 916 976 98 Reduct Vol: 0 0 0 0 0 0 0 0 0 0 0 0 Reduced Vol: 116 468 415 94 381 223 363 438 136 916 976 98 PCE Adj: 1.00 1.00 1.00 1.00 1.00 1.00 1.00 1.00 1.00 1.00 1.00 1.00 MLF Adj: 1.00 1.00 1.00 1.00 1.00 1.00 1.00 1.00 1.00 1.00 1.00 1.00 FinalVolume: 116 468 415 94 381 223 363 438 136 916 976 98 ------------|---------------||---------------||---------------||---------------|Saturation Flow Module:Sat/Lane: 1900 1900 1900 1900 1900 1900 1900 1900 1900 1900 1900 1900 Adjustment: 0.11 0.93 0.93 0.11 0.95 0.95 0.95 0.96 0.96 0.80 0.99 0.99 Lanes: 1.00 0.53 0.47 1.00 0.63 0.37 1.00 0.76 0.24 1.00 0.91 0.09 Final Sat.: 212 937 830 212 1132 663 1805 1398 434 1512 1703 171 ------------|---------------||---------------||---------------||---------------|Capacity Analysis Module:Vol/Sat: 0.55 0.50 0.50 0.44 0.34 0.34 0.20 0.31 0.31 0.61 0.57 0.57 Crit Moves: **** **** **** Green/Cycle: 0.36 0.36 0.69 0.36 0.36 0.36 0.14 0.21 0.21 0.40 0.40 0.40 Volume/Cap: 1.52 1.39 0.72 1.23 0.94 0.94 1.43 1.52 1.52 1.35 1.43 1.43 Uniform Del: 32.0 32.0 9.4 32.0 30.9 30.9 43.0 39.7 39.7 29.3 30.0 30.0 IncremntDel:289.2 185 2.1 176.8 21.0 21.0 216.1 247 246.7 166.8 203 202.6 InitQueuDel: 0.0 0.0 0.0 0.0 0.0 0.0 0.0 0.0 0.0 0.0 0.0 0.0 Delay Adj: 1.00 1.00 1.00 1.00 1.00 1.00 1.00 1.00 1.00 1.00 1.00 1.00 Delay/Veh: 321.3 217 11.5 208.8 51.9 51.9 259.1 286 286.4 196.1 233 232.6 User DelAdj: 1.00 1.00 1.00 1.00 1.00 1.00 1.00 1.00 1.00 1.00 1.00 1.00 AdjDel/Veh: 321.3 217 11.5 208.8 51.9 51.9 259.1 286 286.4 196.1 233 232.6 LOS by Move: F F B F D D F F F F F F HCM2kAvgQ: 10 59 17 7 23 23 27 43 43 59 73 73 ********************************************************************************Note: Queue reported is the number of cars per lane.********************************************************************************

CP(C)_PM Tue Nov 6, 2007 12:05:22 Page 7-1 ---------------------------------------------------------------------------------------------------------------------------------------------------------------- Level Of Service Computation Report 2000 HCM Unsignalized Method (Base Volume Alternative) ********************************************************************************Intersection #5 Gate 2/Palani ********************************************************************************Average Delay (sec/veh): 1.2 Worst Case Level Of Service: F[ 98.2]********************************************************************************Street Name: Gate 2 /Palani Rd Approach: North Bound South Bound East Bound West Bound Movement: L - T - R L - T - R L - T - R L - T - R ------------|---------------||---------------||---------------||---------------|Control: Stop Sign Yield Sign Uncontrolled UncontrolledRights: Include Include Include Include Lanes: 0 0 0 0 0 0 0 0 0 1 0 0 1 0 0 0 0 0 1 0 ------------|---------------||---------------||---------------||---------------|Volume Module:Base Vol: 0 0 0 0 0 36 0 899 0 0 1853 146 Growth Adj: 1.00 1.00 1.00 1.00 1.00 1.00 1.00 1.00 1.00 1.00 1.00 1.00 Initial Bse: 0 0 0 0 0 36 0 899 0 0 1853 146 User Adj: 1.00 1.00 1.00 1.00 1.00 1.00 1.00 1.00 1.00 1.00 1.00 1.00 PHF Adj: 0.95 0.95 0.95 0.95 0.95 0.95 0.95 0.95 0.95 0.95 0.95 0.95 PHF Volume: 0 0 0 0 0 38 0 946 0 0 1951 154 Reduct Vol: 0 0 0 0 0 0 0 0 0 0 0 0 FinalVolume: 0 0 0 0 0 38 0 946 0 0 1951 154 ------------|---------------||---------------||---------------||---------------|Critical Gap Module:Critical Gp:xxxxx xxxx xxxxx xxxxx xxxx 6.2 xxxxx xxxx xxxxx xxxxx xxxx xxxxx FollowUpTim:xxxxx xxxx xxxxx xxxxx xxxx 3.3 xxxxx xxxx xxxxx xxxxx xxxx xxxxx ------------|---------------||---------------||---------------||---------------|Capacity Module:Cnflict Vol: xxxx xxxx xxxxx xxxx xxxx 2027 xxxx xxxx xxxxx xxxx xxxx xxxxx Potent Cap.: xxxx xxxx xxxxx xxxx xxxx 73 xxxx xxxx xxxxx xxxx xxxx xxxxx Move Cap.: xxxx xxxx xxxxx xxxx xxxx 73 xxxx xxxx xxxxx xxxx xxxx xxxxx Volume/Cap: xxxx xxxx xxxx xxxx xxxx 0.52 xxxx xxxx xxxx xxxx xxxx xxxx ------------|---------------||---------------||---------------||---------------|Level Of Service Module:2Way95thQ: xxxx xxxx xxxxx xxxx xxxx 2.2 xxxx xxxx xxxxx xxxx xxxx xxxxx Control Del:xxxxx xxxx xxxxx xxxxx xxxx 98.2 xxxxx xxxx xxxxx xxxxx xxxx xxxxx LOS by Move: * * * * * F * * * * * * Movement: LT - LTR - RT LT - LTR - RT LT - LTR - RT LT - LTR - RT Shared Cap.: xxxx xxxx xxxxx xxxx xxxx xxxxx xxxx xxxx xxxxx xxxx xxxx xxxxx SharedQueue:xxxxx xxxx xxxxx xxxxx xxxx xxxxx xxxxx xxxx xxxxx xxxxx xxxx xxxxx Shrd ConDel:xxxxx xxxx xxxxx xxxxx xxxx xxxxx xxxxx xxxx xxxxx xxxxx xxxx xxxxx Shared LOS: * * * * * * * * * * * * ApproachDel: xxxxxx 98.2 xxxxxx xxxxxxApproachLOS: * F * * ********************************************************************************Note: Queue reported is the number of cars per lane.********************************************************************************

CP(C)_PM Tue Nov 6, 2007 12:05:22 Page 8-1 ---------------------------------------------------------------------------------------------------------------------------------------------------------------- Level Of Service Computation Report 2000 HCM Operations Method (Base Volume Alternative) ********************************************************************************Intersection #6 Queen Kaahumanu Hwy / Makala Blvd ********************************************************************************Cycle (sec): 100 Critical Vol./Cap.(X): 0.801Loss Time (sec): 10 (Y+R=4.0 sec) Average Delay (sec/veh): 24.8Optimal Cycle: 72 Level Of Service: C********************************************************************************Street Name: Queen Kaahumanu Hwy Makala Blvd Approach: North Bound South Bound East Bound West Bound Movement: L - T - R L - T - R L - T - R L - T - R ------------|---------------||---------------||---------------||---------------|Control: Prot+Permit Prot+Permit Prot+Permit Prot+Permit Rights: Ovl Ovl Include Include Min. Green: 0 0 0 0 0 0 0 0 0 0 0 0 Lanes: 1 0 2 0 1 1 0 2 0 1 1 0 0 1 0 1 0 0 1 0 ------------|---------------||---------------||---------------||---------------|Volume Module:Base Vol: 14 735 80 86 1245 294 417 126 41 21 71 104 Growth Adj: 1.00 1.00 1.00 1.00 1.00 1.00 1.00 1.00 1.00 1.00 1.00 1.00 Initial Bse: 14 735 80 86 1245 294 417 126 41 21 71 104 User Adj: 1.00 1.00 1.00 1.00 1.00 1.00 1.00 1.00 1.00 1.00 1.00 1.00 PHF Adj: 0.95 0.95 0.95 0.95 0.95 0.95 0.95 0.95 0.95 0.95 0.95 0.95 PHF Volume: 15 774 84 91 1311 309 439 133 43 22 75 109 Reduct Vol: 0 0 0 0 0 0 0 0 0 0 0 0 Reduced Vol: 15 774 84 91 1311 309 439 133 43 22 75 109 PCE Adj: 1.00 1.00 1.00 1.00 1.00 1.00 1.00 1.00 1.00 1.00 1.00 1.00 MLF Adj: 1.00 1.00 1.00 1.00 1.00 1.00 1.00 1.00 1.00 1.00 1.00 1.00 FinalVolume: 15 774 84 91 1311 309 439 133 43 22 75 109 ------------|---------------||---------------||---------------||---------------|Saturation Flow Module:Sat/Lane: 1900 1900 1900 1900 1900 1900 1900 1900 1900 1900 1900 1900 Adjustment: 0.95 0.95 0.85 0.95 0.95 0.85 0.95 0.96 0.96 0.95 0.91 0.91 Lanes: 1.00 2.00 1.00 1.00 2.00 1.00 1.00 0.75 0.25 1.00 0.41 0.59 Final Sat.: 1805 3610 1615 1805 3610 1615 1805 1380 449 1805 702 1029 ------------|---------------||---------------||---------------||---------------|Capacity Analysis Module:Vol/Sat: 0.01 0.21 0.05 0.05 0.36 0.19 0.24 0.10 0.10 0.01 0.11 0.11 Crit Moves: **** **** **** **** Green/Cycle: 0.39 0.38 0.42 0.48 0.45 0.76 0.46 0.39 0.39 0.18 0.13 0.13 Volume/Cap: 0.16 0.57 0.12 0.30 0.80 0.25 0.71 0.25 0.25 0.09 0.80 0.80 Uniform Del: 21.9 24.8 17.4 15.7 23.5 3.7 19.9 20.8 20.8 33.9 42.1 42.1 IncremntDel: 0.8 0.6 0.1 0.6 2.9 0.1 3.7 0.2 0.2 0.2 17.9 17.9 InitQueuDel: 0.0 0.0 0.0 0.0 0.0 0.0 0.0 0.0 0.0 0.0 0.0 0.0 Delay Adj: 1.00 1.00 1.00 1.00 1.00 1.00 1.00 1.00 1.00 1.00 1.00 1.00 Delay/Veh: 22.7 25.4 17.5 16.3 26.4 3.8 23.6 21.0 21.0 34.0 60.0 60.0 User DelAdj: 1.00 1.00 1.00 1.00 1.00 1.00 1.00 1.00 1.00 1.00 1.00 1.00 AdjDel/Veh: 22.7 25.4 17.5 16.3 26.4 3.8 23.6 21.0 21.0 34.0 60.0 60.0 LOS by Move: C C B B C A C C C C E E HCM2kAvgQ: 0 10 2 2 20 3 12 4 4 1 8 8 ********************************************************************************Note: Queue reported is the number of cars per lane.********************************************************************************

CP(C)_PM Tue Nov 6, 2007 12:05:22 Page 9-1 ---------------------------------------------------------------------------------------------------------------------------------------------------------------- Level Of Service Computation Report 2000 HCM Unsignalized Method (Base Volume Alternative) ********************************************************************************Intersection #7 Ane Keohokahole/Main Gate ********************************************************************************Average Delay (sec/veh): 186.4 Worst Case Level Of Service: F[667.6]********************************************************************************Street Name: Ane Keohokahole Hwy Main Gate Approach: North Bound South Bound East Bound West Bound Movement: L - T - R L - T - R L - T - R L - T - R ------------|---------------||---------------||---------------||---------------|Control: Uncontrolled Uncontrolled Stop Sign Stop Sign Rights: Include Include Include Include Lanes: 0 0 1 0 1 1 0 1 0 0 0 0 0 0 0 1 0 0 0 1 ------------|---------------||---------------||---------------||---------------|Volume Module:Base Vol: 0 445 438 292 338 0 0 0 0 325 0 253 Growth Adj: 1.00 1.00 1.00 1.00 1.00 1.00 1.00 1.00 1.00 1.00 1.00 1.00 Initial Bse: 0 445 438 292 338 0 0 0 0 325 0 253 User Adj: 1.00 1.00 1.00 1.00 1.00 1.00 1.00 1.00 1.00 1.00 1.00 1.00 PHF Adj: 0.95 0.95 0.95 0.95 0.95 0.95 0.95 0.95 0.95 0.95 0.95 0.95 PHF Volume: 0 468 461 307 356 0 0 0 0 342 0 266 Reduct Vol: 0 0 0 0 0 0 0 0 0 0 0 0 FinalVolume: 0 468 461 307 356 0 0 0 0 342 0 266 ------------|---------------||---------------||---------------||---------------|Critical Gap Module:Critical Gp:xxxxx xxxx xxxxx 4.1 xxxx xxxxx xxxxx xxxx xxxxx 6.4 xxxx 6.2 FollowUpTim:xxxxx xxxx xxxxx 2.2 xxxx xxxxx xxxxx xxxx xxxxx 3.5 xxxx 3.3 ------------|---------------||---------------||---------------||---------------|Capacity Module:Cnflict Vol: xxxx xxxx xxxxx 929 xxxx xxxxx xxxx xxxx xxxxx 1439 xxxx 468 Potent Cap.: xxxx xxxx xxxxx 744 xxxx xxxxx xxxx xxxx xxxxx 148 xxxx 599 Move Cap.: xxxx xxxx xxxxx 744 xxxx xxxxx xxxx xxxx xxxxx 100 xxxx 599 Volume/Cap: xxxx xxxx xxxx 0.41 xxxx xxxx xxxx xxxx xxxx 3.41 xxxx 0.44 ------------|---------------||---------------||---------------||---------------|Level Of Service Module:2Way95thQ: xxxx xxxx xxxxx 2.0 xxxx xxxxx xxxx xxxx xxxxx 34.0 xxxx 2.3 Control Del:xxxxx xxxx xxxxx 13.2 xxxx xxxxx xxxxx xxxx xxxxx 1175 xxxx 15.7 LOS by Move: * * * B * * * * * F * C Movement: LT - LTR - RT LT - LTR - RT LT - LTR - RT LT - LTR - RT Shared Cap.: xxxx xxxx xxxxx xxxx xxxx xxxxx xxxx xxxx xxxxx xxxx xxxx xxxxx SharedQueue:xxxxx xxxx xxxxx xxxxx xxxx xxxxx xxxxx xxxx xxxxx xxxxx xxxx xxxxx Shrd ConDel:xxxxx xxxx xxxxx xxxxx xxxx xxxxx xxxxx xxxx xxxxx xxxxx xxxx xxxxx Shared LOS: * * * * * * * * * * * * ApproachDel: xxxxxx xxxxxx xxxxxx 667.6ApproachLOS: * * * F ********************************************************************************Note: Queue reported is the number of cars per lane.********************************************************************************

CP(C)_PM Tue Nov 6, 2007 12:05:22 Page 10-1 ---------------------------------------------------------------------------------------------------------------------------------------------------------------- Level Of Service Computation Report 2000 HCM Operations Method (Base Volume Alternative) ********************************************************************************Intersection #8 Palihiolo St/Palani Rd ********************************************************************************Cycle (sec): 100 Critical Vol./Cap.(X): 1.914Loss Time (sec): 10 (Y+R=4.0 sec) Average Delay (sec/veh): 215.1Optimal Cycle: 180 Level Of Service: F********************************************************************************Street Name: Palihiolo St Palani Rd Approach: North Bound South Bound East Bound West Bound Movement: L - T - R L - T - R L - T - R L - T - R ------------|---------------||---------------||---------------||---------------|Control: Permitted Permitted Prot+Permit Permitted Rights: Include Include Include Ignore Min. Green: 0 0 0 0 0 0 0 0 0 0 0 0 Lanes: 0 1 0 0 1 1 0 0 1 0 1 0 0 1 0 1 0 1 0 1 ------------|---------------||---------------||---------------||---------------|Volume Module:Base Vol: 4 19 26 2 4 614 506 753 13 49 1362 23 Growth Adj: 1.00 1.00 1.00 1.00 1.00 1.00 1.00 1.00 1.00 1.00 1.00 1.00 Initial Bse: 4 19 26 2 4 614 506 753 13 49 1362 23 User Adj: 1.00 1.00 1.00 1.00 1.00 1.00 1.00 1.00 1.00 1.00 1.00 0.00 PHF Adj: 0.95 0.95 0.95 0.95 0.95 0.95 0.95 0.95 0.95 0.95 0.95 0.00 PHF Volume: 4 20 27 2 4 646 533 793 14 52 1434 0 Reduct Vol: 0 0 0 0 0 0 0 0 0 0 0 0 Reduced Vol: 4 20 27 2 4 646 533 793 14 52 1434 0 PCE Adj: 1.00 1.00 1.00 1.00 1.00 1.00 1.00 1.00 1.00 1.00 1.00 0.00 MLF Adj: 1.00 1.00 1.00 1.00 1.00 1.00 1.00 1.00 1.00 1.00 1.00 0.00 FinalVolume: 4 20 27 2 4 646 533 793 14 52 1434 0 ------------|---------------||---------------||---------------||---------------|Saturation Flow Module:Sat/Lane: 1900 1900 1900 1900 1900 1900 1900 1900 1900 1900 1900 1900 Adjustment: 0.67 0.67 0.85 0.75 0.85 0.85 0.21 1.00 1.00 0.95 1.00 1.00 Lanes: 0.17 0.83 1.00 1.00 0.01 0.99 1.00 0.98 0.02 1.00 1.00 1.00 Final Sat.: 222 1055 1615 1423 10 1606 404 1862 32 1805 1900 1900 ------------|---------------||---------------||---------------||---------------|Capacity Analysis Module:Vol/Sat: 0.02 0.02 0.02 0.00 0.40 0.40 1.32 0.43 0.43 0.03 0.75 0.00 Crit Moves: **** **** Green/Cycle: 0.25 0.25 0.25 0.25 0.25 0.25 0.61 0.61 0.61 0.04 0.47 0.00 Volume/Cap: 0.08 0.08 0.07 0.01 1.61 1.61 1.31 0.70 0.70 0.70 1.61 0.00 Uniform Del: 28.7 28.7 28.7 28.2 37.5 37.5 9.8 13.3 13.3 47.3 26.6 0.0 IncremntDel: 0.1 0.1 0.1 0.0 287 287.3 156.8 1.9 1.9 25.5 281 0.0 InitQueuDel: 0.0 0.0 0.0 0.0 0.0 0.0 0.0 0.0 0.0 0.0 0.0 0.0 Delay Adj: 1.00 1.00 1.00 1.00 1.00 1.00 1.00 1.00 1.00 1.00 1.00 0.00 Delay/Veh: 28.8 28.8 28.7 28.2 325 324.8 166.7 15.2 15.2 72.8 308 0.0 User DelAdj: 1.00 1.00 1.00 1.00 1.00 1.00 1.00 1.00 1.00 1.00 1.00 1.00 AdjDel/Veh: 28.8 28.8 28.7 28.2 325 324.8 166.7 15.2 15.2 72.8 308 0.0 LOS by Move: C C C C F F F B B E F A HCM2kAvgQ: 1 1 1 0 51 51 34 17 17 3 110 0 ********************************************************************************Note: Queue reported is the number of cars per lane.********************************************************************************

CP(C)_PM Tue Nov 6, 2007 12:05:22 Page 11-1 ---------------------------------------------------------------------------------------------------------------------------------------------------------------- Level Of Service Computation Report 2000 HCM Unsignalized Method (Base Volume Alternative) ********************************************************************************Intersection #10 Palani Rd / Uluaoa St ********************************************************************************Average Delay (sec/veh): 11.8 Worst Case Level Of Service: F[241.5]********************************************************************************Street Name: Palani Rd Uluaoa St Approach: North Bound South Bound East Bound West Bound Movement: L - T - R L - T - R L - T - R L - T - R ------------|---------------||---------------||---------------||---------------|Control: Uncontrolled Uncontrolled Stop Sign Stop Sign Rights: Include Include Include Include Lanes: 0 1 0 0 0 0 0 0 1 0 1 0 0 0 1 0 0 0 0 0 ------------|---------------||---------------||---------------||---------------|Volume Module:Base Vol: 29 762 0 0 1061 177 71 0 32 0 0 0 Growth Adj: 1.00 1.00 1.00 1.00 1.00 1.00 1.00 1.00 1.00 1.00 1.00 1.00 Initial Bse: 29 762 0 0 1061 177 71 0 32 0 0 0 User Adj: 1.00 1.00 1.00 1.00 1.00 1.00 1.00 1.00 1.00 1.00 1.00 1.00 PHF Adj: 0.95 0.95 0.95 0.95 0.95 0.95 0.95 0.95 0.95 0.95 0.95 0.95 PHF Volume: 31 802 0 0 1117 186 75 0 34 0 0 0 Reduct Vol: 0 0 0 0 0 0 0 0 0 0 0 0 FinalVolume: 31 802 0 0 1117 186 75 0 34 0 0 0 ------------|---------------||---------------||---------------||---------------|Critical Gap Module:Critical Gp: 4.1 xxxx xxxxx xxxxx xxxx xxxxx 6.4 xxxx 6.2 xxxxx xxxx xxxxx FollowUpTim: 2.2 xxxx xxxxx xxxxx xxxx xxxxx 3.5 xxxx 3.3 xxxxx xxxx xxxxx ------------|---------------||---------------||---------------||---------------|Capacity Module:Cnflict Vol: 1303 xxxx xxxxx xxxx xxxx xxxxx 2073 xxxx 1210 xxxx xxxx xxxxx Potent Cap.: 538 xxxx xxxxx xxxx xxxx xxxxx 60 xxxx 225 xxxx xxxx xxxxx Move Cap.: 538 xxxx xxxxx xxxx xxxx xxxxx 57 xxxx 225 xxxx xxxx xxxxx Volume/Cap: 0.06 xxxx xxxx xxxx xxxx xxxx 1.30 xxxx 0.15 xxxx xxxx xxxx ------------|---------------||---------------||---------------||---------------|Level Of Service Module:2Way95thQ: 0.2 xxxx xxxxx xxxx xxxx xxxxx 6.5 xxxx 0.5 xxxx xxxx xxxxx Control Del: 12.1 xxxx xxxxx xxxxx xxxx xxxxx 339.7 xxxx 23.8 xxxxx xxxx xxxxx LOS by Move: B * * * * * F * C * * * Movement: LT - LTR - RT LT - LTR - RT LT - LTR - RT LT - LTR - RT Shared Cap.: xxxx xxxx xxxxx xxxx xxxx xxxxx xxxx xxxx xxxxx xxxx xxxx xxxxx SharedQueue: 0.2 xxxx xxxxx xxxxx xxxx xxxxx xxxxx xxxx xxxxx xxxxx xxxx xxxxx Shrd ConDel: 12.1 xxxx xxxxx xxxxx xxxx xxxxx xxxxx xxxx xxxxx xxxxx xxxx xxxxx Shared LOS: B * * * * * * * * * * * ApproachDel: xxxxxx xxxxxx 241.5 xxxxxxApproachLOS: * * F * ********************************************************************************Note: Queue reported is the number of cars per lane.********************************************************************************

CP(C)_PM Tue Nov 6, 2007 12:05:22 Page 12-1 ---------------------------------------------------------------------------------------------------------------------------------------------------------------- Level Of Service Computation Report 2000 HCM Operations Method (Base Volume Alternative) ********************************************************************************Intersection #11 Queen Kaahumanu Hwy / Kealakehe Pkwy ********************************************************************************Cycle (sec): 100 Critical Vol./Cap.(X): 0.832Loss Time (sec): 10 (Y+R=4.0 sec) Average Delay (sec/veh): 26.3Optimal Cycle: 80 Level Of Service: C********************************************************************************Street Name: Queen Kaahumanu Hwy Kaalakehe Pkwy Approach: North Bound South Bound East Bound West Bound Movement: L - T - R L - T - R L - T - R L - T - R ------------|---------------||---------------||---------------||---------------|Control: Prot+Permit Prot+Permit Permitted Permitted Rights: Ovl Ovl Ovl Ovl Min. Green: 0 0 0 0 0 0 0 0 0 0 0 0 Lanes: 1 0 2 0 1 1 0 2 0 1 0 1 0 0 1 0 1 0 0 1 ------------|---------------||---------------||---------------||---------------|Volume Module:Base Vol: 66 1097 239 201 1071 232 106 97 67 242 66 168 Growth Adj: 1.00 1.00 1.00 1.00 1.00 1.00 1.00 1.00 1.00 1.00 1.00 1.00 Initial Bse: 66 1097 239 201 1071 232 106 97 67 242 66 168 User Adj: 1.00 1.00 1.00 1.00 1.00 1.00 1.00 1.00 1.00 1.00 1.00 1.00 PHF Adj: 0.95 0.95 0.95 0.95 0.95 0.95 0.95 0.95 0.95 0.95 0.95 0.95 PHF Volume: 69 1155 252 212 1127 244 112 102 71 255 69 177 Reduct Vol: 0 0 0 0 0 0 0 0 0 0 0 0 Reduced Vol: 69 1155 252 212 1127 244 112 102 71 255 69 177 PCE Adj: 1.00 1.00 1.00 1.00 1.00 1.00 1.00 1.00 1.00 1.00 1.00 1.00 MLF Adj: 1.00 1.00 1.00 1.00 1.00 1.00 1.00 1.00 1.00 1.00 1.00 1.00 FinalVolume: 69 1155 252 212 1127 244 112 102 71 255 69 177 ------------|---------------||---------------||---------------||---------------|Saturation Flow Module:Sat/Lane: 1900 1900 1900 1900 1900 1900 1900 1900 1900 1900 1900 1900 Adjustment: 0.95 0.95 0.85 0.95 0.95 0.85 0.53 0.53 0.85 0.55 0.55 0.85 Lanes: 1.00 2.00 1.00 1.00 2.00 1.00 0.52 0.48 1.00 0.79 0.21 1.00 Final Sat.: 1805 3610 1615 1805 3610 1615 526 481 1615 818 223 1615 ------------|---------------||---------------||---------------||---------------|Capacity Analysis Module:Vol/Sat: 0.04 0.32 0.16 0.12 0.31 0.15 0.21 0.21 0.04 0.31 0.31 0.11 Crit Moves: **** **** **** Green/Cycle: 0.44 0.38 0.38 0.56 0.47 0.47 0.37 0.37 0.43 0.37 0.37 0.52 Volume/Cap: 0.32 0.83 0.41 0.64 0.67 0.32 0.57 0.57 0.10 0.83 0.83 0.21 Uniform Del: 17.4 27.8 22.4 20.8 20.6 16.7 24.8 24.8 16.9 28.4 28.4 13.2 IncremntDel: 0.8 4.4 0.4 4.2 1.0 0.3 2.0 2.0 0.1 14.1 14.1 0.1 InitQueuDel: 0.0 0.0 0.0 0.0 0.0 0.0 0.0 0.0 0.0 0.0 0.0 0.0 Delay Adj: 1.00 1.00 1.00 1.00 1.00 1.00 1.00 1.00 1.00 1.00 1.00 1.00 Delay/Veh: 18.2 32.3 22.9 25.1 21.6 16.9 26.9 26.9 16.9 42.5 42.5 13.3 User DelAdj: 1.00 1.00 1.00 1.00 1.00 1.00 1.00 1.00 1.00 1.00 1.00 1.00 AdjDel/Veh: 18.2 32.3 22.9 25.1 21.6 16.9 26.9 26.9 16.9 42.5 42.5 13.3 LOS by Move: B C C C C B C C B D D B HCM2kAvgQ: 2 19 6 6 15 5 6 6 1 12 12 3 ********************************************************************************Note: Queue reported is the number of cars per lane.********************************************************************************

CP(C)_PM Tue Nov 6, 2007 12:05:22 Page 13-1 ---------------------------------------------------------------------------------------------------------------------------------------------------------------- Level Of Service Computation Report 2000 HCM Unsignalized Method (Base Volume Alternative) ********************************************************************************Intersection #12 Ane Keohokalole Hwy / Kealakehe Pkwy ********************************************************************************Average Delay (sec/veh): OVERFLOW Worst Case Level Of Service: F[xxxxx]********************************************************************************Street Name: Ane Keohokalole Hwy Kealakehe Pkwy Approach: North Bound South Bound East Bound West Bound Movement: L - T - R L - T - R L - T - R L - T - R ------------|---------------||---------------||---------------||---------------|Control: Stop Sign Stop Sign Uncontrolled UncontrolledRights: Include Include Include Include Lanes: 1 0 1 0 1 1 0 0 1 0 1 0 1 1 0 1 0 1 0 1 ------------|---------------||---------------||---------------||---------------|Volume Module:Base Vol: 222 396 0 50 354 369 165 194 271 5 128 23 Growth Adj: 1.00 1.00 1.00 1.00 1.00 1.00 1.00 1.00 1.00 1.00 1.00 1.00 Initial Bse: 222 396 0 50 354 369 165 194 271 5 128 23 User Adj: 1.00 1.00 1.00 1.00 1.00 1.00 1.00 1.00 1.00 1.00 1.00 1.00 PHF Adj: 0.95 0.95 0.95 0.95 0.95 0.95 0.95 0.95 0.95 0.95 0.95 0.95 PHF Volume: 234 417 0 53 373 388 174 204 285 5 135 24 Reduct Vol: 0 0 0 0 0 0 0 0 0 0 0 0 FinalVolume: 234 417 0 53 373 388 174 204 285 5 135 24 ------------|---------------||---------------||---------------||---------------|Critical Gap Module:Critical Gp: 7.1 6.5 6.2 7.1 6.5 6.2 4.1 xxxx xxxxx 4.1 xxxx xxxxx FollowUpTim: 3.5 4.0 3.3 3.5 4.0 3.3 2.2 xxxx xxxxx 2.2 xxxx xxxxx ------------|---------------||---------------||---------------||---------------|Capacity Module:Cnflict Vol: 1232 864 245 803 982 135 159 xxxx xxxxx 489 xxxx xxxxx Potent Cap.: 155 294 799 304 251 920 1433 xxxx xxxxx 1084 xxxx xxxxx Move Cap.: 0 257 799 0 220 920 1433 xxxx xxxxx 1084 xxxx xxxxx Volume/Cap: xxxx 1.62 0.00 xxxx 1.70 0.42 0.12 xxxx xxxx 0.00 xxxx xxxx ------------|---------------||---------------||---------------||---------------|Level Of Service Module:2Way95thQ: xxxx 26.0 xxxxx xxxx xxxx xxxxx 0.4 xxxx xxxxx 0.0 xxxx xxxxx Control Del:xxxxx 330 xxxxx xxxxx xxxx xxxxx 7.9 xxxx xxxxx 8.3 xxxx xxxxx LOS by Move: * F * * * * A * * A * * Movement: LT - LTR - RT LT - LTR - RT LT - LTR - RT LT - LTR - RT Shared Cap.: xxxx xxxx xxxxx xxxx xxxx 359 xxxx xxxx xxxxx xxxx xxxx xxxxx SharedQueue:xxxxx xxxx xxxxx xxxxx xxxx 55.4 xxxxx xxxx xxxxx xxxxx xxxx xxxxx Shrd ConDel:xxxxx xxxx xxxxx xxxxx xxxx 537.2 xxxxx xxxx xxxxx xxxxx xxxx xxxxx Shared LOS: * * * * * F * * * * * * ApproachDel: xxxxxx xxxxxx xxxxxx xxxxxxApproachLOS: F F * * ********************************************************************************Note: Queue reported is the number of cars per lane.********************************************************************************

CUMULATIVE PLUS PROJECT CONDITIONS WITH MITIGATION – CONCEPT A

MIT_CP(A)_AM Tue Nov 6, 2007 12:28:02 Page 5-1 ---------------------------------------------------------------------------------------------------------------------------------------------------------------- Level Of Service Computation Report 2000 HCM Operations Method (Base Volume Alternative) ********************************************************************************Intersection #3 Kamakaeha Ave / Palani Rd ********************************************************************************Cycle (sec): 100 Critical Vol./Cap.(X): 0.558Loss Time (sec): 10 (Y+R=4.0 sec) Average Delay (sec/veh): 4.8Optimal Cycle: 40 Level Of Service: A********************************************************************************Street Name: Kamakaeha Ave Palani Rd Approach: North Bound South Bound East Bound West Bound Movement: L - T - R L - T - R L - T - R L - T - R ------------|---------------||---------------||---------------||---------------|Control: Permitted Permitted Permitted Permitted Rights: Include Include Include Ignore Min. Green: 0 0 0 0 0 0 0 0 0 0 0 0 Lanes: 0 0 0 0 0 1 0 0 0 1 0 0 1 0 0 0 0 1 0 1 ------------|---------------||---------------||---------------||---------------|Volume Module:Base Vol: 0 0 0 47 0 15 0 404 0 0 846 240 Growth Adj: 1.00 1.00 1.00 1.00 1.00 1.00 1.00 1.00 1.00 1.00 1.00 1.00 Initial Bse: 0 0 0 47 0 15 0 404 0 0 846 240 User Adj: 1.00 1.00 1.00 1.00 1.00 1.00 1.00 1.00 1.00 1.00 1.00 0.00 PHF Adj: 0.95 0.95 0.95 0.95 0.95 0.95 0.95 0.95 0.95 0.95 0.95 0.00 PHF Volume: 0 0 0 49 0 16 0 425 0 0 891 0 Reduct Vol: 0 0 0 0 0 0 0 0 0 0 0 0 Reduced Vol: 0 0 0 49 0 16 0 425 0 0 891 0 PCE Adj: 1.00 1.00 1.00 1.00 1.00 1.00 1.00 1.00 1.00 1.00 1.00 0.00 MLF Adj: 1.00 1.00 1.00 1.00 1.00 1.00 1.00 1.00 1.00 1.00 1.00 0.00 FinalVolume: 0 0 0 49 0 16 0 425 0 0 891 0 ------------|---------------||---------------||---------------||---------------|Saturation Flow Module:Sat/Lane: 1900 1900 1900 1900 1900 1900 1900 1900 1900 1900 1900 1900 Adjustment: 1.00 1.00 1.00 0.77 1.00 0.85 1.00 1.00 1.00 1.00 1.00 1.00 Lanes: 0.00 0.00 0.00 1.00 0.00 1.00 0.00 1.00 0.00 0.00 1.00 1.00 Final Sat.: 0 0 0 1461 0 1615 0 1900 0 0 1900 1900 ------------|---------------||---------------||---------------||---------------|Capacity Analysis Module:Vol/Sat: 0.00 0.00 0.00 0.03 0.00 0.01 0.00 0.22 0.00 0.00 0.47 0.00 Crit Moves: **** **** Green/Cycle: 0.00 0.00 0.00 0.06 0.00 0.06 0.00 0.84 0.00 0.00 0.84 0.00 Volume/Cap: 0.00 0.00 0.00 0.56 0.00 0.16 0.00 0.27 0.00 0.00 0.56 0.00 Uniform Del: 0.0 0.0 0.0 45.7 0.0 44.6 0.0 1.7 0.0 0.0 2.4 0.0 IncremntDel: 0.0 0.0 0.0 7.7 0.0 0.8 0.0 0.1 0.0 0.0 0.4 0.0 InitQueuDel: 0.0 0.0 0.0 0.0 0.0 0.0 0.0 0.0 0.0 0.0 0.0 0.0 Delay Adj: 0.00 0.00 0.00 1.00 0.00 1.00 0.00 1.00 0.00 0.00 1.00 0.00 Delay/Veh: 0.0 0.0 0.0 53.4 0.0 45.3 0.0 1.8 0.0 0.0 2.9 0.0 User DelAdj: 1.00 1.00 1.00 1.00 1.00 1.00 1.00 1.00 1.00 1.00 1.00 1.00 AdjDel/Veh: 0.0 0.0 0.0 53.4 0.0 45.3 0.0 1.8 0.0 0.0 2.9 0.0 LOS by Move: A A A D A D A A A A A A HCM2kAvgQ: 0 0 0 2 0 1 0 3 0 0 9 0 ********************************************************************************Note: Queue reported is the number of cars per lane.********************************************************************************

MIT_CP(A)_AM Tue Nov 6, 2007 12:28:02 Page 6-1 ---------------------------------------------------------------------------------------------------------------------------------------------------------------- Level Of Service Computation Report 2000 HCM Operations Method (Base Volume Alternative) ********************************************************************************Intersection #4 Henry St / Palani Rd ********************************************************************************Cycle (sec): 100 Critical Vol./Cap.(X): 0.833Loss Time (sec): 10 (Y+R=4.0 sec) Average Delay (sec/veh): 32.4Optimal Cycle: 76 Level Of Service: C********************************************************************************Street Name: Henry St Palani Rd Approach: North Bound South Bound East Bound West Bound Movement: L - T - R L - T - R L - T - R L - T - R ------------|---------------||---------------||---------------||---------------|Control: Permitted Permitted Permitted Prot+Permit Rights: Ovl Include Include Include Min. Green: 0 0 0 0 0 0 0 0 0 0 0 0 Lanes: 1 0 1 1 0 1 0 1 1 0 1 0 0 1 0 2 0 1 1 0 ------------|---------------||---------------||---------------||---------------|Volume Module:Base Vol: 122 404 454 86 492 288 237 185 37 927 810 90 Growth Adj: 1.00 1.00 1.00 1.00 1.00 1.00 1.00 1.00 1.00 1.00 1.00 1.00 Initial Bse: 122 404 454 86 492 288 237 185 37 927 810 90 User Adj: 1.00 1.00 1.00 1.00 1.00 1.00 1.00 1.00 1.00 1.00 1.00 1.00 PHF Adj: 0.95 0.95 0.95 0.95 0.95 0.95 0.95 0.95 0.95 0.95 0.95 0.95 PHF Volume: 128 425 478 91 518 303 249 195 39 976 853 95 Reduct Vol: 0 0 0 0 0 0 0 0 0 0 0 0 Reduced Vol: 128 425 478 91 518 303 249 195 39 976 853 95 PCE Adj: 1.00 1.00 1.00 1.00 1.00 1.00 1.00 1.00 1.00 1.00 1.00 1.00 MLF Adj: 1.00 1.00 1.00 1.00 1.00 1.00 1.00 1.00 1.00 1.00 1.00 1.00 FinalVolume: 128 425 478 91 518 303 249 195 39 976 853 95 ------------|---------------||---------------||---------------||---------------|Saturation Flow Module:Sat/Lane: 1900 1900 1900 1900 1900 1900 1900 1900 1900 1900 1900 1900 Adjustment: 0.20 0.87 0.87 0.17 0.90 0.90 0.95 0.98 0.98 0.92 0.94 0.94 Lanes: 1.00 1.00 1.00 1.00 1.26 0.74 1.00 0.83 0.17 2.00 1.80 0.20 Final Sat.: 386 1662 1662 321 2152 1260 1805 1544 309 3502 3200 356 ------------|---------------||---------------||---------------||---------------|Capacity Analysis Module:Vol/Sat: 0.33 0.26 0.29 0.28 0.24 0.24 0.14 0.13 0.13 0.28 0.27 0.27 Crit Moves: **** **** **** Green/Cycle: 0.41 0.41 0.75 0.41 0.41 0.41 0.17 0.15 0.15 0.33 0.33 0.33 Volume/Cap: 0.82 0.63 0.39 0.69 0.59 0.59 0.82 0.82 0.82 0.85 0.82 0.82 Uniform Del: 26.4 23.7 4.5 24.6 23.2 23.2 40.1 41.0 41.0 31.6 31.0 31.0 IncremntDel: 27.7 0.9 0.1 15.0 0.7 0.7 15.9 16.9 16.9 6.1 4.7 4.7 InitQueuDel: 0.0 0.0 0.0 0.0 0.0 0.0 0.0 0.0 0.0 0.0 0.0 0.0 Delay Adj: 1.00 1.00 1.00 1.00 1.00 1.00 1.00 1.00 1.00 1.00 1.00 1.00 Delay/Veh: 54.1 24.6 4.6 39.5 23.9 23.9 56.0 57.9 57.9 37.6 35.8 35.8 User DelAdj: 1.00 1.00 1.00 1.00 1.00 1.00 1.00 1.00 1.00 1.00 1.00 1.00 AdjDel/Veh: 54.1 24.6 4.6 39.5 23.9 23.9 56.0 57.9 57.9 37.6 35.8 35.8 LOS by Move: D C A D C C E E E D D D HCM2kAvgQ: 6 12 6 4 11 11 10 9 9 17 16 16 ********************************************************************************Note: Queue reported is the number of cars per lane.********************************************************************************

MIT_CP(A)_AM Tue Nov 6, 2007 12:28:02 Page 9-1 ---------------------------------------------------------------------------------------------------------------------------------------------------------------- Level Of Service Computation Report 2000 HCM Operations Method (Base Volume Alternative) ********************************************************************************Intersection #7 Ane Keohokahole/Main Gate ********************************************************************************Cycle (sec): 100 Critical Vol./Cap.(X): 0.579Loss Time (sec): 10 (Y+R=4.0 sec) Average Delay (sec/veh): 15.9Optimal Cycle: 42 Level Of Service: B********************************************************************************Street Name: Ane Keohokahole Hwy Main Gate Approach: North Bound South Bound East Bound West Bound Movement: L - T - R L - T - R L - T - R L - T - R ------------|---------------||---------------||---------------||---------------|Control: Permitted Permitted Permitted Permitted Rights: Include Include Include Include Min. Green: 0 0 0 0 0 0 0 0 0 0 0 0 Lanes: 0 0 1 0 1 1 0 1 0 0 0 0 0 0 0 1 0 0 0 1 ------------|---------------||---------------||---------------||---------------|Volume Module:Base Vol: 0 447 284 189 620 0 0 0 0 246 0 191 Growth Adj: 1.00 1.00 1.00 1.00 1.00 1.00 1.00 1.00 1.00 1.00 1.00 1.00 Initial Bse: 0 447 284 189 620 0 0 0 0 246 0 191 User Adj: 1.00 1.00 1.00 1.00 1.00 1.00 1.00 1.00 1.00 1.00 1.00 1.00 PHF Adj: 0.95 0.95 0.95 0.95 0.95 0.95 0.95 0.95 0.95 0.95 0.95 0.95 PHF Volume: 0 471 299 199 653 0 0 0 0 259 0 201 Reduct Vol: 0 0 0 0 0 0 0 0 0 0 0 0 Reduced Vol: 0 471 299 199 653 0 0 0 0 259 0 201 PCE Adj: 1.00 1.00 1.00 1.00 1.00 1.00 1.00 1.00 1.00 1.00 1.00 1.00 MLF Adj: 1.00 1.00 1.00 1.00 1.00 1.00 1.00 1.00 1.00 1.00 1.00 1.00 FinalVolume: 0 471 299 199 653 0 0 0 0 259 0 201 ------------|---------------||---------------||---------------||---------------|Saturation Flow Module:Sat/Lane: 1900 1900 1900 1900 1900 1900 1900 1900 1900 1900 1900 1900 Adjustment: 1.00 1.00 0.85 0.41 1.00 1.00 1.00 1.00 1.00 0.77 1.00 0.85 Lanes: 0.00 1.00 1.00 1.00 1.00 0.00 0.00 0.00 0.00 1.00 0.00 1.00 Final Sat.: 0 1900 1615 783 1900 0 0 0 0 1461 0 1615 ------------|---------------||---------------||---------------||---------------|Capacity Analysis Module:Vol/Sat: 0.00 0.25 0.19 0.25 0.34 0.00 0.00 0.00 0.00 0.18 0.00 0.12 Crit Moves: **** **** Green/Cycle: 0.00 0.59 0.59 0.59 0.59 0.00 0.00 0.00 0.00 0.31 0.00 0.31 Volume/Cap: 0.00 0.42 0.31 0.43 0.58 0.00 0.00 0.00 0.00 0.58 0.00 0.41 Uniform Del: 0.0 11.0 10.1 11.1 12.6 0.0 0.0 0.0 0.0 29.2 0.0 27.5 IncremntDel: 0.0 0.3 0.2 0.6 0.8 0.0 0.0 0.0 0.0 1.9 0.0 0.5 InitQueuDel: 0.0 0.0 0.0 0.0 0.0 0.0 0.0 0.0 0.0 0.0 0.0 0.0 Delay Adj: 0.00 1.00 1.00 1.00 1.00 0.00 0.00 0.00 0.00 1.00 0.00 1.00 Delay/Veh: 0.0 11.2 10.3 11.7 13.3 0.0 0.0 0.0 0.0 31.1 0.0 28.0 User DelAdj: 1.00 1.00 1.00 1.00 1.00 1.00 1.00 1.00 1.00 1.00 1.00 1.00 AdjDel/Veh: 0.0 11.2 10.3 11.7 13.3 0.0 0.0 0.0 0.0 31.1 0.0 28.0 LOS by Move: A B B B B A A A A C A C HCM2kAvgQ: 0 8 5 4 13 0 0 0 0 7 0 5 ********************************************************************************Note: Queue reported is the number of cars per lane.********************************************************************************

MIT_CP(A)_AM Tue Nov 6, 2007 12:28:02 Page 10-1 ---------------------------------------------------------------------------------------------------------------------------------------------------------------- Level Of Service Computation Report 2000 HCM Operations Method (Base Volume Alternative) ********************************************************************************Intersection #8 Palihiolo St/Palani Rd ********************************************************************************Cycle (sec): 100 Critical Vol./Cap.(X): 0.982Loss Time (sec): 10 (Y+R=4.0 sec) Average Delay (sec/veh): 33.2Optimal Cycle: 173 Level Of Service: C********************************************************************************Street Name: Palihiolo St Palani Rd Approach: North Bound South Bound East Bound West Bound Movement: L - T - R L - T - R L - T - R L - T - R ------------|---------------||---------------||---------------||---------------|Control: Permitted Permitted Prot+Permit Permitted Rights: Include Ovl Include Ignore Min. Green: 0 0 0 0 0 0 0 0 0 0 0 0 Lanes: 0 1 0 0 1 1 0 0 1 0 2 0 0 1 0 1 0 1 1 0 ------------|---------------||---------------||---------------||---------------|Volume Module:Base Vol: 5 20 32 10 15 553 438 531 6 20 1317 56 Growth Adj: 1.00 1.00 1.00 1.00 1.00 1.00 1.00 1.00 1.00 1.00 1.00 1.00 Initial Bse: 5 20 32 10 15 553 438 531 6 20 1317 56 User Adj: 1.00 1.00 1.00 1.00 1.00 1.00 1.00 1.00 1.00 1.00 1.00 0.00 PHF Adj: 0.95 0.95 0.95 0.95 0.95 0.95 0.95 0.95 0.95 0.95 0.95 0.00 PHF Volume: 5 21 34 11 16 582 461 559 6 21 1386 0 Reduct Vol: 0 0 0 0 0 0 0 0 0 0 0 0 Reduced Vol: 5 21 34 11 16 582 461 559 6 21 1386 0 PCE Adj: 1.00 1.00 1.00 1.00 1.00 1.00 1.00 1.00 1.00 1.00 1.00 0.00 MLF Adj: 1.00 1.00 1.00 1.00 1.00 1.00 1.00 1.00 1.00 1.00 1.00 0.00 FinalVolume: 5 21 34 11 16 582 461 559 6 21 1386 0 ------------|---------------||---------------||---------------||---------------|Saturation Flow Module:Sat/Lane: 1900 1900 1900 1900 1900 1900 1900 1900 1900 1900 1900 1900 Adjustment: 0.90 0.90 0.85 0.75 0.85 0.85 0.92 1.00 1.00 0.95 0.95 0.95 Lanes: 0.20 0.80 1.00 1.00 0.03 0.97 2.00 0.99 0.01 1.00 2.00 0.00 Final Sat.: 341 1365 1615 1419 43 1580 3502 1875 21 1805 3610 0 ------------|---------------||---------------||---------------||---------------|Capacity Analysis Module:Vol/Sat: 0.02 0.02 0.02 0.01 0.37 0.37 0.13 0.30 0.30 0.01 0.38 0.00 Crit Moves: **** **** **** Green/Cycle: 0.38 0.38 0.38 0.38 0.38 0.51 0.51 0.51 0.51 0.02 0.39 0.00 Volume/Cap: 0.04 0.04 0.06 0.02 0.98 0.72 0.37 0.59 0.59 0.59 0.98 0.00 Uniform Del: 19.8 19.8 19.9 19.7 30.9 19.1 14.1 17.4 17.4 48.6 30.1 0.0 IncremntDel: 0.0 0.0 0.0 0.0 31.9 3.2 0.2 1.0 1.0 23.5 19.8 0.0 InitQueuDel: 0.0 0.0 0.0 0.0 0.0 0.0 0.0 0.0 0.0 0.0 0.0 0.0 Delay Adj: 1.00 1.00 1.00 1.00 1.00 1.00 1.00 1.00 1.00 1.00 1.00 0.00 Delay/Veh: 19.9 19.9 20.0 19.7 62.8 22.3 14.3 18.4 18.4 72.1 49.9 0.0 User DelAdj: 1.00 1.00 1.00 1.00 1.00 1.00 1.00 1.00 1.00 1.00 1.00 1.00 AdjDel/Veh: 19.9 19.9 20.0 19.7 62.8 22.3 14.3 18.4 18.4 72.1 49.9 0.0 LOS by Move: B B B B E C B B B E D A HCM2kAvgQ: 1 1 1 0 24 15 5 12 12 2 29 0 ********************************************************************************Note: Queue reported is the number of cars per lane.********************************************************************************

MIT_CP(A)_AM Tue Nov 6, 2007 12:28:02 Page 11-1 ---------------------------------------------------------------------------------------------------------------------------------------------------------------- Level Of Service Computation Report 2000 HCM Operations Method (Base Volume Alternative) ********************************************************************************Intersection #10 Palani Rd / Uluaoa St ********************************************************************************Cycle (sec): 100 Critical Vol./Cap.(X): 0.757Loss Time (sec): 0 (Y+R=4.0 sec) Average Delay (sec/veh): 13.9Optimal Cycle: 59 Level Of Service: B********************************************************************************Street Name: Palani Rd Uluaoa St Approach: North Bound South Bound East Bound West Bound Movement: L - T - R L - T - R L - T - R L - T - R ------------|---------------||---------------||---------------||---------------|Control: Permitted Permitted Permitted Permitted Rights: Include Include Include Include Min. Green: 0 0 0 0 0 0 0 0 0 0 0 0 Lanes: 0 1 0 0 0 0 0 0 1 0 1 0 0 0 1 0 0 0 0 0 ------------|---------------||---------------||---------------||---------------|Volume Module:Base Vol: 58 477 0 0 786 311 176 0 200 0 0 0 Growth Adj: 1.00 1.00 1.00 1.00 1.00 1.00 1.00 1.00 1.00 1.00 1.00 1.00 Initial Bse: 58 477 0 0 786 311 176 0 200 0 0 0 User Adj: 1.00 1.00 1.00 1.00 1.00 1.00 1.00 1.00 1.00 1.00 1.00 1.00 PHF Adj: 0.95 0.95 0.95 0.95 0.95 0.95 0.95 0.95 0.95 0.95 0.95 0.95 PHF Volume: 61 502 0 0 827 327 185 0 211 0 0 0 Reduct Vol: 0 0 0 0 0 0 0 0 0 0 0 0 Reduced Vol: 61 502 0 0 827 327 185 0 211 0 0 0 PCE Adj: 1.00 1.00 1.00 1.00 1.00 1.00 1.00 1.00 1.00 1.00 1.00 1.00 MLF Adj: 1.00 1.00 1.00 1.00 1.00 1.00 1.00 1.00 1.00 1.00 1.00 1.00 FinalVolume: 61 502 0 0 827 327 185 0 211 0 0 0 ------------|---------------||---------------||---------------||---------------|Saturation Flow Module:Sat/Lane: 1900 1900 1900 1900 1900 1900 1900 1900 1900 1900 1900 1900 Adjustment: 0.81 0.81 1.00 1.00 0.96 0.96 0.78 1.00 0.85 1.00 1.00 1.00 Lanes: 0.11 0.89 0.00 0.00 0.72 0.28 1.00 0.00 1.00 0.00 0.00 0.00 Final Sat.: 167 1376 0 0 1310 518 1480 0 1615 0 0 0 ------------|---------------||---------------||---------------||---------------|Capacity Analysis Module:Vol/Sat: 0.37 0.37 0.00 0.00 0.63 0.63 0.13 0.00 0.13 0.00 0.00 0.00 Crit Moves: **** **** Green/Cycle: 0.83 0.83 0.00 0.00 0.83 0.83 0.17 0.00 0.17 0.00 0.00 0.00 Volume/Cap: 0.44 0.44 0.00 0.00 0.76 0.76 0.76 0.00 0.79 0.00 0.00 0.00 Uniform Del: 2.2 2.2 0.0 0.0 3.7 3.7 39.8 0.0 40.1 0.0 0.0 0.0 IncremntDel: 0.2 0.2 0.0 0.0 2.2 2.2 12.7 0.0 14.5 0.0 0.0 0.0 InitQueuDel: 0.0 0.0 0.0 0.0 0.0 0.0 0.0 0.0 0.0 0.0 0.0 0.0 Delay Adj: 1.00 1.00 0.00 0.00 1.00 1.00 1.00 0.00 1.00 0.00 0.00 0.00 Delay/Veh: 2.4 2.4 0.0 0.0 5.9 5.9 52.5 0.0 54.5 0.0 0.0 0.0 User DelAdj: 1.00 1.00 1.00 1.00 1.00 1.00 1.00 1.00 1.00 1.00 1.00 1.00 AdjDel/Veh: 2.4 2.4 0.0 0.0 5.9 5.9 52.5 0.0 54.5 0.0 0.0 0.0 LOS by Move: A A A A A A D A D A A A HCM2kAvgQ: 5 5 0 0 17 17 7 0 8 0 0 0 ********************************************************************************Note: Queue reported is the number of cars per lane.********************************************************************************

MIT_CP(A)_AM Tue Nov 6, 2007 12:28:03 Page 13-1 ---------------------------------------------------------------------------------------------------------------------------------------------------------------- Level Of Service Computation Report 2000 HCM Operations Method (Base Volume Alternative) ********************************************************************************Intersection #12 Ane Keohokalole Hwy / Kealakehe Pkwy ********************************************************************************Cycle (sec): 100 Critical Vol./Cap.(X): 0.686Loss Time (sec): 0 (Y+R=4.0 sec) Average Delay (sec/veh): 18.5Optimal Cycle: 46 Level Of Service: B********************************************************************************Street Name: Ane Keohokalole Hwy Kealakehe Pkwy Approach: North Bound South Bound East Bound West Bound Movement: L - T - R L - T - R L - T - R L - T - R ------------|---------------||---------------||---------------||---------------|Control: Permitted Permitted Permitted Permitted Rights: Include Include Include Include Min. Green: 0 0 0 0 0 0 0 0 0 0 0 0 Lanes: 1 0 1 0 1 1 0 0 1 0 1 0 1 1 0 1 0 1 0 1 ------------|---------------||---------------||---------------||---------------|Volume Module:Base Vol: 233 402 3 12 358 45 369 94 449 2 115 50 Growth Adj: 1.00 1.00 1.00 1.00 1.00 1.00 1.00 1.00 1.00 1.00 1.00 1.00 Initial Bse: 233 402 3 12 358 45 369 94 449 2 115 50 User Adj: 1.00 1.00 1.00 1.00 1.00 1.00 1.00 1.00 1.00 1.00 1.00 1.00 PHF Adj: 0.95 0.95 0.95 0.95 0.95 0.95 0.95 0.95 0.95 0.95 0.95 0.95 PHF Volume: 245 423 3 13 377 47 388 99 473 2 121 53 Reduct Vol: 0 0 0 0 0 0 0 0 0 0 0 0 Reduced Vol: 245 423 3 13 377 47 388 99 473 2 121 53 PCE Adj: 1.00 1.00 1.00 1.00 1.00 1.00 1.00 1.00 1.00 1.00 1.00 1.00 MLF Adj: 1.00 1.00 1.00 1.00 1.00 1.00 1.00 1.00 1.00 1.00 1.00 1.00 FinalVolume: 245 423 3 13 377 47 388 99 473 2 121 53 ------------|---------------||---------------||---------------||---------------|Saturation Flow Module:Sat/Lane: 1900 1900 1900 1900 1900 1900 1900 1900 1900 1900 1900 1900 Adjustment: 0.37 1.00 0.85 0.37 0.98 0.98 0.62 0.83 0.83 0.36 1.00 0.85 Lanes: 1.00 1.00 1.00 1.00 0.89 0.11 1.00 1.00 1.00 1.00 1.00 1.00 Final Sat.: 694 1900 1615 695 1659 209 1170 1581 1581 676 1900 1615 ------------|---------------||---------------||---------------||---------------|Capacity Analysis Module:Vol/Sat: 0.35 0.22 0.00 0.02 0.23 0.23 0.33 0.06 0.30 0.00 0.06 0.03 Crit Moves: **** **** Green/Cycle: 0.52 0.52 0.52 0.52 0.52 0.52 0.48 0.48 0.48 0.48 0.48 0.48 Volume/Cap: 0.69 0.43 0.00 0.04 0.44 0.44 0.69 0.13 0.62 0.01 0.13 0.07 Uniform Del: 18.1 15.1 11.7 11.9 15.2 15.2 19.9 14.2 19.0 13.3 14.2 13.8 IncremntDel: 5.5 0.3 0.0 0.0 0.3 0.3 3.5 0.0 1.3 0.0 0.1 0.0 InitQueuDel: 0.0 0.0 0.0 0.0 0.0 0.0 0.0 0.0 0.0 0.0 0.0 0.0 Delay Adj: 1.00 1.00 1.00 1.00 1.00 1.00 1.00 1.00 1.00 1.00 1.00 1.00 Delay/Veh: 23.6 15.4 11.7 12.0 15.5 15.5 23.4 14.2 20.3 13.4 14.3 13.8 User DelAdj: 1.00 1.00 1.00 1.00 1.00 1.00 1.00 1.00 1.00 1.00 1.00 1.00 AdjDel/Veh: 23.6 15.4 11.7 12.0 15.5 15.5 23.4 14.2 20.3 13.4 14.3 13.8 LOS by Move: C B B B B B C B C B B B HCM2kAvgQ: 7 8 0 0 8 8 10 2 12 0 2 1 ********************************************************************************Note: Queue reported is the number of cars per lane.********************************************************************************

MIT_CP(A)_PM Tue Nov 6, 2007 12:28:13 Page 5-1 ---------------------------------------------------------------------------------------------------------------------------------------------------------------- Level Of Service Computation Report 2000 HCM Operations Method (Base Volume Alternative) ********************************************************************************Intersection #3 Kamakaeha Ave / Palani Rd ********************************************************************************Cycle (sec): 100 Critical Vol./Cap.(X): 0.652Loss Time (sec): 10 (Y+R=4.0 sec) Average Delay (sec/veh): 10.3Optimal Cycle: 48 Level Of Service: B********************************************************************************Street Name: Kamakaeha Ave Palani Rd Approach: North Bound South Bound East Bound West Bound Movement: L - T - R L - T - R L - T - R L - T - R ------------|---------------||---------------||---------------||---------------|Control: Permitted Permitted Permitted Permitted Rights: Include Include Include Ignore Min. Green: 0 0 0 0 0 0 0 0 0 0 0 0 Lanes: 0 0 0 0 0 1 0 0 0 1 0 0 1 0 0 0 0 1 0 1 ------------|---------------||---------------||---------------||---------------|Volume Module:Base Vol: 0 0 0 127 0 63 0 618 0 0 894 281 Growth Adj: 1.00 1.00 1.00 1.00 1.00 1.00 1.00 1.00 1.00 1.00 1.00 1.00 Initial Bse: 0 0 0 127 0 63 0 618 0 0 894 281 User Adj: 1.00 1.00 1.00 1.00 1.00 1.00 1.00 1.00 1.00 1.00 1.00 0.00 PHF Adj: 0.95 0.95 0.95 0.95 0.95 0.95 0.95 0.95 0.95 0.95 0.95 0.00 PHF Volume: 0 0 0 134 0 66 0 651 0 0 941 0 Reduct Vol: 0 0 0 0 0 0 0 0 0 0 0 0 Reduced Vol: 0 0 0 134 0 66 0 651 0 0 941 0 PCE Adj: 1.00 1.00 1.00 1.00 1.00 1.00 1.00 1.00 1.00 1.00 1.00 0.00 MLF Adj: 1.00 1.00 1.00 1.00 1.00 1.00 1.00 1.00 1.00 1.00 1.00 0.00 FinalVolume: 0 0 0 134 0 66 0 651 0 0 941 0 ------------|---------------||---------------||---------------||---------------|Saturation Flow Module:Sat/Lane: 1900 1900 1900 1900 1900 1900 1900 1900 1900 1900 1900 1900 Adjustment: 1.00 1.00 1.00 0.77 1.00 0.85 1.00 1.00 1.00 1.00 1.00 1.00 Lanes: 0.00 0.00 0.00 1.00 0.00 1.00 0.00 1.00 0.00 0.00 1.00 1.00 Final Sat.: 0 0 0 1461 0 1615 0 1900 0 0 1900 1900 ------------|---------------||---------------||---------------||---------------|Capacity Analysis Module:Vol/Sat: 0.00 0.00 0.00 0.09 0.00 0.04 0.00 0.34 0.00 0.00 0.50 0.00 Crit Moves: **** **** Green/Cycle: 0.00 0.00 0.00 0.14 0.00 0.14 0.00 0.76 0.00 0.00 0.76 0.00 Volume/Cap: 0.00 0.00 0.00 0.65 0.00 0.29 0.00 0.45 0.00 0.00 0.65 0.00 Uniform Del: 0.0 0.0 0.0 40.7 0.0 38.5 0.0 4.4 0.0 0.0 5.7 0.0 IncremntDel: 0.0 0.0 0.0 7.3 0.0 0.7 0.0 0.2 0.0 0.0 1.1 0.0 InitQueuDel: 0.0 0.0 0.0 0.0 0.0 0.0 0.0 0.0 0.0 0.0 0.0 0.0 Delay Adj: 0.00 0.00 0.00 1.00 0.00 1.00 0.00 1.00 0.00 0.00 1.00 0.00 Delay/Veh: 0.0 0.0 0.0 48.0 0.0 39.3 0.0 4.6 0.0 0.0 6.8 0.0 User DelAdj: 1.00 1.00 1.00 1.00 1.00 1.00 1.00 1.00 1.00 1.00 1.00 1.00 AdjDel/Veh: 0.0 0.0 0.0 48.0 0.0 39.3 0.0 4.6 0.0 0.0 6.8 0.0 LOS by Move: A A A D A D A A A A A A HCM2kAvgQ: 0 0 0 5 0 2 0 7 0 0 14 0 ********************************************************************************Note: Queue reported is the number of cars per lane.********************************************************************************

MIT_CP(A)_PM Tue Nov 6, 2007 12:28:13 Page 6-1 ---------------------------------------------------------------------------------------------------------------------------------------------------------------- Level Of Service Computation Report 2000 HCM Operations Method (Base Volume Alternative) ********************************************************************************Intersection #4 Henry St / Palani Rd ********************************************************************************Cycle (sec): 100 Critical Vol./Cap.(X): 0.926Loss Time (sec): 10 (Y+R=4.0 sec) Average Delay (sec/veh): 32.9Optimal Cycle: 120 Level Of Service: C********************************************************************************Street Name: Henry St Palani Rd Approach: North Bound South Bound East Bound West Bound Movement: L - T - R L - T - R L - T - R L - T - R ------------|---------------||---------------||---------------||---------------|Control: Permitted Permitted Permitted Prot+Permit Rights: Ovl Include Include Include Min. Green: 0 0 0 0 0 0 0 0 0 0 0 0 Lanes: 1 0 1 1 0 1 0 1 1 0 1 0 0 1 0 2 0 1 1 0 ------------|---------------||---------------||---------------||---------------|Volume Module:Base Vol: 110 329 394 67 314 183 268 416 129 859 927 93 Growth Adj: 1.00 1.00 1.00 1.00 1.00 1.00 1.00 1.00 1.00 1.00 1.00 1.00 Initial Bse: 110 329 394 67 314 183 268 416 129 859 927 93 User Adj: 1.00 1.00 1.00 1.00 1.00 1.00 1.00 1.00 1.00 1.00 1.00 1.00 PHF Adj: 0.95 0.95 0.95 0.95 0.95 0.95 0.95 0.95 0.95 0.95 0.95 0.95 PHF Volume: 116 346 415 71 331 193 282 438 136 904 976 98 Reduct Vol: 0 0 0 0 0 0 0 0 0 0 0 0 Reduced Vol: 116 346 415 71 331 193 282 438 136 904 976 98 PCE Adj: 1.00 1.00 1.00 1.00 1.00 1.00 1.00 1.00 1.00 1.00 1.00 1.00 MLF Adj: 1.00 1.00 1.00 1.00 1.00 1.00 1.00 1.00 1.00 1.00 1.00 1.00 FinalVolume: 116 346 415 71 331 193 282 438 136 904 976 98 ------------|---------------||---------------||---------------||---------------|Saturation Flow Module:Sat/Lane: 1900 1900 1900 1900 1900 1900 1900 1900 1900 1900 1900 1900 Adjustment: 0.30 0.87 0.87 0.14 0.90 0.90 0.95 0.96 0.96 0.92 0.94 0.94 Lanes: 1.00 1.00 1.00 1.00 1.26 0.74 1.00 0.76 0.24 2.00 1.82 0.18 Final Sat.: 569 1657 1657 269 2155 1256 1805 1398 434 3502 3235 325 ------------|---------------||---------------||---------------||---------------|Capacity Analysis Module:Vol/Sat: 0.20 0.21 0.25 0.26 0.15 0.15 0.16 0.31 0.31 0.26 0.30 0.30 Crit Moves: **** **** **** Green/Cycle: 0.28 0.28 0.56 0.28 0.28 0.28 0.21 0.34 0.34 0.41 0.41 0.41 Volume/Cap: 0.72 0.74 0.45 0.93 0.54 0.54 0.74 0.93 0.93 0.67 0.74 0.74 Uniform Del: 32.3 32.5 12.8 34.8 30.4 30.4 36.9 31.9 31.9 23.7 25.2 25.2 IncremntDel: 14.5 2.9 0.2 78.1 0.6 0.6 7.7 20.1 20.1 1.3 2.1 2.1 InitQueuDel: 0.0 0.0 0.0 0.0 0.0 0.0 0.0 0.0 0.0 0.0 0.0 0.0 Delay Adj: 1.00 1.00 1.00 1.00 1.00 1.00 1.00 1.00 1.00 1.00 1.00 1.00 Delay/Veh: 46.8 35.3 13.0 113.0 31.0 31.0 44.6 52.0 52.0 25.1 27.3 27.3 User DelAdj: 1.00 1.00 1.00 1.00 1.00 1.00 1.00 1.00 1.00 1.00 1.00 1.00 AdjDel/Veh: 46.8 35.3 13.0 113.0 31.0 31.0 44.6 52.0 52.0 25.1 27.3 27.3 LOS by Move: D D B F C C D D D C C C HCM2kAvgQ: 5 12 8 5 8 8 10 21 21 12 16 16 ********************************************************************************Note: Queue reported is the number of cars per lane.********************************************************************************
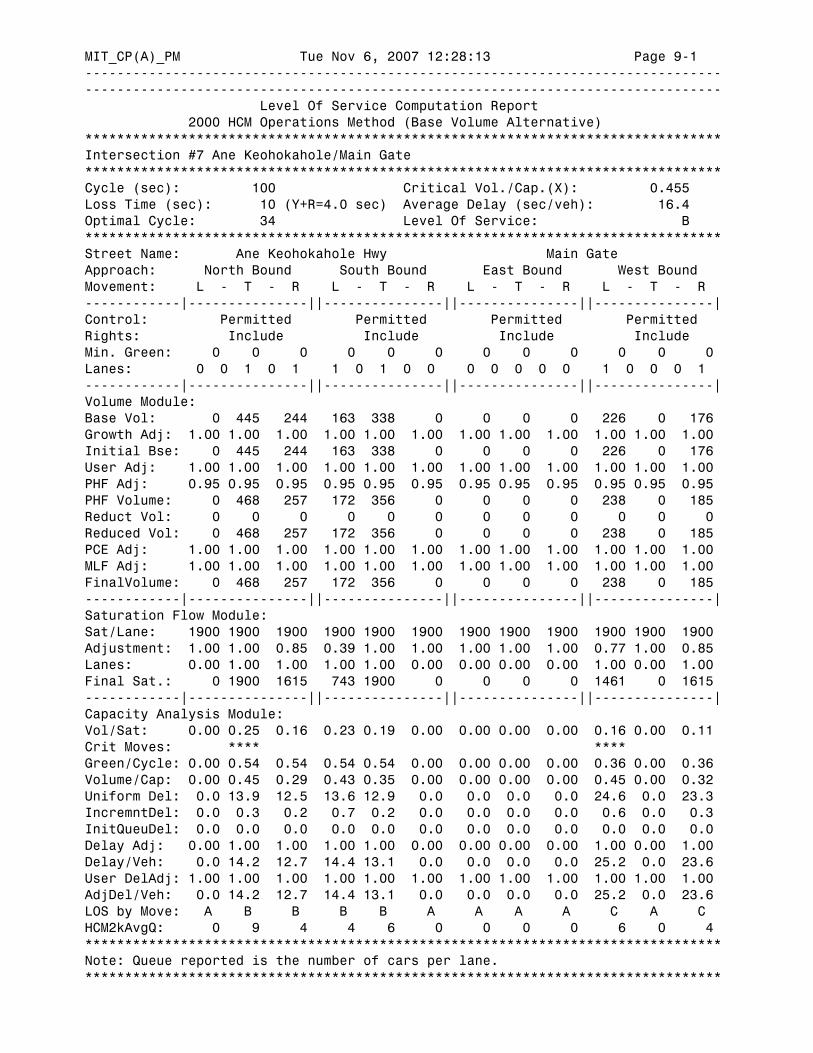
MIT_CP(A)_PM Tue Nov 6, 2007 12:28:13 Page 9-1 ---------------------------------------------------------------------------------------------------------------------------------------------------------------- Level Of Service Computation Report 2000 HCM Operations Method (Base Volume Alternative) ********************************************************************************Intersection #7 Ane Keohokahole/Main Gate ********************************************************************************Cycle (sec): 100 Critical Vol./Cap.(X): 0.455Loss Time (sec): 10 (Y+R=4.0 sec) Average Delay (sec/veh): 16.4Optimal Cycle: 34 Level Of Service: B********************************************************************************Street Name: Ane Keohokahole Hwy Main Gate Approach: North Bound South Bound East Bound West Bound Movement: L - T - R L - T - R L - T - R L - T - R ------------|---------------||---------------||---------------||---------------|Control: Permitted Permitted Permitted Permitted Rights: Include Include Include Include Min. Green: 0 0 0 0 0 0 0 0 0 0 0 0 Lanes: 0 0 1 0 1 1 0 1 0 0 0 0 0 0 0 1 0 0 0 1 ------------|---------------||---------------||---------------||---------------|Volume Module:Base Vol: 0 445 244 163 338 0 0 0 0 226 0 176 Growth Adj: 1.00 1.00 1.00 1.00 1.00 1.00 1.00 1.00 1.00 1.00 1.00 1.00 Initial Bse: 0 445 244 163 338 0 0 0 0 226 0 176 User Adj: 1.00 1.00 1.00 1.00 1.00 1.00 1.00 1.00 1.00 1.00 1.00 1.00 PHF Adj: 0.95 0.95 0.95 0.95 0.95 0.95 0.95 0.95 0.95 0.95 0.95 0.95 PHF Volume: 0 468 257 172 356 0 0 0 0 238 0 185 Reduct Vol: 0 0 0 0 0 0 0 0 0 0 0 0 Reduced Vol: 0 468 257 172 356 0 0 0 0 238 0 185 PCE Adj: 1.00 1.00 1.00 1.00 1.00 1.00 1.00 1.00 1.00 1.00 1.00 1.00 MLF Adj: 1.00 1.00 1.00 1.00 1.00 1.00 1.00 1.00 1.00 1.00 1.00 1.00 FinalVolume: 0 468 257 172 356 0 0 0 0 238 0 185 ------------|---------------||---------------||---------------||---------------|Saturation Flow Module:Sat/Lane: 1900 1900 1900 1900 1900 1900 1900 1900 1900 1900 1900 1900 Adjustment: 1.00 1.00 0.85 0.39 1.00 1.00 1.00 1.00 1.00 0.77 1.00 0.85 Lanes: 0.00 1.00 1.00 1.00 1.00 0.00 0.00 0.00 0.00 1.00 0.00 1.00 Final Sat.: 0 1900 1615 743 1900 0 0 0 0 1461 0 1615 ------------|---------------||---------------||---------------||---------------|Capacity Analysis Module:Vol/Sat: 0.00 0.25 0.16 0.23 0.19 0.00 0.00 0.00 0.00 0.16 0.00 0.11 Crit Moves: **** **** Green/Cycle: 0.00 0.54 0.54 0.54 0.54 0.00 0.00 0.00 0.00 0.36 0.00 0.36 Volume/Cap: 0.00 0.45 0.29 0.43 0.35 0.00 0.00 0.00 0.00 0.45 0.00 0.32 Uniform Del: 0.0 13.9 12.5 13.6 12.9 0.0 0.0 0.0 0.0 24.6 0.0 23.3 IncremntDel: 0.0 0.3 0.2 0.7 0.2 0.0 0.0 0.0 0.0 0.6 0.0 0.3 InitQueuDel: 0.0 0.0 0.0 0.0 0.0 0.0 0.0 0.0 0.0 0.0 0.0 0.0 Delay Adj: 0.00 1.00 1.00 1.00 1.00 0.00 0.00 0.00 0.00 1.00 0.00 1.00 Delay/Veh: 0.0 14.2 12.7 14.4 13.1 0.0 0.0 0.0 0.0 25.2 0.0 23.6 User DelAdj: 1.00 1.00 1.00 1.00 1.00 1.00 1.00 1.00 1.00 1.00 1.00 1.00 AdjDel/Veh: 0.0 14.2 12.7 14.4 13.1 0.0 0.0 0.0 0.0 25.2 0.0 23.6 LOS by Move: A B B B B A A A A C A C HCM2kAvgQ: 0 9 4 4 6 0 0 0 0 6 0 4 ********************************************************************************Note: Queue reported is the number of cars per lane.********************************************************************************

MIT_CP(A)_PM Tue Nov 6, 2007 12:28:13 Page 10-1 ---------------------------------------------------------------------------------------------------------------------------------------------------------------- Level Of Service Computation Report 2000 HCM Operations Method (Base Volume Alternative) ********************************************************************************Intersection #8 Palihiolo St/Palani Rd ********************************************************************************Cycle (sec): 100 Critical Vol./Cap.(X): 1.023Loss Time (sec): 10 (Y+R=4.0 sec) Average Delay (sec/veh): 40.7Optimal Cycle: 180 Level Of Service: D********************************************************************************Street Name: Palihiolo St Palani Rd Approach: North Bound South Bound East Bound West Bound Movement: L - T - R L - T - R L - T - R L - T - R ------------|---------------||---------------||---------------||---------------|Control: Permitted Permitted Prot+Permit Permitted Rights: Include Ovl Include Ignore Min. Green: 0 0 0 0 0 0 0 0 0 0 0 0 Lanes: 0 1 0 0 1 1 0 0 1 0 2 0 0 1 0 1 0 1 1 0 ------------|---------------||---------------||---------------||---------------|Volume Module:Base Vol: 4 19 26 2 4 592 506 731 13 49 1319 23 Growth Adj: 1.00 1.00 1.00 1.00 1.00 1.00 1.00 1.00 1.00 1.00 1.00 1.00 Initial Bse: 4 19 26 2 4 592 506 731 13 49 1319 23 User Adj: 1.00 1.00 1.00 1.00 1.00 1.00 1.00 1.00 1.00 1.00 1.00 0.00 PHF Adj: 0.95 0.95 0.95 0.95 0.95 0.95 0.95 0.95 0.95 0.95 0.95 0.00 PHF Volume: 4 20 27 2 4 623 533 769 14 52 1388 0 Reduct Vol: 0 0 0 0 0 0 0 0 0 0 0 0 Reduced Vol: 4 20 27 2 4 623 533 769 14 52 1388 0 PCE Adj: 1.00 1.00 1.00 1.00 1.00 1.00 1.00 1.00 1.00 1.00 1.00 0.00 MLF Adj: 1.00 1.00 1.00 1.00 1.00 1.00 1.00 1.00 1.00 1.00 1.00 0.00 FinalVolume: 4 20 27 2 4 623 533 769 14 52 1388 0 ------------|---------------||---------------||---------------||---------------|Saturation Flow Module:Sat/Lane: 1900 1900 1900 1900 1900 1900 1900 1900 1900 1900 1900 1900 Adjustment: 0.89 0.89 0.85 0.75 0.85 0.85 0.91 1.00 1.00 0.95 0.95 0.95 Lanes: 0.17 0.83 1.00 1.00 0.01 0.99 2.00 0.98 0.02 1.00 2.00 0.00 Final Sat.: 293 1394 1615 1423 11 1606 3445 1861 33 1805 3610 0 ------------|---------------||---------------||---------------||---------------|Capacity Analysis Module:Vol/Sat: 0.01 0.01 0.02 0.00 0.39 0.39 0.15 0.41 0.41 0.03 0.38 0.00 Crit Moves: **** **** **** Green/Cycle: 0.38 0.38 0.38 0.38 0.38 0.53 0.49 0.49 0.49 0.03 0.37 0.00 Volume/Cap: 0.04 0.04 0.04 0.00 1.03 0.74 0.42 0.85 0.85 0.85 1.03 0.00 Uniform Del: 19.6 19.6 19.7 19.4 31.1 18.4 15.4 22.3 22.3 48.1 31.3 0.0 IncremntDel: 0.0 0.0 0.0 0.0 43.6 3.4 0.2 7.3 7.3 63.7 31.8 0.0 InitQueuDel: 0.0 0.0 0.0 0.0 0.0 0.0 0.0 0.0 0.0 0.0 0.0 0.0 Delay Adj: 1.00 1.00 1.00 1.00 1.00 1.00 1.00 1.00 1.00 1.00 1.00 0.00 Delay/Veh: 19.7 19.7 19.7 19.4 74.7 21.8 15.7 29.6 29.6 111.8 63.0 0.0 User DelAdj: 1.00 1.00 1.00 1.00 1.00 1.00 1.00 1.00 1.00 1.00 1.00 1.00 AdjDel/Veh: 19.7 19.7 19.7 19.4 74.7 21.8 15.7 29.6 29.6 111.8 63.0 0.0 LOS by Move: B B B B E C B C C F E A HCM2kAvgQ: 0 0 1 0 27 16 6 23 23 3 31 0 ********************************************************************************Note: Queue reported is the number of cars per lane.********************************************************************************

MIT_CP(A)_PM Tue Nov 6, 2007 12:28:13 Page 11-1 ---------------------------------------------------------------------------------------------------------------------------------------------------------------- Level Of Service Computation Report 2000 HCM Operations Method (Base Volume Alternative) ********************************************************************************Intersection #10 Palani Rd / Uluaoa St ********************************************************************************Cycle (sec): 100 Critical Vol./Cap.(X): 0.725Loss Time (sec): 0 (Y+R=4.0 sec) Average Delay (sec/veh): 4.6Optimal Cycle: 52 Level Of Service: A********************************************************************************Street Name: Palani Rd Uluaoa St Approach: North Bound South Bound East Bound West Bound Movement: L - T - R L - T - R L - T - R L - T - R ------------|---------------||---------------||---------------||---------------|Control: Permitted Permitted Permitted Permitted Rights: Include Include Include Include Min. Green: 0 0 0 0 0 0 0 0 0 0 0 0 Lanes: 0 1 0 0 0 0 0 0 1 0 1 0 0 0 1 0 0 0 0 0 ------------|---------------||---------------||---------------||---------------|Volume Module:Base Vol: 29 740 0 0 1018 177 71 0 32 0 0 0 Growth Adj: 1.00 1.00 1.00 1.00 1.00 1.00 1.00 1.00 1.00 1.00 1.00 1.00 Initial Bse: 29 740 0 0 1018 177 71 0 32 0 0 0 User Adj: 1.00 1.00 1.00 1.00 1.00 1.00 1.00 1.00 1.00 1.00 1.00 1.00 PHF Adj: 0.95 0.95 0.95 0.95 0.95 0.95 0.95 0.95 0.95 0.95 0.95 0.95 PHF Volume: 31 779 0 0 1072 186 75 0 34 0 0 0 Reduct Vol: 0 0 0 0 0 0 0 0 0 0 0 0 Reduced Vol: 31 779 0 0 1072 186 75 0 34 0 0 0 PCE Adj: 1.00 1.00 1.00 1.00 1.00 1.00 1.00 1.00 1.00 1.00 1.00 1.00 MLF Adj: 1.00 1.00 1.00 1.00 1.00 1.00 1.00 1.00 1.00 1.00 1.00 1.00 FinalVolume: 31 779 0 0 1072 186 75 0 34 0 0 0 ------------|---------------||---------------||---------------||---------------|Saturation Flow Module:Sat/Lane: 1900 1900 1900 1900 1900 1900 1900 1900 1900 1900 1900 1900 Adjustment: 0.93 0.93 1.00 1.00 0.98 0.98 0.79 1.00 0.85 1.00 1.00 1.00 Lanes: 0.04 0.96 0.00 0.00 0.85 0.15 1.00 0.00 1.00 0.00 0.00 0.00 Final Sat.: 67 1700 0 0 1586 276 1503 0 1615 0 0 0 ------------|---------------||---------------||---------------||---------------|Capacity Analysis Module:Vol/Sat: 0.46 0.46 0.00 0.00 0.68 0.68 0.05 0.00 0.02 0.00 0.00 0.00 Crit Moves: **** **** Green/Cycle: 0.93 0.93 0.00 0.00 0.93 0.93 0.07 0.00 0.07 0.00 0.00 0.00 Volume/Cap: 0.49 0.49 0.00 0.00 0.73 0.73 0.73 0.00 0.30 0.00 0.00 0.00 Uniform Del: 0.4 0.4 0.0 0.0 0.7 0.7 45.6 0.0 44.3 0.0 0.0 0.0 IncremntDel: 0.2 0.2 0.0 0.0 1.6 1.6 22.5 0.0 1.6 0.0 0.0 0.0 InitQueuDel: 0.0 0.0 0.0 0.0 0.0 0.0 0.0 0.0 0.0 0.0 0.0 0.0 Delay Adj: 1.00 1.00 0.00 0.00 1.00 1.00 1.00 0.00 1.00 0.00 0.00 0.00 Delay/Veh: 0.7 0.7 0.0 0.0 2.3 2.3 68.1 0.0 45.9 0.0 0.0 0.0 User DelAdj: 1.00 1.00 1.00 1.00 1.00 1.00 1.00 1.00 1.00 1.00 1.00 1.00 AdjDel/Veh: 0.7 0.7 0.0 0.0 2.3 2.3 68.1 0.0 45.9 0.0 0.0 0.0 LOS by Move: A A A A A A E A D A A A HCM2kAvgQ: 4 4 0 0 10 10 4 0 1 0 0 0 ********************************************************************************Note: Queue reported is the number of cars per lane.********************************************************************************


![[SEALED] Dockets concerning Birgitta Jonsdottir in the Wikileaks Grand Jury](https://static.fdocuments.in/doc/165x107/577d25891a28ab4e1e9f0c93/sealed-dockets-concerning-birgitta-jonsdottir-in-the-wikileaks-grand-jury.jpg)