KDP - arXivsample of KDP was measured on cooling, on quasiestatic conditions at a scanning...
7
arXiv:cond-mat/0503698v1 [cond-mat.other] 30 Mar 2005 Influence of the electric field on the latent heat of ferroelectric phase transition in KDP Jose Maria Delgado-Sanchez, Jos´ e Mar´ ıa Mart´ ın-Olalla, Mar´ ıa Carmen Gallardo, and Saturio Ramos Departamento de F´ ısica de la Materia Condensada. Instituto Mixto de Ciencia de Materiales CSIC-Universidad de Sevilla Ap Correos 1065, ES-41080 Sevilla, SPAIN Marceli Koralewski Institute of Physics, Adam Mickiewicz University, Umultowska 85, 61-614, Poznan, Poland Jaime del Cerro Departamento de F´ ısica de la Materia Condensada. Instituto Mixto de Ciencia de Materiales. CSIC-Universidad de Sevilla Ap Correos 1065, ES-41080 Sevilla, SPAIN (Dated: March 30th, 2005) The specific heat, heat flux (DTA trace) and dielectric constant of KDP ferroelectric crystal have been measured simultaneously for various electric fields with a conduction calorimeter. The specific heat presents a strong anomaly but these simultaneous measurements allow us to evaluate the latent heat accurately. Latent heat decreases with field and the value of critical electric field —that where latent heat disappears— is estimated to be (0.44 ± 0.03) kV cm -1 . Incidentally, we have measured simultaneously the dielectric permittivity which suggests that latent heat is developed as domains are growing. 1. INTRODUCTION The KDP family is one of the most extensively studied[1, 2] hydrogen-bonded ferroelectric crystals. The potassium dihydrogen phosphate KH 2 PO 4 crystal ex- hibits a discontinuous phase transition at T 0 = 121 K from a tetragonal paraelectric phase to an orthorhombic ferroelectric phase. The specific heat anomaly at transi- tion temperature shows[3, 4, 5] a strong λ-type anomaly; perhaps, that is why the transition was initially consid- ered continuous. However Reese[4] showed that the tran- sition is discontinuous by measuring its latent heat, which was evaluated to be 46.1 J mol -1 . It is shown that dis- continuity disappear under the influence of pressure or electric field. The value of the critical electric field E c for which the discontinuity disappears is a subject of discussion. Reese et al.[6] also carried out a measurement of the specific heat with an applied field of 294 V cm -1 finding a contro- versial evidence of latent heat. Above E = 785 V cm -1 they found no evidence of latent heat and suggested E c = 300 V cm -1 from the shift of the maximum of the specific heat as function of the electric field. Measure- ments of specific heat under electric field higher than 360 V cm -1 was carried out by Sandvold and Fossheim[7] and the authors suggest that Landau theory for continu- ous transitions with 2 - 4 - 6 potential was appropriate to describe the shape of specific heat curves. Other works have lead to estimations of the critical field. For instance, Strukov et al.[8] evaluated E c = 124 V cm -1 from electrocaloric experiments. Sidnenko and Gladki[9] found E c = 370 V cm -1 while Okada and Sugie[10] obtained 160 V cm -1 for E c . Vallade[11] de- duced a value of 254 V cm -1 from birefringence measure- ments. In contrast to these values, Kobayashi et al.[12] found, by X-ray measurements, 8000 V cm -1 ; Eberhard and Horn[13] derived a value of 6500 V cm -1 from dielec- tric susceptibility. In this frame it would be interesting to evaluate the latent heat as a function of the electric field to determine the value of the critical electric field E c for which latent heat becomes null. The difficulty of an accurate determination of E c from calorimetric measurements in standard equipments — such as differential thermal analysis DTA and differential scanning calorimeter DSC —is that these systems really measure changes of enthalpy which has two contributions near the transition: one due to the latent heat and other due to the variation of specific heat with temperature. In the case of phase transitions near a tricritical point or a discontinuous ferroelectric phase transition under an electric field close to the critical field, the specific heat presents a strong anomaly and latent heat becomes very small. This fact makes difficult to separate both contributions and to distinguish the temperature inter- val where the latent heat is present. This may explain the lack of study of the influence of electric field, smaller than E c , on specific heat and latent heat of KDP after Reese[6]. Our group has developed a method, named square modulated differential thermal analysis SMDTA[14, 15, 16], based on conduction calorimetry, which is able to measure absolute values of specific heat and the heat flux exchanged by the sample when its temperature is changed at a rate as low as 0.1Kh -1 . The comparison of the data allows us to separate the above two contri- butions to the total enthalpy and to evaluate the latent heat, in case there were any. Typeset by REVT E X
Transcript of KDP - arXivsample of KDP was measured on cooling, on quasiestatic conditions at a scanning...
arX
iv:c
ond-
mat
/050
3698
v1 [
cond
-mat
.oth
er]
30
Mar
200
5
Influence of the electric field on the latent heat of ferroelectric phase transition in
KDP
Jose Maria Delgado-Sanchez, Jose Marıa Martın-Olalla, Marıa Carmen Gallardo, and Saturio RamosDepartamento de Fısica de la Materia Condensada. Instituto Mixto de Ciencia de Materiales
CSIC-Universidad de Sevilla
Ap Correos 1065, ES-41080 Sevilla, SPAIN
Marceli KoralewskiInstitute of Physics, Adam Mickiewicz University, Umultowska 85, 61-614, Poznan, Poland
Jaime del CerroDepartamento de Fısica de la Materia Condensada. Instituto Mixto de Ciencia de Materiales.
CSIC-Universidad de Sevilla
Ap Correos 1065, ES-41080 Sevilla, SPAIN
(Dated: March 30th, 2005)
The specific heat, heat flux (DTA trace) and dielectric constant of KDP ferroelectric crystal havebeen measured simultaneously for various electric fields with a conduction calorimeter. The specificheat presents a strong anomaly but these simultaneous measurements allow us to evaluate the latentheat accurately. Latent heat decreases with field and the value of critical electric field —that wherelatent heat disappears— is estimated to be (0.44± 0.03) kV cm−1. Incidentally, we have measuredsimultaneously the dielectric permittivity which suggests that latent heat is developed as domainsare growing.
1. INTRODUCTION
The KDP family is one of the most extensivelystudied[1, 2] hydrogen-bonded ferroelectric crystals. Thepotassium dihydrogen phosphate KH2PO4 crystal ex-hibits a discontinuous phase transition at T0 = 121 Kfrom a tetragonal paraelectric phase to an orthorhombicferroelectric phase. The specific heat anomaly at transi-tion temperature shows[3, 4, 5] a strong λ-type anomaly;perhaps, that is why the transition was initially consid-ered continuous. However Reese[4] showed that the tran-sition is discontinuous by measuring its latent heat, whichwas evaluated to be 46.1 J mol−1. It is shown that dis-continuity disappear under the influence of pressure orelectric field.The value of the critical electric field Ec for which the
discontinuity disappears is a subject of discussion. Reeseet al.[6] also carried out a measurement of the specificheat with an applied field of 294 V cm−1 finding a contro-versial evidence of latent heat. Above E = 785 V cm−1
they found no evidence of latent heat and suggestedEc = 300 V cm−1 from the shift of the maximum of thespecific heat as function of the electric field. Measure-ments of specific heat under electric field higher than360 V cm−1 was carried out by Sandvold and Fossheim[7]and the authors suggest that Landau theory for continu-ous transitions with 2− 4− 6 potential was appropriateto describe the shape of specific heat curves.Other works have lead to estimations of the critical
field. For instance, Strukov et al.[8] evaluated Ec =124 V cm−1 from electrocaloric experiments. Sidnenkoand Gladki[9] found Ec = 370 V cm−1 while Okada andSugie[10] obtained 160 V cm−1 for Ec. Vallade[11] de-duced a value of 254 V cm−1 from birefringence measure-
ments. In contrast to these values, Kobayashi et al.[12]found, by X-ray measurements, 8000 V cm−1; Eberhardand Horn[13] derived a value of 6500 V cm−1 from dielec-tric susceptibility.In this frame it would be interesting to evaluate the
latent heat as a function of the electric field to determinethe value of the critical electric field Ec for which latentheat becomes null.The difficulty of an accurate determination of Ec from
calorimetric measurements in standard equipments —such as differential thermal analysis DTA and differentialscanning calorimeter DSC—is that these systems reallymeasure changes of enthalpy which has two contributionsnear the transition: one due to the latent heat and otherdue to the variation of specific heat with temperature.In the case of phase transitions near a tricritical pointor a discontinuous ferroelectric phase transition underan electric field close to the critical field, the specificheat presents a strong anomaly and latent heat becomesvery small. This fact makes difficult to separate bothcontributions and to distinguish the temperature inter-val where the latent heat is present. This may explainthe lack of study of the influence of electric field, smallerthan Ec, on specific heat and latent heat of KDP afterReese[6].Our group has developed a method, named square
modulated differential thermal analysis SMDTA[14, 15,16], based on conduction calorimetry, which is able tomeasure absolute values of specific heat and the heatflux exchanged by the sample when its temperature ischanged at a rate as low as 0.1 K h−1. The comparisonof the data allows us to separate the above two contri-butions to the total enthalpy and to evaluate the latentheat, in case there were any.
Typeset by REVTEX
2
This technique has been successfully applied to thestudy of the almost tricritical phase transition ofKMnF3[14], whose latent heat was firstly measured withthis technique. Furthermore, the effect of the substitu-tion of Mn by Ca was also investigated measuring thelatent heat[15], which showed that the doping makesthe transition become continuous[17]. The method ofSMDTA has been also applied to show that the phasetransition in CoO[18], whose character was also contro-versial, is continuous.In this paper we have applied this method to study
a KDP single crystal. We have measured the specificheat and the heat flux exchanged by the sample in theneighborhood of the ferroelectric phase transition. Themeasurements have been carried out at four values of E:0 V cm−1, 100 V cm−1, 400 V cm−1, 1000 V cm−1.Simultaneously to these measurements, the dielectric
susceptibility of the sample has also been measured andwe have related its behaviour around transition tempera-ture with the temperature interval where the latent heatis produced. Dielectric measurements provide informa-tion about the mechanism of ferroelectric phase transi-tion of KDP crystal[19, 20] and the simultaneous mea-surement of thermal and dielectric properties would beworthy.
2. EXPERIMENTAL
The measurements were performed in a high resolutionconduction calorimeter which has been described previ-ously in details[21, 22, 23]. The sensor is formed by twoidentical heat fluxmeters, each one having 48 chromel-constantan thermocouples connected electrically in seriesbut thermally in parallel. The sample is pressed betweenboth fluxmeters whose signal is measured by a Keithley182 nanovoltmeter. Two electrodes and two heaters areplaced between sample and fluxmeters.The sensor is placed inside a calorimeter block which is
suspended within two cylindrical radiation shields. Thewhole assembly is then placed in a hermetic outer caseat a high vacuum. The device is then surrounded by acoiled tube and placed in an alcohol bath. Liquid N2 cir-culates through the coil and regulates the temperatureof the bath with a good thermal stabilization. As a re-sult, it is possible to change smoothly the temperatureof the sample (at a rate of about 0.1 K h−1) without ob-serving significant temperature fluctuations (always lessthan 10−6 K) in the block temperature.The specific heat is measured using the method previ-
ously described[16]. The same constant power W is dissi-pated in both heaters (dissipation branch) for twelve min-utes and a steady state characterized by a constant tem-perature difference between the sample and the calorime-ter block is reached. The power is then cut off until anew steady state is reached twelve minutes later (relax-ation branch). Then, the power is again switched on andthe sequence is continuously repeated while the temper-
ature of the assembly is changed at a low constant rate.That is a long-periodic serial of square thermal pulsesis superposed to a heating or cooling ramp. The tem-perature increase of the sample due to the thermal pulseof twelve minutes (circa 50× 10−3 K) is higher than thetemperature variation of the sample produced by the rateof change of temperature in these twelve minutes (circa±20× 10−3 K). Hence, the sample is being cooled andheated alternatively during a run.
The integration of the electromotive force given by thefluxmeter between every pair of steady states allows us todetermine sample thermal capacity. Hence, the method isable to determine two data of heat capacity in each cycle.The first one is calculated from the dissipation branchCd, and the second one from the relaxation branch Cr.Heat capacity obtained in either branch show a regularbehaviour if there is no phase transition or if it is continu-ous. When a discontinuous phase transition occurs, bothdata become different showing an anomalous behaviourin the temperature interval where the latent heat is pro-duced as a result of the thermal hysteresis and transitionkinetics. That behaviour is an evidence of the discon-tinuous character of the transition[16]. Incidentally, wemust point out that specific heat data are not reliablewhen this behaviour is observed.
On the other hand, the DTA trace is continuously mea-sured in a second run without dissipation in the sampleand using the same temperature scanning rate used tomeasure the specific heat. Due to the high number ofthermocouples and their good thermal stability of thesample, the equipment works like a very sensitive DTAdevice. The electromotive force given by the fluxmetersis proportional to the heat flux, φd exchanged betweensample and calorimeter block.
From the specific heat data obtained in the first run-ning and using a method previously described[14, 15, 16],we calculate the heat flux φc which would have been dueexclusively to the behaviour of the thermal capacity ofthe sample around the transition temperature. Compar-ing the measured φd and the calculated φc we deduce thatonly in the temperature range (Tf , Tp) where both datado not coincide there is an effect from the latent heat.Its value is determined by integrating φd/v, where v isthe rate of temperature change, between (Tf , Tp) and us-ing the straight line φd/v(Tf )−φd/v(Tp) as baseline[15].The sensitivity of the method is estimated to be betterthan 5 mJ.
The single crystal of KH2PO4 was grown at the In-stitute of Physics of Poznan University (Poland). Thesample has 0.3857 g mass, with a thickness of 2.16 mmalong the ferroelectric axis and electrodes circular faceswith 78.5 mm2 in surface. The sample was placed out inthe calorimeter. Gold electrodes were evaporated of thesurface of the sample; those electrodes were connected toa capacitance bridge ESI − SP5400 which has allowedus to measure the dielectric permittivity of the sample,simultaneously to the heat flux, with an imposed exter-nal bias field of 0 V cm−1, 100 V cm−1, 400 V cm−1 and
3
1000 V cm−1.
3. RESULTS
3.1. Calorimetric measurements
The temperature dependence of the specific heat cp of asample of KDP was measured on cooling, on quasiestaticconditions at a scanning temperature rate of ca. v ∼
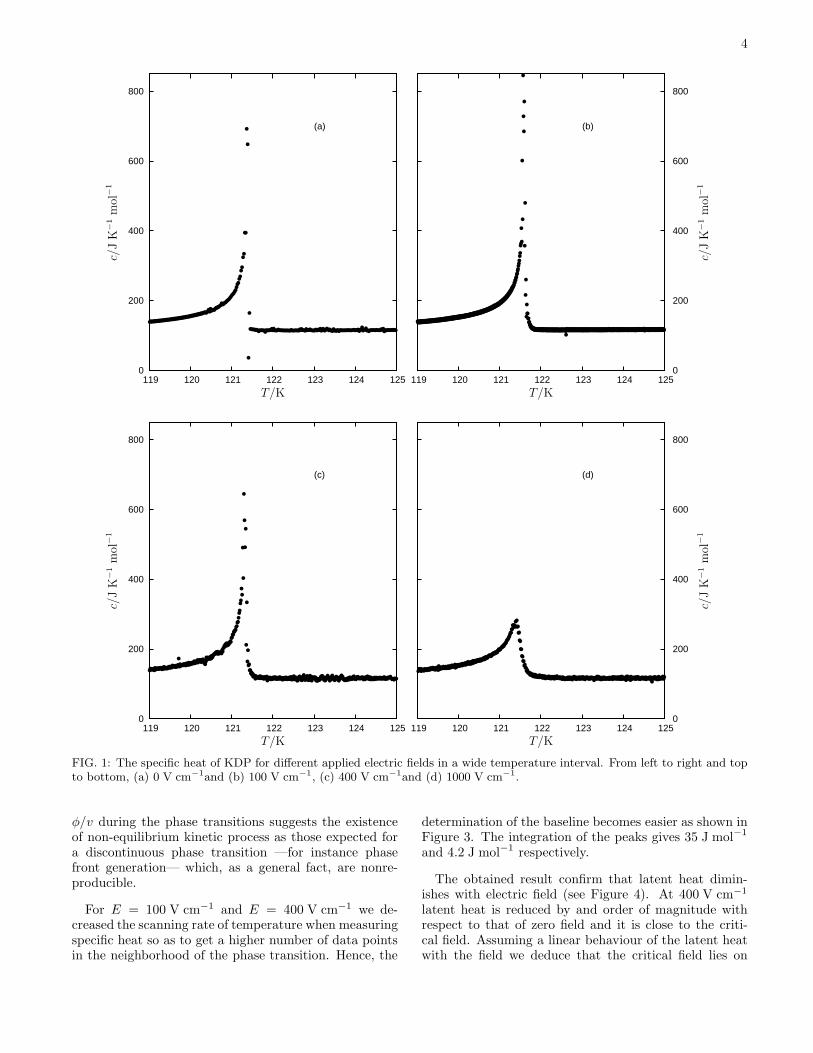
0.1 Kh−1 using the method described in Sec. 2 for differ-ent applied electric fields. In Figure 1, the specific heatdata in a wide temperature interval for different appliedelectric field (a) E = 0 V cm−1, (b) E = 100 V cm−1, (c)E = 400 V cm−1 and (d) E = 1000 V cm−1 is shown.These specific heat data show a linear temperature de-
pendence in the paraelectric phase and for 0 V cm−1,100 V cm−1 and 400 V cm−1 a sharp λ-type anomalyin a narrow temperature interval is observed. For1000 V cm−1 the maximum is more rounded and thetransition is smeared. The shape of specific heat curvefor high electric field tends to be almost symmetric, suchbehaviour was also suggested by Reese[6]. The maxi-mum value of c initially increases with increasing fieldbut decreases for sufficiently high values. As expected,the specific heat tail in the paraelectric phase increaseswith field as a consequence of the coupling of the orderparameter to the field.In Figure 2, we have plotted the specific heat ex-
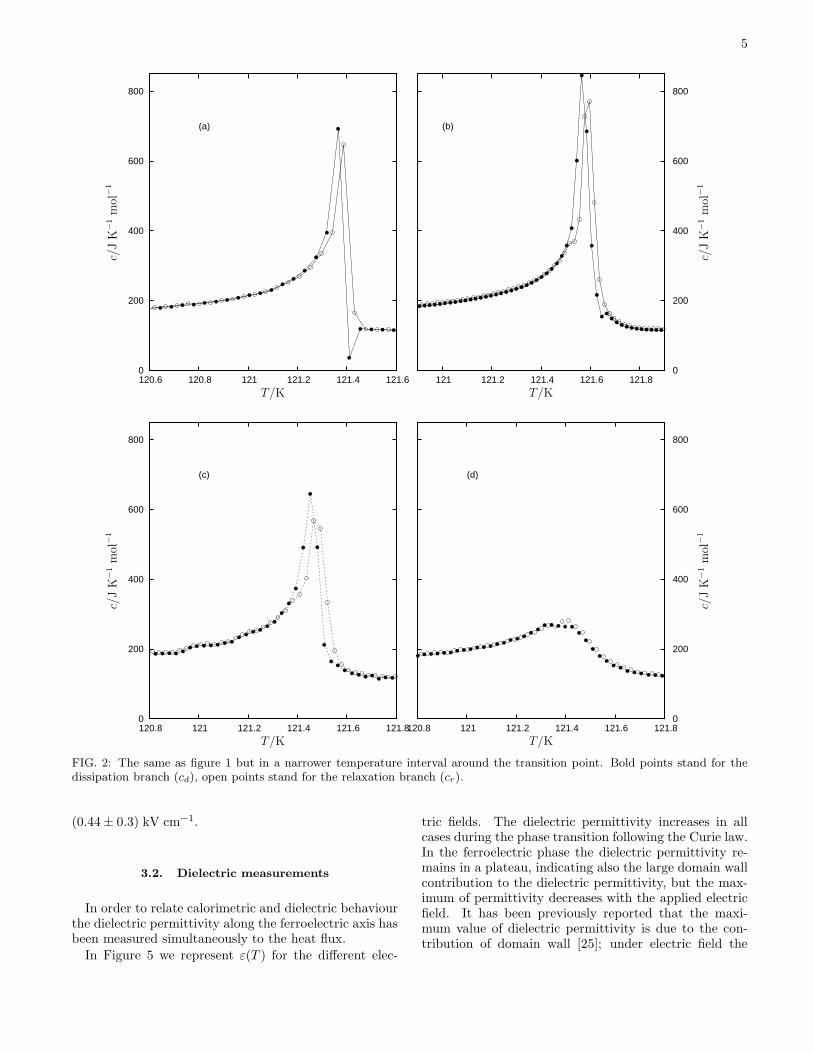
cess obtained in the dissipation branch (cd) and in therelaxation branch (cr) in a narrow temperature inter-val, 1 K, for each electric field. We observed that for0 V cm−1, 100 V cm−1 and 400 V cm−1, cd and cr datado not coincide around the transition temperature whilefor 1000 V cm−1 both series of data almost coincide inthe whole range of temperature. As we have statedabove, the temperature variation of the sample due tothe thermal pulses is slightly higher than the variationdue to the temperature ramp. This means that in ev-ery period the temperature of the sample increases anddecreases consecutively. Due to thermal hysteresis, to ki-netics of the phase transition etc, the process of heatingand cooling when two phases coexist is different and con-sequently data obtained in the dissipation branch and re-laxation branch become different under these conditions.We have reported previously that the difference is verynotorious even in systems near the tricritical point, wherethe latent heat is very small ( L = 0.13 J g−1 for KMnF3,L = 0.010 J g−1 for KMn0.997Ca0.003F3)[16].Hence, in the case of KDP, it is clear from Figure 2 that
for 0 V cm−1, 100 V cm−1 and 400 V cm−1 the phasetransition is discontinuous. On the contrary, the simi-lar behaviour of cd and cr for 1000 V cm−1, Figure 2d,indicate that no trace of latent heat is present, so we candeduce that for 1000 V cm−1 the phase transition is con-tinuous. Hence the critical field lies between 400 V cm−1
and 1000 V cm−1.On the other hand, the baseline respect which the
fluxmeter emf is integrated in order to calculate the spe-cific heat is the underline signal due to the temperatureramp imposed on the calorimeter. This signal changesvery slowly and it does not affect to the specific heatmeasurement except when a latent heat effect happens.It produces a non linear variation of the baseline andconsequently erroneous data of specific heat may appear.Keeping in mind that the measurements have been car-ried out in a cooling ramp, in Figure 2a the first cr at thebeginning of the transition which does not coincide withthe corresponding cd data is lower than the regular con-tribution to the specific heat. In Figure 2b we can alsoobserve such a similar point but this effect is smeared.Finally, in Figure 2c we cannot observe any decrease incr. Nevertheless, cr deviates from cd in a small rangeof temperature as in the two previous figures. Hence,we can deduce that latent heat decreases with field andshould be very small for 400 V cm−1.
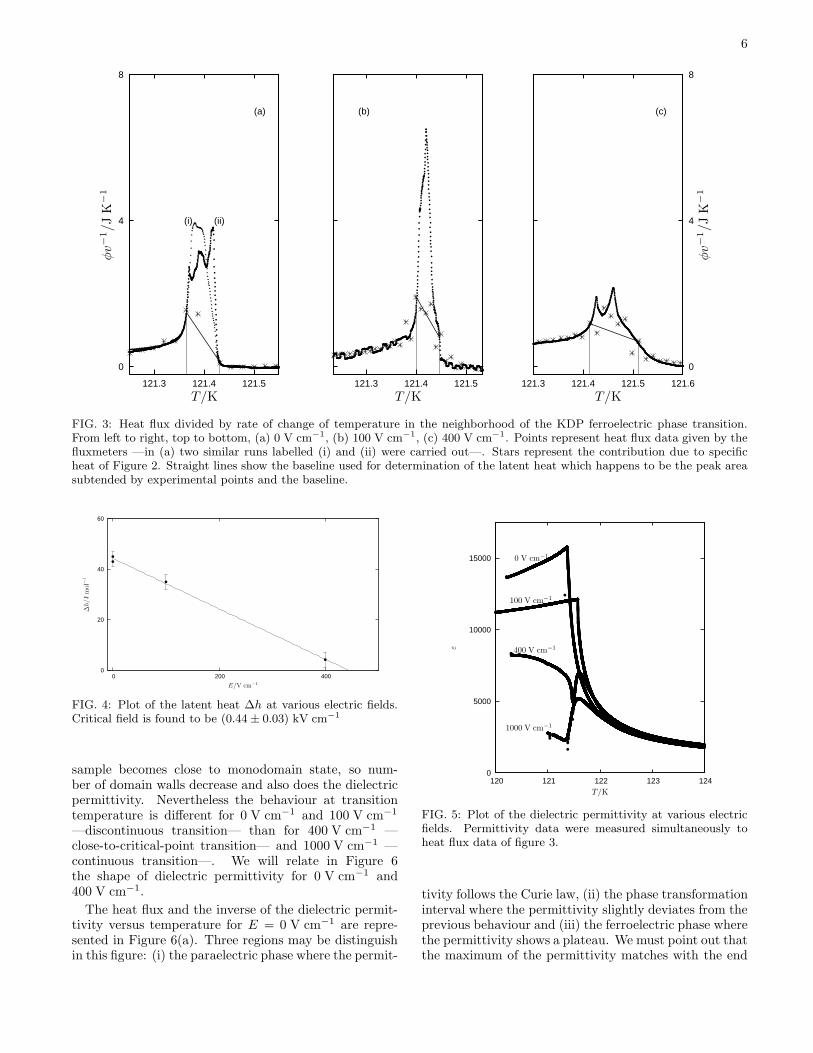
To confirm this suggestion and to calculate the latentheat, we measured the DTA trace in a second run, chang-ing the temperature of the sample at the same constantrate used in the specific heat measurements to make bothsets of data comparable. We must point out that therate of change of temperature is about two orders ofmagnitude lower than the minimum value achieved inconventional DTA equipments. In Figure 3, we repre-sent the heat flux given by the fluxmeters φd/v (DTAtrace) and the heat flux φc/v calculated from the specificheat data, using the method previously described, for thefields 0 V cm−1 (a), 100 V cm−1 (b), 400 V cm−1 (c).
For 0 V cm−1 and 100 V cm−1 φd/v is higher thanφc/v in a very small temperature interval of about 0.05 K,showing the effect of latent heat. For 400 V cm−1φd/v isalso higher than φc/v, but the difference between themis smaller, indicating a very small latent heat.
The choosing of the baseline to determine the latentheat value for 0 V cm−1 in graph Figure 3a(i) is diffi-cult due to the very small temperature interval wherethe latent heat is present and, consequently, the few datarecorded inside that interval. Anyway, by considering asbaseline the straight line between the extreme tempera-tures where φd/v and φc/v coincide, we obtain a value of43 J mol−1. This line is also represented in Figure 3a).The value obtained for KDP deuterated at 80% using thesame set-up and procedure was 317 J mol−1[24].
To confirm the validity of that baseline election weagain measured the heat flux exchanged by the samplein identical conditions. Those heat flux data are alsoplotted in the Figure 3a(ii). The figure shows that bothheat flux data coincide with φc (stars) in the same rangeof temperature thus supporting the baseline used for thedetermination of the latent heat. In fact, the latent heatfor the second run is 45 J mol−1 in good agreement withthat of the first one. On the other hand, these valuesof the latent heat are in agreement with Reese[6]. It isnoteworthy that peak area —i.e. latent heat— is quitereproducible despite the kinetic effects that showed eachexperiment. On the contrary, the difference observed if
4
119 120 121 122 123 124 125 0
200
400
600
800
(b)
PSfra
grep
lacem
ents
c/J
K−
1m
ol−
1
T/K
119 120 121 122 123 124 125 0
200
400
600
800
(d)
PSfra
grep
lacem
ents
c/J
K−
1m
ol−
1
T/K
0
200
400
600
800
119 120 121 122 123 124 125
(a)
PSfra
grep
lacem
ents
c/J
K−
1m
ol−
1
T/K
0
200
400
600
800
119 120 121 122 123 124 125
(c)
PSfra
grep
lacem
ents
c/J
K−
1m
ol−
1
T/K
FIG. 1: The specific heat of KDP for different applied electric fields in a wide temperature interval. From left to right and topto bottom, (a) 0 V cm−1and (b) 100 V cm−1, (c) 400 V cm−1and (d) 1000 V cm−1.
φ/v during the phase transitions suggests the existenceof non-equilibrium kinetic process as those expected fora discontinuous phase transition —for instance phasefront generation— which, as a general fact, are nonre-producible.
For E = 100 V cm−1 and E = 400 V cm−1 we de-creased the scanning rate of temperature when measuringspecific heat so as to get a higher number of data pointsin the neighborhood of the phase transition. Hence, the
determination of the baseline becomes easier as shown inFigure 3. The integration of the peaks gives 35 J mol−1
and 4.2 J mol−1 respectively.
The obtained result confirm that latent heat dimin-ishes with electric field (see Figure 4). At 400 V cm−1
latent heat is reduced by and order of magnitude withrespect to that of zero field and it is close to the criti-cal field. Assuming a linear behaviour of the latent heatwith the field we deduce that the critical field lies on
5
121 121.2 121.4 121.6 121.8 0
200
400
600
800
(b)
PSfra
grep
lacem
ents
c/J
K−
1m
ol−
1
T/K
120.8 121 121.2 121.4 121.6 121.8 0
200
400
600
800
(d)
PSfra
grep
lacem
ents
c/J
K−
1m
ol−
1
T/K
0
200
400
600
800
120.6 120.8 121 121.2 121.4 121.6
(a)
PSfra
grep
lacem
ents
c/J
K−
1m
ol−
1
T/K
0
200
400
600
800
120.8 121 121.2 121.4 121.6 121.8
(c)
PSfra
grep
lacem
ents
c/J
K−
1m
ol−
1
T/K
FIG. 2: The same as figure 1 but in a narrower temperature interval around the transition point. Bold points stand for thedissipation branch (cd), open points stand for the relaxation branch (cr).
(0.44± 0.3) kV cm−1.
3.2. Dielectric measurements
In order to relate calorimetric and dielectric behaviourthe dielectric permittivity along the ferroelectric axis hasbeen measured simultaneously to the heat flux.
In Figure 5 we represent ε(T ) for the different elec-
tric fields. The dielectric permittivity increases in allcases during the phase transition following the Curie law.In the ferroelectric phase the dielectric permittivity re-mains in a plateau, indicating also the large domain wallcontribution to the dielectric permittivity, but the max-imum of permittivity decreases with the applied electricfield. It has been previously reported that the maxi-mum value of dielectric permittivity is due to the con-tribution of domain wall [25]; under electric field the
6
8
4
0
121.5121.4121.3
(a)
(i) (ii)
PSfra
grep
lacem
ents
φv−
1/J
K−
1
T/K121.5121.4121.3
(b)
PSfra
grep
lacem
ents
φv−
1/J
K−
1 T/K121.6121.5121.4121.3
8
4
0
(c)
PSfra
grep
lacem
ents
φv−
1/J
K−
1
T/K
1
FIG. 3: Heat flux divided by rate of change of temperature in the neighborhood of the KDP ferroelectric phase transition.From left to right, top to bottom, (a) 0 V cm−1, (b) 100 V cm−1, (c) 400 V cm−1. Points represent heat flux data given by thefluxmeters —in (a) two similar runs labelled (i) and (ii) were carried out—. Stars represent the contribution due to specificheat of Figure 2. Straight lines show the baseline used for determination of the latent heat which happens to be the peak areasubtended by experimental points and the baseline.
0
20
40
60
0 200 400
PSfra
grep
lacem
ents
E/V cm−1
∆h/J
mol−
1
FIG. 4: Plot of the latent heat ∆h at various electric fields.Critical field is found to be (0.44± 0.03) kV cm−1
sample becomes close to monodomain state, so num-ber of domain walls decrease and also does the dielectricpermittivity. Nevertheless the behaviour at transitiontemperature is different for 0 V cm−1 and 100 V cm−1
—discontinuous transition— than for 400 V cm−1 —close-to-critical-point transition— and 1000 V cm−1 —continuous transition—. We will relate in Figure 6the shape of dielectric permittivity for 0 V cm−1 and400 V cm−1.
The heat flux and the inverse of the dielectric permit-tivity versus temperature for E = 0 V cm−1 are repre-sented in Figure 6(a). Three regions may be distinguishin this figure: (i) the paraelectric phase where the permit-
0
5000
10000
15000
120 121 122 123 124
PSfra
grep
lacem
ents
φv−
1/J
K−
1
T/K
ε
0 V cm−1
100 V cm−1
400 V cm−1
1000 V cm−1
FIG. 5: Plot of the dielectric permittivity at various electricfields. Permittivity data were measured simultaneously toheat flux data of figure 3.
tivity follows the Curie law, (ii) the phase transformationinterval where the permittivity slightly deviates from theprevious behaviour and (iii) the ferroelectric phase wherethe permittivity shows a plateau. We must point out thatthe maximum of the permittivity matches with the end
7
4
2
0
121.5121.4121.3
0.0002
0.0001
0
(a)
PSfra
grep
lacem
ents
φv−
1/J
K−
1
T/K
1/ε
ε
0
2
4
121.4 121.6 121.8 4000
6000
8000
(b)
PSfra
grep
lacem
ents
φv−
1/J
K−
1
T/K
1/ε
ε
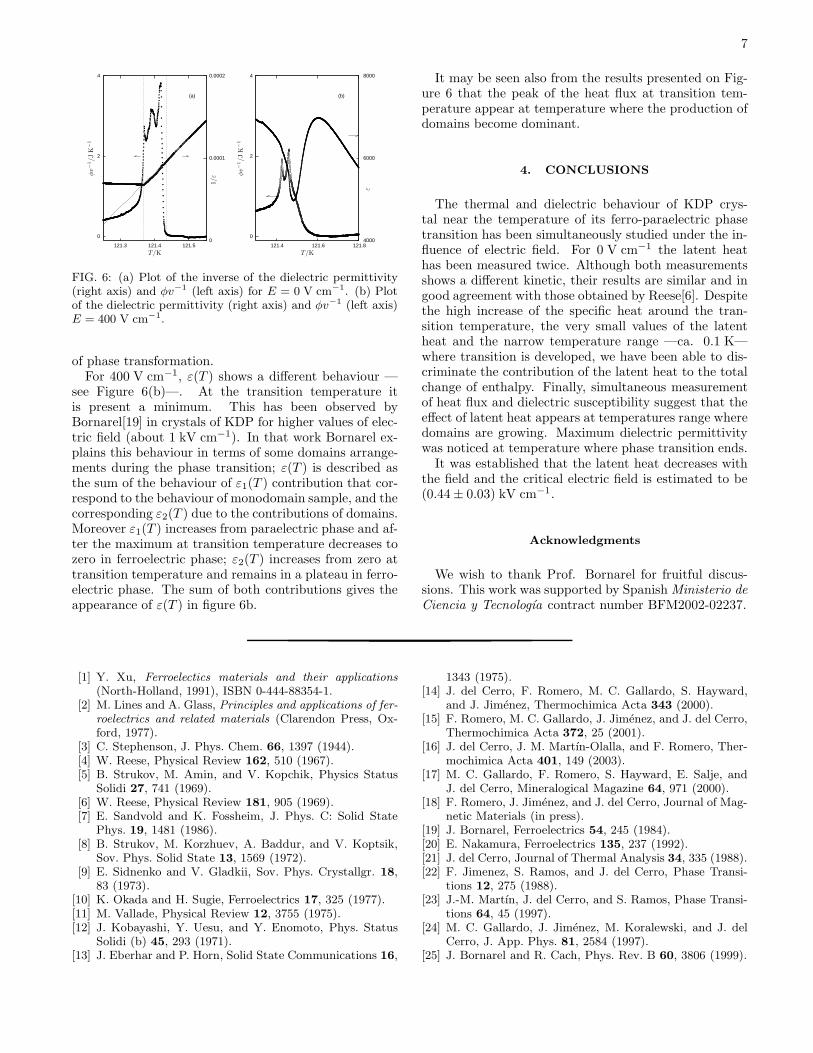
FIG. 6: (a) Plot of the inverse of the dielectric permittivity(right axis) and φv−1 (left axis) for E = 0 V cm−1. (b) Plotof the dielectric permittivity (right axis) and φv−1 (left axis)E = 400 V cm−1.
of phase transformation.For 400 V cm−1, ε(T ) shows a different behaviour —
see Figure 6(b)—. At the transition temperature itis present a minimum. This has been observed byBornarel[19] in crystals of KDP for higher values of elec-tric field (about 1 kV cm−1). In that work Bornarel ex-plains this behaviour in terms of some domains arrange-ments during the phase transition; ε(T ) is described asthe sum of the behaviour of ε1(T ) contribution that cor-respond to the behaviour of monodomain sample, and thecorresponding ε2(T ) due to the contributions of domains.Moreover ε1(T ) increases from paraelectric phase and af-ter the maximum at transition temperature decreases tozero in ferroelectric phase; ε2(T ) increases from zero attransition temperature and remains in a plateau in ferro-electric phase. The sum of both contributions gives theappearance of ε(T ) in figure 6b.
It may be seen also from the results presented on Fig-ure 6 that the peak of the heat flux at transition tem-perature appear at temperature where the production ofdomains become dominant.
4. CONCLUSIONS
The thermal and dielectric behaviour of KDP crys-tal near the temperature of its ferro-paraelectric phasetransition has been simultaneously studied under the in-fluence of electric field. For 0 V cm−1 the latent heathas been measured twice. Although both measurementsshows a different kinetic, their results are similar and ingood agreement with those obtained by Reese[6]. Despitethe high increase of the specific heat around the tran-sition temperature, the very small values of the latentheat and the narrow temperature range —ca. 0.1 K—where transition is developed, we have been able to dis-criminate the contribution of the latent heat to the totalchange of enthalpy. Finally, simultaneous measurementof heat flux and dielectric susceptibility suggest that theeffect of latent heat appears at temperatures range wheredomains are growing. Maximum dielectric permittivitywas noticed at temperature where phase transition ends.It was established that the latent heat decreases with
the field and the critical electric field is estimated to be(0.44± 0.03) kV cm−1.
Acknowledgments
We wish to thank Prof. Bornarel for fruitful discus-sions. This work was supported by Spanish Ministerio de
Ciencia y Tecnologıa contract number BFM2002-02237.
[1] Y. Xu, Ferroelectics materials and their applications
(North-Holland, 1991), ISBN 0-444-88354-1.[2] M. Lines and A. Glass, Principles and applications of fer-
roelectrics and related materials (Clarendon Press, Ox-ford, 1977).
[3] C. Stephenson, J. Phys. Chem. 66, 1397 (1944).[4] W. Reese, Physical Review 162, 510 (1967).[5] B. Strukov, M. Amin, and V. Kopchik, Physics Status
Solidi 27, 741 (1969).[6] W. Reese, Physical Review 181, 905 (1969).[7] E. Sandvold and K. Fossheim, J. Phys. C: Solid State
Phys. 19, 1481 (1986).[8] B. Strukov, M. Korzhuev, A. Baddur, and V. Koptsik,
Sov. Phys. Solid State 13, 1569 (1972).[9] E. Sidnenko and V. Gladkii, Sov. Phys. Crystallgr. 18,
83 (1973).[10] K. Okada and H. Sugie, Ferroelectrics 17, 325 (1977).[11] M. Vallade, Physical Review 12, 3755 (1975).[12] J. Kobayashi, Y. Uesu, and Y. Enomoto, Phys. Status
Solidi (b) 45, 293 (1971).[13] J. Eberhar and P. Horn, Solid State Communications 16,
1343 (1975).[14] J. del Cerro, F. Romero, M. C. Gallardo, S. Hayward,
and J. Jimenez, Thermochimica Acta 343 (2000).[15] F. Romero, M. C. Gallardo, J. Jimenez, and J. del Cerro,
Thermochimica Acta 372, 25 (2001).[16] J. del Cerro, J. M. Martın-Olalla, and F. Romero, Ther-
mochimica Acta 401, 149 (2003).[17] M. C. Gallardo, F. Romero, S. Hayward, E. Salje, and
J. del Cerro, Mineralogical Magazine 64, 971 (2000).[18] F. Romero, J. Jimenez, and J. del Cerro, Journal of Mag-
netic Materials (in press).[19] J. Bornarel, Ferroelectrics 54, 245 (1984).[20] E. Nakamura, Ferroelectrics 135, 237 (1992).[21] J. del Cerro, Journal of Thermal Analysis 34, 335 (1988).[22] F. Jimenez, S. Ramos, and J. del Cerro, Phase Transi-
tions 12, 275 (1988).[23] J.-M. Martın, J. del Cerro, and S. Ramos, Phase Transi-
tions 64, 45 (1997).[24] M. C. Gallardo, J. Jimenez, M. Koralewski, and J. del
Cerro, J. App. Phys. 81, 2584 (1997).[25] J. Bornarel and R. Cach, Phys. Rev. B 60, 3806 (1999).