Kd skladi part 2
13
15 Description: Naftna industrija Srbije is a vertically integrated oil and gas company incorporated in Serbia. Sector: Energy Market Cap: €1.3bn (RSD 145bn) Current Price: RSD 890 Upside: 23% Strengths: A vertically integrated oil&gas company which is highly profitable as oil prices are liberalised and royalty taxes are very low Privatised in 2009 when GazpromNeft became a majority shareholder GPN brought industry know-how and started an investment cycle after which operational efficiency increased significantly One of the lowest valuations among regional peers at 2.8 2013 EV/EBITDA Stock story: NIS (Serbia) Current overweight 5.5% 500 550 600 650 700 750 800 850 900 950 30.06.2011 31.07.2011 31.08.2011 30.09.2011 31.10.2011 30.11.2011 31.12.2011 31.01.2012 29.02.2012 31.03.2012 30.04.2012 31.05.2012 30.06.2012 31.07.2012 31.08.2012 30.09.2012 31.10.2012 30.11.2012 31.12.2012 31.01.2013 28.02.2013 Profit taking Buy Buy Recommendation: Buy
-
Upload
citywirewebsite -
Category
Documents
-
view
314 -
download
2
Transcript of Kd skladi part 2
15
Description: Naftna industrija Srbije is a
vertically integrated oil and gas company
incorporated in Serbia.
Sector: Energy
Market Cap: €1.3bn (RSD 145bn)
Current Price: RSD 890
Upside: 23%
Strengths:
A vertically integrated oil&gas company
which is highly profitable as oil prices are
liberalised and royalty taxes are very low
Privatised in 2009 when GazpromNeft
became a majority shareholder
GPN brought industry know-how and started
an investment cycle after which operational
efficiency increased significantly
One of the lowest valuations among regional
peers at 2.8 2013 EV/EBITDA
Stock story: NIS (Serbia) Current overweight 5.5%
500
550
600
650
700
750
800
850
900
950
30.06.2011
31.07.2011
31.08.2011
30.09.2011
31.10.2011
30.11.2011
31.12.2011
31.01.2012
29.02.2012
31.03.2012
30.04.2012
31.05.2012
30.06.2012
31.07.2012
31.08.2012
30.09.2012
31.10.2012
30.11.2012
31.12.2012
31.01.2013
28.02.2013
Profit taking
Buy Buy
Recommendation: Buy
16
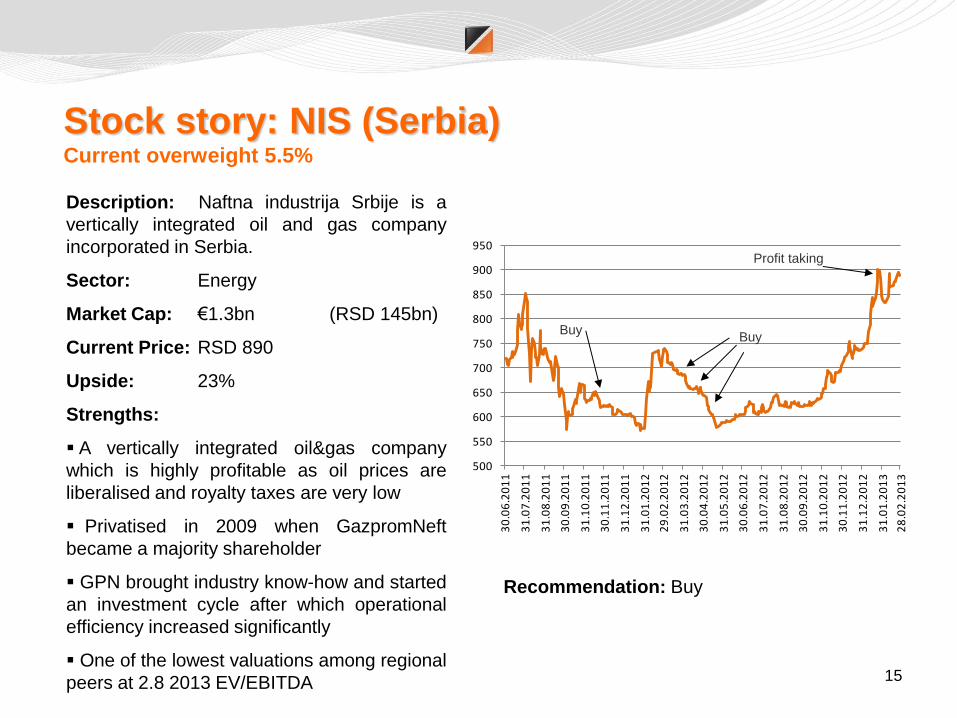
Description: Fondul Proprietatea is a joint
stock company operating as a closed-end
investment company incorporated in Romania.
Sector: Financials with underlying exposure in
the energy sector.
Market Cap: €1.88bn (RON 8.22bn)
Current Price: 0,596 RON
Upside: 21%
Strengths:
Trading at an unjustified discount on NAV
Diversified portfolio with main exposure in
the energy sector
IPO/SPOs: according to privatisation plans
stakes in Transgaz, Romagaz and
Nuclearelectirca (approx. 15% of the
portfolio) could be placed on
market in 2013
Warsaw listing could increase foreign investor
base
Recommendation: Buy
Stock story: Fondul Proprietata (Romania) Current overweight 4.9%
0,4
0,45
0,5
0,55
0,6
0,65
30.0
6.2
011
31.0
8.2
011
31.1
0.2
011
31.1
2.2
011
29.0
2.2
012
30.0
4.2
012
30.0
6.2
012
31.0
8.2
012
31.1
0.2
012
31.1
2.2
012
28.0
2.2
013
Buy
Buy
Profit taking
Buy

17
KD, the Asset Manager for the region
The privatisation process in many Balkan countries has not been finalised. Privatisation, even partial, is making companies more efficient and better managed. KD has deep experience and understanding of the way governments behave in privatisation processes
KD investment professionals have an extensive information network which is
imperative when dealing in these relationship-based markets
KD investment professionals speak the local language and understand the market
dynamics
One trigger to increase shareholder value in regional companies is to improve corporate governance and transparency. KD actively works to improve the corporate governance of the companies we own and we convey our views about specific corporate governance issues through formal and informal communication with the management of companies in which we invest
KD has extensive knowledge of the regulatory environment in each Balkan
country
KD can access tightly held/concentrated shareholdings
KD has been investing in the region for over 15 years
Appendix
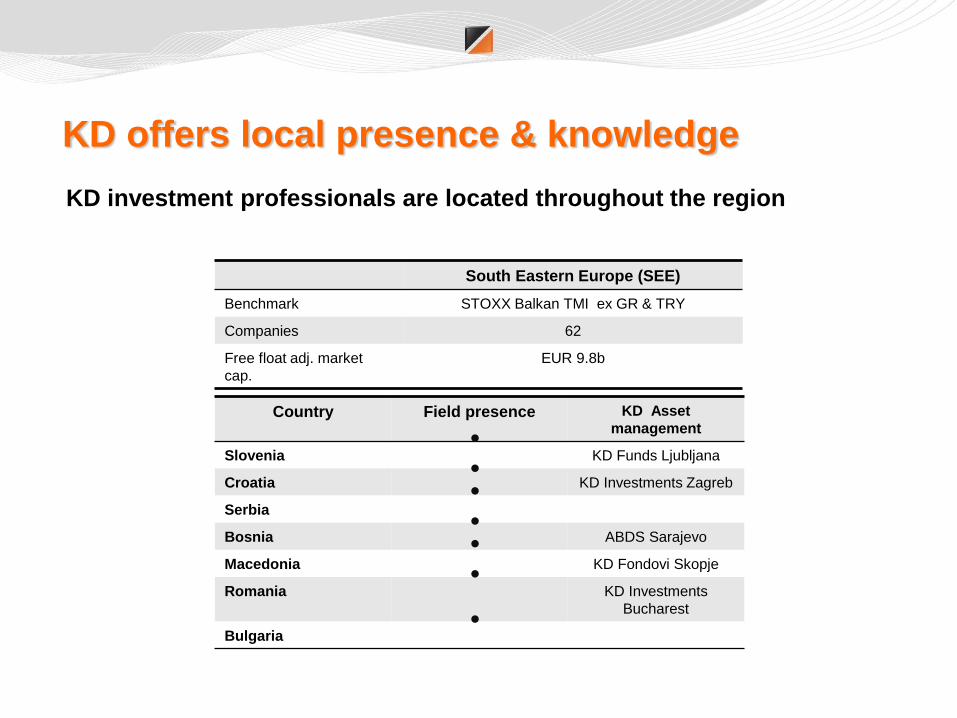
Country Field presence KD Asset
management
Slovenia KD Funds Ljubljana
Croatia KD Investments Zagreb
Serbia
Bosnia ABDS Sarajevo
Macedonia KD Fondovi Skopje
Romania
KD Investments
Bucharest
Bulgaria
South Eastern Europe (SEE)
Benchmark STOXX Balkan TMI ex GR & TRY
Companies 62
Free float adj. market
cap.
EUR 9.8b
KD offers local presence & knowledge
KD investment professionals are located throughout the region
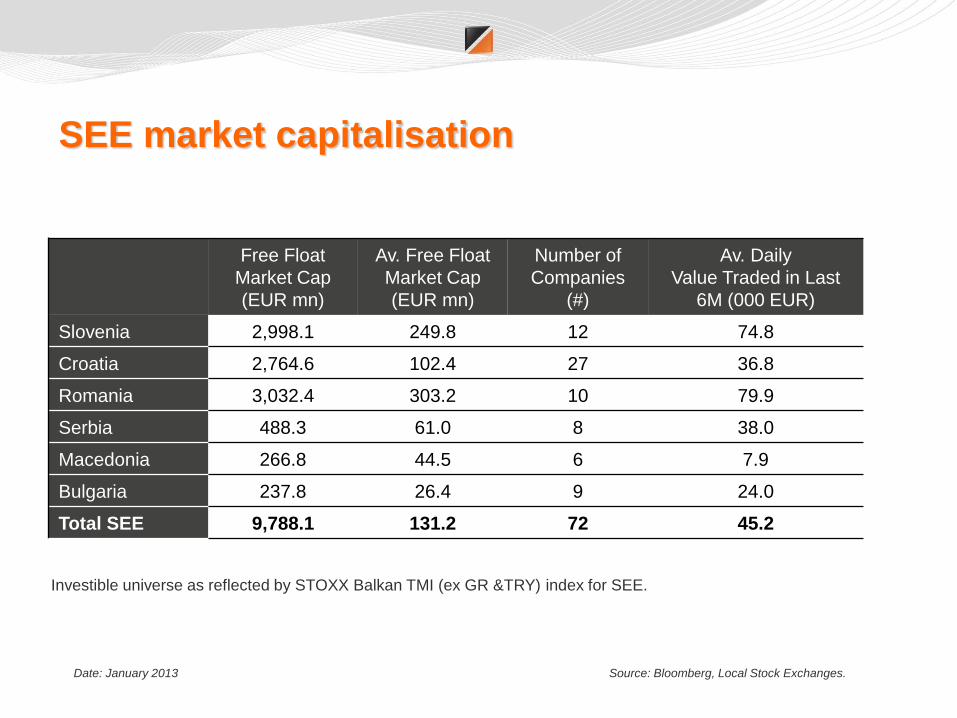
SEE market capitalisation
Free Float
Market Cap
(EUR mn)
Av. Free Float
Market Cap
(EUR mn)
Number of
Companies
(#)
Av. Daily
Value Traded in Last
6M (000 EUR)
Slovenia 2,998.1 249.8 12 74.8
Croatia 2,764.6 102.4 27 36.8
Romania 3,032.4 303.2 10 79.9
Serbia 488.3 61.0 8 38.0
Macedonia 266.8 44.5 6 7.9
Bulgaria 237.8 26.4 9 24.0
Total SEE 9,788.1 131.2 72 45.2
Source: Bloomberg, Local Stock Exchanges. Date: January 2013
Investible universe as reflected by STOXX Balkan TMI (ex GR &TRY) index for SEE.
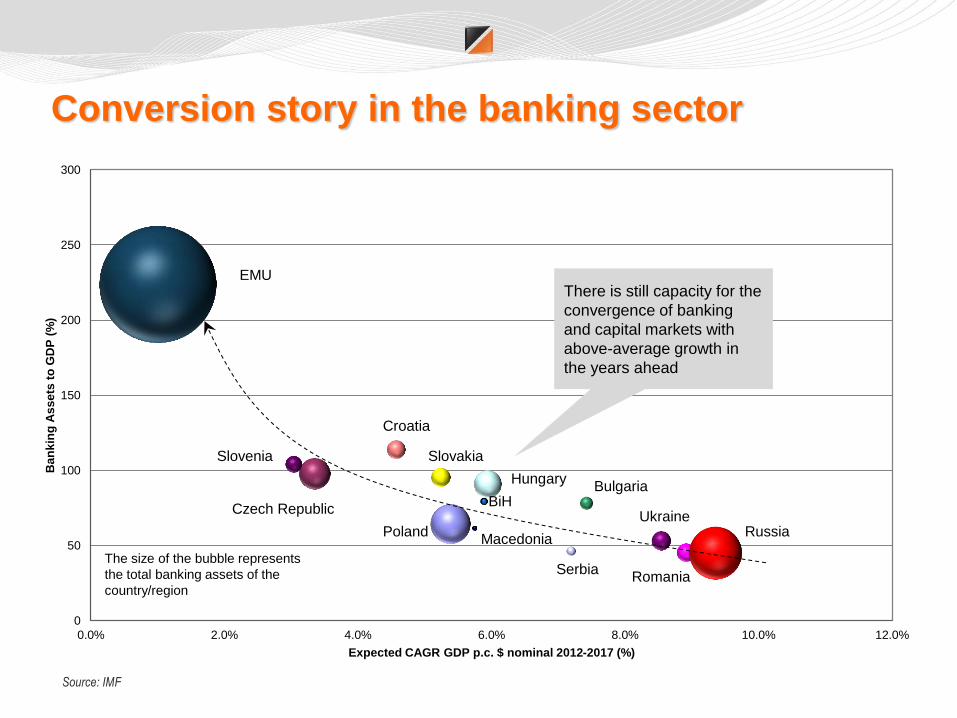
Conversion story in the banking sector
Source: IMF
0
50
100
150
200
250
300
0.0% 2.0% 4.0% 6.0% 8.0% 10.0% 12.0%
Ban
kin
g A
ss
ets
to
GD
P (
%)
Expected CAGR GDP p.c. $ nominal 2012-2017 (%)
The size of the bubble represents
the total banking assets of the
country/region
There is still capacity for the
convergence of banking
and capital markets with
above-average growth in
the years ahead
EMU
Slovenia
Czech Republic
Croatia
Slovakia
Poland
Hungary
BiH
Macedonia
Serbia
Bulgaria
Ukraine Russia
Romania

Convergence in the consumer sector suffered a
setback Slovenia looks to be at the end of convergence
0.0%
20.0%
40.0%
60.0%
80.0%
100.0%
120.0%
140.0%
160.0%
0.0% 2.0% 4.0% 6.0% 8.0% 10.0% 12.0% 14.0%
% o
f EU
per
son
al c
on
sum
pti
on
per
cap
ita
aver
age
Nominal growth in personal consumption per capita 2001 - 2011 (% CAGR)
Austria
Poland
Romania Bulgaria
Czech Rep.
Slovenia
Macedonia
Slovakia Croatia
EU 27
Hungary
Austria was a major beneficiary of
CEE and SEE convergence
Slovenia was the first SEE
country to adopt the euro and a
successful example of
convergence
Countries where the most
notable medium-term
purchasing power
convergence effect is expected
Countries where the strong
long-term effect of purchasing
power convergence is
expected
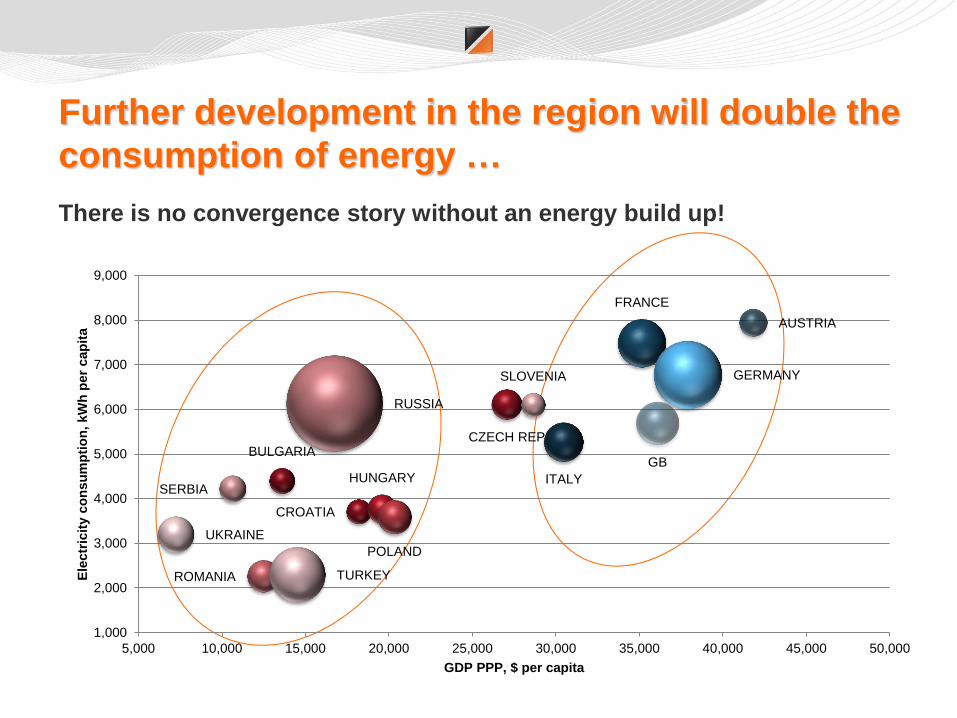
Further development in the region will double the
consumption of energy …
There is no convergence story without an energy build up!
AUSTRIA
BULGARIA
CROATIA
CZECH REP
FRANCE
GERMANY
HUNGARY ITALY
POLAND
ROMANIA
RUSSIA
SERBIA
SLOVENIA
TURKEY
UKRAINE
GB
1,000
2,000
3,000
4,000
5,000
6,000
7,000
8,000
9,000
5,000 10,000 15,000 20,000 25,000 30,000 35,000 40,000 45,000 50,000
Ele
ctr
icit
y c
on
su
mp
tio
n,
kW
h p
er
cap
ita
GDP PPP, $ per capita
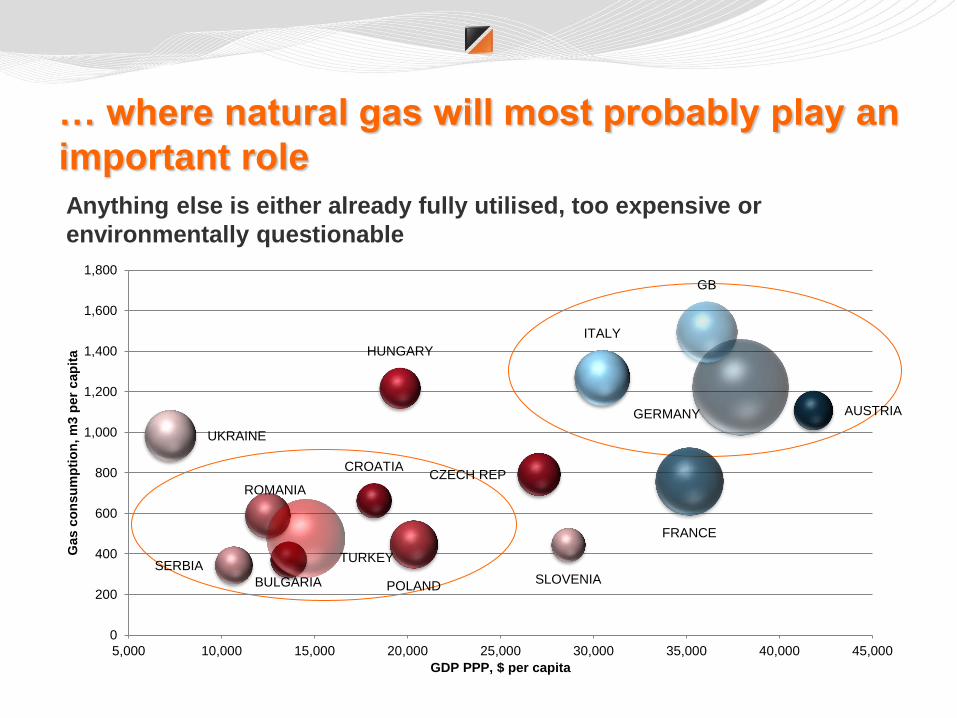
… where natural gas will most probably play an
important role
Anything else is either already fully utilised, too expensive or
environmentally questionable
AUSTRIA
BULGARIA
CROATIA CZECH REP
FRANCE
GERMANY
HUNGARY
ITALY
POLAND
ROMANIA
SERBIA SLOVENIA
TURKEY
UKRAINE
GB
0
200
400
600
800
1,000
1,200
1,400
1,600
1,800
5,000 10,000 15,000 20,000 25,000 30,000 35,000 40,000 45,000
Gas c
on
su
mp
tio
n, m
3 p
er
cap
ita
GDP PPP, $ per capita
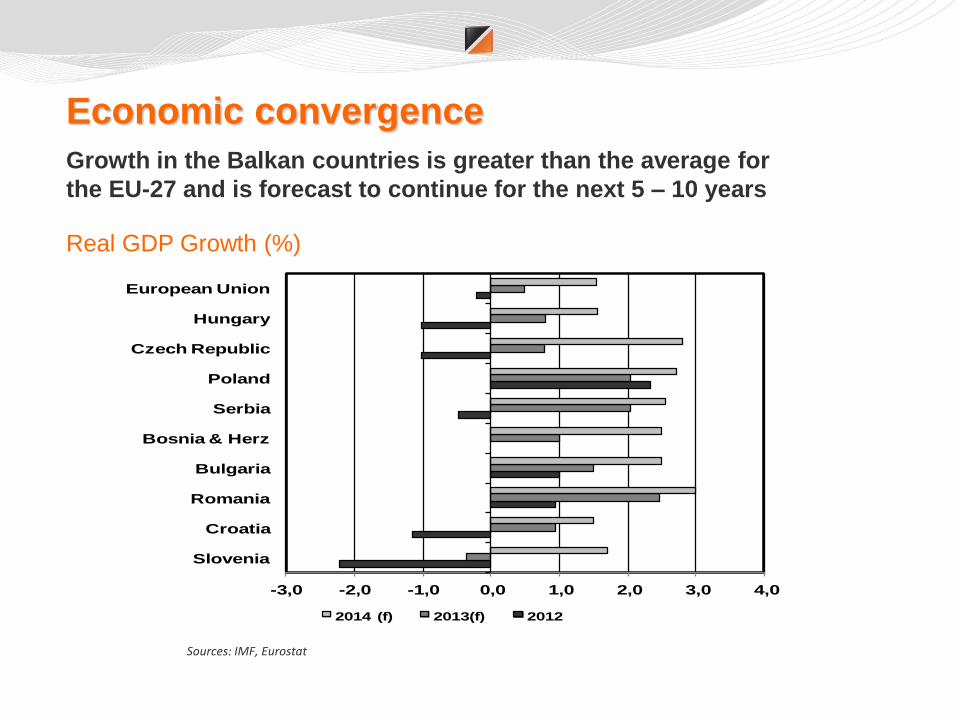
Economic convergence
Growth in the Balkan countries is greater than the average for
the EU-27 and is forecast to continue for the next 5 – 10 years
Real GDP Growth (%)
Sources: IMF, Eurostat
-3,0 -2,0 -1,0 0,0 1,0 2,0 3,0 4,0
Slovenia
Croatia
Romania
Bulgaria
Bosnia & Herz
Serbia
Poland
Czech Republic
Hungary
European Union
2014 (f) 2013(f) 2012
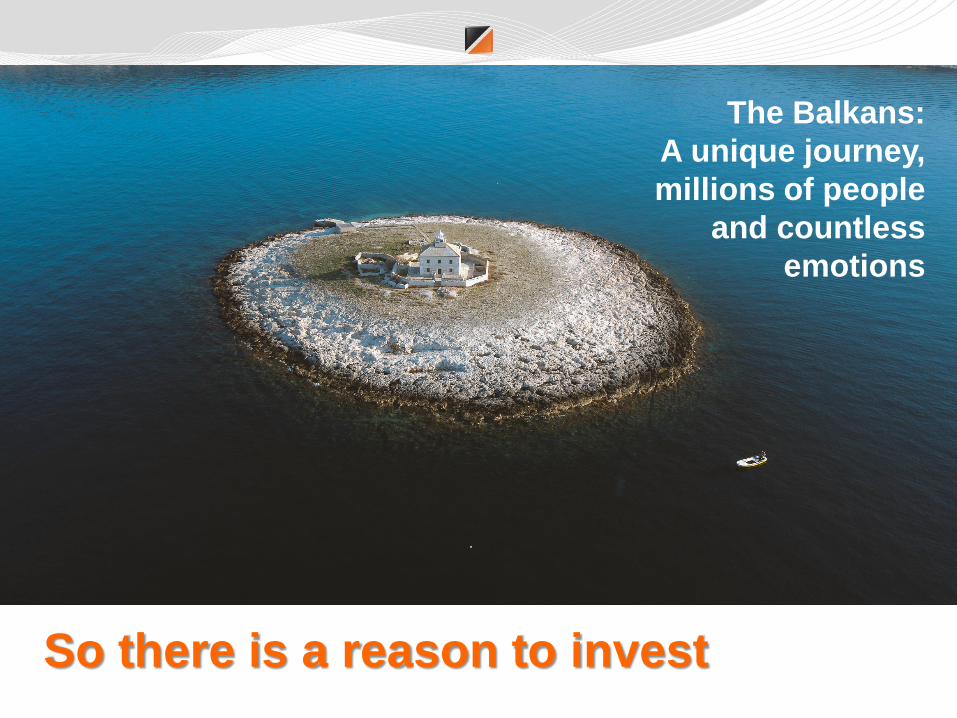
So there is a reason to invest
• TThe
The Balkans:
A unique journey,
millions of people
and countless
emotions
Disclaimer
This presentation is provided for information purposes only and does not constitute financial or investment advice or form part of an
offer, subscription, recommendation or solicitation to buy or sell any financial instrument, nor should it be relied on in connection
with any contract or commitment. Returns are not guaranteed and investment returns tend to fluctuate. Past performance does not
guarantee future results.
KD Funds – Management Company LLC (KD Skladi, družba za upravljanje, d. o. o.), Dunajska cesta 63, Ljubljana, Slovenia,
manages the KD Umbrella Fund and its subfunds KD Galileo, Mixed Flexible Fund; KD Rastko, Europe Equity Fund; KD Bond –
EUR; KD MM, Money Market - EUR; KD First Selection, Fund of Equity Funds; KD Balkan, Equity; KD New Markets, Equity; KD
Raw Materials and Energy, Equity; KD Technology, Equity; KD Vitality, Equity; KD India – China, Equity; KD Latin America, Equity;
KD Eastern Europe, Equity; and KD Dividend, Equity. Hard copies of the prospectus including the fund rules, the Key Investor
Information Document (KIID), and the latest published annual and semi-annual reports in the Slovenian language are available to
investors free of charge at the company's headquarters and subscription offices, and in e-format on the website www.kd-skladi.si.
KD Funds is registered in Slovenia.
![KD-R975BTS / KD-R970BTS / KD-R97MBS / KD … Size: B6L (182 mm x 128 mm) Book Size: B6L (182 mm x 128 mm) ENGLISH FRANÇAIS ESPAÑOL B5A-0813-10 [K] KD-R975BTS / KD-R970BTS / KD-R97MBS](https://static.fdocuments.in/doc/165x107/5aaf5da87f8b9a25088d67a8/kd-r975bts-kd-r970bts-kd-r97mbs-kd-size-b6l-182-mm-x-128-mm-book-size.jpg)


![KD-R981BT / KD-R889BT / KD-R881BT / KD-R784BT / KD ...Data Size: B6L (182 mm x 128 mm) Book Size: B6L (182 mm x 128 mm) ENGLISH FRANÇAIS DEUTSCH РУCCKИЙ B5A-1353-00 [E] KD-R981BT](https://static.fdocuments.in/doc/165x107/60f8a461e650da6d260a5f67/kd-r981bt-kd-r889bt-kd-r881bt-kd-r784bt-kd-data-size-b6l-182-mm-x.jpg)

