Katrina Kosec - If You Give it, Trust Will Come: The Impacts of Community-Managed Cash Transfers
27
If You Give it, Trust Will Come: The Impacts of Community-Managed Cash Transfers Katrina Kosec International Food Policy Research Institute (IFPRI) Development Strategy and Governance Division Joint work with David K. Evans and Brian Holtemeyer Strengthening Institutions and Governance 9 Nov 2015 Evans, Holtemeyer, Kosec (2015) (IFPRI) 9 Nov 2015 1 / 27
Transcript of Katrina Kosec - If You Give it, Trust Will Come: The Impacts of Community-Managed Cash Transfers
If You Give it, Trust Will Come:The Impacts of Community-Managed Cash Transfers
Katrina Kosec
International Food Policy Research Institute (IFPRI)Development Strategy and Governance Division
Joint work with David K. Evans and Brian Holtemeyer
Strengthening Institutions and Governance9 Nov 2015
Evans, Holtemeyer, Kosec (2015) (IFPRI) 9 Nov 2015 1 / 27
Introduction
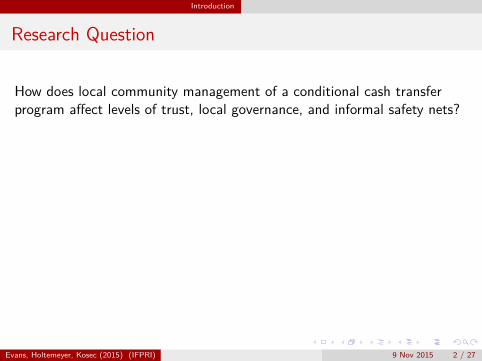
Research Question
How does local community management of a conditional cash transferprogram affect levels of trust, local governance, and informal safety nets?
Evans, Holtemeyer, Kosec (2015) (IFPRI) 9 Nov 2015 2 / 27
Introduction
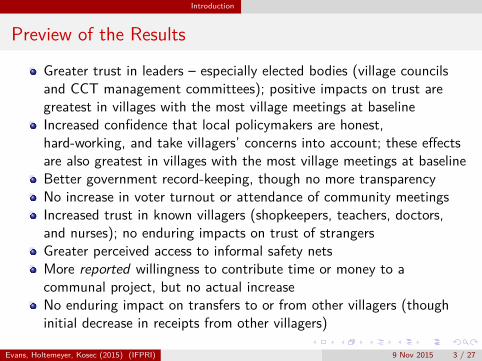
Preview of the Results
Greater trust in leaders – especially elected bodies (village councilsand CCT management committees); positive impacts on trust aregreatest in villages with the most village meetings at baselineIncreased confidence that local policymakers are honest,hard-working, and take villagers’ concerns into account; these effectsare also greatest in villages with the most village meetings at baselineBetter government record-keeping, though no more transparencyNo increase in voter turnout or attendance of community meetingsIncreased trust in known villagers (shopkeepers, teachers, doctors,and nurses); no enduring impacts on trust of strangersGreater perceived access to informal safety netsMore reported willingness to contribute time or money to acommunal project, but no actual increaseNo enduring impact on transfers to or from other villagers (thoughinitial decrease in receipts from other villagers)
Evans, Holtemeyer, Kosec (2015) (IFPRI) 9 Nov 2015 3 / 27
Introduction
Existing Literature
CCTs have grown in popularity in recent years
Evans, Holtemeyer, Kosec (2015) (IFPRI) 9 Nov 2015 4 / 27
Introduction
Existing Literature
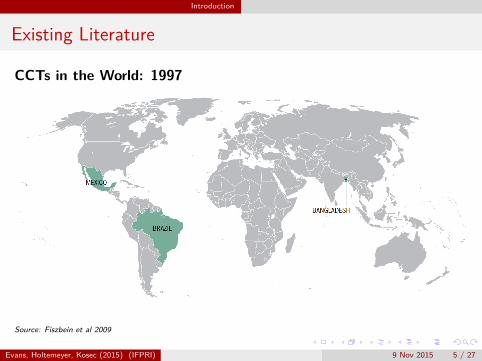
CCTs in the World: 1997
Source: Fiszbein et al 2009
Evans, Holtemeyer, Kosec (2015) (IFPRI) 9 Nov 2015 5 / 27
Introduction
Existing Literature
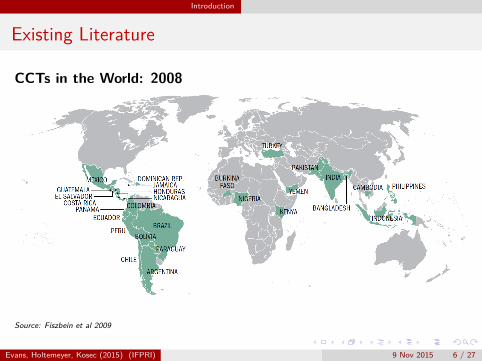
CCTs in the World: 2008
Source: Fiszbein et al 2009
Evans, Holtemeyer, Kosec (2015) (IFPRI) 9 Nov 2015 6 / 27
Introduction
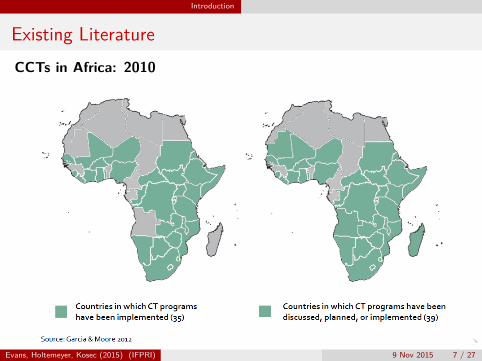
Existing LiteratureCCTs in Africa: 2010
Evans, Holtemeyer, Kosec (2015) (IFPRI) 9 Nov 2015 7 / 27
Introduction
Existing Literature
Almost every country in Latin America has a CCT program (Fiszbeinand Schady, 2009)As of 2010, at least 35 countries in Sub-Saharan Africa hadimplemented a cash transfer program; 14 made transfers conditionalon behaviors Garcia and Moore (2012)While much is known about the impacts of CCTs on education andhealth outcomes, far less is known about their impacts on trust,governance, and informal safety netsFor the most part, CCTs have relied on central governmentmanagement and administration, involving communities only lightly inthe processWe evaluate a novel program that elected community managementcommittees in each community to identify the most vulnerablehouseholds, verify compliance, and distribute transfers
Evans, Holtemeyer, Kosec (2015) (IFPRI) 9 Nov 2015 8 / 27
Introduction
Mixed Evidence on How CCTs Impact, Trust, Governance,and Informal Safety Nets
Positive effects:Increased cooperation as measured through a voluntary contributionmechanism game (Attanasio et al. 2015, Attanasio et al. 2009)Stronger relationships between beneficiary women (Adato 2000)Reduction in bribery (Grimes 2010)Increased trust in institutions (Camacho 2014)Reduced insurgent influence (Crost 2016)
Negative effects:Crowd out of private transfers (Albarran and Attanasio 2004) andremittances (Angelucci and De Giorgi 2009) to CCT recipient HHsWelfare programs can destroy social capital (Chong 2009)Targeted programs that involve extensive needs-testing and requirerecipients to divulge considerable private information reduce individualengagement with their community (Grimes 2010)
Can community management reduce any negative impacts?
Evans, Holtemeyer, Kosec (2015) (IFPRI) 9 Nov 2015 9 / 27
Background and data
Program Overview
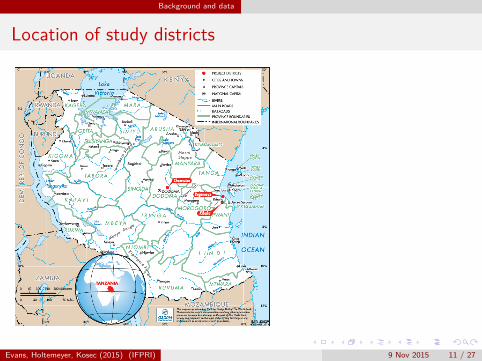
Randomized control trial: Community-managed Conditional CashTransfer (CCT) program piloted in 3 districts of TanzaniaProgram relied on elected community management committees toidentify the most vulnerable households, verify compliance, anddistribute transfers
A unique feature of this program which decentralized programadministration to the local level
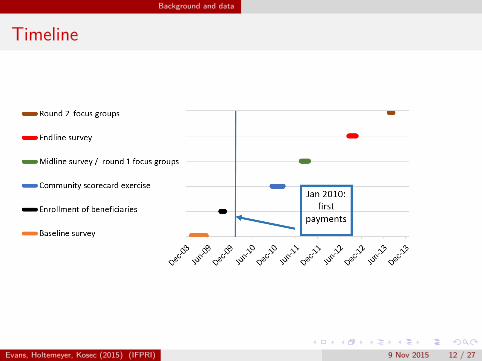
Approx. 1800 households, divided across 40 treatment villages and 40control villagesFirst transfers made in January 2010 (every 2 months)Amount of transfers ranged from a US $12 minimum to a US $36maximum, depending on household size and composition (mean:$16.50); about 10% of household expenditure
Evans, Holtemeyer, Kosec (2015) (IFPRI) 9 Nov 2015 10 / 27
Background and data
Location of study districts
Evans, Holtemeyer, Kosec (2015) (IFPRI) 9 Nov 2015 11 / 27
Background and data
Timeline
Evans, Holtemeyer, Kosec (2015) (IFPRI) 9 Nov 2015 12 / 27
Background and data
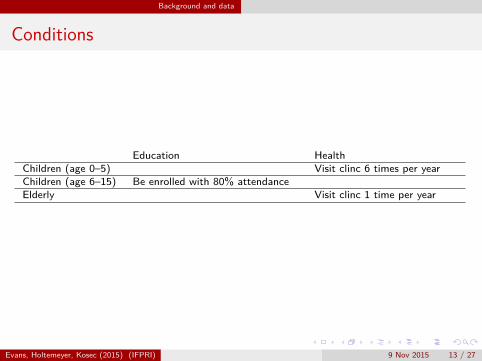
Conditions
Education HealthChildren (age 0–5) Visit clinc 6 times per yearChildren (age 6–15) Be enrolled with 80% attendanceElderly Visit clinc 1 time per year
Evans, Holtemeyer, Kosec (2015) (IFPRI) 9 Nov 2015 13 / 27

Empirical Strategy
Empirical Strategy and Econometric Specification
For household-level outcomes available in all periods we estimate:
hit = β0 + β12011t + β22012t + δ1Ti × 2011t+δ2Ti × 2012t + αi + εit
i indexes households and t indexes the survey roundyit is a trust outcomeαi are household fixed effectsTi =1 in the CCT treatment group and zero otherwise2011t=1 at the time of the midline survey (July - September 2011)and zero otherwise, and2012t = 1 at the time of the endline (August - October 2012) and zerootherwise.
Evans, Holtemeyer, Kosec (2015) (IFPRI) 9 Nov 2015 14 / 27

Results
Baseline balanceTreatment (T) Control (C) Difference (T-C)
Outcome Mean N Mean N Mean S.E.Dummy - leaders can generally be trusted 0.81 878 0.80 873 0.01 (0.03)Dummy - most people can be trusted 0.26 875 0.23 874 0.03 (0.03)Dummy - community people can be trusted 0.59 876 0.53 873 0.06* (0.03)Dummy - contributed labor to CDP in past year 0.36 880 0.35 879 0.01 (0.04)
Dummy - received ... gifts/assistance from individualsDummy - cash 0.24 874 0.28 876 -0.04 (0.03)Dummy - food 0.21 869 0.27 874 -0.06** (0.03)Dummy - other in-kind 0.22 875 0.26 872 -0.04 (0.03)
Dummy - received ... gifts/assistance from NGOsDummy - cash 0.01 879 0.01 879 -0.01 (0.01)Dummy - food 0.01 880 0.03 879 -0.02 (0.02)Dummy - other in-kind 0.03 880 0.05 878 -0.02 (0.02)
Amount (Tsh) of transfers received from...Any group 18314 883 25401 881 -7087** (3427)Individuals 16846 880 23616 879 -6770* (3479)Government or TASAF 833 880 463 879 369 (225)NGOs 698 880 1379 879 -681 (493)
Amount (Tsh) of transfers given in...Any form 1317 880 1729 879 -411 (667)Cash 416 880 407 879 9.20 (224)Food 485 880 659 879 -174 (252)Other in-kind 414 880 659 879 -245 (500)
Notes: Standard errors are clustered at the village level, and appear below the coefficient in parentheses.Coefficient estimates’ statistical significance is indicated at the 10, 5, and 1 percent levels with *, **, and***, respectively.
Evans, Holtemeyer, Kosec (2015) (IFPRI) 9 Nov 2015 15 / 27

Results
Baseline balance (cont.)
Treatment (T) Control (C) Difference (T-C)
Mean N Mean N Mean S.E.Individual characteristics
Age 35.54 3462 37.04 3456 -1.49 (1.20)Dummy - male 0.47 3462 0.45 3456 0.02 (0.01)Dummy - has less than Standard 1 education 0.53 3459 0.54 3451 0.00 (0.02)Dummy - has Standard 1-4 education 0.22 3459 0.22 3451 0.00 (0.01)Dummy - has at least Standard 5 education 0.24 3459 0.24 3451 0.00 (0.02)Dummy - literate 0.41 3462 0.42 3456 -0.01 (0.03)
Household characteristicsDummy - household has improved roof 0.33 880 0.37 878 -0.04 (0.06)Dummy - household has improved floor 0.03 880 0.09 878 -0.06** (0.02)Dummy - household has toilet facilities 0.69 880 0.76 879 -0.07 (0.04)Dummy - household has piped water 0.30 880 0.32 879 -0.01 (0.08)Dummy - head of household is male 0.63 879 0.59 878 0.04 (0.03)Notes: Treatment indicates assignment to treatment. Standard errors are clustered at the village level, andappear below the coefficient in parentheses. Coefficient estimates’ statistical significance is indicated at the10, 5, and 1 percent levels with *, **, and ***, respectively.
Evans, Holtemeyer, Kosec (2015) (IFPRI) 9 Nov 2015 16 / 27
Results
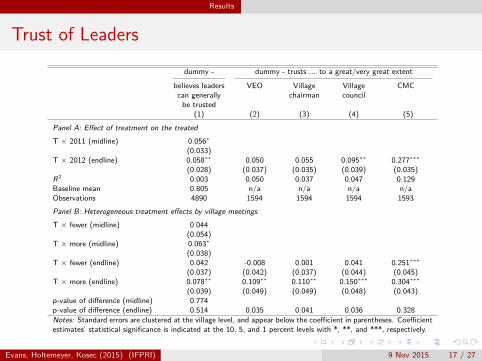
Trust of Leaders
dummy - dummy - trusts ... to a great/very great extent
believes leaderscan generally
be trusted
VEO Villagechairman
Villagecouncil
CMC
(1) (2) (3) (4) (5)
Panel A: Effect of treatment on the treatedT × 2011 (midline) 0.056∗
(0.033)T × 2012 (endline) 0.058∗∗ 0.050 0.055 0.095∗∗ 0.277∗∗∗
(0.028) (0.037) (0.035) (0.039) (0.035)R2 0.003 0.050 0.037 0.047 0.129Baseline mean 0.805 n/a n/a n/a n/aObservations 4890 1594 1594 1594 1593Panel B: Heterogeneous treatment effects by village meetingsT × fewer (midline) 0.044
(0.054)T × more (midline) 0.063∗
(0.038)T × fewer (endline) 0.042 -0.008 0.001 0.041 0.251∗∗∗
(0.037) (0.042) (0.037) (0.044) (0.045)T × more (endline) 0.078∗∗ 0.109∗∗ 0.110∗∗ 0.150∗∗∗ 0.304∗∗∗
(0.039) (0.049) (0.049) (0.048) (0.043)p-value of difference (midline) 0.774p-value of difference (endline) 0.514 0.035 0.041 0.036 0.328Notes: Standard errors are clustered at the village level, and appear below the coefficient in parentheses. Coefficientestimates’ statistical significance is indicated at the 10, 5, and 1 percent levels with *, **, and ***, respectively.
Evans, Holtemeyer, Kosec (2015) (IFPRI) 9 Nov 2015 17 / 27
Results
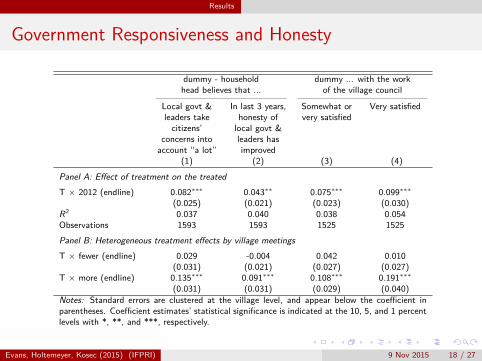
Government Responsiveness and Honesty
dummy - household dummy ... with the workhead believes that ... of the village council
Local govt &leaders take
citizens’concerns into
account “a lot”
In last 3 years,honesty of
local govt &leaders hasimproved
Somewhat orvery satisfied
Very satisfied
(1) (2) (3) (4)
Panel A: Effect of treatment on the treatedT × 2012 (endline) 0.082∗∗∗ 0.043∗∗ 0.075∗∗∗ 0.099∗∗∗
(0.025) (0.021) (0.023) (0.030)R2 0.037 0.040 0.038 0.054Observations 1593 1593 1525 1525Panel B: Heterogeneous treatment effects by village meetingsT × fewer (endline) 0.029 -0.004 0.042 0.010
(0.031) (0.021) (0.027) (0.027)T × more (endline) 0.135∗∗∗ 0.091∗∗∗ 0.108∗∗∗ 0.191∗∗∗
(0.031) (0.031) (0.029) (0.040)Notes: Standard errors are clustered at the village level, and appear below the coefficient inparentheses. Coefficient estimates’ statistical significance is indicated at the 10, 5, and 1 percentlevels with *, **, and ***, respectively.
Evans, Holtemeyer, Kosec (2015) (IFPRI) 9 Nov 2015 18 / 27
Results
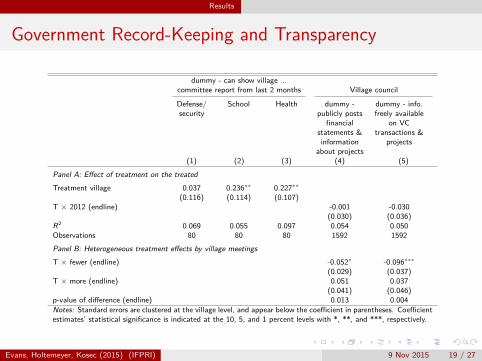
Government Record-Keeping and Transparency
dummy - can show village ...committee report from last 2 months Village council
Defense/security
School Health dummy -publicly posts
financialstatements &information
about projects
dummy - info.freely available
on VCtransactions &
projects
(1) (2) (3) (4) (5)
Panel A: Effect of treatment on the treatedTreatment village 0.037 0.236∗∗ 0.227∗∗
(0.116) (0.114) (0.107)T × 2012 (endline) -0.001 -0.030
(0.030) (0.036)R2 0.069 0.055 0.097 0.054 0.050Observations 80 80 80 1592 1592Panel B: Heterogeneous treatment effects by village meetingsT × fewer (endline) -0.052∗ -0.096∗∗∗
(0.029) (0.037)T × more (endline) 0.051 0.037
(0.041) (0.046)p-value of difference (endline) 0.013 0.004Notes: Standard errors are clustered at the village level, and appear below the coefficient in parentheses. Coefficientestimates’ statistical significance is indicated at the 10, 5, and 1 percent levels with *, **, and ***, respectively.
Evans, Holtemeyer, Kosec (2015) (IFPRI) 9 Nov 2015 19 / 27
Results
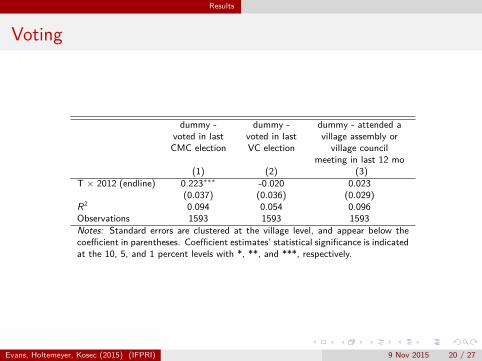
Voting
dummy -voted in last
CMC election
dummy -voted in lastVC election
dummy - attended avillage assembly or
village councilmeeting in last 12 mo
(1) (2) (3)T × 2012 (endline) 0.223∗∗∗ -0.020 0.023
(0.037) (0.036) (0.029)R2 0.094 0.054 0.096Observations 1593 1593 1593Notes: Standard errors are clustered at the village level, and appear below thecoefficient in parentheses. Coefficient estimates’ statistical significance is indicatedat the 10, 5, and 1 percent levels with *, **, and ***, respectively.
Evans, Holtemeyer, Kosec (2015) (IFPRI) 9 Nov 2015 20 / 27
Results
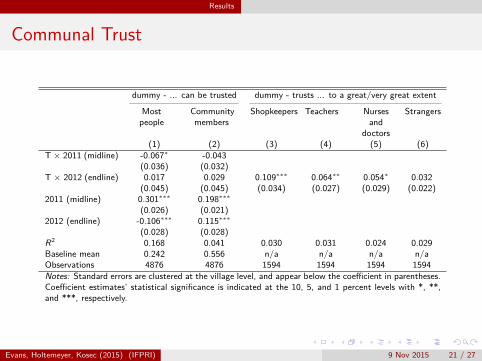
Communal Trust
dummy - ... can be trusted dummy - trusts ... to a great/very great extent
Mostpeople
Communitymembers
Shopkeepers Teachers Nursesand
doctors
Strangers
(1) (2) (3) (4) (5) (6)T × 2011 (midline) -0.067∗ -0.043
(0.036) (0.032)T × 2012 (endline) 0.017 0.029 0.109∗∗∗ 0.064∗∗ 0.054∗ 0.032
(0.045) (0.045) (0.034) (0.027) (0.029) (0.022)2011 (midline) 0.301∗∗∗ 0.198∗∗∗
(0.026) (0.021)2012 (endline) -0.106∗∗∗ 0.115∗∗∗
(0.028) (0.028)R2 0.168 0.041 0.030 0.031 0.024 0.029Baseline mean 0.242 0.556 n/a n/a n/a n/aObservations 4876 4876 1594 1594 1594 1594Notes: Standard errors are clustered at the village level, and appear below the coefficient in parentheses.Coefficient estimates’ statistical significance is indicated at the 10, 5, and 1 percent levels with *, **,and ***, respectively.
Evans, Holtemeyer, Kosec (2015) (IFPRI) 9 Nov 2015 21 / 27

Results
Informal Safety Nets
dummy - knows someonewho could provide...
15k TSHsuddenly
Childcaresuddenly
dummy - someonewith a personal
problem has turned toHH for assistance
(1) (2) (3)T × 2012 (endline) 0.055∗ 0.094∗∗∗ 0.045∗∗
(0.032) (0.033) (0.022)R2 0.052 0.038 0.068Observations 1594 1594 1594Notes: Standard errors are clustered at the village level, and appear below thecoefficient in parentheses. Coefficient estimates’ statistical significance is indicatedat the 10, 5, and 1 percent levels with *, **, and ***, respectively.
Evans, Holtemeyer, Kosec (2015) (IFPRI) 9 Nov 2015 22 / 27

Results
Contributions to Community Development Projects
dummy - would contribute ...to a communal project dummy - in last year has...
Time Money Worked withvillagers forbenefit of
community
Contributedlabor to a
CDP
(1) (2) (3) (4)T × 2012 (endline) 0.052∗∗ 0.060∗∗ 0.017 0.006
(0.026) (0.027) (0.023) (0.040)T × 2011 (midline) 0.017
(0.044)2011 (midline) -0.129∗∗∗
(0.030)2012 (endline) -0.213∗∗∗
(0.025)R2 0.055 0.053 0.085 0.064Baseline mean n/a n/a n/a 0.358Observations 1594 1594 1594 4920Notes: CDP = Community development project. Standard errors are clustered at thevillage level, and appear below the coefficient in parentheses. Coefficient estimates’ sta-tistical significance is indicated at the 10, 5, and 1 percent levels with *, **, and ***,respectively.
Evans, Holtemeyer, Kosec (2015) (IFPRI) 9 Nov 2015 23 / 27
Results
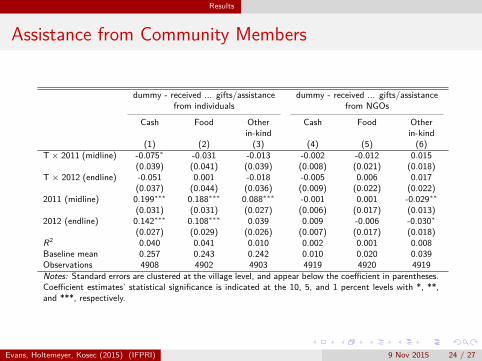
Assistance from Community Members
dummy - received ... gifts/assistance dummy - received ... gifts/assistancefrom individuals from NGOs
Cash Food Otherin-kind
Cash Food Otherin-kind
(1) (2) (3) (4) (5) (6)T × 2011 (midline) -0.075∗ -0.031 -0.013 -0.002 -0.012 0.015
(0.039) (0.041) (0.039) (0.008) (0.021) (0.018)T × 2012 (endline) -0.051 0.001 -0.018 -0.005 0.006 0.017
(0.037) (0.044) (0.036) (0.009) (0.022) (0.022)2011 (midline) 0.199∗∗∗ 0.188∗∗∗ 0.088∗∗∗ -0.001 0.001 -0.029∗∗
(0.031) (0.031) (0.027) (0.006) (0.017) (0.013)2012 (endline) 0.142∗∗∗ 0.108∗∗∗ 0.039 0.009 -0.006 -0.030∗
(0.027) (0.029) (0.026) (0.007) (0.017) (0.018)R2 0.040 0.041 0.010 0.002 0.001 0.008Baseline mean 0.257 0.243 0.242 0.010 0.020 0.039Observations 4908 4902 4903 4919 4920 4919Notes: Standard errors are clustered at the village level, and appear below the coefficient in parentheses.Coefficient estimates’ statistical significance is indicated at the 10, 5, and 1 percent levels with *, **,and ***, respectively.
Evans, Holtemeyer, Kosec (2015) (IFPRI) 9 Nov 2015 24 / 27
Results
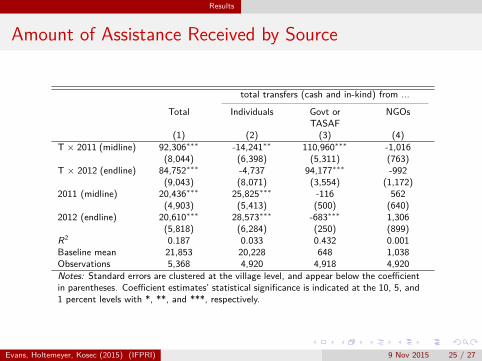
Amount of Assistance Received by Source
total transfers (cash and in-kind) from ...
Total Individuals Govt orTASAF
NGOs
(1) (2) (3) (4)T × 2011 (midline) 92,306∗∗∗ -14,241∗∗ 110,960∗∗∗ -1,016
(8,044) (6,398) (5,311) (763)T × 2012 (endline) 84,752∗∗∗ -4,737 94,177∗∗∗ -992
(9,043) (8,071) (3,554) (1,172)2011 (midline) 20,436∗∗∗ 25,825∗∗∗ -116 562
(4,903) (5,413) (500) (640)2012 (endline) 20,610∗∗∗ 28,573∗∗∗ -683∗∗∗ 1,306
(5,818) (6,284) (250) (899)R2 0.187 0.033 0.432 0.001Baseline mean 21,853 20,228 648 1,038Observations 5,368 4,920 4,918 4,920Notes: Standard errors are clustered at the village level, and appear below the coefficientin parentheses. Coefficient estimates’ statistical significance is indicated at the 10, 5, and1 percent levels with *, **, and ***, respectively.
Evans, Holtemeyer, Kosec (2015) (IFPRI) 9 Nov 2015 25 / 27
Results
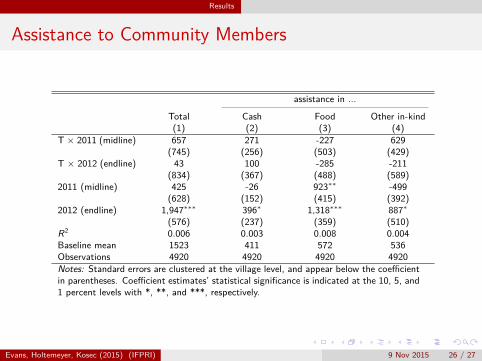
Assistance to Community Members
assistance in ...
Total Cash Food Other in-kind(1) (2) (3) (4)
T × 2011 (midline) 657 271 -227 629(745) (256) (503) (429)
T × 2012 (endline) 43 100 -285 -211(834) (367) (488) (589)
2011 (midline) 425 -26 923∗∗ -499(628) (152) (415) (392)
2012 (endline) 1,947∗∗∗ 396∗ 1,318∗∗∗ 887∗
(576) (237) (359) (510)R2 0.006 0.003 0.008 0.004Baseline mean 1523 411 572 536Observations 4920 4920 4920 4920Notes: Standard errors are clustered at the village level, and appear below the coefficientin parentheses. Coefficient estimates’ statistical significance is indicated at the 10, 5, and1 percent levels with *, **, and ***, respectively.
Evans, Holtemeyer, Kosec (2015) (IFPRI) 9 Nov 2015 26 / 27
Conclusions
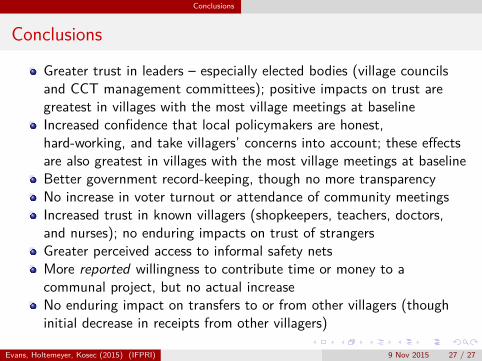
Conclusions
Greater trust in leaders – especially elected bodies (village councilsand CCT management committees); positive impacts on trust aregreatest in villages with the most village meetings at baselineIncreased confidence that local policymakers are honest,hard-working, and take villagers’ concerns into account; these effectsare also greatest in villages with the most village meetings at baselineBetter government record-keeping, though no more transparencyNo increase in voter turnout or attendance of community meetingsIncreased trust in known villagers (shopkeepers, teachers, doctors,and nurses); no enduring impacts on trust of strangersGreater perceived access to informal safety netsMore reported willingness to contribute time or money to acommunal project, but no actual increaseNo enduring impact on transfers to or from other villagers (thoughinitial decrease in receipts from other villagers)
Evans, Holtemeyer, Kosec (2015) (IFPRI) 9 Nov 2015 27 / 27