Katie A. Cychoszand Matthias Thommes -...
38
Katie A. Cychosz and Matthias Thommes * Quantachrome Instruments Boynton Beach, Florida, USA
Transcript of Katie A. Cychoszand Matthias Thommes -...

Katie A. Cychosz and Matthias Thommes*
Quantachrome InstrumentsBoynton Beach, Florida, USA

Surface Area Pore Size/Volume Distribution Pore Geometry, Structure of Pore Network Surface Properties

IUPAC (1985)
Micropores: < 2 nm
Mesopores: 2‐ 50 nm
Macropores: > 50 nm
MicroporeHeterogeneous Planar Surface
Heterogeneous Planar Surface
Mesopore
“Ideal” Planar Surface
New IUPAC Project – revision of recommendation from 1985: started in March 2010 (http://www.iupac.org/web/ins/2010-009-1-100)
This isotherm classification is valid for adsorption of subcritical adsorptives on rigid solids.
Mesopore and Micropore
3


Pore size/volume characterization of nanoporous carbons
Combination of carbon dioxide (273 K) with nitrogen (77 K) or argon (87 K)
Pore size/volume characterization of microporous materials with polar surfaces (e.g. MOFs, zeolites)
Argon (87 K)
Analysis of materials with ultra‐low surface area
Krypton (77 K) adsorption for surface area onlyKrypton (87 K) for pore size analysis of thin films
5
Problem: Below 100 mTorr (P/P0 = 10‐5) is regime of extremely slow kinetics. The selection of proper equilibrium parameters is essential for obtaining accurate adsorption isotherm data.
5 10-7 5 10-6 5 10-5 5 10-4 5 10-3 5 10-2 5 10-1 5 100
P/P0
0
70
140
210
280
350
Vol
ume
[cm
3 g-1
] STP
Ar (87 K) - Faujasite ZeoliteAr (87 K) - Faujasite ZeoliteN2 (77K) - Faujasite ZeoliteN2 (77K) - Faujasite Zeolite
10-7 5 10-6 5 10-5 5 10-4 5 10-3 5 10-2 5 10-1 5 100
Relative Pressure [P/P0]
0
100
200
300
400
500
600
700
800
Vol
ume
[cm
3 g-1
]
CMC2-Carbon (Argon, 87.3K)CMC2-Carbon (Argon, 87.3K)CMC2-Carbon (Nitrogen, 77.3 K)CMC2-Carbon (Nitrogen, 77.3 K)
Ar and N2 adsorption on Faujasite zeolite
Ar and N2 adsorption on activated carbon
N2 (77 K)
Ar (87 K)Ar (87 K)
N2 (77 K)
Zeolites: N2 – quadrupole interactions important
Many Carbons: N2 – quadrupoleinteractions not important
Thommes, M. Textural Characterization of Zeolites and Ordered Mesoporous Materials by Physical Adsorption in: Introduction to Zeolite Science and Practice, 2007, p. 495‐523
6

Effective pore width ~ 5 Å
structural change
Lässig, D.; Lincke, J.; Moellmer, J.; Reichenbach, C.; Moeller, A. Gläser, R.; Kalies, G.; Cychosz, K.A.; Thommes, M.; Staudt, R.; Krautscheid, H. Angew. Chemie. Int. Ed. 2011, 50, 10344‐10348
pore filling
7
N2, 77 K
Ar, 87 K

8
Zhang, X.; Liu, D.; Xu, D.; Asahina, S.; Cychosz, K.A.; Agrawal, K.V.; Al Wahedi, Y.; Bhan, A.; Al Hashimi, S.; Terasaki, O.; Thommes, M.; Tsapatsis, M. Science 2012, 336, 1684‐1687
High resolution TEM image (A) of self‐pillared zeolite nanosheet
NLDFT model fits the experimental argon data
Cumulative pore volumes (C) were plotted for zeolites with varying Si/Al ratios
NLDFT pore size distributions (D) clearly show the micro‐and mesoporosity

0
0.01
0.02
0.03
0.04
0.05
0.06
0.07
4 6 8 10 12 14 16 18 20Pore Size Å
Pore
Vol
ume,
cc/
g
CON
2
2
At elevated temperatures and higher absolute pressure (P0 = 26200 torr) CO2 can access micropores which are not accessible for nitrogen and argon at 77 K, 87 K
Fast analysis: due to higher diffusion rate, equilibrium is achieved faster as compared to nitrogen adsorption at 77 K dramatic decrease in analysis time, i.e. 3‐5 h for CO2 versus 30‐50 h N2
No need for high vacuum system No need for a low‐pressure transducer
1000 torr transducer is sufficientAnalysis Time:
CO2 = 5 hN2 = 40 hGarrido, J., et al. Langmuir, 1987, 3, 76‐81
Cazorla‐Amorós, D., et al. Langmuir, 2996, 12, 2820‐2824

NLDFT Analysis: slit/cylinder model
Zhu, Y.; Murali, S.; Stoller, M.D.; Ganesh, K.J.; Cai, W.; Ferreira, P.J.; Pirkle, A.; Wallace, R.M.; Cychosz, K.A.; Thommes, M.; Su, D.; Stach, E.A.; Ruoff, R.S. Science 2011, 332, 1537‐1541


Macroscopic, thermodynamic methodsMicropores (< 2 nm): e.g. Dubinin‐Radushkevitch, Horvath‐Kawazoe (HK), Saito‐Foley (SF), comparison plot methods (t‐method, alpha‐s method)
Meso‐ and Macropores (> 2 nm): e.g. Kelvin equation based methods such as Barrett, Joyner, Halenda (BJH) or Broeckhoff‐de Boer (BDB)
Modern, microscopic methods based on statistical mechanics describe configuration of adsorbed molecules on a molecular level Both Micro‐ and Mesopore size range: e.g. Density Functional Theory (DFT), Molecular Simulation
An accurate pore size analysis over the complete pore size range can be performed by a single method.
12

DFT (NLDFT, QSDFT) is widely used for micro‐ and mesopore analysis.
A comprehensive library of DFT methods for various adsorptive/adsorbent pairs is available.
Since 2007: NLDFT methods for pore size analysis are featured/recommended in standards of the International Standard Organization (ISO, i.e. ISO‐15901‐3).Facilitates the application and use of DFT methods for pore size analysis in industry.
13
DFT Review: Landers, J.; Gor, G.; Neimark, A.V. Colloids Surfaces A 2013, 437, 3‐32.

0 0.2 0.4 0.6 0.8 1Relative Pressure P/P0
0
100
200
300
400
500
600
700
800
900
Vol
ume
[cm
3 g-1
] STP
N2 (77.4 K) - AdsN2 (77.4 K) - AdsN2 (77.4 K) - DesN2 (77.4 K) - DesAr (87.3 K) - AdsAr (87.3 K) - AdsAr (87.3 K) - DesAr (87.3 K) - Des
Data from: Zukal, A.; Thommes, M.; Cejka, J. Microporous and Mesoporous Materials 2007, 104, 52‐58
14
Ordered mesoporous material Pore size verified using independent methods BJH (and other Kelvin equation based approaches) underestimates the pore size (up to 25%)

Molecular Simulation Tremendous progress in modeling realistic 3D structures (Gubbins, Monson, and others) of porous solids.
Non‐Local Density Functional Theory Various efforts to account for heterogeneity in NLDFT/DFT (Olivier, 1997; Ravikovitch, Jagiello, Neimark, 1999; Bhatia, 2002; Ustinov, Do, 2004‐06; Jagiello, Olivier, 2010).
Quenched Solid Density Functional Theory Solid enters the model as a quenched component with a fixed density distribution rather than a source of an external potential (Neimark, Ravikovitch: QSDFT for silica in 2006; QSDFT for carbons in 2007).
15

QSDFT provides a much more realistic approach for the pore size analysis of heterogeneous activated carbon!
5 10-6 5 10-5 5 10-4 5 10-3 5 10-2 5 10-1 5 100
P/P0
0
100
200
300
400
500
600
Vol
ume
[cm
3 g-1
]
NLDFT FitNLDFT Fit QSDFT Fit QSDFT Fit
Experimental data, N2 (77 K)/ACF 15Experimental data, N2 (77 K)/ACF 15
5 10 50 100 500 1000Pore Diameter [Å]
0
0.01
0.02
0.03
0.04
0.05
0.06
0.07
0.08
0.09
Dv(
d) [c
m3 /Å
/g]
QSDFTQSDFTNLDFTNLDFT
Neimark, A.V.; Ravikovitch, P.I.; Lin, Y.; Thommes, M. Carbon 2009, 47, 1617
Activated Carbon Fiber ACF‐15
16
QSDFT method for carbons has been originally developed assuming slit‐shaped pores which are typically found in activated microporous carbons.
Emergence of novel materials with pre‐designed pore morphology (obtained by synthesis routes which make use of structure directing agents or hard templates) requires the development of new methods.
We extend the QSDFT method to micro‐ and mesoporous carbons with cage‐like and channel‐like pore geometries.
17
Gor, G.; Thommes, M.; Cychosz, K.A.; Neimark, A.V. Carbon 2012, 50, 1583‐1590

The obtained QSDFT pore size agrees well with the pore size derived from XRD (49.97 Å) by using the geometrical model of hexagonally arranged carbon rods described in the paper by Joo, Ryoo, Kruk, and Jaroniec (J. Phys. Chem.2002, 106, 4640‐ 4646)
18
Gor, G.; Thommes, M.; Cychosz, K.A.; Neimark, A.V. Carbon 2012, 50, 1583‐1590
BJH underestimates true pore size up to 25%
BJH (3.5 nm)
NLDFT (5.1 nm)


20

Cylindrical Pores
Cylindrical &Spherical Pores
Disordered, lamellar pore structures, slit & wedge shape pores
Micro‐ and mesoporous adsorbents
21
Cylindrical/Slit‐like pores Delayed condensation due to metastable pore
fluid Desorption branch reflects equilibrium transition H1 Hysteresis
Pore Networks and Ink‐Bottle Pores Delay in condensation due to metastable pore
fluid Delay in evaporation potentially due to pore
blocking, cavitation, and percolation phenomena H2, H3, H4 Hysteresis
Disordered Porous Materials with Non‐Uniform Pore Network Structures Combination of kinetic and thermodynamic effects
spanning the complete disordered pore system H2, H3, H4 Hysteresis

Equilibrium
Delayed condensation
Neimark, A.V.; Ravikovitch, P.I Microporous and Mesoporous Materials 2001, 697, 44‐56
Desorption Branch: Equilibrium liquid‐gas phase transition (evaporation)NLDFT Kernel of Equilibrium Isotherms
Adsorption Branch: NLDFT‐spinodal‐gas‐liquid phase transition (condensation)NLDFT Kernel of (Metastable) Adsorption Isotherms
22

0 0.2 0.4 0.6 0.8 1Relative Pressure P/P0
0
100
200
300
400
500
600
700
Vol
ume
STP
[cc/
g]
25 45 65 85 105 125Pore Diameter [Å]
0
0.02
0.04
0.06
0.08
0.1
0.12
0.14
0.16
0.18
0.2
0.22
Dv(
d) [c
c/Å
/g]
Ads (NLDFT-spinodal condensation)Ads (NLDFT-spinodal condensation)Des (NLDFT- equilibrium transition)Des (NLDFT- equilibrium transition)
M. Thommes, In Nanoporous Materials‐ Science and Engineering” (edited by Max Lu and G. Zhao), Imperial College Press, Chapter 11 p. 317 ‐ 364 (2004)
H1 Hysteresis
Delayed condensation
Equilibrium Transition
23
PSD from adsorption calculated using NLDFT metastable adsorption branch method.
PSD from desorption calculated using NLDFT equilibrium transition kernel.

Wc = critical “neck” diameter 5‐6 nm for N2 (77 K)
From: Thommes, M.; Smarsly, B.; Groenewolt, M.; Ravikovitch, P.I.; Neimark, A.V. Langmuir 2006, 22, 756
Pore/cavity Size analysis from adsorption by DFT method which takes into account delayed condensation in spherical or cylindrical pores
Cavitation depends on the thermophysical properties of the adsorptive PSD determined from
desorption branch DOES depend on adsorptive or temperature
Pore blocking controlled desorption depends on the neck size, but not on the adsorptive PSD determined from
desorption branch DOES NOT depend on choice of adsorptive or temperature
24Sarkisov, L.D.; Monson, P.A. Langmuir 2001, 17, 7600

30 40 50 60 70 80 90 100 110 120 130Pore Diameter [Å]
0
0.08
0.16
0.24
0.32
0.4
0.48
D(v
)[cc/
Å/g
]
Argon 87 K Argon 87 K Nitrogen 77 K Nitrogen 77 K
NLDFT PSD from Desorption
30 42 54 66 78 90 102 114 126 138 150Pore Diameter [Å]
0
0.005
0.01
0.015
0.02
0.025
[cm
3 /Å/g
]
Argon (87 K), AdsArgon (87 K), AdsNitrogen (77K),AdsNitrogen (77K),Ads
NLDFT-PSD (from Adsorption Branch)
SE3030(PSD) | 17.2.2003
NLDFT pore size from adsorption
0 0.2 0.4 0.6 0.8 1P/P0
0
100
200
300
400
500
600
Vol
ume
[cc/
g] [S
TP]
Nitrogen 77 KNitrogen 77 KArgon 87 KArgon 87 K
No quantitative pore size info from desorption!
Thommes, M.; Smarsly, B.; Groenewolt, M.; Ravikovitch, P.I.; Neimark, A.V. Langmuir 2006, 22, 756‐764
Disagreement between Ar and N2“pseudo” desorption PSDs due to cavitation transition
25

CavitationQSDFT equilibrium kernel
QSDFT metastable adsorption branch kernel
PSD artifact due to cavitation
Thommes, M.; Cychosz, K.A.; Neimark, A.V. In: Novel Carbon Adsorbents, Ed. J.M.D. Tascon, 2012, Elsevier, p. 107‐145
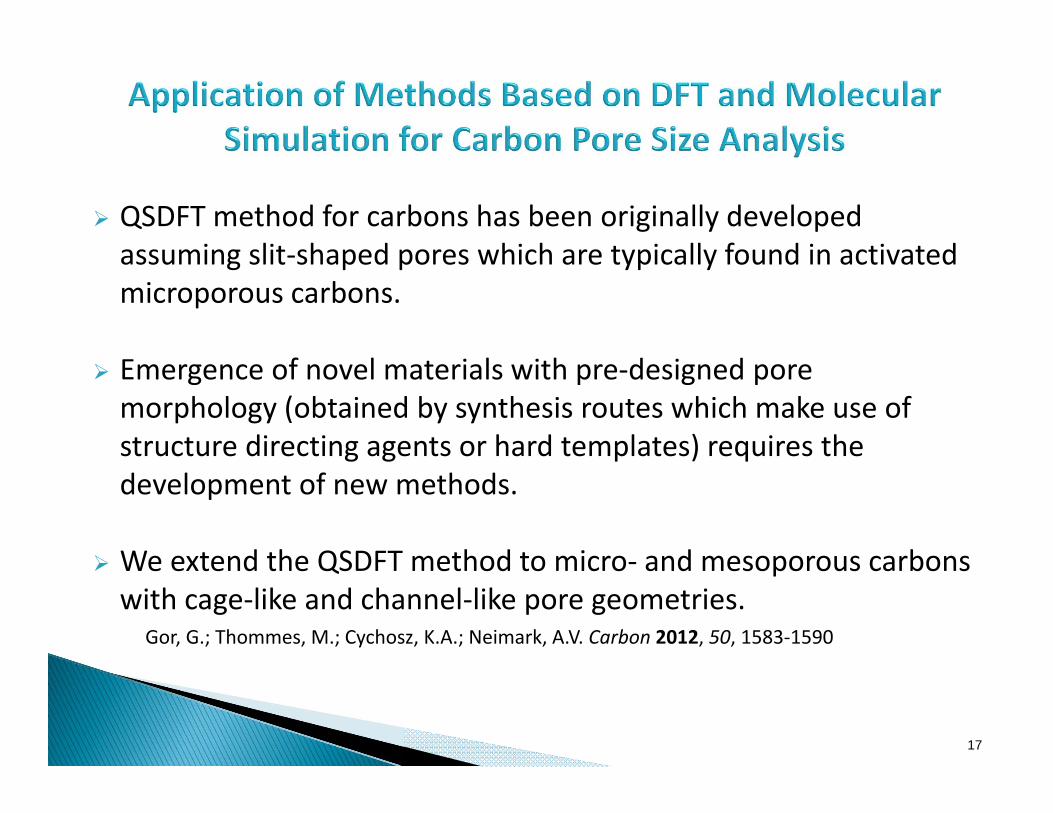
Template: 3D colloidal crystals formed from lysine‐silica nanoparticles
High degree of control over nanoparticle size
Pore size of 3DOm carbon verified using SEM, TEM, SAXS
Fan, W.; Snyder, M.A.; Kumar, S.; Lee, P‐S.; Yoo, W.C.; McCormick, A.V.; Penn, R.L.; Stein, A.; Tsapatsis, M. Nature Materials 2008, 7, 984‐991
N2 at 77 K
27

H1 Hysteresis
Pore size analysis from adsorption branch with novel QSDFT method assuming spherical pore geometry for mesopores which takes correctly into account delay in condensation due to metastable pore fluid.
QSDFT pore sizes in good agreement with SEM
28
Gor, G.; Thommes, M.; Cychosz, K.A.; Neimark, A.V. Carbon 2012, 50, 1583‐1590

Comparison of N2 (77K) and Ar (87K) pore size distributions for 10 nm and 20 nm 3DOm carbons from desorption branch
Good agreement of N2 (77K) and Ar (87K) PSD curves indicates the absence of cavitation!! Desorption PSD reflects the distribution of window sizes
10 nm Carbon 20 nm Carbon
29
Cychosz, K.A.; Guo, X.; Fan, W.; Cimino, R.; Gor, G.Y.; Tsapatsis, M.; Neimark, A.V.; Thommes, M. Langmuir 2012, 28, 12647‐12654
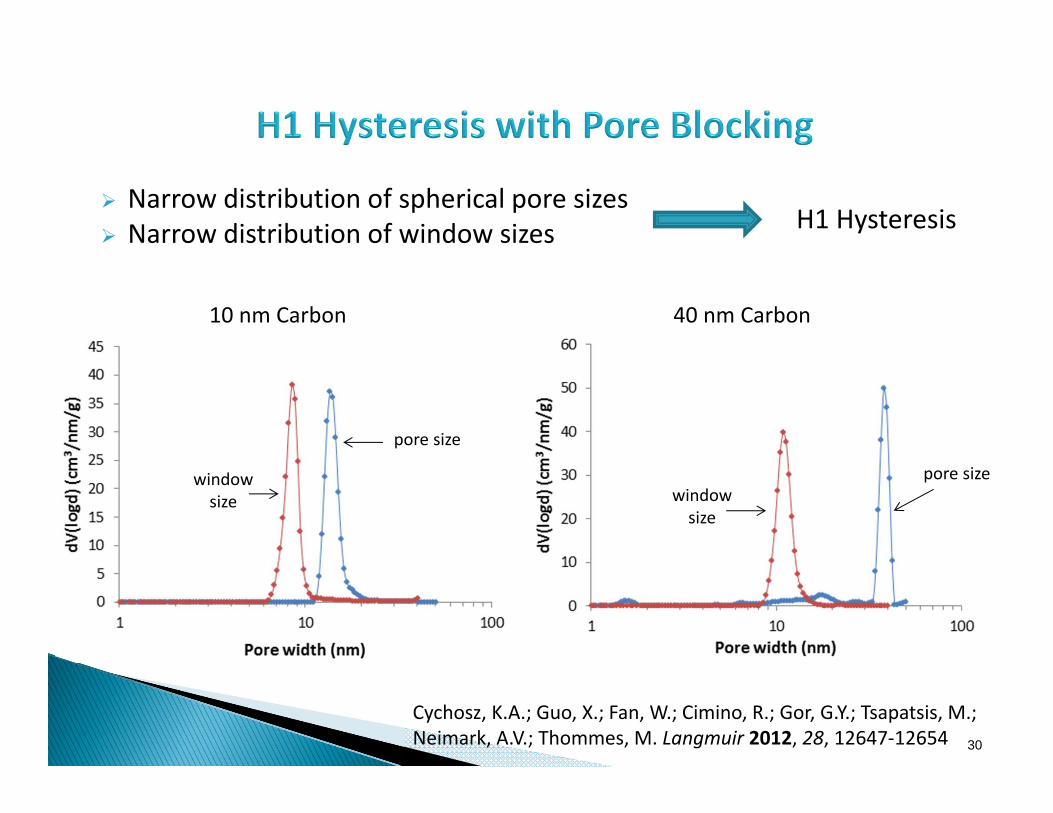
Narrow distribution of spherical pore sizes Narrow distribution of window sizes
10 nm Carbon 40 nm Carbon
H1 Hysteresis
pore size
pore sizewindowsize window
size
30
Cychosz, K.A.; Guo, X.; Fan, W.; Cimino, R.; Gor, G.Y.; Tsapatsis, M.; Neimark, A.V.; Thommes, M. Langmuir 2012, 28, 12647‐12654

Type H1 Hysteresis: Pores evaporate independently from one another (e.g. SBA‐15 silica)
Type H2 Hysteresis: Evaporation of certain pores depends on the state of neighboring pores Network effects/percolation
31
Pioneered by Everett ‐ 1967, De Boer ‐ 1958
Pore Network ‐ Type H2 hysteresis
Quantitative analysis of scanning curves allows one to obtain information about
pore connectivity.
Cimino, R.; Cychosz, K.A.; Thommes, M.; Neimark, A.V. Colloids Surfaces A 2013, 437, 76‐89

Ar (87K) hysteresis desorption scanning curves Scanning hysteresis analysis clearly suggests the existence of two independent pore networks, a and b, in this 3DOm carbon sample
12
345
a
b
a
b
32
This image cannot currently be displayed.
Cychosz, K.A.; Guo, X.; Fan, W.; Cimino, R.; Gor, G.Y.; Tsapatsis, M.; Neimark, A.V.; Thommes, M. Langmuir 2012, 28, 12647‐12654

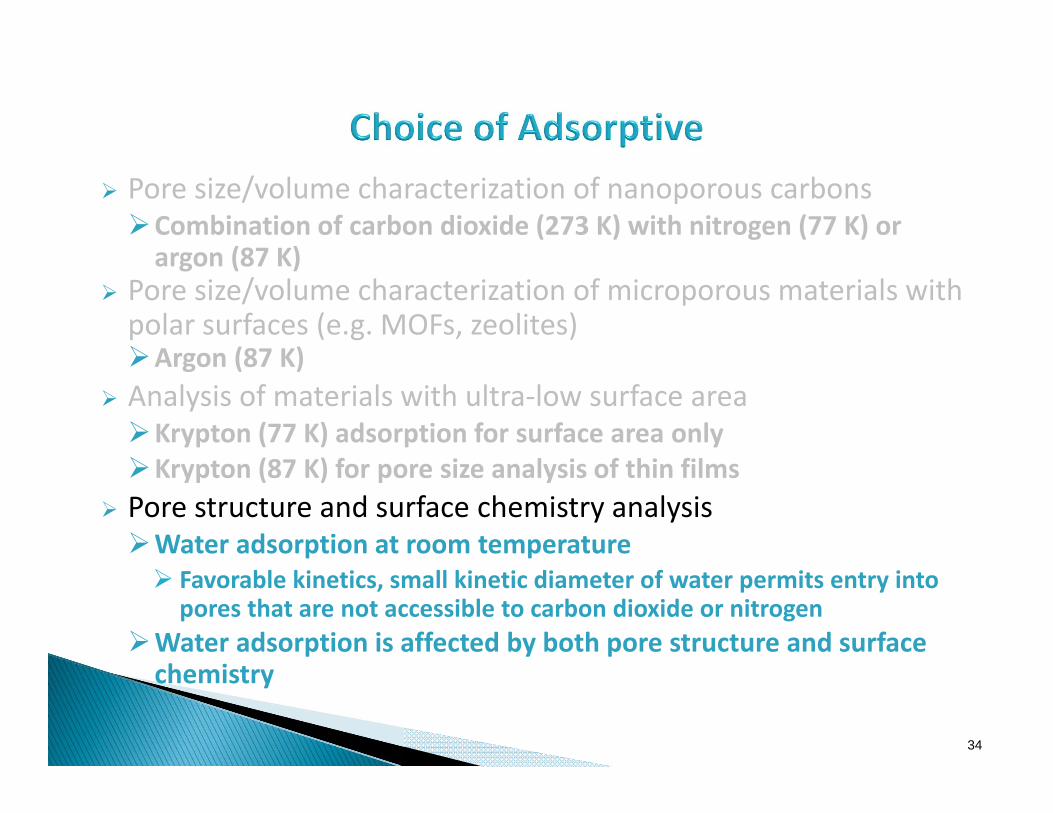
Pore size/volume characterization of nanoporous carbonsCombination of carbon dioxide (273 K) with nitrogen (77 K) or argon (87 K)
Pore size/volume characterization of microporous materials with polar surfaces (e.g. MOFs, zeolites)Argon (87 K)
Analysis of materials with ultra‐low surface areaKrypton (77 K) adsorption for surface area onlyKrypton (87 K) for pore size analysis of thin films
Pore structure and surface chemistry analysisWater adsorption at room temperature Favorable kinetics, small kinetic diameter of water permits entry into pores that are not accessible to carbon dioxide or nitrogen
Water adsorption is affected by both pore structure and surface chemistry
34

35
0 0.2 0.4 0.6 0.8 1P/P0
0
100
200
300
400
500
600
700
Vol
ume
[cm
3 g-1
] STP
Water (298.4 K) TE80 (CME2) Water (298.4 K) TE80 (CME2) Nitrogen (77.4K) TE80 (CME2)Nitrogen (77.4K) TE80 (CME2)
H2O/298 K (partial wetting fluid)
N2/77 K (wetting fluid)
Type I isotherm
Type V isotherm
Hysteresis in water adsorption isotherm is not regular capillary condensation
Clustering mechanism of adsorption
Thommes, M.; Morlay, C.; Ahmad, R.; Joly, J.P. Adsorption 2011, 17, 633

36
Two CMK‐3 materials with identical micropore size and slightly different mesopore size (4 nm vs. 5 nm)
Identical surface chemistry Differences in water adsorption isotherms
– water is sensitive to small changes in pore size
Thommes, M.; Morell, J.; Cychosz, K.A.; Froeba, M. Langmuir 2013, DOI: 10.1021/la402832b
0.0 0.1 0.2 0.3 0.4 0.5 0.6 0.7 0.8 0.9 1.00
100
200
300
400
500
600
700
800
900
1000
1100
1200
1300
Vol
ume
@ S
TP
Relative Pressure
CMK-3 (318) CMK-3 (348)
0 1 2 3 4 5 6 7 8 9 10 11 120.0
0.1
0.2
0.3
0.4
0.5
0.6
0.7
0.8
dV(d
) (cm
3 /nm
/g)
Pore Width (nm)
CMK-3 (318) CMK-3 (348)
0.0 0.1 0.2 0.3 0.4 0.5 0.6 0.7 0.8 0.9 1.00
100
200
300
400
500
600
700
800
900
Vol
ume
Ads
orbe
d (c
m3 /g
)
P/P0
CMK-3 (318) CMK-3 (348)
N2 (77 K)QSDFT pore size distributions
H2O (298 K)

0.0 0.1 0.2 0.3 0.4 0.5 0.6 0.7 0.8 0.9 1.00
100
200
300
400
500
600
700
Vol
ume
Adso
rbed
(cm
3 /g)
P/P0
Benzene PMO Divinylbenzene PMO
2 3 4 5 6 7 80.0
0.1
0.2
0.3
0.4
0.5
0.6
dV(d
) (cm
3 /nm
/g)
Pore Width (nm)
Benzene PMO Divinylbenzene PMO
0.0 0.1 0.2 0.3 0.4 0.5 0.6 0.7 0.8 0.9 1.00
100
200
300
400
500
600
Vol
ume
Ads
orbe
d (c
m3 /g
)
P/P0
Benzene PMO Divinylbenzene PMO
37
Two PMO materials with identical pore size Different organic molecules lead to
different surface chemistry for the two PMOs
Differences in water adsorption isotherms due to differences in surface chemistry
Thommes, M.; Morell, J.; Cychosz, K.A.; Froeba, M. Langmuir 2013, DOI: 10.1021/la402832b
Ar (87 K)NLDFT pore size distributions
H2O (298 K)

Physical adsorption is a powerful method for surface and pore size/volume characterization.
Microscopic methods (NLDFT, QSDFT) allow one to obtain an accurate and comprehensive pore size analysis of micro‐mesoporous materials.
Water adsorption detects small difference in surface chemistry and micro‐mesoporous structure.
Chemisorption is a useful tool for characterization of active sites (acidic, basic) in catalysts and other materials.
38