KATANGA MINING LIMITED/media/Files/K/Katanga-mining-v2/reports... · KATANGA MINING LIMITED...
33
KATANGA MINING LIMITED Management’s Discussion and Analysis For the three and nine months ended September 30, 2016 and 2015 The following discussion and analysis is management’s assessment of the results of operations and financial condition of Katanga Mining Limited (“Katanga” or the “Company”) and should be read in conjunction with the audited consolidated financial statements and the notes thereto of the Company for the years ended December 31, 2015, and 2014. The unaudited interim condensed consolidated financial statements have been prepared in accordance with the International Financial Reporting Standards (“IFRS”) issued by the International Accounting Standards Board (“IASB”) and Interpretations of the International Financial Reporting Interpretations Committee (“IFRIC”). All dollar amounts are in United States dollars unless otherwise indicated. This information has been prepared as of November 9, 2016. Katanga’s common shares trade on the Toronto Stock Exchange (“TSX”) under the symbol “KAT”. Katanga’s most recent filings, including Katanga’s Annual Information Form for the year ended December 31, 2015, dated March 30, 2016, are available on the System for Electronic Document Analysis and Retrieval (“SEDAR”) and can be accessed through the internet at www.sedar.com. This Management’s Discussion and Analysis contains forward looking statements that are subject to risk factors as set out in items 14 and 18.
-
Upload
phungkhuong -
Category
Documents
-
view
230 -
download
0
Transcript of KATANGA MINING LIMITED/media/Files/K/Katanga-mining-v2/reports... · KATANGA MINING LIMITED...

KATANGA MINING LIMITED
Management’s Discussion and Analysis For the three and nine months ended September 30, 2016 and 2015
The following discussion and analysis is management’s assessment of the results of operations and financial condition of Katanga
Mining Limited (“Katanga” or the “Company”) and should be read in conjunction with the audited consolidated financial statements and the notes thereto of the Company for the years ended December 31, 2015, and 2014. The unaudited interim condensed
consolidated financial statements have been prepared in accordance with the International Financial Reporting Standards (“IFRS”)
issued by the International Accounting Standards Board (“IASB”) and Interpretations of the International Financial Reporting Interpretations Committee (“IFRIC”). All dollar amounts are in United States dollars unless otherwise indicated. This information
has been prepared as of November 9, 2016. Katanga’s common shares trade on the Toronto Stock Exchange (“TSX”) under the
symbol “KAT”. Katanga’s most recent filings, including Katanga’s Annual Information Form for the year ended December 31, 2015, dated March 30, 2016, are available on the System for Electronic Document Analysis and Retrieval (“SEDAR”) and can be accessed
through the internet at www.sedar.com. This Management’s Discussion and Analysis contains forward looking statements that are subject to risk factors as set out in items 14 and 18.

MANAGEMENT’S DISCUSSION AND ANALYSIS OF FINANCIAL CONDITION AND RESULTS OF OPERATIONS
1
1. Company Overview
Katanga is a limited company whose common shares are listed on the TSX under the symbol “KAT”. The
Company’s registered office address is Suite 300, 204 Black Street, Whitehorse, Yukon, Canada Y1A 2M9.
Katanga's ultimate parent company is Glencore plc (“Glencore”) which owns 75.3% of Katanga's shares
through its wholly-owned subsidiary Glencore International AG.
Katanga, through its 75% owned subsidiary Kamoto Copper Company SA (“KCC”), is engaged in copper
and cobalt mining and related activities in the Democratic Republic of Congo (“DRC”). KCC is engaged in
the exploration, mining, refurbishment, rehabilitation, development and operation of the Kamoto /
Mashamba East mining complex (including “KTO Underground Mine” or “KTO”, “KTE Underground
Mine” and “Etang South Underground Mine”), the Kamoto Oliveira Virgule copper and cobalt mine
(“KOV Open Pit” or “KOV”), the T17 Mine consisting of “T17 Open Pit” and “T17 Underground Mine”,
various oxide open pit resources, the Kamoto Concentrator (“KTC”) and the Luilu Metallurgical Plant
(“Luilu”), (collectively, the “Project”), in the DRC. Operations at KTO, KTE, Etang South, T17, KTC and
Luilu are currently suspended pending the completion of the Whole Ore Leach Project (“WOL Project”) as
described further herein. The Whole Ore Leach Plant is expected to commence commissioning in the
second half of 2017.
2. Highlights during the three and nine months ended September 30, 2016, and
Outlook
Three months ended Nine months ended
Sep 30, Jun 30, Sep 30, Sep 30,
2016 2016 2015 2016 2015
Financial
Realized copper price $/lb - - 2.03 - 2.35
Realized cobalt price $/lb - - 10.53 - 11.17
Total sales* $'000
(1,632) (615) 202,006 (30,130) 671,198
- including repricing* $'000 (1,632) (615) (32,039) (30,856) (57,496)
EBITDA** $'000 (55,214) (42,919) (133,162) (184,673) (207,559)
Net loss attributable to shareholders $'000 (99,499) (96,059) (188,193) (314,464) (300,693)
C1 cash costs* $/lb - - 3.32 - 2.92
Cash flows from operating activities $'000 (33,141) (42,007) (167,644) (153,990) (459,560)
Mining
Waste mined tonnes 3,295,872 1,583,434 13,395,209 6,021,978 29,603,671
Ore mined tonnes 825 - 1,779,343 825 5,828,966
Average copper grade % 2.67 - 3.94 2.67 3.75
Contained copper in ore mined tonnes 22 - 70,079 22 218,297
Processing
Ore milled tonnes - - 1,460,316 - 5,454,990
Finished copper metal and
concentrate tonnes
- -
36,444
-
113,674
Finished cobalt tonnes - - 1,105 - 2,901
* Negative price and sales amounts are a result of quality discounts, adverse repricing and mark to market
(“M2M”) adjustments
** Refer to Item 21; Non-IFRS Measures.
MANAGEMENT’S DISCUSSION AND ANALYSIS OF FINANCIAL CONDITION AND RESULTS OF OPERATIONS
2
Ongoing suspension of production
On September 11, 2015, the Company announced the decision to suspend the processing of copper and
cobalt during the construction phase of the Whole Ore Leach Project (“WOL Project”). The suspension
continued through the third quarter of 2016 and production is not expected to resume until the WOL
Project is commissioned, which is expected to commence in the second half of 2017.
Mining operations continued during the first nine months of 2016 at KOV and Mashamba East Open
Pits with a focus on waste mining.
Review of 2016 Third Quarter Results
Financial
Profitability during Q3 2016, when compared to Q2 2016 and Q3 2015, was affected by:
o Finalization of outstanding 2015 sales resulting in negative sales of $1.6 million (Q2 2016 -
$0.6 million; Q3 2015 – nil);
o Loss on sale of assets amounting to $0.4 million in Q3 2016 (Q2 2016 - $1.0 million profit;
Q3 2015 – 0.5 million profit) due to lower sales of non-core products;
o Higher loss on sales of warehouse inventory items of $2.4 million (Q2 2016 - $1.0 million
loss, Q3 2015 – nil);
o Reduced operating expenditures due to the suspension of copper and cobalt processing;
o Restructuring costs relating to contractor demobilisations and employee redundancy costs,
which totalled $24.0 million in Q3 2015, were nil in Q3 2016 and Q2 2016;
o Income relating to stock-based compensation due to departure of senior employees prior to
vesting of their granted stock options. This resulted in reversal of accumulated costs
amounting to $0.6 million income in Q2 2016 and $0.2 million income in Q3 2015. For Q3
2016 this was nil; and
o Income tax expense of $5.5 million in Q3 2016 relating to 2014 and 2015 corporate income
taxes (Q2 2016 - $0.2 million recovery; Q3 2015 - $0.2 million expense). Deferred tax
recognition on tax losses carried forward in the DRC ceased in Q2 2015. Such recognition
will be reassessed on commissioning of the WOL Project.
Cash outflows from operating activities decreased in Q3 2016, when compared to Q3 2015, due to
lower working capital requirements, notably for the reduction in inventories and prepayments
following the suspension of copper and cobalt processing. These cash outflows were funded by
Glencore.
Mining
Waste mined at KOV Open Pit and Mashamba East Open Pit in Q3 2016 was 1,704,379 tonnes
(108.0%) higher than in Q2 2016 due to increased mining activities following the remediation works
due to the geotechnical failure. Compared to Q3 2015, waste mined was 75.4% lower due to the
revised waste mining plan (pre strip) in the open pits which was put in place following the suspension
of copper and cobalt processing at the end of Q3 2015. The revised waste mining plan aims to secure
sufficient ore availability for processing once the suspension of copper and cobalt processing ends,
while minimizing costs during the suspension period; and
Ore mined in Q3 2016 was 825 tonnes at KOV and is related to incidental ore mined during waste
mining. Due to the suspension of ore mining underground and the shift in focus towards waste mining
in the open pits following the suspension of copper and cobalt processing at the end of Q3 2015, ore
mined is minimal.
In Q3 2016, the Company commissioned:
o 1 fuel truck and 1 service truck at the KOV Open Pit mine.
Processing
Due to plant shutdown, there was no ore milled at KTC and no copper metal, concentrates or cobalt
metal produced in Q3 2016.
During Q3 2016 work continued on the WOL Project:
o Ongoing engineering design optimization continued on the Pre Leach, Leach and Post Leach
circuits and satisfactory progress was made on the earth works and civil works, as well as
construction of the steel structures;

MANAGEMENT’S DISCUSSION AND ANALYSIS OF FINANCIAL CONDITION AND RESULTS OF OPERATIONS
3
o Related capital expenditures amounted to $12.4 million in Q3 2016, which principally related
to site excavation, civil work and prepayments for various long lead time items (Q2 2016 –
$17.0 million); and
o Concurrent with the construction of the WOL Project plant and infrastructure, the current Life
of Mine Plan continues to be optimized to ensure the appropriate blend will be supplied to the
WOL Project process when complete in order to maximize copper and cobalt recovery and to
minimize operating cost per unit.
Review of 2016 First Nine Months Results
Financial
Profitability during Q3 2016 YTD, when compared to Q3 2015 YTD, was affected by:
o Quality discounts of $27.0 million on finalization of outstanding 2015 sales;
o Reduced operating expenditures due to the suspension of copper and cobalt processing;
o Lower restructuring costs relating to contractor demobilisations and employee redundancy
costs, which totalled $3.1 million in Q3 2016 YTD, compared to $24.0 million in Q3 2015
YTD;
o The cessation of borrowing cost capitalisation during Q1 2015 due to the completion of the
Phase 5 Expansion Project, resulting in Amended Loan Facility interest expense of $227.0
million for Q3 2016 YTD (Q3 2015 YTD – $166.6 million); and
o Income tax expense of $5.4 million in Q3 2016 YTD relating to 2014 and 2015 corporate
income taxes (Q3 2015 YTD - $111.1 million recovery). Deferred tax recognition on tax
losses carried forward in the DRC ceased in Q2 2015. Such recognition will be reassessed on
commissioning of the WOL Project.
Cash outflows from operating activities decreased in Q3 2016 YTD, when compared to Q3 2015 YTD,
due to lower working capital requirements, notably for the reduction in inventories and prepayments
following the suspension of copper and cobalt processing, as well as higher reduction of payables
during Q3 2015 YTD. These cash outflows were funded by Glencore.
Mining
Waste mined in Q3 2016 YTD was 79.7% lower than in Q3 2015 YTD due to the revised waste
mining plan in the open pits which was put in place following the suspension of copper and cobalt
processing at the end of Q3 2015. The revised waste mining plan aims to secure sufficient ore
availability for processing once the suspension of copper and cobalt processing ends, while minimizing
costs during the suspension period;
Ore mined in Q3 2016 YTD was 825 tonnes at KOV and is related to incidental ore mined during
waste mining. Due to the suspension of ore mining underground and the shift in focus towards waste
mining in the open pits following the suspension of copper and cobalt processing at the end of Q3
2015, ore mined is minimal; and
In Q3 2016 YTD, the Company commissioned:
o 1 CAT shovel and 1 excavator at the KOV Open Pit mine; and
o 1 fuel truck and 1 service truck at the KOV Open Pit mine.
Processing
Due to plant shutdown, there was no ore milled at KTC and no copper metal, concentrates or cobalt
metal produced in Q3 2016 YTD.
During Q3 2016 YTD work continued on the WOL Project:
o Ongoing engineering design optimization continued on the Pre Leach, Leach and Post Leach
circuits and satisfactory progress was made on the earth works and civil works, as well as
construction of the steel structures;
o Related capital expenditures amounted to $64.5 million in Q3 2016 YTD, which principally
related to site excavation, civil work and prepayments for various long lead time items; and
o Concurrent with the construction of the WOL Project plant and infrastructure, the current Life
of Mine Plan continues to be optimized to ensure the appropriate blend will be supplied to the
WOL Project process when complete in order to maximize copper and cobalt recovery and to
minimize operating cost per unit.

MANAGEMENT’S DISCUSSION AND ANALYSIS OF FINANCIAL CONDITION AND RESULTS OF OPERATIONS
4
Outlook
During Q4 2016:
o Work will continue on the design optimization and construction of the WOL Project
according to the defined project plan;
o Open pit mining operations are expected to continue with focus on waste mining and
remediation activities following the geotechnical failure at the KOV Open Pit mine in March
2016;
o Care and maintenance activities in the underground mine and at KTC and Luilu are expected
to continue; and
o Various initiatives relating to cost base reduction, consumable inventory reductions, staff
training and process improvements are expected to continue to be developed.

MANAGEMENT’S DISCUSSION AND ANALYSIS OF FINANCIAL CONDITION AND RESULTS OF OPERATIONS
5
3. Operational performance
The production of copper cathode, cobalt metal and previously copper concentrate is achieved through
distinct processes which are described and reviewed below. The production statistics for each of these areas
are presented below, for the current and comparative periods, and in item 6 – Summary of Quarterly
Results, for the last eight quarters.
Mining
Three months ended Nine months ended
Sep 30, Jun 30, Sep 30, Sep 30,
2016 2016 2015 2016 2015
Ore mined
KOV Open Pit tonnes 825 - 1,331,428 825 4,344,027
Mashamba East Open Pit tonnes - - - - 4,312
T17 Open Pit tonnes - - - - 0
KTO Underground tonnes - - 447,915 - 1,478,932
Etang South Underground tonnes - - - - 1,695
Total tonnes 825 - 1,779,343 825 5,828,966
Waste mined
KOV Open Pit tonnes 3,282,938 944,834 11,656,361 5,349,052 27,267,528
Mashamba East Open Pit tonnes - 633,725 1,618,381 633,725 1,922,438
T17 Open Pit tonnes - - - - -
KTO Underground tonnes 12,934 4,875 53,319 39,201 214,440
Etang South Underground tonnes - - 16,930 - 31,884
KTE Underground tonnes - - 50,218 - 162,454
T17 Underground tonnes - - - - 4,925
Total tonnes 3,295,872 1,583,434 13,395,209 6,021,978 29,603,671
Average Cu grade
KOV Open Pit % 2.67 - 4.16 2.67 3.93
Mashamba East Open Pit % - - - - 3.42
T17 Open Pit % - - - - -
KTO Underground % - - 3.28 - 3.22
Etang South Underground % - - - - 2.43
Total average % 2.67 - 3.94 2.67 3.75
Average Co grade
KOV Open Pit % 0.68 - 0.42 0.68 0.47
Mashamba East Open Pit % - - - - 0.41
T17 Open Pit % - - - - -
KTO Underground % - - 0.40 - 0.36
Etang South Underground % - - - - 0.45
Total average % 0.68 - 0.42 0.68 0.44
Recorded rainfall
KOV Open Pit mm 34 79 43 558 730

MANAGEMENT’S DISCUSSION AND ANALYSIS OF FINANCIAL CONDITION AND RESULTS OF OPERATIONS
6
Review of 2016 Third Quarter and First Nine Months Results
KOV Open Pit
Ore mined in Q3 2016 YTD was 825 tonnes and is related to incidental ore mined during waste
mining. Due to the suspension of copper and cobalt processing at the end of Q3 2015, ore mined is
minimal.
Waste mined in Q3 2016 was 247.5% higher than in Q2 2016 and 71.8% lower than in Q3 2015. When
comparing Q3 2016 YTD to Q3 2015 YTD, waste mined decreased by 80.4%. This is due to the
revised waste mining plan, which was put in place following the suspension of copper and cobalt
processing at the end of Q3 2015. Of the total waste mined in Q3 2016, approximately 3,007,869
tonnes related to ongoing search and recovery and remediation activities following the geotechnical
failure at KOV Open Pit on March 8, 2016 (Q2 2016 – 415,000 tonnes).
The revised waste mining plan aims to secure sufficient ore availability for processing once the
suspension of copper and cobalt processing ends, while minimizing costs during the suspension period.
In Q3 2016 YTD, the Company commissioned:
o 1 CAT shovel and 1 excavator; and
o 1 fuel truck and 1 service truck at the KOV Open Pit mine.
KTO Underground Mine
Ore mined in Q3 2016 was Nil following the suspension of copper and cobalt processing at the end of
Q3 2015.
Waste mined in Q3 2016 was 8,059 tonnes higher than in Q2 2016 and 40,385 tonnes lower than in Q3
2015. The decrease between Q3 2016 YTD and Q3 2015 YTD is 175,240 tonnes. This is due to the
suspension of ore mining following the suspension of copper and cobalt processing.
Other mines
Waste mined in Q3 2016 at Mashamba East Open Pit was Nil, compared to 633,725 tonnes in Q2 2016
and 1,618,381 tonnes in Q3 2015. The decrease between Q3 2016 YTD and Q3 2015 YTD is 67.0%. At T17 Underground, Etang South Underground Mine and KTE Underground Mine (both extensions
of KTO) mining operations were suspended in Q3 2015.
Processing
Kamoto Concentrator (“KTC”)
Three months ended Nine months ended
Sep 30, Jun 30, Sep 30, Sep 30,
2016 2016 2015 2016 2015
Production
Ore milled tonnes - - 1,460,316 - 5,454,990
Cu mill grade % - - 4.38 - 3.97
Co mill grade % - - 0.51 - 0.46
Concentrate produced tonnes - - 271,647 - 859,647
Cu grade in concentrate % - - 16.15 - 17.19
Co grade in concentrate % - - 1.68 - 1.68
KTC mills ore from the various mines and concentrates the contained copper and cobalt before transfer
to Luilu.
Following the suspension of copper and cobalt production in Q3 2015, Nil ore was milled and Nil
concentrate was produced in Q3 2016 YTD.

MANAGEMENT’S DISCUSSION AND ANALYSIS OF FINANCIAL CONDITION AND RESULTS OF OPERATIONS
7
Luilu Metallurgical Plant
Three months ended Nine months ended
Sep 30, Jun 30, Sep 30, Sep 30,
2016 2016 2015 2016 2015
Production
Concentrate fed tonnes - - 272,545 - 844,708
Cu concentrate grade % - - 16.73 - 17.52
Co concentrate grade % - - 1.80 - 1.75
Copper produced tonnes - - 33,709 - 106,816
Cobalt produced tonnes - - 1,105 - 2,901
The Luilu Metallurgical Plant processed sulphide and oxide concentrate from KTC through a modern
Solvent Extraction and Electro-Winning (“SX-EW”) circuit.
Due to the suspension of copper and cobalt processing in Q3 2015, Nil copper and cobalt metal was
produced in Q3 2016 YTD.

MANAGEMENT’S DISCUSSION AND ANALYSIS OF FINANCIAL CONDITION AND RESULTS OF OPERATIONS
8
4. Financial Performance
Operating Results
Three months ended Nine months ended
Sep 30, Jun 30, Sep 30, Sep 30,
2016 2016 2015 2016 2015
Sales**** $'000 (1,632) (615) 202,006 (30,130) 671,198
Operating expenses (including other
expenses)* $'000 (53,582) (42,304) (335,168) (154,543) (878,757)
EBITDA* $'000 (55,214) (42,919) (133,162) (184,673) (207,559)
Depreciation and amortization* $'000 (6,915) (6,806) (54,656) (21,425) (172,463)
Exclude: Other expenses (included
below gross loss)* $'000 550 (44) 26,006 3,173 17,348
Gross loss $'000 (61,579) (49,769) (161,812) (202,925) (362,674)
Other (expenses) income* $'000 (550) 44 (26,006) (3,173) (17,348)
Net finance costs $'000 (88,160) (91,433) (80,431) (264,434) (186,094)
Income tax (expense) recovery $'000 (5,510) 212 (164) (5,367) 111,148
Net loss $'000 (155,799) (140,946) (268,413) (475,899) (454,968)
Non-controlling interests $'000 (56,300) (44,887) (80,220) (161,435) (154,275)
Attributable to equity holders $'000 (99,499) (96,059) (188,193) (314,464) (300,693)
Basic and diluted income per common
share** $/share (0.05) (0.05) (0.10) (0.16) (0.16)
C1 cash cost*** $/pound - - 3.32 - 2.92
* The aggregation of sales cost of sales, operating expenses, royalties and transportation costs, and
other expenses totals to EBITDA (Refer to item 21 Non-IFRS financial measures).
** Basic and diluted loss per common share are the same for the periods presented as the
outstanding share options are non-dilutive since their exercise prices exceeded the average market
value of the common shares at each period end.
*** Refer to item 21 Non-IFRS financial measures. Due to the suspension of production C1 cash costs
are not calculated for this period.
**** Negative price and sales amounts are a result of quality discounts, adverse repricing and mark to
market (“M2M”) adjustments

MANAGEMENT’S DISCUSSION AND ANALYSIS OF FINANCIAL CONDITION AND RESULTS OF OPERATIONS
9
The movement in sales is due to the following price and volume factors:
Three months ended Nine months ended
Sep 30, Jun 30, Sep 30, Sep 30,
2016 2016 2015 2016 2015
Copper sales $'000 (1,632) (615) 177,141 (29,682) 601,165
Copper tonnes sold tonnes - - 39,524 69 116,054
Realized copper price $/tonne - - 4,482 - 5,180
Closing mark-to-market copper price $/tonne 4,832 4,637 5,194 4,832 5,194
Cobalt sales $'000 - - 24,865 (448) 70,033
Cobalt tonnes sold tonnes - - 1,071 32 2,844
Realized cobalt price $/tonne - - 23,217 - 24,625
Closing mark-to-market cobalt price $/tonne 26,599 24,559 27,780 26,599 27,780
Total sales $'000 (1,632) (615) 202,006 (30,130) 671,198
Including net repricing $'000 (1,632) (615) (32,039) (30,856) (57,496)
No sales of copper and cobalt cathodes or concentrates were made in Q3 2016.
Sales related adjustments for Q3 2016 increased by $1.0 million over Q2 2016 mainly due to
additional quality discounts of $1.6 million on finalization of outstanding 2015 sales. Sales for Q3
2016 decreased by $203.6 million over Q3 2015 due to a negative volume variance, which is the
result of the suspension of copper and cobalt processing.
Sales for Q3 2016 YTD decreased by $701.3 million over Q3 2015 YTD due to a $31.3 million
negative price variance and a $670.1 million negative volume variance.
Included in sales is a net re-pricing movement. Re-pricing adjustments result from sales being
made at a provisional price in the month of shipment with final pricing based on average prices at
a specified period thereafter. At each reporting date, open provisionally priced sales which retain
an exposure to future changes in prices are marked-to-market based on forward prices (per the
London Metal Exchange (“LME”) offset by the contractual discount with adjustments being
recorded in sales in the statement of loss and receivables on the statement of financial position. As
at September 30, 2016, the Company had 25 tonnes copper (December 31, 2015 – no copper) and
no cobalt (December 31, 2015 – 25 tonnes) for which final commodity prices have yet to be
determined. These were valued at September 30, 2016, at a forward commodity price net of
contractual discounts of $1,320 per tonne for copper (December 31, 2015 – no copper) (amounts
in whole numbers). A 5% increase or decrease in the forward copper price as at September 30,
2016 would result in a $0.002 million change to revenue and trade receivables (as at December 31,
2015 – no copper).

MANAGEMENT’S DISCUSSION AND ANALYSIS OF FINANCIAL CONDITION AND RESULTS OF OPERATIONS
10
The movement in cost of sales, operating expenses, depreciation, royalties and transportation costs
(operating expenses) is due to:
Three months ended Nine months ended
Sep 30, Jun 30, Sep 30, Sep 30,
2016 2016 2015 2016 2015
Mining $'000 - - 102,792 - 228,605
KTC processing cost $'000 - - 55,941 - 170,434
Luilu processing cost $'000 - - 73,780 - 192,896
Mine infrastructure and support $'000 - - 45,352 - 112,196
Change in metal inventories $'000 - - (34,736) - (43,304)
Expense on issue of capital spares to
production $'000 - - 4,948 - 14,487
(Gain) loss on disposal of property,
plant and equipment $'000 - - (511) - (468)
NRV write-down $'000 - - 25,692 - 85,890
Total cost of sales $'000 - - 273,257 - 760,737
Mining care and maintenance costs $'000 17,761 16,815 - 48,067 -
KTC care and maintenance costs $'000 3,824 2,062 - 8,963 -
Luilu care and maintenance costs $'000 2,878 2,641 - 8,349 -
Mine infrastructure and support care
and maintenance costs $'000 26,964 17,720 - 74,085 -
Expense on issue of capital spares to
production $'000 1,230 4,123 - 13,159 -
Loss (gain) on disposal of property,
plant and equipment $'000 375 (1,015) - (1,334) -
Royalties and transportation costs $'000 - 1 35,905 81 100,672
Depreciation $'000 6,915 6,806 54,656 21,425 172,463
Total operating expenses $'000 59,947 49,154 363,818 172,795 1,033,872
Copper tonnes sold tonnes - - 39,524 69 116,054
Cost per tonne sold $/tonne - - 9,205 - 8,909
Following the suspension of copper and cobalt processing in September 2015, mining, KTC and
Luilu care and maintenance costs decreased significantly.
o Mining care and maintenance costs for Q3 2016 YTD consisted of:
The costs of ongoing search and recovery and slope remediation activities
following the geotechnical failure on March 8, 2016;
The costs of dewatering operations in the open pits and underground;
The costs of limited backfilling operations;
Labour costs; and
Other costs relating to the care and maintenance of the open pits and
underground mines.
o KTC care and maintenance costs for Q3 2016 YTD consisted of:
Labour costs;
The costs of running limited milling operations to support underground backfill
activities; and
Other costs relating to the care and maintenance of KTC.
o Luilu care and maintenance costs for Q3 2016 YTD consisted of:
Labour costs; and
Other costs relating to the care and maintenance of Luilu.

MANAGEMENT’S DISCUSSION AND ANALYSIS OF FINANCIAL CONDITION AND RESULTS OF OPERATIONS
11
Review of 2016 Third Quarter Expenses
Mine infrastructure and support care and maintenance costs for Q3 2016 decreased by 40.5%,
when compared to Q3 2015 mine infrastructure and support costs, due to lower engineering costs
and savings following the suspension of copper and cobalt processing (mainly in relation to labour
savings following headcount reductions).
Compared to Q2 2016, mine infrastructure and support care and maintenance costs increased by
52.2% mainly due to slightly higher engineering costs of $6.6 million (Q2 2016 - $6.4 million)
and a loss on sales of warehouse inventory items of $2.4 million (Q2 2016 - $1.0 million loss)
Loss on disposal of property, plant and equipment was $0.4 million in Q3 2016 compared to a
$1.0 million profit in Q2 2016, which relates to lower sales of non-core products. In Q3 2015,
profit on disposal of property, plant and equipment was $0.5 million.
Royalty payments and transportation costs for Q3 2016 decreased by 100.0% over both Q3 2015
and Q2 2016, due to Nil tonnes sold following the suspension of copper and cobalt processing.
Depreciation and amortization decreased by 87.3% from Q3 2015 as a result of lower units-of-
production (“UOP”) amortization and depreciation following the suspension of copper and cobalt
processing and reduced mining due to the revised waste mining plan. Compared to Q2 2016,
depreciation increased by 1.6% due to additional waste tonnes mined.
Other expenses in Q3 2016 were lower compared to Q3 2015 due to restructuring expenses of
$24.0 million in Q3 2015 (Q3 2016 – nil).
Compared to Q2 2016, other expenses increased due to higher general and administrative expenses
of $1.0 million compared to $0.1 million in Q2 2016. This is mainly due to income relating to
stock-based compensation in Q2 2016 due to departure of senior employees prior to vesting of
their granted stock options. This resulted in reversal of accumulated costs.
Net finance costs in Q3 2016 increased compared to Q3 2015 and Q2 2016 mainly due to
additional funding drawn under customer prepayments. Amended Loan Facility interest expense
amounted to $77.5 million for Q3 2016 (Q3 2015 – $72.4 million and Q2 2016 - $75.2 million)
and customer prepayment interest of $11.1 million for Q3 2016 (Q3 2015 - $6.0 million and Q2
2016 - $10.4 million).
Income tax expense was $5.5 million in Q3 2016 and is related to 2014 and 2015 corporate
income taxes (Q3 2015 – $0.2 million expense and Q2 2016 – $0.2 million recovery).
Review of 2016 First Nine Months Expenses
Mine infrastructure and support care and maintenance costs for Q3 2016 YTD decreased by
34.0%, when compared to Q3 2015 YTD mine infrastructure and support costs, due to lower
engineering costs and savings following the suspension of copper and cobalt processing (mainly in
relation to labour savings following headcount reductions).
Gain on disposal of property, plant and equipment increased to $1.3 million in Q3 2016 YTD
compared to $0.5 million in Q3 2015 YTD, due to higher sales of non-core products.
Royalty payments and transportation costs for Q3 2016 YTD decreased by 99.9% over Q3 2015
YTD, due to the decrease in tonnes sold following the suspension of copper and cobalt processing.
Depreciation and amortization decreased by 87.6% from Q3 2015 YTD as a result of lower units-
of-production (“UOP”) amortization and depreciation following the suspension of copper and
cobalt processing and reduced mining due to the revised waste mining plan.
Other expenses in Q3 2016 YTD decreased compared to Q3 2015 YTD, due to restructuring
expenses of $24.0 million in Q3 2015 YTD, slightly offset by a foreign exchange gain of $8.0
million in Q3 2015 YTD (Q3 2016 YTD - $1.6 million gain).
Net finance costs in Q3 2016 YTD increased compared to Q3 2015 YTD, due to the cessation of
borrowing cost capitalisation during Q1 2015 following the completion of the Phase 5 Expansion
Project. This resulted in Amended Loan Facility interest expense of $227.0 million for Q3 2016
YTD (Q3 2015 YTD – $166.6 million) and customer prepayment interest of $31.5 million for Q3
2016 YTD (Q3 2015 YTD – $10.9 million).
Income tax expense in Q3 2016 YTD was $5.4 million and is related to 2014 and 2015 corporate
income taxes (Q3 2015 YTD – $111.1 million recovery). Deferred tax recognition on tax losses
carried forward in the DRC ceased in Q2 2015. Such recognition will be reassessed on
commissioning of the WOL Project.

MANAGEMENT’S DISCUSSION AND ANALYSIS OF FINANCIAL CONDITION AND RESULTS OF OPERATIONS
12
Cash Flows
Three months ended Nine months ended
Sep 30, Jun 30, Sep 30, Sep 30,
2016 2016 2015 2016 2015
Cash flow from (used in):
Operating activities $'000 (33,141) (42,007) (167,644) (153,990) (459,560)
Investing activities $'000 (69,758) (22,979) (125,853) (145,511) (386,862)
Financing activities $'000 96,650 71,500 296,992 263,945 892,142
Total cash flows $'000 (6,249) 6,513 3,495 (35,556) 45,720
Cash, beginning of period* $'000 8,429 1,923 31,686 37,740 (10,519)
Effect of exchange rate changes on cash
held in foreign currencies $'000 9 (8) (17) 5 (37)
Cash, end of period* $'000 2,188 8,429 35,164 2,188 35,164
* Consisting of cash on hand and bank overdrafts.
Review of 2016 Third Quarter Cash Flows
Cash outflows from operating activities were:
o $134.5 million lower in Q3 2016, when compared to Q3 2015, primarily due to:
A working capital inflow of $21.6 million (Q3 2015 - $52.5 million outflow);
and
A decrease in net loss, net of non-cash items, of $60.4 million, as described
above.
o $8.9 million lower, when compared to Q2 2016, primarily due to:
A working capital inflow of $21.6 million (Q2 2016 - $3.8 million inflow); and
An increase in net loss, net of non-cash items, of $8.8 million, as described
above.
Investing activities in Q3 2016 decreased by $56.1 million, when compared to Q3 2015, mainly
due to lower expenditure on the KOV mining fleet, lower KOV pre-strip costs capitalized, lower
primary development and lower sustaining capital, slightly offset by WOL Project investments.
Investing activities in Q3 2016 were in line with planned spending on expansionary projects and
sustaining capital expenditure.
Financing activities in Q3 2016 were in line with planned funding. The Q3 2016 draw-downs
were mainly utilized to fund additions to property, plant and equipment and operating cash
outflows.
Review of 2016 First Nine Months Cash Flows
Cash outflows from operating activities were:
o $305.6 million lower in Q3 2016 YTD, when compared to Q3 2015 YTD, primarily due
to:
A working capital inflow of $29.2 million (Q3 2015 YTD - $273.4 million
outflow); and
A decrease in net loss, net of non-cash items, of $3.0 million, as described
above.
Investing activities in Q3 2016 YTD decreased by $241.4 million, when compared to Q3 2015
YTD, mainly due to the completion of the Phase 5 Expansion Project, lower expenditure on the
KOV mining fleet, lower pre-strip costs capitalized, lower primary development and lower
sustaining capital, slightly offset by WOL Project investments.
Financing activities in Q3 2016 YTD decreased by $628.2 million, when compared to Q3 2015
YTD, due to lower funding by Glencore. The Q3 2016 YTD draw-downs were mainly utilized to
fund additions to property, plant and equipment and operating cash outflows.

MANAGEMENT’S DISCUSSION AND ANALYSIS OF FINANCIAL CONDITION AND RESULTS OF OPERATIONS
13
5. Statement of Financial Position Discussion
September 30,
2016
$’000
December 31,
2015
$’000
Assets
Cash and cash equivalents 2,188 37,740
Receivables 220,633 201,900
Inventories 574,184 620,517
Prepayments and other current assets 119,181 274,704
Mineral interests and property, plant and equipment 4,240,497 4,128,746
Other non-current assets 629,435 515,078
5,786,118 5,778,685
Liabilities
Current liabilities 277,299 320,062
Customer prepayments 1,505,727 1,208,243
Amended loan facilities 3,284,739 3,057,760
Other non-current liabilities 14,688 12,445
5,082,453 4,598,510
Total equity 703,665 1,180,175
Cash and cash equivalents / liquidity
The cash and cash equivalents balance decreased from $37.7 million at December 31, 2015 to $2.2 million
at September 30, 2016. The movements in cash and cash equivalents are discussed in item 4 under the
heading “Cash Flows”.
Receivables
As at September 30, 2016, the receivables balance of $220.6 million includes $185.7 million of VAT input
credits receivable, $14.3 million of outstanding balances for warehouse inventory items invoiced to
Mutanda and $7.2 million of outstanding balances for mining fleet invoiced to Mopani. Receivables
increased by $18.7 million from December 31, 2015 due to an increase in other receivables, mainly VAT
input credits of $17.5 million, and an increase in third party receivables of $3.5 million, slightly offset by a
decrease in related party receivables of $2.1 million.
Inventories
Inventories decreased from $620.5 million at December 31, 2015 to $574.2 million at September 30, 2016,
due to a decrease in consumables inventories of $46.3 million following sales of warehouse inventory items
to Mutanda and third parties. A review of all inventory levels and the subsequent right sizing of the
consumables balance has started following the suspension of copper and cobalt processing and is still
underway. As at September 30, 2016, $65.9 million of consumables inventories with a useful life of more
than one year were included in property, plant and equipment as capital spares (December 31, 2015 - $69.3
million).

MANAGEMENT’S DISCUSSION AND ANALYSIS OF FINANCIAL CONDITION AND RESULTS OF OPERATIONS
14
Prepayments and other current assets
Prepayments and other current assets decreased from $274.7 million at December 31, 2015 to $119.2
million at September 30, 2016, primarily due to a reclassification of $109.3 million relating to royalties and
drilling prepayments to Gecamines from current to non-current prepayments following the suspension of
copper and cobalt processing.
Mineral interests and property, plant and equipment
Mineral interests and property, plant and equipment increased from $4,128.7 million at December 31, 2015
to $4,240.5 million at September 30, 2016, primarily due to sustaining capital expenditures of $17.2
million, KOV and Mashamba East pre-stripping expenditures of $23.3 million, project related capital
expenditures of $109.7 million and capitalized borrowing costs of $2.0 million offset by depreciation and
amortization expense of $21.4 million. As at September 30, 2016, $65.9 million of consumables inventory
with a useful life of more than one year were included in property, plant and equipment as capital spares
(December 31, 2015 - $69.3 million).
Other non-current assets
Other non-current assets increased from $515.1 million at December 31, 2015 to $629.4 million at
September 30, 2016, mainly due to an increase in non-current prepayments relating to a reclassification of
$109.3 million relating to royalties and drilling prepayments to Gecamines from current to non-current
prepayments.
Current liabilities
Current liabilities decreased from $320.1 million at December 31, 2015 to $277.3 million at September 30,
2016. This is primarily due to a decrease in trade payables and accruals of $62.8 million, a $3.7 million
decrease in provisions mainly driven by the partial utilization of the restructuring provision and a $1.4
million decrease in the current portion of other non-current liabilities, offset by an increase in credit
facilities relating to letters of credit of $25.1 million. Letters of credit were obtained in relation to the
purchase of property, plant and equipment, and consumables inventories. The letters of credit carry an
interest rate of 1.17% ($13.1 million) and 1.15% ($12.0 million) per annum. The maturity date of the total
balance of $25.1 million is in October, 2016.
Customer prepayments
Customer prepayments increased from $1,208.2 million at December 31, 2015 to $1,505.7 million at
September 30, 2016. This is due to $263.9 million of advance payments received and $33.5 million of
interest payable accrued. It is the Company’s intention to transfer the existing and future customer
prepayments into a loan facility in due course.
Amended Loan Facilities
Amended Loan Facilities (refer to item 9) increased from $3,057.8 million at December 31, 2015, to
$3,284.7 million at September 30, 2016, due to the accrual of interest of $227.0 million which is payable on
maturity on January 1, 2021.
Other non-current liabilities
As at September 30, 2016, other non-current liabilities consist of decommissioning and environmental
provisions, and have increased from $12.4 million as at December 31, 2015, to $14.7 million as at
September 30, 2016 as a result of the accretion ($1.2 million) as well as an increase in the liability of $1.1
million since the company reassessed its WACC rate and lowered it from 11.25% to 10.70%.
Off-Balance Sheet Arrangements
As at September 30, 2016, the Company had no off-balance sheet arrangements.
MANAGEMENT’S DISCUSSION AND ANALYSIS OF FINANCIAL CONDITION AND RESULTS OF OPERATIONS
15
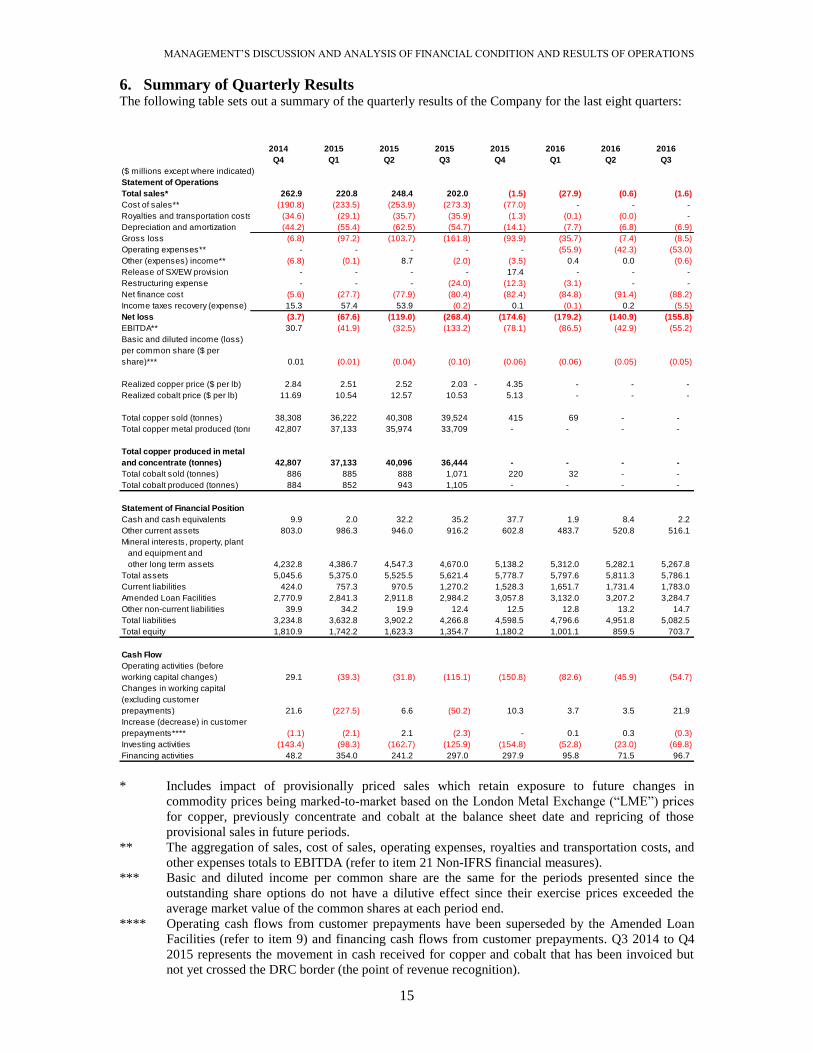
6. Summary of Quarterly Results The following table sets out a summary of the quarterly results of the Company for the last eight quarters:
* Includes impact of provisionally priced sales which retain exposure to future changes in
commodity prices being marked-to-market based on the London Metal Exchange (“LME”) prices
for copper, previously concentrate and cobalt at the balance sheet date and repricing of those
provisional sales in future periods.
** The aggregation of sales, cost of sales, operating expenses, royalties and transportation costs, and
other expenses totals to EBITDA (refer to item 21 Non-IFRS financial measures).
*** Basic and diluted income per common share are the same for the periods presented since the
outstanding share options do not have a dilutive effect since their exercise prices exceeded the
average market value of the common shares at each period end.
**** Operating cash flows from customer prepayments have been superseded by the Amended Loan
Facilities (refer to item 9) and financing cash flows from customer prepayments. Q3 2014 to Q4
2015 represents the movement in cash received for copper and cobalt that has been invoiced but
not yet crossed the DRC border (the point of revenue recognition).
2014 2015 2015 2015 2015 2016 2016 2016
Q4 Q1 Q2 Q3 Q4 Q1 Q2 Q3
($ millions except where indicated)
Statement of Operations
Total sales* 262.9 220.8 248.4 202.0 (1.5) (27.9) (0.6) (1.6)
Cost of sales** (190.8) (233.5) (253.9) (273.3) (77.0) - - -
Royalties and transportation costs** (34.6) (29.1) (35.7) (35.9) (1.3) (0.1) (0.0) -
Depreciation and amortization (44.2) (55.4) (62.5) (54.7) (14.1) (7.7) (6.8) (6.9)
Gross loss (6.8) (97.2) (103.7) (161.8) (93.9) (35.7) (7.4) (8.5)
Operating expenses** - - - - - (55.9) (42.3) (53.0)
Other (expenses) income** (6.8) (0.1) 8.7 (2.0) (3.5) 0.4 0.0 (0.6)
Release of SX/EW provision - - - - 17.4 - - -
Restructuring expense - - - (24.0) (12.3) (3.1) - -
Net finance cost (5.6) (27.7) (77.9) (80.4) (82.4) (84.8) (91.4) (88.2)
Income taxes recovery (expense) 15.3 57.4 53.9 (0.2) 0.1 (0.1) 0.2 (5.5)
Net loss (3.7) (67.6) (119.0) (268.4) (174.6) (179.2) (140.9) (155.8)
EBITDA** 30.7 (41.9) (32.5) (133.2) (78.1) (86.5) (42.9) (55.2)
Basic and diluted income (loss)
per common share ($ per
share)*** 0.01 (0.01) (0.04) (0.10) (0.06) (0.06) (0.05) (0.05)
Realized copper price ($ per lb) 2.84 2.51 2.52 2.03 4.35- - - -
Realized cobalt price ($ per lb) 11.69 10.54 12.57 10.53 5.13 - - -
Total copper sold (tonnes) 38,308 36,222 40,308 39,524 415 69 - -
Total copper metal produced (tonnes) 42,807 37,133 35,974 33,709 - - - -
Total copper produced in metal
and concentrate (tonnes) 42,807 37,133 40,096 36,444 - - - -
Total cobalt sold (tonnes) 886 885 888 1,071 220 32 - -
Total cobalt produced (tonnes) 884 852 943 1,105 - - - -
Statement of Financial Position
Cash and cash equivalents 9.9 2.0 32.2 35.2 37.7 1.9 8.4 2.2
Other current assets 803.0 986.3 946.0 916.2 602.8 483.7 520.8 516.1
Mineral interests, property, plant
and equipment and
other long term assets 4,232.8 4,386.7 4,547.3 4,670.0 5,138.2 5,312.0 5,282.1 5,267.8
Total assets 5,045.6 5,375.0 5,525.5 5,621.4 5,778.7 5,797.6 5,811.3 5,786.1
Current liabilities 424.0 757.3 970.5 1,270.2 1,528.3 1,651.7 1,731.4 1,783.0
Amended Loan Facilities 2,770.9 2,841.3 2,911.8 2,984.2 3,057.8 3,132.0 3,207.2 3,284.7
Other non-current liabilities 39.9 34.2 19.9 12.4 12.5 12.8 13.2 14.7
Total liabilities 3,234.8 3,632.8 3,902.2 4,266.8 4,598.5 4,796.6 4,951.8 5,082.5
Total equity 1,810.9 1,742.2 1,623.3 1,354.7 1,180.2 1,001.1 859.5 703.7
Cash Flow
Operating activities (before
working capital changes) 29.1 (39.3) (31.8) (115.1) (150.8) (82.6) (45.9) (54.7)
Changes in working capital
(excluding customer
prepayments) 21.6 (227.5) 6.6 (50.2) 10.3 3.7 3.5 21.9
Increase (decrease) in customer
prepayments**** (1.1) (2.1) 2.1 (2.3) - 0.1 0.3 (0.3)
Investing activities (143.4) (98.3) (162.7) (125.9) (154.8) (52.8) (23.0) (69.8)
Financing activities 48.2 354.0 241.2 297.0 297.9 95.8 71.5 96.7

MANAGEMENT’S DISCUSSION AND ANALYSIS OF FINANCIAL CONDITION AND RESULTS OF OPERATIONS
16
In Q3 2014, profitability was adversely impacted by reduced income tax recoveries. Income tax recoveries
during 2014 and up to Q2 2015 were due to deferred tax credits principally arising from increases in tax
losses carried forward in the DRC. In Q3 2015, the recognition of such deferred tax assets was suspended.
In Q4 2014, profitability was adversely impacted by decreasing copper and cobalt prices and reduced
income tax recoveries.
In Q1 2015 profitability was adversely impacted by reduced copper and cobalt prices, decreasing copper
production, the cessation of borrowing cost capitalisation and the write down of product inventories to net
realizable value. These factors were offset by increased income tax recoveries.
In Q1 2015, the Company ceased borrowing cost capitalization leading to the expensing of Amended Loan
Facility and customer prepayment interest costs of $24.4 million, $74.6 million, $78.4 million and $82.1
million in Q1 2015, Q2 2015, Q3 2015 and Q4 2015, respectively.
In Q1 2015, Q2 2015 and Q3 2015 the Company incurred an expense of $24.9 million, $35.3 million and
$25.7 million, respectively, on inventory write-down due to the decrease in the copper price.
In Q2 2015, profitability was adversely impacted by the expensing of Amended Loan Facility and customer
prepayment interest costs of $74.6 million and inventory write down costs of $35.3 million, offset by an
increase in copper sales tonnes and an increase in cobalt prices.
In Q3 2015, profitability was adversely impacted by decreasing copper and cobalt prices, a $24.0 million
restructuring expense recorded following the suspension of copper and cobalt production in September
2015 and the suspension of recognition of deferred tax assets. These factors were offset by an increase in
cobalt production and sales.
In Q4 2015, profitability was negatively impacted by a further $12.3 million restructuring expense and the
recording of a provision of $30.6 million in relation to the write-down to net realizable value of
consumables inventory.
In Q1 2016, profitability was negatively impacted by additional quality discounts of $25.4 million relating
to finalization of outstanding 2015 sales, and a further $3.1 million restructuring expense.
In Q2 2016, profitability compared to Q1 2016 was positively impacted by lower negative sales of $0.6
million relating to the finalization of copper sold in 2015, and cost savings following the suspension of
copper and cobalt processing.
In Q3 2016, profitability compared to Q2 2016 was negatively impacted by higher negative sales of $1.6
million relating to the finalization of copper sold in 2015, as well as loss on sale of assets amounting to $0.4
million due to lower sales of non-core products and higher loss on sales of warehouse inventory items of
$2.4 million.
These movements in the results are also reflected in the cash flows from operating activities before working
capital changes.
Investing activities increased in Q3 2014, as the Phase 5 Expansion Project progressed, and then again in
Q2 2015 and Q4 2015, due to mining fleet acquisitions and pre-stripping costs at KOV, and this has also
resulted in an increase in the net additions to mineral interest and other assets. Other movements on the
statement of financial position can be primarily attributed to the changes in production.

MANAGEMENT’S DISCUSSION AND ANALYSIS OF FINANCIAL CONDITION AND RESULTS OF OPERATIONS
17
The following production information sets out the quarterly results of the Company for the last
eight quarters:
2014 2015 2015 2015 2015 2016 2016 2016
Q4 Q1 Q2 Q3 Q4 Q1 Q2 Q3
Copper and Cobalt
Production Statistics
Open Pit Mining - KOV
Waste mined (tonnes) 7,820,548 6,215,360 9,395,807 11,656,361 7,456,107 1,121,281 944,834 3,282,938
Ore mined (tonnes) 1,368,624 1,343,544 1,669,055 1,331,428 202,559 - - 825
Copper grade (%) 4.41 3.66 3.95 4.16 3.30 - - 2.67
Cobalt grade (%) 0.46 0.46 0.52 0.42 0.65 - - 0.68
Open Pit Mining - T17
Waste mined (tonnes) - - - - - - - -
Ore mined (tonnes) - - - - - - - -
Copper grade (%) - - - - - - - -
Cobalt grade (%) - - - - - - - -
Open Pit Mining - Mashamba
East
Waste mined (tonnes) - - 304,057 1,618,381 2,303,698 - 633,725 -
Ore mined (tonnes) - - 4,312 - - - - -
Copper grade (%) - - 3.42 - - - - -
Cobalt grade (%) - - 0.41 - - - - -
Underground Mining - KTO
Waste mined (tonnes) 115,529 103,179 57,943 53,319 21,472 21,392 4,875 12,934
Ore mined (tonnes) 495,343 504,725 526,292 447,915 - - - -
Copper grade (%) 3.68 3.32 3.06 3.28 - - - -
Cobalt grade (%) 0.43 0.38 0.31 0.40 - - - -
Underground Mining - Etang
South
Waste mined (tonnes) - - 14,954 16,930 - - - -
Ore mined (tonnes) - - 1,695 - - - - -
Copper grade (%) - - 2.43 - - - - -
Cobalt grade (%) - - 0.45 - - - - -
Underground Mining - T17
Waste mined (tonnes) 20,070 4,925 - - - - - -
Ore mined (tonnes) - - - - - - - -
Copper grade (%) - - - - - - - -
Cobalt grade (%) - - - - - - - -
Underground Mining - KTE
Waste mined (tonnes) - 67,650 44,586 50,218 - - - -
Ore mined (tonnes) - - - - - - - -
Copper grade (%) - - - - - - - -
Cobalt grade (%) - - - - - - - -
Total Mining
Waste mined (tonnes) 7,956,147 6,391,114 9,817,347 13,395,209 9,781,277 1,142,672 1,583,434 3,295,872
Ore mined (tonnes) 1,863,967 1,848,269 2,201,354 1,779,343 202,559 - - 825
Copper grade (%) 4.22 3.57 3.74 3.94 3.30 - - 2.67
Cobalt grade (%) 0.45 0.44 0.47 0.42 0.65 - - 0.68
KTC Concentrator
Ore processed (tonnes) 1,722,177 1,959,724 2,034,949 1,460,316 - - - -
Concentrate produced (tonnes) 287,604 270,608 317,392 271,647 - - - -
Luilu Metullurgical Plant
Total concentrate feed (tonnes) 318,096 279,492 292,671 272,545 - - - -
Copper produced (tonnes) 42,807 37,133 35,974 33,709 - - - -
Cobalt produced (tonnes) 884 852 943 1,105 - - - -
MANAGEMENT’S DISCUSSION AND ANALYSIS OF FINANCIAL CONDITION AND RESULTS OF OPERATIONS
18
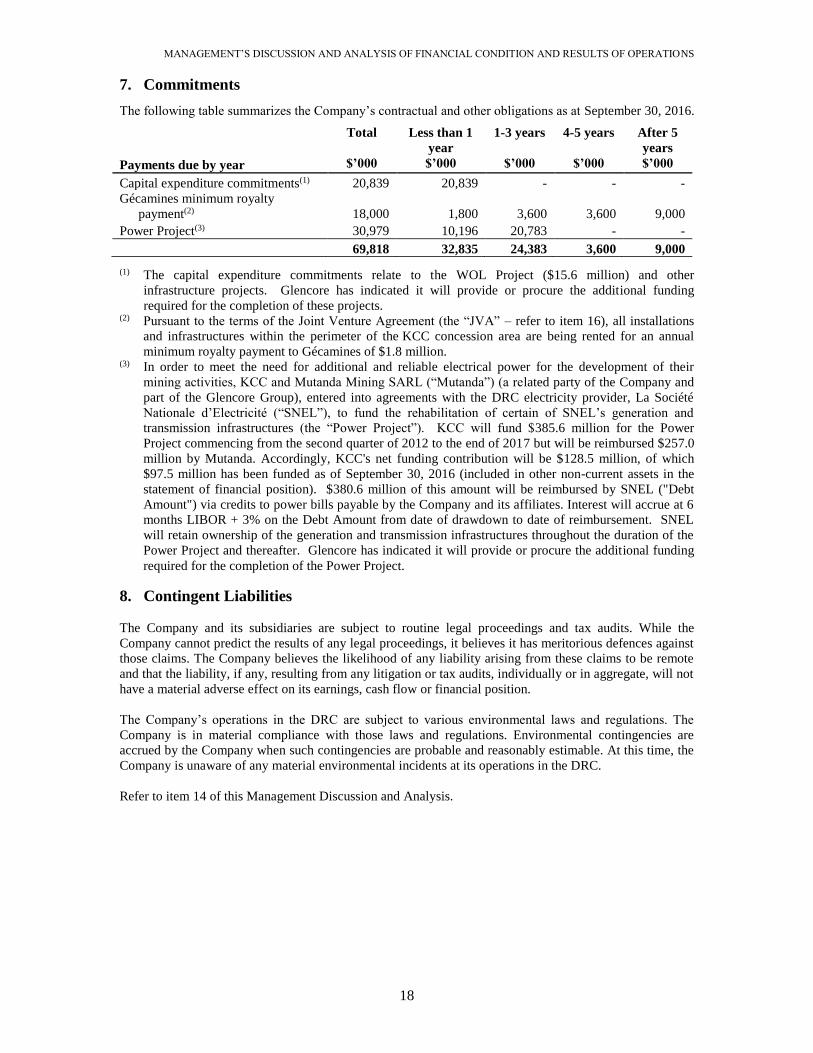
7. Commitments
The following table summarizes the Company’s contractual and other obligations as at September 30, 2016.
(1) The capital expenditure commitments relate to the WOL Project ($15.6 million) and other
infrastructure projects. Glencore has indicated it will provide or procure the additional funding
required for the completion of these projects. (2) Pursuant to the terms of the Joint Venture Agreement (the “JVA” – refer to item 16), all installations
and infrastructures within the perimeter of the KCC concession area are being rented for an annual
minimum royalty payment to Gécamines of $1.8 million. (3) In order to meet the need for additional and reliable electrical power for the development of their
mining activities, KCC and Mutanda Mining SARL (“Mutanda”) (a related party of the Company and
part of the Glencore Group), entered into agreements with the DRC electricity provider, La Société
Nationale d’Electricité (“SNEL”), to fund the rehabilitation of certain of SNEL’s generation and
transmission infrastructures (the “Power Project”). KCC will fund $385.6 million for the Power
Project commencing from the second quarter of 2012 to the end of 2017 but will be reimbursed $257.0
million by Mutanda. Accordingly, KCC's net funding contribution will be $128.5 million, of which
$97.5 million has been funded as of September 30, 2016 (included in other non-current assets in the
statement of financial position). $380.6 million of this amount will be reimbursed by SNEL ("Debt
Amount") via credits to power bills payable by the Company and its affiliates. Interest will accrue at 6
months LIBOR + 3% on the Debt Amount from date of drawdown to date of reimbursement. SNEL
will retain ownership of the generation and transmission infrastructures throughout the duration of the
Power Project and thereafter. Glencore has indicated it will provide or procure the additional funding
required for the completion of the Power Project.
8. Contingent Liabilities
The Company and its subsidiaries are subject to routine legal proceedings and tax audits. While the
Company cannot predict the results of any legal proceedings, it believes it has meritorious defences against
those claims. The Company believes the likelihood of any liability arising from these claims to be remote
and that the liability, if any, resulting from any litigation or tax audits, individually or in aggregate, will not
have a material adverse effect on its earnings, cash flow or financial position.
The Company’s operations in the DRC are subject to various environmental laws and regulations. The
Company is in material compliance with those laws and regulations. Environmental contingencies are
accrued by the Company when such contingencies are probable and reasonably estimable. At this time, the
Company is unaware of any material environmental incidents at its operations in the DRC.
Refer to item 14 of this Management Discussion and Analysis.
Total Less than 1
year
1-3 years 4-5 years After 5
years
Payments due by year $’000 $’000 $’000 $’000 $’000
Capital expenditure commitments(1) 20,839 20,839 - - -
Gécamines minimum royalty
payment(2) 18,000 1,800 3,600 3,600 9,000
Power Project(3) 30,979 10,196 20,783 - -
69,818 32,835 24,383 3,600 9,000

MANAGEMENT’S DISCUSSION AND ANALYSIS OF FINANCIAL CONDITION AND RESULTS OF OPERATIONS
19
9. Liquidity and Capital Resources
As at September 30, 2016, the Company had cash and cash equivalents of $2.2 million (December 31, 2015
– $37.7 million) and a working capital shortfall of $1,264.7 million (December 31, 2015 – $887.8 million).
In December 2011, the Company announced the execution of two loan facilities with Glencore Finance
(Bermuda) Limited, a subsidiary of Glencore, with total available borrowing of up to $635.5 million (the
“Loan Facilities”). $120.0 million was provided to the Company during the year ended December 31, 2011,
as a new term loan facility (the “Term Loan”) to fund in substantial part the redemption of the Company's
debentures. On December 13, 2012, the second facility (the “Senior Facility”), making up the balance of
the available borrowing and amounting to $515.5 million, was provided to a subsidiary of the Company and
together with other subsidiaries of the Company as guarantors, as a senior secured credit facility to fund a
portion of the Updated Phase 4 Expansion Project not covered by the Company's cash flows.
On November 26, 2014, the Company announced the execution of extended and increased loan facilities
with Glencore Finance (Bermuda) Limited. The amended facilities are comprised of the Senior Facility
and Term Loan, each as amended (the "Amended Loan Facilities") as follows:
The Senior Facility was increased to include the existing $515.5 million Senior Facility (plus accrued
interest thereon) and $1,815.8 million of un-invoiced customer prepayments provided by Glencore
International AG to KCC (plus accumulated interest thereon), which were converted into loans bearing
interest at 10% per annum and provided by Glencore Finance (Bermuda) Limited. Included in the total
amount of the amended Senior Facility was further funding of $50.0 million, which was subsequently fully
drawn down, made available according to the cash flow requirements of KCC based on the approved
budgets for the Phase 5 Expansion Project and the Power Project. The amount of the Term Loan remained
unchanged at $120.0 million plus accumulated interest. The maturity of the Senior Facility and the Term
Loan was extended to January 1, 2021. All other material terms of the Senior Facility and the Term Loan
remained the same.
The Company's 75% interest in KCC (which holds the copper and cobalt project assets) has been pledged
as security for the Senior Facility along with certain other assets of the Company and its subsidiaries. As
security for the Term Loan and additional security for the Senior Facility, the Company has agreed, if a
Loan Facility is in default, to complete a discounted rights offering with a Glencore subsidiary providing a
standby commitment, to repay the Loan Facility. In the case of the Senior Facility, a Glencore subsidiary
has agreed to exercise its right to compel the Company to complete the discounted rights offering prior to
realizing on the Glencore subsidiary's other security. The Loan Facilities contain undertakings which
restrict the Company’s and other Company subsidiaries’ ability to (i) make acquisitions, (ii) grant loans,
(iii) provide guarantees, (iv) pledge or dispose of their assets, as well as certain additional undertakings
which are customary for these type of transactions.
MANAGEMENT’S DISCUSSION AND ANALYSIS OF FINANCIAL CONDITION AND RESULTS OF OPERATIONS
20
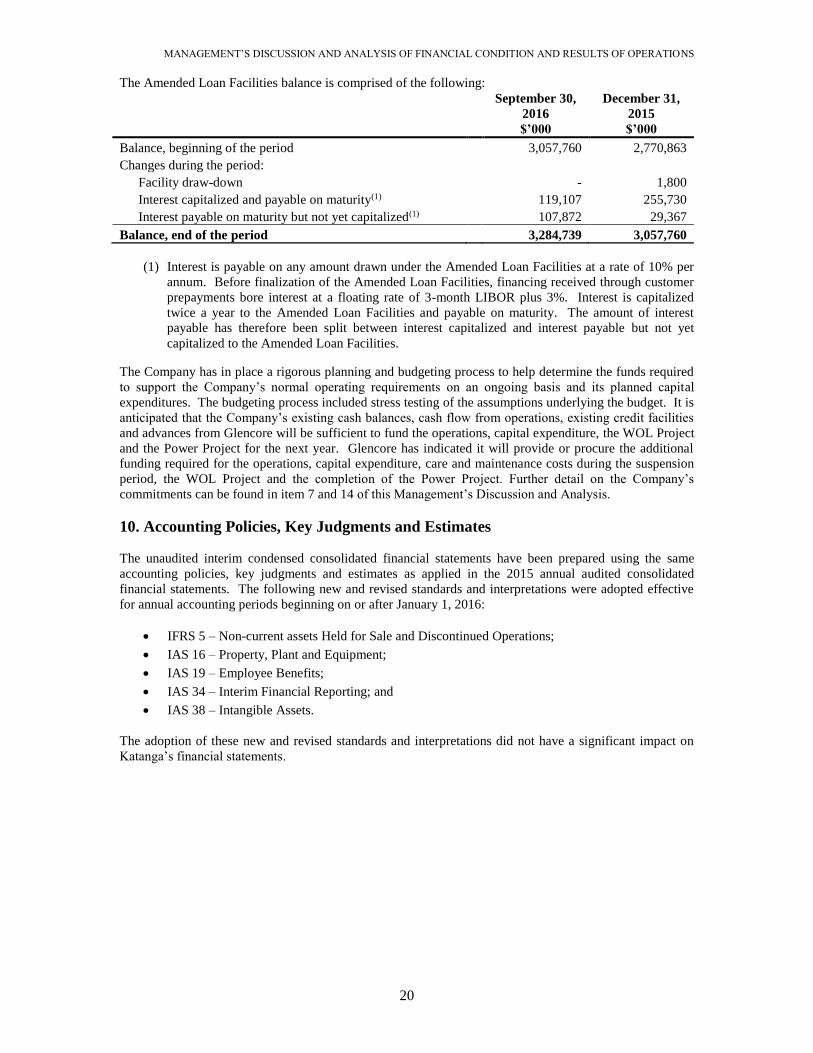
The Amended Loan Facilities balance is comprised of the following:
September 30,
2016
$’000
December 31,
2015
$’000
Balance, beginning of the period 3,057,760 2,770,863
Changes during the period:
Facility draw-down - 1,800
Interest capitalized and payable on maturity(1) 119,107 255,730
Interest payable on maturity but not yet capitalized(1) 107,872 29,367
Balance, end of the period 3,284,739 3,057,760
(1) Interest is payable on any amount drawn under the Amended Loan Facilities at a rate of 10% per
annum. Before finalization of the Amended Loan Facilities, financing received through customer
prepayments bore interest at a floating rate of 3-month LIBOR plus 3%. Interest is capitalized
twice a year to the Amended Loan Facilities and payable on maturity. The amount of interest
payable has therefore been split between interest capitalized and interest payable but not yet
capitalized to the Amended Loan Facilities.
The Company has in place a rigorous planning and budgeting process to help determine the funds required
to support the Company’s normal operating requirements on an ongoing basis and its planned capital
expenditures. The budgeting process included stress testing of the assumptions underlying the budget. It is
anticipated that the Company’s existing cash balances, cash flow from operations, existing credit facilities
and advances from Glencore will be sufficient to fund the operations, capital expenditure, the WOL Project
and the Power Project for the next year. Glencore has indicated it will provide or procure the additional
funding required for the operations, capital expenditure, care and maintenance costs during the suspension
period, the WOL Project and the completion of the Power Project. Further detail on the Company’s
commitments can be found in item 7 and 14 of this Management’s Discussion and Analysis.
10. Accounting Policies, Key Judgments and Estimates
The unaudited interim condensed consolidated financial statements have been prepared using the same
accounting policies, key judgments and estimates as applied in the 2015 annual audited consolidated
financial statements. The following new and revised standards and interpretations were adopted effective
for annual accounting periods beginning on or after January 1, 2016:
IFRS 5 – Non-current assets Held for Sale and Discontinued Operations;
IAS 16 – Property, Plant and Equipment;
IAS 19 – Employee Benefits;
IAS 34 – Interim Financial Reporting; and
IAS 38 – Intangible Assets.
The adoption of these new and revised standards and interpretations did not have a significant impact on
Katanga’s financial statements.

MANAGEMENT’S DISCUSSION AND ANALYSIS OF FINANCIAL CONDITION AND RESULTS OF OPERATIONS
21
New standards not yet effective
At the date of authorisation of these financial statements, the following new standards, which are applicable
to the Company, were issued but are not yet effective:
IFRS 15 – Revenue from Contracts with Customers – effective for year ends beginning on or after
1 January 2018. IFRS 15 applies to revenue from contracts with customers and replaces all of the
revenue standards and interpretations in IFRS. The standard outlines the principles an entity must
apply to measure and recognise revenue and the related cash flows.
IFRS 9 – Financial Instruments – effective for year ends beginning on or after 1 January 2018.
IFRS 9 modifies the classification and measurement of certain classes of financial assets and
liabilities. The most significant change is to rationalise from four to two primary categories of
financial assets.
IFRS 16 Leases: Effective for year ends beginning on or after 1 January 2019. IFRS 16 provides a
comprehensive model for identification of lease arrangements and their treatment in the financial
statements of both lessees and lessors. It supersedes IAS 17 Leases and its associated
interpretative guidance.
The Company has not early adopted these standards and amendments. The Company is currently assessing
what impact the application of the remaining standards or amendments will have on the financial
statements. These standards and amendments will be first applied in the financial report of the Company
that relates to the annual reporting period beginning on or after the effective date of each pronouncement.
11. Outstanding Share Data
(a) AUTHORIZED
An unlimited number of common shares with no par value.
(b) ISSUED AT SEPTEMBER 30, 2016
1,907,380,413 common shares.
(c) SHARE OPTIONS
The following table reflects the continuity of share options during the periods presented:
Number of share
options
Weighted Exercise
Price per Share (1)
Outstanding at January 1, 2015 7,153,658) $2.85)
Forfeited during the year (3,095,406) ($0.97)
Outstanding at December 31, 2015 4,058,252) $4.28)
Forfeited during the period (1,562,754) ($0.79)
Outstanding at September 30, 2016 2,495,498) $6.47)
(1) Denominated in Canadian dollars.

MANAGEMENT’S DISCUSSION AND ANALYSIS OF FINANCIAL CONDITION AND RESULTS OF OPERATIONS
22
12. Related Party Transactions
Related parties and related party transactions not otherwise disclosed elsewhere in this Management’s
Discussion and Analysis include:
Galif Investments Limited (“Galif”), registered in Bermuda, is an aircraft management company whose
ultimate beneficial owner is Glencore. During 2016 and 2015, Galif provided aircraft maintenance and
auxiliary services to the Company in the normal course of business and on arm’s length commercial terms.
For the nine months ending September 30, 2016 and 2015 the Company incurred charges of $0.7 million
and $1.9 million, respectively.
Glencore is the Company’s ultimate majority shareholder and is represented on the Board of Directors of
the Company. In November 2007, Glencore’s wholly owned subsidiary, Glencore International AG entered
into a 100% off-take agreement for concentrate sales with the Company and commencing January 1, 2009,
pursuant to additional off-take agreements, all copper and cobalt metal produced are sold to Glencore
International AG on market terms for the life of any mines and plants operated, acquired and / or developed
by the Company in the DRC. The off-take agreements were entered into before Glencore was a related
party of the Company. In December 2011, the Company entered into the Loan Facilities with total
available borrowings of up to $635,500, which was fully drawn down during 2011 and 2012. Such Loan
Facilities were amended in 2014 (refer to item 9).
Mutanda Mining SARL (“Mutanda”) is a copper and cobalt producer located in the DRC and is a 69%
owned subsidiary of Glencore. During the year ended December 31, 2012, the Company commenced the
Power Project with Mutanda and Kansuki SPRL (since merged with Mutanda). Additionally, there is an
agreement in place for employees of either Katanga or Mutanda to use charter flights operated by either
company with associated costs invoiced. In November 2014, the Company’s Board of Directors, including
its independent directors, unanimously approved entering into a contract for the sale by Mutanda of copper
concentrate to the Company, in the ordinary course of business and on arm’s length commercial terms.
Further, during 2016, the Company supplied warehouse inventory items to Mutanda. During 2015,
Mutanda supplied processing consumables and medical services to the Company. These services were
provided in the normal course of business and on arm’s length commercial terms.
Mopani Copper Mines Plc (“Mopani”) is a copper and cobalt producer located in Zambia. Mopani is a
73.1% owned subsidiary of Glencore. During 2015, Mopani supplied sulphuric acid and other
consumables to the Company in the normal course of business and on arm’s length commercial terms.
Further, during 2016, the Company sold mining fleet to Mopani. This sale was done in the ordinary course
of business and on arm’s length commercial terms.
Glencore Technology Proprietary Limited (“Glencore Technology”) is a provider of mining services and
is a 100% subsidiary of Glencore. During 2016 and 2015, Glencore Technology provided mining
equipment and services to the Company, in the normal course of business and on arm’s length commercial
terms.
MANAGEMENT’S DISCUSSION AND ANALYSIS OF FINANCIAL CONDITION AND RESULTS OF OPERATIONS
23
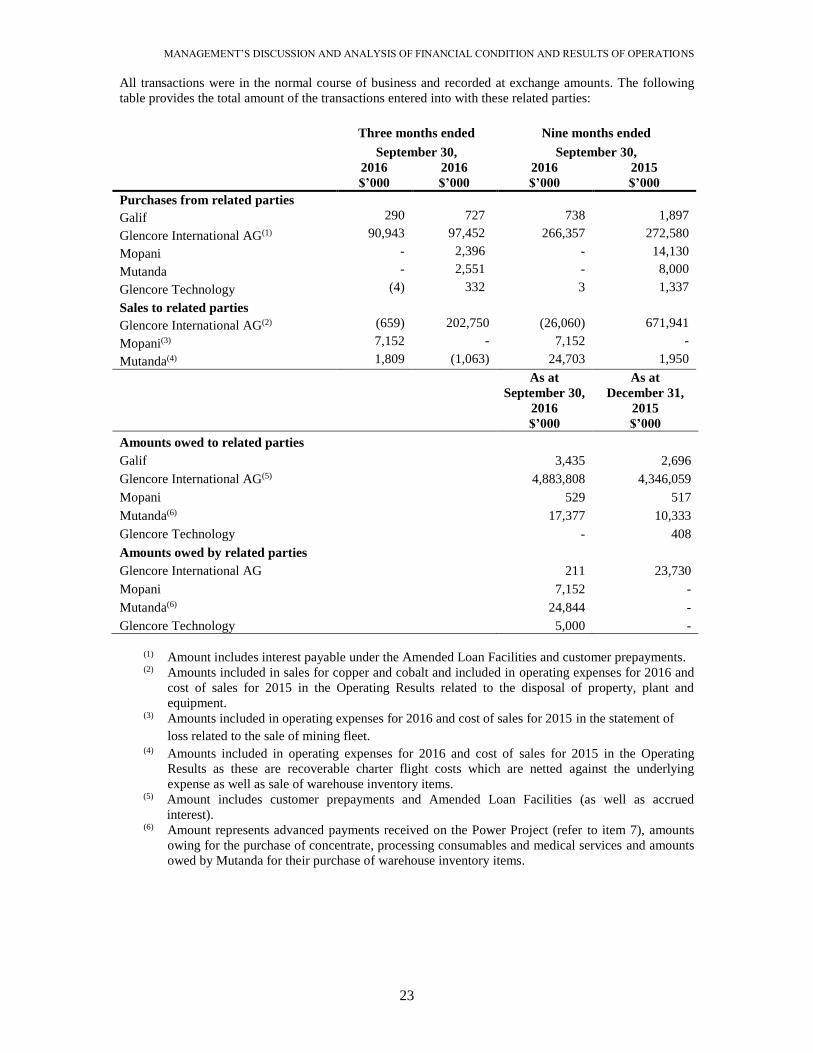
All transactions were in the normal course of business and recorded at exchange amounts. The following
table provides the total amount of the transactions entered into with these related parties:
Three months ended Nine months ended
September 30, September 30,
2016
$’000
2016
$’000
2016
$’000
2015
$’000
Purchases from related parties
Galif 290 727) 738 1,897
Glencore International AG(1) 90,943 97,452) 266,357 272,580
Mopani - 2,396) - 14,130
Mutanda - 2,551) - 8,000
Glencore Technology (4) 332) 3 1,337
Sales to related parties
Glencore International AG(2) (659) 202,750 (26,060) 671,941
Mopani(3) 7,152 - 7,152 -
Mutanda(4) 1,809 (1,063) 24,703 1,950
As at
September 30,
2016
$’000
As at
December 31,
2015
$’000
Amounts owed to related parties
Galif 3,435 2,696
Glencore International AG(5) 4,883,808 4,346,059
Mopani 529 517
Mutanda(6) 17,377 10,333
Glencore Technology - 408
Amounts owed by related parties
Glencore International AG 211 23,730
Mopani 7,152 -
Mutanda(6) 24,844 -
Glencore Technology 5,000 -
(1) Amount includes interest payable under the Amended Loan Facilities and customer prepayments. (2) Amounts included in sales for copper and cobalt and included in operating expenses for 2016 and
cost of sales for 2015 in the Operating Results related to the disposal of property, plant and
equipment. (3) Amounts included in operating expenses for 2016 and cost of sales for 2015 in the statement of
loss related to the sale of mining fleet. (4) Amounts included in operating expenses for 2016 and cost of sales for 2015 in the Operating
Results as these are recoverable charter flight costs which are netted against the underlying
expense as well as sale of warehouse inventory items. (5) Amount includes customer prepayments and Amended Loan Facilities (as well as accrued
interest). (6) Amount represents advanced payments received on the Power Project (refer to item 7), amounts
owing for the purchase of concentrate, processing consumables and medical services and amounts
owed by Mutanda for their purchase of warehouse inventory items.

MANAGEMENT’S DISCUSSION AND ANALYSIS OF FINANCIAL CONDITION AND RESULTS OF OPERATIONS
24
13. Financial Instruments
At September 30, 2016, and December 31, 2015, the Company’s financial instruments consisted of cash
and cash equivalents, receivables, accounts payable and accrued liabilities, bank overdrafts, customer
prepayments, other non-current liabilities and the Amended Loan Facilities. With respect to all of these
financial instruments, the Company estimates that the fair value of these financial instruments approximates
their carrying values at September 30, 2016 and December 31, 2015, respectively.
The Company values instruments carried at fair value using quoted market prices, where available. Quoted
market prices represent a Level 1 valuation. When quoted market prices are not available, the Company
maximizes the use of observable inputs within valuation models. When all significant inputs are
observable, the valuation is classified as Level 2. Valuations that require the significant use of unobservable
inputs are considered Level 3.
The following table outlines financial assets and liabilities measured at fair value in the financial statements
and the level of the inputs used to determine those fair values in the context of the hierarchy as defined
above as at September 30, 2016, and December 31, 2015:
Hierarchy
Level
September 30,
2016
$’000
December 31,
2015
$’000
Cash and cash equivalents 1 2,188) 37,740)
Provisional pricing derivative (1) 2 2) (7)
(1) Open provisionally priced sales which retain an exposure to future changes in commodity prices are
marked-to-market based on the LME forward prices offset by the contractual discount to the LME
price. As such, these embedded derivatives included in receivables are classified within Level 2 of the
fair value hierarchy.
There have been no transfers between Level 1 and 2 in the respective reporting periods. The methods and
valuation techniques used for the purpose of measuring fair value are unchanged compared to the previous
reporting period. Fair values have been determined by reference to quoted prices at the reporting dates.
The risks associated with these financial instruments and the policies on how to mitigate these risks are set
out in item 14.
14. Risk Factors
The risks associated with the financial instruments (set out in item 13) and the policies on how to mitigate
these risks are set out below. Management manages and monitors these exposures to ensure appropriate
measures are implemented on a timely and effective manner. The Company does not enter into or trade
financial instruments including derivative financial instruments, for speculative purposes.
Credit risk
The Company’s credit risk is primarily attributable to other receivables mainly consisting of value added
tax input credits receivable, trade receivables from copper and cobalt sales and short-term deposits. The
value added tax input credits are receivable from the tax authorities in the countries in which the Company
operates and the collection thereof is closely monitored by management. The Company has a concentration
of credit risk with all sales to one customer, which is closely monitored by management. The customer is a
related party of the Company (refer to item 12). The majority of the Company’s cash and cash equivalents
are on deposit with banks or money market participants with a Standard and Poor’s rating of BBB or
greater in line with the Company’s treasury policy.

MANAGEMENT’S DISCUSSION AND ANALYSIS OF FINANCIAL CONDITION AND RESULTS OF OPERATIONS
25
Market risk
(a) Interest rate risk
The Company had cash balances and bank overdrafts, the Amended Loan Facilities and financing received
through customer prepayments as at September 30, 2016, and December 31, 2015. The bank overdrafts
had fixed interest rates of between 7% and 10%. The Amended Loan Facilities have a fixed interest rate of
10% and the financing received through customer prepayments bears interest at an interest rate of 3-month
LIBOR plus 3% fixed on the date of receipt. The Company held no floating rate debt as at September 30,
2016, and December 31, 2015.
(b) Foreign currency risk
The Company’s functional currency is the U.S. dollar. Sales are transacted in U.S. dollars and the majority
of major purchases are transacted in U.S. dollars and South African rand. The Company maintains the
majority of its cash and cash equivalents in U.S. dollars but it does hold balances in South African rand,
Canadian dollars, Swiss franc, Congolese franc and Euros (for future expenditures which will be
denominated in these currencies). The Company has not entered into any derivative instruments to manage
foreign exchange fluctuations; however, management monitors foreign exchange exposure.
The carrying amounts of the Company’s foreign currency denominated monetary assets and monetary
liabilities at the respective dates of the statement of financial position are as follows:
Assets Liabilities
September 30, December 31, September 30, December 31,
As at
2016
$’000
2015
$’000
2016
$’000
2015
$’000
Assets
South African rand 2,069 212 -) -)
British pounds 32 35 36 -) -)
Canadian dollars 38 5 30 -) -)
Swiss franc
23
1 26 24
-) -)
Congolese franc 75 104 26,041 (501) (1,918)
Euros 45 52 255 -) -)
2,490 26,598 (453) (1,918)
A 5% increase or decrease in the U.S. dollar at September 30, 2016, with respect to all of the above
currencies, would result in a movement of the unrealized foreign exchange gain or loss for the period of
approximately $0.1 million (year ended December 31, 2015 – $1.2 million).
Commodity risk
The Company sells copper, cobalt and previously sold copper concentrate at prevailing market prices.
Under certain revenue contracts, final pricing adjustments are made after delivery to customers. The
Company is therefore exposed to changes in commodity prices of copper and cobalt both in respect of
future sales and previous sales which remain open to final pricing.
The Company has not used any commodity price derivatives in this period or the prior period. There is
currently no intention to hedge future copper and cobalt sales.
As at September 30, 2016, the Company had 25 tonnes of copper (December 31, 2015 – no copper) and no
cobalt (December 31, 2015 – 25 tonnes) for which final commodity prices have yet to be determined. These
were valued at September 30, 2016, at a forward commodity price net of contractual discounts of $1,320
per tonne for copper (December 31, 2015 – no copper) (amounts in whole numbers). A 5% increase or
decrease in the forward copper price as at September 30, 2016 would result in a $0.002 million change to
revenue and trade receivables (as at December 31, 2015 – no copper).

MANAGEMENT’S DISCUSSION AND ANALYSIS OF FINANCIAL CONDITION AND RESULTS OF OPERATIONS
26
Liquidity risk
It is anticipated that the Company’s existing cash balances, cash flow from operations, existing credit
facilities and advances from Glencore (refer to item 9) will be sufficient to fund the operations, capital
expenditure, the WOL Project and the Power Project (refer to item 7), for the next twelve months.
Glencore has indicated it will provide or procure the additional funding required while the Company
continues the planned investment in ongoing processing plant upgrades, the waste stripping at the KOV and
Mashamba East Open Pits and any other operating activities during the suspension period. During the year
ended December 31, 2014, the existing Loan Facilities and customer prepayments received up to November
26, 2014 were rolled into new long-term facilities with repayment terms extended to January 1, 2021 (refer
to item 9).
The following table details the Company’s expected remaining contractual maturities for its financial
liabilities at September 30, 2016. The table is based on the undiscounted cash flows of financial liabilities
based on the earliest date on which the Company can be required to satisfy the liabilities.
6 months
or less
6 to 12 1 to 2 Over
months years 2 years Total
As at September 30, 2016 $’000 $’000 $’000 $’000 $’000
Accounts payable and accrued
liabilities 102,006 138,907 - - 240,913
Customer prepayments 1,505,727 - - - 1,505,727
Credit facilities 25,136 - - 25,136
Amended Loan Facilities – related
parties - - - 3,284,739 3,284,739
1,632,869 138,907 - 3,284,739 5,056,515
6 months
or less
6 to 12 1 to 2 Over
months years 2 years Total
As at December 31, 2015 $’000 $’000 $’000 $’000 $’000
Accounts payable and accrued
liabilities 271,788 31,929 - - 303,717
Customer prepayments 1,208,243 - - - 1,208,243
Amended Loan Facilities – related
parties - - - 3,057,760 3,057,760
Current portion of finance lease
liability 705 705 - - 1,410
1,480,736 32,634 - 3,057,760 4,571,130
Other risks
The Company is exposed to other risks during its course of business and these are discussed in detail in the
Company’s Annual Information Form which is available on SEDAR at www.sedar.com and should be
reviewed in conjunction with this document.
The financial information in this Management’s Discussion and Analysis has been prepared using the same
accounting policies and methods of computation as applied in the Company’s 2015 annual audited
consolidated financial statements for the year ended December 31, 2015, which are available on SEDAR at
www.sedar.com, and no updates are required for the key accounting judgments and estimates.

MANAGEMENT’S DISCUSSION AND ANALYSIS OF FINANCIAL CONDITION AND RESULTS OF OPERATIONS
27
15. Health, Safety, Community and Environment
In terms of the health and safety policy, there is explicit recognition of the importance of a safe and healthy
work environment, created as a result of joint responsibility between the Company, its employees and
contracting companies involved in work on the operating site. The Company is fully committed to
continual improvement of its operational conditions and practices. The Company is actively developing
and implementing procedures, conducting training and auditing of protocols across its operation. The
Company has a well-established Emergency Response Team (“ERT”) and a mine rescue team trained to
international standards. Additionally, Katanga has an on-site hospital providing medical and occupational
health services to all employees, contractors and their dependents.
The prevention of fatalities is of utmost importance to the Company. As part of the Glencore “SafeWork”
program, the Company continues to develop and introduce Fatal Hazard Protocols and Life Saving
Behaviours that mandate the processes, conditions and behaviours needed to prevent fatalities. Each
individual employee has provided a commitment to this program. The Company also completed its
comprehensive baseline Health and Safety risk assessment for mining and processing areas in Q4 2014. In
2015, the Company identified the top potentially fatal hazards in each area of the operation and trained its
supervisors to lead SafeWork conversations to ensure our employees perform high risk tasks safely. In Q1
and Q2 2016, KCC continued to focus on implementation of Catastrophic Hazard Management Plans and
achieving Stage 2 of the Fatal Hazard Protocols.
During Q1 2016, regrettably 7 fatalities occurred from a single ground failure event. During 2015, no
fatalities occurred in the operations. There was one lost time injury (LTI) recorded during Q3 2016
compared to one LTI in Q2 2016 and 5 during the whole of 2015. The Q3 2016 rolling LTI frequency rate
based on one million man hours was 0.15 (0.18 during the whole of 2015).
The Company’s environmental practices are modelled after ISO 14000 and continual improvement is a
consistent theme with the Company’s environmental practices. In March 2008, the Company’s consultants
completed a draft Environmental & Social Impact Assessment (“ESIA”) which is supported by a series of
Environmental & Social Management Plans. This ESIA was carried out on a project description that
envisaged a full build-out to increase the production to in excess of 300,000 tonnes per annum of copper
production. Arrangements were subsequently made to review the draft ESIA based on the Accelerated
Development Plan, the 2012 ITR (refer to item 17) and in consideration of DRC legal requirements and to
re-draft an Environmental Impact Study (“EIS”). Public consultation was completed on April 15, 2010.
The EIS was submitted to the DRC authorities for approval in January 2011. Through the Department for
the Protection of Mining Environment, the DRC Ministry of Mines approved the EIS in March 2011 and as
a consequence, the Company has commenced all necessary steps required to comply with its environmental
commitments referenced in the EIS and its Environmental and Social Management Plans.
Under DRC law, Katanga is required to review its approved ESIA every five years and when any
significant changes to its operations occur. Katanga submitted an amended ESIA, including the Updated
Phase 4 Expansion Project, the Phase 5 Expansion Project and the development of T17 Underground Mine
in April 2014. The Company has aligned its security practices with the United Nation’s Voluntary
Principles on Security and Human Rights.

MANAGEMENT’S DISCUSSION AND ANALYSIS OF FINANCIAL CONDITION AND RESULTS OF OPERATIONS
28
Decommissioning and environmental provisions
Decommissioning and environmental provisions arise from the acquisition, development, construction and
normal operation of mining property, plant and equipment due to government controls and regulations that
protect the environment on the closure and reclamation of mining properties.
The decommissioning and environmental provisions are calculated at the net present value of estimated
future cash flows of the reclamation and closure costs which total $102.4 million (December 31, 2015 –
$102.4 million) (undiscounted) and are required to satisfy the obligations until 2034 (December 31, 2015 –
until 2034). A risk-adjusted discount rate of 10.70% was applied to the expected future cash flows to
determine the carrying value of the provisions (December 31, 2015 – 11.25% discount rate).
The following table details the items that affect the decommissioning and environmental provisions:
As at
September 30,
2016
$’000
As at
December 31,
2015
$’000
Provisions, beginning of the period 12,445) )) 24,518) ))
Accretion 1,109) ) 2,025) )
Charged to cost of sales -)) ) 68)) )
Charged to operating expenses 42 -
Revision to estimate 1,091((2) (14,166) (1)
Provisions, end of the period 14,688)) ) 12,445) ))
(1) As at January 1, 2015, the Company reassessed its estimate regarding the expected closure date of the
mining properties from 2030 to 2031. This resulted in a $2.5 million decrease in the provisions and
corresponding decrease to property, plant and equipment.
As at June 30, 2015, the Company reassessed its estimate regarding the total reclamation and closure
costs from $138.5 million to $102.4 million and the expected closure date of the mining properties
from 2031 to 2034. This resulted in an $11.1 million decrease in the provisions and a corresponding
decrease in property, plant and equipment.
As at September 30, 2015, the Company reassessed its risk-adjusted discount rate due to changes in the
Company’s weighted average cost of capital. This resulted in a $0.5 million decrease in the provisions
and corresponding decrease in property, plant and equipment. (2) As at September 30, 2016, the Company reassessed its risk-adjusted discount rate due to changes in the
Company’s weighted average cost of capital. This resulted in a $1.1 million increase in the provisions
and a corresponding increase in property, plant and equipment.
16. Joint Venture Agreement
The amended JVA was entered into with Gécamines on July 25, 2009, and all provisions remain consistent
with those described in the Company's Annual Information Form for the year ended December 31, 2015,
dated March 30, 2016, which is available under the Company’s profile on SEDAR at www.sedar.com.
17. Technical Report
The Company filed its technical report entitled “An Independent Technical Report on the Material Assets
of Katanga Mining Limited, Katanga Province, Democratic Republic of Congo” (“2012 ITR”) on SEDAR
(at www.sedar.com under Katanga's profile) on March 30, 2012. The 2012 ITR covers the mineral reserves
and mineral resources (as defined by National Instrument 43-101 of the Canadian Securities Regulators)
and operations of the Company’s operating subsidiary in the DRC, KCC.

MANAGEMENT’S DISCUSSION AND ANALYSIS OF FINANCIAL CONDITION AND RESULTS OF OPERATIONS
29
18. Disclosure Controls, Procedures and Internal Control over Financial Reporting
Disclosure control and procedures have been designed to ensure that information required to be disclosed
by the Company is accumulated and communicated to the Company’s management as appropriate to allow
timely decisions regarding required disclosure.
The Company’s Chief Executive Officer (“CEO”) and Chief Financial Officer (“CFO”) are responsible for
establishing and maintaining disclosure controls and procedures (“DC&P”) and internal controls over
financial reporting (“ICFR”), as those terms are defined in National Instrument 52-109 Certification of
Disclosure in Issuers’ Annual and Interim Filings, for the Company.
The CEO and CFO have concluded that, as at September 30, 2016, the Company’s DC&P have been
designed and operate effectively to provide reasonable assurance that (a) material information relating to
the Company is made known to them by others, particularly during the period in which the annual filings
are being prepared; and (b) information required to be disclosed by the Company in its annual filings,
interim filings or other reports filed or submitted by the Company under securities legislation is recorded,
processed, summarized and reported within the time periods specified in securities legislation. They have
also concluded that the Company’s ICFR have been designed and operate effectively to provide reasonable
assurance regarding the reliability of the preparation and presentation of the financial statements for
external purposes and were effective as at September 30, 2016.
It should be noted that while the Company’s CEO and CFO believe that the Company’s disclosure controls
and procedures provide a reasonable level of assurance that they are effective, they do not expect that the
disclosure controls will prevent all errors and fraud. A control system, no matter how well conceived or
operated, can only provide reasonable, not absolute, assurance that the objectives of the control system are
met.
Internal controls over financial reporting are designed to provide reasonable assurance regarding the
reliability of financial reporting and the preparation of the consolidated financial statements for external
reporting purposes in line with IFRS. Management is responsible for establishing and maintaining
adequate internal controls over financial reporting appropriate to the nature and size of the Company.
However, any system of internal control over financial reporting has inherent limitations and can only
provide reasonable assurance with respect to financial statement preparation and presentation.
The Company uses the Committee of Sponsoring Organizations of the Treadway Commission control
framework (2013). There were no changes to the Company’s internal controls over financial reporting that
occurred during the period ended September 30, 2016, that materially affected, or are reasonably likely to
affect, the Company’s internal controls over financial reporting.

MANAGEMENT’S DISCUSSION AND ANALYSIS OF FINANCIAL CONDITION AND RESULTS OF OPERATIONS
30
19. Forward Looking Statements
Management’s discussion and analysis may contain forward-looking statements, including, but not limited
to statements relating to, the suspension of copper and cobalt processing, investigations into and
remediation efforts related to the March 2016 geotechnical failure at KOV Open Pit, the impact of newly
acquired or commissioned equipment on operations, the improvements related to the WOL Project, the
impact of the shift in focus towards waste mining during the suspension of production, the expectation of
resumption of production and the impact of the timing thereof, initiatives to be undertaken during the
suspension of production and the overall expected improvement of recoveries and grades. Often, but not
always, forward-looking statements can be identified by the use of words such as "plans", "expects" or
"does not expect", "is expected", "budget", "scheduled", "estimates", "forecasts", "intends", "anticipates" or
"does not anticipate", or "believes", or describes a "goal", or variation of such words and phrases or state
that certain actions, events or results "may", "could", "would", "might" or "will" be taken, occur or be
achieved.
All forward-looking statements reflect the Company’s beliefs and assumptions based on information
available at the time the statements were made. Actual results or events may differ from those predicted in
these forward-looking statements. All of the Company’s forward-looking statements are qualified by the
assumptions that are stated or inherent in such forward-looking statements, including the assumptions listed
below. Although the Company believes that these assumptions are reasonable, this list is not exhaustive of
factors that may affect any of the forward-looking statements. The key assumptions that have been made in
connection with the forward-looking statements include the following: the operations of the Company
during the production suspension and timeline for the recommencement of operations remaining consistent
with management’s expectations, there being no significant disruptions affecting the operations of the
Company whether due to labour disruptions, supply disruptions, power disruptions, rollout of new
equipment, damage to equipment or otherwise; permitting, development, operations, expansion and
acquisitions at the Project being consistent with the Company's current expectations; continued recognition
of the Company’s mining concessions and other assets, rights, titles and interests in the DRC; political and
legal developments in the DRC being consistent with its current expectations; the continued provision or
procurement of additional funding from Glencore for operations, the completion of the T17 Underground
Mine, the WOL Project and the Power Project; the successful completion of, and realizing the intended
benefits from the WOL Project and the Power Project; new equipment performs to expectations; the
successful development of the T17 Underground Mine; the exchange rate between the US dollar, South
African rand, British pounds, Canadian dollar, Swiss franc, Congolese franc and Euro being approximately
consistent with current levels; certain price assumptions for copper and cobalt; prices for diesel, natural gas,
fuel oil, electricity and other key supplies being approximately consistent with current levels; production,
operating expenses and cost of sales forecasts for the Company meeting expectations; the accuracy of the
current ore reserve and mineral resource estimates of the Company (including but not limited to ore
tonnage and ore grade estimates); and labour and material costs increasing on a basis consistent with the
Company's current expectations.
Forward-looking statements involve known and unknown risks, future events, conditions, uncertainties and
other factors which may cause the actual results, performance or achievements to be materially different
from any future results, prediction, projection, forecast, performance or achievements expressed or implied
by the forward-looking statements. Such factors include, among others, the unforeseen delays or changes to
the WOL Project; actual results of current exploration activities; actual results and interpretation of current
reclamation activities; conclusions of economic evaluations; changes in project parameters as plans
continue to be refined; future prices of copper and cobalt; possible variations in ore grade or recovery rates;
failure of plant, equipment or processes to operate as anticipated; accidents, labour disputes and other risks
of the mining industry; delays in obtaining governmental approvals or financing or in the completion of
exploration, development or construction activities, delays due to strikes or other work stoppage, both
internal and external to the Company as well as those factors disclosed in the Company's current annual
information form and other publicly filed documents. Although Katanga has attempted to identify
important factors that could cause actual actions, events or results to differ materially from those described
in forward-looking statements, there may be other factors that cause actions, events or results not to be as
anticipated, estimated or intended. There can be no assurance that forward-looking statements will prove to
be accurate, as actual results and future events could differ materially from those anticipated in such
statements. Accordingly, readers should not place undue reliance on forward-looking statements.

MANAGEMENT’S DISCUSSION AND ANALYSIS OF FINANCIAL CONDITION AND RESULTS OF OPERATIONS
31
The Company disclaims any intention or obligation to update or revise any forward-looking statements
whether as a result of new information, future events, or otherwise, except in accordance with applicable
securities laws.
20. Qualified Person
Tim Henderson, a Director and Technical Consultant to the Company, is the ‘Qualified Person’, as defined
in National Instrument 43-101, who approved the scientific and technical disclosure in this Management’s
Discussion and Analysis.
21. Non-IFRS Measures
The Company has included three non-IFRS performance measures:
1. EBITDA (earnings before interest, tax, depreciation and amortization); and
2. C1 cash costs.
The Company believes that, in addition to conventional measures prepared in accordance with IFRS, these
measures provide useful information to both management and investors to evaluate the Company’s
performance and ability to generate cash flow. Accordingly, it is intended to provide additional
information and should not be considered in isolation or as a substitute for measures of performance
prepared in accordance with IFRS. These measures do not have a standardized meaning prescribed by
IFRS and therefore may not be comparable to similarly titled measures presented by other publicly traded
companies and should not be construed as an alternative to other financial measures determined in
accordance with IFRS.
1. EBITDA has been calculated as:
Three months ended Nine months ended
Sep 30, Jun 30, Sep 30, Sep 30,
2016 2016 2015 2016 2015
Sales $'000 (1,632) (615) 202,006 (30,130) 671,198
Cost of sales $'000 - - (363,818) - (1,033,872)
Operating expenses $'000 (59,947) (49,154) - (172,795) -
General and administrative expense $'000 (932) (83) (533) (1,723) (1,353)
Release of SX/EW provision $'000 - - - - -
Restructuring expense $'000 - - (23,974) (3,065) (23,974)
Foreign exchange gain (loss) $'000 382 127 (1,499) 1,615 7,979
Exclude: Depreciation $'000 6,915 6,806 54,656 21,425 172,463
EBITDA $'000 (55,214) (42,919) (133,162) (184,673) (207,559)

MANAGEMENT’S DISCUSSION AND ANALYSIS OF FINANCIAL CONDITION AND RESULTS OF OPERATIONS
32
2. C1 cash costs are the operational costs of production per unit of output. Due to the suspension of
production C1 cash costs are not calculated for the applicable periods. The following is included
in the calculation of C1 cash costs:
Three months ended Nine months ended
Sep 30, Jun 30, Sep 30, Sep 30,
2016 2016 2015 2016 2015
Cobalt sales $'000 - - 24,865 - 70,033
Cost of sales $'000 - - (363,818) - (1,033,872)
General and administrative expense $'000 - -
(533) -
(1,353)
Exclude: - - -
- Change in product inventory $'000 - - (9,044) - 44,532
- Depreciation (C2 cost) $'000 - - 54,656 - 172,463
- Loss on disposal of property, plant
and equipment (C3 cost) $'000
- -
(511)
-
(468)
- Decommissioning and
environmental provisions accretion
(C3 cost) $'000
- -
384
-
1,711
Total C1 costs $'000 - - (294,001) - (746,954)