KARL KAUPMEES Acidity and basicity in non-aqueous media ...
75
KARL KAUPMEES Acidity and basicity in non-aqueous media: importance of solvent properties and purity DISSERTATIONES CHIMICAE UNIVERSITATIS TARTUENSIS 141
-
Upload
trinhkhuong -
Category
Documents
-
view
215 -
download
0
Transcript of KARL KAUPMEES Acidity and basicity in non-aqueous media ...
KA
RL
KA
UP
ME
ES
A
cidity and basicity in non-aqueous media: im
portance of solvent properties and purity
Tartu 2014
ISSN 1406–0299ISBN 978-9949-32-635-8
KARL KAUPMEES
Acidity and basicity in non-aqueous media: importance of solvent properties and purity
DISSERTATIONES CHIMICAE
UNIVERSITATIS TARTUENSIS
141

DISSERTATIONES CHIMICAE UNIVERSITATIS TARTUENSIS 141
DISSERTATIONES CHIMICAE UNIVERSITATIS TARTUENSIS 141
KARL KAUPMEES
Acidity and basicity in non-aqueous media: importance of solvent properties and purity

Institute of Chemistry, Faculty of Science and Technology, University of Tartu. Dissertation is accepted for the commencement of the Degree of Doctor philo-sophiae in Chemistry on June 17, 2014 by the Doctoral Committee of the Institute of Chemistry, University of Tartu. Supervisor: Professor Ivo Leito (PhD) Senior research fellow Ivari Kaljurand (PhD) Institute of Chemistry, University of Tartu, Estonia
Commencement: August 29, 2014 at 12:00, Ravila 14a, room 1021 This work has been partially supported by Graduate School “Functional materials and technologies” receiving funding from the European Social Fund under project 1.2.0401.09-0079 in University of Tartu, Estonia.
Publication of this dissertation is granted by University of Tartu ISSN 1406-0299 ISBN 978-9949-32-635-8 (print) ISBN 978-9949-32-636-5 (pdf) Copyright: Karl Kaupmees, 2014 University of Tartu Press www.tyk.ee
Opponent: Prof. José Luis Abboud Mas (D.Sc.) Retired professor, Instituto de Química Física “Rocasolano”,
CSIC, Madrid, Spain
5
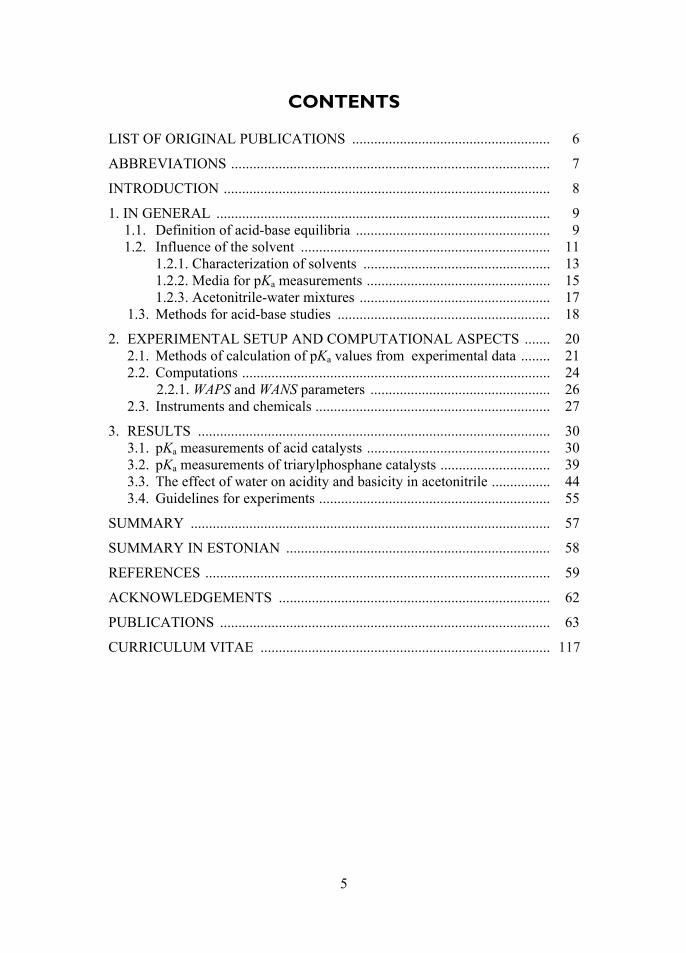
CONTENTS
LIST OF ORIGINAL PUBLICATIONS ...................................................... 6
ABBREVIATIONS ....................................................................................... 7
INTRODUCTION ......................................................................................... 8
1. IN GENERAL ........................................................................................... 9 1.1. Definition of acid-base equilibria ..................................................... 9 1.2. Influence of the solvent .................................................................... 11
1.2.1. Characterization of solvents ................................................... 13 1.2.2. Media for pKa measurements .................................................. 15 1.2.3. Acetonitrile-water mixtures .................................................... 17
1.3. Methods for acid-base studies .......................................................... 18
2. EXPERIMENTAL SETUP AND COMPUTATIONAL ASPECTS ....... 20 2.1. Methods of calculation of pKa values from experimental data ........ 21 2.2. Computations .................................................................................... 24 2.2.1. WAPS and WANS parameters ................................................. 26 2.3. Instruments and chemicals ................................................................ 27
3. RESULTS ................................................................................................ 30 3.1. pKa measurements of acid catalysts .................................................. 30 3.2. pKa measurements of triarylphosphane catalysts .............................. 39 3.3. The effect of water on acidity and basicity in acetonitrile ................ 44 3.4. Guidelines for experiments ............................................................... 55
SUMMARY .................................................................................................. 57
SUMMARY IN ESTONIAN ........................................................................ 58
REFERENCES .............................................................................................. 59
ACKNOWLEDGEMENTS .......................................................................... 62
PUBLICATIONS .......................................................................................... 63
CURRICULUM VITAE ............................................................................... 7
11
6
LIST OF ORIGINAL PUBLICATIONS
This thesis consists of five papers and the present review that is written based on the mentioned papers and uses some segments from the corresponding publications.
I. Kaupmees, K.; Kaljurand, I.; Leito, I. Influence of water content on the acidities in acetonitrile. Quantifying charge delocalization in anions. J. Phys. Chem. A, 2010, 114, 11788–11793.
II. Greb, L.; Tussing, S.; Schirmer, B.; Oña-Burgos, P.; Kaupmees, K.; Lõkov, M.; Leito, I.; Grimme, S.; Paradies, J. Electronic effects of triarylphosphines in metal-free hydrogen activation: a kinetic and computational study. Chem. Sci., 2013, 4, 2788–2796.
III. Kaupmees, K.; Tolstoluzhsky, N.; Raja, S.; Rueping, M.; Leito, I. On the Acidity and Reactivity of Highly Effective Chiral Brønsted Acid Catalysts: Establishment of an Acidity Scale. Angew. Chem. Int. Ed., 2013, 52, 11569–11572.
IV. Kaupmees, K.; Kaljurand, I.; Leito, I. Influence of water content on the basicities in acetonitrile. J. Sol. Chem., 2014, Accepted for Publication.
V. Raamat, E.; Kaupmees, K.; Ovsjannikov, G.; Trummal, A.; Kütt, A.; Saame, J.; Koppel, I.; Kaljurand, I.; Lipping, L.; Rodima, T.; Pihl, V.; Koppel, I. A.; Leito, I. Acidities of strong neutral Brønsted acids in different media. J. Phys. Org. Chem., 2013, 26, 162–170.
Authors contribution
Paper I. Performed all experiments and computations. Main person responsible for planning and writing the manuscript.
Paper II. Planned all of the pKa measurements and performed large part of them. Main person responsible for writing the part of the manu-script concerning the pKa measurements.
Paper III. Performed all pKa measurements. Main person responsible for planning and writing the manuscript.
Paper IV. Performed all experiments and computations. Main person respon-sible for planning and writing the manuscript.
Paper V. Performed some of the theoretical calculations. Contributed to the writing of the text.
7
ABBREVIATIONS
A Basic form of a compoundAλ Absorbance AN Acceptor numberα Empirical parameter for solvent HBA acidityBPA BINOL-derived phosphoric acid diesterβ Empirical parameter for solvent HBA basicityCOSMO-RS Conductor-like Screening Model for Real SolventsDCE 1,2-dichloroethanedma N,N-dimethylamino groupDMSO Dimethyl sulfoxideDN Donor numberEPA Electron pair acceptorEPD Electron pair donorεr Relative permittivityελ Molar absorbance coefficientG Gibbs free energyHA Acidic form of a compoundHBA Hydrogen bond acceptorHBD Hydrogen bond donorJINGLE Imides of sulfonic acidK Equilibrium constantλ Wavelength MeCN Acetonitrile NTPA Mixed imide of phosphoric and trifluoromethanesulphonic acid pKa Negative logarithm of ionization constantpKip Negative logarithm of ion-pair ionization constantpyrr N-pyrrolidino groupS Solvent ()S Solvent shellz Charge of the speciesTfOH Trifluoromethanesulfonic acidTMG N,N,N',N'-tetramethylguanidine groupWANS Weighted Average Negative SigmaWAPS Weighted Average Positive Sigma
8
INTRODUCTION
Acidic and basic properties of compounds can influence processes in nearly all fields of chemistry and related sciences: from organic synthesis to chromato-graphic analysis, from biology to geology. The variety of environments for those applications is wide, from the classical aqueous solution to different non-aqueous solvents, the mixtures of solvents or even ionic liquids. In order to take into account the effects related to acidity and basicity, these properties must be reliably determined. Alongside the quantification of acid-base properties, possible environmental effects influencing these properties should also be accounted for.
This work examines the importance of solvent properties and purity on acid-base behavior on the example of several case studies. The importance of solvent’s moisture content is specifically addressed on the example of aceto-nitrile. It is demonstrated that choosing suitable solvent is very important for acid-base studies and in certain cases the content of water – the most important impurity in solvents – can be critically important. In addition to quantifying the effect of water in solvent at low concentrations, suggestions concerning the experimental setup of pKa measurements are given for minimizing its effect.
The behavior of several catalytic systems is rationalized on the basis of acid-base properties of the participating compounds. It is demonstrated that know-ledge of acid-base properties of the molecules and ions participating in a catalytic process is essential for rationalizing the process. The carefully per-formed experiments reveal errors in literature pKa values. Their origin is pointed out with additional experiments and the importance of knowledge of the usability limits of solvents is emphasized.
During the studies a gap was found in the selection of possible parameters for charge delocalization in ions. In order to rationalize the results and aid the interpretation two new parameters Weighted Average Positive Sigma (WAPS) for anions and Weighted Average Negative Sigma (WANS) for cations are proposed for that purpose. They seem to describe the charge delocalization well and in accordance with the chemical intuition.
9
1. IN GENERAL
1.1. Definition of acid-base equilibria
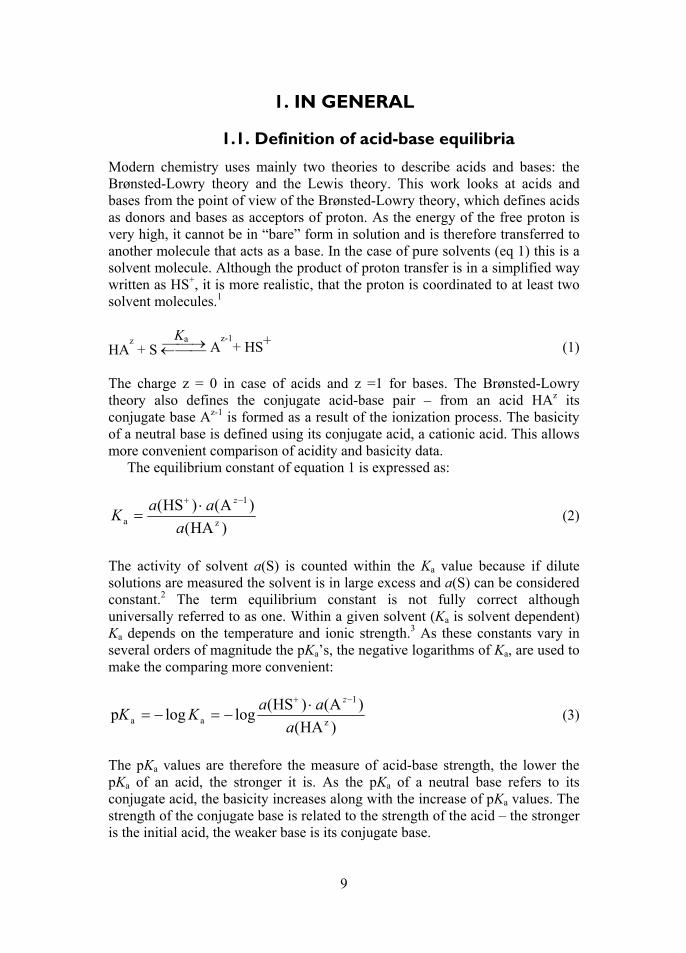
Modern chemistry uses mainly two theories to describe acids and bases: the Brønsted-Lowry theory and the Lewis theory. This work looks at acids and bases from the point of view of the Brønsted-Lowry theory, which defines acids as donors and bases as acceptors of proton. As the energy of the free proton is very high, it cannot be in “bare” form in solution and is therefore transferred to another molecule that acts as a base. In the case of pure solvents (eq 1) this is a solvent molecule. Although the product of proton transfer is in a simplified way written as HS+, it is more realistic, that the proton is coordinated to at least two solvent molecules.1
HAz + S Ka
Az-1
+ HS+ (1) The charge z = 0 in case of acids and z =1 for bases. The Brønsted-Lowry theory also defines the conjugate acid-base pair – from an acid HAz its conjugate base Az-1 is formed as a result of the ionization process. The basicity of a neutral base is defined using its conjugate acid, a cationic acid. This allows more convenient comparison of acidity and basicity data.
The equilibrium constant of equation 1 is expressed as:
)HA(
)A()HS(z
1
a a
aaK
z (2)
The activity of solvent a(S) is counted within the Ka value because if dilute solutions are measured the solvent is in large excess and a(S) can be considered constant.2 The term equilibrium constant is not fully correct although universally referred to as one. Within a given solvent (Ka is solvent dependent) Ka depends on the temperature and ionic strength.3 As these constants vary in several orders of magnitude the pKa’s, the negative logarithms of Ka, are used to make the comparing more convenient:
)HA(
)A()HS(loglogp
z
1
aaa
aaKK
z (3)
The pKa values are therefore the measure of acid-base strength, the lower the pKa of an acid, the stronger it is. As the pKa of a neutral base refers to its conjugate acid, the basicity increases along with the increase of pKa values. The strength of the conjugate base is related to the strength of the acid – the stronger is the initial acid, the weaker base is its conjugate base.

10
Measuring the pKa according to equation 3 is straightforward only in water (and few more solvents, such as methanol and ethanol), as the activity of H+ can be easily measured using a pH electrode. In non-aqueous media problems with electrode calibration and stabilization arise, making experiment difficult and unreliable unless very large efforts are made.4 To eliminate the need for knowing the activity of hydrogen ion in a given solvent relative acidities of two acids or bases can be determined:
HA1z+ A2
z-1- K A1
z-1 + HA2z (4)
)A()HA(
)HA()A(log)HA(p)HA(pplog
121
21
112
zz
zz
aaa aa
aaKKKK (5)
If the measurements are carried out in dilute solutions, it can be assumed that the ratio of activity coefficients for neutral and ionic species is the same for both compounds.5 This enables using equilibrium concentrations instead of activities:
1
21
21
1z1
z2 AHA
HAAlog)HA(p)HA(pplog
zz
zz
aaa KKKK (6)
This approach avoids the need for measuring solution’s pH, but brings in another limitation – as the ratios of equilibrium concentrations have to be known exactly, both species must be present in a quantity detectable with acceptable uncertainty. This means that the difference of pKa values of the studied compounds must not exceed 2.5 units.
If ion pair acidities/basicities are studied, then the equilibrium between two compounds is:
HA1z + [HB
+ A2
z-1 ] ip [HB
+ A1
z-1] + HA2
z (7)
]A[HB ][HA
][HA ]A[HBlogp
121
21
1ip
zz
zz
K
(8)
Where HB+ indicates a protonated base. As this methodology only describes the ionization part of the full reaction associated with acidity/basicity (equation 9) the dissociation segment (Kd = K3·K4) must be determined by another mea-surement or by estimating if ∆pKa values are desired.6
11
1.2. Influence of the solvent
In order to influence the acid-base equilibria, a compound must first dissolve in the solvent. From that point on solvent affects several processes: dissociation, aggregation etc.
From equation 1 it can be seen that in condensed media solvent takes part in the ionization as a base or as an acid, meaning that both acidity and basicity of the solvent itself are relevant when interpreting these ionization reactions. The more detailed description of acidity and basicity of different solvents is given in future sections. One should also note that the reactions describing acidity and basicity are somewhat different. In case of acidity a cation and an anion are formed from a neutral molecule – charged species are created in the solution. In the case of basicity no charged species are created nor destroyed.
Equation 1 presents a very simplified view of the proton transfer reaction and reflects the situation only in polar solvents (and at low concentrations). In more detailed terms the transfer of proton from one species to another can be broken down into four steps2:
(HAz)S + (:B)S K1 (AHz···:B)S K2
(A:z-1···HB+)S or
(A: z-1HB+)S K3 (A: z-1||HB+)S
K4 (A:¯)S + (HB+)S (9)
B indicates a base, in case of simple ionization reaction in solvent S, a solvent molecule is considered as a base. K1 describes the formation of a hydrogen bonded complex. K2 describes the transfer of proton, resulting in hydrogen bonded complex of ionized species or an ion pair. In the third step, charac-terized by K3, solvent molecules come between the ionized species producing a solvent separated ion pair. In the final, forth step, full dissociation of the ion pair occurs. The overall product of the equilibrium constants of individual steps is the Ka
Ka = K1·K2·K3·K4 (10) The value of K2 is defined first of all by the acid and base strengths of HAz and B. The values of K3 or K4 are determined by the properties of the ions (their size and extent of charge delocalization) as well as the properties of the solvent. K3
depends first of all on the ability of the solvent to (specifically) solvate the ionized species. K4 correlates well with the solvent polarity (in terms of dielectric constant): the lower the polarity, the lower also the dissociation to free solvated ions.
If the solvating power of the solvent is low and the ionized species are quite small and therefore the charge is not well delocalized or hidden, side reactions may occur. These side reactions involve association processes to aid the charge
12
delocalization and can be divided into three: homoassociation, heteroassociation and selfassociation.2 As solvents have different abilities to solvate anions and cations, association processes may be favored for one charge type. In the case of acetonitrile, the main solvent used in this work, the anions of Brønsted acids tend to homo- and heteroassociate more than the protonated forms of Brønsted bases.7
Homoassociation occurs when neutral and ionic species of the same substance form a complex:
1z1A + z
1HA Khomo z1
1z1 HAA
(11) If the species forming a complex are from different substances the process is called heteroassociation
1z1A + z
2HA Khetero z2
1z1 HAA
(12)
Formation of a complex can also occur when both species are neutrals of the same substance. This is selfassociation:
z1HA + z
1HA Kself z1
z1 HAHA (13)
All of these association processes can be characterized by equilibrium constants and must be either avoided or taken into account when determining pKa values. Aggregation processes can also involve more than two molecules, depending on the nature of the solvent, solutes and their concentrations. To suppress the formation of aggregates, measurements in dilute solutions are recommended.
Along with the mentioned conjugation processes ion pairing is also con-sidered as a side process. In equation 9 ion pairing was discussed as a result of incomplete dissociation. This is the case for acids, where cations and anions are formed that are strongly attracted to each other, either electrostatically or via hydrogen bond. Ion pairs can also be, and usually are, formed between solutes of different origin. During experiments this is mainly caused by different titrants introduced in the solution in order to change the equilibrium of the conjugate acid-base pair.6
If a mixed solvent is used then its composition can also be a major factor influencing the equilibrium. Although the solvent mixture might be homo-geneous in the macroscopic scale, the composition of the solvent shell is usually not.2,8 If the solvent shell differs in composition from the bulk solvent mixture two distinct possibilities arise. (1) If the solvent shell contains molecules of all solvents, but not in the same mole ratio as the bulk mixture it is called preferential solvation. (2) If the preference of one solvent component proceeds
13
to extremity and the solvent shell is composed by the molecules of only one solvent component the solvation is selective.
The properties of solutes in condensed media are the combination of the intrinsic properties of the solute molecule and the supportive effect of the solvent molecules, more precisely the molecules in close proximity, in the solvent shell of the solute. If the solvent shell is changed, the observed physicochemical properties of the solute in a given media may also change depending on the gain in the solvation energy. Therefore significant changes in physicochemical properties can be observed if the additive, that is capable of selectively or even preferentially solvating the solute molecules, is present even in small quantities.
Although solvents are often referred to as pure, they contain almost always impurities, making them mixed solvents. If the concentration of impurities is very low and do not influence the properties of solvents to observable amount, referring to them as pure is justified.
1.2.1. Characterization of solvents
Before discussing different solvents for studies of acid-base equilibria, one should be acquainted with parameters describing them. Depending on the method used, several physical and chemical characteristics should be considered. Among the most common are boiling point, transparency, stability against both the environment (oxygen) and studied compounds, viscosity, hygroscopicity etc. In order to describe the interactions between solvent and solute molecules three groups of properties should be considered: polarity, polarizability and acidity/basicity.2
One of the first characteristics of solvents taught to young chemists is the polar-apolar scale, „like dissolves like“. Although polarity is perhaps the most important property of a solvent and seems to be easily understandable at first sight, chemists have still not agreed upon a definition to date. Reichardt for instance defines polarity as the sum of all molecular properties responsible for all the interaction forces between the solvent and the solute molecules.2 Just like with definitions, there is no single good parameter available for quantifying solvent polarity. If solvents are looked at as a bulk, the relative permittivity εr is often used. Relative permittivity of a solvent describes its ability to reduce the Coloumbic forces between charged particles in a solution by changing the orientation of dipoles of its molecules. Based on the εr values the polar-apolar scale can be quantitatively divided – solvents with εr above 40 are considered polar, the ones with εr<20 are apolar or even inert if εr approaches 1, if 20<εr<40 a solvent is of medium polarity.
If the close proximity of solute molecule is considered, the relative permittivity of the solvent no longer serves as an adequate measure of polarity because solvent molecules are not as free to orient themselves in the solvation shell. Several empiric parameters have been proposed to describe this other side of polarity that measure a solvent dependent parameter in a previously defined
14
standard system. Probably the most known is the ET30, that measures polarity based on the spectral shifts of a molecular probe between solvents.2
Dispersion interactions are the main contributors to solvation energy, especially in the case of neutral molecules. Dispersion interactions arise from the correlated fluctuations in the electron clouds of two neighboring molecules. The ease, by which the electron cloud can be distorted from its normal shape, is different for every substance. This dependence is named polarizability and is measured by refractive index. The higher the polarizability of a molecule, the easier it is to deform its electron cloud and the higher is the possibility for favorable interactions. Solvents with high polarizability tend to be good solvators for species with high polarizability, like anions and molecules with large conjugated π electron systems.
The acid-base properties of solvents can be looked at several angles. The autoprotolysis constant (Kauto) combines both the acidic (14) and basic (15) properties of a solvent.
HS S- + H+ (14)
HS + H+ H2S
+ (15)
HS + S Kauto S
- + H2S+ (16)
Kauto = a(S-)·a(H2S
+) (17) As the solvents are very different in respect to one another, the pKauto values are used. In a solvent HS the strongest acid is H2S
+ and the strongest base S-, all acids stronger than H2S
+ are levelled at the strength of H2S+ and are fully
deprotonated, the analogy goes also for bases – bases stronger than S- are levelled at its strength and are fully protonated. The range of pKa values measurable in a solvent is therefore limited by the autoprotolysis constant. The larger is the pKauto, the wider is the span of acidities/basicities realizable in a given solvent. The pKauto of water is 14, meaning that as a broad generalization acidities and basicities in water can be measured between pKa values of 0 and 14 with conventional methods.
Depending on whether a solvent molecule has acidic hydrogen atoms or not, solvents can be classified as protic or aprotic. If a solvent molecule has both significant acidic and basic properties (reactions 14 and 15 can be experi-mentally observed) then the solvent is called amphiprotic. If a solvent has high pKauto, it is a differentiating solvent, which is a desirable quality in acid-base studies. For many solvents one property (acidic or basic) dominates over the other. For example MeCN is more basic than acidic. If a solvent is acidic and lacks of basic character, it is protogenic, and a solvent with basic properties, but negligible acidic properties can be referred to as a protophilic solvent. One should already realize that protogenic solvents are levelling for strong bases and
15
are therefore usually used for the studies of acids with strong or moderate strength and weak bases. Protophilic solvents on the other hand are suitable for studies of strong and medium strength bases as well as weak acids.
Acidity and basicity of a solvent are strongly correlated to hydrogen bond donating (HBD) and accepting (HBA) ability, respectively, as the formation of a hydrogen bond is the first step in equation 9. The HBD and HBA are very important concerning the specific solvation via hydrogen bonds – HBD solvents tend to solvate anions very well, whereas HBA solvents solvate cations very well. There are several parameters for quantitatively describing HBD and HBA.2 The most often used are the α and β scales, respectively, proposed by Kamlet, Abboud and Taft.9
Specific solvation does not only include the interaction via hydrogen bonding but also via electron pair donor (EPD) – electron pair acceptor (EPA) interaction. EPD and EPA describe the Lewis basicity and acidity of the solvent, determining its ionizing power. The higher the ability to donate or accept electron pairs, the more easily ions are formed from neutral molecules. EPD and EPA are usually described by donor (DN) and acceptor (AN) numbers by Gutmann and coworkers.10,11
1.2.2. Media for pKa measurements
The acid-base properties of a molecule in the condensed phase are influenced by two distinct set of factors: the molecular structure of the compound and the properties of the medium (solvent). The molecular structure determines the intrinsic acidity or basicity and can be studied either experimentally in the gas phase or computationally. The solvent properties modify the intrinsic acidity and basicity significantly. Acetic acid, for example, is a very weak acid in the gas phase (341.1 kcal mol-1)12 compared to picric acid (299.0 kcal mol-1, from Publication V): the difference is around 30 orders of magnitude. In water the pKa values of these acids are much closer: 4.7613 and 0.4013, respectively, differing by slightly more than 4 orders of magnitude. The pKa measurements in condensed media are carried out, because most of the “practical chemistry” takes place in solutions and the computational approaches of pKa determination are still very much less accurate than experiments. The acidity-basicity data in different solvents, as well as in the gas phase, complement each other.
If one should list the characteristics of an ideal solvent for pKa studies, the list should contain the following: sufficiently polar to aid the dissociation into free ions; very high autoprotolysis constant, low basicity and acidity; trans-parent to widen the choice of analytical methods; easy to purify; stable towards strong acids and strong bases; not very viscous. Unfortunately there is no ideal solvent and different solvents have to be used. To combine aspects of different solvents, sometimes mixtures of multiple solvents are used.
In the present work three solvents are used: Acetonitrile (MeCN) is considered to be a rather polar (εr = 35.94)2 aprotonic
solvent, meaning it dissolves reasonably well both polar and apolar compounds
16
and enables dissociation of ion pairs into free ions after ionization, so that pKa values corresponding to eq 1 can be studied. MeCN is a weak HBD and EPD (DN = 14.110 β=0.3114) and moderate HBA and EPA (AN = 18.92; α=0.1914). It can specifically solvate cations to some extent, but the solvation of anions is limited to van der Waals interactions – first of all dispersion forces and ion-dipole interactions.2 That results in the formation of homo- and heteroassociates in the case of acids having small molecular size and with localized charge in their anions.15 The differentiating ability (pKauto = 33.3-44)16,17 is quite good enabling measurements in a wide range of pKa values. MeCN is suitable for measurements of both acids and bases: acids of medium and high strength, bases with medium and low strength. In the superbasic region (pKa’s over 32) it starts to oligomerize (which partly explains the very huge uncertainty of its autoprotolysis constant) and the basicity of its molecule hinders its use in the superacidic region, so that the pKa values of e.g. CF3SO2OH and perfluorinated sulfonyl imides are not measurable in MeCN.
1,2-dichloroethane (DCE) is a non-polar (εr =10.36)2 solvent, meaning that only ion-pair acidities can be measured experimentally. Its autoprotolysis constant is very high and quantitatively unknown because no detectable ionization can be observed (any ionization detected is caused by impurities). Thus, theoretically DCE enables measurements of pKa values in a very wide range. Both HBD and HBA capabilities of DCE are very low (α=0.00 β=0.00).14 Its Lewis acidity is low (AN=16.72) and Lewis basicity non-existent (DN=0 by definition10). DCE has been used due to these properties for acidity mea-surements of superacidic compounds6 and is used to measure the pKa values of very weak bases in this work.
Dimethyl sulfoxide (DMSO) is a highly polar (εr =46.45)2 solvent with pKauto = 33.32. It is a rather basic solvent (DN = 29.810; β=0.7614) that is mainly used for studies of acids, especially for the weaker region of acidity scale. Along with MeCN, DMSO is one of the most often used solvent for acid-base measurements, as they both are sufficiently polar to dissolve and aid the dissociation of compounds of different properties. They complement each other: DMSO is more suitable for studying weak acids, MeCN is more suitable for studying strong acids. Both these media are widely used for pKa measurements and are also the media of choice for other fields of chemistry where the determined pKa’s are directly put in practice.
For comparison, water and the gas phase are also characterized below. Water is definitely the most popular solvent for studying acid-base
properties of compounds, the pKa values for aqueous media are often needed and a very large amount of aqueous pKa data18,19 is available. Importance of water arises from its role in biological systems and analytical chemistry (HPLC, UV-Vis spectroscopy as well as electrochemistry). The environmental aspect along with the low cost makes water the first choice of solvent (if possible) for industrial processes. Water is a very polar solvent (εr=78.362) and pKa values corresponding to eq 1 are measured. Water is a protic solvent with strong acidic and basic properties and thus a high tendency to autoprotolyse (pKauto=14.002).
17
Water is best known for hydrogen bonding, both as a donor (α=1.17) and an acceptor (β=0.18). Water is also a good EPA and EPD solvent (AN = 54.811 DN=1810). Water is widely used for pKa measurements, but the levelling effect due to the autoprotolysis hinders the measurements of strong acids and bases. Also the high polarity of the solvent means that less polar compounds may not dissolve enough to carry out pKa measurements.
Gas phase is a medium, that is ideally inert (εr=1 by definition), as there is no solvent, the true intrinsic properties of molecules can be measured. There is no levelling effect and the acidity of almost every hydrogen-containing compound (and basicity of any compound) can be at least in theory studied in gas phase. Although there are also no solubility problems, there are limits caused by the volatility of compounds, as they have to be vaporized for experiments. The absence of solvent molecules makes the theoretical calculations much more accurate so that the acidity and basicity in the gas phase can be studied computationally with high accuracy.
1.2.3. Acetonitrile-water mixtures
Water and acetonitrile are miscible in all proportions above 272 K (-1 °C)20. The structure of the mixture depends strongly on relative concentrations of the two co-solvents. In water-rich mixtures the individual MeCN molecules are solvated by water molecules via hydrogen bonding, as the O-H···O bonds are replaced by O-H···N.21 This means that MeCN molecules fit in the cavities of structured water molecules. Upon addition of acetonitrile, the cavities are no longer sufficient to host the MeCN molecules, so that the structure becomes micro heterogeneous with two domains.22 The hydrogen-bonded network in water is broken down into smaller self-associated regions.21 MeCN molecules also undergo the self-association process. Hydrogen bonding between MeCN and water molecules takes place on the interface of these micro domains.21 At higher concentrations of acetonitrile, there are no longer sufficient amounts of water molecules available to form hydrogen bonded domains, so they are limited to small clusters consisting of few molecules (or even single water molecules), that are in turn hydrogen bonded by MeCN molecules.21,22
pKa values of both acids and bases are higher in acetonitrile compared to water. The changes are not linear over different fractions of MeCN/H2O content and changes in opposite direction are reported for bases23 at higher mole fractions of water. This behavior in pKa values is universal in mixtures of water and an organic solvent.23,24 As the multicomponent solvent mixtures, among them acetonitrile-water, are relevant in many fields of chemistry, the pKa values in them have also been studied quite extensively. 23,24,25 However, acetonitrile-water mixtures, where water content is very low, have not gained as much attention. The pKa dependence of picric acid, as the anchor for the acidity scale in acetonitrile, has been studied systematically at impurity levels of water and found not to be influenced significantly by small amounts of water.26 Based on chemical intuition, there are assumptions, that in the case of pKa values of acids,
18
addition of water in acetonitrile should in one hand influence (i.e. increase the acidic strength of) weaker acids more than stronger acids and on the other hand the effect should generally be greater on OH acids compared to NH and CH acids.15 The anions of OH acids tend to be smaller and therefore have more concentrated charge than their NH and CH acid analogs if acids with similar strength are considered (acids A5, A6 and A8 in Section 3.3), making their anions more open to selective or preferential solvation.
1.3. Methods for acid-base studies
Over the past hundred years, that pKa values have been measured quantitatively, a wide variety of techniques have been used. If a change of a solution property, that is sensitive to pH, can be measured by an analytical method, then this property can be used in pKa measurements. Among them are various electro-chemical, spectrometric and chromatographic methods.3 Depending on the nature of solutes and solvents, the combination of several methods may also be used.3
Electrochemical methods, especially potentiometry, are the most commonly used methods among acid-base chemists. Potentiometry is probably the easiest method to use in aqueous media but is often also used in non-aqueous media.4 The accuracy of potentiometry largely relies on the accuracy of calibration of the electrodes and the stability of their behavior. This is easy to achieve in water, but often problematic in non-aqueous media.27 It is problematic to measure potentiometrically pKa values in solutions with either high or low activity of H+.3 As the method measures only the changes in potential during titration and the species of studied compounds are not directly observed, significant errors may occur.
The possible spectrometric methods used for pKa measurements include UV-Vis, infrared, nuclear magnetic resonance, fluorescence etc.3 These methods use the differences in spectra of the neutral and ionized species (in case of UV-Vis and fluorescence spectroscopy a chromo-/fluorophore is needed) and the results are calculated from the observed changes in spectra as a response to changes of the acidity of the solution. The general advantage of spectrometric methods is that they enable directly observing both the neutral and ionized species separately and give information if a competing equilibrium is affecting the mea-surements (side processes usually affect the spectra).
In this work UV-Vis spectrophotometry is used. This technique enables mea-surements in very dilute solutions minimizing the possibility of side processes. Besides the already mentioned need for substances, that have different UV-Vis spectra in neutral and ionized form, UV-Vis spectroscopy also requires the usage of solvents transparent in the UV-Vis region used for measurements. Details of the used spectrophotometric method are given below.
Alongside experimental techniques, mankind has also intensely developed methods to computationally predict pKa values.28 From the classical additive
19
methods of substituent effects of Hammet and Taft equations29,30,31 to more complex quantitative structure activity relationships (QSAR) models, we have reached to the era of computational methods capable of predicting the pKa values with reasonable accuracy. This reasonable accuracy is achieved through parametrization and correletions with experimental data.28 The computational methods are faster and cheaper compared to the experimental methods. They enable predicting the pKa values of compounds, that haven’t even been synthesized yet, making it a usable tool for screening.
Calculation of properties in the gas phase only needs the calculation of the Gibbs free energy of all the species involved in the reaction. In the case of
ionization of an acid HA, the conformers of two species, HA and A–, are
needed. For the Gibbs free energy of H+ the experimental value is usually used. In the solution the interactions with the solvent molecules in the solvent shell
have to be calculated in addition. In order to calculate these interactions correctly all possible orientations and positions of solvent molecules as well as the solute molecules have to be taken into account. This is a very complex task and several approximations are made in order to arrive at a reasonable computation time. The solvent surrounding the solute molecule is often handled as a continuum, characterized by its permittivity ε, so that only the interaction with the continuum has to be calculated.32 These models are referred to as Continuum Solvation Models (CSM) and there are several modification of them (CPCM33, SMD34 etc).28,32
In this study the Conductor-like Screening Model for Real Solvents (COSMO-RS)35 is used. COSMO-RS calculation consists of quantum chemical COSMO calculation, that is also a modification of CSM,36 and a statistical thermodynamics part.35 The COSMO part consists of calculating the geometry and energy in a virtual conductor εr=∞. As a result also a detailed data on the shape of the molecular cavity is calculated and the polarization charge densities are mapped onto the cavity surface, yielding the σ-surface. The σ-surfaces of all solutes and solvent molecules are then used in the statistical thermodynamics calculation, where the relative concentrations of each species can be taken into account. This enables calculations in various solvent mixtures, which is a huge advantage of COSMO-RS, which is the reason why it was chosen for this work. It has been shown that COSMO-RS is able to calculate the pKa values of acids and bases in different solvents, among which are also acetonitrile and water, with, in best scenarios, an average error of 1 pKa unit.35,37,38
20
2. EXPERIMENTAL SETUP AND COMPUTATIONAL ASPECTS
In the previous sections we have established that it is possible to measure the relative difference in acidities excluding the need for knowing the pH of the solution, equations 6 and 8. This approach in combination with UV-Vis spectrophotometric titration method results in a “pure” spectrophotometric method, without the need for measurement of pH and, in case of compounds having different spectra in acid and base forms, also knowledge of exact concentrations. It also allows the elimination of several possible errors of different origin (impurities, instrumental etc), as the errors are the same for both compounds. The method is based on titrating first the solutions of pure compounds with strong acid and/or base and recording the spectra of neutral and ionic species. From the intermediate spectra of these titration series, the influence of spectrally active impurities, as well as possible side processes can be determined. The titration is repeated with the solution containing both compounds with the emphasis not only on the spectra of acidic and basic forms, but also on the intermediate spectra, in which the net absorbance is caused by absorbance of four species (eq 4), at different ionization level. The ionization level is defined as
)HA(
A
AHA
A 1-z
1-zz
1-z
c
(18)
The ionization levels are calculated from spectra for both compounds and are the basis for ∆pKa calculations
)1(
)1(log
AHA
HAA
logAHA
HAAlog
AHA
HAAlog
12
21
2
12
1
11
2
22
1
11
1211
221
11
21
21
1
cc
c
c
c
c
c
cpK
zz
zz
zz
zz
zz
zz
a
(19)
Where c1 and c2 refer to the analytical concentrations of studied compounds. The titrants used have to be transparent in the analytical wavelengths and at least one of the compounds measured must have difference in spectra of neutral and ionic species. If both compounds exhibit spectral properties, they cannot be identical.
In part 3.3 of the thesis, the influence of water in impurity level on acid-base properties of the compounds is studied. In order to observe the changes in relative acidity/basicity caused by small amounts of water, the measurement was repeated in four solvents with water content approximately up to 10, from 30 to 70, 1000 and 10000 ppm. Best commercially available UV-grade acetonitrile has water content in around from 30 to 70 ppm level and this has been used in this study and previously in building acidity6,15,39 and basicity41-45
21
ladders. The higher water concentrations were achieved by adding additional water gravimetrically whereas the lowest was obtained by drying the solvent over molecular sieves.
2.1. Methods of calculation of pKa values from experimental data
The basis of every UV-Vis analysis is the Lambert-Beer law.
XX XA (20)
where the absorbance XA of the solution of species X in a layer of unit
thickness at wavelength λ is determined by the equilibrium concentration of X and its molar absorbance coefficient ελ at given wavelength, assuming the absorbance of the pure solvent has been taken into account. If the solution of two acids is considered, where both are partially dissociated, the absorbance of the solution is the sum of the absorbances of four species:
12
z22
11
z11 A
12HA
z
A
11HA
z AHAAHA zz
zzA (21)
Introducing the ionization levels (equations 18 and 19) into the equation results after regrouping in a following formula
)()( z2
12
z1
11
z2
z1 HAA22HAA11HA2HA1
zz ccccA (22)
Let us introduce the relative concentrations, which are defined as the ratio of compound’s concentration in the mixture and the concentration in the solution of pure compound.
pure1
1rel1 c
cc (23)
Previously the importance of border forms was emphasized, these border forms allow the calculation of concentration of the substance in the solution based on
the Lambert-Beer law. For instance if the solution of pure acid z1HA is
considered and it is fully in ionic form 0HA1 z :
11
11 Apure1A
11A
zz cA z (24)
22
Combining the equation 22, 23 and 24 gives
)()( z2
12
z1
111
z2
z11 HAA
rel22HAA
rel1HA
rel2HA
rel AAcAAcAcAcA zz (25)
Which can be used in two parameter linear regression model when
1HAAx)( z
11
1
AA z and 2HAAx)( z
21
2
AA z
The ionization ratios of both compounds can be obtained from the regression analysis and ∆pKa can be calculated according to equation 19. The linear regression analysis can be carried out with or without an intercept giving two calculation methods. It should be noted, that the calculation of ∆pKa does not use any other input data than the normalized spectra of pure compounds and mixture and the relative concentrations.
Alternatively the ionization ratios can be calculated utilizing the isosbestic points (wavelength at which both neutral and ionic species have the same molar absorptivity) or regions in spectra, where only one of the compounds absorbs light. This allows ascribing the changes in the spectra of mixture of two com-pounds to one of the compounds and therefore calculation of the ionization ratio of that compound.
z1
11
11
HAA
A1 AA
AA
z
z
(26)
If ionization ratios can be calculated for both compounds, an independent method can be achieved for calculating the ∆pKa.
Not all compounds have suitable chromophores or the changes in spectra upon protonation or deprotonation are very small, which makes the above described calculation methods inapplicable. In these cases the ionization ratio of one compound must be obtained from the spectra according to equation 26. Knowing the concentration of the first compound, concentration of the added titrant and the ionization ratio of the first compound allows the calculation of amount of titrant used for ionization of the second compound, which in turn lets us calculate the ionization ratio of the second compound and the calculation of ∆pKa. The concentrations of both compounds and titrants must be accurately known, meaning that larger amounts of compounds along with lower titrant concentrations are needed to minimize the errors of weighing.
As already mentioned earlier side processes can occur depending on the chemical nature of studied compounds and solvent used. In the case of acid pairs g, h, and i in section 3.3 one of the acids in pairs (compounds A12, A13 and A14, respectively) is prone to homoassociate. All of mentioned acids do not have sufficient spectral properties, so that the calculation method based on the
23
concentrations had to be modified. The homoassociation equilibria (equation 11) can be taken into account knowing that
1-zz
1-zz
homo AHA
AHA K (27)
In the previous method [HAz] and [Az-1] values could be easily calculated using the concentrations and knowing the amount of acidic or basic titrants added. The same scheme can be used here, but the obtained values correspond to apparent concentrations: [HAz]app = [HAz] + [HAz···Az-1] and [Az-1]app = [Az-1] + [HAz···Az-1] (28) If equations 27 and 28 are combined quadratic equation is formed
0AHAAHA1
AHAAHA app1-z
app
z1
homoapp
1-z
app
z21z
zzz
K (29)
From which the concentration of homoassociate complex can be found
2
AHA41
AHA1
AHA
AHAapp
1-z
app
z
2
homoapp
1-z
app
z
homoapp
1-z
app1-zz
KK
z
(30)
Knowing the [HAz···Az-1] allows the calculation of the true concentration of [HAz] and [Az-1] and therefore also the calculation of ionization ratio and ∆pKa. Experimental standard deviation s(ΔpKa) in Table 4 was calculated over the range of ∆pKa values obtained during n titration experiment points (generally 8 to 20 values), where both of the acids were generally dissociated more than 5% and less than 95% according to eq 31.
)1(
)pp()p( 1
2,
n
KKKs
n
iaia
a (31)
In section 3.2 a basicity scale is constructed in DCE. In order to get assigned pKip values for the bases, one of the base was taken as the reference point (anchor compound) and its pKip considered to be zero, the sum of squares (SS) of differences between estimates of assigned pKip values and the experimentally measured ∆pKip values were minimized, allowing the changing of all the assigned pKip values except the one, that was taken as an anchor compound.
24
This was done according to the following equation
mn
i
i KKKSS1
2
1ip2ipip minHApHApp (32)
Where nm is the number of measurements.
2.2. Computations
If equilibrium constants are desired the computations operate on the basis of Gibbs free energy: every reaction can be characterized by the Gibbs free energy change of the reaction, which can be calculated as the difference of Gibbs free energies of products and substrates, in the case of acid ionization (eq 1):
SSHHAAion GGGGG (33)
The equilibrium constants can be calculated using the following relationship between K and ∆G: ΔG = –RTlnK (34) Where R is the universal gas constant, T is the temperature.
The relationship between Ka and Gibbs free energy change of reaction is:
ΔGion = –RTlnKa + RTln[S] (35) The need for RTln[S] comes from the ∆G definition equation (eq 33), where the G of solvent molecules is given, but absent in the Ka definition equation at dilution limit (eq 2) as it is considered constant.
The pKa is therefore
Slog)10ln(
)S()HS(
)10ln(p a
RT
GG
RT
GK (36)
The ΔG is here referred to as the energy difference between ionic and neutral
form (ΔG = G(A-) – G(HA)). The experimental approach used in this work
involves measurement of relative acidity/basicity (i.e. acidity/basicity difference) of two compounds (pKa), this approach is applicable also here, avoiding the need for calculating the energy of solvated proton.
25
BABA
BAa
10ln
1
10ln10ln
Slog10ln
)S()HS(
10lnSlog
10ln
)S()HS(
10lnp
GGRTRT
G
RT
G
RT
GG
RT
G
RT
GG
RT
GK
(37)
In this study computations were made to supplement the observations made from the results of the experiments, where the effect of water content of the solvent on the acidities and basicities was studied. COSMO-RS is only one of the few computational methods capable of calculation in solvent mixtures.46 In previous section it was already mentioned that COSMO-RS uses two step com-putation protocol35:
As the first step, full geometry optimization and energy calculation at DFT BP TZVP level with the RI approximation and applying the COSMO conti-nuum solvation model was carried out for all species of eq 4 and solvent mole-cules using the Turbomole V 6.2 or V 6.3 software package47. Different starting geometries were used, based on common chemical knowledge of the species involved. For most species, several conformers corresponding to different local energy minima were found. These were all taken into account by statistical weighting inherent in the COSMO-RS procedure. The default convergence criteria of Turbomole were used (wavefunction convergence: max difference 10-6 Hartree; geometry convergence: max gradient |dE/dxyz| 10-3 Hartree/Bohr). This first computation step yields for every conformer the following data: (1) the geometry of the conformer, (2) detailed data on the shape of the molecular cavity, (3) the polarization charge densities mapped onto the cavity surface (the sigma profile) and (4) the total electronic energy of the species submerged into a virtual conductor (εr = ∞).
As the second step the COSMO-RS calculation was carried out on all species using the above listed data as input data with the COSMOtherm software package Version C2.1, Release 01.10 and Version C3.0, Release 13.0148. COSMO-RS calculation takes into account the interactions between the species of eq 4 and the solvent/medium molecules, as well as between the solvent molecules themselves (the implicit solvation model is used). The solvent composition is input as it was in the experiment (i.e. including the concentration of water in the solvent). Zero concentrations of the species of eq 4 are used. This way the interactions between the species and the solvent com-ponents are taken into account, but not the interactions between the species themselves. This situation corresponds well to the reality of very low con-centrations used in the experiments. Both van der Waals interactions (electro-static interactions, such as dipole-dipole, ion-dipole, etc and dispersion forces) and hydrogen bonds (in the implicit way) are taken into account. The inter-actions are quantified via statistical counting and averaging of energies of pair-wise interactions of molecular surface segments using the polarization charge density maps of the species created in the first step taking into account the concentrations of the respective species in the solution.35 Terms accounting for
26
vibrational contributions to the G are also added in this step. This is done implicitly, as these are represented through the experimental data used for para-metrization of the method. The energetics of these interactions are calculated at 298 K using a statistical thermodynamics procedure whereby also the con-formers of all the interacting species are taken into account and statistically weighted based on their relative stabilities.35 This way the entropy effect of the same species present in multiple conformers is also accounted for. As a result, a G value is found for every species. From the G values of the species the pKa is found.
2.2.1. WAPS and WANS parameters
In previous sections it was already mentioned, that the effect of water on ions through preferential solvation is influenced by the charge delocalization in the ions. The concept of charge delocalization in ions seems to be insufficiently quantified as it is used only at qualitative level. There are different well-known approaches, that involve partial charges on atoms in molecules and ions,32,50 but prior to Publication I, there was no quantitative parameter available that would characterize the charge distribution in an ion as a whole. At the same time in numerous situations – especially in interactions, such as ion-aggregation, hydrogen bonding between neutrals and ions, etc – it is the extent of charge delocalization of the ion as the whole that plays role.
The need to quantitatively describe the charge delocalization in anions in order to interpret the experimental results lead to the definition of a parameter for quantifying charge delocalization – Weighted Average Positive Sigma (WAPS).I It utilizes the sigma profile – distribution of charge density (σ) on molecular surface35 – obtained from the COSMO calculation. WAPS is defined as weighted mean of positive sigma values divided by the ion surface area:
0
0
)(
)(
dpA
dp
WAPS (38)
Where σ is the polarization charge density on the ions surface, p(σ) is the probability function of σ and A is the surface area of the anion. The surface segments with negative charge are (due to definition of σ) characterized by positive sigma values.
Analogous to the WAPS parameter, describing charge delocalization in anions, WANS (Weighted Average Negative Sigma) parameter can be defined to describe the charge delocalization in cations:
27
0
0
)(
)(
dpA
dp
WANS (39)
The smaller is the value of WAPS or WANS, respectively, the more delocalized is the charge in the ion. A charge in an ion is considered to be “localized” if the WAPS/WANS value is above 4.5 as proposed in Publications I and IV.
2.3. Instruments and chemicals
Preparations of all solutions and titration experiments were done in MBraun UniLab glovebox in the atmosphere of argon (concentration of O2 and H2O less than 1 ppm). Before each measurement from 1 to 2 ml of stock solutions (ca 10-
3 M) of both acids were prepared gravimetrically by using analytical balance into small glass vials with PTFE lined caps. For titration experiments the solutions of acids were further diluted to ca 10-5 M range directly into the 3.5 ml spectrophotometrical UV-grade quartz PTFE lined screw capped cuvette. Perkin Elmer UV-Vis spectrometer Lambda 40 with external sample compartment, which was situated in the glovebox and was connected to the spectrometer with quartz fiber optic light guides, was used for acquiring spectral data. For pairs h and i Ocean Optics HR2000+ spectrometer with Micropack DH-2000 light source, Sony ILX-511 detector and Quantum Northwest TLC 50F™ sample compartment was used, the temperature of the sample compartment was set to 25°C using Quantum Northwest TC 125™ temperature controller. Spectra of both neutral and ionic form were registered and as well as several spectra (ca 5 for pure acids and up to 20 to 30 for mixture of acids) of mixtures which contained both neutral and the ionic forms. The spectral data ere processed in MS Excel using the calculation methods described in section 2.1
For the measurements, where the influence of water content was observed, the chemicals, measurement method, equipment and conditions were kept the same as in the previous studies6,15,41,42,45 in our research group, where the ∆pKa values were first measured. The only difference was the water content of the solvent. Commercially available MeCN (Romil, >99.9 %, Super Purity Solvent, far UV) was used for preparation of solutions for the data points up to around 0.01% (100 ppm) of water. For obtaining the lowest possible water content MeCN was kept on molecular sieves (Riedel de Haën, average pore size 3Å) for at least 12 hours. This resulted trace water at few ppm level. Deionized water from Purite Analyst HP or Millipore Advantage a10 was gravimetrically added by syringe to the acetonitrile used for preparation of all solutions to get higher concentrations of water and its content was determined for pure solvent and titrated solutions by coulometric Karl Fischer titration (Mettler Toledo DL32)
28
after each experiment run using DM 143-SC diaphragmaless indicator electrode, Riedel deHäen Hydranal® Coulomat AD reagent solution and the following instrument settings: mix time 10 s, drift was kept at 3–5 μg/min, iodine generation speed was lower in dryer solvents and higher in wetter solvents. For measuring, the electrode polarization current was set to 2 μA and end point voltage to 100mV. The solvents with increased water content were individually made for each of the acid/base pair titration experiments. The same experimentally determined water content was later used in COSMO-RS calculation to exactly match the experimental conditions. For the investigation of phosphane bases DCE (Romil, >99.9 %, Super Purity Solvent, far UV) and MeCN were both used as solvents because of the solubility problems and due to the solvent limit of MeCN making the measurement of weakest bases impossible. Both solvents were dried on 3Å molecular sieves to minimize the effect of water.
TfOH (Aldrich, 99+%) was used for preparation of the acidic titrant, com-mercial superbasic phosphazenes t-BuP1(pyrr) (Fluka, >98%) and EtP2(dma) (>98%) depending on the strength of acids to be measured were used for preparation of the basic titrants in MeCN. In DCE TfOH was found to be too weak to protonate the acids studied so the CF3SO(=NTf)NHTf as acidic titrant49 had to be used.
In the studies of effect of water content, the compounds were the same as in previously published acidity6,15 and basicity41,42,45 scales, the origin of com-pounds is described therein. The origin of chiral acid catalysts (BINOL-phosphoric acids; NTPA (N-trifylphosphoramide); sulfurylimides (JINGLE, BINOL-bis(sulfurylimide)) and phosphane base catalysts (mainly fluoro and chloro substituted triphenylphosphanes) is described in Publications II and III, respectively.
In the pKa determination experiments each pKa value was obtained by measuring the acid under question in reference to 2 or 3 different reference acids and the assigned pKa (in Table 1 and Table 3) is the average over the pKa values obtained from the individual measurements.
29
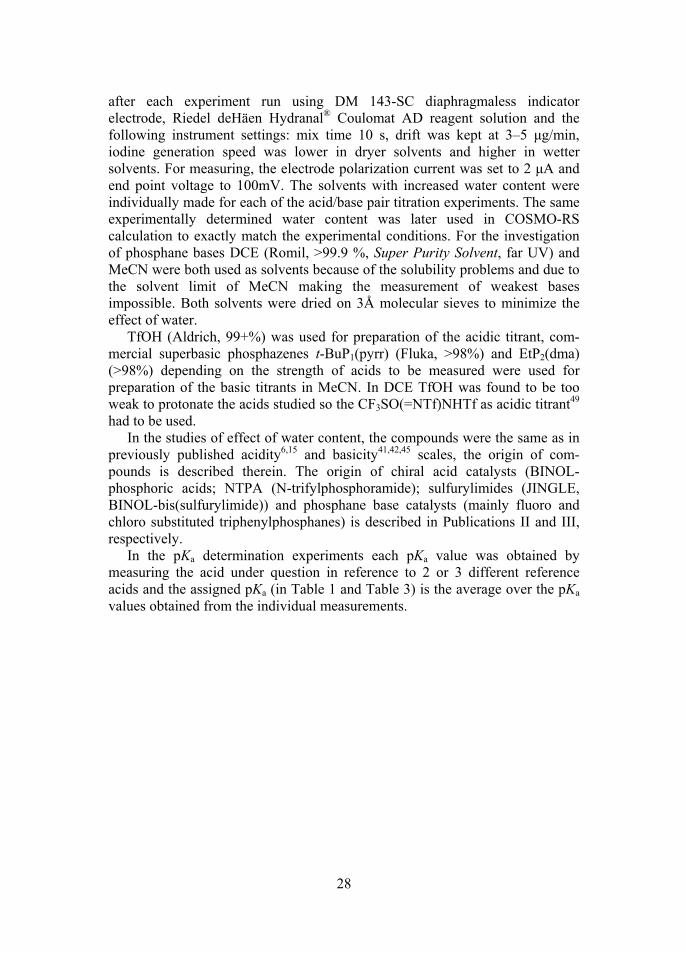
Figure 1. Structures of some of the compounds in order to help interpret the names and abbreviations.
9-COOMe Fluorene
2-methyl-8-quinolineamine
PhTMG
t-BuP1(pyrr) t-BuP
1(dma) EtP
2(dma)
N N
N
N H2
N
OO
N
P
N
NN
N
P
N P
N
N
N
N N
N P N
N
N

30
3. RESULTS
Knowing the limits and properties of solvents is very important when choosing the solvent for pKa measurements.
The first two parts of the Results section is focused on the pKa determination experiments of two sets of compounds: chiral Brønsted acid catalysts – BINOL-phosphoric acids; NTPA (N-trifylphosphoramide); sulfurylimides (JINGLE, BINOL-bissulfurylimide) – and phosphane bases as a part of Frustrated Lewis Pair (FLP) catalyst system. The two compound groups are similar in the sense that both have quite low pKa values, very near, or in the case of some phosphanes even below, the limit of MeCN (set by the basicity of the solvent). Knowing the limits of MeCN has led to involving besides MeCN also DCE for pKa measurements of phosphanes. In the case of chiral acid catalysts choosing MeCN as the solvent revealed serious errors in previously published pKa values of similar compounds determined in DMSO. The reasons behind the differen-ces, both from the point of view of solvent properties as well as experimental setup are discussed.
In the third part the influence of MeCN purity with respect to water content is studied and the effect of low water concentration is quantified for acids and bases with varying properties. The resulting suggestions for experimental setup based on the gained knowledge are presented in the fourth part of the results section.
3.1. pKa measurements of acid catalysts
There is increasing interest in highly efficient metal-free Brønsted acid organocatalysts51, especially in the field of asymmetric catalysis. Perhaps the best known are the chiral 1,1’-bi-2-naphthol (BINOL)-derived phosphoric acid diesters and analogues. They are used e.g. for transfer hydrogenations as well as various addition reactions to aldimines and ketimines. As the application of these catalysts involves basic substrates, the activation of more challenging (i.e. less basic) substrates needs more acidic catalysts. Therefore, the more acidic chiral BINOL-derived N-triflylphosphoramides (NTPAs)52,53 and bis(sulfuryl)imide54 based catalysts have been introduced.
Although the catalytic activity of these catalysts is related to acidity of the compounds52, very little was known about their exact pKa values. This inspired the measurement of the pKa values of these very important compounds with the aim of help to fine tune the catalysts. The pKa values of a selection of represen-tatives (Figure 2) of the mentioned organocatalysts’ families were measured.
31
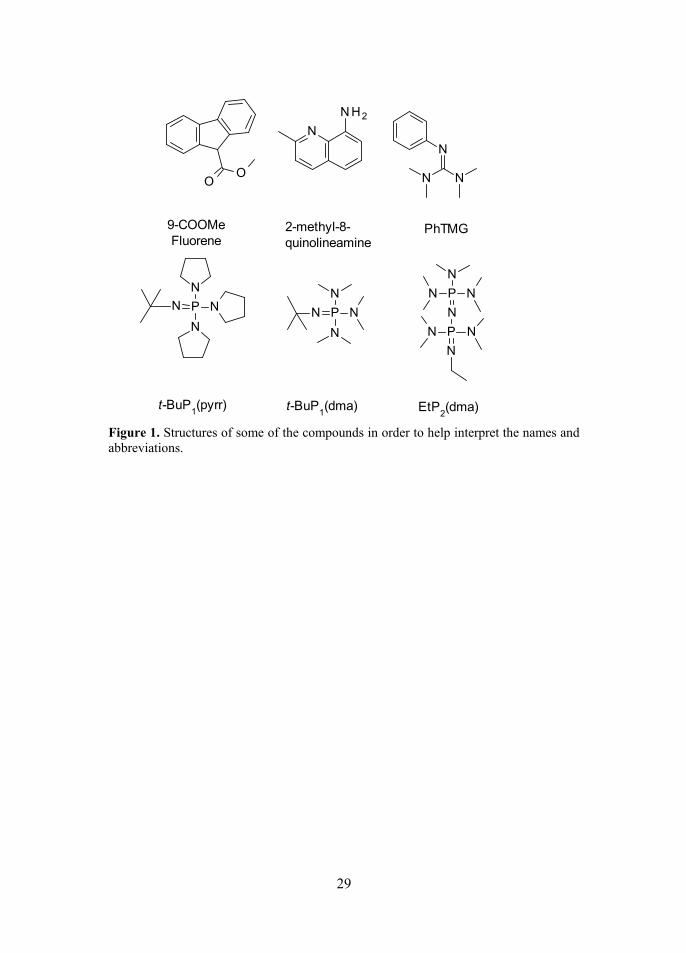
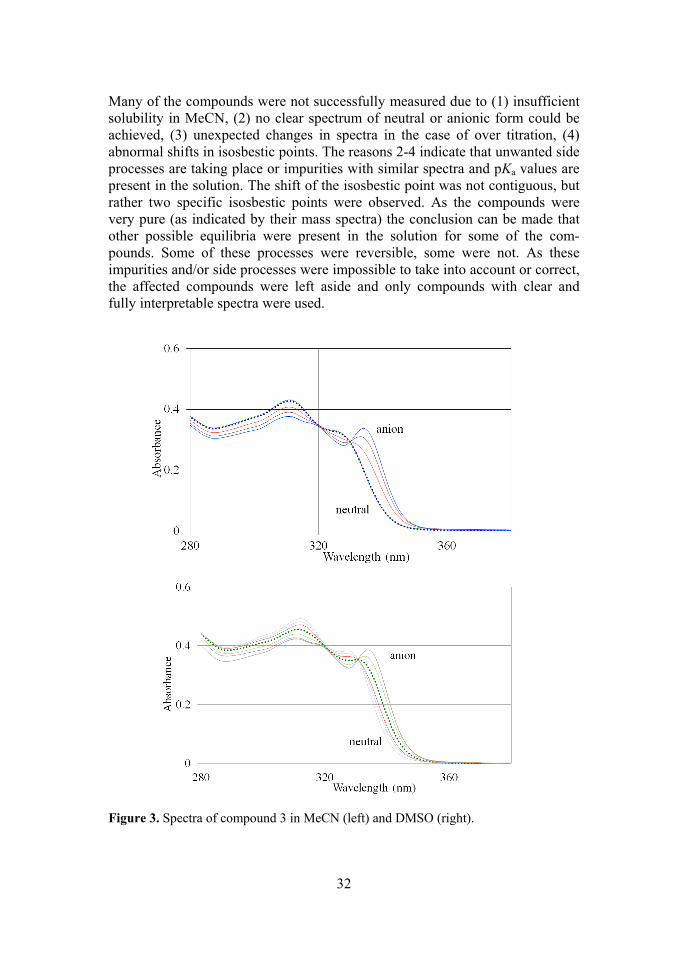
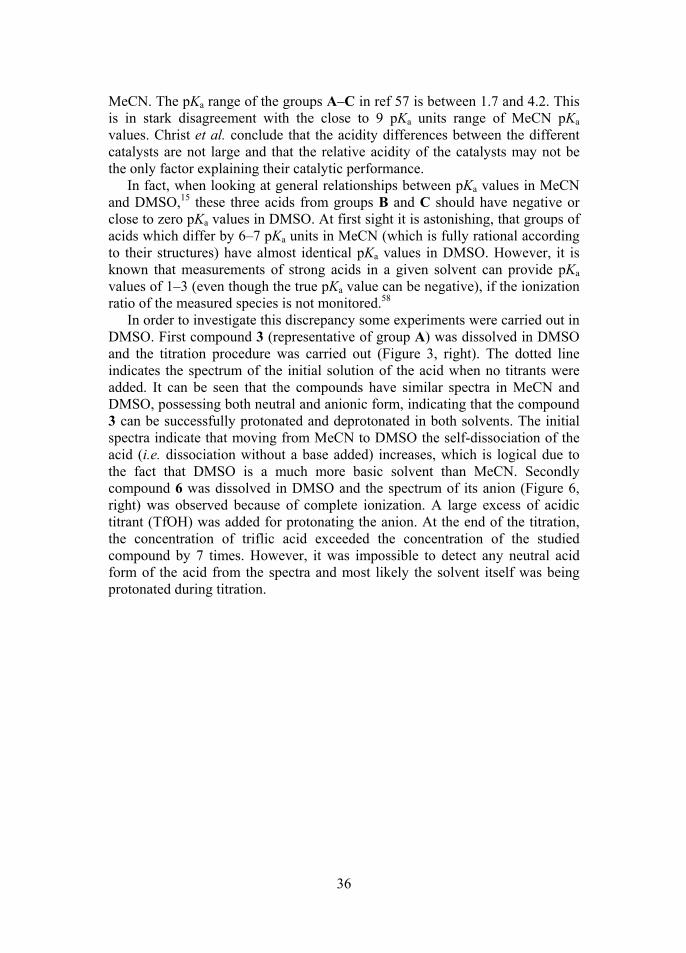
Figure 2. Types of chiral Brønsted acid organocatalysts. [H8] denotes 5,6,7,8-tetra-hydronaphthyl rings. The pKa values of these compounds proved quite difficult to measure. Because the acidity centers of these compounds are quite distant from the aromatic system, the molar absorbance coefficients (and thus the spectra) of the neutrals and anions are very similar in the case of all of these compounds, meaning that the changes in spectra upon protonation/deprotonation are very small. Figure 3 shows the best spectra, with the largest changes upon deprotonation, out of all studied compounds, for comparison see also Figure 6, image on the left. This affects the performance of methods used for calculation of pKa values from the spectra that rely on the changes in spectra. Due to the limited choice of reference acids (and their spectral properties relative to studied compounds) in the investigated pKa region, the measurements of these acids as “invisible” acids proved impossible. The original list of compounds was much wider than the final list of compounds with pKa values successfully measured (13 compounds).
32
Many of the compounds were not successfully measured due to (1) insufficient solubility in MeCN, (2) no clear spectrum of neutral or anionic form could be achieved, (3) unexpected changes in spectra in the case of over titration, (4) abnormal shifts in isosbestic points. The reasons 2-4 indicate that unwanted side processes are taking place or impurities with similar spectra and pKa values are present in the solution. The shift of the isosbestic point was not contiguous, but rather two specific isosbestic points were observed. As the compounds were very pure (as indicated by their mass spectra) the conclusion can be made that other possible equilibria were present in the solution for some of the com-pounds. Some of these processes were reversible, some were not. As these impurities and/or side processes were impossible to take into account or correct, the affected compounds were left aside and only compounds with clear and fully interpretable spectra were used.
Figure 3. Spectra of compound 3 in MeCN (left) and DMSO (right).
33
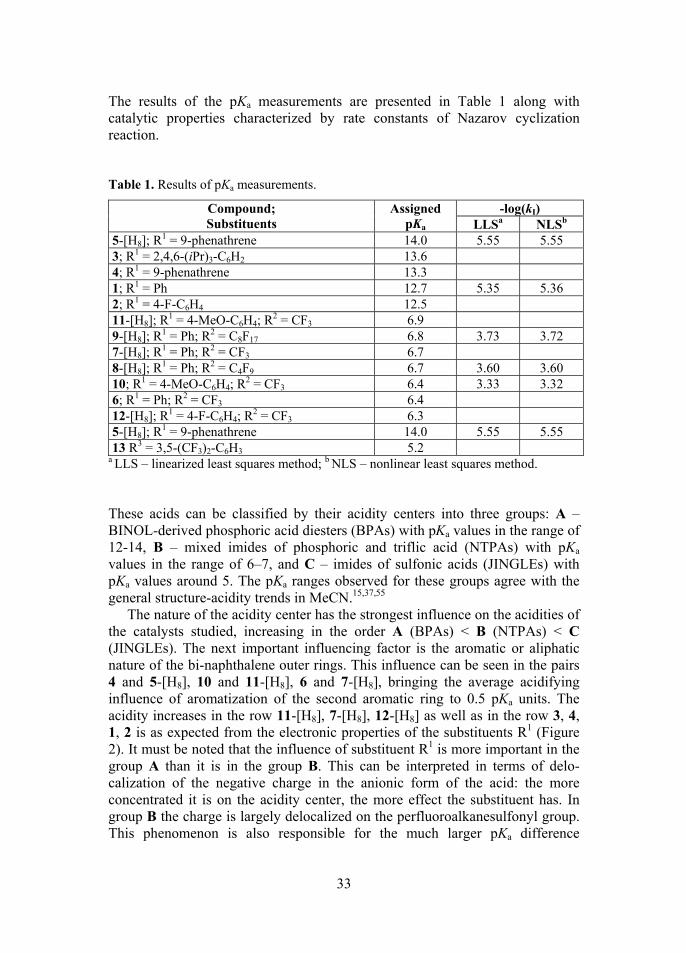
The results of the pKa measurements are presented in Table 1 along with catalytic properties characterized by rate constants of Nazarov cyclization reaction. Table 1. Results of pKa measurements.
Compound; Substituents
Assigned pKa
-log(kI)
LLSa NLSb 5-[H8]; R
1 = 9-phenathrene 14.0 5.55 5.55 3; R1 = 2,4,6-(iPr)3-C6H2 13.6 4; R1 = 9-phenathrene 13.3 1; R1 = Ph 12.7 5.35 5.36 2; R1 = 4-F-C6H4 12.5 11-[H8]; R
1 = 4-MeO-C6H4; R2 = CF3 6.9
9-[H8]; R1 = Ph; R2 = C8F17 6.8 3.73 3.72
7-[H8]; R1 = Ph; R2 = CF3 6.7
8-[H8]; R1 = Ph; R2 = C4F9 6.7 3.60 3.60
10; R1 = 4-MeO-C6H4; R2 = CF3 6.4 3.33 3.32
6; R1 = Ph; R2 = CF3 6.4 12-[H8]; R
1 = 4-F-C6H4; R2 = CF3 6.3
5-[H8]; R1 = 9-phenathrene 14.0 5.55 5.55
13 R3 = 3,5-(CF3)2-C6H3 5.2 a LLS – linearized least squares method; b NLS – nonlinear least squares method. These acids can be classified by their acidity centers into three groups: A – BINOL-derived phosphoric acid diesters (BPAs) with pKa values in the range of 12-14, B – mixed imides of phosphoric and triflic acid (NTPAs) with pKa values in the range of 6–7, and C – imides of sulfonic acids (JINGLEs) with pKa values around 5. The pKa ranges observed for these groups agree with the general structure-acidity trends in MeCN.15,37,55
The nature of the acidity center has the strongest influence on the acidities of the catalysts studied, increasing in the order A (BPAs) < B (NTPAs) < C (JINGLEs). The next important influencing factor is the aromatic or aliphatic nature of the bi-naphthalene outer rings. This influence can be seen in the pairs 4 and 5-[H8], 10 and 11-[H8], 6 and 7-[H8], bringing the average acidifying influence of aromatization of the second aromatic ring to 0.5 pKa units. The acidity increases in the row 11-[H8], 7-[H8], 12-[H8] as well as in the row 3, 4, 1, 2 is as expected from the electronic properties of the substituents R1 (Figure 2). It must be noted that the influence of substituent R1 is more important in the group A than it is in the group B. This can be interpreted in terms of delo-calization of the negative charge in the anionic form of the acid: the more concentrated it is on the acidity center, the more effect the substituent has. In group B the charge is largely delocalized on the perfluoroalkanesulfonyl group. This phenomenon is also responsible for the much larger pKa difference
34
between compound 1 and 4-toluenesulfonic acid (4.2 pKa units) than between 6 and TosNHTf (0.5 pKa units) and can also be extended to the above mentioned aromatic nature of the outer bi-naphthalene backbone.
The members of group B, which differ only in the length of the perfluoro-alkyl chain, have almost equal acidities. Although the perfluoroalkyl chain is closer to the acid center than the R1 substituents they influence the negative charge of the anions only through an inductive effect.
Type C catalyst 13 is the most acidic and differs in acidity from type B by one order of magnitude.
As mentioned above, the relationship between the acidity of a catalyst and its catalytic activity has been observed empirically. As concrete pKa values for a number of acidic catalysts had been measured, the measurement of catalytic activity followed with the aim of establishing the relation between acidity and catalytic activity. The catalytic activity measurements were carried out by our partners at RWTH Aachen University and the data treatment was carried out by the author [see Publication III] and hereby a brief description is given.
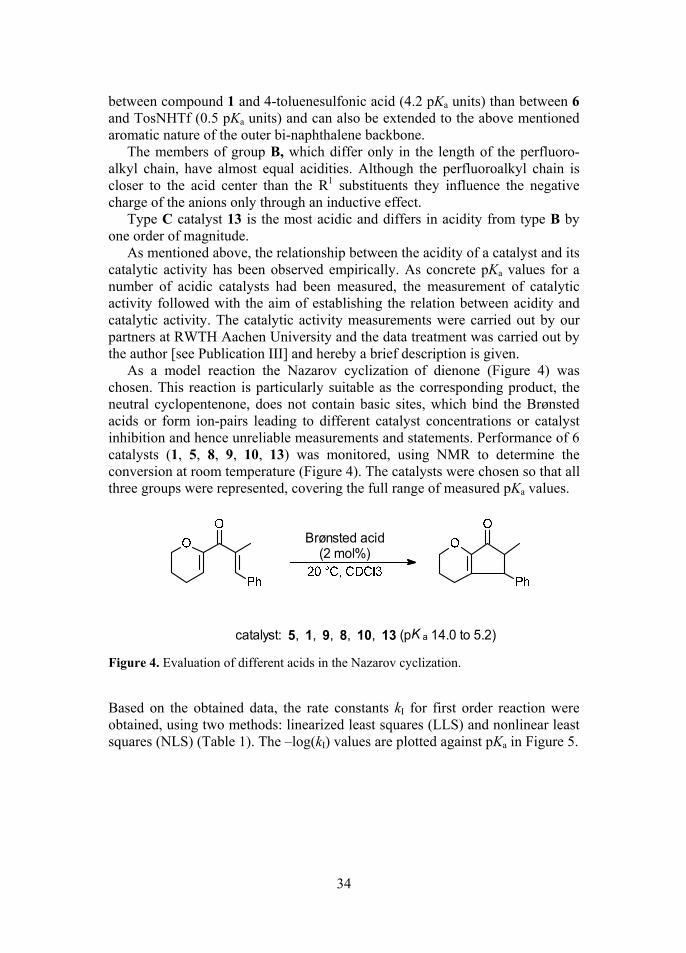
As a model reaction the Nazarov cyclization of dienone (Figure 4) was chosen. This reaction is particularly suitable as the corresponding product, the neutral cyclopentenone, does not contain basic sites, which bind the Brønsted acids or form ion-pairs leading to different catalyst concentrations or catalyst inhibition and hence unreliable measurements and statements. Performance of 6 catalysts (1, 5, 8, 9, 10, 13) was monitored, using NMR to determine the conversion at room temperature (Figure 4). The catalysts were chosen so that all three groups were represented, covering the full range of measured pKa values.
Brønsted acid (2 mol%)
catalyst: 5, 1, 9, 8, 10, 13 (pK a 14.0 to 5.2)
Figure 4. Evaluation of different acids in the Nazarov cyclization.
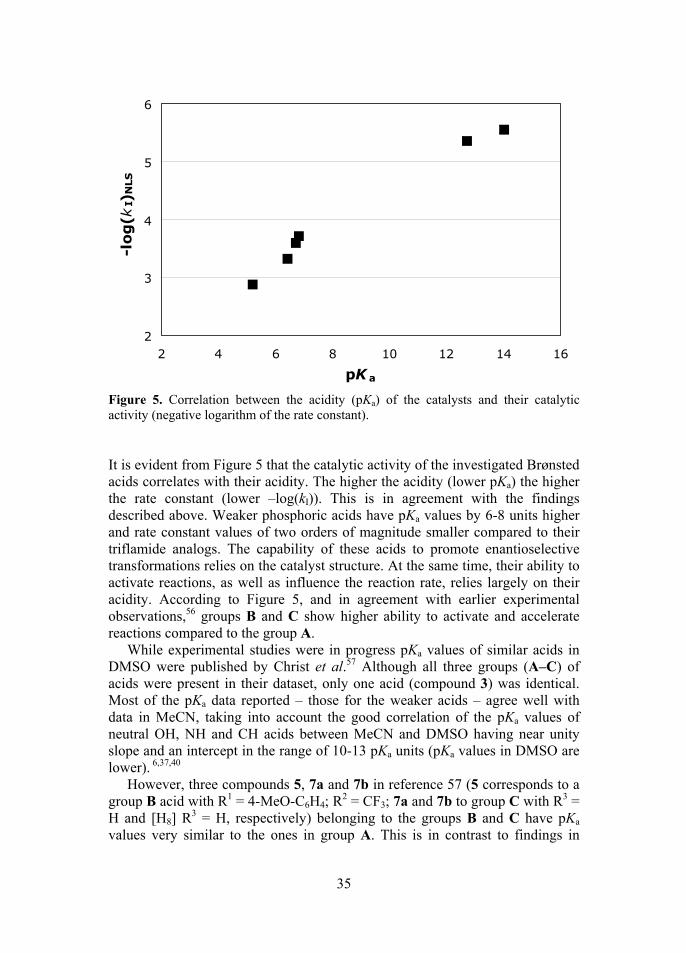
Based on the obtained data, the rate constants kI for first order reaction were obtained, using two methods: linearized least squares (LLS) and nonlinear least squares (NLS) (Table 1). The –log(kI) values are plotted against pKa in Figure 5.
35
Figure 5. Correlation between the acidity (pKa) of the catalysts and their catalytic activity (negative logarithm of the rate constant). It is evident from Figure 5 that the catalytic activity of the investigated Brønsted acids correlates with their acidity. The higher the acidity (lower pKa) the higher the rate constant (lower –log(kI)). This is in agreement with the findings described above. Weaker phosphoric acids have pKa values by 6-8 units higher and rate constant values of two orders of magnitude smaller compared to their triflamide analogs. The capability of these acids to promote enantioselective transformations relies on the catalyst structure. At the same time, their ability to activate reactions, as well as influence the reaction rate, relies largely on their acidity. According to Figure 5, and in agreement with earlier experimental observations,56 groups B and C show higher ability to activate and accelerate reactions compared to the group A.
While experimental studies were in progress pKa values of similar acids in DMSO were published by Christ et al.57 Although all three groups (A–C) of acids were present in their dataset, only one acid (compound 3) was identical. Most of the pKa data reported – those for the weaker acids – agree well with data in MeCN, taking into account the good correlation of the pKa values of neutral OH, NH and CH acids between MeCN and DMSO having near unity slope and an intercept in the range of 10-13 pKa units (pKa values in DMSO are lower). 6,37,40
However, three compounds 5, 7a and 7b in reference 57 (5 corresponds to a group B acid with R1 = 4-MeO-C6H4; R
2 = CF3; 7a and 7b to group C with R3 = H and [H8] R3 = H, respectively) belonging to the groups B and C have pKa values very similar to the ones in group A. This is in contrast to findings in
2
3
4
5
6
2 4 6 8 10 12 14 16
pK a
-log(kI)NLS
36
MeCN. The pKa range of the groups A–C in ref 57 is between 1.7 and 4.2. This is in stark disagreement with the close to 9 pKa units range of MeCN pKa values. Christ et al. conclude that the acidity differences between the different catalysts are not large and that the relative acidity of the catalysts may not be the only factor explaining their catalytic performance.
In fact, when looking at general relationships between pKa values in MeCN and DMSO,15 these three acids from groups B and C should have negative or close to zero pKa values in DMSO. At first sight it is astonishing, that groups of acids which differ by 6–7 pKa units in MeCN (which is fully rational according to their structures) have almost identical pKa values in DMSO. However, it is known that measurements of strong acids in a given solvent can provide pKa values of 1–3 (even though the true pKa value can be negative), if the ionization ratio of the measured species is not monitored.58
In order to investigate this discrepancy some experiments were carried out in DMSO. First compound 3 (representative of group A) was dissolved in DMSO and the titration procedure was carried out (Figure 3, right). The dotted line indicates the spectrum of the initial solution of the acid when no titrants were added. It can be seen that the compounds have similar spectra in MeCN and DMSO, possessing both neutral and anionic form, indicating that the compound 3 can be successfully protonated and deprotonated in both solvents. The initial spectra indicate that moving from MeCN to DMSO the self-dissociation of the acid (i.e. dissociation without a base added) increases, which is logical due to the fact that DMSO is a much more basic solvent than MeCN. Secondly compound 6 was dissolved in DMSO and the spectrum of its anion (Figure 6, right) was observed because of complete ionization. A large excess of acidic titrant (TfOH) was added for protonating the anion. At the end of the titration, the concentration of triflic acid exceeded the concentration of the studied compound by 7 times. However, it was impossible to detect any neutral acid form of the acid from the spectra and most likely the solvent itself was being protonated during titration.
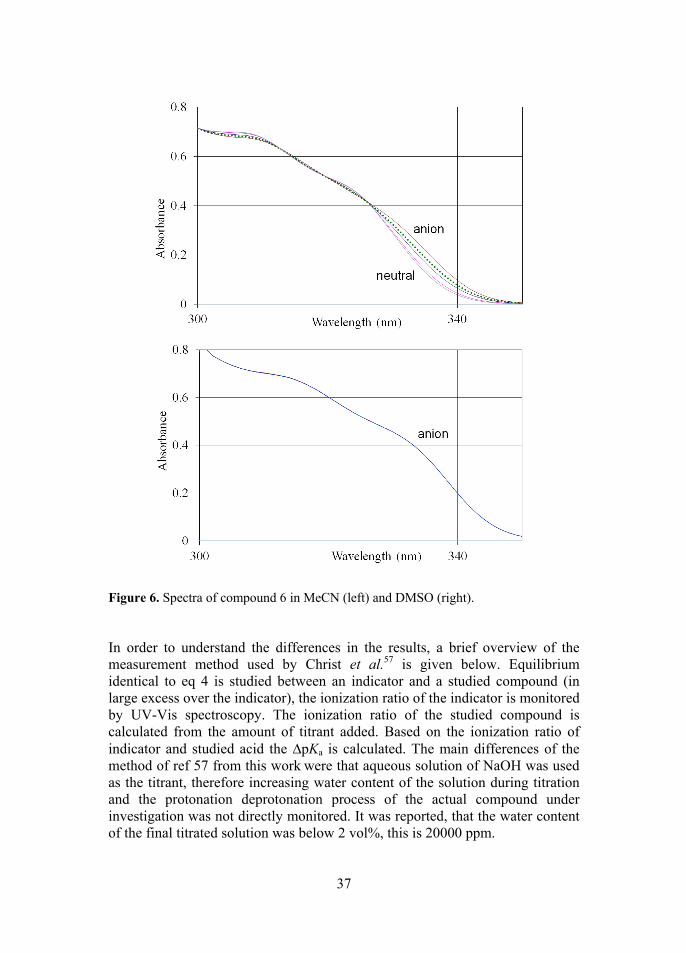
37
Figure 6. Spectra of compound 6 in MeCN (left) and DMSO (right). In order to understand the differences in the results, a brief overview of the measurement method used by Christ et al.57 is given below. Equilibrium identical to eq 4 is studied between an indicator and a studied compound (in large excess over the indicator), the ionization ratio of the indicator is monitored by UV-Vis spectroscopy. The ionization ratio of the studied compound is calculated from the amount of titrant added. Based on the ionization ratio of indicator and studied acid the ∆pKa is calculated. The main differences of the method of ref 57 from this work were that aqueous solution of NaOH was used as the titrant, therefore increasing water content of the solution during titration and the protonation deprotonation process of the actual compound under investigation was not directly monitored. It was reported, that the water content of the final titrated solution was below 2 vol%, this is 20000 ppm.
38
Christ et al. assumed that the studied Brønsted acids and conjugate bases either have no chromophore or undergo no spectral change upon ionization. Due to the assumption that there are no spectral changes upon ionization Christ et al. did not monitor the spectra of the Brønsted acids during titration, leading to the possibility that the process studied was not the desired one.
This method worked well for group A acids, but when the DMSO solutions of the B and C acids were prepared then the acids dissociated virtually completely. As the spectra of the studied compounds were not monitored, the self-ionization was missed. The different added amounts of aqueous hydroxide neutralized different proportions of the acid, which was already almost fully dissociated (leading to different H+ concentrations in solutions). The introduced water also modified (decreased) the pKa values of the indicators (as well as the catalysts). The indicators actually mostly measured the extent of neutralization (the “pH” of the solution) rather than acid dissociation. The difference between the pKa values of compounds of B and C groups in ref 57 are most probably due to the different indicators used and partial correction for self-dissociation that was done in the case of C group compounds, but not the B group compound. Probably these pKa values cannot be measured in DMSO accurately by conventional methods, but further experiments may give more information.
Direct observation – via spectral changes – of the protonation-deprotonation process is very important for obtaining trustworthy pKa values, especially for very strong and very weak acids (or bases). By directly observing the spectral changes of both compounds during the titration of the mixture one can reliably establish that protonation or deprotonation occurs. Based on simple observation of the spectra of a mixture of two compounds qualitative conclusions can already be made if the pKa values of both compounds are similar or not. If the ∆pKa is over 0.5 units, then, if we assume that both compounds are in their neutral forms and basic titrant is added, the compound, which is more acidic, ionizes to a greater extent and the spectra of the mixture resemble combinations of the anion of the more acidic compound and neutral of the less acidic compound. If the ∆pKa is below 0.5 units both compounds ionize to similar degree, and the order of acidity is not distinguishable from the spectra. In case of ∆pKa values above 2.5 units one compound is almost fully ionized before the other starts to ionize and the large difference in acidity can be easily detected from the spectra of the mixture. This means that if the protonation-depro-tonation process of both compounds is monitored, possible errors and artifacts can be avoided based on the qualitative evaluation of the spectra.
To further support the results it is instructive to look at the pKa of picric acid, which has been measured to be 11.0 in MeCN59 and is the anchor point of the acidity scale. The pKa of picric acid in DMSO is estimated to be around 0 by Kolthoff et al.60, which is reasonable based on the correlations between MeCN and DMSO mentioned before. Now if one considers an acid from group B, determined to be 4–5 units more acidic than picric acid in MeCN, it is irrational to assume, that the order of acidity changes so drastically, that they become 2–3 units less acidic.
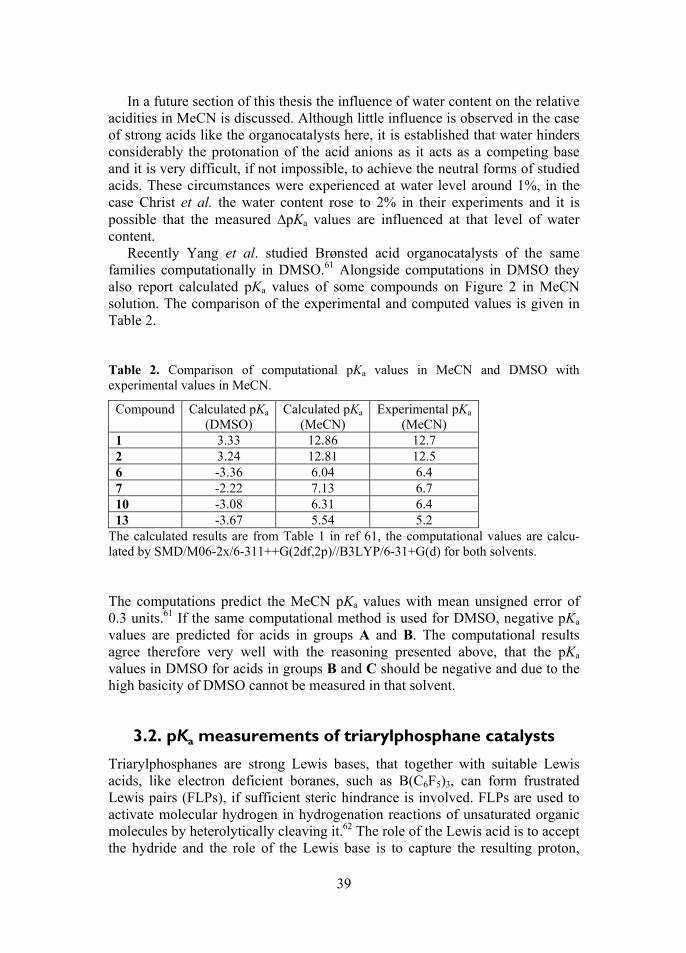
39
In a future section of this thesis the influence of water content on the relative acidities in MeCN is discussed. Although little influence is observed in the case of strong acids like the organocatalysts here, it is established that water hinders considerably the protonation of the acid anions as it acts as a competing base and it is very difficult, if not impossible, to achieve the neutral forms of studied acids. These circumstances were experienced at water level around 1%, in the case Christ et al. the water content rose to 2% in their experiments and it is possible that the measured ∆pKa values are influenced at that level of water content.
Recently Yang et al. studied Brønsted acid organocatalysts of the same families computationally in DMSO.61 Alongside computations in DMSO they also report calculated pKa values of some compounds on Figure 2 in MeCN solution. The comparison of the experimental and computed values is given in Table 2.
Table 2. Comparison of computational pKa values in MeCN and DMSO with experimental values in MeCN.
Compound Calculated pKa (DMSO)
Calculated pKa
(MeCN) Experimental pKa
(MeCN) 1 3.33 12.86 12.7 2 3.24 12.81 12.5 6 -3.36 6.04 6.4 7 -2.22 7.13 6.7 10 -3.08 6.31 6.4 13 -3.67 5.54 5.2
The calculated results are from Table 1 in ref 61, the computational values are calcu-lated by SMD/M06-2x/6-311++G(2df,2p)//B3LYP/6-31+G(d) for both solvents. The computations predict the MeCN pKa values with mean unsigned error of 0.3 units.61 If the same computational method is used for DMSO, negative pKa values are predicted for acids in groups A and B. The computational results agree therefore very well with the reasoning presented above, that the pKa values in DMSO for acids in groups B and C should be negative and due to the high basicity of DMSO cannot be measured in that solvent.
3.2. pKa measurements of triarylphosphane catalysts
Triarylphosphanes are strong Lewis bases, that together with suitable Lewis acids, like electron deficient boranes, such as B(C6F5)3, can form frustrated Lewis pairs (FLPs), if sufficient steric hindrance is involved. FLPs are used to activate molecular hydrogen in hydrogenation reactions of unsaturated organic molecules by heterolytically cleaving it.62 The role of the Lewis acid is to accept the hydride and the role of the Lewis base is to capture the resulting proton,
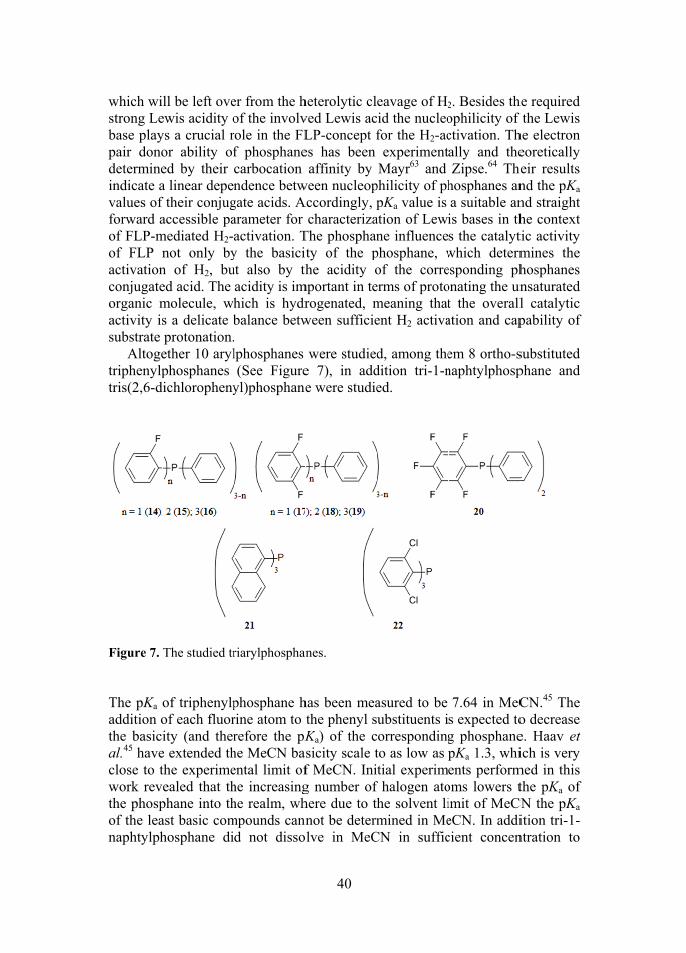
which wistrong Lebase playpair donodetermineindicate avalues of forward aof FLP-mof FLP nactivationconjugateorganic mactivity issubstrate
Altogetriphenylptris(2,6-d
Figure 7. The pKa addition othe basicial.45 haveclose to twork revthe phospof the leanaphtylph
ll be left oveewis acidity oys a crucial ror ability ofed by their a linear depenf their conjugaccessible pa
mediated H2-not only byn of H2, bued acid. The molecule, whs a delicate bprotonation.ether 10 arylphosphanes ichloropheny
The studied tr
of triphenylpof each fluority (and ther
e extended ththe experimeealed that th
phane into thast basic comhosphane di
er from the hof the involvrole in the FLf phosphanecarbocation ndence betw
gate acids. Aarameter for activation. Ty the basicitut also by thacidity is imhich is hydrbalance betw lphosphanes (See Figure
yl)phosphane
riarylphosphan
phosphane hrine atom to trefore the pKhe MeCN basental limit ofhe increasinghe realm, whmpounds cannd not disso
40
heterolytic clved Lewis acLP-concept fes has been affinity by
ween nucleopAccordingly, p
characterizaThe phosphanty of the phe acidity o
mportant in terogenated, mween sufficie
were studiede 7), in adde were studie
nes.
has been meathe phenyl sKa) of the csicity scale tf MeCN. Inig number of here due to thnot be determlve in MeC
eavage of H2
id the nucleofor the H2-acexperiment
Mayr63 and philicity of phpKa value is
ation of Lewine influence
phosphane, wof the correerms of protomeaning thatent H2 activa
d, among thedition tri-1-ned.
asured to be ubstituents iorrespondingto as low as ptial experim
f halogen atohe solvent limined in Me
CN in suffic
2. Besides thophilicity of ctivation. Thally and theZipse.64 The
hosphanes ana suitable anis bases in ths the catalytwhich determesponding phonating the unt the overallation and cap
em 8 ortho-snaphtylphosp
7.64 in MeCs expected tog phosphanepKa 1.3, whients perform
oms lowers timit of MeCNeCN. In addicient concen
he required f the Lewis he electron eoretically
heir results nd the pKa nd straight he context tic activity mines the hosphanes nsaturated l catalytic pability of
substituted phane and
CN.45 The o decrease e. Haav et ich is very
med in this the pKa of
CN the pKa ition tri-1-ntration to
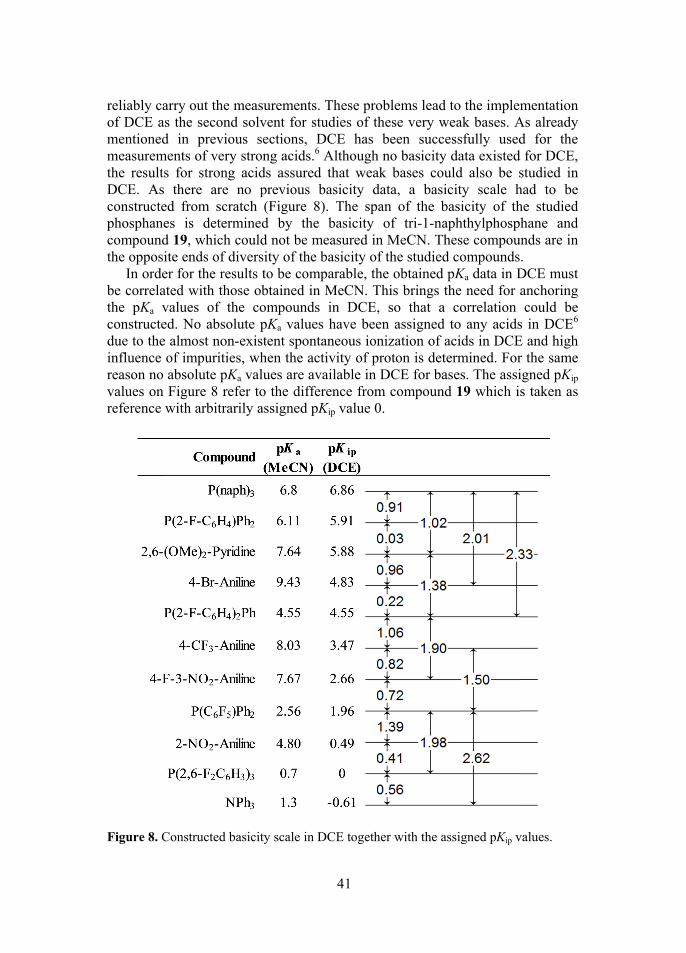
41
reliably carry out the measurements. These problems lead to the implementation of DCE as the second solvent for studies of these very weak bases. As already mentioned in previous sections, DCE has been successfully used for the measurements of very strong acids.6 Although no basicity data existed for DCE, the results for strong acids assured that weak bases could also be studied in DCE. As there are no previous basicity data, a basicity scale had to be constructed from scratch (Figure 8). The span of the basicity of the studied phosphanes is determined by the basicity of tri-1-naphthylphosphane and compound 19, which could not be measured in MeCN. These compounds are in the opposite ends of diversity of the basicity of the studied compounds.
In order for the results to be comparable, the obtained pKa data in DCE must be correlated with those obtained in MeCN. This brings the need for anchoring the pKa values of the compounds in DCE, so that a correlation could be constructed. No absolute pKa values have been assigned to any acids in DCE6 due to the almost non-existent spontaneous ionization of acids in DCE and high influence of impurities, when the activity of proton is determined. For the same reason no absolute pKa values are available in DCE for bases. The assigned pKip values on Figure 8 refer to the difference from compound 19 which is taken as reference with arbitrarily assigned pKip value 0.
Figure 8. Constructed basicity scale in DCE together with the assigned pKip values.
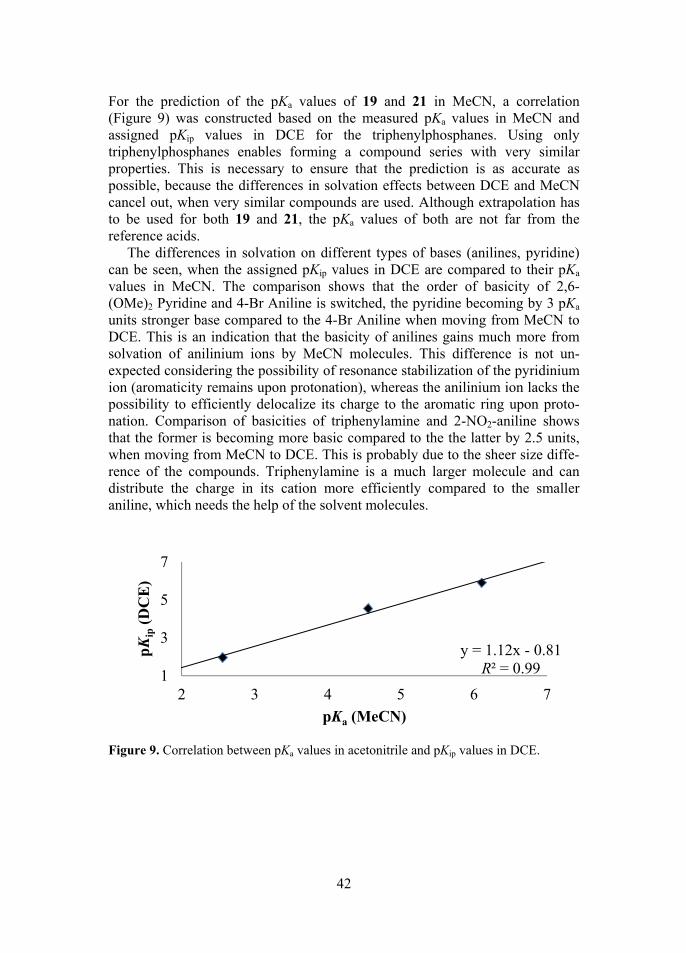
42
For the prediction of the pKa values of 19 and 21 in MeCN, a correlation (Figure 9) was constructed based on the measured pKa values in MeCN and assigned pKip values in DCE for the triphenylphosphanes. Using only triphenylphosphanes enables forming a compound series with very similar properties. This is necessary to ensure that the prediction is as accurate as possible, because the differences in solvation effects between DCE and MeCN cancel out, when very similar compounds are used. Although extrapolation has to be used for both 19 and 21, the pKa values of both are not far from the reference acids.
The differences in solvation on different types of bases (anilines, pyridine) can be seen, when the assigned pKip values in DCE are compared to their pKa values in MeCN. The comparison shows that the order of basicity of 2,6-(OMe)2 Pyridine and 4-Br Aniline is switched, the pyridine becoming by 3 pKa units stronger base compared to the 4-Br Aniline when moving from MeCN to DCE. This is an indication that the basicity of anilines gains much more from solvation of anilinium ions by MeCN molecules. This difference is not un-expected considering the possibility of resonance stabilization of the pyridinium ion (aromaticity remains upon protonation), whereas the anilinium ion lacks the possibility to efficiently delocalize its charge to the aromatic ring upon proto-nation. Comparison of basicities of triphenylamine and 2-NO2-aniline shows that the former is becoming more basic compared to the the latter by 2.5 units, when moving from MeCN to DCE. This is probably due to the sheer size diffe-rence of the compounds. Triphenylamine is a much larger molecule and can distribute the charge in its cation more efficiently compared to the smaller aniline, which needs the help of the solvent molecules.
Figure 9. Correlation between pKa values in acetonitrile and pKip values in DCE.
y = 1.12x - 0.81R² = 0.991
3
5
7
2 3 4 5 6 7
pK
ip(D
CE
)
pKa (MeCN)

43
Table 3 presents the experimentally determined pKa values of phosphanes in MeCN along with the pKa values obtained by correlation analysis from DCE data. If the phenyl substituents are replaced by 2-fluorophenyl substituents each substitution decreases the pKa by 1.5-1.6 units in an additive manner: from the pKa of triphenylphosphane (7.64)45 to compounds 14, 15 and 16 with pKa values of 6.11, 4.55 and 3.03, respectively. If the phenyl group is substituted with 2,6-difluorophenyl substituent then the pKa decreases by about 2.5 units with the first two substitutions and only by 1.8 with the last one. This reduction can be caused by either saturation effects or by errors originating from the correlation between DCE and MeCN, as the pKa value of compound 19 was determined from correlation. As extrapolation had to be used in order to find the pKa value of 19, increased error in the pKa value can be expected. The saturation effect can be seen with 20, where one phenyl group is fully perfluorinated. The pKa value of compound 20 with five fluorine substituents has pKa value of 2.56, whereas compound 18 achieves practically the same pKa with only four fluorine substituents (in two different phenyl groups). Table 3. Studied phosphanes and measured pKa values.
Base Assigned pKa (MeCN)(2-F-C6H4)(Ph)2P 14 6.11 (2-F-C6H4)2(Ph)P 15 4.55 (2-F-C6H4)3P 16 3.03 (2,6-F2-C6H3)(Ph)2P 17 5.16 (2,6-F2-C6H3)2(Ph)P 18 2.52 (2,6-F2-C6H3)3P 19 0.7 a (C6F5)(Ph)2P 20 2.56 P(naph)3 21 6.8a (2,6-Cl2-C6H3)3P 22 1.72
a Estimated from correlation with DCE data In order to demonstrate the correlation between pKa of the phosphane and the catalytic activity, Figure 10 illustrates the dependence between H2 activation temperature and the measured pKa. Details concerning the temperature measurement experiment as well as kinetic measurements of subsequent activation of unsaturated organic molecules can be found in in Publication II.
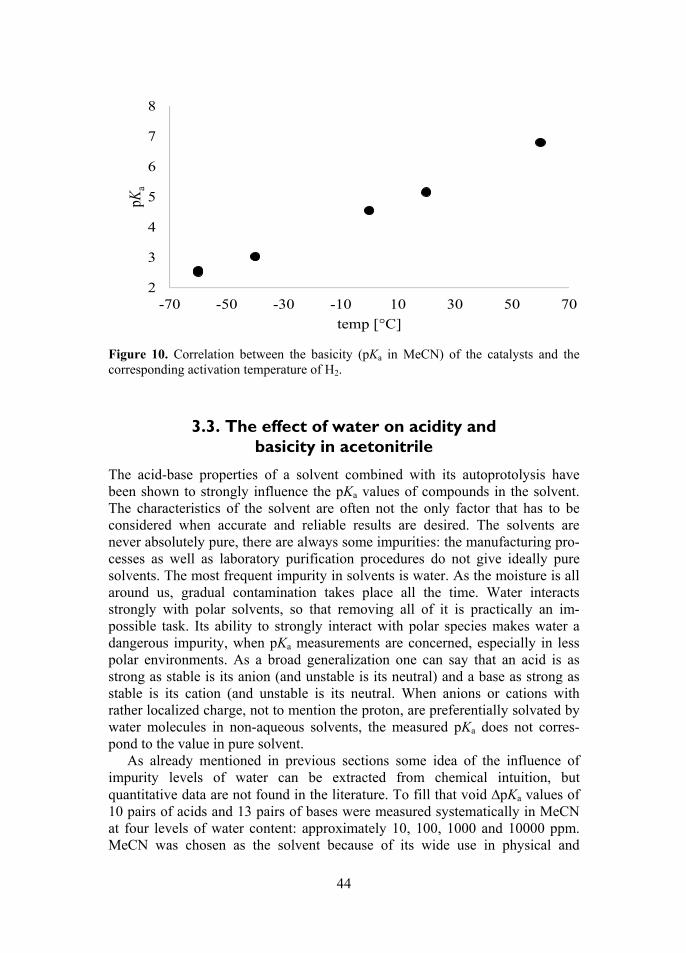
44
Figure 10. Correlation between the basicity (pKa in MeCN) of the catalysts and the corresponding activation temperature of H2.
3.3. The effect of water on acidity and basicity in acetonitrile
The acid-base properties of a solvent combined with its autoprotolysis have been shown to strongly influence the pKa values of compounds in the solvent. The characteristics of the solvent are often not the only factor that has to be considered when accurate and reliable results are desired. The solvents are never absolutely pure, there are always some impurities: the manufacturing pro-cesses as well as laboratory purification procedures do not give ideally pure solvents. The most frequent impurity in solvents is water. As the moisture is all around us, gradual contamination takes place all the time. Water interacts strongly with polar solvents, so that removing all of it is practically an im-possible task. Its ability to strongly interact with polar species makes water a dangerous impurity, when pKa measurements are concerned, especially in less polar environments. As a broad generalization one can say that an acid is as strong as stable is its anion (and unstable is its neutral) and a base as strong as stable is its cation (and unstable is its neutral. When anions or cations with rather localized charge, not to mention the proton, are preferentially solvated by water molecules in non-aqueous solvents, the measured pKa does not corres-pond to the value in pure solvent.
As already mentioned in previous sections some idea of the influence of impurity levels of water can be extracted from chemical intuition, but quantitative data are not found in the literature. To fill that void ∆pKa values of 10 pairs of acids and 13 pairs of bases were measured systematically in MeCN at four levels of water content: approximately 10, 100, 1000 and 10000 ppm. MeCN was chosen as the solvent because of its wide use in physical and
2
3
4
5
6
7
8
-70 -50 -30 -10 10 30 50 70
pKa
temp [°C]
45
analytical chemistry as well as the previous expertise associated with MeCN in our research group. In addition to the fundamental knowledge about the influence of water, the results can be used to validate the published acidity and basicity scales, that were constructed in MeCN with water content around 40 ppm15,41.
The acid and base pairs were chosen so that the nature of the acidity/basicity center, strength of the acid or base and the amount of charge delocalization in anions/cations were different. The results are presented in Table 4. It must be noted, that no change in ∆pKa value can be the result of either (1) the acidity/ basicity of neither of the compounds changed or (2) the acidity/basicity of both compounds changed to the same extent. Thus, the influence of water is evaluated only in relative terms – we cannot say anything about the changes in absolute pKa values as the change of H+ activity is not known. It is very likely that the activity of proton changes very much as the water concentration is increased, because proton is definitely the most solvated species in the solution and, if possible, is preferentially or even selectively solvated by water mole-cules. Measuring the ∆pKa between two compounds avoids the need to know the changes in H+ activity, but care must be taken choosing the reference compound. CH acids were chosen as reference acids, because they should be least affected by the changes in water concentration. For the same reason phosphazenes, if possible, were chosen as references in base pairs. If feasible, the same reference compound was used for measurements in the same pKa region. These considerations increase the comparability of the measured changes in ∆pKa values.
The pairs of acids a, b, c, f, g and i have also been measured in reference 15. The difference between the results in this work and results from reference 15 (with similar water content) are 0.01, 0.01, -0.01, 0.00, 0.05 and 0.20 pKa units, respectively. Base pairs k, l, m, s, t, w and x were also measured in reference 41, the differences being 0.04, 0.02, 0.08, 0.02, 0.00, 0.06 and 0.07, respecti-vely. The quite large difference for pair i can be the result of more difficult experiment, due to the absence of spectral properties of acetic acid15. The absence of spectral properties is also the reason for increased disparity in base pairs w and x. In broad terms one can conclude that the experimental setup was kept the same in this work and references 15 and 41.
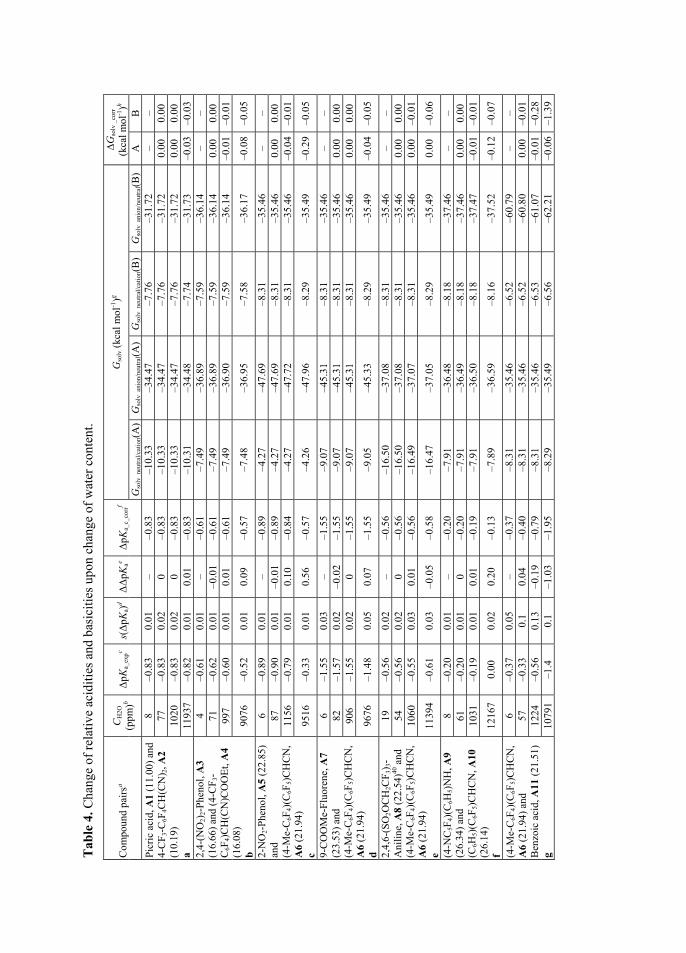
46
Tab
le 4
. Cha
nge
of r
elat
ive
acid
ities
and
bas
iciti
es u
pon
chan
ge o
f w
ater
con
tent
.
Com
poun
d pa
irsa
CH
2O
(ppm
)b Δ
pKa_
expc
s(Δ
pKa)
dΔΔ
pKae
ΔpK
a_c_
corr
f G
solv (
kcal
mol
-1)g
∆G
solv
_co
rr
(kca
l mol
-1)h
Gso
lv_n
eutr
al/c
atio
n(A
)G
solv
_ani
on/n
eutr
al(A
) G
solv
_neu
tral
/cat
ion(
B)
Gso
lv_a
nion
/neu
tral(B
) A
B
P
icri
c ac
id, A
1 (1
1.00
) an
d 4-
CF
3-C
6F4C
H(C
N) 2
, A2
(10.
19)
a
8 –0
.83
0.01
–
–0.8
3 –1
0.33
–3
4.47
–7
.76
–31.
72
– –
77
–0.8
3 0.
02
0 –0
.83
–10.
33
–34.
47
–7.7
6 –3
1.72
0.
00
0.00
10
20
–0.8
3 0.
02
0 –0
.83
–10.
33
–34.
47
–7.7
6 –3
1.72
0.
00
0.00
11
937
–0.8
2 0.
01
0.01
–0
.83
–10.
31
–34.
48
–7.7
4 –3
1.73
–0
.03
–0.0
3 2,
4-(N
O2)
2-P
heno
l, A
3 (1
6.66
) an
d (4
-CF
3-C
6F4)
CH
(CN
)CO
OE
t, A
4 (1
6.08
)
b
4 –0
.61
0.01
–
–0.6
1 –7
.49
–36.
89
–7.5
9 –3
6.14
–
– 71
–0
.62
0.01
–0
.01
–0.6
1 –7
.49
–36.
89
–7.5
9 –3
6.14
0.
00
0.00
99
7 –0
.60
0.01
0.
01
–0.6
1 –7
.49
–36.
90
–7.5
9 –3
6.14
–0
.01
–0.0
1
9076
–0
.52
0.01
0.
09
–0.5
7 –7
.48
–36.
95
–7.5
8 –3
6.17
–0
.08
–0.0
5
2-N
O2-
Phe
nol,
A5
(22.
85)
and
(4-M
e-C
6F4)
(C6F
5)C
HC
N,
A6
(21.
94)
c
6 –0
.89
0.01
–
–0.8
9 –4
.27
–47.
69
–8.3
1 –3
5.46
–
– 87
–0
.90
0.01
–0
.01
–0.8
9 –4
.27
–47.
69
–8.3
1 –3
5.46
0.
00
0.00
11
56
–0.7
9 0.
01
0.10
–0
.84
–4.2
7 –4
7.72
–8
.31
–35.
46
–0.0
4 –0
.01
9516
–0
.33
0.01
0.
56
–0.5
7 –4
.26
–47.
96
–8.2
9 –3
5.49
–0
.29
–0.0
5
9-C
OO
Me-
Flu
oren
e, A
7 (2
3.53
) an
d (4
-Me-
C6F
4)(C
6F5)
CH
CN
, A
6 (2
1.94
)
d
6 –1
.55
0.03
–
–1.5
5 –9
.07
–45.
31
–8.3
1 –3
5.46
–
– 82
–1
.57
0.02
–0
.02
–1.5
5 –9
.07
–45.
31
–8.3
1 –3
5.46
0.
00
0.00
90
6 –1
.55
0.02
0
–1.5
5 –9
.07
–45.
31
–8.3
1 –3
5.46
0.
00
0.00
9676
–1
.48
0.05
0.
07
–1.5
5 –9
.05
–45.
33
–8.2
9 –3
5.49
–0
.04
–0.0
5
2,4,
6-(S
O2O
CH
2CF
3)3-
Ani
line
, A8
(22.
54)40
and
(4
-Me-
C6F
4)(C
6F5)
CH
CN
, A
6 (2
1.94
)
e
19
–0.5
6 0.
02
– –0
.56
–16.
50
–37.
08
–8.3
1 –3
5.46
–
– 54
–0
.56
0.02
0
–0.5
6 –1
6.50
–3
7.08
–8
.31
–35.
46
0.00
0.
00
1060
–0
.55
0.03
0.
01
–0.5
6 –1
6.49
–3
7.07
–8
.31
–35.
46
0.00
–0
.01
1139
4 –0
.61
0.03
–0
.05
–0.5
8 –1
6.47
–3
7.05
–8
.29
–35.
49
0.00
–0
.06
(4-N
C5F
4)(C
6H5)
NH
, A9
(26.
34)
and
(C6H
5)(C
6F5)
CH
CN
, A10
(2
6.14
)
f
8 –0
.20
0.01
–
–0.2
0 –7
.91
–36.
48
–8.1
8 –3
7.46
–
– 61
–0
.20
0.01
0
–0.2
0 –7
.91
–36.
49
–8.1
8 –3
7.46
0.
00
0.00
10
31
–0.1
9 0.
01
0.01
–0
.19
–7.9
1 –3
6.50
–8
.18
–37.
47
–0.0
1 –0
.01
1216
7 0.
00
0.02
0.
20
–0.1
3 –7
.89
–36.
59
–8.1
6 –3
7.52
–0
.12
–0.0
7
(4-M
e-C
6F4)
(C6F
5)C
HC
N,
A6
(21.
94)
and
Ben
zoic
aci
d, A
11 (
21.5
1)
g
6 –0
.37
0.05
–
–0.3
7 –8
.31
–35.
46
–6.5
2 –6
0.79
–
– 57
–0
.33
0.1
0.04
–0
.40
–8.3
1 –3
5.46
–6
.52
–60.
80
0.00
–0
.01
1224
–0
.56
0.13
–0
.19
–0.7
9 –8
.31
–35.
46
–6.5
3 –6
1.07
–0
.01
–0.2
8 10
791
–1.4
0.
1 –1
.03
–1.9
5 –8
.29
–35.
49
–6.5
6 –6
2.21
–0
.06
–1.3
9
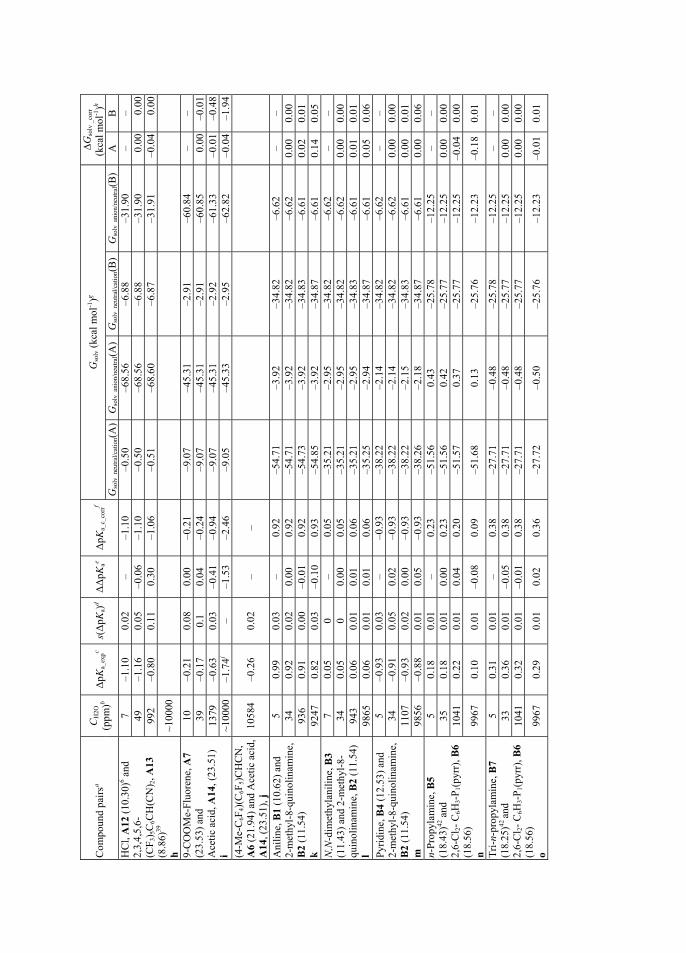
47
Com
poun
d pa
irsa
CH
2O
(ppm
)b Δ
pKa_
expc
s(Δ
pKa)
dΔΔ
pKae
ΔpK
a_c_
corr
f G
solv (
kcal
mol
-1)g
∆G
solv
_co
rr
(kca
l mol
-1)h
Gso
lv_n
eutr
al/c
atio
n(A
)G
solv
_ani
on/n
eutr
al(A
) G
solv
_neu
tral
/cat
ion(
B)
Gso
lv_a
nion
/neu
tral(B
) A
B
H
Cl,
A12
(10
.30)
6 and
2,
3,4,
5,6-
(CF
3)5C
6CH
(CN
) 2, A
13
(8.8
6)39
h
7 –1
.10
0.02
–
–1.1
0 –0
.50
–68.
56
–6.8
8 –3
1.90
–
– 49
–1
.16
0.05
–0
.06
–1.1
0 –0
.50
–68.
56
–6.8
8 –3
1.90
0.
00
0.00
99
2 –0
.80
0.11
0.
30
–1.0
6 –0
.51
–68.
60
–6.8
7 –3
1.91
–0
.04
0.00
~100
00
9-
CO
OM
e-F
luor
ene,
A7
(23.
53)
and
Ace
tic
acid
, A14
, (23
.51)
i
10
–0.2
1 0.
08
0.00
–0
.21
–9.0
7 –4
5.31
–2
.91
–60.
84
– –
39
–0.1
7 0.
1 0.
04
–0.2
4 –9
.07
–45.
31
–2.9
1 –6
0.85
0.
00
–0.0
1 13
79
–0.6
3 0.
03
–0.4
1 –0
.94
–9.0
7 –4
5.31
–2
.92
–61.
33
–0.0
1 –0
.48
~100
00–1
.74j
– –1
.53
–2.4
6 –9
.05
–45.
33
–2.9
5 –6
2.82
–0
.04
–1.9
4 (4
-Me-
C6F
4)(C
6F5)
CH
CN
, A
6 (2
1.94
) an
d A
ceti
c ac
id,
A14
, (23
.51)
, j
1058
4 –0
.26
0.02
–
–
Ani
line
, B1
(10.
62)
and
2-m
ethy
l-8-
quin
olin
amin
e,
B2
(11.
54)
k
5 0.
99
0.03
–
0.92
–5
4.71
–3
.92
–34.
82
–6.6
2 –
– 34
0.
92
0.02
0.
00
0.92
–5
4.71
–3
.92
–34.
82
–6.6
2 0.
00
0.00
93
6 0.
91
0.00
–0
.01
0.92
–5
4.73
–3
.92
–34.
83
–6.6
1 0.
02
0.01
92
47
0.82
0.
03
–0.1
0 0.
93
–54.
85
–3.9
2 –3
4.87
–6
.61
0.14
0.
05
N,N
-dim
ethy
lani
line
, B3
(11.
43)
and
2-m
ethy
l-8-
quin
olin
amin
e, B
2 (1
1.54
) l
7 0.
05
0 –
0.05
–3
5.21
–2
.95
–34.
82
–6.6
2 –
– 34
0.
05
0 0.
00
0.05
–3
5.21
–2
.95
–34.
82
–6.6
2 0.
00
0.00
94
3 0.
06
0.01
0.
01
0.06
–3
5.21
–2
.95
–34.
83
–6.6
1 0.
01
0.01
98
65
0.06
0.
01
0.01
0.
06
–35.
25
–2.9
4 –3
4.87
–6
.61
0.05
0.
06
Pyr
idin
e, B
4 (1
2.53
) an
d 2-
met
hyl-
8-qu
inol
inam
ine,
B
2 (1
1.54
) m
5 –0
.93
0.03
–
–0.9
3 –3
8.22
–2
.14
–34.
82
–6.6
2 –
– 34
–0
.91
0.05
0.
02
–0.9
3 –3
8.22
–2
.14
–34.
82
–6.6
2 0.
00
0.00
11
07
–0.9
3 0.
02
0.00
–0
.93
–38.
22
–2.1
5 –3
4.83
–6
.61
0.00
0.
01
9856
–0
.88
0.01
0.
05
–0.9
3 –3
8.26
–2
.18
–34.
87
–6.6
1 0.
00
0.06
n-
Pro
pyla
min
e, B
5 (1
8.43
)42 a
nd
2,6-
Cl 2
- C
6H3-
P1(
pyrr
), B
6 (1
8.56
)
n
5 0.
18
0.01
–
0.23
–5
1.56
0.
43
–25.
78
–12.
25
– –
35
0.18
0.
01
0.00
0.
23
–51.
56
0.42
–2
5.77
–1
2.25
0.
00
0.00
10
41
0.22
0.
01
0.04
0.
20
–51.
57
0.37
–2
5.77
–1
2.25
–0
.04
0.00
9967
0.
10
0.01
–0
.08
0.09
–5
1.68
0.
13
–25.
76
–12.
23
–0.1
8 0.
01
Tri
-n-p
ropy
lam
ine,
B7
(18.
25)42
and
2,6-
Cl 2
- C
6H3-
P1(
pyrr
), B
6 (1
8.56
)
o
5 0.
31
0.01
–
0.38
–2
7.71
–0
.48
–25.
78
–12.
25
– –
33
0.36
0.
01
–0.0
5 0.
38
–27.
71
–0.4
8 –2
5.77
–1
2.25
0.
00
0.00
10
41
0.32
0.
01
–0.0
1 0.
38
–27.
71
–0.4
8 –2
5.77
–1
2.25
0.
00
0.00
9967
0.
29
0.01
0.
02
0.36
–2
7.72
–0
.50
–25.
76
–12.
23
–0.0
1 0.
01
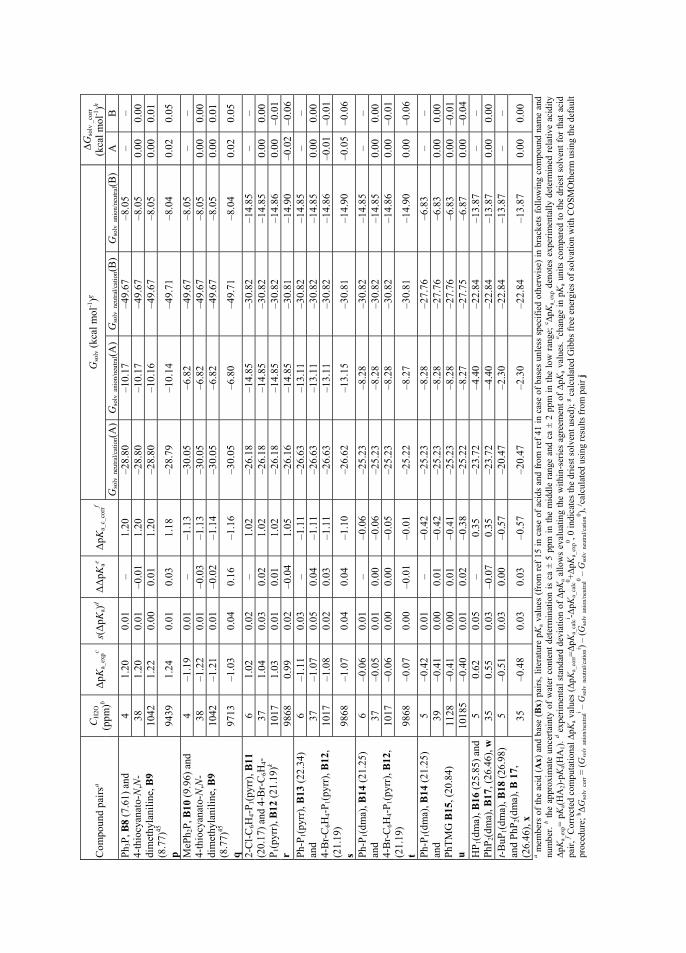
48
Com
poun
d pa
irsa
CH
2O
(ppm
)b Δ
pKa_
expc
s(Δ
pKa)
dΔΔ
pKae
ΔpK
a_c_
corr
f G
solv (
kcal
mol
-1)g
∆G
solv
_co
rr
(kca
l mol
-1)h
Gso
lv_n
eutr
al/c
atio
n(A
)G
solv
_ani
on/n
eutr
al(A
) G
solv
_neu
tral
/cat
ion(
B)
Gso
lv_a
nion
/neu
tral(B
) A
B
P
h 3P
, B8
(7.6
1) a
nd
4-th
iocy
anat
o-N
,N-
dim
ethy
lani
line
, B9
(8.7
7)45
p
4 1.
20
0.01
–
1.20
–2
8.80
–1
0.17
–4
9.67
–8
.05
– –
38
1.20
0.
01
–0.0
1 1.
20
–28.
80
–10.
17
–49.
67
–8.0
5 0.
00
0.00
10
42
1.22
0.
00
0.01
1.
20
–28.
80
–10.
16
–49.
67
–8.0
5 0.
00
0.01
9439
1.
24
0.01
0.
03
1.18
–2
8.79
–1
0.14
–4
9.71
–8
.04
0.02
0.
05
MeP
h 2P
, B10
(9.
96)
and
4-th
iocy
anat
o-N
,N-
dim
ethy
lani
line
, B9
(8.7
7)45
q
4 –1
.19
0.01
–
–1.1
3 –3
0.05
–6
.82
–49.
67
–8.0
5 –
– 38
–1
.22
0.01
–0
.03
–1.1
3 –3
0.05
–6
.82
–49.
67
–8.0
5 0.
00
0.00
10
42
–1.2
1 0.
01
–0.0
2 –1
.14
–30.
05
–6.8
2 –4
9.67
–8
.05
0.00
0.
01
9713
–1
.03
0.04
0.
16
–1.1
6 –3
0.05
–6
.80
–49.
71
–8.0
4 0.
02
0.05
2-C
l-C
6H4-
P1(
pyrr
), B
11
(20.
17)
and
4-B
r-C
6H4-
P1(
pyrr
), B
12 (
21.1
9)k
r
6 1.
02
0.02
–
1.02
–2
6.18
–1
4.85
–3
0.82
–1
4.85
–
– 37
1.
04
0.03
0.
02
1.02
–2
6.18
–1
4.85
–3
0.82
–1
4.85
0.
00
0.00
10
17
1.03
0.
01
0.01
1.
02
–26.
18
–14.
85
–30.
82
–14.
86
0.00
–0
.01
9868
0.
99
0.02
–0
.04
1.05
–2
6.16
–1
4.85
–3
0.81
–1
4.90
–0
.02
–0.0
6 P
h-P
1(py
rr),
B13
(22
.34)
an
d 4-
Br-
C6H
4-P
1(py
rr),
B12
, (2
1.19
) s
6 –1
.11
0.03
–
–1.1
1 –2
6.63
–1
3.11
–3
0.82
–1
4.85
–
– 37
–1
.07
0.05
0.
04
–1.1
1 –2
6.63
–1
3.11
–3
0.82
–1
4.85
0.
00
0.00
10
17
–1.0
8 0.
02
0.03
–1
.11
–26.
63
–13.
11
–30.
82
–14.
86
–0.0
1 –0
.01
9868
–1
.07
0.04
0.
04
–1.1
0 –2
6.62
–1
3.15
–3
0.81
–1
4.90
–0
.05
–0.0
6
Ph-
P1(
dma)
, B14
(21
.25)
an
d 4-
Br-
C6H
4-P
1(py
rr),
B12
, (2
1.19
) t
6 –0
.06
0.01
–
–0.0
6 –2
5.23
–8
.28
–30.
82
–14.
85
– –
37
–0.0
5 0.
01
0.00
–0
.06
–25.
23
–8.2
8 –3
0.82
–1
4.85
0.
00
0.00
10
17
–0.0
6 0.
00
0.00
–0
.05
–25.
23
–8.2
8 –3
0.82
–1
4.86
0.
00
–0.0
1
9868
–0
.07
0.00
–0
.01
–0.0
1 –2
5.22
–8
.27
–30.
81
–14.
90
0.00
–0
.06
Ph-
P1(
dma)
, B14
(21
.25)
an
d P
hTM
G B
15, (
20.8
4)
u
5 –0
.42
0.01
–
–0.4
2 –2
5.23
–8
.28
–27.
76
–6.8
3 –
– 39
–0
.41
0.00
0.
01
–0.4
2 –2
5.23
–8
.28
–27.
76
–6.8
3 0.
00
0.00
11
28
–0.4
1 0.
00
0.01
–0
.41
–25.
23
–8.2
8 –2
7.76
–6
.83
0.00
–0
.01
1018
5 –0
.40
0.01
0.
02
–0.3
8 –2
5.22
–8
.27
–27.
75
–6.8
7 0.
00
–0.0
4 H
P1(
dma)
, B16
(25
.85)
and
P
hP2(
dma)
, B17
, (26
.46)
, w5
0.62
0.
05
– 0.
35
–23.
72
–4.4
0 –2
2.84
–1
3.87
–
– 35
0.
55
0.03
–0
.07
0.35
–2
3.72
–4
.40
–22.
84
–13.
87
0.00
0.
00
t-B
uP1(
dma)
, B18
(26
.98)
an
d P
hP2(
dma)
, B 1
7,
(26.
46),
x
5 –0
.51
0.03
0.
00
–0.5
7 –2
0.47
–2
.30
–22.
84
–13.
87
– –
35
–0.4
8 0.
03
0.03
–0
.57
–20.
47
–2.3
0 –2
2.84
–1
3.87
0.
00
0.00
a m
embe
rs o
f th
e ac
id (
Ax)
and
bas
e (B
x) p
airs
, lit
erat
ure
pKa
valu
es (
from
ref
15
in c
ase
of a
cids
and
fro
m r
ef 4
1 in
cas
e of
bas
es u
nles
s sp
ecif
ied
othe
rwis
e) i
n br
acke
ts f
ollo
win
g co
mpo
und
nam
e an
d nu
mbe
r. b t
he a
ppro
xim
ate
unce
rtai
nty
of w
ater
con
tent
det
erm
inat
ion
is c
a ±
5 pp
m i
n th
e m
iddl
e ra
nge
and
ca ±
2 p
pm i
n th
e lo
w r
ange
; c ∆
pKa_
exp
deno
tes
expe
rim
enta
lly d
eter
min
ed r
elat
ive
acid
ity
∆pK
a_ex
p= p
Ka(
HA
2)-p
Ka(
HA
1).
d exp
erim
enta
l st
anda
rd d
evia
tion
of ∆
pKa
allo
ws
eval
uatin
g th
e w
ithin
-ser
ies
agre
emen
t of
∆pK
a va
lues
. e chan
ge i
n pK
a un
its
com
pare
d to
the
dri
est
solv
ent
for
that
aci
d pa
ir, f C
orre
cted
com
puta
tion
al ∆
pKa v
alue
s (Δ
pKa_
corr=Δ
pKa_
calc
i -ΔpK
a_ca
lc0 +Δ
pKa_
exp0 , 0
indi
cate
s th
e dr
iest
sol
vent
use
d); g c
alcu
late
d G
ibbs
fre
e en
ergi
es o
f so
lvat
ion
with
CO
SMO
ther
m u
sing
the
defa
ult
proc
edur
e; h Δ
Gso
lvco
rr =
(G
solv
anio
n/ne
utra
li – G
solv
neut
ral/
catio
ni ) –
(Gso
lvan
ion/
neut
ral0 –
Gso
lvne
utra
l/ca
tion
0 ), j ca
lcul
ated
usi
ng r
esul
ts f
rom
pai
r j
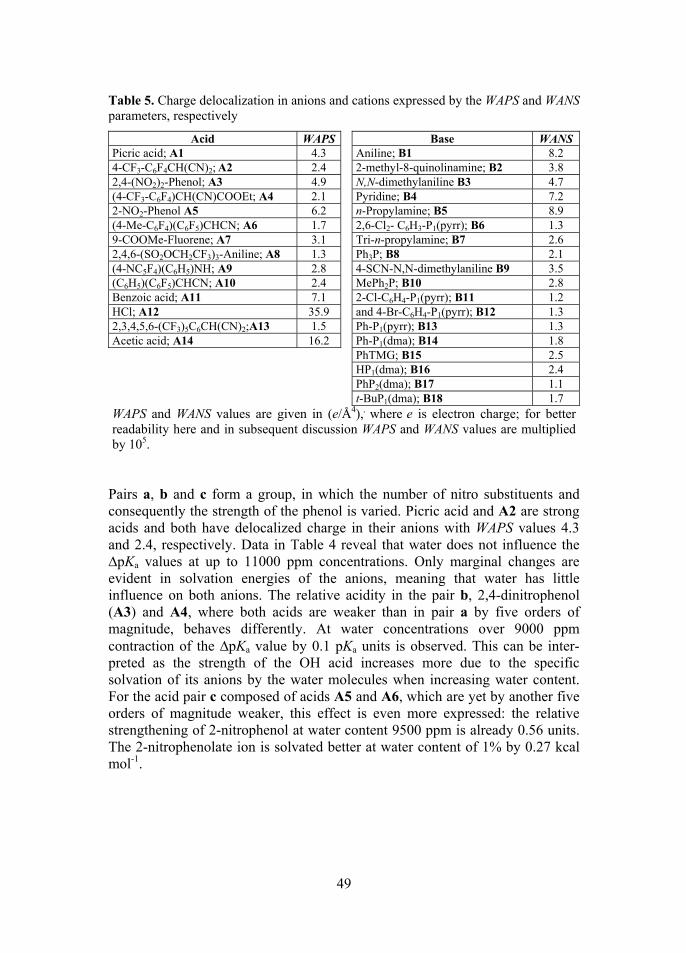
49
Table 5. Charge delocalization in anions and cations expressed by the WAPS and WANS parameters, respectively
Acid WAPS Base WANS Picric acid; A1 4.3 Aniline; B1 8.2 4-CF3-C6F4CH(CN)2; A2 2.4 2-methyl-8-quinolinamine; B2 3.8 2,4-(NO2)2-Phenol; A3 4.9 N,N-dimethylaniline B3 4.7 (4-CF3-C6F4)CH(CN)COOEt; A4 2.1 Pyridine; B4 7.2 2-NO2-Phenol A5 6.2 n-Propylamine; B5 8.9 (4-Me-C6F4)(C6F5)CHCN; A6 1.7 2,6-Cl2- C6H3-P1(pyrr); B6 1.3 9-COOMe-Fluorene; A7 3.1 Tri-n-propylamine; B7 2.6 2,4,6-(SO2OCH2CF3)3-Aniline; A8 1.3 Ph3P; B8 2.1 (4-NC5F4)(C6H5)NH; A9 2.8 4-SCN-N,N-dimethylaniline B9 3.5 (C6H5)(C6F5)CHCN; A10 2.4 MePh2P; B10 2.8 Benzoic acid; A11 7.1 2-Cl-C6H4-P1(pyrr); B11 1.2 HCl; A12 35.9 and 4-Br-C6H4-P1(pyrr); B12 1.3 2,3,4,5,6-(CF3)5C6CH(CN)2;A13 1.5 Ph-P1(pyrr); B13 1.3 Acetic acid; A14 16.2 Ph-P1(dma); B14 1.8
PhTMG; B15 2.5 HP1(dma); B16 2.4 PhP2(dma); B17 1.1 t-BuP1(dma); B18 1.7
WAPS and WANS values are given in (e/Å4),, where e is electron charge; for better readability here and in subsequent discussion WAPS and WANS values are multiplied by 105.
Pairs a, b and c form a group, in which the number of nitro substituents and consequently the strength of the phenol is varied. Picric acid and A2 are strong acids and both have delocalized charge in their anions with WAPS values 4.3 and 2.4, respectively. Data in Table 4 reveal that water does not influence the ∆pKa values at up to 11000 ppm concentrations. Only marginal changes are evident in solvation energies of the anions, meaning that water has little influence on both anions. The relative acidity in the pair b, 2,4-dinitrophenol (A3) and A4, where both acids are weaker than in pair a by five orders of magnitude, behaves differently. At water concentrations over 9000 ppm contraction of the ∆pKa value by 0.1 pKa units is observed. This can be inter-preted as the strength of the OH acid increases more due to the specific solvation of its anions by the water molecules when increasing water content. For the acid pair c composed of acids A5 and A6, which are yet by another five orders of magnitude weaker, this effect is even more expressed: the relative strengthening of 2-nitrophenol at water content 9500 ppm is already 0.56 units. The 2-nitrophenolate ion is solvated better at water content of 1% by 0.27 kcal mol-1.
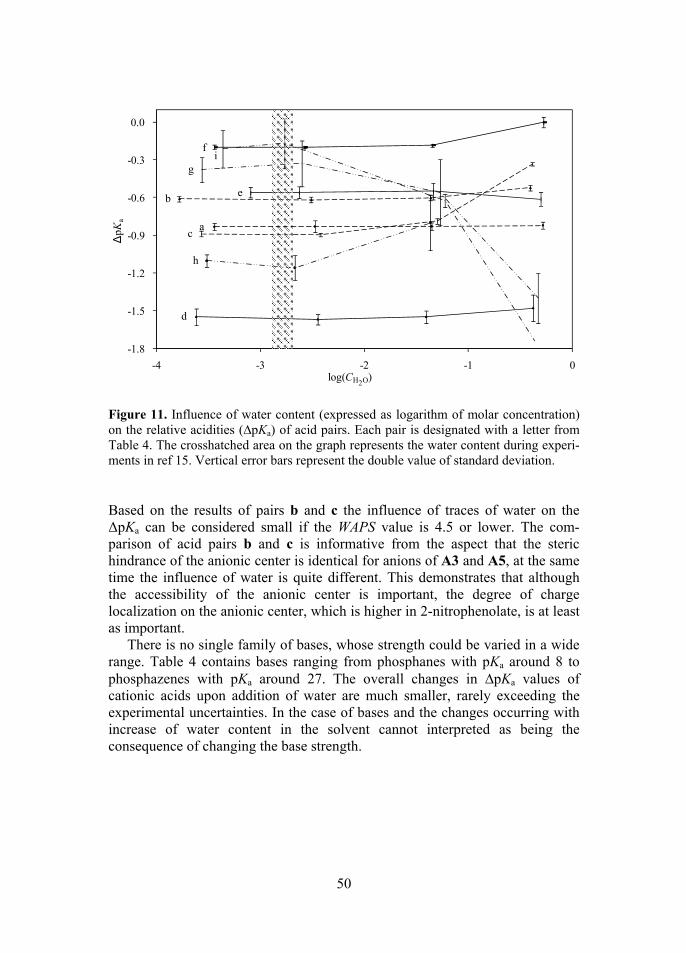
50
Figure 11. Influence of water content (expressed as logarithm of molar concentration) on the relative acidities (∆pKa) of acid pairs. Each pair is designated with a letter from Table 4. The crosshatched area on the graph represents the water content during experi-ments in ref 15. Vertical error bars represent the double value of standard deviation. Based on the results of pairs b and c the influence of traces of water on the ΔpKa can be considered small if the WAPS value is 4.5 or lower. The com-parison of acid pairs b and c is informative from the aspect that the steric hindrance of the anionic center is identical for anions of A3 and A5, at the same time the influence of water is quite different. This demonstrates that although the accessibility of the anionic center is important, the degree of charge localization on the anionic center, which is higher in 2-nitrophenolate, is at least as important.
There is no single family of bases, whose strength could be varied in a wide range. Table 4 contains bases ranging from phosphanes with pKa around 8 to phosphazenes with pKa around 27. The overall changes in ∆pKa values of cationic acids upon addition of water are much smaller, rarely exceeding the experimental uncertainties. In the case of bases and the changes occurring with increase of water content in the solvent cannot interpreted as being the consequence of changing the base strength.
-1.8
-1.5
-1.2
-0.9
-0.6
-0.3
0.0
-4 -3 -2 -1 0
ΔpK
a
log(CH2O)
fi
b e
g
d
h
ca
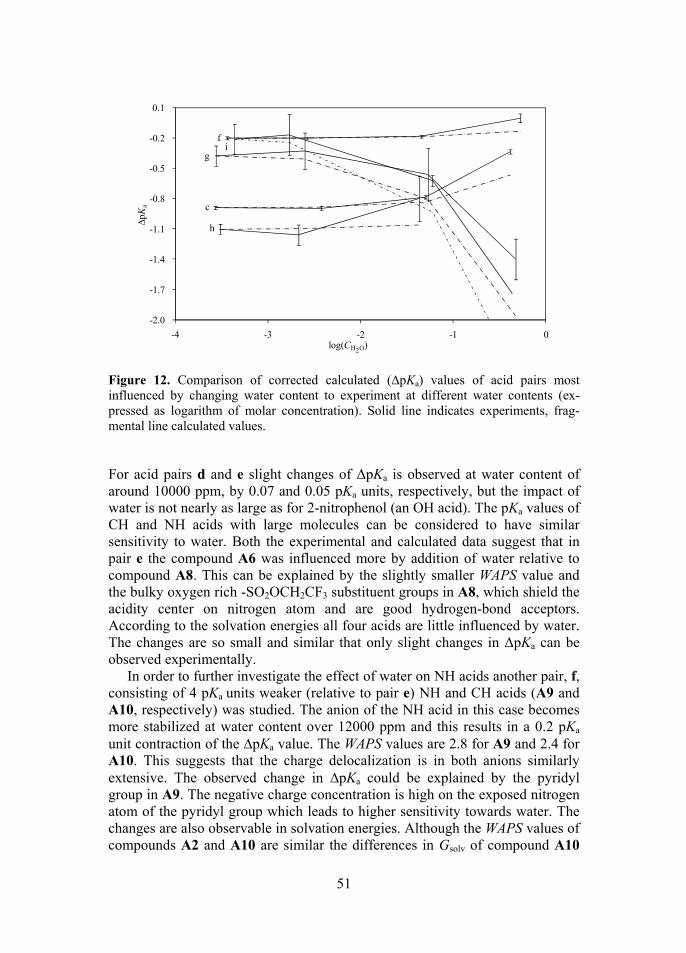
51
Figure 12. Comparison of corrected calculated (∆pKa) values of acid pairs most influenced by changing water content to experiment at different water contents (ex-pressed as logarithm of molar concentration). Solid line indicates experiments, frag-mental line calculated values. For acid pairs d and e slight changes of ΔpKa is observed at water content of around 10000 ppm, by 0.07 and 0.05 pKa units, respectively, but the impact of water is not nearly as large as for 2-nitrophenol (an OH acid). The pKa values of CH and NH acids with large molecules can be considered to have similar sensitivity to water. Both the experimental and calculated data suggest that in pair e the compound A6 was influenced more by addition of water relative to compound A8. This can be explained by the slightly smaller WAPS value and the bulky oxygen rich -SO2OCH2CF3 substituent groups in A8, which shield the acidity center on nitrogen atom and are good hydrogen-bond acceptors. According to the solvation energies all four acids are little influenced by water. The changes are so small and similar that only slight changes in ΔpKa can be observed experimentally.
In order to further investigate the effect of water on NH acids another pair, f, consisting of 4 pKa units weaker (relative to pair e) NH and CH acids (A9 and A10, respectively) was studied. The anion of the NH acid in this case becomes more stabilized at water content over 12000 ppm and this results in a 0.2 pKa unit contraction of the ∆pKa value. The WAPS values are 2.8 for A9 and 2.4 for A10. This suggests that the charge delocalization is in both anions similarly extensive. The observed change in ∆pKa could be explained by the pyridyl group in A9. The negative charge concentration is high on the exposed nitrogen atom of the pyridyl group which leads to higher sensitivity towards water. The changes are also observable in solvation energies. Although the WAPS values of compounds A2 and A10 are similar the differences in Gsolv of compound A10
-2.0
-1.7
-1.4
-1.1
-0.8
-0.5
-0.2
0.1
-4 -3 -2 -1 0
ΔpK
a
log(CH2O)
h
c
gi
f
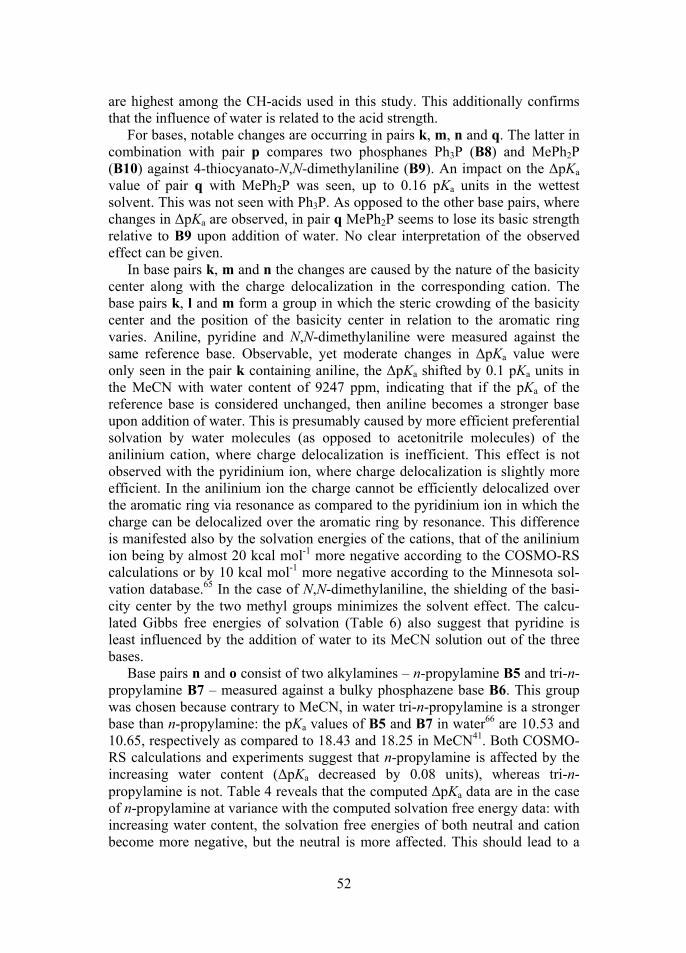
52
are highest among the CH-acids used in this study. This additionally confirms that the influence of water is related to the acid strength.
For bases, notable changes are occurring in pairs k, m, n and q. The latter in combination with pair p compares two phosphanes Ph3P (B8) and MePh2P (B10) against 4-thiocyanato-N,N-dimethylaniline (B9). An impact on the ΔpKa value of pair q with MePh2P was seen, up to 0.16 pKa units in the wettest solvent. This was not seen with Ph3P. As opposed to the other base pairs, where changes in ΔpKa are observed, in pair q MePh2P seems to lose its basic strength relative to B9 upon addition of water. No clear interpretation of the observed effect can be given.
In base pairs k, m and n the changes are caused by the nature of the basicity center along with the charge delocalization in the corresponding cation. The base pairs k, l and m form a group in which the steric crowding of the basicity center and the position of the basicity center in relation to the aromatic ring varies. Aniline, pyridine and N,N-dimethylaniline were measured against the same reference base. Observable, yet moderate changes in ΔpKa value were only seen in the pair k containing aniline, the ΔpKa shifted by 0.1 pKa units in the MeCN with water content of 9247 ppm, indicating that if the pKa of the reference base is considered unchanged, then aniline becomes a stronger base upon addition of water. This is presumably caused by more efficient preferential solvation by water molecules (as opposed to acetonitrile molecules) of the anilinium cation, where charge delocalization is inefficient. This effect is not observed with the pyridinium ion, where charge delocalization is slightly more efficient. In the anilinium ion the charge cannot be efficiently delocalized over the aromatic ring via resonance as compared to the pyridinium ion in which the charge can be delocalized over the aromatic ring by resonance. This difference is manifested also by the solvation energies of the cations, that of the anilinium ion being by almost 20 kcal mol-1 more negative according to the COSMO-RS calculations or by 10 kcal mol-1 more negative according to the Minnesota sol-vation database.65 In the case of N,N-dimethylaniline, the shielding of the basi-city center by the two methyl groups minimizes the solvent effect. The calcu-lated Gibbs free energies of solvation (Table 6) also suggest that pyridine is least influenced by the addition of water to its MeCN solution out of the three bases.
Base pairs n and o consist of two alkylamines – n-propylamine B5 and tri-n-propylamine B7 – measured against a bulky phosphazene base B6. This group was chosen because contrary to MeCN, in water tri-n-propylamine is a stronger base than n-propylamine: the pKa values of B5 and B7 in water66 are 10.53 and 10.65, respectively as compared to 18.43 and 18.25 in MeCN41. Both COSMO-RS calculations and experiments suggest that n-propylamine is affected by the increasing water content (ΔpKa decreased by 0.08 units), whereas tri-n-propylamine is not. Table 4 reveals that the computed ∆pKa data are in the case of n-propylamine at variance with the computed solvation free energy data: with increasing water content, the solvation free energies of both neutral and cation become more negative, but the neutral is more affected. This should lead to a
53
decrease of basicity, but the opposite is observed. The WANS value of 2.59 for tri-n-propylammonium cation indicates a far better charge delocalization compared to n-propylammonium ion (WANS 8.89).
The influence of charge delocalization is dramatically more noticeable in the case of acids. The series with nitrophenols can be considered as the first indi-cation of that, but in phenolate ions resonance stabilization considerably facili-tates charge delocalization. Resonance stabilization is absent if the carboxyl group is deprotonated, i.e. in benzoic acid, which is investigated in pair g. To further look into the dependence of charge delocalization, acetic acid along with hydrochloric acid were included into the study.
For benzoic acid (A11), which was measured against compound A6, the impact of water was severe. Its relative strength increased by 0.19 units at water content of 1000 ppm and by 1.03 units at 10000 ppm. This is easily interpreted: negative charge in benzoate anion is only weakly delocalized into the aromatic ring, because only the field-inductive effect is operational. This leads to quite high WAPS value of 7.1. The charge is concentrated on the two exposed oxygen atoms of the carboxylate group, which are good hydrogen bond acceptors. Water molecules form easily hydrogen bonds with the COO– group providing significant stabilization that acetonitrile molecules are unable to provide. In the anion of 2-nitrophenol (A5) the charge is delocalized more to the aromatic ring and to the nitro group. The hydrogen bonds formed are therefore weaker. This is supported by the difference in energetic effects of solvation of benzoic acid and 2-nitrophenol. The ∆Gsolv values -1.36 and -0.29, respectively.
For the pair h the ∆pKa value at water content around 1000 ppm in Table 4 is not fully accurate (the ∆pKa value should actually be larger). This is because the neutral form of the acid A13 could not be observed in the solution with high water content. The spectral data suggest that a large fraction of the acidic titrant was consumed for protonating water. It was impossible to take this effect into account due to the fact that HCl is an acid transparent in the UV region. The experiment at water content around 10000 ppm was also carried out but the protonation of water was so extensive that getting even near the protonated forms of the acids was impossible and the attempts to calculate the ∆pKa were unsuccessful. Spectra of neutral form from drier solvents can be used to calculate ∆pKa if both of the studied compounds have spectra in UV-Vis region. The gathered data for pair h suggest that the behavior of HCl is similar to weaker OH-acids: the low water content (<100 ppm) does not influence the determination of ∆pKa values, but the impact is clearly visible at higher concentrations of water. Here the impact is large due to the lack of charge distribution in the single-atom chloride anion. According to the WAPS value (and not unexpectedly from the viewpoint of chemical intuition) Cl– is the most charge-localized anion in this study. The effect of water on HCl is nevertheless not as large as on acetic acid (see below) according to the experiments, also, the computations do not seem to predict the effect. Two possible reasons are: (1) the atomic radius of chlorine is higher than oxygen and (2) COSMO-RS is known to display below-average accuracy in describing monoatomic ions67.
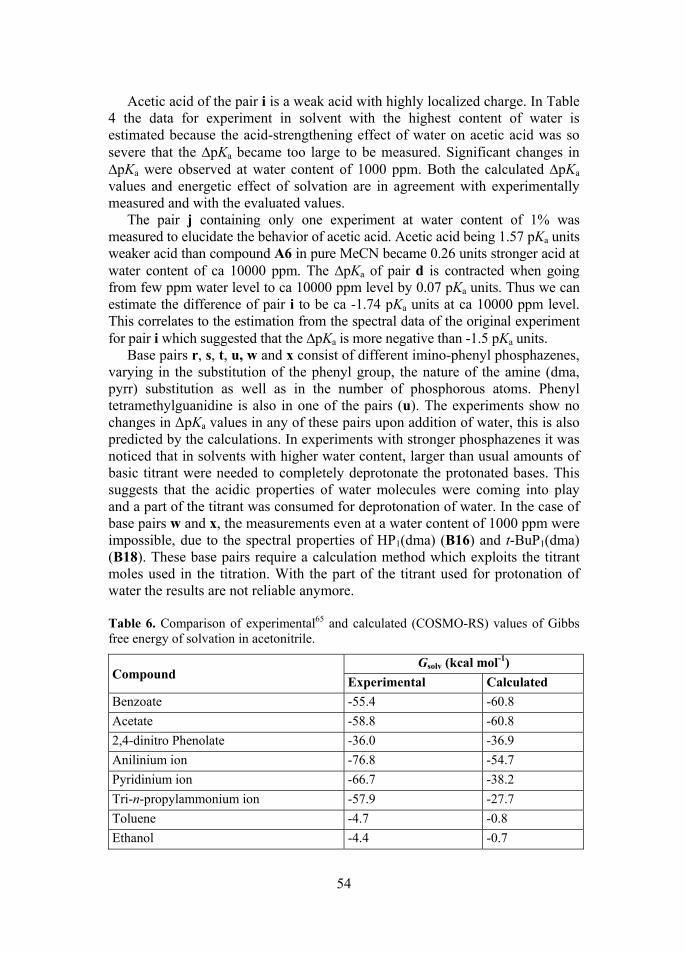
54
Acetic acid of the pair i is a weak acid with highly localized charge. In Table 4 the data for experiment in solvent with the highest content of water is estimated because the acid-strengthening effect of water on acetic acid was so severe that the ∆pKa became too large to be measured. Significant changes in ∆pKa were observed at water content of 1000 ppm. Both the calculated ∆pKa values and energetic effect of solvation are in agreement with experimentally measured and with the evaluated values.
The pair j containing only one experiment at water content of 1% was measured to elucidate the behavior of acetic acid. Acetic acid being 1.57 pKa units weaker acid than compound A6 in pure MeCN became 0.26 units stronger acid at water content of ca 10000 ppm. The ∆pKa of pair d is contracted when going from few ppm water level to ca 10000 ppm level by 0.07 pKa units. Thus we can estimate the difference of pair i to be ca -1.74 pKa units at ca 10000 ppm level. This correlates to the estimation from the spectral data of the original experiment for pair i which suggested that the ∆pKa is more negative than -1.5 pKa units.
Base pairs r, s, t, u, w and x consist of different imino-phenyl phosphazenes, varying in the substitution of the phenyl group, the nature of the amine (dma, pyrr) substitution as well as in the number of phosphorous atoms. Phenyl tetramethylguanidine is also in one of the pairs (u). The experiments show no changes in ΔpKa values in any of these pairs upon addition of water, this is also predicted by the calculations. In experiments with stronger phosphazenes it was noticed that in solvents with higher water content, larger than usual amounts of basic titrant were needed to completely deprotonate the protonated bases. This suggests that the acidic properties of water molecules were coming into play and a part of the titrant was consumed for deprotonation of water. In the case of base pairs w and x, the measurements even at a water content of 1000 ppm were impossible, due to the spectral properties of HP1(dma) (B16) and t-BuP1(dma) (B18). These base pairs require a calculation method which exploits the titrant moles used in the titration. With the part of the titrant used for protonation of water the results are not reliable anymore. Table 6. Comparison of experimental65 and calculated (COSMO-RS) values of Gibbs free energy of solvation in acetonitrile.
Compound Gsolv (kcal mol-1)
Experimental Calculated
Benzoate -55.4 -60.8
Acetate -58.8 -60.8
2,4-dinitro Phenolate -36.0 -36.9
Anilinium ion -76.8 -54.7
Pyridinium ion -66.7 -38.2
Tri-n-propylammonium ion -57.9 -27.7
Toluene -4.7 -0.8
Ethanol -4.4 -0.7
55
The last six columns of Table 4 present the COSMO-RS computational estimates of Gibbs free energies of solvation of the different species of acid and base pairs. In order to put these calculated values into a perspective compared to experimental values, a comparison is presented in Table 6 for species, for which experimental solvation free energies in acetonitrile are available. It can be seen that the trends are more or less reproduced, but the absolute values differ very strongly between experiments and computations.
The influence of water on the solvation of acid anions is very strong, for acetate ion the solvation free energy becomes more negative by 2.0 kcal mol-1 according to calculations. The influence of water on the solvation of neutral acids is, on the other hand, almost negligible. For protonated bases the influence of water on solvation energies does not exceed 0.14 kcal mol-1. On the other hand, the influence of water on the solvation energies of free bases is often almost the same and in some cases even exceeds that of the cations (n-propylamine, phenyl tetramethylguanidine, Ph3P, MePh2P, 4-Br-C6H4-P1(pyrr), Ph-P1(pyrr), tripropylamine). In the base pair n, the calculations of the Gibbs free energies of solvation suggest that the changes in pKa of n-propylammonium ion are caused by the increase of the solvation free energy of the neutral species. In the pair k, the changes of the solvation of the cation are responsible for the shift in the ΔpKa value.
The absolute values of solvation free energies of cations are, as expected, significantly higher than those of the neutral bases. It can be seen that the Gsolv values of the phosphazenium cations with efficiently delocalized charge (protonated forms of B6, B11, B12, B13, B14, B16, B17, B18, B19, B20) are mostly in the range of -20 to -30 kcal mol-1. In all these cations stabilization by hydrogen bonding is virtually impossible because of steric reasons. Also protonated tri-n-propylamine and protonated phosphanes fall into this group. The solvation energies of cations with a single sterically unshielded N-H bond, capable of donating one hydrogen bond, are around -35 to -38 kcal mol-1 (pyridinium and N,N-dimethylanilinium). The solvation energies of cations able to donate (at least in theory) up to three hydrogen bonds are in the region of -52 to -55 kcal mol-1. A notable deviation from this picture is displayed by 4-thiocyanato-N,N-dimethylanilinium with Gsolv = -50 kcal mol-1. It is unclear whether this deviation is caused by the high polarizability of the SCN substituent or by limitations of the COSMO-RS procedure.
3.4. Guidelines for experiments
Based on the obtained knowledge of the influence of water content, recom-mendations can be given, which should be valid also in other non-aqueous solvents. The water content below 100 ppm is acceptable in a polar solvent, such as MeCN, for acids and bases in the medium pKa range (11–20 in acetonitrile) water content slightly higher, but not exceeding 1000 ppm is still tolerable. In apolar media (e.g. 1,2-dichloroethane) small polar, especially ionic,
56
solutes are expected to be strongly preferentially solvated by the available water molecules and therefore the water content should be kept as low as possible (below 10 ppm for relative pKa measurements). Operating at the edges of acidity/basicity scales, where acid-base properties of water come into play, the water content should be also as low as possible, because water strongly hinders the full deprotonation/protonation of the studied compounds, as was the case for acid pair h and base pairs w and x.
Our experience is that if all the manipulations with compounds and solvent (including solution preparation) are made in an inert-gas glovebox (less than 1 ppm water level in the argon gas atmosphere) and the glassware is dried in drying oven for 12 hours at 150 °C then the residual water content of ultra-dry (specified water content by manufacturer is less than 50 ppm) UV-grade acetonitrile is taken down below 10 ppm by keeping the solvent on 3 Å granulated molecular sieves for at least 20 hours. Storage of this solvent on molecular sieves for at least 20 hours will not change its spectral properties in the UV range. One should consider that for removing water from the solvent having a higher initial water content, a different solvent treatment approach (changing the molecular sieves several times, combining with other water removal techniques, etc) may be needed and this may alter the spectral properties in the UV-Vis range (i.e. possible increase of absorbance) or intro-ducing impurities involved in the acidic-basic equilibrium into the solvent.
In the case of pKa measurements, experimental techniques, that allow the direct observation of studied compound(s), are recommended. In this way the protonation/deprotonation process is monitored and possible competing equilibria can be detected and taken into account if needed.

57
SUMMARY
This thesis is focused on solvent characteristics, that influence the pKa measure-ments in non-aqueous media and is divided into two major sections. First pKa measurements for two sets of compounds are carried out revealing the im-portance of knowledge of solvent properties in order to achieve accurate and reliable results. In the second section the influence of the most frequent impu-rity, water, in non-aqueous solvents is systematically investigated at impurity levels for both acids and bases on the example of acetonitrile.
pKa values of 13 chiral acid catalysts, based on phosphonic acid and its esters are measured in acetonitrile. The results confirm the previous empirical assumption, that the catalytic activity is correlated to the acidity of the com-pounds. Furthermore the results reveal, that pKa values of similar compounds reported by another research group in DMSO may contain errors. This discrepancy is investigated and discussed in detail and evidence is presented in favor of the results of this work .
Another set of compounds, triarylphosphanes, a part of a Frustrated Lewis Pair catalyst system, have been investigated. pKa values of 10 such compounds have been measured in acetonitrile. The very low basicity (exceeding the scope on MeCN) of one of the compounds, as well as insolubility of another in MeCN, meant that in order to get comparable values in MeCN, these two com-pounds had to be measured in 1,2-dichloroethane. In order to predict the pKa values in MeCN using correlations, a basicity scale, spanning 7 orders of magnitude, was constructed in DCE. Once again the results of the pKa measure-ments help to rationalize the observed catalytic activity of the corresponding catalytic system.
In the second part of the thesis, the influence of water, at low concentration, below 1% (w/w), is systematically studied on the relative acidities and basi-cities. It is quantitatively shown, that acids are much more influenced by the in-crease of water content in solvent, compared to bases. Higher impacts are observed in case of acids and bases with localized charges in corresponding ions. In order to quantify the charge delocalization in ions, two computational parameters WAPS (for anions) and WANS (for cations) are proposed. The strength of the acids as well as the nature of acidity center is shown to affect the changes in relative acidity upon increase of water content.
The results of this thesis help to improve and fine-tune catalytic systems, as the pKa values of the involved compounds have been reliably measured. The quantification of influence of impurity levels of water allows evaluation of the already published acidity and basicity data as well as plan future experiments. The results are also helpful for those chemists who rely on the acidity or basi-city data of their reactants or catalysts but now, in some cases, can avoid the costly and time-consuming solvent purification step.

58
SUMMARY IN ESTONIAN
Happelisus ja aluselisus mittevesikeskkondades: solvendi omaduste ja puhtuse mõju
Väitekiri keskendub solventide parameetritele, mis mõjutavad pKa mõõtmisi mitte-vesikeskkondades. Väitekiri on jagatud kahte ossa, kus esimeses käsitle-takse kahe komplekti ainete pKa mõõtmisi, mis ilmestavad vajadust teada solvendi parameetreid, et jõuda täpsete ja usaldusväärsete tulemusteni. Teises osas uuritakse süstemaatiliselt mitte-vesikeskkondades kõige levinuma lisandi, vee, mõju nii hapete kui ka aluste suhtelisele tugevusele atsetonitriili keskkonna näitel.
Mõõdeti 13 fosfoonhapetel ja nende estritel põhineva kiraalse happelise katalüsaatori pKa väärtused atsetonitriilis. Tulemused kinnitavad eelnenud kogemuslikke arvamusi, et nende katalüsaatorite katalüütiline aktiivsus sõltub nende happelisusest. Lisaks leiti, et uuringu käigus teise uurimisgrupi poolt avaldatud pKa väärtused sarnastele ühenditele DMSO keskkonnas võivad olla märgatava veaga. Leitud lahknevusi uuriti põhjalikult ja näidati võimalikud vea allikad ning esitati tõendusmaterjal käesolevas töös saadud pKa väärtuste kasuks.
Teiseks ainete komplektiks olid triarüülfosfaanid, mida kasutakse osana frustrueeritud Lewise paari katalüsaatori süsteemis. Mõõdeti kümne sellise ühendi pKa väärtused atsetonitriilis. Ühe ühendi väga madal aluselisus, ja teise mittelahustumine atsetonitriilis, tingis vajaduse neid aineid mõõta 1,2-dikloroetaanis (DCE). Selleks, et DCE andmetest oleks võimalik ennustada MeCN andmeid konstrueeriti esmakordselt DCE-s 7 suurusjärku hõlmav aluselisuse skaala. Saadud tulemused aitavad selgitada uuritud katalüütilise süsteemi aktiivsust.
Väitekirja teises osas uuriti väga madalate veesisalduste (alla 1%) mõju hapete ja aluste suhtelisele tugevusele. Kvantitatiivselt näidati, et happed on tõusva veesisalduse suhtes tundlikumad kui alused. Suurimad muutused mõõdetud suhteliste happelisuste ja aluseliste juures ilmnesid ainetel, mille ioonides on laeng lokaliseeritud. Laengu delokalisatsiooni hindamiseks pakuti välja kaks arvutuslikku parameetrit: WAPS (anioonidele) ja WANS (katioonidele). Hapete puhul sõltub veesisalduse mõju ka hapete tugevusest ja happelise tsentri iseloomust.
Käesolevas väitekirjas avaldatud tulemused aitavad parendada uuritud katalüsaatoreid, sest nende happelis-aluselised omadused on nüüd usaldus-väärselt mõõdetud. Madalate veesisalduste mõju kvantifitseerimine annab võimaluse hinnata juba avaldatud andmete usaldusväärsust ja planeerida tulevasi eksperimente. Samuti on nüüd võimalik keemikutel, kes oma uurin-gutes pKa väärtustele tuginevad vältida kalleid ja ajamahukaid solvendi puhastamise etappe, kui on teada, et mõnel juhul kasutatavate ainete happelis-aluselised omadused solvendi lisandite mõjul oluliselt ei muutu.
59
REFERENCES
1. Reed, C. A. Acc. Chem. Res., 2013, 46, 2567–2575. 2. Reichardt, C. Solvents and Solvent Effects in Organic Chemistry, 3rd ed.; VCH:
Weinheim, 2003. 3. Reijenga, J.; van Hoof, A.; van Loon, A.; Teunissen, B. Anal Chem Insights.,
2013, 8, 53–71. 4. Izutsu, K. Electrochemistry in Nonaqueous Solutions, 2nd ed.; Wiley-VCH,
Weinheim, 2009. 5. Leito, I.; Rodima, T.; Koppel, I.A.; Schwesinger, R.; Vlasov, V.M. J. Org. Chem.,
1997, 62, 8479–8483. 6. Kütt, A.; Rodima, T.; Saame, J.;Raamat, E.; Mäemets, V.; Kaljurand, I.; Koppel,
I.A.; Garlyauskayte, R.Y.; Yagupolskii, Y.L.; Yagupolskii, L.M.; Bernhardt, E.; Willner, H.; Leito, I. J. Org. Chem., 2011, 76, 391–395.
7. Coetzee, J. F.; Padmanabhan, G. R.; Cunningham, G. P. Talanta, 1964, 11, 93–103.
8. Marcus, Y. Solvent Mixtures: Properties and Selective Solvation, Marcel Dekker: New York, 2002.
9. Kamlet, M. J.; Abboud, J.-L. M.; Taft, R. W. Prog. Phys. Org. Chem., 1981, 13, 485−630.
10. Guttmann, V. Coordination Chemistry in Non-Aqueous Solutions, Springer, Wien, New York, 1968.
11. Guttmann, V. Coord. Chem. Rev., 1976, 18, 225–255. 12. Bartmess, J. E. Negative Ion Energetics Data; Mallard, W. G.; Linstrom, P. J.,
Eds.; NIST Standard reference Database Number 69, August 1997, National Institute of Standards and Technology, Gaithersburg MD, 20899
(http://webbook.nist.gov). 13. Kortüm, G.; Vogel, W.; Andrussov, K. Dissotziationskonstanten Organischen
Säuren in wasseriger Lösung. London, Butterworths, 1961. 14. Kamlet, M. J.; Abboud, J.-L. M.; Abraham, M. H.; Taft, R. W. J. Org. Chem.,
1983, 48, 2877–2887. 15. Kütt, A.; Leito, I.; Kaljurand, I.; Sooväli, L.; Vlasov, V. M.; Yagupolskii, L. M.;
Koppel, I. A. J. Org. Chem., 2006, 71, 2829–2838. 16. Kolthoff, I. M.; Chantooni, M. K. J. Phys. Chem., 1968, 72, 2270–2272. 17. Bernasconi, C. M.; Leyes, A. E.; Ragains, M. L.; Shi, Y.; Wang, H.; Wulff, W. D.
J. Am. Chem. Soc., 1998, 120, 8632−8639. 18. Perrin, D. D. Dissociation Constants of Organic Bases in Aqueous Solution:
Published as a Supplement to Pure and Applied Chemistry, Butterworth, London, 1965.
19. Palm, V. Tables of Rate and Equilibrium Constants of Heterolytic Organic Reactions, VINITI: Moscow-Tartu, 1975–1985.
20. Blandamer, M. J.; Engberts, J. B. F. N.; Gleeson, P. T.; Reis, J. C. R. Chem. Soc. Rev., 2005, 34, 440–458.
21. Marcus, Y. J. Phys. Org. Chem., 2012, 25, 1072–1085. 22. El Seoud, O., A. Pure Appl. Chem., 2009, 81, 4, 697–707. 23. Espinosa, S.; Bosch, E.; Rosés, M. Anal. Chim. Acta., 2002, 454, 157–166. 24. Rived, F.; Canals, I.; Bosch, E.; Rosés, M. Anal. Chim. Acta. 2001, 439, 315–333. 25. Völgyi, G.; Ruiz, R.; Box, K.; Comer, J.; Bosch, E.; Takács-Novák, K.; Anal.
Chim Acta, 2007, 583, 418–428.
60
26. Kolthoff, I. M.; Chantooni, M. K. Jr. J. Am. Chem. Soc., 1969, 81, 6907–6910. 27. Rondini, S. Anal. Bioanal. Chem., 2002, 374, 813–816. 28. Ho, J.; Coote, M. L. Theor. Chem. Acc., 2010, 125, 3–21. 29. Hansch, C.; Leo, A.; Taft, R. W. Chem. Rev., 1991, 91, 165–195. 30. Taft, R. W.; Topsom, R. D. Prog. Phys. Org. Chem., 1987, 16, 1–83. 31. Perrin, D. D.; Dempsey, B.; Serjeant, E. P. pKa Prediction for Organic Acids and
Bases, Chapman & Hall, London, UK, 1981. 32. Cramer, C., J. Essentials of Computational Chemistry: Theories and Models; John
Wiley & Sons, Ltd: Chichester, England, 2003. 33. Cossi, M.; Scalmani, G.; Rega, N.; Barone, V. J. Chem. Phys., 2002, 117, 43–54. 34. Marenich, A. V.; Cramer, C. J.; Truhlar, D. G. J. Phys. Chem. B, 2009, 113, 6378–
6396. 35. Klamt, A. COSMO-RS: From Quantum Chemistry to Fluid Phase Thermo-
dynamics and Drug Design; Elsevier Science Ltd: Amsterdam, The Netherlands, 2005.
36. Klamt, A.; Schüürmann, G. J. Chem. Soc. Perkin Trans.2, 1993, 799–805. 37. Eckert, F.; Leito, I.; Kaljurand, I.; Kütt, A.; Klamt, A.; Diedenhofen, M. J.
Comput. Chem., 2009, 30, 799–810. 38. Klamt, A.; Eckert, F. J. Comput. Chem., 2006, 27, 11–19. 39. Kütt, A.; Movchun, V.; Rodima, T.; Dansauer, T.; Rusanov, E.; Leito, I.;
Kaljurand, I.; Koppel, J.; Pihl, V.; Koppel, I.; Ovsjannikov, G.; Toom, L.; Mishima, M.; Medebielle, M.; Lork, E.; Röschenthaler, G.-V.; Koppel, I. A.; Kolomeitsev, A. A. J. Org. Chem., 2008, 73, 2607–2620.
40. Leito, I.; Raamat, E.; Kütt, A.; Saame, J.; Kipper, K.; Koppel, I. A.; Koppel, I.; Zhang, M.; Mishima, M.; Yagupolskii, L.M.; Garlyauskayte, S. Yu.; Filatov, A. A. J. Phys. Chem. A, 2009, 113, 8421–8424.
41. Kaljurand, I.; Kütt, A.; Sooväli, L.; Rodima, T.; Mäemets, V.; Leito, I.; Koppel, I. A. J. Org. Chem., 2005, 70, 1019–1028.
42. Rõõm, E-I.; Kütt, A.; Kaljurand, I.; Koppel, I.; Leito, I.; Koppel, I. A.; Mishima, M.; Goto, K.; Miyahara, Y. Chem. Eur. J., 2007, 13, 7631–7643.
43. Kunetskiy, R. A.; Polyakova, S. M.; Vavrik, J.; Cisarova, I.; Saame, J.; Nerut, E. R.; Koppel, I.; Koppel, I.A.; Kütt, A.; Leito, I.; Lyapkalo, I. M. Chem. Eur. J., 2012, 18, 3621–3630.
44. Kaljurand, I.; Lilleorg, R.; Murumaa, A.; Mishima, M.; Burk, P.; Koppel, I.; Koppel, I. A.; Leito, I. J. Phys. Org. Chem., 2012, 26, 171–181.
45. Haav, K.; Saame, J.; Kütt, A.; Leito, I. Eur. J. Org. Chem. 2012, 11, 2167–2172. 46. Klamt, A.; Eckert, F.; Arlt, W. Annu. Rev. Chem. Biomol. Eng., 2010, 1, 101–122. 47. Ahlrichs, R.; Bär, M.; Baron, H.-P.; Bauernschmitt, R.; Böcker, S.; Ehrig, M.;
Eichkorn, K.; Elliott, S.; Furche, F.; Haase, F.; Häser, M.; Horn, H.; Hattig, C.; Huber, C.; Huniar, U.; Kattannek, M.; Köhn, M.; Kölmel, C.; Kollwitz, M.; May, K.; Ochsenfeld, C.; Öhm, H.; Schäfer, A.; Schneider, U.; Treutler, O.; von Arnim, M.; Weigend, F.; Weis, P.; Weiss, H. TURBOMOLE V 6.3, 2011.
48. Eckert, F.; Klamt, A. COSMOtherm, Version C3.0, Release 13.01; COSMOlogic GmbH&CoKG, Leverkusen, Germany, 2013;
Available at http://www.cosmologic.de/ 49. a) Garlyauskayte, R. Yu.; Chernega, A. N.; Michot, C.; Armand, M.; Yagupolskii,
Y. L.; Yagupolskii, L. M. Org. Biomol. Chem., 2005, 3, 2239–2243; b) Posternak, A. G.; Garlyauskayte, R. Yu.; Polovinko, V. V.; Yagupolskii, L. M.; Yagupolskii, Yu. L. Org. Biomol. Chem., 2009, 7, 1642–1645; c) Posternak, A. G.; Garlyauskayte, R. Yu.; Yagupolskii, L. M. Tetrahedron Lett., 2009, 50, 446–447.
61
50. Meister, J.; Schwarz, W., H., E J. Phys. Chem., 1994, 98, 8245–8252. 51. Reviews on Brønsted acid catalysis using phosphoric acid diesters: a) Akiyama,
T.; Itoh, J.; Fuchibe, K. Adv. Synth. Catal., 2006, 348, 999–1010; b) Akiyama, T. Chem. Rev. 2007, 107, 5744;a) Terada, M. Chem. Commun., 2008, 4097–4112; c) Terada, M. Synthesis, 2010, 1929; d) Terada, M. Bull. Chem. Soc. Jpn., 2010, 101–119; e) Rueping, M.; Sugiono, E.; Schoepke, F. R. Synlett,, 2010, 852–865; f) Zamfir, A. Schenker, S.; Freund, M.; Tsogoeva, S. B. Org. Biomol. Chem., 2010, 8, 5262–5676; g) Rueping, M.; Dufour, J.; Schoepke, F. R. Green Chem., 2011, 13, 1084–1105; h) Akiyama, T. J. Synth. Org. Chem. Jpn., 2011, 69, 913–925.
52. Nakashima, D.; Yamamoto, H. J. Am. Chem. Soc., 2006, 128, 9626–9627. 53. Rueping, M.; Nachtsheim, B. J.; Koenigs, R. M.; Ieawsuwan, W. Chem. Eur. J.,
2010, 44, 13116–13126. 54. Berkessel, A.; Christ, P.; Leconte, N.; Neudörfl, J-M.; Schäfer, M. Eur. J. Org.
Chem., 2010, 5165–5170. 55. Abboud, J.-L. M.; Notario, R. Pure Appl. Chem., 1999, 71, 645–718. 56. Rueping, M.; Nachtsheim, B. J.; Ieawsuwan, W. ; Atodiresei, I. Angew. Chem. Int.
Ed., 2011, 50, 6706–6720; b) Rueping, M.; Kuenkel, A.; Atodiresei, I. Chem. Soc. Rev., 2011, 40, 4539–4549.
57. Christ, P.; Lindsay, A.; Vormittag, S.; Neudörfl, J.; Berkessel, A.; O’Donoghue, A. Chem. Eur. J., 2011, 17, 8524–8528.
58. Koppel, I. A.; Koppel, J.; Pihl, V.; Leito, I.; Mishima, M.; Vlasov, V. M.; Yagupolskii, L. M.; Taft, R. W. J. Chem. Soc., Perkin Trans. 2, 2000, 6, 1125–1133.
59. Kolthoff, I. M.; Chantooni, J. K. Jr. J. Am. Chem. Soc., 1965, 87, 4428–4436. 60. Kolthoff, I. M.; Chantooni,, J. K. Jr.; Bhowmik, S. J. Am. Chem. Soc., 1968, 90,
23–28. 61. Yang, C.; Xue, X-S.; Li, X.; Cheng, J-P. J. Org. Chem., 2014, 79, 4340–4351. 62. Greb, L.; Ona-Burgos, P.; Schirmer, B.; Grimme, S.; Stephan D. W. Paradies, J.
Angew. Chem. Int. Ed., 2012, 51, 10164–10168. 63. Kempf, B.; Mayr, H. Chem. Eur. J., 2005, 11, 917–927. 64. Lindner, C.; Maryasin, B.; Richter, F.; Zipse, H. J. Phys. Org. Chem., 2010, 23,
1036–1042. 65. Marenich, A. V., Kelly, C. P., Thompson, J. D., Hawkins, G. D., Chambers, C. C.,
Giesen, D. J., Winget, P., Cramer, C. J., Truhlar, D. G. Minnesota Solvation Database – version 2012, University of Minnesota, Minneapolis.
66. Hall, H. K. Jr. J. Am. Chem. Soc., 1957, 79, 5441–5444. 67. Tshepelevitsh, S.; Oss, M.; Pung, A.; Leito, I. ChemPhysChem, 2013, 14, 1909–
1919.
62
ACKNOWLEDGEMENTS
First of all I would like to thank my parents for the opportunity to start and continue my studies, as well as Tõnis and my late grandfather Leo, who (along with my parents) induced the critical thinking in me throughout my childhood. There’s a saying that behind every great man is a great woman. Although I don’t consider myself “great” (yet), the woman behind me is Siiri.
I am very grateful to my supervisors, Ivo and Ivari, who have given me the chance to experience science at first hand, not only strictly limited to the subject of this thesis, but rather physical organic chemistry as a whole. From the first steps I took in the lab, you have given me your full support and explained in detail all questions I have had. I’d like to thank my co-workers Jaan, Kristjan, Tõiv, Agnes and Lauri for insightful conversations, along with my student Eno, whose questions have given me much to think about. These years have been enjoyable because I have had the pleasure to be working with such a good friend, thank you Anneli. I consider myself lucky to be a member of the Chair of Analytical Chemistry.
I am thankful for the influence that you had on me, Karolin. Finally I’d like to mention some of my friends who have been there for me:
Margus, Aivar, Liisi, Maia, Urmas, Nele, Mihkel, Piia, Jaanus, Tauri and Olga. Last but not least, every experiment and hour spent in the lab needs financial
support. The financial support for this work came from the Estonian Science Foundation Grants No 7374, 8162, 8689 and Graduate School „Functional materials and technologies“.

PUBLICATIONS
CURRICULUM VITAE
Name: Karl Kaupmees Born: November 7th 1985, Tallinn, Estonia E-mail: [email protected] Citizenship: Estonian Education: 2010–present University of Tartu, Ph.D student in Chemistry 2008–2010 University of Tartu, M.Sc (cum laude) in Analytical and
Physical Chemistry 2005–2008 University of Tartu, B.Sc in Analytical and Physical Chemistry 1993–2005 Tallinn German Gymnasium Professional Employment: 2010–present University of Tartu, Chemist Scientific publications: 1. Kaupmees, K.; Kaljurand, I.; Leito, I. Influence of water content on the
acidities in acetonitrile. Quantifying charge delocalization in anions. J. Phys. Chem. A, 2010, 114, 11788–11793.
2. Lipping, L.; Kütt, A.; Kaupmees, K.; Koppel, I.; Burk, P.; Leito, I.; Koppel, I. A. Acidity of Anilines: Calculations vs Experiment J. Phys. Chem. A, 2011, 115, 10335–10344.
3. Greb, L.; Tussing, S.; Schirmer, B.; Oña-Burgos, P.; Kaupmees, K.; Lõkov, M.; Leito, I.; Grimme, S.; Paradies, J. Electronic effects of triarylphosphines in metal-free hydrogen activation: a kinetic and compu-tational study. Chem. Sci., 2013, 4, 2788–2796.
4. Kaupmees, K.; Tolstoluzhsky, N.; Raja, S.; Rueping, M.; Leito, I. On the Acidity and Reactivity of Highly Effective Chiral Brønsted Acid Catalysts: Establishment of an Acidity Scale. Angew. Chem. Int. Ed., 2013, 52, 11569–11572.
5. Raamat, E.; Kaupmees, K.; Ovsjannikov, G.; Trummal, A.; Kütt, A.; Saame, J.; Koppel, I.; Kaljurand, I.; Lipping, L.; Rodima, T.; Pihl, V.; Koppel, I. A.; Leito, I. Acidities of strong neutral Brønsted acids in different media. J. Phys. Org. Chem., 2013, 26, 162–170.
6. Kruve, A.; Kaupmees, K.; Liigand, J.; Oss, M.; Leito, I. Sodium adduct formation efficiency in ESI source. J. Mass Spectrom., 2013, 48, 695–702.
7. Vazdar, K.; Kunetskiy, R.; Saame, J.; Kaupmees, K.; Leito, I.; Jahn, U. Very Strong Organosuperbases Formed by Combining Imidazole and Guanidine Bases: Synthesis, Structure, and Basicity Angew. Chem. Int. Ed., 2014, 53, 1435–1438.
117
118
8. Kruve, A.; Kaupmees, K.; Liigand, J.; Leito, I. Negative Electrospray Ionization via Deprotonation: Predicting the Ionization Efficiency. Anal. Chem., 2014, 86, 4822–4830.
9. Kaupmees, K.; Kaljurand, I.; Leito, I. Influence of water content on the basicities in acetonitrile. J. Sol. Chem., 2014, Accepted for Publication.
ELULOOKIRJELDUS
Nimi: Karl Kaupmees Sünniaeg: November 7th 1985, Tallinn, Estonia E-mail: [email protected] Kodakondsus: eesti Haridus: 2010–tänaseni Tartu Ülikool, keemia eriala doktorant 2008–2010 Tartu Ülikool, M.Sc (cum laude) analüütiline ja füüsikaline
keemia 2005–2008 Tartu Ülikool, B.Sc analüütiline ja füüsikaline keemia 1993–2005 Tallinna Saksa Gümnaasium Töökogemus: 2010–tänaseni Tartu Ülikool, keemik Teaduspublikatsioonid: 1. Kaupmees, K.; Kaljurand, I.; Leito, I. Influence of water content on the
acidities in acetonitrile. Quantifying charge delocalization in anions. J. Phys. Chem. A, 2010, 114, 11788–11793.
2. Lipping, L.; Kütt, A.; Kaupmees, K.; Koppel, I.; Burk, P.; Leito, I.; Koppel, I.A. Acidity of Anilines: Calculations vs Experiment J. Phys. Chem. A, 2011, 115, 10335–10344.
3. Greb, L.; Tussing, S.; Schirmer, B.; Oña-Burgos, P.; Kaupmees, K.; Lõkov, M.; Leito, I.; Grimme, S.; Paradies, J. Electronic effects of triarylphosphines in metal-free hydrogen activation: a kinetic and computational study. Chem. Sci., 2013, 4, 2788–2796.
4. Kaupmees, K.; Tolstoluzhsky, N.; Raja, S.; Rueping, M.; Leito, I. On the Acidity and Reactivity of Highly Effective Chiral Brønsted Acid Catalysts: Establishment of an Acidity Scale. Angew. Chem. Int. Ed., 2013, 52, 11569– 11572.
5. Raamat, E.; Kaupmees, K.; Ovsjannikov, G.; Trummal, A.; Kütt, A.; Saame, J.; Koppel, I.; Kaljurand, I.; Lipping, L.; Rodima, T.; Pihl, V.; Koppel, I. A.; Leito, I. Acidities of strong neutral Brönsted acids in different media. J. Phys. Org. Chem. 2013, 26, 162–170.
6. Kruve, A.; Kaupmees, K.; Liigand, J.; Oss, M.; Leito, I. Sodium adduct formation efficiency in ESI source. J. Mass Spectrom. 2013, 48, 695–702.
7. Vazdar, K.; Kunetskiy, R.; Saame, J.; Kaupmees, K.; Leito, I.; Jahn, U. Very Strong Organosuperbases Formed by Combining Imidazole and Guanidine Bases: Synthesis, Structure, and Basicity Angew. Chem. Int. Ed., 2014, 53, 1435–1438.
119
8. Kruve, A.; Kaupmees, K.; Liigand, J.; Leito, I. Negative Electrospray Ioni-zation via Deprotonation: Predicting the Ionization Efficiency. Anal. Chem. 2014, 86, 4822–4830.
9. Kaupmees, K.; Kaljurand, I.; Leito, I. Influence of water content on the basicities in acetonitrile. J. Sol. Chem. 2014, Avaldamiseks vastu võetud.
120
121
DISSERTATIONES CHIMICAE UNIVERSITATIS TARTUENSIS
1. Toomas Tamm. Quantum-chemical simulation of solvent effects. Tartu, 1993, 110 p.
2. Peeter Burk. Theoretical study of gas-phase acid-base equilibria. Tartu, 1994, 96 p.
3. Victor Lobanov. Quantitative structure-property relationships in large descriptor spaces. Tartu, 1995, 135 p.
4. Vahur Mäemets. The 17O and 1H nuclear magnetic resonance study of H2O in individual solvents and its charged clusters in aqueous solutions of electrolytes. Tartu, 1997, 140 p.
5. Andrus Metsala. Microcanonical rate constant in nonequilibrium distribu-tion of vibrational energy and in restricted intramolecular vibrational energy redistribution on the basis of slater’s theory of unimolecular re-actions. Tartu, 1997, 150 p.
6. Uko Maran. Quantum-mechanical study of potential energy surfaces in different environments. Tartu, 1997, 137 p.
7. Alar Jänes. Adsorption of organic compounds on antimony, bismuth and cadmium electrodes. Tartu, 1998, 219 p.
8. Kaido Tammeveski. Oxygen electroreduction on thin platinum films and the electrochemical detection of superoxide anion. Tartu, 1998, 139 p.
9. Ivo Leito. Studies of Brønsted acid-base equilibria in water and non-aqueous media. Tartu, 1998, 101 p.
10. Jaan Leis. Conformational dynamics and equilibria in amides. Tartu, 1998, 131 p.
11. Toonika Rinken. The modelling of amperometric biosensors based on oxi-doreductases. Tartu, 2000, 108 p.
12. Dmitri Panov. Partially solvated Grignard reagents. Tartu, 2000, 64 p. 13. Kaja Orupõld. Treatment and analysis of phenolic wastewater with micro-
organisms. Tartu, 2000, 123 p. 14. Jüri Ivask. Ion Chromatographic determination of major anions and
cations in polar ice core. Tartu, 2000, 85 p. 15. Lauri Vares. Stereoselective Synthesis of Tetrahydrofuran and Tetra-
hydropyran Derivatives by Use of Asymmetric Horner-Wadsworth- Emmons and Ring Closure Reactions. Tartu, 2000, 184 p.
16. Martin Lepiku. Kinetic aspects of dopamine D2 receptor interactions with specific ligands. Tartu, 2000, 81 p.
17. Katrin Sak. Some aspects of ligand specificity of P2Y receptors. Tartu, 2000, 106 p.
18. Vello Pällin. The role of solvation in the formation of iotsitch complexes. Tartu, 2001, 95 p.
122
19. Katrin Kollist. Interactions between polycyclic aromatic compounds and humic substances. Tartu, 2001, 93 p.
20. Ivar Koppel. Quantum chemical study of acidity of strong and superstrong Brønsted acids. Tartu, 2001, 104 p.
21. Viljar Pihl. The study of the substituent and solvent effects on the acidity of OH and CH acids. Tartu, 2001, 132 p.
22. Natalia Palm. Specification of the minimum, sufficient and significant set of descriptors for general description of solvent effects. Tartu, 2001, 134 p.
23. Sulev Sild. QSPR/QSAR approaches for complex molecular systems. Tartu, 2001, 134 p.
24. Ruslan Petrukhin. Industrial applications of the quantitative structure-property relationships. Tartu, 2001, 162 p.
25. Boris V. Rogovoy. Synthesis of (benzotriazolyl)carboximidamides and their application in relations with N- and S-nucleophyles. Tartu, 2002, 84 p.
26. Koit Herodes. Solvent effects on UV-vis absorption spectra of some solvatochromic substances in binary solvent mixtures: the preferential solvation model. Tartu, 2002, 102 p.
27. Anti Perkson. Synthesis and characterisation of nanostructured carbon. Tartu, 2002, 152 p.
28. Ivari Kaljurand. Self-consistent acidity scales of neutral and cationic Brønsted acids in acetonitrile and tetrahydrofuran. Tartu, 2003, 108 p.
29. Karmen Lust. Adsorption of anions on bismuth single crystal electrodes. Tartu, 2003, 128 p.
30. Mare Piirsalu. Substituent, temperature and solvent effects on the alkaline hydrolysis of substituted phenyl and alkyl esters of benzoic acid. Tartu, 2003, 156 p.
31. Meeri Sassian. Reactions of partially solvated Grignard reagents. Tartu, 2003, 78 p.
32. Tarmo Tamm. Quantum chemical modelling of polypyrrole. Tartu, 2003. 100 p.
33. Erik Teinemaa. The environmental fate of the particulate matter and organic pollutants from an oil shale power plant. Tartu, 2003. 102 p.
34. Jaana Tammiku-Taul. Quantum chemical study of the properties of Grignard reagents. Tartu, 2003. 120 p.
35. Andre Lomaka. Biomedical applications of predictive computational chemistry. Tartu, 2003. 132 p.
36. Kostyantyn Kirichenko. Benzotriazole – Mediated Carbon–Carbon Bond Formation. Tartu, 2003. 132 p.
37. Gunnar Nurk. Adsorption kinetics of some organic compounds on bis-muth single crystal electrodes. Tartu, 2003, 170 p.
38. Mati Arulepp. Electrochemical characteristics of porous carbon materials and electrical double layer capacitors. Tartu, 2003, 196 p.
1
39. Dan Cornel Fara. QSPR modeling of complexation and distribution of organic compounds. Tartu, 2004, 126 p.
40. Riina Mahlapuu. Signalling of galanin and amyloid precursor protein through adenylate cyclase. Tartu, 2004, 124 p.
41. Mihkel Kerikmäe. Some luminescent materials for dosimetric applications and physical research. Tartu, 2004, 143 p.
42. Jaanus Kruusma. Determination of some important trace metal ions in human blood. Tartu, 2004, 115 p.
43. Urmas Johanson. Investigations of the electrochemical properties of poly-pyrrole modified electrodes. Tartu, 2004, 91 p.
44. Kaido Sillar. Computational study of the acid sites in zeolite ZSM-5. Tartu, 2004, 80 p.
45. Aldo Oras. Kinetic aspects of dATPS interaction with P2Y1 receptor. Tartu, 2004, 75 p.
46. Erik Mölder. Measurement of the oxygen mass transfer through the air-water interface. Tartu, 2005, 73 p.
47. Thomas Thomberg. The kinetics of electroreduction of peroxodisulfate anion on cadmium (0001) single crystal electrode. Tartu, 2005, 95 p.
48. Olavi Loog. Aspects of condensations of carbonyl compounds and their imine analogues. Tartu, 2005, 83 p.
49. Siim Salmar. Effect of ultrasound on ester hydrolysis in aqueous ethanol. Tartu, 2006, 73 p.
50. Ain Uustare. Modulation of signal transduction of heptahelical receptors by other receptors and G proteins. Tartu, 2006, 121 p.
51. Sergei Yurchenko. Determination of some carcinogenic contaminants in food. Tartu, 2006, 143 p.
52. Kaido Tämm. QSPR modeling of some properties of organic compounds. Tartu, 2006, 67 p.
53. Olga Tšubrik. New methods in the synthesis of multisubstituted hydra-zines. Tartu. 2006, 183 p.
54. Lilli Sooväli. Spectrophotometric measurements and their uncertainty in chemical analysis and dissociation constant measurements. Tartu, 2006, 125 p.
55. Eve Koort. Uncertainty estimation of potentiometrically measured ph and pKa values. Tartu, 2006, 139 p.
56. Sergei Kopanchuk. Regulation of ligand binding to melanocortin receptor subtypes. Tartu, 2006, 119 p.
57. Silvar Kallip. Surface structure of some bismuth and antimony single crystal electrodes. Tartu, 2006, 107 p.
58. Kristjan Saal. Surface silanization and its application in biomolecule coupling. Tartu, 2006, 77 p.
59. Tanel Tätte. High viscosity Sn(OBu)4 oligomeric concentrates and their applications in technology. Tartu, 2006, 91 p.
23
124
60. Dimitar Atanasov Dobchev. Robust QSAR methods for the prediction of properties from molecular structure. Tartu, 2006, 118 p.
61. Hannes Hagu. Impact of ultrasound on hydrophobic interactions in solutions. Tartu, 2007, 81 p.
62. Rutha Jäger. Electroreduction of peroxodisulfate anion on bismuth electrodes. Tartu, 2007, 142 p.
63. Kaido Viht. Immobilizable bisubstrate-analogue inhibitors of basophilic protein kinases: development and application in biosensors. Tartu, 2007, 88 p.
64. Eva-Ingrid Rõõm. Acid-base equilibria in nonpolar media. Tartu, 2007, 156 p.
65. Sven Tamp. DFT study of the cesium cation containing complexes relevant to the cesium cation binding by the humic acids. Tartu, 2007, 102 p.
66. Jaak Nerut. Electroreduction of hexacyanoferrate(III) anion on Cadmium (0001) single crystal electrode. Tartu, 2007, 180 p.
67. Lauri Jalukse. Measurement uncertainty estimation in amperometric dissolved oxygen concentration measurement. Tartu, 2007, 112 p.
68. Aime Lust. Charge state of dopants and ordered clusters formation in CaF2:Mn and CaF2:Eu luminophors. Tartu, 2007, 100 p.
69. Iiris Kahn. Quantitative Structure-Activity Relationships of environ-mentally relevant properties. Tartu, 2007, 98 p.
70. Mari Reinik. Nitrates, nitrites, N-nitrosamines and polycyclic aromatic hydrocarbons in food: analytical methods, occurrence and dietary intake. Tartu, 2007, 172 p.
71. Heili Kasuk. Thermodynamic parameters and adsorption kinetics of orga-nic compounds forming the compact adsorption layer at Bi single crystal electrodes. Tartu, 2007, 212 p.
72. Erki Enkvist. Synthesis of adenosine-peptide conjugates for biological applications. Tartu, 2007, 114 p.
73. Svetoslav Hristov Slavov. Biomedical applications of the QSAR approach. Tartu, 2007, 146 p.
74. Eneli Härk. Electroreduction of complex cations on electrochemically polished Bi(hkl) single crystal electrodes. Tartu, 2008, 158 p.
75. Priit Möller. Electrochemical characteristics of some cathodes for medium temperature solid oxide fuel cells, synthesized by solid state reaction technique. Tartu, 2008, 90 p.
76. Signe Viggor. Impact of biochemical parameters of genetically different pseudomonads at the degradation of phenolic compounds. Tartu, 2008, 122 p.
77. Ave Sarapuu. Electrochemical reduction of oxygen on quinone-modified carbon electrodes and on thin films of platinum and gold. Tartu, 2008, 134 p.
78. Agnes Kütt. Studies of acid-base equilibria in non-aqueous media. Tartu, 2008, 198 p.
125
79. Rouvim Kadis. Evaluation of measurement uncertainty in analytical che-mistry: related concepts and some points of misinterpretation. Tartu, 2008, 118 p.
80. Valter Reedo. Elaboration of IVB group metal oxide structures and their possible applications. Tartu, 2008, 98 p.
81. Aleksei Kuznetsov. Allosteric effects in reactions catalyzed by the cAMP-dependent protein kinase catalytic subunit. Tartu, 2009, 133 p.
82. Aleksei Bredihhin. Use of mono- and polyanions in the synthesis of multisubstituted hydrazine derivatives. Tartu, 2009, 105 p.
83. Anu Ploom. Quantitative structure-reactivity analysis in organosilicon chemistry. Tartu, 2009, 99 p.
84. Argo Vonk. Determination of adenosine A2A- and dopamine D1 receptor-specific modulation of adenylate cyclase activity in rat striatum. Tartu, 2009, 129 p.
85. Indrek Kivi. Synthesis and electrochemical characterization of porous cathode materials for intermediate temperature solid oxide fuel cells. Tartu, 2009, 177 p.
86. Jaanus Eskusson. Synthesis and characterisation of diamond-like carbon thin films prepared by pulsed laser deposition method. Tartu, 2009, 117 p.
87. Marko Lätt. Carbide derived microporous carbon and electrical double layer capacitors. Tartu, 2009, 107 p.
88. Vladimir Stepanov. Slow conformational changes in dopamine transporter interaction with its ligands. Tartu, 2009, 103 p.
89. Aleksander Trummal. Computational Study of Structural and Solvent Effects on Acidities of Some Brønsted Acids. Tartu, 2009, 103 p.
90. Eerold Vellemäe. Applications of mischmetal in organic synthesis. Tartu, 2009, 93 p.
91. Sven Parkel. Ligand binding to 5-HT1A receptors and its regulation by Mg2+ and Mn2+. Tartu, 2010, 99 p.
92. Signe Vahur. Expanding the possibilities of ATR-FT-IR spectroscopy in determination of inorganic pigments. Tartu, 2010, 184 p.
93. Tavo Romann. Preparation and surface modification of bismuth thin film, porous, and microelectrodes. Tartu, 2010, 155 p.
94. Nadežda Aleksejeva. Electrocatalytic reduction of oxygen on carbon nanotube-based nanocomposite materials. Tartu, 2010, 147 p.
95. Marko Kullapere. Electrochemical properties of glassy carbon, nickel and gold electrodes modified with aryl groups. Tartu, 2010, 233 p.
96. Liis Siinor. Adsorption kinetics of ions at Bi single crystal planes from aqueous electrolyte solutions and room-temperature ionic liquids. Tartu, 2010, 101 p.
97. Angela Vaasa. Development of fluorescence-based kinetic and binding assays for characterization of protein kinases and their inhibitors. Tartu 2010, 101 p.
126
98. Indrek Tulp. Multivariate analysis of chemical and biological properties. Tartu 2010, 105 p.
99. Aare Selberg. Evaluation of environmental quality in Northern Estonia by the analysis of leachate. Tartu 2010, 117 p.
100. Darja Lavõgina. Development of protein kinase inhibitors based on adenosine analogue-oligoarginine conjugates. Tartu 2010, 248 p.
101. Laura Herm. Biochemistry of dopamine D2 receptors and its association with motivated behaviour. Tartu 2010, 156 p.
102. Terje Raudsepp. Influence of dopant anions on the electrochemical pro-perties of polypyrrole films. Tartu 2010, 112 p.
103. Margus Marandi. Electroformation of Polypyrrole Films: In-situ AFM and STM Study. Tartu 2011, 116 p.
104. Kairi Kivirand. Diamine oxidase-based biosensors: construction and working principles. Tartu, 2011, 140 p.
105. Anneli Kruve. Matrix effects in liquid-chromatography electrospray mass-spectrometry. Tartu, 2011, 156 p.
106. Gary Urb. Assessment of environmental impact of oil shale fly ash from PF and CFB combustion. Tartu, 2011, 108 p.
107. Nikita Oskolkov. A novel strategy for peptide-mediated cellular delivery and induction of endosomal escape. Tartu, 2011, 106 p.
108. Dana Martin. The QSPR/QSAR approach for the prediction of properties of fullerene derivatives. Tartu, 2011, 98 p.
109. Säde Viirlaid. Novel glutathione analogues and their antioxidant activity. Tartu, 2011, 106 p.
110. Ülis Sõukand. Simultaneous adsorption of Cd2+, Ni2+, and Pb2+ on peat. Tartu, 2011, 124 p.
111. Lauri Lipping. The acidity of strong and superstrong Brønsted acids, an outreach for the “limits of growth”: a quantum chemical study. Tartu, 2011, 124 p.
112. Heisi Kurig. Electrical double-layer capacitors based on ionic liquids as electrolytes. Tartu, 2011, 146 p.
113. Marje Kasari. Bisubstrate luminescent probes, optical sensors and affinity adsorbents for measurement of active protein kinases in biological samples. Tartu, 2012, 126 p.
114. Kalev Takkis. Virtual screening of chemical databases for bioactive mole-cules. Tartu, 2012, 122 p.
115. Ksenija Kisseljova. Synthesis of aza-β3-amino acid containing peptides and kinetic study of their phosphorylation by protein kinase A. Tartu, 2012, 104 p.
116. Riin Rebane. Advanced method development strategy for derivatization LC/ESI/MS. Tartu, 2012, 184 p.
127
117. Vladislav Ivaništšev. Double layer structure and adsorption kinetics of ions at metal electrodes in room temperature ionic liquids. Tartu, 2012, 128 p.
118. Irja Helm. High accuracy gravimetric Winkler method for determination of dissolved oxygen. Tartu, 2012, 139 p.
119. Karin Kipper. Fluoroalcohols as Components of LC-ESI-MS Eluents: Usage and Applications. Tartu, 2012, 164 p.
120. Arno Ratas. Energy storage and transfer in dosimetric luminescent materials. Tartu, 2012, 163 p.
121. Reet Reinart-Okugbeni. Assay systems for characterisation of subtype-selective binding and functional activity of ligands on dopamine recep-tors. Tartu, 2012, 159 p.
122. Lauri Sikk. Computational study of the Sonogashira cross-coupling reaction. Tartu, 2012, 81 p.
123. Karita Raudkivi. Neurochemical studies on inter-individual differences in affect-related behaviour of the laboratory rat. Tartu, 2012, 161 p.
124. Indrek Saar. Design of GalR2 subtype specific ligands: their role in depression-like behavior and feeding regulation. Tartu, 2013, 126 p.
125. Ann Laheäär. Electrochemical characterization of alkali metal salt based non-aqueous electrolytes for supercapacitors. Tartu, 2013, 127 p.
126. Kerli Tõnurist. Influence of electrospun separator materials properties on electrochemical performance of electrical double-layer capacitors. Tartu, 2013, 147 p.
127. Kaija Põhako-Esko. Novel organic and inorganic ionogels: preparation and characterization. Tartu, 2013, 124 p.
128. Ivar Kruusenberg. Electroreduction of oxygen on carbon nanomaterial-based catalysts. Tartu, 2013, 191 p.
129. Sander Piiskop. Kinetic effects of ultrasound in aqueous acetonitrile solutions. Tartu, 2013, 95 p.
130. Ilona Faustova. Regulatory role of L-type pyruvate kinase N-terminal domain. Tartu, 2013, 109 p.
131. Kadi Tamm. Synthesis and characterization of the micro-mesoporous anode materials and testing of the medium temperature solid oxide fuel cell single cells. Tartu, 2013, 138 p.
132. Iva Bozhidarova Stoyanova-Slavova. Validation of QSAR/QSPR for regulatory purposes. Tartu, 2013, 109 p.
133. Vitali Grozovski. Adsorption of organic molecules at single crystal electrodes studied by in situ STM method. Tartu, 2014, 146 p.
134. Santa Veikšina. Development of assay systems for characterisation of ligand binding properties to melanocortin 4 receptors. Tartu, 2014, 151 p.
135. Jüri Liiv. PVDF (polyvinylidene difluoride) as material for active element of twisting-ball displays. Tartu, 2014, 111 p.
136. Kersti Vaarmets. Electrochemical and physical characterization of pristine and activated molybdenum carbide-derived carbon electrodes for the oxygen electroreduction reaction. Tartu, 2014, 131 p.
137. Lauri Tõntson. Regulation of G-protein subtypes by receptors, guanine nucleotides and Mn2+. Tartu, 2014, 105 p.
138. Aiko Adamson. Properties of amine-boranes and phosphorus analogues in the gas phase. Tartu, 2014, 78 p.
139. Elo Kibena. Electrochemical grafting of glassy carbon, gold, highly oriented pyrolytic graphite and chemical vapour deposition-grown graphene electrodes by diazonium reduction method. Tartu, 2014, 184 p.
140. Teemu Näykki. Novel Tools for Water Quality Monitoring – From Field to Laboratory. Tartu, 2014, 202 p.