Kara Sea freshwater transport through Vilkitsky Strait ... · accumulates due to Ekman convergence...
20
RESEARCH ARTICLE 10.1002/2014JC010635 Kara Sea freshwater transport through Vilkitsky Strait: Variability, forcing, and further pathways toward the western Arctic Ocean from a model and observations Markus A. Janout 1 , Yevgeny Aksenov 2 , Jens A. H€ olemann 1 , Benjamin Rabe 1 , Ursula Schauer 1 , Igor V. Polyakov 3 , Sheldon Bacon 2 , Andrew C. Coward 2 , Michael Karcher 1,4 , Yueng-Djern Lenn 5 , Heidemarie Kassens 6 , and Leonid Timokhov 7 1 Alfred Wegener Institute, Helmholtz Centre for Polar and Marine Research, Bremerhaven, Germany, 2 National Oceanography Centre, Southampton, UK, 3 International Arctic Research Center, Fairbanks, Alaska, USA, 4 O.A.Sys—Ocean Atmosphere Systems GmbH, Hamburg, Germany, 5 School of Ocean Sciences, Bangor University, Bangor, UK, 6 GEOMAR Helmholtz Centre for Ocean Research, Kiel, Germany, 7 Arctic and Antarctic Research Center, St. Petersburg, Russia Abstract Siberian river water is a first-order contribution to the Arctic freshwater budget, with the Ob, Yenisey, and Lena supplying nearly half of the total surface freshwater flux. However, few details are known regarding where, when, and how the freshwater transverses the vast Siberian shelf seas. This paper investi- gates the mechanism, variability, and pathways of the fresh Kara Sea outflow through Vilkitsky Strait toward the Laptev Sea. We utilize a high-resolution ocean model and recent shipboard observations to characterize the freshwater-laden Vilkitsky Strait Current (VSC), and shed new light on the little-studied region between the Kara and Laptev Seas, characterized by harsh ice conditions, contrasting water masses, straits, and a large sub- marine canyon. The VSC is 10–20 km wide, surface intensified, and varies seasonally (maximum from August to March) and interannually. Average freshwater (volume) transport is 500 6 120 km 3 a 21 (0.53 6 0.08 Sv), with a baroclinic flow contribution of 50–90%. Interannual transport variability is explained by a storage- release mechanism, where blocking-favorable summer winds hamper the outflow and cause accumulation of freshwater in the Kara Sea. The year following a blocking event is characterized by enhanced transports driven by a baroclinic flow along the coast that is set up by increased freshwater volumes. Eventually, the VSC merges with a slope current and provides a major pathway for Eurasian river water toward the western Arctic along the Eurasian continental slope. Kara (and Laptev) Sea freshwater transport is not correlated with the Arc- tic Oscillation, but rather driven by regional summer pressure patterns. 1. Introduction The Arctic Ocean receives nearly 11% of the earth’s river runoff but contains only 1% of the global volume of seawater [Shiklomanov et al., 2000]. The Arctic Ocean surface freshwater flux is a large net input to the ocean, dominated by runoff from North American and Eurasian Rivers [Aagaard and Carmack, 1989; Serreze et al., 2006]. Rivers discharge on the shallow Arctic shelf seas, where different mixing processes produce moderately saline and cold shelf waters. These eventually feed into (and below) the Arctic halocline [Aagaard et al., 1981], insulating the ice cover from the warmer Atlantic-derived waters below. A recent idealized Arctic Ocean model study [Spall, 2013] highlighted the role of freshwater from the Arctic shelves in setting up horizontal salinity gradients across the continental slopes, which, through the dominant impact of salinity on density, are a major driver for the Atlantic water circulation. The largest freshwater content (FWC) is found in the Canada Basin [Aagaard and Carmack, 1989], where FW accumulates due to Ekman convergence under a predominant anticyclonic atmospheric circulation [Proshu- tinsky et al., 2009]. FWC varies on interannual and interdecadal time scales [Rabe et al., 2014], which has been linked to large-scale Arctic indices of sea level pressure [Morison et al., 2012; Proshutinksy and Johnson, 1997] and to changes in wind forcing [Giles et al., 2012]. Freshwater budgets, supported by hydrochemical data [Alkire et al., 2010], suggest that 70% of the Canada Basin’s meteoric freshwater must result from Eur- asian Rivers [Yamamoto-Kawai et al., 2008; Carmack et al., 2008]. However, the exact pathways and links between the Eurasian shelves and the Canada Basin remain poorly understood. Special Section: Forum for Arctic Modeling and Observing Synthesis (FAMOS): Results and Synthesis of Coordinated Experiments Key Points: Siberian River water in buoyancy- driven Vilkitsky Strait Current Kara Sea freshwater export toward Laptev Sea VSC potential pathway of Siberian river water toward western Arctic Correspondence to: M. Janout, [email protected] Citation: Janout, M. A., et al. (2015), Kara Sea freshwater transport through Vilkitsky Strait: Variability, forcing, and further pathways toward the western Arctic Ocean from a model and observations, J. Geophys. Res. Oceans, 120, 4925– 4944, doi:10.1002/2014JC010635. Received 10 DEC 2014 Accepted 1 JUN 2015 Accepted article online 6 JUN 2015 Published online 18 JUL 2015 V C 2015. American Geophysical Union. All Rights Reserved. JANOUT ET AL. KARA SEA FRESHWATER TRANSPORT 4925 Journal of Geophysical Research: Oceans PUBLICATIONS
Transcript of Kara Sea freshwater transport through Vilkitsky Strait ... · accumulates due to Ekman convergence...

RESEARCH ARTICLE10.1002/2014JC010635
Kara Sea freshwater transport through Vilkitsky Strait:Variability, forcing, and further pathways toward the westernArctic Ocean from a model and observationsMarkus A. Janout1, Yevgeny Aksenov2, Jens A. H€olemann1, Benjamin Rabe1, Ursula Schauer1,Igor V. Polyakov3, Sheldon Bacon2, Andrew C. Coward2, Michael Karcher1,4, Yueng-Djern Lenn5,Heidemarie Kassens6, and Leonid Timokhov7
1Alfred Wegener Institute, Helmholtz Centre for Polar and Marine Research, Bremerhaven, Germany, 2NationalOceanography Centre, Southampton, UK, 3International Arctic Research Center, Fairbanks, Alaska, USA, 4O.A.Sys—OceanAtmosphere Systems GmbH, Hamburg, Germany, 5School of Ocean Sciences, Bangor University, Bangor, UK, 6GEOMARHelmholtz Centre for Ocean Research, Kiel, Germany, 7Arctic and Antarctic Research Center, St. Petersburg, Russia
Abstract Siberian river water is a first-order contribution to the Arctic freshwater budget, with the Ob,Yenisey, and Lena supplying nearly half of the total surface freshwater flux. However, few details are knownregarding where, when, and how the freshwater transverses the vast Siberian shelf seas. This paper investi-gates the mechanism, variability, and pathways of the fresh Kara Sea outflow through Vilkitsky Strait towardthe Laptev Sea. We utilize a high-resolution ocean model and recent shipboard observations to characterizethe freshwater-laden Vilkitsky Strait Current (VSC), and shed new light on the little-studied region between theKara and Laptev Seas, characterized by harsh ice conditions, contrasting water masses, straits, and a large sub-marine canyon. The VSC is 10–20 km wide, surface intensified, and varies seasonally (maximum from Augustto March) and interannually. Average freshwater (volume) transport is 500 6 120 km3 a21 (0.53 6 0.08 Sv),with a baroclinic flow contribution of 50–90%. Interannual transport variability is explained by a storage-release mechanism, where blocking-favorable summer winds hamper the outflow and cause accumulation offreshwater in the Kara Sea. The year following a blocking event is characterized by enhanced transports drivenby a baroclinic flow along the coast that is set up by increased freshwater volumes. Eventually, the VSCmerges with a slope current and provides a major pathway for Eurasian river water toward the western Arcticalong the Eurasian continental slope. Kara (and Laptev) Sea freshwater transport is not correlated with the Arc-tic Oscillation, but rather driven by regional summer pressure patterns.
1. Introduction
The Arctic Ocean receives nearly 11% of the earth’s river runoff but contains only 1% of the global volume ofseawater [Shiklomanov et al., 2000]. The Arctic Ocean surface freshwater flux is a large net input to the ocean,dominated by runoff from North American and Eurasian Rivers [Aagaard and Carmack, 1989; Serreze et al.,2006]. Rivers discharge on the shallow Arctic shelf seas, where different mixing processes produce moderatelysaline and cold shelf waters. These eventually feed into (and below) the Arctic halocline [Aagaard et al., 1981],insulating the ice cover from the warmer Atlantic-derived waters below. A recent idealized Arctic Ocean modelstudy [Spall, 2013] highlighted the role of freshwater from the Arctic shelves in setting up horizontal salinitygradients across the continental slopes, which, through the dominant impact of salinity on density, are amajor driver for the Atlantic water circulation.
The largest freshwater content (FWC) is found in the Canada Basin [Aagaard and Carmack, 1989], where FWaccumulates due to Ekman convergence under a predominant anticyclonic atmospheric circulation [Proshu-tinsky et al., 2009]. FWC varies on interannual and interdecadal time scales [Rabe et al., 2014], which hasbeen linked to large-scale Arctic indices of sea level pressure [Morison et al., 2012; Proshutinksy and Johnson,1997] and to changes in wind forcing [Giles et al., 2012]. Freshwater budgets, supported by hydrochemicaldata [Alkire et al., 2010], suggest that �70% of the Canada Basin’s meteoric freshwater must result from Eur-asian Rivers [Yamamoto-Kawai et al., 2008; Carmack et al., 2008]. However, the exact pathways and linksbetween the Eurasian shelves and the Canada Basin remain poorly understood.
Special Section:Forum for Arctic Modelingand Observing Synthesis(FAMOS): Results andSynthesis of CoordinatedExperiments
Key Points:� Siberian River water in buoyancy-
driven Vilkitsky Strait Current� Kara Sea freshwater export toward
Laptev Sea� VSC potential pathway of Siberian
river water toward western Arctic
Correspondence to:M. Janout,[email protected]
Citation:Janout, M. A., et al. (2015), Kara Seafreshwater transport through VilkitskyStrait: Variability, forcing, and furtherpathways toward the western ArcticOcean from a model and observations,J. Geophys. Res. Oceans, 120, 4925–4944, doi:10.1002/2014JC010635.
Received 10 DEC 2014
Accepted 1 JUN 2015
Accepted article online 6 JUN 2015
Published online 18 JUL 2015
VC 2015. American Geophysical Union.
All Rights Reserved.
JANOUT ET AL. KARA SEA FRESHWATER TRANSPORT 4925
Journal of Geophysical Research: Oceans
PUBLICATIONS
http://agupubs.onlinelibrary.wiley.com/agu/issue/10.1002/(ISSN)2169-9291(CAT)SpecialIssues(VI)FAMOS/
http://agupubs.onlinelibrary.wiley.com/agu/issue/10.1002/(ISSN)2169-9291(CAT)SpecialIssues(VI)FAMOS/
http://agupubs.onlinelibrary.wiley.com/agu/issue/10.1002/(ISSN)2169-9291(CAT)SpecialIssues(VI)FAMOS/
http://agupubs.onlinelibrary.wiley.com/agu/issue/10.1002/(ISSN)2169-9291(CAT)SpecialIssues(VI)FAMOS/

Nearly 50% of the Arctic river water enters from three of the largest rivers on earth over the vast Kara andLaptev Sea shelves from the Lena (531 km3 a21), Ob (412 km3 a21), and Yenisey (599 km3 a21; Figure 1) [Daiand Trenberth, 2002]. The discharge is highly seasonal (Figure 2) and controls the summer stratification [Jan-out et al., 2013] and biogeochemical environment on the Siberian shelves [Holmes et al., 2011]. The distribu-tion and fate of the river plumes is primarily dominated by winds in summer [Dmitrenko et al., 2005]. Duringyears with weak or predominantly westerly winds over the Laptev Sea, Lena River water propagates intothe East Siberian Sea and further along the coast toward Bering Strait [Weingartner et al., 1999]. Duringsummers with easterly or southerly winds, the plume remains on the central and northern Laptev shelf, andis available for export into the Arctic Basin [Guay et al., 2001].
The Siberian shelves are important ice formation regions. While polynyas are frequent along most of theLaptev and East Siberian coasts, the Kara Sea polynyas are mainly concentrated along the Novaya Zemlyacoast and north of Severnaya Zemlya [Winsor and Bj€ork, 2000]. Landfast ice (LFI) can form along the north-east Kara Sea coast as early as in November, and more consistently covers a larger region from February toJune [Divine et al., 2004]. Atmospheric conditions considerably affect LFI variability, where the largest extentcoincides with high pressure over the Arctic leading to cold offshore winds over the Kara Sea, while cyclo-nes favor a lesser LFI extent and earlier breakup in spring [Divine et al., 2005]. The increasing cyclonicity inthe Arctic [Zhang et al., 2004] may in part explain the LFI decrease in the Kara Sea by �4% decade21
between 1976 and 2007, reported by Yu et al. [2014]. A 5 year model study estimated an average ice volume
Figure 1. (a) Map of the Arctic Ocean, the dark shading highlights the shallow shelf areas (<200 m), the box indicates the boundaries of(b) map of the Kara and Laptev Seas region. Shading separates depths deeper (gray) and shallower (white) than 200 m from the Interna-tional Bathymetric Chart of the Arctic Ocean [Jakobsson et al., 2008] WTC indicates the West Taymyr Current. (c) Zoom into the VilkitskyStrait (VS) and Trough (VT) region. Colored lines and dots show transect locations: VS model-transect (magenta), RV Polarstern 2011 VT-transect (blue dots), 2013 UCTD-transect along 1138E and 1168E (red dots), and the 1268E-NABOS-transect (blue line).
Journal of Geophysical Research: Oceans 10.1002/2014JC010635
JANOUT ET AL. KARA SEA FRESHWATER TRANSPORT 4926
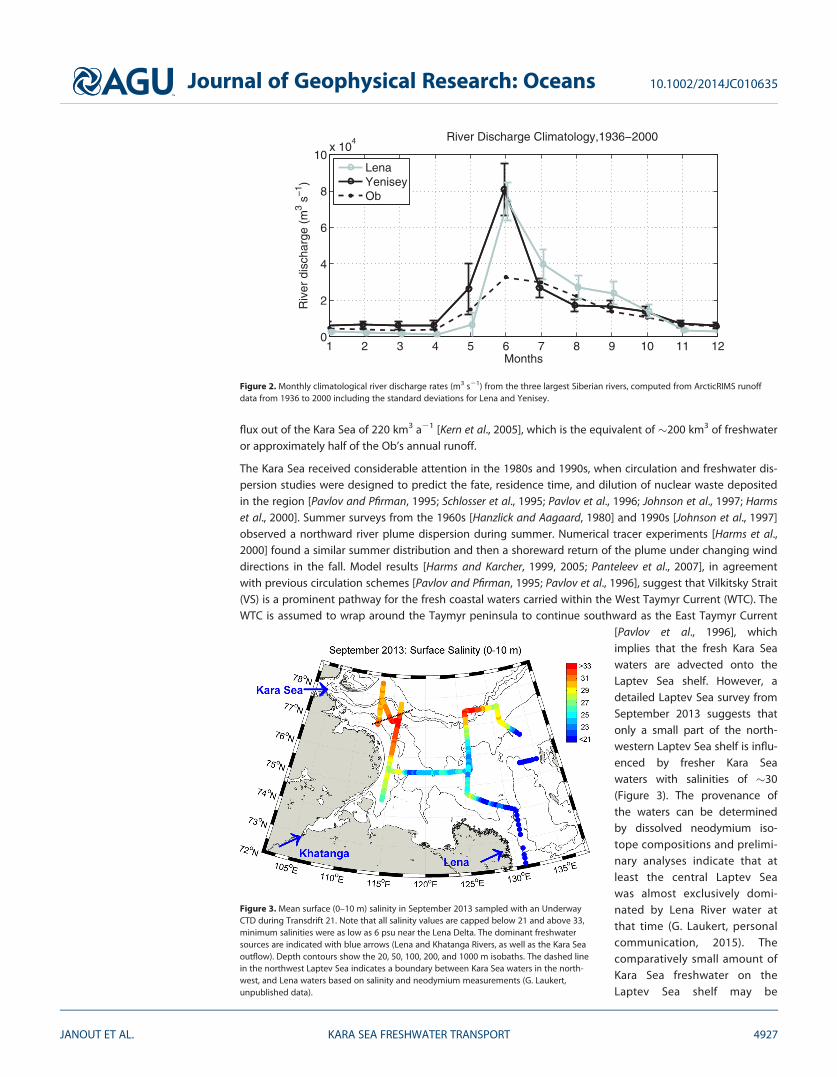
flux out of the Kara Sea of 220 km3 a21 [Kern et al., 2005], which is the equivalent of �200 km3 of freshwateror approximately half of the Ob’s annual runoff.
The Kara Sea received considerable attention in the 1980s and 1990s, when circulation and freshwater dis-persion studies were designed to predict the fate, residence time, and dilution of nuclear waste depositedin the region [Pavlov and Pfirman, 1995; Schlosser et al., 1995; Pavlov et al., 1996; Johnson et al., 1997; Harmset al., 2000]. Summer surveys from the 1960s [Hanzlick and Aagaard, 1980] and 1990s [Johnson et al., 1997]observed a northward river plume dispersion during summer. Numerical tracer experiments [Harms et al.,2000] found a similar summer distribution and then a shoreward return of the plume under changing winddirections in the fall. Model results [Harms and Karcher, 1999, 2005; Panteleev et al., 2007], in agreementwith previous circulation schemes [Pavlov and Pfirman, 1995; Pavlov et al., 1996], suggest that Vilkitsky Strait(VS) is a prominent pathway for the fresh coastal waters carried within the West Taymyr Current (WTC). TheWTC is assumed to wrap around the Taymyr peninsula to continue southward as the East Taymyr Current
[Pavlov et al., 1996], whichimplies that the fresh Kara Seawaters are advected onto theLaptev Sea shelf. However, adetailed Laptev Sea survey fromSeptember 2013 suggests thatonly a small part of the north-western Laptev Sea shelf is influ-enced by fresher Kara Seawaters with salinities of �30(Figure 3). The provenance ofthe waters can be determinedby dissolved neodymium iso-tope compositions and prelimi-nary analyses indicate that atleast the central Laptev Seawas almost exclusively domi-nated by Lena River water atthat time (G. Laukert, personalcommunication, 2015). Thecomparatively small amount ofKara Sea freshwater on theLaptev Sea shelf may be
River Discharge Climatology,1936−2000
1 2 3 4 5 6 7 8 9 10 11 120
2
4
6
8
10x 10
4
Months
Riv
er d
isch
arge
(m
3 s−
1 )
LenaYeniseyOb
Figure 2. Monthly climatological river discharge rates (m3 s21) from the three largest Siberian rivers, computed from ArcticRIMS runoffdata from 1936 to 2000 including the standard deviations for Lena and Yenisey.
Figure 3. Mean surface (0–10 m) salinity in September 2013 sampled with an UnderwayCTD during Transdrift 21. Note that all salinity values are capped below 21 and above 33,minimum salinities were as low as 6 psu near the Lena Delta. The dominant freshwatersources are indicated with blue arrows (Lena and Khatanga Rivers, as well as the Kara Seaoutflow). Depth contours show the 20, 50, 100, 200, and 1000 m isobaths. The dashed linein the northwest Laptev Sea indicates a boundary between Kara Sea waters in the north-west, and Lena waters based on salinity and neodymium measurements (G. Laukert,unpublished data).
Journal of Geophysical Research: Oceans 10.1002/2014JC010635
JANOUT ET AL. KARA SEA FRESHWATER TRANSPORT 4927

explained by the region’s bathymetry, which is far more complex than previously considered. Immedi-ately eastward of the �200 m deep VS, the bathymetry deepens into a large submarine canyon (Vilkit-sky Trough, VT, see Figure 1). VT is a maximum of 350 m deep, 80 km wide, and more than 200 km long[Jakobsson et al., 2008]. Unfortunately, detailed observations and published information from the can-yon are missing, which may be primarily due to the harsh ice conditions that often prevail in the region.In a numerical circulation study, Aksenov et al. [2011] mention a fresh current that exits the Kara Seathrough VS, and eventually forms the near-surface part of a ‘‘pan-arctically persistent current’’ propagat-ing along the Arctic continental slopes. This proposed pathway of Kara Sea freshwater is contrasted bya propagation along the inner Laptev Sea shelf, and urgently requires observational evidence consider-ing the implications of Siberian freshwater for the Arctic Ocean.
The goal of this study is to shed light on the region between VS and the continental slope along the north-ern Laptev Sea in order to understand the regional conditions and derive their larger-scale importance forthe Arctic Ocean. In particular, we aim to characterize the fresh Kara Sea outflow, investigate its structure,seasonal and interannual variability, and forcing mechanisms based on a high-resolution circulation modelcombined with recent observations.
The paper is structured as follows. ‘‘Data and methods’’ are provided in section 2. The results section 3 pro-vides a characterization of the Vilkitsky Strait Current (section 3.1), associated volume and freshwater trans-ports (section 3.2), their variability and forcing mechanisms (section 3.3), observations and further pathways(section 3.4), and finally the fate of the Kara Sea freshwater (section 3.5). The paper finishes with a discussionin section 4 and summary in section 5.
2. Data and Methods
2.1. ModelIn this study, we analyzed results from an Ocean General Circulation Model (OGCM) developed under theNucleus for European Modelling of the Ocean (NEMO) framework for ocean climate research and opera-tional oceanography (http://www.nemo-ocean.eu). The NEMO configuration used here is a z-level globalcoupled sea ice-ocean model, which includes the ocean circulation model OPA9 [Madec and the NEMOTeam, 2011] and the Louvain-la-Neuve sea ice model LIM2 [Fichefet and Morales Maqueda, 1997] updatedwith elastic-viscous-plastic rheology. The ocean model is configured at 1/128 on a tripolar Arakawa C-gridwith the model poles at the geographical South Pole, in Siberia and in the Canadian Arctic Archipelago. Thenominal horizontal resolution is �3 km in the area of interest (Kara and Laptev Seas and the eastern Eura-sian Basin; Figure 1), 2–4 km in the central Arctic Ocean and Canadian Arctic, and �9 km in the rest of theocean. The model is eddy-resolving in the Arctic Ocean and eddy-permitting on the shelves [Nurser andBacon, 2014]. The model has 75 vertical levels with 19 levels in the upper 50 m and 25 levels in the upper100 m. The thickness of the top model layer is �1 m, increasing to �204 m at 6000 m. Following Barnieret al. [2006], partial steps in the model bottom topography are implemented to improve model approxima-tion of the steep continental slopes. The high vertical resolution and partial bottom steps in topographyallow for better simulations of the boundary currents and shelf circulation. The model has a nonlinear oceanfree surface, improving simulations of the sea surface height. An isoneutral Laplacian operator is used forlateral tracer diffusion and a bi-Laplacian horizontal operator is applied for momentum diffusion. A turbu-lent kinetic energy closure scheme is used for vertical mixing [Madec and the NEMO Team, 2011]. The modelhas been successfully used in several studies of the Arctic Ocean [Lique and Steele, 2012] and the NorthAtlantic [Bacon et al., 2014]. Among the known biases are a �10% higher than observed sea ice concentra-tion and a 7% higher inflow through Bering Strait [Woodgate et al., 2012].
2.2. ObservationsConductivity-Temperature-Depth (CTD) measurements from the Laptev Sea originate from several differentexpeditions. In 2004 and 2005, CTD transects were taken during the NABOS (Nansen and Amundsen BasinsObservational System) program aboard the research icebreaker Kapitan Dranitsyn using a Seabird 19plusprofiler. Accuracies for temperature and conductivity are 0.0058C and 0.0005 S m21, respectively. VT sam-pling in 2011 was carried out during ‘‘TRANSARC’’ aboard RV Polarstern, using a Seabird SBE911 CTD withaccuracies of 0.0018C and 0.0003 S m21 for temperature and conductivity, respectively (data published inSchauer et al. [2012]). Polarstern operates a 75 kHz vessel-mounted Acoustic Doppler Current Profiler
Journal of Geophysical Research: Oceans 10.1002/2014JC010635
JANOUT ET AL. KARA SEA FRESHWATER TRANSPORT 4928

(ADCP), which provides along-track velocity profiles in 8 m bins with an accuracy of 3 cm s21. In September2013, the Transdrift-21-expedition to the Laptev Sea was carried out aboard RV Viktor Buinitskiy within theframework of the Russian-German ‘‘Laptev Sea System’’—program. Temperature and salinity transects werecarried out using an Ocean Science underway (U-)CTD system, which allows profiling while the ship is intransit. The U-CTD sensors are manufactured by Seabird and provide accuracies of 0.00048C and 0.002–0.005 S m21 at a sampling frequency of 16 Hz. The sensors operate in free-fall mode with a non-constantsinking velocity, and subsequent salinity computations require careful alignment of conductivity and tem-perature samples. The U-CTD postprocessing followed the recommendations of Ullman and Hebert [2014].
3. Results
3.1. Structure, Seasonality, and Pathway of the Vilkitsky Strait CurrentA state-of-the-art numerical model (NEMO) with a proven track record in simulating Arctic Ocean circulationfeatures was investigated for the circulation in the Kara Sea outflow region around VS and the western Lap-tev Sea (Figure 4). Based on long-term (1990–2010) mean October velocities, the model shows the variableWest Taymyr Current (WTC) in the eastern Kara Sea, which carries western Kara Sea waters mixed with riverwater alongshore in agreement with Pavlov and Pfirman [1995]. Upon reaching the narrowing strait, theWTC intensifies and continues eastward, first along the southern edge of VT, and then along the continentalshelf break of the northern Laptev Sea. In VS, the diffuse WTC develops into a strong and well-defined cur-rent, which we henceforth refer to as the Vilkitsky Strait Current (VSC). The VSC is swift and narrow (10–20 km) and propagates eastward along the slopes surrounding the Laptev Sea (Figure 4). During the first200 km of its propagation along VT the velocities decrease with depth, but increase again once the VSCreaches the Laptev continental slope, presumably due to the interaction with other slope currents such asdescribed by Aksenov et al. [2011].
Climatological sections of currents (Figure 5) and salinity (Figure 6) across VS reveal the vertical and horizon-tal structure and seasonal development of the VSC. Cross-strait velocities show a pronounced surface-intensified jet on the strait’s south side, with maximum velocities of >0.5 m s21 during October–December.The jet is �20 km wide, most intense in the upper 20 m and clearly defined to a depth of 80–100 m fromJuly to March, while it is nearly absent from April to June. The structure of the geostrophic velocities (refer-enced to the bottom; not shown) computed from the model’s density cross section is identical to that ofthe current magnitude (Figure 5). Average monthly (0–60 m) geostrophic velocities are 10–30% (summerand fall) to 50% (spring) smaller than the total velocities (Figure 7). The baroclinic flow constitutes70% 6 13% of the currents in VS and implies that the flow is largely buoyancy-driven, which explains thestrong coupling of the jets’ magnitude and structure to the seasonal freshwater cycle of the Ob and Yenisey
Figure 4. Mean (1990–2010) October (a) surface and (b) 70 m current speed from NEMO (m s21).
Journal of Geophysical Research: Oceans 10.1002/2014JC010635
JANOUT ET AL. KARA SEA FRESHWATER TRANSPORT 4929

(Figure 2) and the cross-strait salinity (Figure 6). Discharge of both rivers peaks in June and subsequentlydecreases to the minimum runoff rates from November to April (Figure 2). The �3 month lag between peakrunoff in June and maximum VS velocities in fall may be explained by the time it takes the freshwater tocover the distance of 700–900 km from the rivers’ estuaries to VS.
Salinities are markedly lower on the south side of VS (Figure 6), with minimum values of �29 from October toJanuary. During this time, across-strait isohalines have the steepest slopes corresponding to maximum veloc-ities. Isohalines level out during spring, when surface salinities are maximum (�31 to 32), and velocities areminimum. Upper-ocean temperatures in VS (not shown) are near-freezing year-round except from July toSeptember, when the climatological mean reaches �28C on the strait’s south side in the core of the VSC.Deeper waters in VS are warmer (>218C) and more saline (34.5–34.8), and influenced by Barents Sea Branchwater [Rudels, 2012], which is found in the canyon east of VS as will be shown later.
3.2. Freshwater and Volume Transport Through Vilkitsky StraitTransports across VS were quantified based on NEMO results. Volume transport FVol is computed according to:
FVol5
ðudA; (1)
where u is the cross-strait velocity and A the area of the strait’s cross section. Liquid freshwater transportFFW is estimated using:
Figure 5. Monthly mean velocities across Vilkitsky Strait versus depth from NEMO (1990–2010). The right hand of the transect (km 0) is the south side (i.e., the Laptev Sea side), flowtoward the Laptev Sea is into the page. Black dots in November plot indicate model grid points (see Figure 1 for location).
Journal of Geophysical Research: Oceans 10.1002/2014JC010635
JANOUT ET AL. KARA SEA FRESHWATER TRANSPORT 4930

FFW 5
ðu3
Sref 2SSref
dA; (2)
where S is the salinity and a reference salinity Sref 5 34.80, following Aagaard and Carmack [1989].
Applying (1) and (2) to monthly velocity and salinity from the 21 year simulation results in volume andfreshwater transports that strongly resemble each other, as well as a seasonal cycle that is clearly governedby the seasonality in the VSC (Figure 7). Monthly mean transports are small during spring and early summer,with a minimum in May in volume and freshwater transport of 0.2 6 0.15 Sv (1 Sv 5 106 m3 s21) and4.8 6 3.6 mSv, respectively. Transports increase in late summer/early fall to become maximum in Decem-ber/January, with monthly mean transports of 0.85 6 0.30 Sv (26.4 6 11.8 mSv). The average volume and liq-uid freshwater transports through VS over 21 years of NEMO simulation are 0.53 6 0.08 Sv and497 6 118 km3 a21, respectively.
The mean annual freshwater transport through VS accounts for nearly half of the Kara Sea’s annual riverrunoff, and hence the VSC provides a significant amount of freshwater to the western Laptev Sea shelf andslope region. As shown above, transports vary seasonally with maxima in late fall, but in addition featureconsiderable interannual variability (Figure 8). The two-decade-long transport record suggests a volumetransport that peaks at 1.5 Sv down-strait, such as in late 2001 and in early 2005 (Figure 8), with occasionalreversals (i.e., up-strait transports). In high-flow years, maximum flow in peak transport months can be more
Figure 6. Same as Figure 5 except for salinity.
Journal of Geophysical Research: Oceans 10.1002/2014JC010635
JANOUT ET AL. KARA SEA FRESHWATER TRANSPORT 4931

than twice the average transport. In low-flow years, maximum flow may only be half as much as theaverage.
The dominant baroclinic nature of the VSC explains the close resemblance of the volume and freshwatertransports (Figure 8) and hence a considerable range in the baroclinic flow fraction. While only �30% of theflow appears to be baroclinic during low transports in 2004, a baroclinicity of >95% occurs in 2008 and2009. Overall, the interannual variability in volume and freshwater transport is large enough to play a signif-icant role for the regional and larger-scale freshwater distribution.
3.3. Interannual Transport Variability and Atmospheric ForcingThe transports (Figure 9a) have negative anomalies during several years such as in 1990, 1993, 1998, 2004,and 2010, with values that are up to 0.2 Sv below average for several months. Our modeled salinity/fresh-water content anomaly fields during these years show considerably more freshwater in the western KaraSea along Novaya Zemlya’s east coast, as well as less freshwater in the northeastern Kara Sea along the Tay-myr peninsula toward VS in summer and fall (Figure 10). The corresponding Arctic-wide NCEP [Kalnay et al.,1996] sea level pressure patterns and the resulting wind fields over the Kara Sea show anomalously north-erly winds during each of these minimum transport periods, often accompanied by enhanced easterlywinds (Figure 9b). These conditions favor the advection of river water toward the west, and at the sametime a reduction of the VS outflow. These results confirm and expand on a previous study [Harms andKarcher, 2005], which described wind-forced blocking of the VS outflow in 1998 based on a 5 year long KaraSea simulation.
Blocking-favorable winds develop under the influence of either a summer high-pressure system over theBarents and western Kara Seas and/or a low over the northern Laptev Sea (Figure 9). In the summer aftera year with blocking conditions, the runoff gets added to accumulated freshwater and sets up anenhanced northeastward baroclinic flow along the coast in late summer, which may explain why yearswith negative transport anomalies are followed by years with enhanced volume and freshwater
1 2 3 4 5 6 7 8 9 10 11 120
0.2
0.4
0.6
0.8
1
Vol
ume
Tra
nspo
rt (
SV
)
1 2 3 4 5 6 7 8 9 10 11 120
20
40
60
80
100
FW
Tra
nspo
rt (
km3 m
onth
−1)
Vilkitsky Strait Transports and Velocities
1 2 3 4 5 6 7 8 9 10 11 12
0
0.1
0.2
0.3
0.4
Month
Vel
ocity
(m
s−1
)
total velocity (0−60 m)geostrophic velocity (0−60 m)
Figure 7. Monthly mean (top) volume (Sv) and freshwater (km3 month21) transport through Vilkitsky Strait from NEMO (1990–2010) and(bottom) mean (0–60 m) total (black) and geostrophic velocities (gray) computed from the NEMO density structure. Vertical bars denoteone standard deviation.
Journal of Geophysical Research: Oceans 10.1002/2014JC010635
JANOUT ET AL. KARA SEA FRESHWATER TRANSPORT 4932

transports (Figures 8 and 9). The residence time for Kara Sea river water is between 2.5 years [Hanzlick andAagaard, 1980] and 3.5 years [Schlosser et al., 1994], and considering that the annual mean modeled freshwatertransport through VS is only �half of the annual discharge from Ob and Yenisey, the fate of a significant portionof river water remains uncertain. The Kara Sea’s only wide opening is to the north between Novaya Zemlya andSevernaya Zemlya, which, based on our results and previous simulations [Panteleev et al., 2007] is bounded bythe strong influence of the Barents Sea throughflow (Figure 1b) at least on climatological time scales. For furtherinsights into the Kara Sea-internal conditions during blocking-years, we computed summer volume and fresh-water transports across all major Kara Sea openings (Figure 11). Volume transports in particular indicate a larger-scale effect of these blocking situations such as in 1993, 1998, or 2004, when the largest transport reductions ofnearly 0.5 Sv occured in the Barents Sea opening and the northern Kara Sea. This is plausible considering thatthe corresponding pressure systems (Figure 9) favor an Ekman transport against the eastward and then north-ward flow of the Barents Sea outflow. At the same time, the inflow through Kara Gate is reduced. In contrast,both volume and freshwater transports across the opening between Novaya Zemlya and Severnaya Zemlya(Figure 11) are slightly elevated during blocking-years, which indicates that �one-third (e.g., 1993 and 1998) ofthe negative freshwater transport anomaly exits through the northern Kara Sea instead of VS, while the largershare remains in the Kara Sea. Overall, our simulations largely agree with previous studies [Panteleev et al., 2007]and highlight the importance of the narrow VS as the major Kara Sea freshwater gateway.
The concept of a simple (atmospherically forced) storage-release mechanism is supported by two hydro-graphic cross-slope transects across the presumed pathway of the VSC in the northern Laptev Sea along1268E occupied during the 2004-blocking and 2005-release years (Figures 1 for location; Figure 12). In 2004,salinities above the slope were comparatively high (>30), concurrent with an atmospheric ‘‘blocking’’ pat-tern and reduced VS model outflow. In the following year, the waters were significantly fresher (�28), repre-sentative of enhanced volume and freshwater transports in the simulation.
Meridional summer winds over the eastern Kara Sea appear to influence the variability of volume and fresh-water transport through VS. Therefore, we decompose monthly mean reanalyzed SLP from 608N to 908N
0.2
0.3
0.4
0.5
0.6
0.7
Ann
. Vol
.Tr.
(S
V) a
200
300
400
500
600
700
FW
T (
km3 y
ear−1
)
0
0.5
1
1.5M
onth
ly V
ol.T
r. (
SV
)
b
0
50
100
150
FW
T (
km3 m
onth
−1)
1990 1992 1994 1996 1998 2000 2002 2004 2006 2008 2010
25
50
75
100
Time
Bar
ocl.
flow
frac
tion
(%)
c
Figure 8. Model-based: (a) annual means of volume (blue; Sv) and freshwater transport (red; km3 yr21). (b) Monthly mean volume (blue)and freshwater (red) transports. (c) Baroclinic flow fraction in Vilkitsky Strait, i.e., the fraction of geostrophic versus the total velocities inthe upper 60 m.
Journal of Geophysical Research: Oceans 10.1002/2014JC010635
JANOUT ET AL. KARA SEA FRESHWATER TRANSPORT 4933

into their principal components by use of empirical orthogonal function (EOF) analysis to identify the domi-nant modes of variability in Arctic atmospheric patterns and their relation with Siberian shelf processes. Thedecomposition results in three leading EOF modes, which explain 54.6%, 12.5%, and 9.1% of the variance inmean July–September SLP, similar to findings by Overland and Wang [2010]. The first mode is identical tothe Arctic Oscillation [Thompson and Wallace, 1998], and describes the strength of the polar vortex. The sec-ond highlights the Arctic Dipole Anomaly [Wu et al., 2006], which favors a transpolar circulation from Siberiatoward Fram Strait. Both patterns have the largest signals during winter and show no apparent correlationwith VS transports. Considering that river discharge and wind-driven currents are maximum in the openwater season and when sea ice is thin and mobile, we find that the VS transports best correspond to thethird mode (EOF3). This mode is slightly more pronounced during summer (9.1%) than winter (6.9%) anddescribes a pressure pattern centered approximately halfway between the New Siberian Islands and theNorth Pole (Figure 13), and was previously linked with the freshwater distribution on the Laptev Sea shelf[Dmitrenko et al., 2005; Bauch et al., 2011].
Positive EOF3 patterns within the 1990–2010 simulation period coincide (although not statistically signifi-cant) with minimum modeled VS transports (Figures 8 and 9), such as in 1993, 1998, 2004, and 2010.
Figure 9. (a) Volume transport anomaly through Vilkitsky Strait based on NEMO 1990–2010, x-ticks mark January of each year. (b) NCEP summer wind components over the eastern KaraSea (white star in plot ‘‘1993,’’ averaged from July to September). (c) Principal components from the third leading EOF decomposed from JAS sea level pressure (608N–908N). (d) Summer(JAS) SLP distribution during years characterized by strong negative transport anomalies through Vilkitsky Strait, indicated by green stars in the middle plot.
Journal of Geophysical Research: Oceans 10.1002/2014JC010635
JANOUT ET AL. KARA SEA FRESHWATER TRANSPORT 4934

Larger-scale pressure systems are not necessarily stationary and minor shifts may cause different winds inthe topographically complex eastern Kara Sea, which may in part explain the weak correlations. Further,average summer winds are weaker and may not prevent the establishment of a predominantly buoyancy-driven outflow with the VSC. The mean summer SLP during anomalously positive patterns highlights acyclone, which leads to predominantly shoreward winds in the eastern Kara Sea and alongshore winds inthe Laptev Sea (Figure 13). Overall, the implications of cyclonic versus anticyclonic patterns are considerablefor the distribution of Lena, Ob, and Yenisey waters. Cyclonic conditions block the Kara Sea outflow andfavor an eastward removal of Lena water, which enhances the positive salinity anomaly in the northern Lap-tev Sea (Figure 13), possibly supported by wind-driven onshelf transport of more saline basin water. Theopposite occurs during anticyclonic conditions, which enhance the accumulation of freshwater in the north-ern Laptev Sea due to both a northward diversion of the Lena River plume and an unhampered outflow offresh Kara Sea waters through VS, likely favoring an export of Siberian river water into the Eurasian Basin.
3.4. The Further Pathways and Observations in Vilkitsky TroughUpon exiting VS, the VSC encounters the complex topography of VT with its steep slopes and strong gra-dients in water mass properties between canyon and Laptev Sea shelf. Along the Laptev shelf-canyon edge,
Figure 10. Maps of simulated Kara Sea freshwater content difference (m) between the summers of: (a) 1993 minus 1994; (b) 1998 minus1999; and (c) 2004 minus 2005.
Journal of Geophysical Research: Oceans 10.1002/2014JC010635
JANOUT ET AL. KARA SEA FRESHWATER TRANSPORT 4935

the model features a topographically guided VSC while the subsurface waters inside the canyon are influ-enced by recirculating Barents Sea water (not shown). A high-resolution shelf-to-canyon transect was occu-pied in September 2013 using an underway CTD system (Figure 14). The entire transect is characterized by
Figure 11. (a) Volume (Sv) and (b) freshwater (mSv) transport anomalies from NEMO computed from June to October averages across all major Kara Sea gateways. The colors indicatethe boundaries as shown in the small map (blue: Vilkitsky Strait; green: Kara Gate; red: Franz Josef Land (FJL) to Novaya Zemlya (NZ); black: FJL to Severnaya Zemlya (SZ); magenta: Sho-kalsky Strait; cyan: NZ to SZ).
Figure 12. NABOS salinity transects along 1268E during the summers of (left) 2004 and (right) 2005. Note the comparatively high salinity(low salinity) in 2004 (2005) during negative (positive) freshwater transport anomalies in Vilkitsky Strait. See map in Figure 1 for location.
Journal of Geophysical Research: Oceans 10.1002/2014JC010635
JANOUT ET AL. KARA SEA FRESHWATER TRANSPORT 4936

a sharp halocline, separating the fresh (<31) surface waters from the more saline (>33) waters below 30 m.Surface temperatures are highest (>38C) on the shelf and low over the slope and canyon, which is likelydue to the presence of sea ice in and west of VS at the time of sampling.
The interior canyon waters between 100 and 250 m feature maximum salinities of 34.8 and temperaturesaround 08C, characteristic for the water mass properties that exit the Barents Sea through the eastern sideof St. Anna Trough [Schauer et al., 1997, 2002; Dmitrenko et al., 2014]. Considering that the Barents Seawaters are transported along the Eurasian slope in the Barents Sea branch [Rudels et al., 1999, 2000; Aksenovet al., 2011], it is plausible to find that these waters followed the topography into the dynamically wide VT,where the canyon width of 50–80 km is much larger than the first baroclinic Rossby Radius (�4 km) [Nurserand Bacon, 2014].
Near the base of the canyon’s slope, isotherms and isohalines become vertical, which translates into a dis-tinct boundary layer at the slope favorable for baroclinic flow. The upper 50–100 m above the slope featureclearly depressed isohalines, which implies the presence of enhanced amounts of freshwater directly abovethe slope. Geostrophic velocities based on the hydrographic structure imply surface-intensified currentsabove the shelf edge as well as in a thin boundary layer on the slope. A similar velocity structure was meas-ured with a vessel-mounted ADCP from a cross-canyon transect in September 2011 (Figure 15). Maximumalong-canyon velocities of 25 cm s21 were measured over the south-side of VT, suggesting that the south-ern edge of VT is indeed a region carrying waters that exited the Kara Sea in a surface-enhanced current.
The volume transport through VT at this location amounts to 0.53 Sv based on a canyon width of 75 km, anaverage depth of 250 m, and average down-canyon velocities of 0.03 m s21. This estimate may be low,since the vmADCP misses the strongest flow generally found in the upper 20 m, but provides a firstobservation-based transport estimate from VT, which is close to NEMO’s average VS volume transport. Thehydrographic cross-canyon structure from 2011 (Figure 15) is similar to the one measured in 2013, withstrong shelf-to-canyon gradients and canyon temperature-salinity-properties that imply Barents Sea origin(34.8, �08C). Overall, these observations confirm the existence of a current coming out of the Kara Sea andhence lend support to NEMO’s physically plausible suggestions and underline the importance of the VTregion for the Eurasian Slope and Basin.
3.5. On the Fate of the Kara Sea FreshwaterThe fate of �500 km3 of freshwater exiting VS per year is clearly of regional importance, but mayalso impact the larger-scale Arctic freshwater distribution. To investigate the impact of the VSC onthe Arctic continental slope currents near the mouth of VT, we extracted three transects from the
Figure 13. (top) The black contours indicate the third largest mode of variability, based on an EOF analysis of Arctic Ocean (latitude>608N) summer (JAS) NCEP sea level pressure from 1948 to 2013. This pattern corresponds to a blocking situation of the VSC due toonshore winds (indicated by arrows) over the eastern Kara Sea leading to negative anomalies in Vilkitsky Strait volume and freshwatertransport. At the same time, winds are zonal over the southern Laptev Sea, leading to an eastward diversion of the Lena River plume. Over-all, this situation leads to positive salinity anomalies in the Laptev Sea, as indicated by the red ‘‘S1’’—boxes, and to negative salinityanomalies in the Kara and the East Siberian Seas.
Journal of Geophysical Research: Oceans 10.1002/2014JC010635
JANOUT ET AL. KARA SEA FRESHWATER TRANSPORT 4937
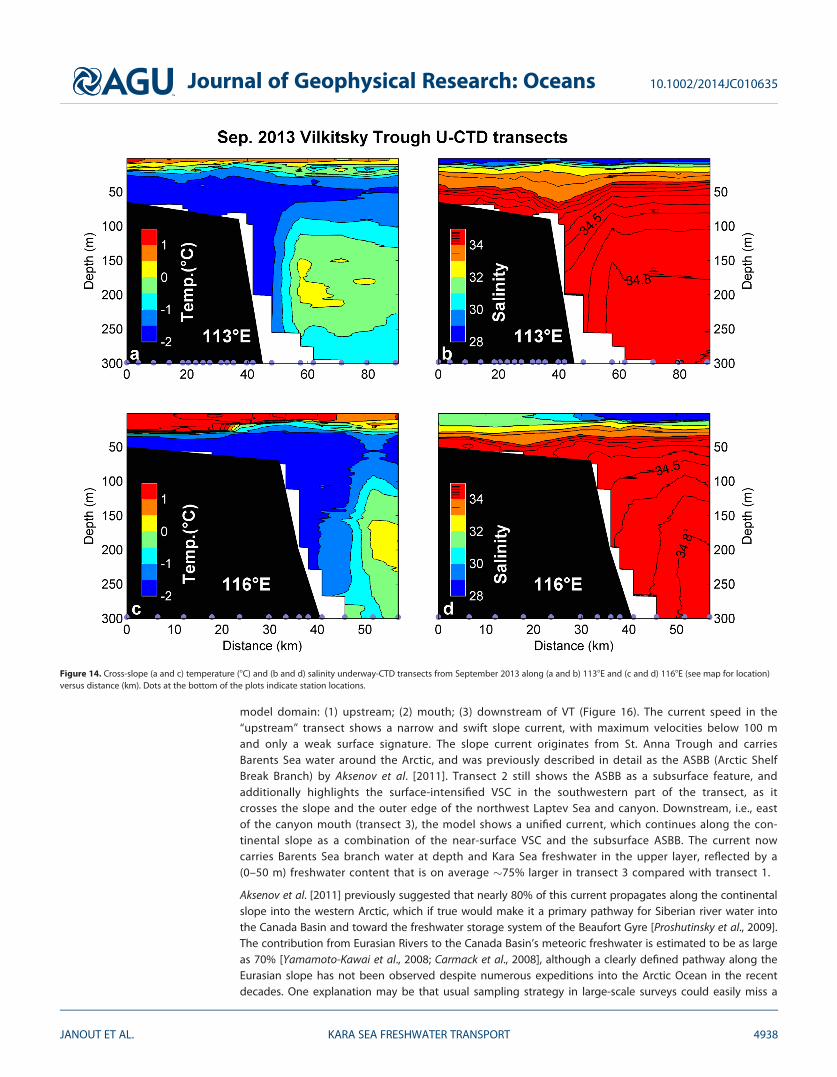
model domain: (1) upstream; (2) mouth; (3) downstream of VT (Figure 16). The current speed in the‘‘upstream’’ transect shows a narrow and swift slope current, with maximum velocities below 100 mand only a weak surface signature. The slope current originates from St. Anna Trough and carriesBarents Sea water around the Arctic, and was previously described in detail as the ASBB (Arctic ShelfBreak Branch) by Aksenov et al. [2011]. Transect 2 still shows the ASBB as a subsurface feature, andadditionally highlights the surface-intensified VSC in the southwestern part of the transect, as itcrosses the slope and the outer edge of the northwest Laptev Sea and canyon. Downstream, i.e., eastof the canyon mouth (transect 3), the model shows a unified current, which continues along the con-tinental slope as a combination of the near-surface VSC and the subsurface ASBB. The current nowcarries Barents Sea branch water at depth and Kara Sea freshwater in the upper layer, reflected by a(0–50 m) freshwater content that is on average �75% larger in transect 3 compared with transect 1.
Aksenov et al. [2011] previously suggested that nearly 80% of this current propagates along the continentalslope into the western Arctic, which if true would make it a primary pathway for Siberian river water intothe Canada Basin and toward the freshwater storage system of the Beaufort Gyre [Proshutinsky et al., 2009].The contribution from Eurasian Rivers to the Canada Basin’s meteoric freshwater is estimated to be as largeas 70% [Yamamoto-Kawai et al., 2008; Carmack et al., 2008], although a clearly defined pathway along theEurasian slope has not been observed despite numerous expeditions into the Arctic Ocean in the recentdecades. One explanation may be that usual sampling strategy in large-scale surveys could easily miss a
Figure 14. Cross-slope (a and c) temperature (8C) and (b and d) salinity underway-CTD transects from September 2013 along (a and b) 1138E and (c and d) 1168E (see map for location)versus distance (km). Dots at the bottom of the plots indicate station locations.
Journal of Geophysical Research: Oceans 10.1002/2014JC010635
JANOUT ET AL. KARA SEA FRESHWATER TRANSPORT 4938

narrow current such as the one described here. A similar current along the Beaufort Sea slope with horizon-tal scales of 10–15 km was observed with hydrographic observations [Pickart, 2004] and a high-resolutionmooring array [Spall et al., 2008; Nikolopoulos et al., 2009], which provides an excellent example for the ben-efits of finer-scale sampling. The 2013 cross-slope U-CTD transects resolved the shelf break region with amaximum horizontal resolution of 3–6 km near 1138E and 1168E (Figure 14). Both transects resolve a frontlocated in a narrow band between the slopeward edge of the warmer (Barents Sea branch) water and theslope, most pronounced below 100 m depth. Isotherms are vertical in the front, with horizontal temperaturegradients of up to 28C over less than 10 km. These transects highlight a density structure that is favorablefor maintaining a geostrophic baroclinic flow along the continental slope as suggested by the model, andunderline the need for more modern sampling strategies that allow better resolution of these narrowfronts.
4. Discussion
The aim of this paper is to characterize the VSC including its transports and variability on seasonal and inter-annual time scales, and we therefore provide only limited insights into processes that occur on shorter
Figure 15. Cross-canyon CTD and vmADCP transect carried out by RV Polarstern in September 2011. (a) Salinity, (b) temperature (8C) over-laid by density contours (kg m23), (c) vessel-mounted ADCP velocity (m s21, positive eastward); small insert map in Figure 15b shows thelocation of CTD stations (blue dots) and ADCP transect (red line). Black dots in Figures 15a and 15b indicate station locations. The blackshading indicates the along-track bottom topography, extracted from IBCAO [Jakobsson et al., 2008].
Journal of Geophysical Research: Oceans 10.1002/2014JC010635
JANOUT ET AL. KARA SEA FRESHWATER TRANSPORT 4939

(tides to storms) time scales. On seasonal scales, the VSC is a stable current that (in the model) steadily flowsfrom the origin in VS all the way into the Canada Basin. However, along its path the VSC experiences suddentopographic changes near the mouth of VT (see Figure 1) where it is also exposed to fast-propagating Arcticstorms, both conditions which are favorable for generating barotropic and baroclinic instabilities. Instabil-ities in a buoyant current can generate eddies which may transport some of the Kara Sea freshwater intothe Eurasian Basin and potentially modify our conclusions gained in this paper, and should therefore besubject to future investigations.
Sea ice-ocean models including the one used in this study generally do not correctly implement landfastice (LFI) [Proshutinsky et al., 2007], which might affect certain aspects of the coastal ocean circulation. Forinstance, Itkin et al. [2015] discussed consequences of LFI on brine formation and river water pathways inthe Laptev Sea based on a simple LFI parameterization in a regional circulation model. Kasper and Weingart-ner [2015] investigated the effect of LFI on a river plume along a straight shelf such as the Alaskan BeaufortSea with an idealized model. They found that introducing LFI enhanced vertical mixing due to frictional cou-pling between ice and river plume and resulted in a subsurface velocity maximum and a seaward displace-ment of the plume. Johnson et al. [2012, hereafter J12] implemented LFI in a model by not allowing sea iceto move from November to May in regions shallower than 28 m, and found an ice thickness decrease inparts of the Siberian shelves (most noticeable between the eastern Laptev and the western Chukchi Sea)relative to a control run without LFI. J12 explained their findings by slower (thermodynamic) ice growthbecause LFI inhibits ice ridging and deformation.
Since significant parts of the northeastern Kara Sea are covered by LFI in winter and spring [Divine et al., 2004],we investigated the previous model results from J12 in more detail in order to obtain qualitative insightsregarding the role of LFI on VS transports. We compared the volume and freshwater transports in VS from bothexperiments (LFI and the control run) described in J12, and found only marginal differences in the volumetransports (2% in summer June–October,<1% from December to March). Freshwater transports were 11 6 7%larger in summer-fall (June–October), and 15 6 4% smaller in the winter-spring (December–March) with animplementation of LFI, thus the seasonal cycle of the transports is reduced in the LFI simulations. The LFIparameterization in the model inhibited ice export in the Eastern Kara Sea (predominantly north-eastwardtoward the Nansen Basin in the control run), increasing ice divergence and open water at the outer LFI edge.The effect of the LFI parameterization was such that ice production and salt fluxes in winter and spring weremoderately reduced near the LFI-covered coast, but greatly enhanced at the outer LFI edge, thus overall reduc-ing VS freshwater transport in the LFI run. While we cannot necessarily expect a realistic representation of LFI
Figure 16. Current speed (m s21) in three model-based example transects from January 2004, showing the merging of the Barents Seabranch with the Vilkitsky Strait Current. Bottom plot shows the location of the three transects.
Journal of Geophysical Research: Oceans 10.1002/2014JC010635
JANOUT ET AL. KARA SEA FRESHWATER TRANSPORT 4940

with a simple parameterization, this comparison indicates that the absence of LFI on the southern Kara andLaptev Sea shelves moderately increases the uncertainty in our results, although it is not detrimental for thepresented conclusions. A more physical representation of LFI should be considered in future model studies.
Tides are not implemented in our study, and although tides are generally small in the Arctic [Padman and Ero-feeva, 2004], some shelf regions such as the Laptev Sea feature substantial tidal currents with the potential toincrease vertical mixing [Janout and Lenn, 2014]. A similar conclusion is reached by model studies regardingthe role of tides on Arctic hydrographic properties (M. V. Luneva et al., The effects of tides on the water massmixing and sea ice in the Arctic Ocean, submitted to Journal of Geophysical Research, 2015), which found indi-cations for enhanced tide-induced mixing manifested by colder and fresher bottom waters in parts of theKara Sea. However, tidal currents are weak along the northeastern Kara Sea coast and the VSC pathway in VT[Padman and Erofeeva, 2004] and north of the Laptev Sea [Pnyushkov and Polyakov, 2012] and likely wouldnot noticeably affect the properties of the VSC. Therefore, we expect that our conclusions regarding the path-way of the VSC and the Siberian freshwater are not substantially biased by neglecting the tides.
Our results suggest that a considerable portion of the Kara Sea freshwater enters the Laptev Sea and Eurasiancontinental slope region in a pronounced surface-intensified current, which strongly varies on seasonal andinterannual time scales. The estimated �500 km3 a21 only account for the liquid freshwater portion, while anadditional part of the Kara Sea freshwater may leave the shelf as sea ice. However, the Siberian shelves are vastand often ice-free during recent summers. Satellite-based studies showed that sea ice formed in the river plumenear the Lena Delta region is not exported into the Basin but rather melts on the shelf [Krumpen et al., 2013],which supports the assumption that the majority of freshwater is exported in its liquid phase, at least in the Lap-tev Sea. Mean model-based Kara Sea ice export estimates are 220 km3 a21 [Kern et al., 2005], although therecent advances to remotely sense sea ice thickness may allow more robust ice volume fluxes in the future.
The VS freshwater transport alone, computed as the freshwater anomaly relative to a salinity of 34.8 [Aagaardand Carmack, 1989], comprises �30% of the Pacific freshwater inflow through Bering Strait [Woodgate et al.,2012]. However, our estimate is low since additional smaller export pathways through the Severnaya Zemlyaislands as well as sea ice export were not considered. Further, the model uses climatological mean river discharge[Dai and Trenberth, 2002] and does not consider observed trends or interannual variability in runoff [Petersonet al., 2002]. These, however, are small (O(10%)) compared with the atmospherically controlled VS freshwatertransport variability (O(50%)). The Kara Sea outflow is regulated by pressure patterns that may simultaneouslyaffect the distribution of the Laptev Sea freshwater. Figures 9 and 13 indicate that onshore winds in the Kara Seablock the VS outflow, while alongshore winds near the Lena Delta export freshwater into the East Siberian Sea.This implies that larger-scale pressure systems during summer may primarily control the distribution and fate ofthree of the earth’s largest rivers. Morison et al. [2012] observed an increase in Canadian Basin freshwater alongwith a decrease in Eurasian Basin freshwater, which they attributed to alterations in the pathways of Siberian riverrunoff under varying AO conditions. Similarly, Steele and Ermold [2004] linked decadal salinity trends on the Sibe-rian shelves to the AO. Panteleev et al. [2007] related moderately elevated VS transports in their assimilationmodel to anomalous westerly winds over the Kara Sea prevalent during positive summer AO conditions. In con-trast, the interannual variability in Arctic Ocean freshwater storage in recent decades does not noticeably relateto the AO, but rather corresponds to changes in regional wind and ocean circulation [Rabe et al., 2014]. Similarly,our VS transports show no obvious relationship with summer or winter AO, which indicates that, as earlier studiessuggest [Bauch et al., 2011], regional conditions dominate the Siberian freshwater pathways.
The open water season is crucial in shaping the hydrographic conditions, as this is the time of the year ofmaximum river discharge, baroclinic flows develop, and wind stress imparts advection and vertical mixing.The recent years were characterized by freeze ups that were delayed well into October, which leaves theocean under a prolonged and stronger influence of fall storms. A continuation of this trend might poten-tially alter the predominantly baroclinic structure of the VSC and enhance synoptic-scale horizontal and ver-tical freshwater dispersion, which makes the pathways and distribution of Siberian freshwater depend moreon the local variability of the wind patterns and less on the continental freshwater discharge.
5. Summary and Conclusion
This paper characterizes the Vilkitsky Strait Current (VSC) including its volume and freshwater transportsand their seasonal and interannual variability based on a well-resolved (�3 km) numerical model (NEMO)
Journal of Geophysical Research: Oceans 10.1002/2014JC010635
JANOUT ET AL. KARA SEA FRESHWATER TRANSPORT 4941

complemented by recent shipboard observations. The surface-intensified 10–20 km wide VSC is the contin-uation of the variable West Taymyr Current in the eastern Kara Sea and the primary pathway to carry riverrunoff from the Kara Sea through Vilkitsky Strait (VS) and subsequently along Vilkitsky Trough (VT) and thecontinental slope along the Laptev Sea (Figure 4). Some recent shipboard surveys from VT across the pre-sumed VSC pathway qualitatively confirm the existence of enhanced flow and lower-salinity waters overthe southern canyon slope (Figures 14 and 15), although a direct comparison with model results is not pos-sible due to nonoverlapping time periods. The VSC is strongest during October–March and nearly recedesfrom April to July (Figures 5–7), with annual mean volume and freshwater transports of 0.53 6 0.08 Sv and497 6 118 km a21, respectively, based on a 21 year simulation. The VSC is predominantly buoyancy-driven,with a fraction of baroclinic-to-total flow that varies from �50% in spring to �90% in fall.
Strong interannual VSC transport variability is explained by a storage-release mechanism, which is domi-nated by atmospheric pressure patterns during summer (Figures 9 and 13), when winds have the maximumimpact on the river plume distribution. Minimum transports occur, when northerly or northeasterly windsdue to a low-pressure system north of the Laptev Sea prevent the along-coast spreading of freshwater andblock the outflow through VS. The blocking accumulates freshwater on the shelf, which is then released inthe following year when the next pulse of runoff gets added and sets up an alongshore baroclinic flowtoward VS. The same pattern causes westerly winds over the Laptev Sea, which then favors the removal ofLena water toward the East Siberian Sea, and overall strengthens a positive salinity anomaly in the northernLaptev Sea (Figure 13).
The model suggests that upon arrival at the canyon mouth, the VSC merges with the Barents Sea Branch ofthe Arctic Boundary Current (Figure 16), and subsequently follows the Eurasian continental slope into theCanadian Basin. The interaction between these two baroclinic currents is not understood and requires acloser investigation. If these results hold, the VSC would be a primary pathway for Siberian river watertoward the Beaufort Gyre freshwater storage system, and would hence impact Arctic freshwater distribu-tion. Our conclusions here are mainly based on long-term mean model results. These are qualitatively sup-ported by the few observations that exist from this region that is characterized by complex bathymetry(straits, submarine canyon, steep slopes), multiple contrasting water masses, difficult sea ice conditions, andthe largest river discharge to be found in the Arctic. The measurements presented in this paper underlinethe need for modern sampling strategies to better resolve fronts and baroclinic currents, regional featuresthat occur on small enough scales to be missed by classic large-scale surveys, but which may explain miss-ing links in the Arctic Ocean system.
Clearly, further steps have to be taken to investigate the stability of the VSC and associated freshwaterfluxes to obtain more reliable budgets and, perhaps more importantly, to identify ‘‘hot spots,’’ where eddyfluxes export the shelves’ freshwater to the Arctic interior. Eddy fluxes are assumed to supply the Arctichalocline waters as well as to provide the potential energy needed to drive the cyclonic boundary current[Spall, 2013], and the only way to investigate these further is by use of high-resolution numerical models,ideally supported by high-resolution year-round measurements.
ReferencesAagaard, K., and E. C. Carmack (1989), The role of sea ice and other fresh water in the Arctic circulation, J. Geophys. Res., 94, 14,485–14,498,
doi:10.1029/JC094iC10p14485.Aagaard, K., L. K. Coachman, and E. C. Carmack (1981), On the halocline of the Arctic Ocean, Deep Sea Res., Part A, 28, 529–545.Aksenov, Y., V. V. Ivanov, A. J. G. Nurser, S. Bacon, I. V. Polyakov, A. C. Coward, A. C. Naveira-Garabato, and A. Beszczynska-Moeller (2011),
The Arctic circumpolar boundary current, J. Geophys. Res., 116, C09017, doi:10.1029/2010JC006637.Alkire, M. B., K. K. Falkner, J. Morison, R. W. Collier, C. K. Guay, R. A. Desiderio, I. G. Rigor, and M. McPhee (2010), Sensor-based profiles of the
NO parameter in the central Arctic and southern Canada Basin: New insights regarding the cold halocline, Deep Sea Res., Part I, 57,1432–1443, doi:10.1016/j.dsr.2010.07.011.
Bacon, S., A. Marshall, N. P. Holliday, Y. Aksenov, and S. R. Dye (2014), Seasonal variability of the East Greenland Coastal Current, J. Geophys.Res. Oceans, 119, 3967–3987, doi:10.1002/2013JC009279.
Barnier, B., et al. (2006), Impact of partial steps and momentum advection schemes in a global ocean circulation model at eddy permittingresolution, Ocean Dyn., 56, 543–567.
Bauch, D., M. Gr€oger, I. Dmitrenko, J. H€olemann, S. Kirillov, A. Mackensen, E. Taldenkova, and N. Andersen (2011), Atmospheric controlledfreshwater release at the Laptev Sea continental margin, Polar Res., 30, 1–14, doi:10.3402/polar.v30i0.5858.
Carmack, E., F. McLaughlin, M. Yamamoto-Kawai, M. Itoh, K. Shimada, R. Krishfield, and A. Proshutinsky (2008), Freshwater storage in theNorthern Ocean and the special role of the Beaufort Gyre, in Arctic-Subarctic Ocean Fluxes: Defining the Role of the Northern Seas inClimate, edited by R. R. Dickson, J. Meincke, and P. Rhines, pp. 145–170, Springer, Dordrecht, Netherlands.
AcknowledgmentsFinancial support for the Laptev SeaSystem project was provided by theGerman Federal Ministry of Educationand Research (grants BMBF 03G0759Band 03G0833B) and the Ministry ofEducation and Science of the RussianFederation. The 2011 CTD and ADCPdata are available at http://www.pangea.de. NABOS data are availableat http://nabos.iarc.uaf.edu. NCEPReanalysis data were provided by theNOAA-CIRES Climate DiagnosticsCenter, Boulder, CO, USA, from theirWeb site at http://www.cdc.noaa.gov/.Data from the 2013 CTD survey as wellas the model results will be madeavailable by the authors upon request([email protected]). Riverdischarge data were downloaded fromthe Arctic RIMS website (http://rims.unh.edu/data.shtml). The study is alsoa contribution to the TEA-COSI Projectof the UK Arctic Research Program(NERC grant NE/I028947/), The UKNatural Environment Research Council(NERC) Marine Centres’ StrategicResearch Program. We thank theForum for Arctic Ocean Modeling andObservational Synthesis (FAMOS),funded by the National ScienceFoundation Office of Polar Programs(awards PLR-1313614 and PLR-1203720), for providing an opportunityto discuss the presented ideas at theFAMOS meetings. The NOCS-ORCAsimulations were completed as part ofthe DRAKKAR collaboration [Barnieret al., 2006]. NOC also acknowledgesthe use of UK National HighPerformance Computing Resource. Wethank the crews and captains of thevarious research vessels involved ingenerating the observations. Wesincerely acknowledge the thoroughcomments from the Editor(A. Proshutinsky) and two anonymousreviewers, which helped to improvethe manuscript.
Journal of Geophysical Research: Oceans 10.1002/2014JC010635
JANOUT ET AL. KARA SEA FRESHWATER TRANSPORT 4942

Dai, A., and K. E. Trenberth (2002), Estimates of freshwater discharge from continents: Latitudinal and seasonal variations, J.Hydrometeorol., 3, 660–687.
Divine, D. V., R. Korsnes, and A. P. Makshtas (2004), Temporal and spatial variation of shore-fast ice in the Kara Sea, Cont. Shelf Res., 24,1717–1736, doi:10.1016/j.csr.2004.05.010.
Divine, D. V., R. Korsnes, A. P. Makshtas, F. Godtliebsen, and H. Svendsen (2005), Atmospheric-driven state transfer of shore-fast ice in thenortheastern Kara Sea, J. Geophys. Res., 110, C09013, doi:10.1029/2004JC002706.
Dmitrenko, I., S. Kirillov, H. Eicken, and N. Markova (2005), Wind-driven summer surface hydrography of the eastern Siberian shelf, Geophys.Res. Lett., 32, L14613, doi:10.1029/2005GL023022.
Dmitrenko, I. A., et al. (2014), Heat loss from the Atlantic water layer in the northern Kara Sea: Causes and consequences, Ocean Sci., 10,719–730, doi:10.5194/os-10-719-2014.
Fichefet, T., and M. A. Morales Maqueda (1997), Sensitivity of a global sea ice model to the treatment of ice thermodynamics anddynamics, J. Geophys. Res., 102, 12,609–12,646.
Giles, K. A., S. W. Laxon, A. L. Ridout, D. J. Wingham, and S. Bacon (2012), Western Arctic Ocean freshwater storage increased by wind-driven spin-up of the Beaufort Gyre, Nat. Geosci., 5, 194–197, doi:10.1038/ngeo1379.
Guay, C. K., R. D. Falkner, R. D. Muench, M. Mensch, M. Frank, and R. Bayer (2001), Wind-driven transport pathways for Eurasian Arctic riverdischarge, J. Geophys. Res., 106, 11,469–11,480.
Hanzlick, D., and K. Aagaard (1980), Freshwater and Atlantic Water in the Kara Sea, J. Geophys. Res., 85, 4937–4942.Harms, I. H., and M. J. Karcher (1999), Modeling the seasonal variability of hydrography and circulation in the Kara Sea, J. Geophys. Res., 104,
13,431–13,448.Harms, I. H., and M. J. Karcher (2005), Kara Sea freshwater dispersion and export in the late 1990s, J. Geophys. Res., 110, C08007, doi:
10.1029/2004JC002744.Harms, I. H., M. J. Karcher, and D. Dethleff (2000), Modelling Siberian river runoff—Implications for contaminant transport in the Arctic
Ocean, J. Mar. Syst., 27, 95–115.Holmes, R. M., et al. (2011), Seasonal and annual fluxes of nutrients and organic matter from large rivers to the Arctic Ocean and
surrounding seas, Estuaries Coasts, 35(2), 369–382, doi:10.1007/s12237-011-9386-6.Itkin, P., M. Losch, and R. Gerdes (2015), Landfast ice affects the stability of the Arctic halocline: Evidence from a numerical model, J.
Geophys. Res. Oceans, 120, 2622–2635, doi:10.1002/2014JC010353.Jakobsson, M., R. Macnab, L. Mayer, R. Anderson, M. Edwards, J. Hatzky, H. W. Schenke, and P. Johnson (2008), An improved bathymetric
portrayal of the Arctic Ocean: Implications for ocean modeling and geological, geophysical and oceanographic analyses, Geophys. Res.Lett., 35, L07602, doi:10.1029/2008GL033520.
Janout, M. A., and Y. D. Lenn (2014), Semidiurnal tides on the Laptev Sea Shelf based on oceanographic moorings with implications forshear and vertical mixing, J. Phys. Oceanogr., 44(1), 202–219, doi:10.1175/JPO-D-12-0240.1.
Janout, M. A., J. H€olemann, and T. Krumpen (2013), Cross-shelf transport of warm and saline water in response to sea ice drift on theLaptev Sea shelf, J. Geophys. Res. Oceans, 118, 563–576, doi:10.1029/2011JC007731.
Johnson, D. R., T. A. McClimans, S. King, and Ø. Grenness (1997), Fresh water masses in the Kara Sea during summer, J. Mar. Syst., 12, 127–145.Johnson, M., et al. (2012), Evaluation of Arctic sea ice thickness simulated by Arctic Ocean Model Intercomparison Project models, J.
Geophys. Res., 117, C00D13, doi:10.1029/2011JC007257.Kalnay, E., et al. (1996), The NCEP/NCAR 40-year reanalysis project, Bull. Am. Meteorol. Soc., 77, 437–471.Kasper, J. L., and T. J. Weingartner (2015), The spreading of a buoyant plume beneath a landfast ice cover, J. Phys. Oceanogr., 45, 478–494,
doi:10.1175/JPO-D-14-0101.1.Kern, S., I. Harms, S. Bakan, and Y. Chen (2005), A comprehensive view of Kara Sea polynya dynamics, sea-ice compactness and export
from model and remote sensing data, Geophys. Res. Lett., 32, L15501, doi:10.1029/2005GL023532.Krumpen, T., M. A. Janout, K. I. Hodges, R. Gerdes, F. Ardhuin, J. A. Hoelemann, and S. Willmes (2013), Variability and trends in Laptev Sea
ice outflow between 1992–2011, Cryosphere, 7(1), 349–363.Lique, C., and M. Steele (2012), Where can we find a seasonal cycle of the Atlantic water temperature within the Arctic Basin?, J. Geophys.
Res., 117, C03026, doi:10.1029/2011JC007612.Madec, G., and the NEMO Team (2011), NEMO Ocean Engine, Version 3.2, Note du Pole de Modelisation de l’Institut Pierre-Simon Laplace,
vol. 27, report, Paris.Morison, J., R. Kwok, C. Peralta-Ferriz, M. Alkire, I. Rigor, R. Andersen, and M. Steele (2012), Changing Arctic Ocean freshwater pathways,
Nature, 481, 66–70, doi:10.1038/nature10705.Nikolopoulos, A., R. S. Pickart, P. S. Fratantoni, K. Shimada, D. J. Torres, and E. P. Jones (2009), The western Arctic boundary current at
1528W: Structure, variability, and transport, Deep Sea Res., Part II, 56, 1164–1181, doi:10.1016/j.dsr2.2008.10.014.Nurser, A. J. G., and S. Bacon (2014), The Rossby radius in the Arctic Ocean, Ocean Sci., 10, 967–975, doi:10.5194/os-10-967-2014.Overland, J. E., and M. Wang (2010), Large-scale atmospheric circulation changes are associated with the recent loss of Arctic sea ice,
Tellus, Ser. A, 62, 1–9, doi:10.1111/j.1600-0870.2009.00421.x.Padman, L., and S. Erofeeva (2004), A barotropic inverse tidal model for the Arctic Ocean, Geophys. Res. Lett., 31, L02303, doi:10.1029/
2003GL019003.Panteleev, G., A. Proshutinsky, M. Kulakov, D. A. Nechaev, and W. Maslowski (2007), Investigation of the summer Kara Sea circulation
employing a variational data assimilation technique, J. Geophys. Res., 112, C04S15, doi:10.1029/2006JC003728.Pavlov, V. K., and S. I. Pfirman (1995), Hydrographic structure and variability of the Kara Sea: Implication for pollutant distribution, Deep Sea
Res., Part II, 42, 1369–1390.Pavlov, V. K., L. A. Timokhov, G. A. Baskakov, M. Y. Kulakov, V. K. Kurazhov, P. V. Pavlov, S. V. Pivovoarov, and V. V. Stanovoy (1996),
Hydrometeorological regime of the Kara, Laptev, and East-Siberian Seas, Tech. Memo. APL-UW TM 1-96, 179 pp., Appl. Phys. Lab., Univ.of Wash., Seattle.
Peterson, B. J., R. M. Holmes, J. W. McClelland, C. J. V€or€osmarty, R. B. Lammers, A. I. Shiklomanov, I. A. Shiklomanov, and S. Rahmstorf(2002), Increasing river discharge to the Arctic Ocean, Science, 298, 2171–2173.
Pickart, R. S. (2004), Shelfbreak circulation in the Alaskan Beaufort Sea: Mean structure and variability, J. Geophys. Res., 109, C04024, doi:10.1029/2003JC001912.
Pnyushkov, A. V., and I. V. Polyakov (2012), Observations of tidally induced currents over the continental slope of the Laptev Sea, ArcticOcean, J. Phys. Oceanogr., 42, 78–94.
Proshutinsky, A., I. Ashik, S. H€akkinen, E. Hunke, R. Krishfield, M. Maltrud, W. Maslowski, and J. Zhang (2007), Sea level variability in theArctic Ocean from AOMIP models, J. Geophys. Res., 112, C04S08, doi:10.1029/2006JC003916.
Journal of Geophysical Research: Oceans 10.1002/2014JC010635
JANOUT ET AL. KARA SEA FRESHWATER TRANSPORT 4943

Proshutinsky, A., R. Krishfield, M.-L. Timmermans, J. Toole, E. Carmack, F. McLaughlin, W. J. Williams, S. Zimmermann, M. Itoh, andK. Shimada (2009), Beaufort Gyre freshwater reservoir: State and variability from observations, J. Geophys. Res., 114, C00A10, doi:10.1029/2008JC005104.
Proshutinksy, A. Y., and M. A. Johnson (1997), Two circulation regimes of the wind-driven Arctic Ocean, J. Geophys. Res., 102, 12,493–12,514.
Rabe, B., M. Karcher, F. Kauker, U. Schauer, J. M. Toole, R. A. Krishfield, S. Pisarev, T. Kikuchi, and J. Su (2014), Arctic Ocean basin liquidfreshwater storage trend 1992–2012, Geophys. Res. Lett., 41, 961–968, doi:10.1002/2013GL058121.
Rudels, B. (2012), Arctic Ocean circulation and variability—Advection and external forcing encounter constraints and local processes,Ocean Sci., 8, 261–286.
Rudels, B., H. J. Friedrich, and D. Quadfasel (1999), The Arctic Circumpolar Boundary Current, Deep Sea Res., Part II, 46, 1023–1062.Rudels, B., R. D. Muench, J. Gunn, U. Schauer, and H. J. Friedrich (2000), Evolution of the Arctic Ocean boundary current north of the
Siberian shelves, J. Mar. Syst., 25, 77–99.Schauer, U., R. D. Muench, B. Rudels, and L. Timokhov (1997), The impact of eastern Arctic Shelf Waters on the Nansen Basin intermediate
layers, J. Geophys. Res., 102, 3371–3382.Schauer, U., H. Loeng, B. Rudels, V. K. Ozhigin, and W. Dieck (2002), Atlantic Water flow through the Barents and Kara Seas, Deep Sea Res.,
Part I, 49, 2281–2298.Schauer, U., B. Rabe, and A. Wisotzki (2012), Physical Oceanography During POLARSTERN Cruise ARK-XXVI/3, Alfred Wegener Inst., Helmholtz
Cent. for Polar and Mar. Res., Bremerhaven, Germany, doi:10.1594/PANGAEA.774181.Schlosser, P., D. Bauch, R. Fairbanks, and G. B€onisch (1994), Arctic river runoff: Mean residence time on the shelves and in the halocline,
Deep Sea Res., Part I, 41, 1053–1068.Schlosser, P., J. H. Swift, D. Lewis, and S. Pfirman (1995), The role of the large-scale Arctic Ocean circulation in the transport of Contami-
nants, Deep Sea Res., Part II, 42(6), 1341–1367.Serreze, M. C., A. P. Barrett, A. G. Slater, R. A. Woodgate, K. Aagaard, R. B. Lammers, M. Steele, R. Moritz, M. Meredith, and C. M. Lee (2006),
The large-scale freshwater cycle of the Arctic, J. Geophys. Res., 111, C11010, doi:10.1029/2005JC003424.Shiklomanov, I. A., A. I. Shiklomanov, R. B. Lammers, B. J. Peterson, and A. J. Vorosmarty (2000), The dynamics of river water inflow to the
Arctic Ocean, in Fresh Water Budget of the Arctic Ocean, edited by E. L. Lewis, pp. 281–296, Kluwer Acad., Norwell, Mass.Spall, M. A. (2013), On the circulation of Atlantic Water in the Arctic Ocean, J. Phys. Oceanogr., 43, 2352–2371, doi:10.1175/JPO-D-13-
079.1.Spall, M. A., R. S. Pickart, P. Fratantoni, and A. Plueddemann (2008), Western Arctic shelfbreak eddies: Formation and transport, J. Phys.
Oceanogr., 38, 1644–1668.Steele, M., and W. Ermold (2004), Salinity trends on the Siberian Shelves, Geophys. Res. Lett., 31, L24308, doi:10.1029/2004GL021302.Thompson, D. W. J., and J. M. Wallace (1998), The Arctic Oscillation signature in the wintertime geopotential height and temperature fields,
Geophys. Res. Lett., 25, 1297–1300, doi:10.1029/98GL00950.Ullman, D. S., and D. Hebert (2014), Processing of Underway CTD Data, J. Atmos. Oceanic Technol., 31, 984–998, doi:10.1175/JTECH-D-13-
00200.1.Weingartner, T. J., S. Danielson, Y. Sasaki, V. Pavlov, and M. Kulakov (1999), The Siberian coastal current: A wind- and buoyancy-forced Arc-
tic coastal current, J. Geophys. Res., 104, 29,697–29,714.Winsor, P., and G. Bj€ork (2000), Polynya activity in the Arctic Ocean from 1958 to 1997, J. Geophys. Res., 105, 8789–8803, doi:10.1029/
1999JC900305.Woodgate, R. A., T. J. Weingartner, and R. Lindsay (2012), Observed increases in Bering Strait oceanic fluxes from the Pacific to the
Arctic from 2001 to 2011 and their impacts on the Arctic Ocean water column, Geophys. Res. Lett., 39, L24603, doi:10.1029/2012GL054092.
Wu, B., J. Wang, and J. E. Walsh (2006), Dipole anomaly in the winter Arctic atmosphere and its association with sea ice motion, J. Clim., 19,210–225.
Yamamoto-Kawai, M., F. A. McLaughlin, E. C. Carmack, S. Nishino, and K. Shimada (2008), Freshwater budget of the Canada Basin, ArcticOcean, from salinity, d18O, and nutrients, J. Geophys. Res., 113, C01007, doi:10.1029/2006JC003858.
Yu, Y., H. Stern, C. Fowler, F. Fetterer, and J. Maslanik (2014), Interannual variability of Arctic landfast ice between 1976 and 2007, J. Clim.,27, 227–243, doi:10.1175/JCLI-D-13-00178.1.
Zhang, X., J. Walsh, U. Bhatt, and M. Ikeda (2004), Climatology and interannual variability of Arctic cyclone activity: 1948–2002, J. Clim., 17,2300–2317.
Journal of Geophysical Research: Oceans 10.1002/2014JC010635
JANOUT ET AL. KARA SEA FRESHWATER TRANSPORT 4944