Kaolin Concept Study 20210712 Final
149
Page 1 of 149 Concept Study – July 2021 Surprise Kaolin Project
Transcript of Kaolin Concept Study 20210712 Final
Page 1 of 149
Concept Study – July 2021
Surprise Kaolin Project
Page 2 of 149
Table of Contents 1. Executive Summary ........................................................................................................ 11
a) Context ........................................................................................................................ 11
b) Kaolin & Metakaolin .................................................................................................... 11
c) Business Configuration ................................................................................................ 12
d) Preliminary Economic Assessment .............................................................................. 15
e) Project Development Pathway .................................................................................... 20
f) Environmental and Permitting Considerations ........................................................... 21
g) Risks and Opportunities ............................................................................................... 22
2. Introduction .................................................................................................................... 22
a) InterGroup Mining ....................................................................................................... 22
b) The Surprise Project .................................................................................................... 22
c) Project Outline ............................................................................................................. 23
d) Kaolin Market .............................................................................................................. 24
e) Metakaolin Market and Use ........................................................................................ 24
f) Report Objective .......................................................................................................... 25
g) Use of This Report ....................................................................................................... 25
3. Reliance on Experts ........................................................................................................ 25
4. Property Description and Location ................................................................................. 27
5. Accessibility, Climate, Local Resources, Infrastructure and Physiography ..................... 28
a) Accessibility ................................................................................................................. 28
b) Climate ........................................................................................................................ 29
c) Land Use ...................................................................................................................... 29
d) Local Infrastructure ..................................................................................................... 29
6. History ............................................................................................................................ 29
a) History of Cement Development ................................................................................. 29
b) Modern Cement Chemistry ......................................................................................... 30
c) Cement Additions ........................................................................................................ 30
d) Cement Chemistry and Pozzolan Reactions ................................................................ 32
e) Artificial Pozzolans ....................................................................................................... 34
f) Metakaolin in Cement ................................................................................................. 36
7. Geological Setting and Mineralization of the Kaolin Deposits ....................................... 37
Page 3 of 149
a) Geological Setting ........................................................................................................ 37
b) Kaolin Mineralisation ................................................................................................... 39
8. Deposit Types ................................................................................................................. 39
a) Kaolin Mineralisation ................................................................................................... 39
b) Gold Mineralisation ..................................................................................................... 40
9. Exploration ..................................................................................................................... 40
a) Kaolin Exploration Targets ........................................................................................... 40
b) Initial Exploration ........................................................................................................ 41
10. Drilling ......................................................................................................................... 45
a) Drilling Evaluation ........................................................................................................ 45
b) Future Drilling .............................................................................................................. 48
c) Kaolin Exploration Targets Estimation ......................................................................... 50
a. Surprise Project Target Estimation .............................................................................. 50
d) Surprise Pit Area Target Estimation ............................................................................. 52
11. Sample Preparation, Analyses and Security ................................................................ 53
a) Drilling Procedures ...................................................................................................... 53
12. Data Verification .......................................................................................................... 57
13. Mineral Processing and Metallurgical Testing ............................................................. 57
a) Pozzolanic Material Specifications and Testing ........................................................... 57
b) Test Work Completed to Date ..................................................................................... 58
14. Mineral Resource Estimates ........................................................................................ 69
15. Mineral Reserve Estimates .......................................................................................... 69
16. Mining Methods .......................................................................................................... 69
a) Preamble ..................................................................................................................... 69
b) Works Preparatory to Mining ...................................................................................... 69
c) Mining for the Demonstration Plant ........................................................................... 70
d) Mining for the Bulk Processing Plant ........................................................................... 72
17. Process Plant Requirements ........................................................................................ 72
a) Overview ...................................................................................................................... 72
b) Quartz Rejection .......................................................................................................... 72
a. Wet processing ............................................................................................................ 72
b. Dry processing ............................................................................................................. 74
Page 4 of 149
c) Metakaolin Production ................................................................................................ 75
18. Project Infrastructure .................................................................................................. 82
a) Mine Site Infrastructure .............................................................................................. 82
b) Townsville Site Infrastructure ...................................................................................... 84
c) Geotechnical Scope ..................................................................................................... 84
d) Hydrology .................................................................................................................... 84
e) Tailings Storage Facilities ............................................................................................. 84
19. Market Studies and Contracts ..................................................................................... 84
a) Market Summary ......................................................................................................... 84
b) Growth Forecast .......................................................................................................... 87
c) Growing Use of Metakaolin in High Strength Concretes ............................................. 88
d) Australian Metakaolin Market ..................................................................................... 88
20. Environmental Studies, Permitting and Social or Community Impact ........................ 90
a) Mine Site ...................................................................................................................... 90
a. Landholdings ............................................................................................................... 90
b. Native title and cultural heritage ................................................................................. 90
c. Social and heritage impacts ......................................................................................... 91
d. Assessment of obstacles .............................................................................................. 91
e. Environment ................................................................................................................ 91
i. Environmental authorities held ................................................................................... 91
ii. Environmental closure liabilities ................................................................................. 92
f. Social and Facilities ...................................................................................................... 92
i. Planning Permission and Reclamation Liability ........................................................... 92
ii. Third Party Obligations ................................................................................................ 92
Obligations of the Landowner ............................................................................................ 92
Obligations of IGM.............................................................................................................. 93
b) Townsville Site ............................................................................................................. 93
a. Metakaolin production ................................................................................................ 93
b. Potential process locations .......................................................................................... 94
i. Townsville State Development Area ........................................................................... 94
ii. Landsdown Eco Precinct ............................................................................................ 109
Impacts on natural values ............................................................................................ 122
Page 5 of 149
21. Capital and Operating Costs ...................................................................................... 125
a) Capital Costs .............................................................................................................. 125
a. Basis of Estimate ........................................................................................................ 126
b. Proposed Short Term Programs and Expenditure ..................................................... 127
b) Operating Costs ......................................................................................................... 128
a. Mining Related Site Costs .......................................................................................... 129
b. Transport Costs .......................................................................................................... 129
c. Townsville Processing Costs ...................................................................................... 130
d. General and Administration Costs ............................................................................. 131
e. Kaolin Processing Costs ............................................................................................. 131
f. Selling Costs ............................................................................................................... 131
22. Economic Analysis ..................................................................................................... 131
23. Adjacent Properties ................................................................................................... 134
a) Nearby Properties ..................................................................................................... 134
b) Kaolin Opportunities in the Region ........................................................................... 135
a. Charters Towers West - Centauri .............................................................................. 135
b. Thalanga Northeast ................................................................................................... 137
c. Drummond Basin ....................................................................................................... 139
24. Other Relevant Data and Information ....................................................................... 141
a) Key Technical Risks and Opportunities ...................................................................... 141
a. Risks ........................................................................................................................... 141
b. Opportunities ............................................................................................................ 142
25. Interpretation and Conclusions ................................................................................. 142
a) Kaolin Assets Review ................................................................................................. 142
b) Potential Project Value .............................................................................................. 143
26. Recommendations and Further Work ....................................................................... 143
27. References ................................................................................................................. 147
List of Tables Table 1 Summary of Economic Analysis ................................................................................ 15
Page 6 of 149
Table 2 Summary of Project Capital Costs for the Metakaolin Demonstration and Full Scale Plants ...................................................................................................................................... 19
Table 3 Summary of Unit Plant Operating Costs Based on Metakaolin Production ............... 20
Table 4 Potential Resource Estimate Tonnages ..................................................................... 53
Table 5 Assay Data by Size Fraction for a Sample of Surprise Material .................................. 58
Table 6 Feedstock Characterisation .................................................................................. 62
Table 7 Surprise Kaolin Sample Elemental Analysis ........................................................... 63
Table 8 Surprise Kaolin Sample XRD analysis ..................................................................... 63
Table 9 Impact of Scrubbing on Elemental Deportment (Source: Simulus BRIL-947-TBR-001 Rev A - Lab Testwork Report) ................................................................................................. 63
Table 10 Clay Fraction XRD Assay ........................................................................................... 64
Table 11 Comparative Kaolin Composition (White Spot 11 is a sample from the Clydesdale prospect). ............................................................................................................................... 66
Table 12 Chemical Analyses of World Metakaolin Products Compared With Clydesdale derived Metakaolin ............................................................................................................................. 66
Table 13 Comparison of Calciner Technology Capex and Opex ............................................. 81
Table 14 Implied Demand for Metakaolin Based on Substitution for Portland Cement ........ 90
Table 15 Proximity to Sensitive Receptors ........................................................................ 106
Table 16 LEIP Available Land Parcels ................................................................................ 114
Table 17 Summary of Project Capital Costs for the Metakaolin Demonstration and Full Scale Plants .................................................................................................................................... 126
Table 18 Summary of Annual Plant Operating Costs ............................................................ 128
Table 19 Summary of Unit Plant Operating Costs Based on Metakaolin Production ........... 129
Table 20 Mine Related Operating Costs ............................................................................... 129
Table 21 Transport Related Operating Costs ....................................................................... 129
Table 22 Gas Consumption Related Operating Costs .......................................................... 130
Table 23 Selling Cost Estimates ........................................................................................... 131
Table 24 Summary of Economic Analysis ............................................................................. 131
Table 25 Preliminary Project Execution Schedule for the Demonstration Plant Phase ....... 145
List of Figures Figure 1 Process Schematic Showing Dry and Wet Screening Options at the Surprise Site ... 15
Page 7 of 149
Figure 2 Project Revenues Based on Metakaolin (MK), Kaolin and Aggregate (Sand) ........... 17
Figure 3 Projected Project Cash Flow ..................................................................................... 17
Figure 4 Project Returns ......................................................................................................... 18
Figure 5 Project Cash Flow Showing Impact of Grants ........................................................... 18
Figure 6 Brilliant Brumby Tenement Map Showing Prospects and Areas of Prospective Mineralisation ........................................................................................................................ 23
Figure 7 Location of the Brilliant Brumby Prospect, including the Surprise Project ............... 28
Figure 8 Initial Hydration of Cement Particles to form Hydrates (CBA internal data) ............ 33
Figure 9 Hydration of Individual Species to form Initial Hydrated Products (CBA Internal data) ................................................................................................................................................ 33
Figure 10 Composition of Kaolinite ........................................................................................ 34
Figure 11 Reaction Temperatures for Clay Species ................................................................ 35
Figure 12 GSQ 1:100,000 Scale Geology and Project Tenements. ......................................... 38
Figure 13 Kaolin Prospects and Prospective Areas on the Lolworth Range plateau. ............. 39
Figure 14 Distribution of the Interpreted Kaolinitic Vegetation Anomalies (Green), Field Sites Visited (Yellow), and the 740m ASL Contour (Red). ............................................................... 41
Figure 17 Photographs of Project Kaolin Sites, (a) Surprise Pit (left), (b) Clydesdale (right). 42
Figure 16 Geological Fact Map of the Clydesdale Prospect ................................................... 43
Figure 17 Photo of Kaolinite Occurrences, Clydesdale (Little Spot) on left and Regional Location on right .................................................................................................................... 44
Figure 18 Lolworth Project Regional Mapping ....................................................................... 45
Figure 18 Surprise Kaolin Drilling Area Cross Section Location Map. (Pink diamonds show better kaolin intersections. Holes to the southwest are collared below the lateritic profile). ................................................................................................................................................ 46
Figure 19 March 2021 Kaolin RC Drilling Program Hole Locations and Visually Estimated Extent of Kaolin Thickness ................................................................................................................. 47
Figure 20 Section 331600E Looking West .............................................................................. 47
Figure 21 Kaolin Drilling at Surprise, March 2021 .................................................................. 48
Figure 23 Proposed Drill Hole Locations ................................................................................. 49
Figure 22 Proposed 800 m x 100m Kaolin Outline Drilling Program, EPMs 18419 & 25299. Drill Holes (White Spots), Tenement Boundaries (Blue), 740m Contour (Red), TQr Shallow Cover, Interp. Better Kaolin (Green). ................................................................................................. 50
Figure 25 Distribution of the GSQ’s “TQr” Unit (Pale Blue) and the 740m ASL Contour (Red). ................................................................................................................................................ 51
Page 8 of 149
Figure 16 Distribution of White Reflectance Occurrences and the 740m ASL Contour (Red). ................................................................................................................................................ 52
Figure 22 Surprise Pit Area 2021 Drilling Voronoi Polygons for Internal Resource Calculation ................................................................................................................................................ 53
Figure 24 Tambellup, W.A., Kaolin Deposit Drill Section, Hulls Prospect. .............................. 55
Figure 25 ENE Cross Section A – B of RC Drilling Chip Trays Through Surprise Showing Kaolinitic Horizon. .................................................................................................................................. 56
Figure 26 NNE Cross Section C – D of RC Drilling Chip Trays Through Surprise Showing the Kaolinitic Horizon. .................................................................................................................. 56
Figure 27 Kaolin Composite Sampling Slot at Surprise Southern Pit ...................................... 59
Figure 28 GMT Processing Test Work Flowsheet ................................................................... 61
Figure 29 Modified Chappelle Test Outcomes for Metakaolin Samples ................................ 61
Figure 30 Surprise Kaolin Reflectance v Reference and Sumitomo HPA. Green (2020). Horizontal Scale nm. Visible light Frequency Ranges From 380 to 700 nm. (ITK = Surprise Kaolin Clay Sample). ............................................................................................................... 64
Figure 35 TGA Data on the Clay Fraction .............................................................................. 65
Figure 36 X Ray Diffractograms of Clydesdale prospect Samples Indicating Mineral Composition and Homogeneity .............................................................................................. 67
Figure 37 Contours and Drill Hole Locations in the Surprise Area .......................................... 70
Figure 32 Process Schematic Showing Dry and Wet Processing Options ............................... 74
Figure 34 Rotary Kiln (no preheater) for Clay Calcination (Source CIMPOR presentation Feb 2020 ICR webinar) .................................................................................................................. 76
Figure 35 Rotary Kiln with Preheater for Clay Calcination (Source: Dynamis Presentation Feb 2020 ICR webinar) .................................................................................................................. 77
Figure 36 FCT Combustion Flash Calciner for Clays (Source: FCT Combustion website accessed March 2020) ........................................................................................................................... 78
Figure 37 FLSmidth Process Diagram for Calcined Clays (Source: FLSmidth website accessed March 2020 and FLS budget proposal April 2021) ................................................................. 79
Figure 38 FLSmidth Flash Calciner for Clays (Source: FLSmidth website accessed March 2020) ................................................................................................................................................ 80
Figure 39 Power Supply Infrastructure ................................................................................... 83
Figure 40 2017 EBBAR Road Construction to ML 100008. ..................................................... 83
Figure 41 Global Construction Industry Spending 2014-19 With Forecasts for 2020-35 (US$ trillions) (Source: Statista) ...................................................................................................... 85
Figure 42 Global SCM Market by Material. (Source: Technavio) ............................................ 86
Page 9 of 149
Figure 43 US Kaolin Market Size by Application 2013-2024 (US$ million). (Source: Global Market Insights 2014) ............................................................................................................. 86
Figure 44 Townsville SDA Locality ......................................................................................... 96
Figure 45 Townsville SDA Regional Setting ....................................................................... 97
Figure 46 SDA Precincts Showing Castral Parcels ............................................................ 98
Figure 47 SDA Lots With Land Use ................................................................................... 99
Figure 48 SDA Site Local Topography ............................................................................. 100
Figure 49 Hydrographic Lines SDA .................................................................................. 101
Figure 50 SDA Remnant Vegetation ............................................................................... 103
Figure 51 Matters of State Environmental Significance ................................................. 104
Figure 52 Proximity to Community Facilities .................................................................. 107
Figure 53 LEIP Regional Setting ...................................................................................... 111
Figure 54 LEIP Local Context ........................................................................................... 112
Figure 55 LIP Cadastral Parcels ....................................................................................... 113
Figure 56 LEIP Topography and Hydrology ..................................................................... 115
Figure 57 Two Mile Creek Looking East of the Flinders Highway ................................... 116
Figure 58 Registered Bores ............................................................................................. 118
Figure 59 LEIP Natural Values Impact Map .................................................................... 119
Figure 60 LEIP Heritage sites reviewed ........................................................................... 121
Figure 61 Project Revenues Based on Metakaolin (MK), Kaolin and Aggregate (Sand) ....... 133
Figure 62 Projected Project Cash Flow ................................................................................. 133
Figure 63 Project Returns ..................................................................................................... 134
Figure 64 Project Cash Flow Showing Impact of Grants ....................................................... 134
Figure 65 Kaolin Prospective Areas and Infrastructure. ....................................................... 135
Figure 66 Centauri Area White Reflectance on ESRI Satellite Image. ................................... 136
Figure 67 Centauri Road NW, White Reflectance Exposed in Drainage. Image ~1,000 x 450m. .............................................................................................................................................. 136
Figure 68 SE escarpment, White Reflectance Exposed Beneath Escarpment. Image ~1,000 x 450m. ................................................................................................................................... 137
Figure 69 Thalanga NE Kaolin Prospect Location. ................................................................ 138
Figure 70 Thalanga NE Kaolin Prospect Geology. ................................................................. 138
Figure 71 Thalanga NE Kaolin Prospect Satellite Image with White Reflectance. ................ 139
Figure 72 Austral Dutch Kaolin Prospect Photo .................................................................... 140

Page 10 of 149
Figure 73 Wirralie West, 4km S of NW EPM 12049. Image 900 x 400m. ............................ 140
Page 11 of 149
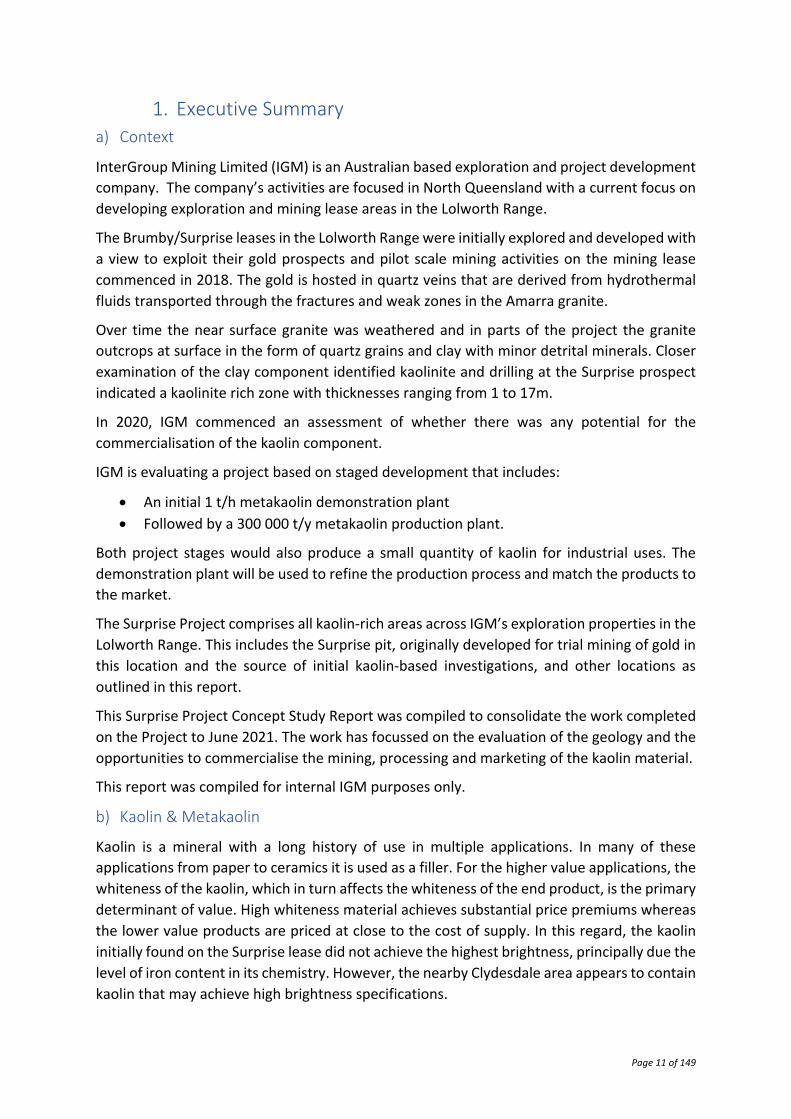
1. Executive Summary a) Context
InterGroup Mining Limited (IGM) is an Australian based exploration and project development company. The company’s activities are focused in North Queensland with a current focus on developing exploration and mining lease areas in the Lolworth Range.
The Brumby/Surprise leases in the Lolworth Range were initially explored and developed with a view to exploit their gold prospects and pilot scale mining activities on the mining lease commenced in 2018. The gold is hosted in quartz veins that are derived from hydrothermal fluids transported through the fractures and weak zones in the Amarra granite.
Over time the near surface granite was weathered and in parts of the project the granite outcrops at surface in the form of quartz grains and clay with minor detrital minerals. Closer examination of the clay component identified kaolinite and drilling at the Surprise prospect indicated a kaolinite rich zone with thicknesses ranging from 1 to 17m.
In 2020, IGM commenced an assessment of whether there was any potential for the commercialisation of the kaolin component.
IGM is evaluating a project based on staged development that includes:
• An initial 1 t/h metakaolin demonstration plant • Followed by a 300 000 t/y metakaolin production plant.
Both project stages would also produce a small quantity of kaolin for industrial uses. The demonstration plant will be used to refine the production process and match the products to the market.
The Surprise Project comprises all kaolin-rich areas across IGM’s exploration properties in the Lolworth Range. This includes the Surprise pit, originally developed for trial mining of gold in this location and the source of initial kaolin-based investigations, and other locations as outlined in this report.
This Surprise Project Concept Study Report was compiled to consolidate the work completed on the Project to June 2021. The work has focussed on the evaluation of the geology and the opportunities to commercialise the mining, processing and marketing of the kaolin material.
This report was compiled for internal IGM purposes only.
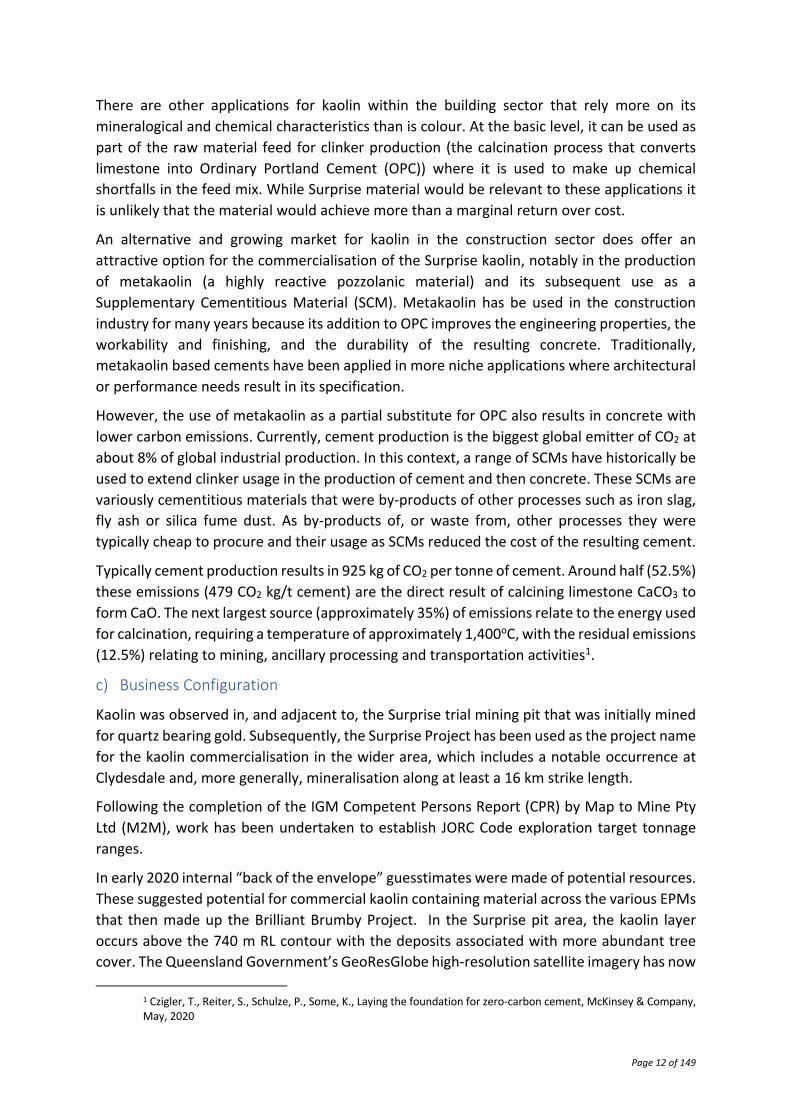
b) Kaolin & Metakaolin
Kaolin is a mineral with a long history of use in multiple applications. In many of these applications from paper to ceramics it is used as a filler. For the higher value applications, the whiteness of the kaolin, which in turn affects the whiteness of the end product, is the primary determinant of value. High whiteness material achieves substantial price premiums whereas the lower value products are priced at close to the cost of supply. In this regard, the kaolin initially found on the Surprise lease did not achieve the highest brightness, principally due the level of iron content in its chemistry. However, the nearby Clydesdale area appears to contain kaolin that may achieve high brightness specifications.
Page 12 of 149
There are other applications for kaolin within the building sector that rely more on its mineralogical and chemical characteristics than is colour. At the basic level, it can be used as part of the raw material feed for clinker production (the calcination process that converts limestone into Ordinary Portland Cement (OPC)) where it is used to make up chemical shortfalls in the feed mix. While Surprise material would be relevant to these applications it is unlikely that the material would achieve more than a marginal return over cost.
An alternative and growing market for kaolin in the construction sector does offer an attractive option for the commercialisation of the Surprise kaolin, notably in the production of metakaolin (a highly reactive pozzolanic material) and its subsequent use as a Supplementary Cementitious Material (SCM). Metakaolin has be used in the construction industry for many years because its addition to OPC improves the engineering properties, the workability and finishing, and the durability of the resulting concrete. Traditionally, metakaolin based cements have been applied in more niche applications where architectural or performance needs result in its specification.
However, the use of metakaolin as a partial substitute for OPC also results in concrete with lower carbon emissions. Currently, cement production is the biggest global emitter of CO2 at about 8% of global industrial production. In this context, a range of SCMs have historically be used to extend clinker usage in the production of cement and then concrete. These SCMs are variously cementitious materials that were by-products of other processes such as iron slag, fly ash or silica fume dust. As by-products of, or waste from, other processes they were typically cheap to procure and their usage as SCMs reduced the cost of the resulting cement.
Typically cement production results in 925 kg of CO2 per tonne of cement. Around half (52.5%) these emissions (479 CO2 kg/t cement) are the direct result of calcining limestone CaCO3 to form CaO. The next largest source (approximately 35%) of emissions relate to the energy used for calcination, requiring a temperature of approximately 1,400oC, with the residual emissions (12.5%) relating to mining, ancillary processing and transportation activities1.
c) Business Configuration
Kaolin was observed in, and adjacent to, the Surprise trial mining pit that was initially mined for quartz bearing gold. Subsequently, the Surprise Project has been used as the project name for the kaolin commercialisation in the wider area, which includes a notable occurrence at Clydesdale and, more generally, mineralisation along at least a 16 km strike length.
Following the completion of the IGM Competent Persons Report (CPR) by Map to Mine Pty Ltd (M2M), work has been undertaken to establish JORC Code exploration target tonnage ranges.
In early 2020 internal “back of the envelope” guesstimates were made of potential resources. These suggested potential for commercial kaolin containing material across the various EPMs that then made up the Brilliant Brumby Project. In the Surprise pit area, the kaolin layer occurs above the 740 m RL contour with the deposits associated with more abundant tree cover. The Queensland Government’s GeoResGlobe high-resolution satellite imagery has now
1 Czigler, T., Reiter, S., Schulze, P., Some, K., Laying the foundation for zero-carbon cement, McKinsey & Company, May, 2020
Page 13 of 149
been used to better delineate prospective areas. Darker green vegetation areas correlate with denser tree cover and are interpreted to be due to improved moisture retention related to more abundant clay in the sub-surface.
Assuming the Featherby surface is preserving the kaolinized granite below surface there is a total of 1,209 ha with interpreted full kaolinitic profiles on the Surprise Project tenements (12 sq.km.) including 17.5 ha on ML 100008.
Based on these areas, tonnage estimations were made using an inferred density of 1.7 t/cubic metre for kaolinized granite (FYI Resources, 2018). For the total Project the kaolin material would range from 41 Mt to 165 Mt depending on the thickness of the kaolinization (estimate range is based on a thickness of between 2 and 8 m). These values will remain speculative until the geology is confirmed on the ground. Drilling in March 2021 was focused on the Surprise prospect on ML 100008 and was designed to provide data for a resource estimate. While test work is still ongoing on the drill hole samples, an internal calculation was completed and indicated a potential resource of 1.8 Mt kaolinized granite at a 17.6 % Al2O3. This is not a JORC compliant resource and further resource calculations are being completed on the Surprise prospect to update the confidence of these figures.
IGM’s aspirational target is for the production of up to 300,000 t/y of metakaolin (calcined kaolin). Preliminary estimates indicate that the mineable material is about 47% kaolinite and this would require the mining of about 1.2 M t/y of the kaolinized granite.
Metallurgical test work is progressing on material taken from bulk samples in both the Surprise pit and Clydesdale areas. As highlighted earlier, test work on Surprise pit samples has focussed on the suitability of the material for the production of metakaolin for use in cement/concrete. In addition, work is underway to assess the quality of Clydesdale kaolin for industrial uses due to its potential high purity and brightness qualities.
The current focus is predominantly on revenue from metakaolin production. Metallurgical testwork has included the calcination of kaolin to produce metakaolin. The quality of the metakaolin for use in cement/concrete has been checked using Chapelle tests and strength tests will be conducted to validate the expected improvement in concrete quality when Portland cement is substituted (by up to 25%) by metakaolin.
Mining of the kaolin material is expected to result in a relatively low strip ratio and principally be conducted using an excavator and small truck fleet. Initially, it is proposed to mine the kaolin from the northern area of ML 100008 to supply the demonstration plant located near Townsville. It is understood that the depth of kaolinized granite extends from 0 m to 30 m in the Surprise area. For a 25 000 t/y mine production rate, it is envisaged that a contractor will be engaged to complete the works on a campaign basis outside the wet or cyclone months of December to April each year.
Mining operations will initially be completed in daylight hours only to allow for grade control and the observation of quartz veins.
Once the agreements and approvals are obtained it is envisaged that the following activities will be undertaken:
Page 14 of 149
1. Upgrade of access roads 2. Site preparation 3. Removal & stockpiling of timber, topsoil and overburden 4. Excavate the kaolinized granite with a excavator 5. The kaolinized granite will be loaded into 40 t Moxy 6. A front end loader (FEL) will feed the screening plant and load the Moxy truck with the
oversize for return to the mine void 7. The FEL should also load the undersize into 2 x 40 t Moxy trucks for transport of the
kaolinized granite down the hill to the Stockpile and Transfer Station. The hill is steep and only such vehicles could accomplish this safely
8. Road truck drivers will load themselves with the FEL located at the Stockpile and Transfer Station
9. The road trucks will then transport the kaolin containing material approximately 260 km to the processing and calcination plant in the Townsville area
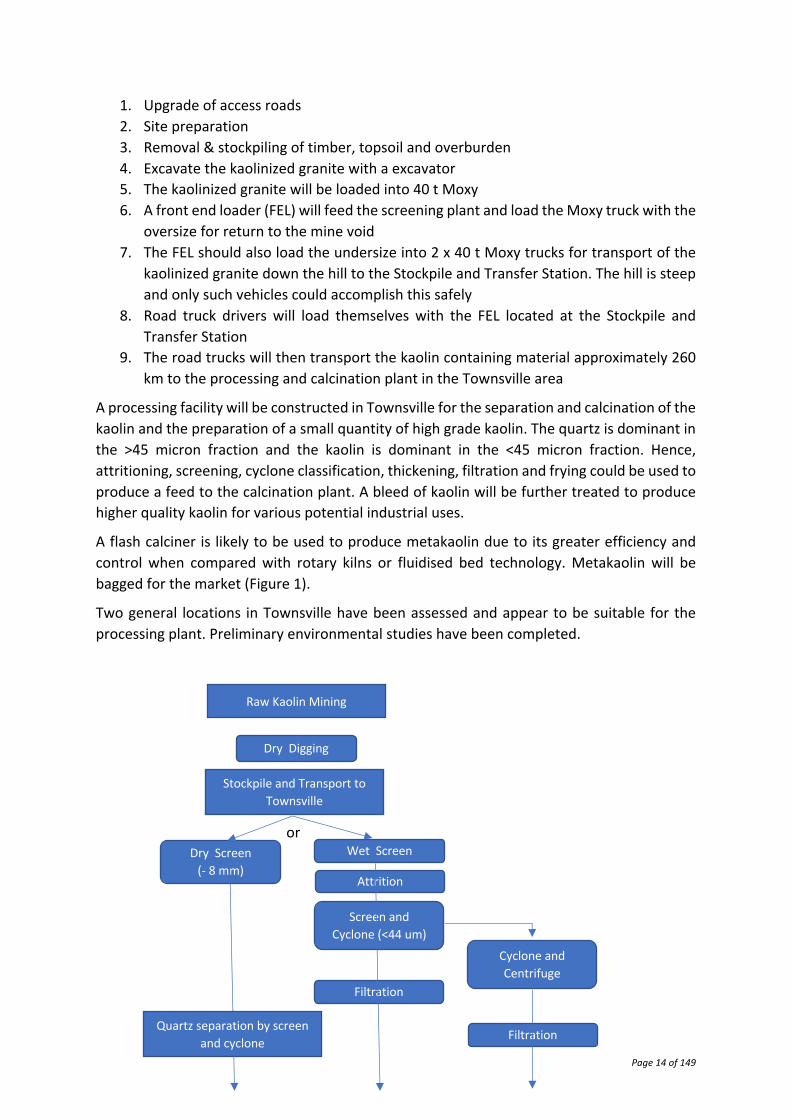
A processing facility will be constructed in Townsville for the separation and calcination of the kaolin and the preparation of a small quantity of high grade kaolin. The quartz is dominant in the >45 micron fraction and the kaolin is dominant in the <45 micron fraction. Hence, attritioning, screening, cyclone classification, thickening, filtration and frying could be used to produce a feed to the calcination plant. A bleed of kaolin will be further treated to produce higher quality kaolin for various potential industrial uses.
A flash calciner is likely to be used to produce metakaolin due to its greater efficiency and control when compared with rotary kilns or fluidised bed technology. Metakaolin will be bagged for the market (Figure 1).
Two general locations in Townsville have been assessed and appear to be suitable for the processing plant. Preliminary environmental studies have been completed.
Raw Kaolin Mining
Dry Digging
Dry Screen (- 8 mm)
Wet Screen
Attrition
Screen and Cyclone (<44 um)
Stockpile and Transport to Townsville
Filtration
Quartz separation by screen and cyclone
or
Cyclone and Centrifuge
Filtration
Page 15 of 149
Figure 1 Process Schematic Showing Dry and Wet Screening Options at the Surprise Site
IGM anticipates that a major source of growth in the demand for metakaolin will be derived from its use as a SCM. This will be driven by the ongoing requirement to reduce construction related CO2 emissions. Metakaolin will either replace fly ash or slag as their availability declines or be used in preference to fly ash and slag to achieve high performance concretes. Market and technical experience indicates that metakaolin can replace clinker cement in concrete by up to 25% and under these circumstances, depending on the rate of market evolution, the demand for metakaolin in Australia alone could reach and exceed 1 million tonnes per year. The current Australian market for cement is approximately 11 million tonnes. For IGM, local Australian demand could be supplemented by exports to nearby pacific countries.
Additionally, Cement Business Advisory estimated that in 2019 Australia imported almost 3 Mt of clinker and 0.9 Mt of cement. The clinker goes to the 12 grinding plants in Australia. Hence, there is a deficit in indigenous clinker in Australia and in theory a good clinker substitute should be of interest to the industry.
The market for bright kaolin is very specific to kaolin product size, assay impurities, colour and brightness. IGM will carefully assess market options when test work on kaolin quantity is further developed.
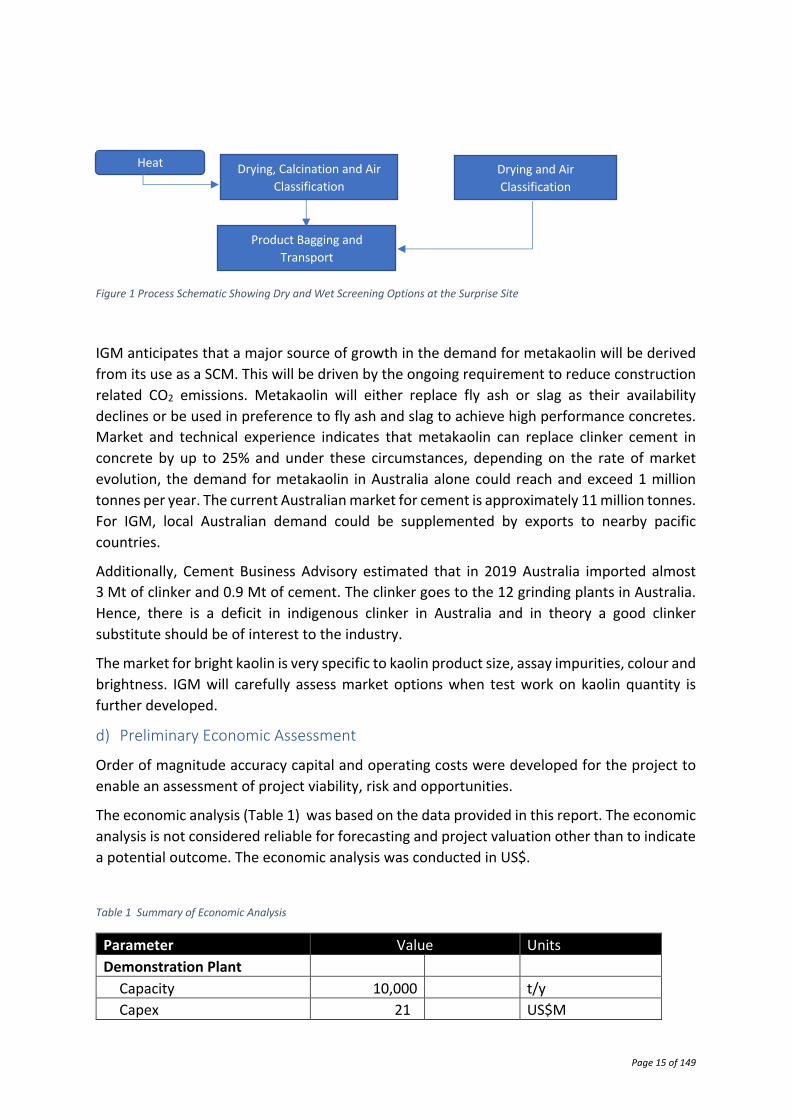
d) Preliminary Economic Assessment
Order of magnitude accuracy capital and operating costs were developed for the project to enable an assessment of project viability, risk and opportunities.
The economic analysis (Table 1) was based on the data provided in this report. The economic analysis is not considered reliable for forecasting and project valuation other than to indicate a potential outcome. The economic analysis was conducted in US$.
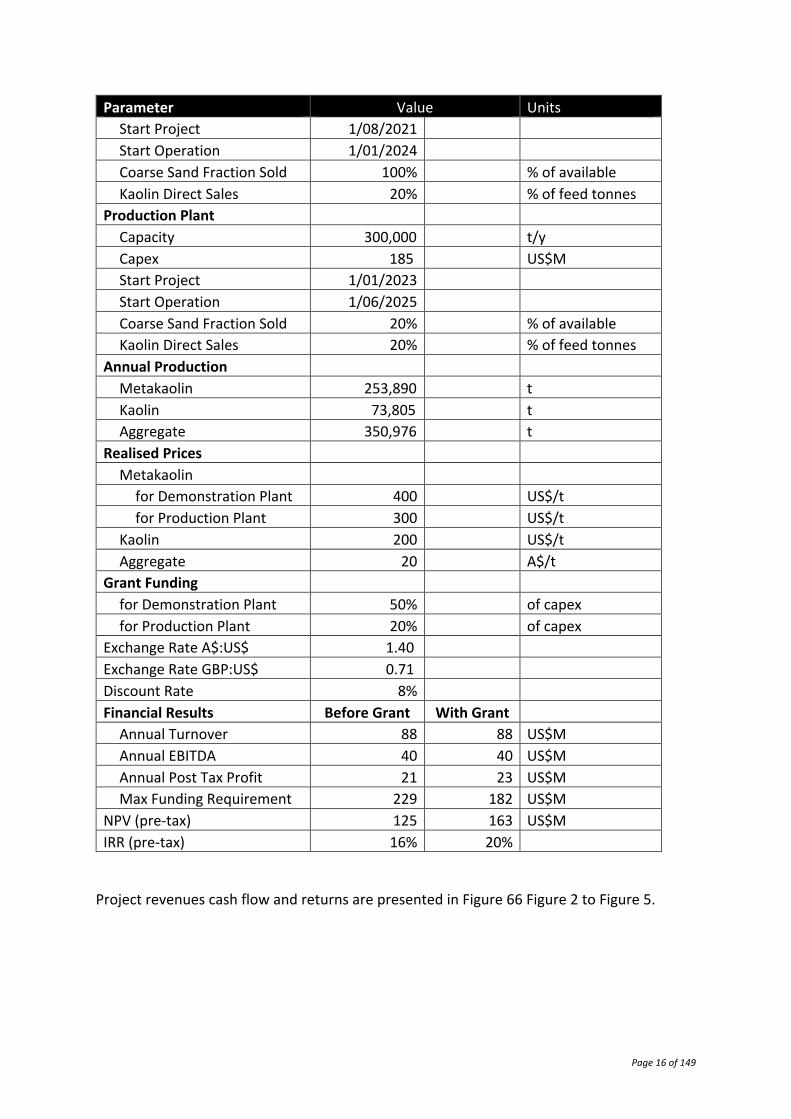
Table 1 Summary of Economic Analysis
Parameter Value Units Demonstration Plant
Capacity 10,000 t/y Capex 21 US$M
Drying, Calcination and Air Classification
Heat
Product Bagging and Transport
Drying and Air Classification
Page 16 of 149
Parameter Value Units Start Project 1/08/2021 Start Operation 1/01/2024 Coarse Sand Fraction Sold 100% % of available Kaolin Direct Sales 20% % of feed tonnes
Production Plant Capacity 300,000 t/y Capex 185 US$M Start Project 1/01/2023 Start Operation 1/06/2025 Coarse Sand Fraction Sold 20% % of available Kaolin Direct Sales 20% % of feed tonnes
Annual Production Metakaolin 253,890 t Kaolin 73,805 t Aggregate 350,976 t
Realised Prices Metakaolin
for Demonstration Plant 400 US$/t for Production Plant 300 US$/t
Kaolin 200 US$/t Aggregate 20 A$/t
Grant Funding for Demonstration Plant 50% of capex for Production Plant 20% of capex
Exchange Rate A$:US$ 1.40 Exchange Rate GBP:US$ 0.71 Discount Rate 8% Financial Results Before Grant With Grant
Annual Turnover 88 88 US$M Annual EBITDA 40 40 US$M Annual Post Tax Profit 21 23 US$M Max Funding Requirement 229 182 US$M
NPV (pre-tax) 125 163 US$M IRR (pre-tax) 16% 20%
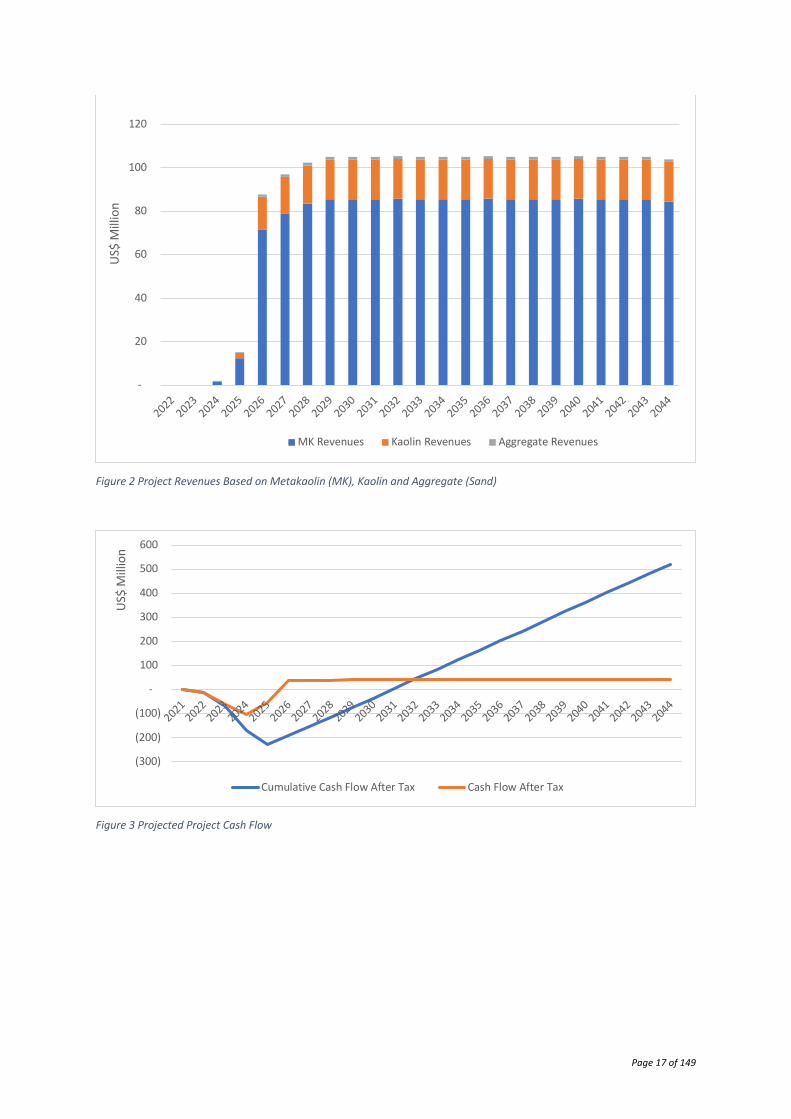
Project revenues cash flow and returns are presented in Figure 66 Figure 2 to Figure 5.
Page 17 of 149
Figure 2 Project Revenues Based on Metakaolin (MK), Kaolin and Aggregate (Sand)
Figure 3 Projected Project Cash Flow
-
20
40
60
80
100
120
20222023
20242025
20262027
20282029
20302031
20322033
20342035
20362037
20382039
20402041
20422043
2044
US$
Mill
ion
MK Revenues Kaolin Revenues Aggregate Revenues
(300)
(200)
(100)
-
100
200
300
400
500
600
20212022
20232024
20252026
20272028
20292030
20312032
20332034
20352036
20372038
20392040
20412042
20432044
US$
Mill
ion
Cumulative Cash Flow After Tax Cash Flow After Tax
Page 18 of 149
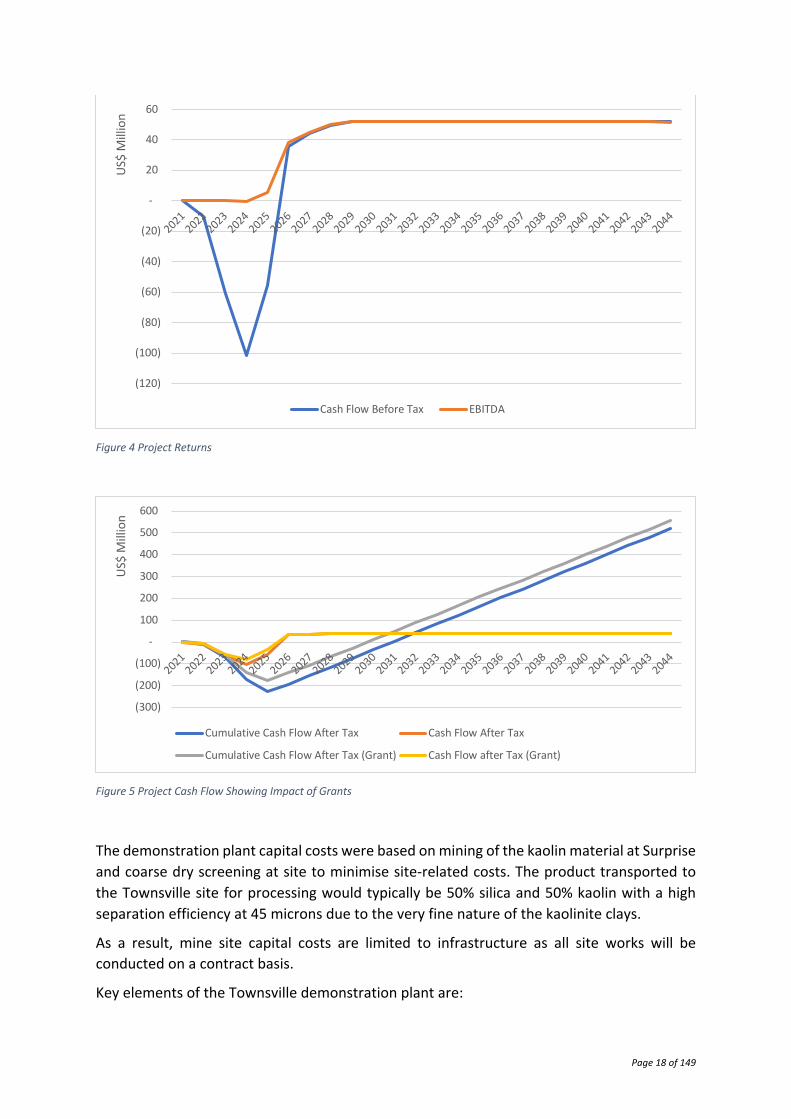
Figure 4 Project Returns
Figure 5 Project Cash Flow Showing Impact of Grants
The demonstration plant capital costs were based on mining of the kaolin material at Surprise and coarse dry screening at site to minimise site-related costs. The product transported to the Townsville site for processing would typically be 50% silica and 50% kaolin with a high separation efficiency at 45 microns due to the very fine nature of the kaolinite clays.
As a result, mine site capital costs are limited to infrastructure as all site works will be conducted on a contract basis.
Key elements of the Townsville demonstration plant are:
(120)
(100)
(80)
(60)
(40)
(20)
-
20
40
60
20212022
20232024
20252026
20272028
20292030
20312032
20332034
20352036
20372038
20392040
20412042
20432044
US$
Mill
ion
Cash Flow Before Tax EBITDA
(300)
(200)
(100)
-
100
200
300
400
500
600
20212022
20232024
20252026
20272028
20292030
20312032
20332034
20352036
20372038
20392040
20412042
20432044
US$
Mill
ion
Cumulative Cash Flow After Tax Cash Flow After Tax
Cumulative Cash Flow After Tax (Grant) Cash Flow after Tax (Grant)
Page 19 of 149
• Material receival and storage • Attritioning • Screening • Cycloning • Kaolin dewatering (thickening and filtration) • Kaolin drying • Kaolin packaging (for kaolin sales) • Kaolin calcination • Kaolin product handling • Silica sand product handling • Plant infrastructure (water and power) • Warehouse, offices and maintenance facilities will be located in a common building
(shed)
In addition, allowance is made for owner’s project costs (including exploration and geology and project management), contingency and indirect costs.
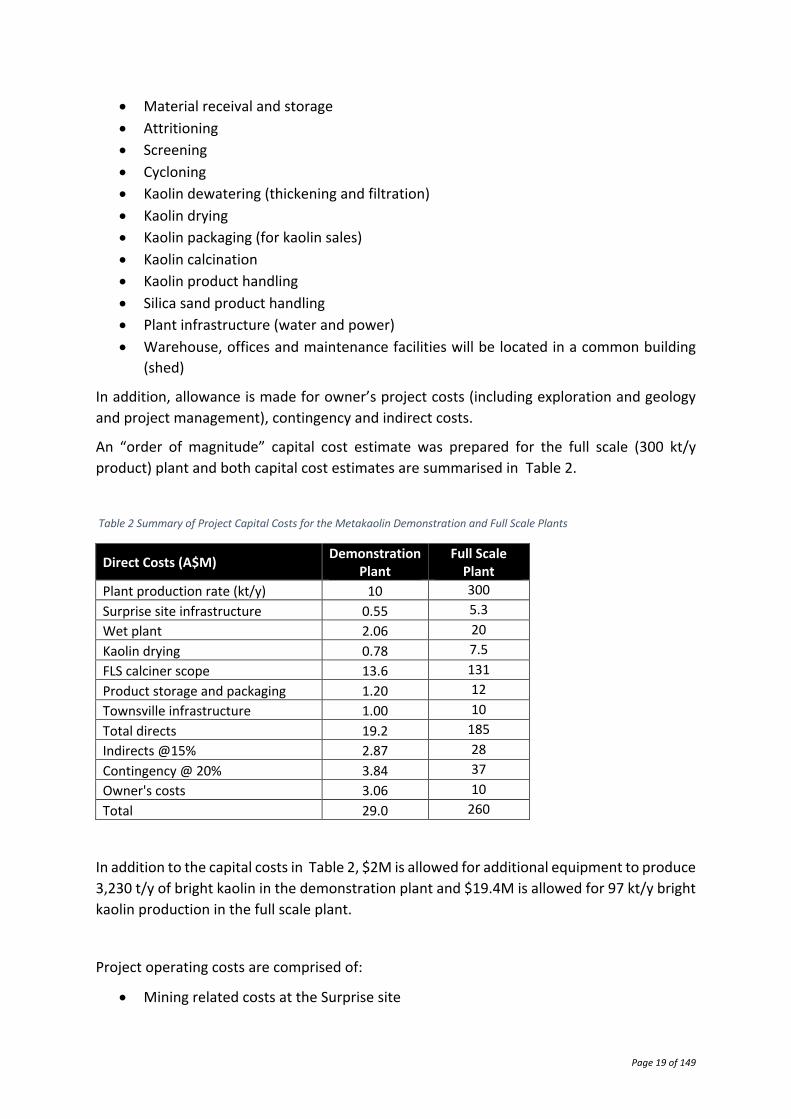
An “order of magnitude” capital cost estimate was prepared for the full scale (300 kt/y product) plant and both capital cost estimates are summarised in Table 2.
Table 2 Summary of Project Capital Costs for the Metakaolin Demonstration and Full Scale Plants
Direct Costs (A$M) Demonstration Plant
Full Scale Plant
Plant production rate (kt/y) 10 300 Surprise site infrastructure 0.55 5.3 Wet plant 2.06 20 Kaolin drying 0.78 7.5 FLS calciner scope 13.6 131 Product storage and packaging 1.20 12 Townsville infrastructure 1.00 10 Total directs 19.2 185 Indirects @15% 2.87 28 Contingency @ 20% 3.84 37 Owner's costs 3.06 10 Total 29.0 260
In addition to the capital costs in Table 2, $2M is allowed for additional equipment to produce 3,230 t/y of bright kaolin in the demonstration plant and $19.4M is allowed for 97 kt/y bright kaolin production in the full scale plant.
Project operating costs are comprised of:
• Mining related costs at the Surprise site
Page 20 of 149
• Transport of kaolin material to Townsville • Processing costs at Townsville • General G&A costs.
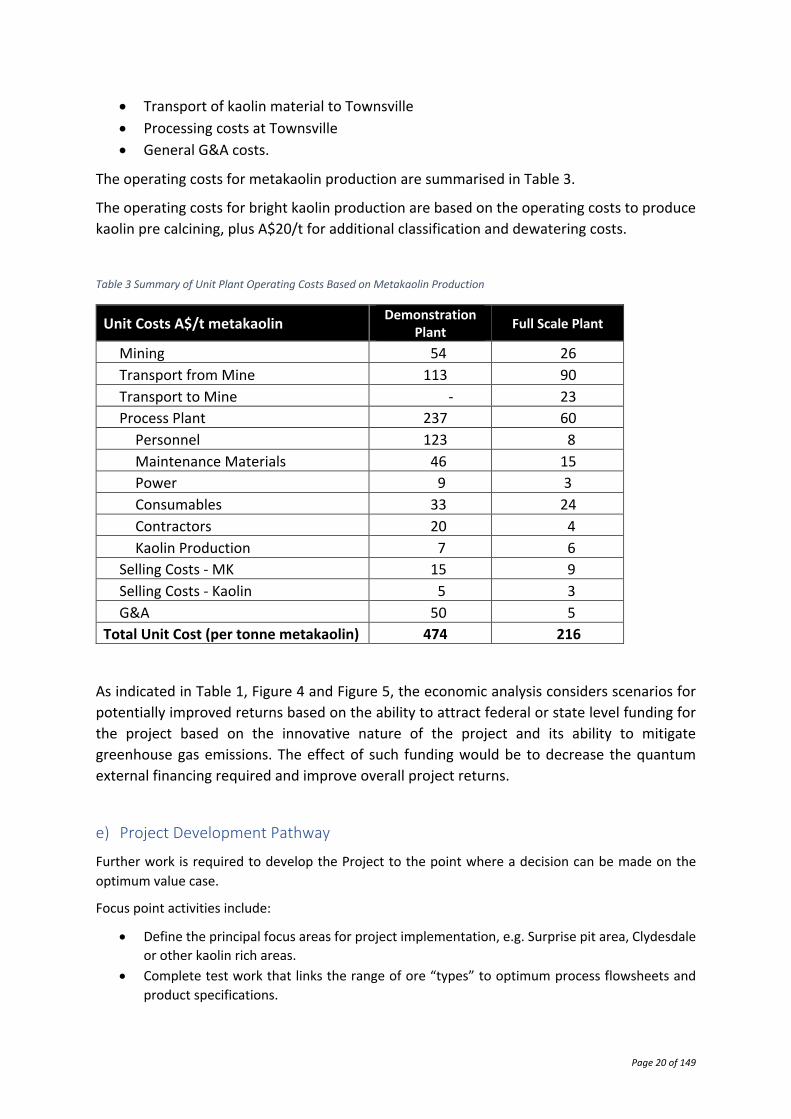
The operating costs for metakaolin production are summarised in Table 3.
The operating costs for bright kaolin production are based on the operating costs to produce kaolin pre calcining, plus A$20/t for additional classification and dewatering costs.
Table 3 Summary of Unit Plant Operating Costs Based on Metakaolin Production
Unit Costs A$/t metakaolin Demonstration Plant Full Scale Plant
Mining 54 26 Transport from Mine 113 90 Transport to Mine - 23 Process Plant 237 60
Personnel 123 8 Maintenance Materials 46 15 Power 9 3 Consumables 33 24 Contractors 20 4 Kaolin Production 7 6
Selling Costs - MK 15 9 Selling Costs - Kaolin 5 3 G&A 50 5
Total Unit Cost (per tonne metakaolin) 474 216
As indicated in Table 1, Figure 4 and Figure 5, the economic analysis considers scenarios for potentially improved returns based on the ability to attract federal or state level funding for the project based on the innovative nature of the project and its ability to mitigate greenhouse gas emissions. The effect of such funding would be to decrease the quantum external financing required and improve overall project returns.
e) Project Development Pathway
Further work is required to develop the Project to the point where a decision can be made on the optimum value case.
Focus point activities include:
• Define the principal focus areas for project implementation, e.g. Surprise pit area, Clydesdale or other kaolin rich areas.
• Complete test work that links the range of ore “types” to optimum process flowsheets and product specifications.
Page 21 of 149
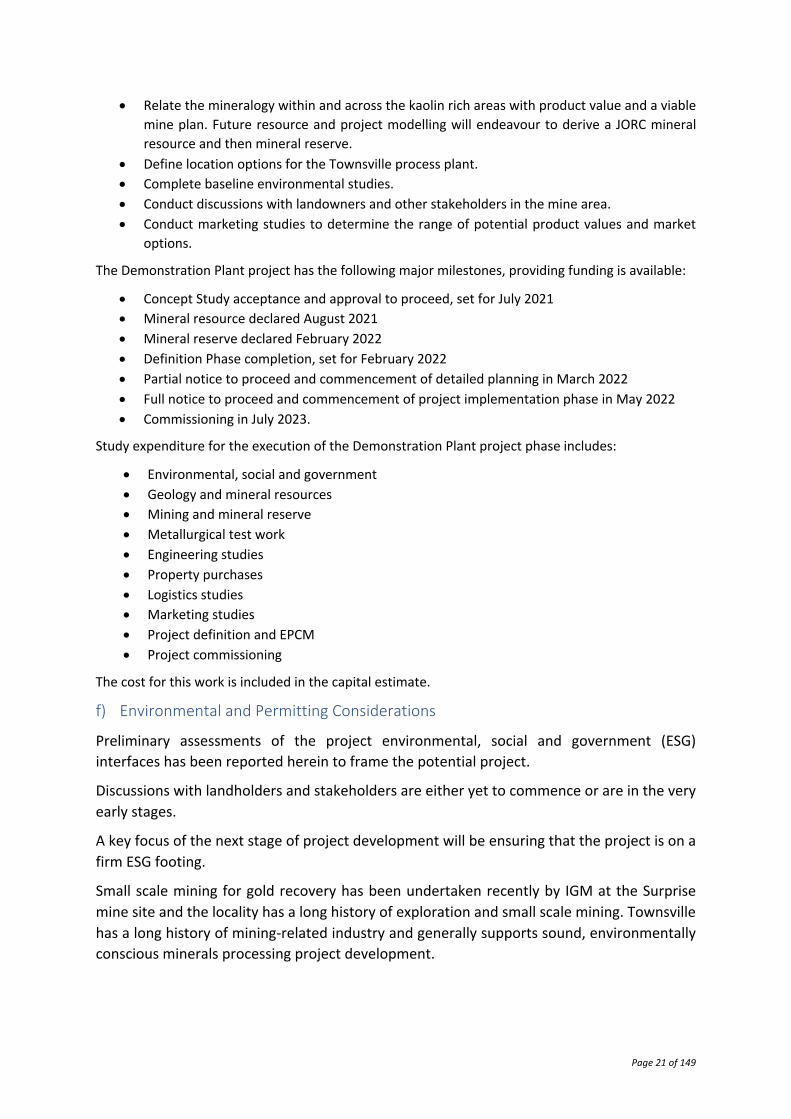
• Relate the mineralogy within and across the kaolin rich areas with product value and a viable mine plan. Future resource and project modelling will endeavour to derive a JORC mineral resource and then mineral reserve.
• Define location options for the Townsville process plant. • Complete baseline environmental studies. • Conduct discussions with landowners and other stakeholders in the mine area. • Conduct marketing studies to determine the range of potential product values and market
options.
The Demonstration Plant project has the following major milestones, providing funding is available:
• Concept Study acceptance and approval to proceed, set for July 2021 • Mineral resource declared August 2021 • Mineral reserve declared February 2022 • Definition Phase completion, set for February 2022 • Partial notice to proceed and commencement of detailed planning in March 2022 • Full notice to proceed and commencement of project implementation phase in May 2022 • Commissioning in July 2023.
Study expenditure for the execution of the Demonstration Plant project phase includes:
• Environmental, social and government • Geology and mineral resources • Mining and mineral reserve • Metallurgical test work • Engineering studies • Property purchases • Logistics studies • Marketing studies • Project definition and EPCM • Project commissioning
The cost for this work is included in the capital estimate.
f) Environmental and Permitting Considerations
Preliminary assessments of the project environmental, social and government (ESG) interfaces has been reported herein to frame the potential project.
Discussions with landholders and stakeholders are either yet to commence or are in the very early stages.
A key focus of the next stage of project development will be ensuring that the project is on a firm ESG footing.
Small scale mining for gold recovery has been undertaken recently by IGM at the Surprise mine site and the locality has a long history of exploration and small scale mining. Townsville has a long history of mining-related industry and generally supports sound, environmentally conscious minerals processing project development.
Page 22 of 149
g) Risks and Opportunities
At a Concept Study level there are many risks and opportunities that present during project assessment. The Surprise Project appears to be potentially viable, albeit with a modest IRR (in mining project terms).
Significant work is required on all aspects of the project from exploration to marketing to finalise the optimum business case. A key focus will be determining whether locations like Clydesdale can produce high grade bright kaolin for ceramics, or similar higher value and lower input cost uses.
Work is still in progress to confirm the net value of metakaolin that may be produced by the project for the cement/concrete industry.
2. Introduction a) InterGroup Mining
InterGroup Mining Limited (IGM), an Australian company, together with its wholly owned subsidiary Jodo Gold Pty Ltd (Jodo), has a major kaolin and gold exploration project located in North Queensland, Australia, immediately north of the gold bearing district of Pentland. For this report the Surprise Project comprises the kaolin component of the development project and the Brumby Project refers to the gold component. Jointly, the project area is known as Brilliant Brumby.
b) The Surprise Project
The kaolin prospects cover more than 100 km² of highly prospective ground in an underexplored gold district of the Charters Towers Gold Province where more than 20 million ounces (Moz) of gold has previously been mined. Detailed exploration and drilling continue to highlight the growing potential of the Surprise Project. IGM began its initial gold mining activity at ML 100008 in 2018 and good progress has been made since then including bulk sampling and trial processing.
IGMs interest in kaolin dates back to 2017 when the first kaolin assays were taken from the Surprise prospect on ML 100008. More recent interest in the kaolin potential has resulted from a review of the detailed drilling logs of 36 of the RC holes from the 2018 drilling programme in the Surprise pit area. Analysis of the results demonstrated that 30% of the holes were logged as having grey or white cuttings. An additional 16% of the holes which were drilled in or near the gold bearing quartz lodes showed pale cuttings with sericite alteration caused by hydrothermal activity typically associated with gold deposition.
In early 2020, internal “back of the envelope” guesstimates were made of potential resources based on regional Geological Survey mapping. This suggested the possibility of approximately 90 Mt of kaolin containing material across available area, with a range from 41 Mt to 165 Mt.
Testing has been conducted on selected kaolin samples to ascertain purity and brightness in order to determine whether a potential saleable product can be mined. This material was
Page 23 of 149
excavated along with the gold-bearing quartz veins. Preliminary tests on Surprise kaolin indicated that it could be processed for the manufacture of:
• lower to medium quality industrial usage kaolin • metakaolin • as feed stock for the manufacture of high purity alumina (HPA).
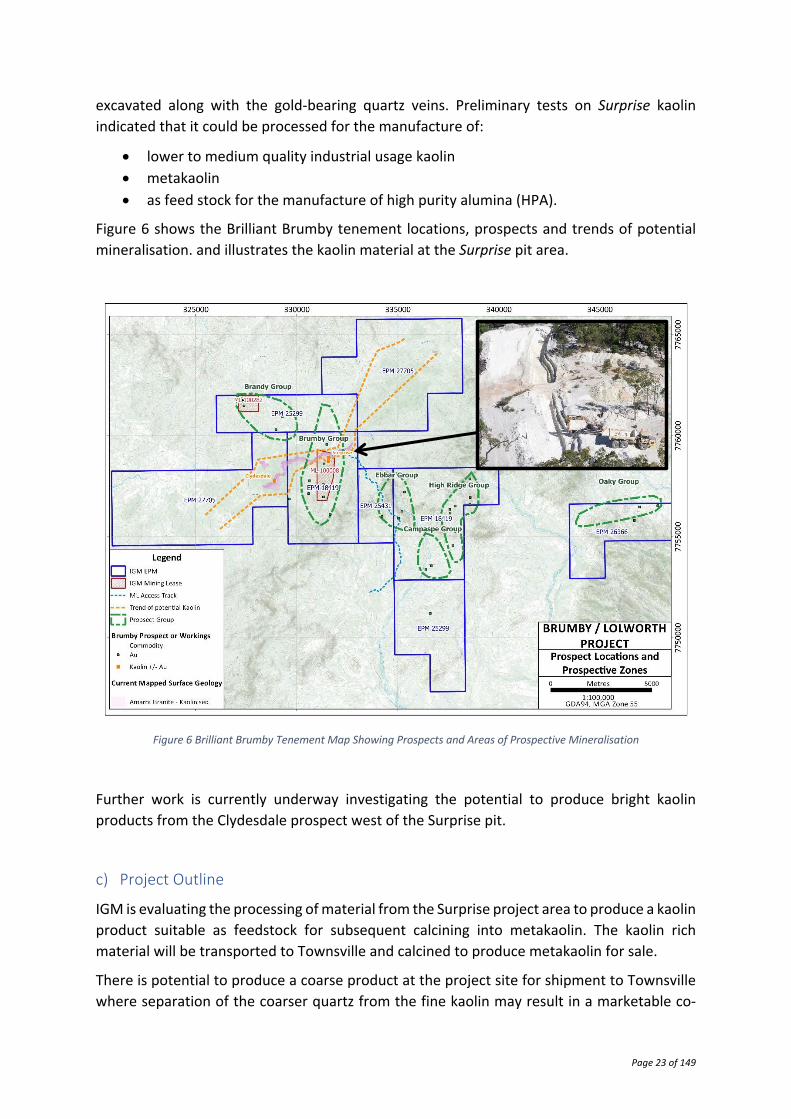
Figure 6 shows the Brilliant Brumby tenement locations, prospects and trends of potential mineralisation. and illustrates the kaolin material at the Surprise pit area.
Figure 6 Brilliant Brumby Tenement Map Showing Prospects and Areas of Prospective Mineralisation
Further work is currently underway investigating the potential to produce bright kaolin products from the Clydesdale prospect west of the Surprise pit.
c) Project Outline
IGM is evaluating the processing of material from the Surprise project area to produce a kaolin product suitable as feedstock for subsequent calcining into metakaolin. The kaolin rich material will be transported to Townsville and calcined to produce metakaolin for sale.
There is potential to produce a coarse product at the project site for shipment to Townsville where separation of the coarser quartz from the fine kaolin may result in a marketable co-

Page 24 of 149
product (quartz) as well as a kaolin-based products. Processing is likely to include attritioning, screening, hydrocyclone classification, thickening of the fine cyclone overflow and filtration or centrifuging to produce a moist kaolin rich material.
It is expected that some kaolin product (approximately 20% of kaolin based production) will also be produced that achieves the bright kaolin product specifications of grade, fineness and brightness. This processing stream will require additional classification and separate drying and bagging systems.
Residual kaolin rich material will be dried, calcined and bagged as metakaolin product.
d) Kaolin Market
There is a 29 Mt/y international market for kaolin which has a range of industrial applications led by paper, ceramics and other speciality uses. Demand is dominated by the paper industry which accounts for more than 40% of market share in terms of volume where kaolin acts as both as a filler to reduce costs as well as improving printing characteristics which is important in the manufacturing of high-quality paper for promotional material. Lightweight coated papers can contain up to 35-40% kaolin. The second biggest market is for use in the manufacture of whiteware ceramics where kaolin makes ceramics whiter in anything from vitreous-china sanitaryware to tableware and wall tiles. Specialty applications include the use of kaolin as a filler in paint as well as being used in rubber, plastics, adhesives, sealants, pharmaceuticals, animal feed, white cement and glass fibre.
The minerals associated with a kaolin product determine its suitability for a particular use. However, there is a growing use by a myriad of new-age industries. Kaolin is now being heralded as “white gold” as it can be transformed into high purity alumina (HPA) which is a key ingredient of the modern world. HPA is a highly versatile material with many uses including LEDs, coating cathode and anode electrode separator sheets in the lithium-ion battery for electric vehicles and energy storage. HPA produced from kaolin may be more cost effective as it is less energy intensive than the traditional processing route which uses bauxite (via aluminium metal) as the feedstock material.
India and US based market researcher Grand View Research2 believes that the global kaolin market was worth US$4.36 billion in 2019 and expects it to grow at a compound annual growth rate (CAGR) of 3.3% from 2020 – 27. The key driving factor is expected to continue to be the increasing demand for ceramics in the construction industry as kaolin is the major raw material used in manufacturing ceramic tiles. Grand View has also pointed out that increasing construction activities in developing economies (China, Brazil and India), resulting from rapid urbanization and industrialisation, is projected to drive the demand for new housing units resulting in a positive influence on ceramic tile demand.
e) Metakaolin Market and Use
IGM’s current major target market is metakaolin for the cement industry. Metakaolin is one of the most effective pozzolanic materials for use in concrete. It is manufactured by heating kaolin, to a temperature between 600 and 800oC. Its quality can be controlled during
2 https://www.grandviewresearch.com/industry-analysis/kaolin-market, accessed 12 April 2021
Page 25 of 149
manufacture, resulting in a much less variable material than industrial pozzolans that are by-products. First used in the 1960s for the construction of a number of large dams in Brazil, metakaolin was successfully incorporated into the concrete with the original intention of suppressing any damage due to alkali-silica reaction1.
When used to replace cement at levels of 5 to 10% by weight, the concrete produced is generally more cohesive and less likely to bleed. As a result, pumping and finishing processes require less effort. The compressive strength of hardened concrete is also increased at this level of replacement.
Slightly higher replacement levels (up to 20%) produce a cement matrix that has low porosity and permeability. This results in improvements to resistance of the hardened concrete to attack by sulfates, chloride ions and other aggressive substances, such as mineral and organic acids. Freeze/ thaw resistance is improved and the risk of damage resulting from the effects of impact or abrasion is reduced for metakaolin concrete that has been finished and cured properly1.
f) Report Objective
The objective of this Concept Study is to present the status of the Surprise Project for internal IGM use. The report structure is similar to that of Technical Reports for the TSX. This structure was used for convenience and clarity.
g) Use of This Report
Use of this report for purposes other than those associated with internal IGM project development are at the reader’s risk. The authors accept no liability for any loss or damage arising as a result of any person or entity, other than IGM, acting in reliance on any information, opinion or advice contained in this document.
3. Reliance on Experts This report was co-ordinated and compiled by Lane Project Services (LPS) based on input from the following experts:
• R J Morrison. Jim Morrison is a geologist with MSc, DIC, FRMIT qualifications and is a Fellow and Chartered Professional (Geology) of the Australasian Institute of Mining and Metallurgy (“AusIMM”), a Member of the Australian Institute of Geoscientists (“AIG”) and of the Advisory Board of the Economic Geology Research Centre (EGRU) of James Cook University, Townsville. He has over 50 years of experience in the Australian mining and exploration industry with various mining companies and for the Geological Survey of WA. For the past 30 years he has worked in northern Queensland holding a number of senior geological positions including significant periods at the Charters Towers, Mount Leyshon and Pajingo gold operations. Since 2014, employed by MTM as a Senior Geologist, he has mapped or inspected most of the main prospects on the Brilliant Brumby Project, and was involved with the planning and supervision of the drilling programs.
Page 26 of 149
• B P Ward. Bridgette Ward has a BSc qualification in Geology and is a Member of the Australian Institute of Geoscientists. Her 13 years of mineral exploration experience in Queensland, includes the assessment of gold, base metal, phosphate and other mineral deposits in northern Queensland. She is Geology Manager for MTM having extensive experience in project management, GIS software and tenement administration as well as a high level of expertise in data compilation, management and database administration. She has inspected many of the prospects and supervised the mining operations on the lease as well as the ground penetrating radar surveys during 2018.
• G S Lane. Greg Lane (BAppSc, MSc, RPEQ, FAusIMM) has over 35 years of experience in minerals processing and has managed, reported and reviewed numerous feasibility studies in Australia, South East Asia, Africa, North America, South America and Europe. He has worked as a subject matter expert for engineering and operating companies across a wide range of commodities, including gold, lithium, copper, iron ore, base metals and industrial minerals.
• M Green. Dr Michael Green is an independent analyst who specialising in growth companies and resources companies. He gained a BSc Honours degree in Mining Engineering from Nottingham University, UK and PhD for a thesis that looked at the economic analysis of mining projects. Having been involved in consultancy work, Michael began working in London in the 1980s as a Mining Analyst with stockbrokers Buckmaster & Moore and then HSBC-owned Greenwell Montagu Securities. Subsequently, he was involved in analysing a wide range of growth companies and became Head of Research at stockbroker Everett Financial which specialised in the small cap market. Since 2006 Michael has been an independent analyst. He has specialised in analysing companies in the resources sector providing research for mining companies, stockbrokers, corporate finance houses, advisers and independent research firms. Between 2008 – 2011, he was a Non-Executive Director of Ascot Mining PLC, a quoted Central American gold mining company. In addition, he has worked closely with resources companies assisting in IR.
• T Pavlopoulos. Terry Pavlopoulos is the managing partner of Cement Business Advisory, a consulting boutique in the global cement sector, and a senior advisor at CemBR, an intelligence and data provider in the global cement sector. Terry has been an independent consultant in the global cement sector since 2008. During this time, he has advised senior managers in several cement producers in Europe, MENA, India, Africa, and Latin America along with some very well-established financial institutions. Previously, he had a successful career with a global cement company (Blue Circle Industries plc) where he was initially a member of the Group Strategy team and subsequently a senior manager of a vertically integrated cement subsidiary. Before embarking on his independent career, Terry spent eight years at Credit Suisse Asset Management as a Buy Side analyst/fund manager, investing in the global cement and building materials sector. Terry’s client list includes the EBRD (European Bank for Reconstruction and Development), and a global development finance institution, where he has an external advisor role, contributing to all of the Bank’s cement related projects.
Page 27 of 149
• L P Evans. Lawrie Evans is a chemical engineer with almost 50 years of experience in the cement industry. He is currently an independent consultant focusing on business improvement by operational, strategic and commercial optimisation mainly, but not exclusively, in the cement industry. He is also engaged in several research projects for novel methods of producing cement with a lower CO2 footprint. He gained a BSc Honours degree in Chemical Engineering from Leeds University. Lawrie joined Blue Circle Industries (BCI), then one of the leading global cement producers, direct from University and progressed through the Technical Centre support group to become Chief Chemical Engineer of BCI in 1991. One responsibility of this position was to manage the technical due diligences for BCI cement acquisitions and following its acquisition by BCI in 1999 Lawrie moved to Heracles Cement in Greece as Operations Director. Following BCIs acquisition by Lafarge in 2002, Lawrie moved to Italcementi, initially as General Manager of a cement plant in Puerto Rico. In 2007, he moved to Italy as Performance Director of Italcementi and remained in this position until retirement in 2014.
• M Barden. Mike Barden is an engineer with over 40 years of experience in the mining industry. After an initial career designing, manufacturing and servicing mining equipment he has then spent the balance of his career in advisory roles. These advisory roles have spanned the full range of activities across the mining value chain from operational to strategic perspectives. Over this period he has been a partner at the Monitor Company, a Director at KPMG and CEO of the CRU group of companies. Mike has consulted to companies across the size horizon and worked in each of the major mining geographies with experience in precious and base metals, bulk commodities and industrial minerals. He currently leads Commodity and Mining Insight, an advisory firm focused on the integration of practical engineering in the mining sector, and the economics and the enabling funding.
• R Garling. Ross Garling has over 50 years of experience in the mining industry. He has a B.E.(Mining)(UNSW), M.B.A.(Macg.), 1st Cl. Cert. as a Mine Mgr.(Qld), and is a Fellow of The Australasian Institute of Mining and Metallurgy. He has held senior positions in a number of mining companies in Australasia and has worked in a diverse range of commodities including zinc (Century Zinc), tin, coal, gold, silver, iron ore, nickel, fly ash, beach sands, etc. Over the last 30 years he has done extensive works in the planning, evaluation, re-mining, re-processing and rehabilitation of mine tailings and mine waste as a consultant and contractor.
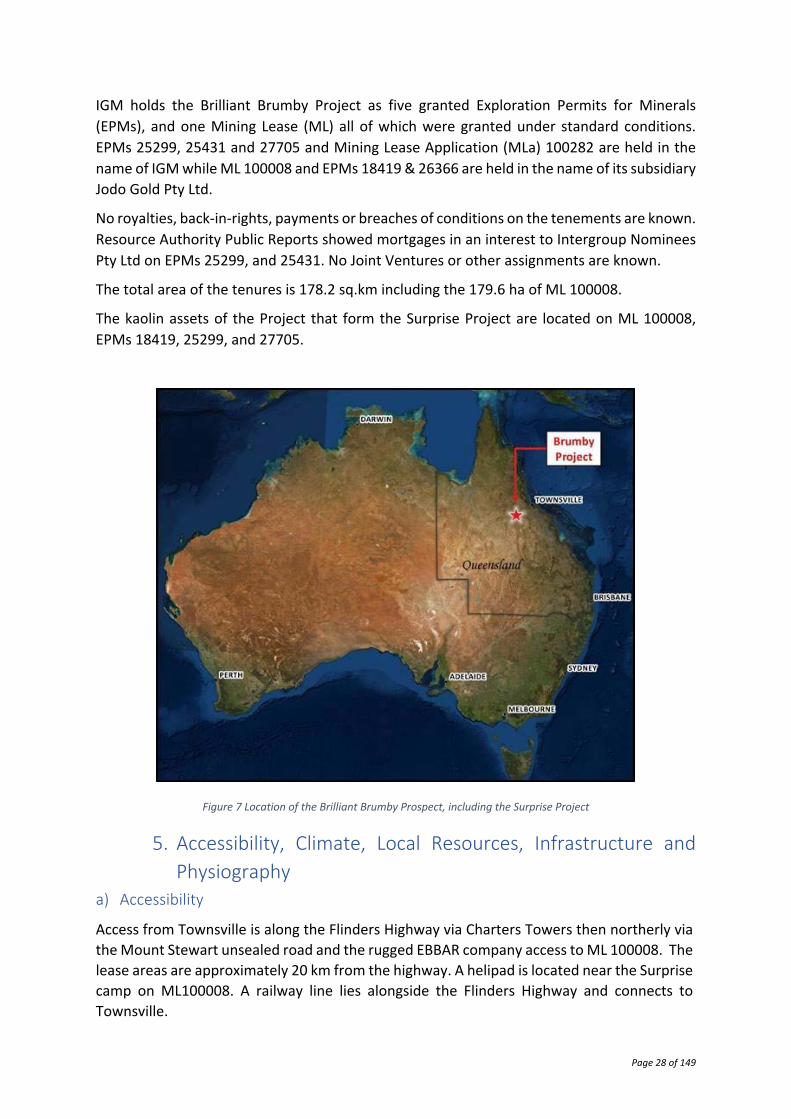
4. Property Description and Location The Brilliant Brumby Project is situated in north east Queensland at approximately 20°15’ 30” S latitude and 145°23’ E longitude, 250 km by road south west of Townsville. Charters Towers lies 95 km to the east northeast, and the Thalanga base metal mine is located 40 km to the ESE.
Page 28 of 149
IGM holds the Brilliant Brumby Project as five granted Exploration Permits for Minerals (EPMs), and one Mining Lease (ML) all of which were granted under standard conditions. EPMs 25299, 25431 and 27705 and Mining Lease Application (MLa) 100282 are held in the name of IGM while ML 100008 and EPMs 18419 & 26366 are held in the name of its subsidiary Jodo Gold Pty Ltd.
No royalties, back-in-rights, payments or breaches of conditions on the tenements are known. Resource Authority Public Reports showed mortgages in an interest to Intergroup Nominees Pty Ltd on EPMs 25299, and 25431. No Joint Ventures or other assignments are known.
The total area of the tenures is 178.2 sq.km including the 179.6 ha of ML 100008.
The kaolin assets of the Project that form the Surprise Project are located on ML 100008, EPMs 18419, 25299, and 27705.
Figure 7 Location of the Brilliant Brumby Prospect, including the Surprise Project
5. Accessibility, Climate, Local Resources, Infrastructure and Physiography
a) Accessibility
Access from Townsville is along the Flinders Highway via Charters Towers then northerly via the Mount Stewart unsealed road and the rugged EBBAR company access to ML 100008. The lease areas are approximately 20 km from the highway. A helipad is located near the Surprise camp on ML100008. A railway line lies alongside the Flinders Highway and connects to Townsville.
Page 29 of 149
There are no sealed public or private roads within the Project area. However, a network of station tracks link many of the old mines and prospects. Most roads and tracks are 4-wheel drive only due to the steep slopes accessing the top of the Lolworth Range, and to the numerous ephemeral creek crossings. Roads and tracks sometimes become impassable after heavy rain events. Some of the more remote prospects are only accessible on foot or all-terrain vehicle.
b) Climate
The project has a hot semi-arid climate. In nearby Charters Towers, there is little rainfall throughout the year. The Köppen-Geiger climate classification is BSh. The average annual temperature is 23.1 °C in Charters Towers with about 585 mm of rain annually.
Average maximum temperatures are 35 °C in summer and 25 °C in winter. Corresponding average minimum temperatures are 22 °C to 11 °C.
Rainfall is predominantly in summer with an average of 145 mm in January and 15 to 20 mm in June through September.
c) Land Use
The current land use on the Project is cattle grazing. The landholders are mostly familiar with mineral exploration activities and of the presence of mining leases and small-scale operations on their holdings.
d) Local Infrastructure
The Surprise pit site is remote and has limited access by tracks, no power supply and limited availability of water.
The initial project plans to provide a dirt access road. Power supply will initially be by diesel generator for the mining and on-site processing activities required for demonstration plant operation. The larger production plant will likely be supplied by a combination of diesel, solar and battery power and road access across the properties will be upgraded.
A local water supply will be developed to supply raw water and potable water for mine use.
The potential locations of the kaolin/metakaolin process plant, potentially a fluid bed or flash calciner and dry classification circuit, are in the Townsville surrounds and will be accessed by sealed roads, have grid power and scheme water.
6. History a) History of Cement Development
The first cementitious materials used were lime mortars, some of which have been dated back to 6500 BC. Limestone was burned to manufacture the lime and when mixed with water and sand a lime mortar was produced which could be used for jointing etc. However, the strength of this mortar was low and very slow to develop as it required the absorption of carbon dioxide back into the mortar. The Romans made the next advance in cements with the addition of a pozzolanic volcanic ash to the lime mortar. The active silica in the pozzolan
Page 30 of 149
combined with the hydrated lime to form calcium silicate hydrate which crystallised and interlocked to form a rigid structure. The longevity and strength of this mortar can be seen in the 2000-year-old Pantheon building in Rome. The roof used pumice as a lightweight aggregate to reduce the mass of the structure.
The formation of natural pozzolans is associated with geothermal activity. It was not until the 1820s when Joseph Aspdin heated a poor-quality marl in an attempt to make lime and accidentally made the first Portland cement. This occurred when the lime and silica combined at high temperature to produce calcium silicates and when water and sand was added it replicated the Roman reaction to form calcium silicate hydrate crystals, producing a rigid structure. The reaction was rapid and the addition of gypsum was subsequently used to control the hydration rate / setting time.
b) Modern Cement Chemistry
For modern pure Portland cement, in its most basic form, the raw materials comprise a mix of a limestone / chalk component for calcium carbonate and a clay or shale for silica, alumina, and iron. In the kiln process the calcium carbonate is decarbonated at temperatures of 700 to 900oC before it combines with the silica, alumina, and iron oxides in the rotary kiln at temperatures of 1400 to 1500oC.
The main four components of Portland cement clinker are, in cement industry shorthand, C3S, C2S, C3A and C4AF. In full form these are tricalcium silicate, dicalcium silicate, tricalcium aluminate and tetracalcium aluminoferrite. Most of the final strength in concrete is due to hydration of the C3S and C2S components with a lesser contribution from C3A and a negligible contribution from C4AF.
The main reason for including the iron oxide in the mix is that it forms most of the high temperature liquid phase in the kiln and facilitates the combination of the calcium and silica compounds.
Pure Portland cement containing only ground clinker, with some 5% gypsum to control setting time, remained the dominant cementitious material used globally until the middle of the 20th century, when the role of additions to cement began to be developed. Due to the conservatism of the construction industry, recognition and acceptance of technological change is slow and changes in the enabling Cement Standards to allow, for example cement additions, are commensurately slow. As an example, Australian Standards as recently as 1982 had no standard permitting pozzolan addition (either natural or artificial) or more than a few percentage points of limestone.
c) Cement Additions
The main additions to cement which have become accepted globally, and their impact on cement characteristics, are as follows.
• Limestone is generally used as an inert filler, although studies have shown that up to approximately 5% addition there is a slightly beneficial impact on strengths due to
Page 31 of 149
activation of the C3A component. Above this level strengths are simply diluted at all stages by limestone addition. The acceptance of limestone cements varies around the world, but even as recently as 25 years ago a few major countries (Australia included) had no limestone cement standard other than for masonry cement types. Limestone cements are almost only offered direct from integrated cement or grinding plants.
• Fly ash from coal fired power stations has been an important addition to cement for at least 50 years. Fly ash is classified into two types for use in cement – Class F and Class C. Class F is the most common and contains active silica which reacts with the hydrated lime released from the hydration of the calcium silicates (see explanation below). Class C ash also contains free lime which can generate some cementitious reaction. Both types of ash have a common problem which is the unburnt carbon remaining in the ash when power stations operate at higher than rated capacity or change coal source to a lower volatile type. This carbon damages strength development and also floats to the surface of concrete causing staining and black patches. The major issue with fly ash is that supplies are drying up in regions where coal fired power stations are being closed. As most fly ash is fine enough to be added direct at the ready-mix concrete plants, there are many countries where the fly ash is sold direct to the end user without passing through a cement plant (e.g. Germany, the UK etc.), but in others (India etc.) it is offered inter-ground or blended at the cement plant.
• Ground granulated blast furnace slag (ggbfs) has been another important addition to cement for at least 50 years. The chemistry of blast furnace slag includes silicates, aluminosilicates, and calcium-alumina-silicates. The slag extracted from blast furnaces is inactive as a cementitious material if allowed to cool slowly, but when quenched rapidly with water it becomes glassy and has some cementitious activity which is enhanced by the alkaline environment of concrete with Portland cement. Widely used, slag cements with up to 50% slag content are used for their excellent durability in aggressive environments (chloride, sulphates etc.). Strength growth is slow with slag cements, but this can be an advantage in mass pours when heat evolution from hydration is an issue. Slag is still widely available on a global basis, but as steel recycling and direct reduction of iron ore replaces blast furnaces the availability of ggbfs is becoming ever tighter. Many cement plants offer slag cements, but there is also a large volume of pure ground ggbfs which is sold to ready mix producers.
• Natural pozzolans have been used in cements for millennia. The vast majority of natural pozzolans used today are derived from geothermal activity where the activation of the silica is due to rapid cooling of eruptive material. Such materials are available widely globally, but there are many regions (Australia, Northern Europe, Eastern USA, North Africa etc.) where such materials are in scarce supply. The pozzolanic activity can vary widely across a deposit and Chapelle testing (see below) is essential to differentiate between active and lesser or inactive materials.
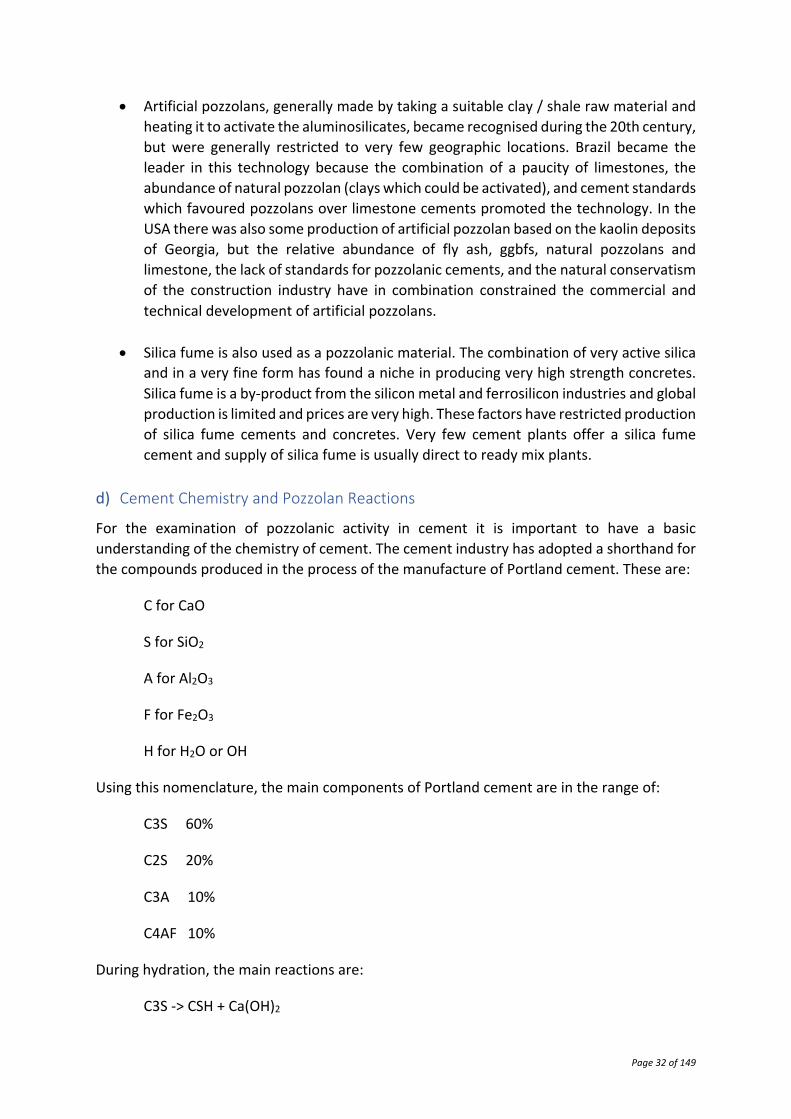
Page 32 of 149
• Artificial pozzolans, generally made by taking a suitable clay / shale raw material and heating it to activate the aluminosilicates, became recognised during the 20th century, but were generally restricted to very few geographic locations. Brazil became the leader in this technology because the combination of a paucity of limestones, the abundance of natural pozzolan (clays which could be activated), and cement standards which favoured pozzolans over limestone cements promoted the technology. In the USA there was also some production of artificial pozzolan based on the kaolin deposits of Georgia, but the relative abundance of fly ash, ggbfs, natural pozzolans and limestone, the lack of standards for pozzolanic cements, and the natural conservatism of the construction industry have in combination constrained the commercial and technical development of artificial pozzolans.
• Silica fume is also used as a pozzolanic material. The combination of very active silica and in a very fine form has found a niche in producing very high strength concretes. Silica fume is a by-product from the silicon metal and ferrosilicon industries and global production is limited and prices are very high. These factors have restricted production of silica fume cements and concretes. Very few cement plants offer a silica fume cement and supply of silica fume is usually direct to ready mix plants.
d) Cement Chemistry and Pozzolan Reactions
For the examination of pozzolanic activity in cement it is important to have a basic understanding of the chemistry of cement. The cement industry has adopted a shorthand for the compounds produced in the process of the manufacture of Portland cement. These are:
C for CaO
S for SiO2
A for Al2O3
F for Fe2O3
H for H2O or OH
Using this nomenclature, the main components of Portland cement are in the range of:
C3S 60%
C2S 20%
C3A 10%
C4AF 10%
During hydration, the main reactions are:
C3S -> CSH + Ca(OH)2
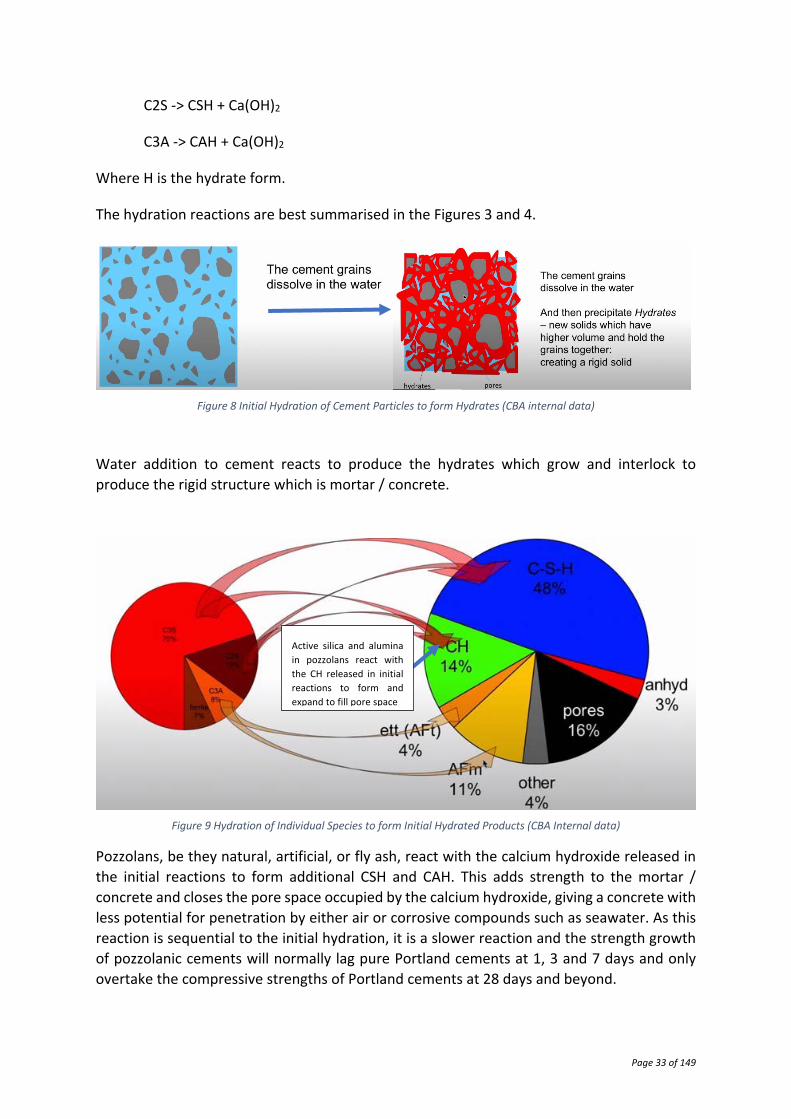
Page 33 of 149
C2S -> CSH + Ca(OH)2
C3A -> CAH + Ca(OH)2
Where H is the hydrate form.
The hydration reactions are best summarised in the Figures 3 and 4.
Figure 8 Initial Hydration of Cement Particles to form Hydrates (CBA internal data)
Water addition to cement reacts to produce the hydrates which grow and interlock to produce the rigid structure which is mortar / concrete.
Figure 9 Hydration of Individual Species to form Initial Hydrated Products (CBA Internal data)
Pozzolans, be they natural, artificial, or fly ash, react with the calcium hydroxide released in the initial reactions to form additional CSH and CAH. This adds strength to the mortar / concrete and closes the pore space occupied by the calcium hydroxide, giving a concrete with less potential for penetration by either air or corrosive compounds such as seawater. As this reaction is sequential to the initial hydration, it is a slower reaction and the strength growth of pozzolanic cements will normally lag pure Portland cements at 1, 3 and 7 days and only overtake the compressive strengths of Portland cements at 28 days and beyond.
Active silica and alumina in pozzolans react with the CH released in initial reactions to form and expand to fill pore space
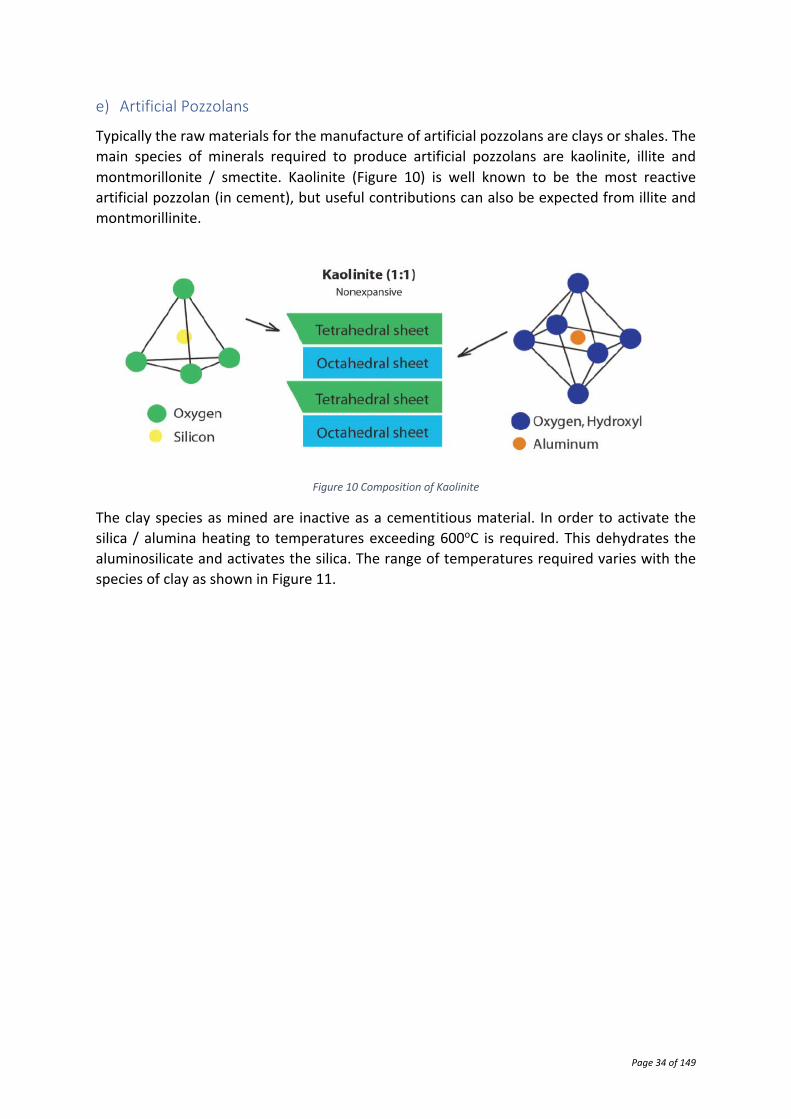
Page 34 of 149
e) Artificial Pozzolans
Typically the raw materials for the manufacture of artificial pozzolans are clays or shales. The main species of minerals required to produce artificial pozzolans are kaolinite, illite and montmorillonite / smectite. Kaolinite (Figure 10) is well known to be the most reactive artificial pozzolan (in cement), but useful contributions can also be expected from illite and montmorillinite.
Figure 10 Composition of Kaolinite
The clay species as mined are inactive as a cementitious material. In order to activate the silica / alumina heating to temperatures exceeding 600oC is required. This dehydrates the aluminosilicate and activates the silica. The range of temperatures required varies with the species of clay as shown in Figure 11.
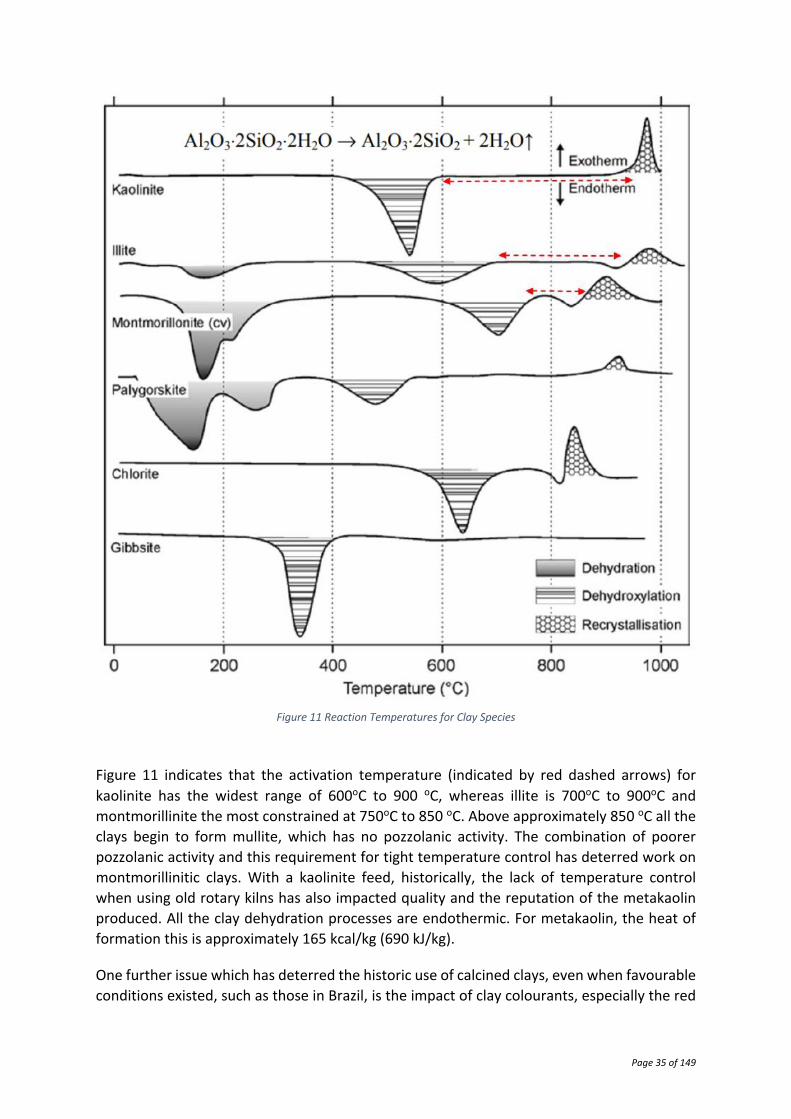
Page 35 of 149
Figure 11 Reaction Temperatures for Clay Species
Figure 11 indicates that the activation temperature (indicated by red dashed arrows) for kaolinite has the widest range of 600oC to 900 oC, whereas illite is 700oC to 900oC and montmorillinite the most constrained at 750oC to 850 oC. Above approximately 850 oC all the clays begin to form mullite, which has no pozzolanic activity. The combination of poorer pozzolanic activity and this requirement for tight temperature control has deterred work on montmorillinitic clays. With a kaolinite feed, historically, the lack of temperature control when using old rotary kilns has also impacted quality and the reputation of the metakaolin produced. All the clay dehydration processes are endothermic. For metakaolin, the heat of formation this is approximately 165 kcal/kg (690 kJ/kg).
One further issue which has deterred the historic use of calcined clays, even when favourable conditions existed, such as those in Brazil, is the impact of clay colourants, especially the red
Page 36 of 149
/ brown staining caused by iron oxides. When the red coloured calcined clay was added to cement the result was a pink cement which was not acceptable for most customers. However, beginning in the 1990s, industry developments, notably by FLSmidth of Denmark, employed techniques similar to those used to improve whiteness in white cements. This utilised a strong reducing atmosphere during calcination to chemically reduce the red Fe2O3 to FeO, which is effectively light green / colourless. The success of this approach has led to a wider application of calcined clays in Brazil and, more recently, in Colombia and West Africa.
f) Metakaolin in Cement
Historically, the use of calcined clays in cement has been mainly limited to Brazil. In the USA, metakaolin in cement was a product available from only a single cement producer and this ceased at the end of the last century. In all of these cases the calcined clay / metakaolin was produced by the cement manufacturer and then mixed at the 10 to 25% level with Ordinary Portland Cement (OPC). As recently as 2012 the industry was not well developed, as indicated by the following quotes from a cement industry conference at that time:
• “metakaolin remains a niche product in the cement industry”
• “there is no effective production of high quality metakaolin in Europe. What is produced usually has high levels of quartz contamination”
• “to obtain high quality metakaolin I had to import from the USA to Europe and the selling price was 300€ to 700€ per tonne, only applicable to high value projects for high strength, high durability and with a desire for light coloured concrete”
• “world production volumes of metakaolin are only 500,000 t/y”.
Since 2012 there has been a “sea-change” in the cement industry’s view of calcined clays and especially metakaolin. This is due to a number of factors, including:
• The failure of the cement industry to meet CO2 reduction targets. In Europe, the target was a 2% annual reduction as measured by kg CO2/ t clinker, but only a 0.4% annual reduction has been achieved.
• Since 2017 in Europe there has been a rapid increase in the traded cost of carbon credits.
• Increasing discussion of carbon leakage protection to prevent outsourcing of CO2.
• In several regions of the world there are rapidly dwindling sources of fly ash and ggbfs.
• A general recognition that limestone cements are not “environmentally friendly”.
Page 37 of 149
The addition of metakaolin to cement is relatively simple. At both integrated and grinding plants the metakaolin can be introduced into the cement milling stage. Depending on the fineness of the metakaolin it can be added to the materials entering the mill, or to the mill separator, or to the transport from the mill. Up to 25% metakaolin can be added as this is the amount which can react with the hydrated lime available from the hydration of the C3S, C2S and C3A. There are indications that the higher activity metakaolins require higher gypsum addition to control setting time. To effect the addition of metakaolin, cement terminals require blending equipment and ready-mix concrete plants require a new silo to control addition into the batch mix.
To be acceptable as an addition to cement, metakaolin must be accepted under the national standards for a given country. Most country cement standards tend to fall under the influence of either European or American standards. Australia has some influences from both sources, but the majority (classes, strength testing) are European. As recently as 1991, there was no artificial or natural pozzolan which qualified as an addition under Australian Standards.
Under current European Cement Standards (EN 197-1), metakaolin would be classified as a natural calcined pozzolan (abbreviation Q) and would be allowed in CEM IV up to a maximum of 55% in combination with other pozzolans, fly ash and silica fume, but with no limestone permitted. It is also permitted up to 35% in combination with limestone. Changes have been proposed to allow higher combination levels for pozzolans and limestone which would allow cements such as LC3 which comprises 50% clinker, 30% calcined clay, 15% limestone and 5% gypsum.
Under American Standards (ASTM 150, ASTM 1157) pozzolans, both natural and artificial are allowed under Type IP and GU categories, respectively.
In some countries there are issues with concrete standards which can also limit pozzolan additions, such as metakaolin, when these are added directly to concrete. This must be addressed on a case-by-case basis, but can be achieved. As an example, the ultra-conservative American Department of Transport regulations for California have specified metakaolin as acceptable for direct use in concrete.
Overall, with the growing awareness of CO2 issues and global warming, changes to cement and concrete standards, and with ever tightening supplies of fly ash and slag, the major cement players are now strongly moving towards calcined clay as an answer to the environmental challenge.
7. Geological Setting and Mineralization of the Kaolin Deposits a) Geological Setting
The kaolin assets of the Surpise Project are located on Lolworth Range plateau within ML 100008, EPMs 18419, 25299, and 27705.
The tenements are underlain by granites of the Lolworth Igneous Complex (Figure 12 and Figure 13) comprising mainly of Amarra Granite (biotite-muscovite adamellite and granodiorite) which has been dated as Upper Silurian to Lower Devonian (~380 Ma). Faulting,
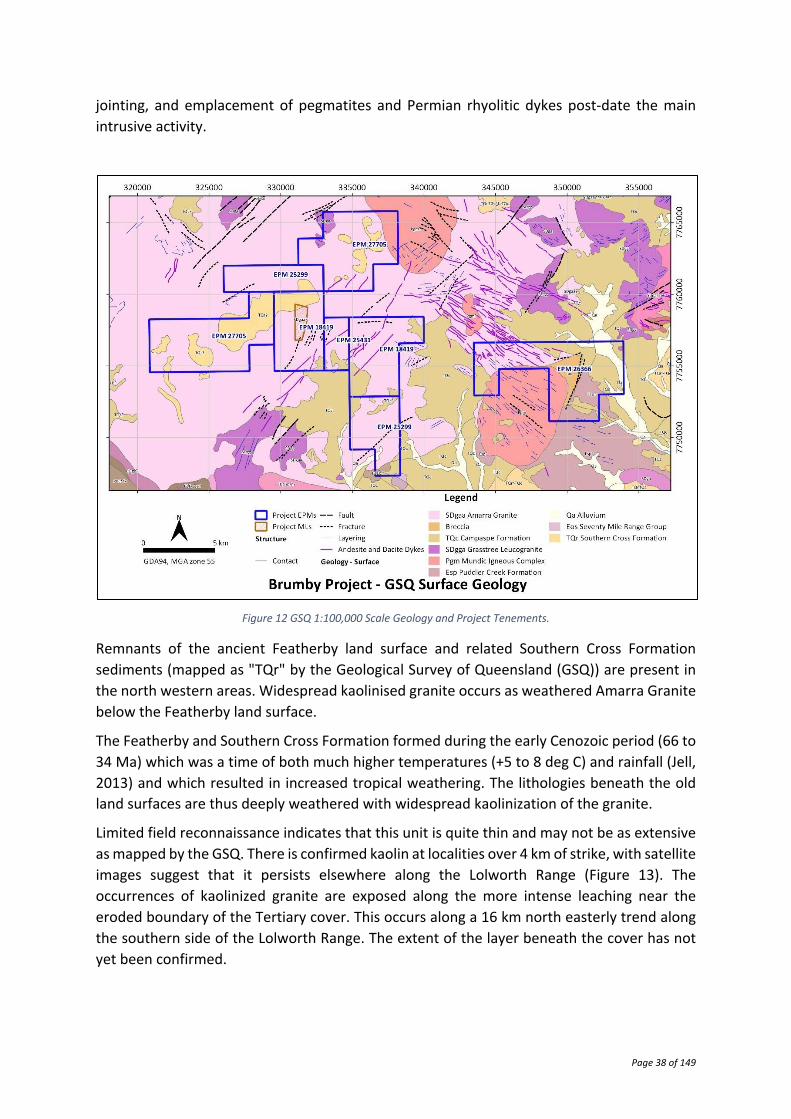
Page 38 of 149
jointing, and emplacement of pegmatites and Permian rhyolitic dykes post-date the main intrusive activity.
Figure 12 GSQ 1:100,000 Scale Geology and Project Tenements.
Remnants of the ancient Featherby land surface and related Southern Cross Formation sediments (mapped as "TQr" by the Geological Survey of Queensland (GSQ)) are present in the north western areas. Widespread kaolinised granite occurs as weathered Amarra Granite below the Featherby land surface.
The Featherby and Southern Cross Formation formed during the early Cenozoic period (66 to 34 Ma) which was a time of both much higher temperatures (+5 to 8 deg C) and rainfall (Jell, 2013) and which resulted in increased tropical weathering. The lithologies beneath the old land surfaces are thus deeply weathered with widespread kaolinization of the granite.
Limited field reconnaissance indicates that this unit is quite thin and may not be as extensive as mapped by the GSQ. There is confirmed kaolin at localities over 4 km of strike, with satellite images suggest that it persists elsewhere along the Lolworth Range (Figure 13). The occurrences of kaolinized granite are exposed along the more intense leaching near the eroded boundary of the Tertiary cover. This occurs along a 16 km north easterly trend along the southern side of the Lolworth Range. The extent of the layer beneath the cover has not yet been confirmed.
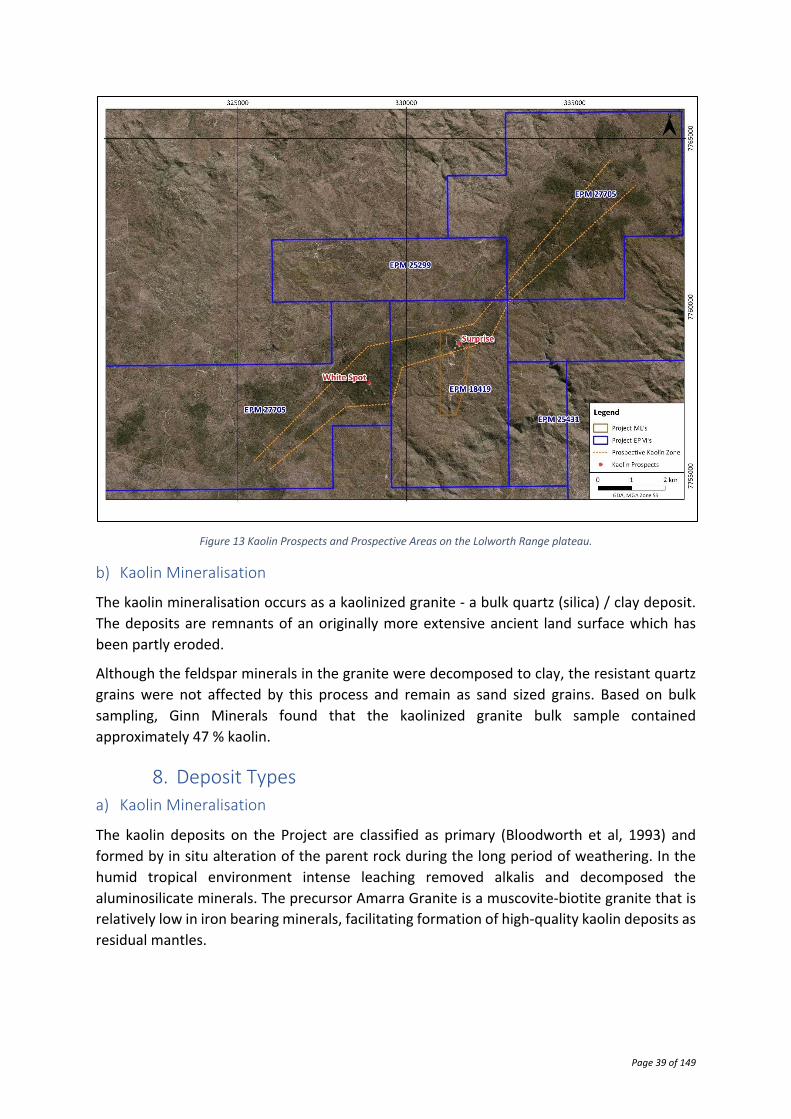
Page 39 of 149
Figure 13 Kaolin Prospects and Prospective Areas on the Lolworth Range plateau.
b) Kaolin Mineralisation
The kaolin mineralisation occurs as a kaolinized granite - a bulk quartz (silica) / clay deposit. The deposits are remnants of an originally more extensive ancient land surface which has been partly eroded.
Although the feldspar minerals in the granite were decomposed to clay, the resistant quartz grains were not affected by this process and remain as sand sized grains. Based on bulk sampling, Ginn Minerals found that the kaolinized granite bulk sample contained approximately 47 % kaolin.
8. Deposit Types a) Kaolin Mineralisation
The kaolin deposits on the Project are classified as primary (Bloodworth et al, 1993) and formed by in situ alteration of the parent rock during the long period of weathering. In the humid tropical environment intense leaching removed alkalis and decomposed the aluminosilicate minerals. The precursor Amarra Granite is a muscovite-biotite granite that is relatively low in iron bearing minerals, facilitating formation of high-quality kaolin deposits as residual mantles.
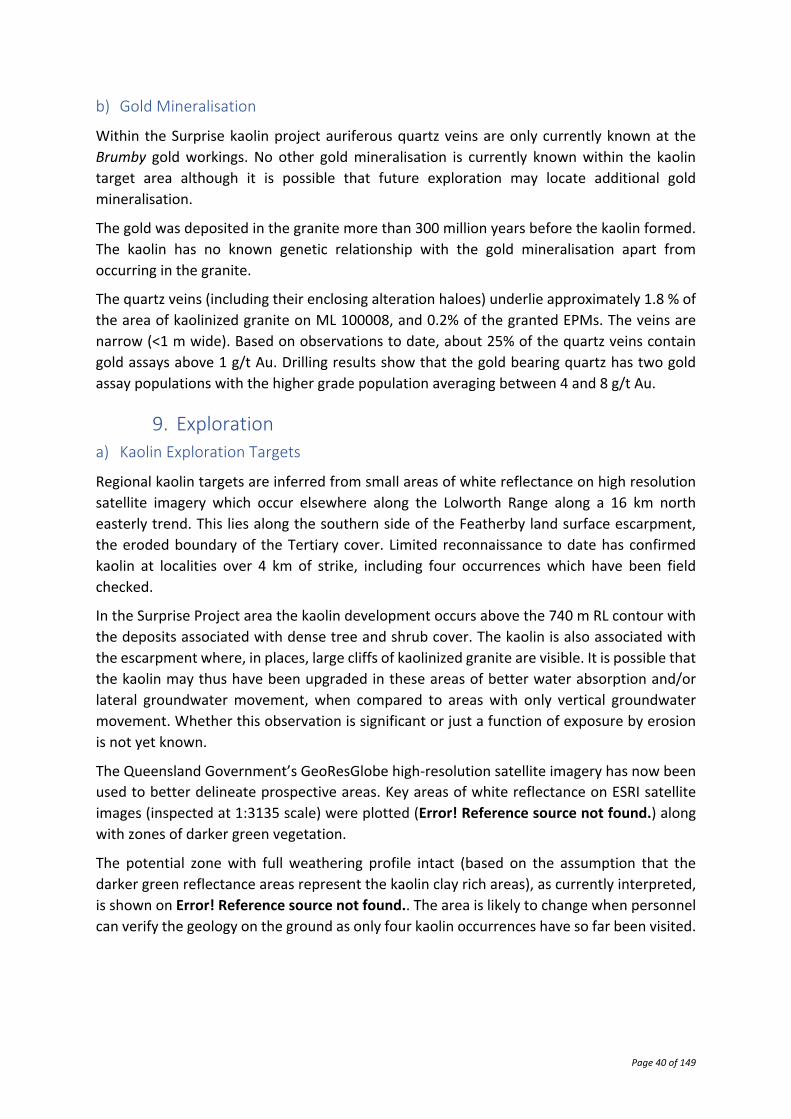
Page 40 of 149
b) Gold Mineralisation
Within the Surprise kaolin project auriferous quartz veins are only currently known at the Brumby gold workings. No other gold mineralisation is currently known within the kaolin target area although it is possible that future exploration may locate additional gold mineralisation.
The gold was deposited in the granite more than 300 million years before the kaolin formed. The kaolin has no known genetic relationship with the gold mineralisation apart from occurring in the granite.
The quartz veins (including their enclosing alteration haloes) underlie approximately 1.8 % of the area of kaolinized granite on ML 100008, and 0.2% of the granted EPMs. The veins are narrow (<1 m wide). Based on observations to date, about 25% of the quartz veins contain gold assays above 1 g/t Au. Drilling results show that the gold bearing quartz has two gold assay populations with the higher grade population averaging between 4 and 8 g/t Au.
9. Exploration a) Kaolin Exploration Targets
Regional kaolin targets are inferred from small areas of white reflectance on high resolution satellite imagery which occur elsewhere along the Lolworth Range along a 16 km north easterly trend. This lies along the southern side of the Featherby land surface escarpment, the eroded boundary of the Tertiary cover. Limited reconnaissance to date has confirmed kaolin at localities over 4 km of strike, including four occurrences which have been field checked.
In the Surprise Project area the kaolin development occurs above the 740 m RL contour with the deposits associated with dense tree and shrub cover. The kaolin is also associated with the escarpment where, in places, large cliffs of kaolinized granite are visible. It is possible that the kaolin may thus have been upgraded in these areas of better water absorption and/or lateral groundwater movement, when compared to areas with only vertical groundwater movement. Whether this observation is significant or just a function of exposure by erosion is not yet known.
The Queensland Government’s GeoResGlobe high-resolution satellite imagery has now been used to better delineate prospective areas. Key areas of white reflectance on ESRI satellite images (inspected at 1:3135 scale) were plotted (Error! Reference source not found.) along with zones of darker green vegetation.
The potential zone with full weathering profile intact (based on the assumption that the darker green reflectance areas represent the kaolin clay rich areas), as currently interpreted, is shown on Error! Reference source not found.. The area is likely to change when personnel can verify the geology on the ground as only four kaolin occurrences have so far been visited.
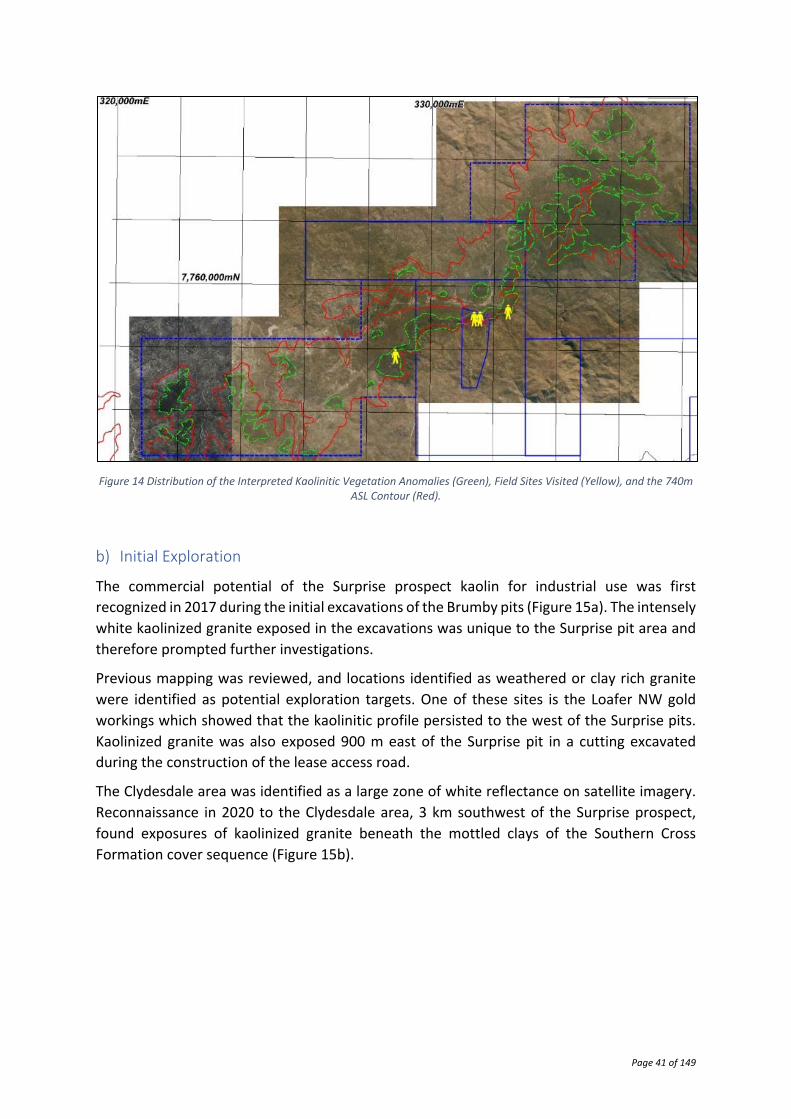
Page 41 of 149
Figure 14 Distribution of the Interpreted Kaolinitic Vegetation Anomalies (Green), Field Sites Visited (Yellow), and the 740m
ASL Contour (Red).
b) Initial Exploration
The commercial potential of the Surprise prospect kaolin for industrial use was first recognized in 2017 during the initial excavations of the Brumby pits (Figure 15a). The intensely white kaolinized granite exposed in the excavations was unique to the Surprise pit area and therefore prompted further investigations.
Previous mapping was reviewed, and locations identified as weathered or clay rich granite were identified as potential exploration targets. One of these sites is the Loafer NW gold workings which showed that the kaolinitic profile persisted to the west of the Surprise pits. Kaolinized granite was also exposed 900 m east of the Surprise pit in a cutting excavated during the construction of the lease access road.
The Clydesdale area was identified as a large zone of white reflectance on satellite imagery. Reconnaissance in 2020 to the Clydesdale area, 3 km southwest of the Surprise prospect, found exposures of kaolinized granite beneath the mottled clays of the Southern Cross Formation cover sequence (Figure 15b).
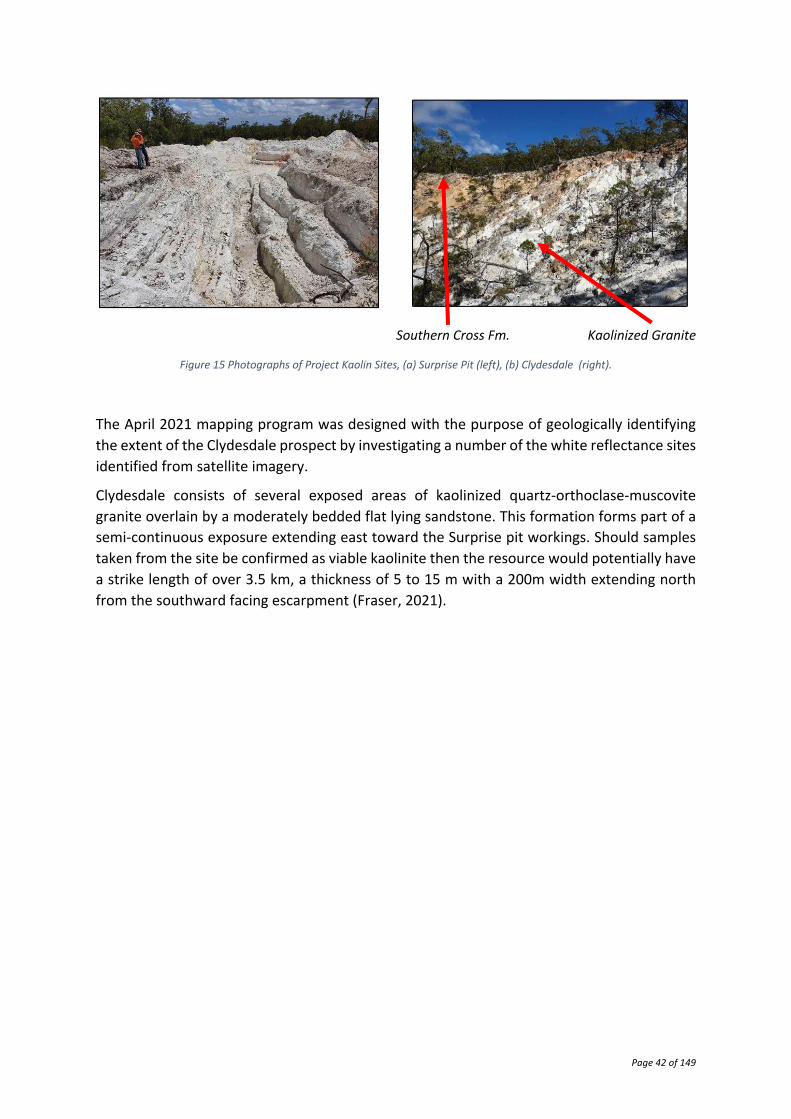
Page 42 of 149
Southern Cross Fm. Kaolinized Granite
Figure 15 Photographs of Project Kaolin Sites, (a) Surprise Pit (left), (b) Clydesdale (right).
The April 2021 mapping program was designed with the purpose of geologically identifying the extent of the Clydesdale prospect by investigating a number of the white reflectance sites identified from satellite imagery.
Clydesdale consists of several exposed areas of kaolinized quartz-orthoclase-muscovite granite overlain by a moderately bedded flat lying sandstone. This formation forms part of a semi-continuous exposure extending east toward the Surprise pit workings. Should samples taken from the site be confirmed as viable kaolinite then the resource would potentially have a strike length of over 3.5 km, a thickness of 5 to 15 m with a 200m width extending north from the southward facing escarpment (Fraser, 2021).
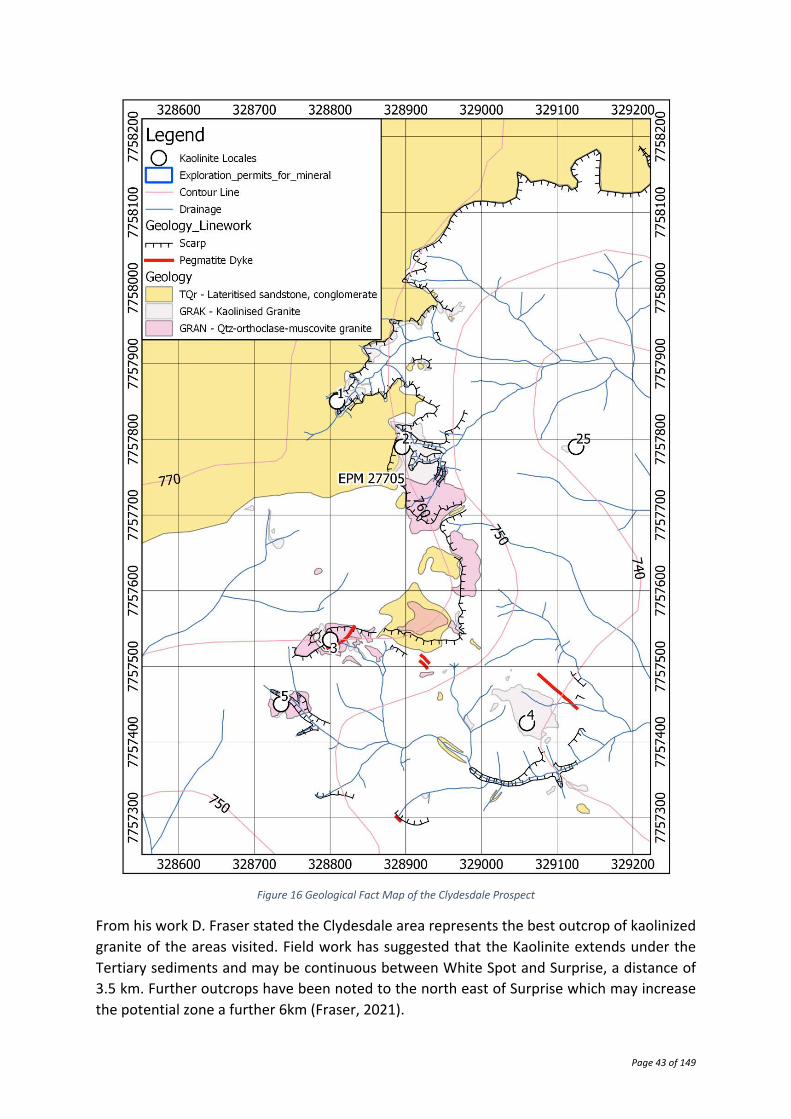
Page 43 of 149
Figure 16 Geological Fact Map of the Clydesdale Prospect
From his work D. Fraser stated the Clydesdale area represents the best outcrop of kaolinized granite of the areas visited. Field work has suggested that the Kaolinite extends under the Tertiary sediments and may be continuous between White Spot and Surprise, a distance of 3.5 km. Further outcrops have been noted to the north east of Surprise which may increase the potential zone a further 6km (Fraser, 2021).
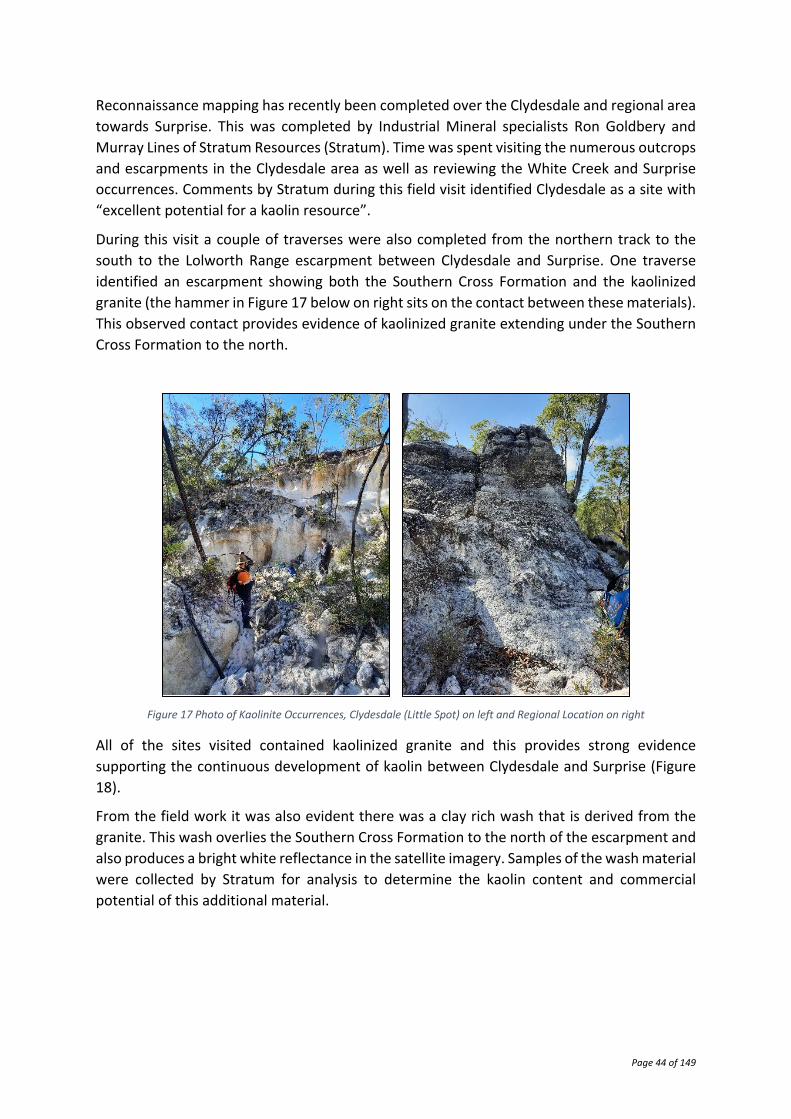
Page 44 of 149
Reconnaissance mapping has recently been completed over the Clydesdale and regional area towards Surprise. This was completed by Industrial Mineral specialists Ron Goldbery and Murray Lines of Stratum Resources (Stratum). Time was spent visiting the numerous outcrops and escarpments in the Clydesdale area as well as reviewing the White Creek and Surprise occurrences. Comments by Stratum during this field visit identified Clydesdale as a site with “excellent potential for a kaolin resource”.
During this visit a couple of traverses were also completed from the northern track to the south to the Lolworth Range escarpment between Clydesdale and Surprise. One traverse identified an escarpment showing both the Southern Cross Formation and the kaolinized granite (the hammer in Figure 17 below on right sits on the contact between these materials). This observed contact provides evidence of kaolinized granite extending under the Southern Cross Formation to the north.
Figure 17 Photo of Kaolinite Occurrences, Clydesdale (Little Spot) on left and Regional Location on right
All of the sites visited contained kaolinized granite and this provides strong evidence supporting the continuous development of kaolin between Clydesdale and Surprise (Figure 18).
From the field work it was also evident there was a clay rich wash that is derived from the granite. This wash overlies the Southern Cross Formation to the north of the escarpment and also produces a bright white reflectance in the satellite imagery. Samples of the wash material were collected by Stratum for analysis to determine the kaolin content and commercial potential of this additional material.
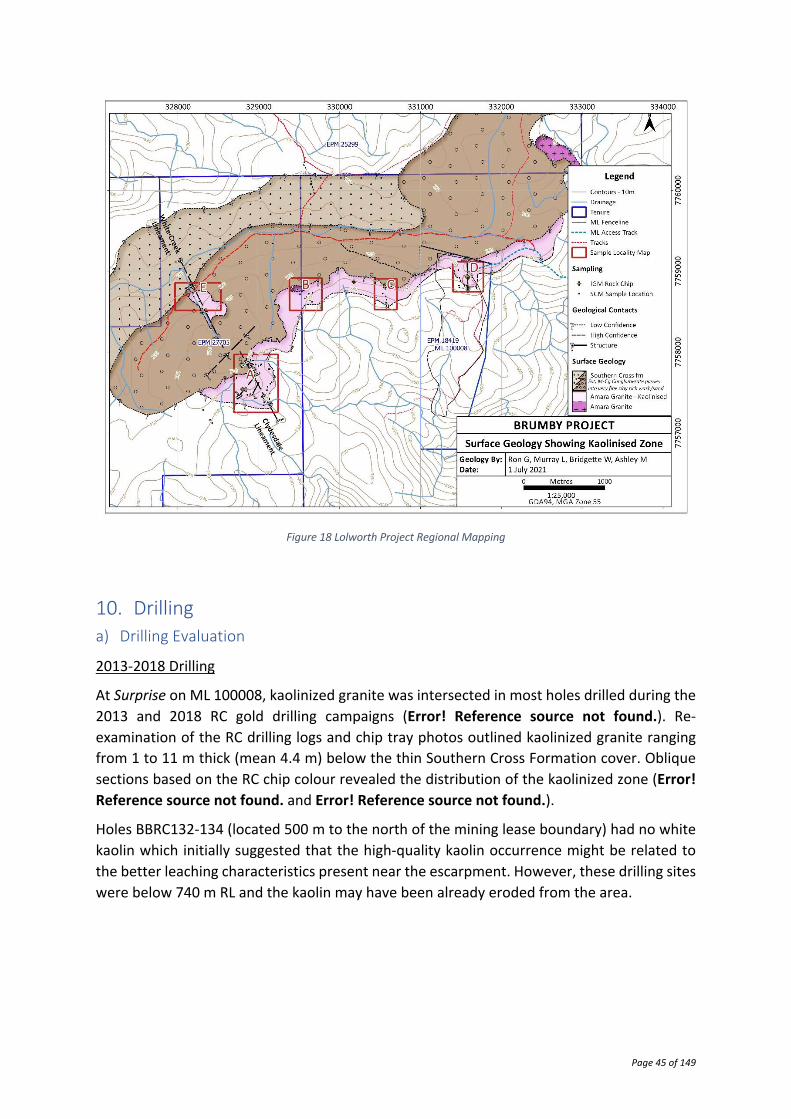
Page 45 of 149
Figure 18 Lolworth Project Regional Mapping
10. Drilling a) Drilling Evaluation
2013-2018 Drilling
At Surprise on ML 100008, kaolinized granite was intersected in most holes drilled during the 2013 and 2018 RC gold drilling campaigns (Error! Reference source not found.). Re-examination of the RC drilling logs and chip tray photos outlined kaolinized granite ranging from 1 to 11 m thick (mean 4.4 m) below the thin Southern Cross Formation cover. Oblique sections based on the RC chip colour revealed the distribution of the kaolinized zone (Error! Reference source not found. and Error! Reference source not found.).
Holes BBRC132-134 (located 500 m to the north of the mining lease boundary) had no white kaolin which initially suggested that the high-quality kaolin occurrence might be related to the better leaching characteristics present near the escarpment. However, these drilling sites were below 740 m RL and the kaolin may have been already eroded from the area.
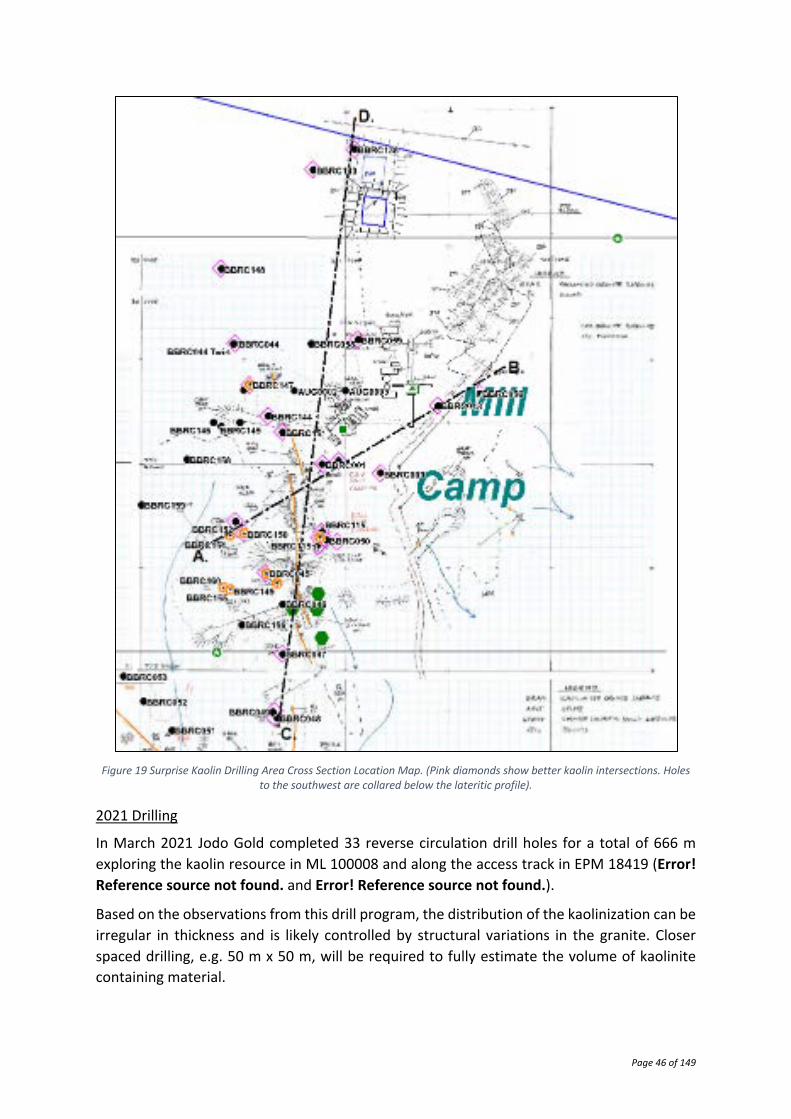
Page 46 of 149
Figure 19 Surprise Kaolin Drilling Area Cross Section Location Map. (Pink diamonds show better kaolin intersections. Holes
to the southwest are collared below the lateritic profile).
2021 Drilling
In March 2021 Jodo Gold completed 33 reverse circulation drill holes for a total of 666 m exploring the kaolin resource in ML 100008 and along the access track in EPM 18419 (Error! Reference source not found. and Error! Reference source not found.).
Based on the observations from this drill program, the distribution of the kaolinization can be irregular in thickness and is likely controlled by structural variations in the granite. Closer spaced drilling, e.g. 50 m x 50 m, will be required to fully estimate the volume of kaolinite containing material.
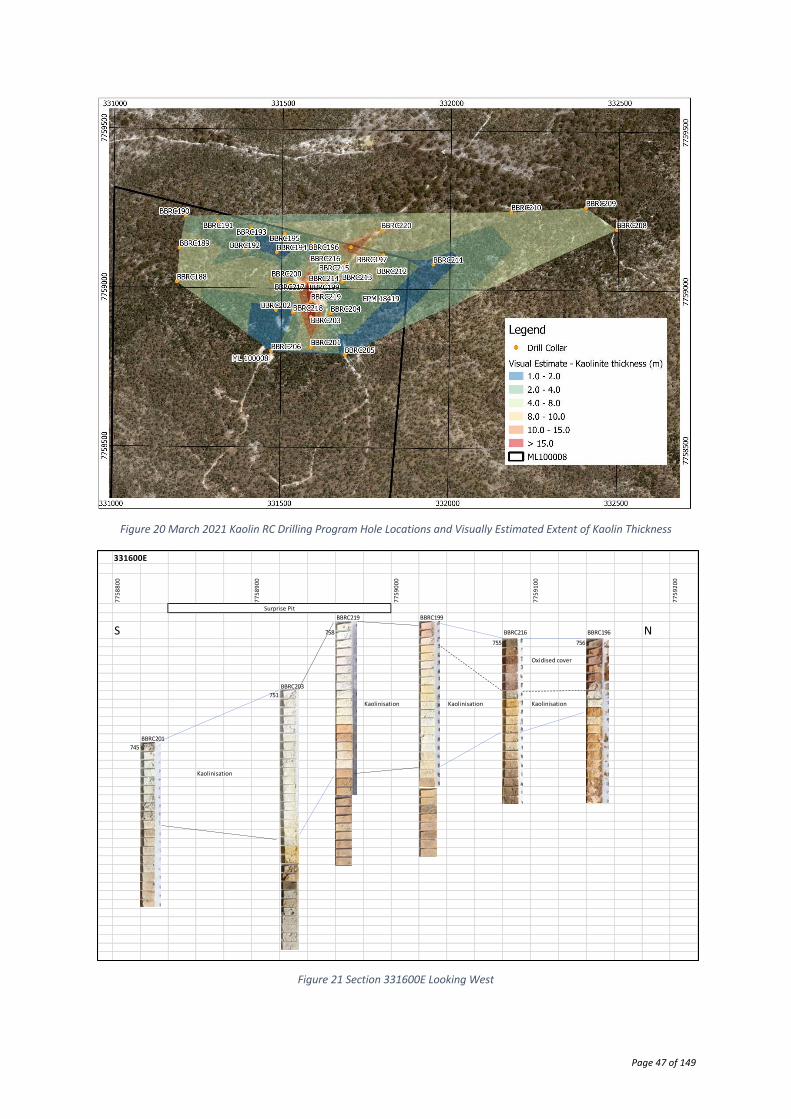
Page 47 of 149
Figure 20 March 2021 Kaolin RC Drilling Program Hole Locations and Visually Estimated Extent of Kaolin Thickness
Figure 21 Section 331600E Looking West
331600E
7758
800
7758
900
7759
000
7759
100
7759
200
BBRC219 BBRC199
S 758 BBRC216 BBRC196 N755 756
Oxidised cover
BBRC203751
Kaolinisation Kaolinisation Kaolinisation
BBRC201745
Kaolinisation
Surprise Pit
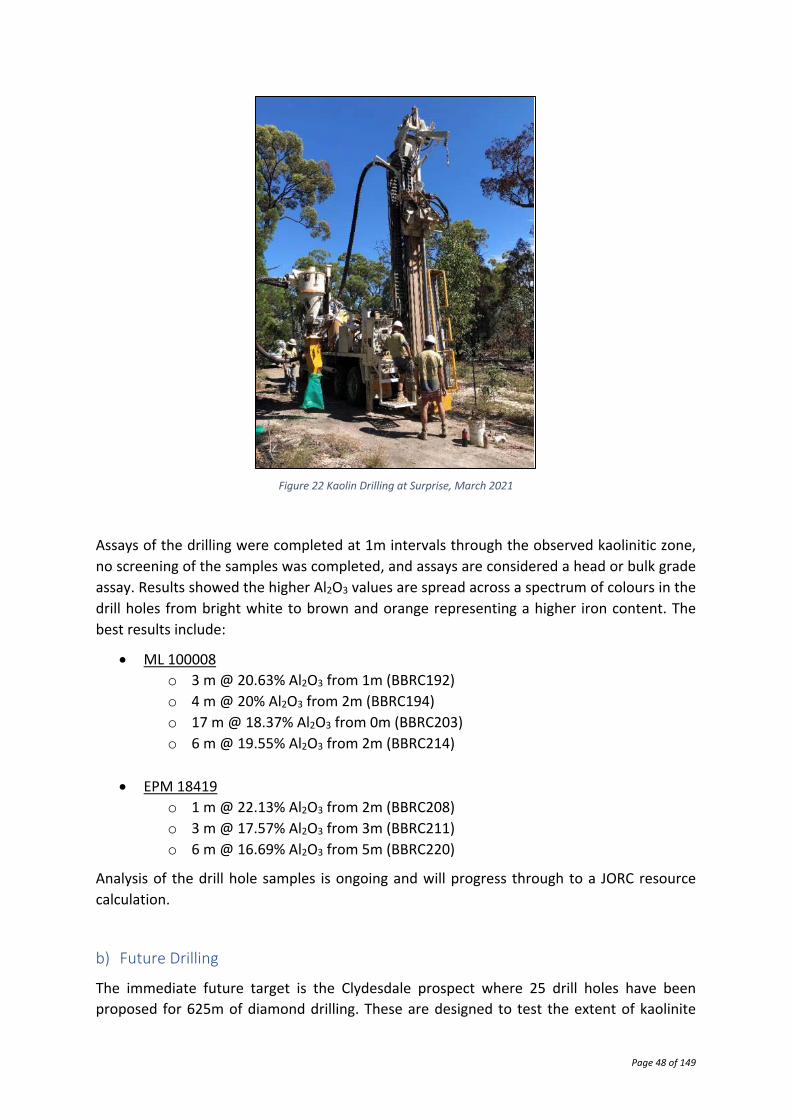
Page 48 of 149
Figure 22 Kaolin Drilling at Surprise, March 2021
Assays of the drilling were completed at 1m intervals through the observed kaolinitic zone, no screening of the samples was completed, and assays are considered a head or bulk grade assay. Results showed the higher Al2O3 values are spread across a spectrum of colours in the drill holes from bright white to brown and orange representing a higher iron content. The best results include:
• ML 100008 o 3 m @ 20.63% Al2O3 from 1m (BBRC192) o 4 m @ 20% Al2O3 from 2m (BBRC194) o 17 m @ 18.37% Al2O3 from 0m (BBRC203) o 6 m @ 19.55% Al2O3 from 2m (BBRC214)
• EPM 18419
o 1 m @ 22.13% Al2O3 from 2m (BBRC208) o 3 m @ 17.57% Al2O3 from 3m (BBRC211) o 6 m @ 16.69% Al2O3 from 5m (BBRC220)
Analysis of the drill hole samples is ongoing and will progress through to a JORC resource calculation.
b) Future Drilling
The immediate future target is the Clydesdale prospect where 25 drill holes have been proposed for 625m of diamond drilling. These are designed to test the extent of kaolinite
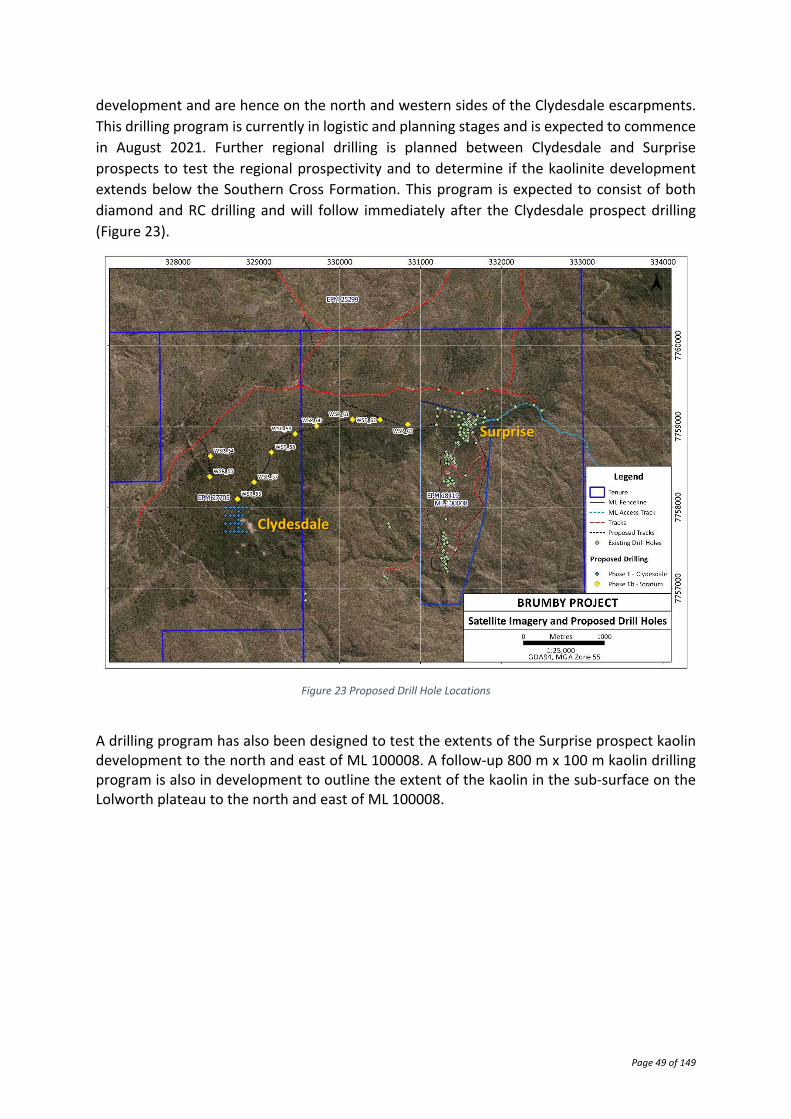
Page 49 of 149
development and are hence on the north and western sides of the Clydesdale escarpments. This drilling program is currently in logistic and planning stages and is expected to commence in August 2021. Further regional drilling is planned between Clydesdale and Surprise prospects to test the regional prospectivity and to determine if the kaolinite development extends below the Southern Cross Formation. This program is expected to consist of both diamond and RC drilling and will follow immediately after the Clydesdale prospect drilling (Figure 23).
Figure 23 Proposed Drill Hole Locations
A drilling program has also been designed to test the extents of the Surprise prospect kaolin development to the north and east of ML 100008. A follow-up 800 m x 100 m kaolin drilling program is also in development to outline the extent of the kaolin in the sub-surface on the Lolworth plateau to the north and east of ML 100008.
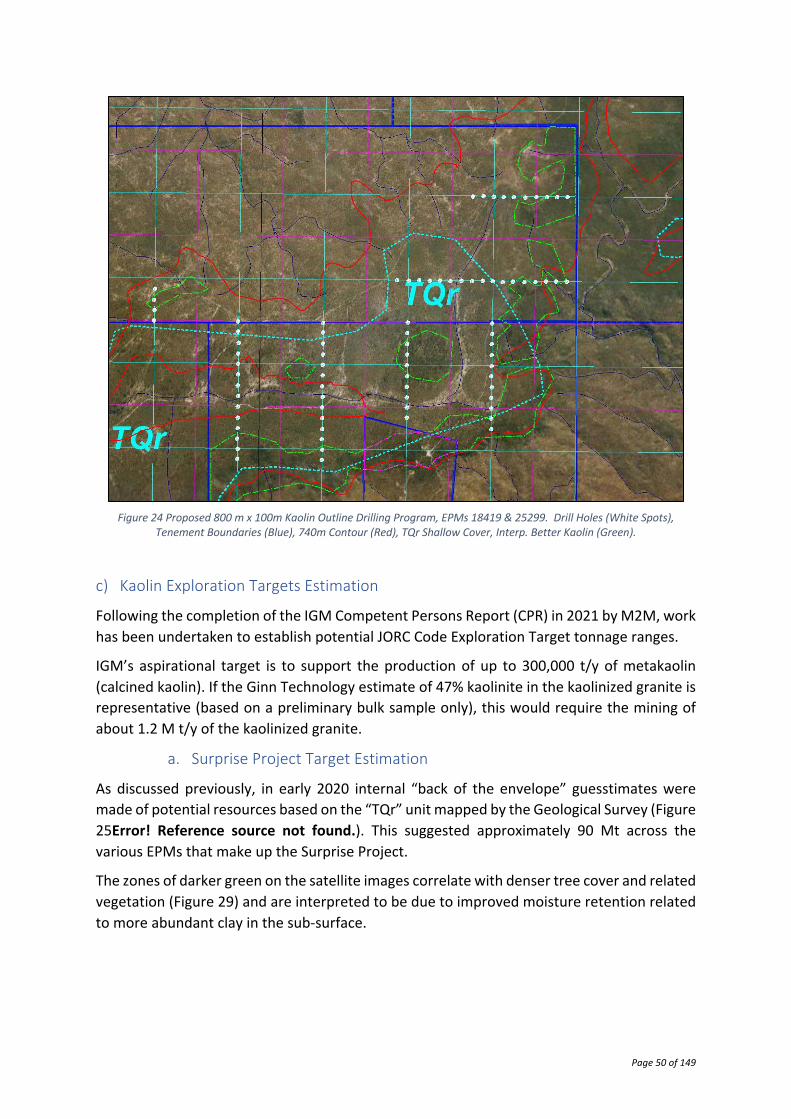
Page 50 of 149
Figure 24 Proposed 800 m x 100m Kaolin Outline Drilling Program, EPMs 18419 & 25299. Drill Holes (White Spots),
Tenement Boundaries (Blue), 740m Contour (Red), TQr Shallow Cover, Interp. Better Kaolin (Green).
c) Kaolin Exploration Targets Estimation
Following the completion of the IGM Competent Persons Report (CPR) in 2021 by M2M, work has been undertaken to establish potential JORC Code Exploration Target tonnage ranges.
IGM’s aspirational target is to support the production of up to 300,000 t/y of metakaolin (calcined kaolin). If the Ginn Technology estimate of 47% kaolinite in the kaolinized granite is representative (based on a preliminary bulk sample only), this would require the mining of about 1.2 M t/y of the kaolinized granite.
a. Surprise Project Target Estimation
As discussed previously, in early 2020 internal “back of the envelope” guesstimates were made of potential resources based on the “TQr” unit mapped by the Geological Survey (Figure 25Error! Reference source not found.). This suggested approximately 90 Mt across the various EPMs that make up the Surprise Project.
The zones of darker green on the satellite images correlate with denser tree cover and related vegetation (Figure 29) and are interpreted to be due to improved moisture retention related to more abundant clay in the sub-surface.
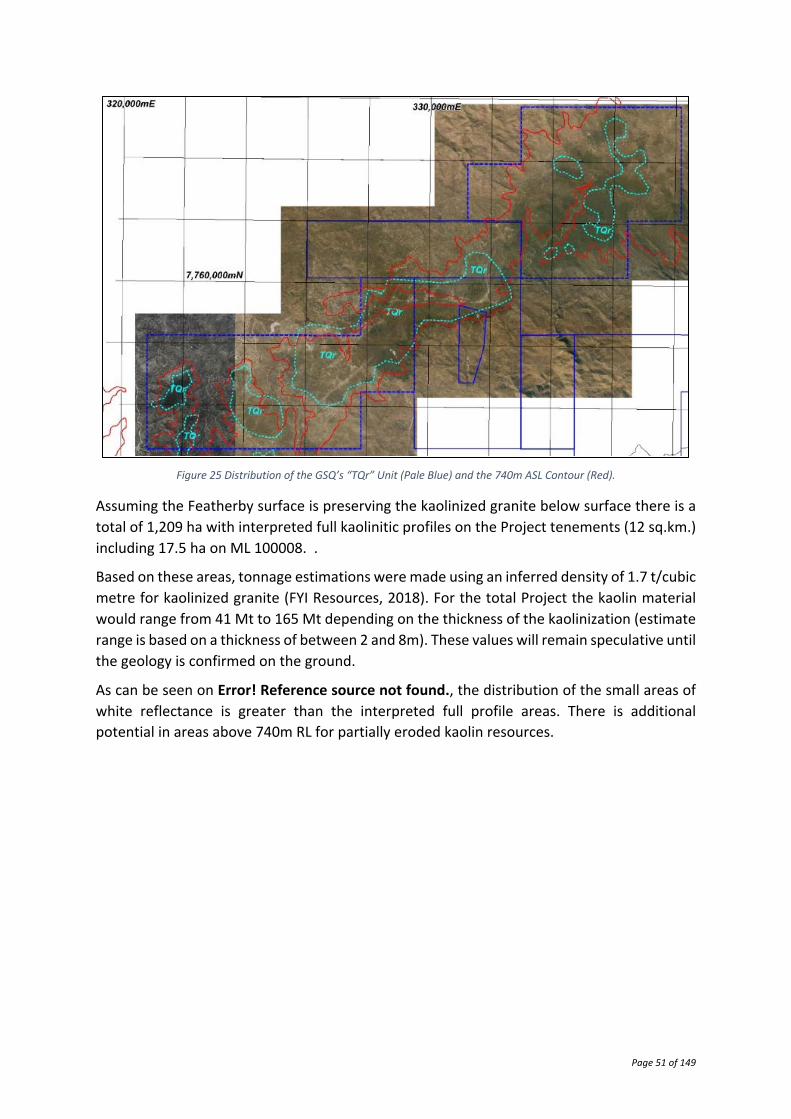
Page 51 of 149
Figure 25 Distribution of the GSQ’s “TQr” Unit (Pale Blue) and the 740m ASL Contour (Red).
Assuming the Featherby surface is preserving the kaolinized granite below surface there is a total of 1,209 ha with interpreted full kaolinitic profiles on the Project tenements (12 sq.km.) including 17.5 ha on ML 100008. .
Based on these areas, tonnage estimations were made using an inferred density of 1.7 t/cubic metre for kaolinized granite (FYI Resources, 2018). For the total Project the kaolin material would range from 41 Mt to 165 Mt depending on the thickness of the kaolinization (estimate range is based on a thickness of between 2 and 8m). These values will remain speculative until the geology is confirmed on the ground.
As can be seen on Error! Reference source not found., the distribution of the small areas of white reflectance is greater than the interpreted full profile areas. There is additional potential in areas above 740m RL for partially eroded kaolin resources.
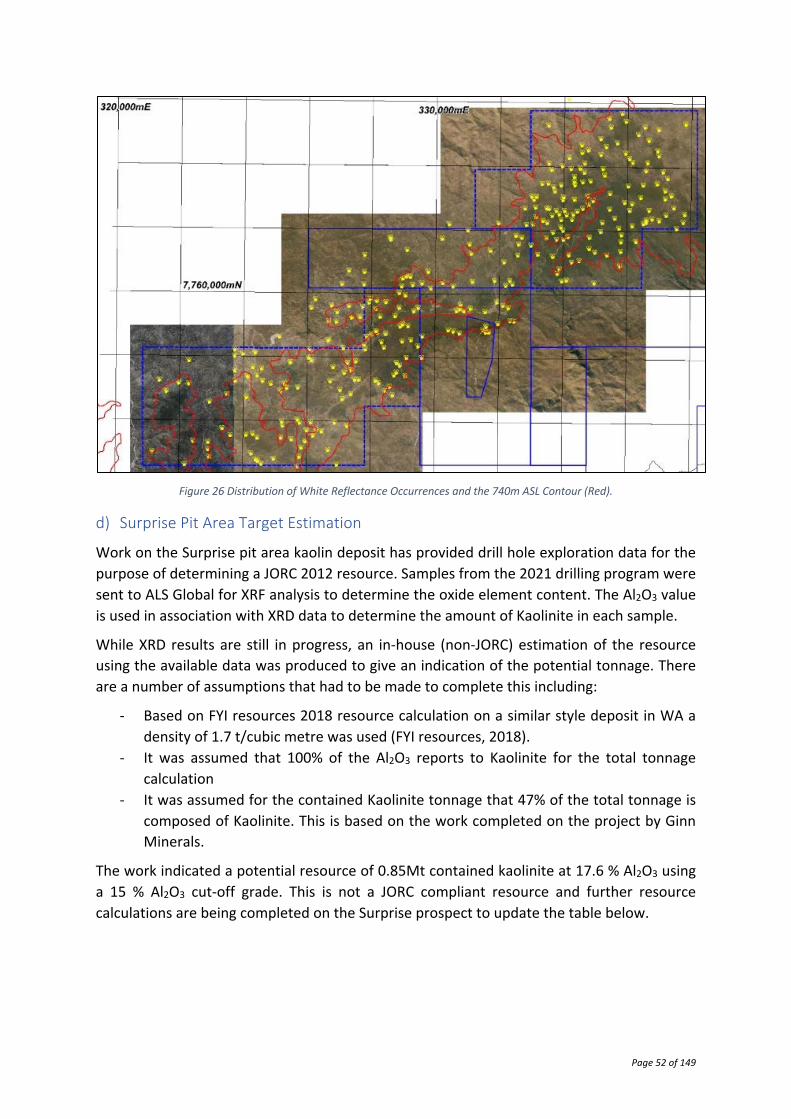
Page 52 of 149
Figure 26 Distribution of White Reflectance Occurrences and the 740m ASL Contour (Red).
d) Surprise Pit Area Target Estimation
Work on the Surprise pit area kaolin deposit has provided drill hole exploration data for the purpose of determining a JORC 2012 resource. Samples from the 2021 drilling program were sent to ALS Global for XRF analysis to determine the oxide element content. The Al2O3 value is used in association with XRD data to determine the amount of Kaolinite in each sample.
While XRD results are still in progress, an in-house (non-JORC) estimation of the resource using the available data was produced to give an indication of the potential tonnage. There are a number of assumptions that had to be made to complete this including:
- Based on FYI resources 2018 resource calculation on a similar style deposit in WA a density of 1.7 t/cubic metre was used (FYI resources, 2018).
- It was assumed that 100% of the Al2O3 reports to Kaolinite for the total tonnage calculation
- It was assumed for the contained Kaolinite tonnage that 47% of the total tonnage is composed of Kaolinite. This is based on the work completed on the project by Ginn Minerals.
The work indicated a potential resource of 0.85Mt contained kaolinite at 17.6 % Al2O3 using a 15 % Al2O3 cut-off grade. This is not a JORC compliant resource and further resource calculations are being completed on the Surprise prospect to update the table below.
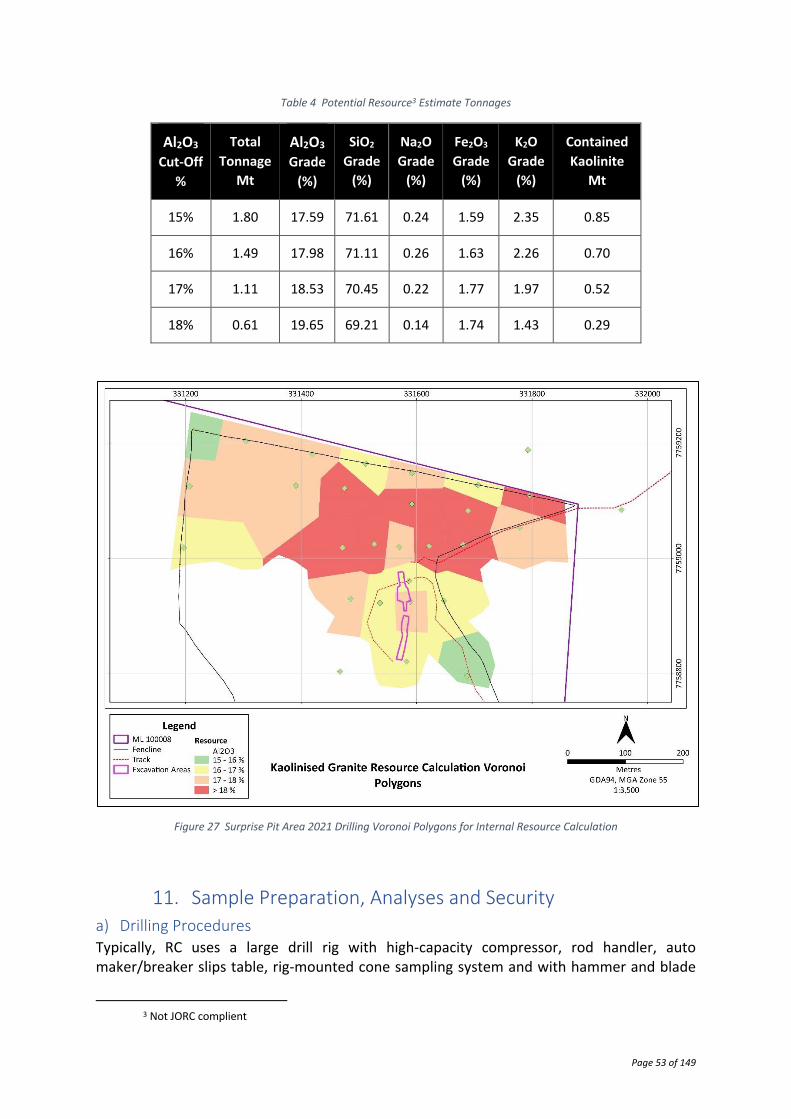
Page 53 of 149
Table 4 Potential Resource3 Estimate Tonnages
Al2O3 Cut-Off
%
Total Tonnage
Mt
Al2O3 Grade
(%)
SiO2 Grade
(%)
Na2O Grade
(%)
Fe2O3 Grade
(%)
K2O Grade
(%)
Contained Kaolinite
Mt
15% 1.80 17.59 71.61 0.24 1.59 2.35 0.85
16% 1.49 17.98 71.11 0.26 1.63 2.26 0.70
17% 1.11 18.53 70.45 0.22 1.77 1.97 0.52
18% 0.61 19.65 69.21 0.14 1.74 1.43 0.29
Figure 27 Surprise Pit Area 2021 Drilling Voronoi Polygons for Internal Resource Calculation
11. Sample Preparation, Analyses and Security a) Drilling Procedures
Typically, RC uses a large drill rig with high-capacity compressor, rod handler, auto maker/breaker slips table, rig-mounted cone sampling system and with hammer and blade
3 Not JORC complient
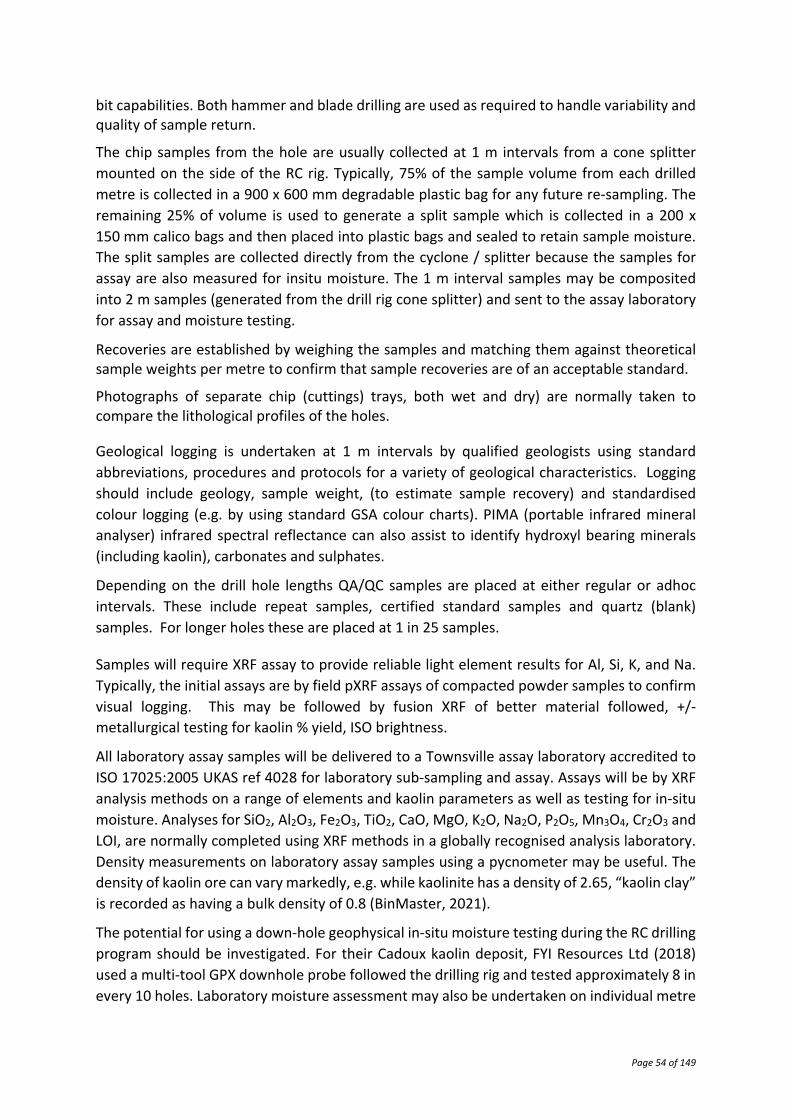
Page 54 of 149
bit capabilities. Both hammer and blade drilling are used as required to handle variability and quality of sample return.
The chip samples from the hole are usually collected at 1 m intervals from a cone splitter mounted on the side of the RC rig. Typically, 75% of the sample volume from each drilled metre is collected in a 900 x 600 mm degradable plastic bag for any future re-sampling. The remaining 25% of volume is used to generate a split sample which is collected in a 200 x 150 mm calico bags and then placed into plastic bags and sealed to retain sample moisture. The split samples are collected directly from the cyclone / splitter because the samples for assay are also measured for insitu moisture. The 1 m interval samples may be composited into 2 m samples (generated from the drill rig cone splitter) and sent to the assay laboratory for assay and moisture testing.
Recoveries are established by weighing the samples and matching them against theoretical sample weights per metre to confirm that sample recoveries are of an acceptable standard.
Photographs of separate chip (cuttings) trays, both wet and dry) are normally taken to compare the lithological profiles of the holes.
Geological logging is undertaken at 1 m intervals by qualified geologists using standard abbreviations, procedures and protocols for a variety of geological characteristics. Logging should include geology, sample weight, (to estimate sample recovery) and standardised colour logging (e.g. by using standard GSA colour charts). PIMA (portable infrared mineral analyser) infrared spectral reflectance can also assist to identify hydroxyl bearing minerals (including kaolin), carbonates and sulphates.
Depending on the drill hole lengths QA/QC samples are placed at either regular or adhoc intervals. These include repeat samples, certified standard samples and quartz (blank) samples. For longer holes these are placed at 1 in 25 samples.
Samples will require XRF assay to provide reliable light element results for Al, Si, K, and Na. Typically, the initial assays are by field pXRF assays of compacted powder samples to confirm visual logging. This may be followed by fusion XRF of better material followed, +/- metallurgical testing for kaolin % yield, ISO brightness.
All laboratory assay samples will be delivered to a Townsville assay laboratory accredited to ISO 17025:2005 UKAS ref 4028 for laboratory sub-sampling and assay. Assays will be by XRF analysis methods on a range of elements and kaolin parameters as well as testing for in-situ moisture. Analyses for SiO2, Al2O3, Fe2O3, TiO2, CaO, MgO, K2O, Na2O, P2O5, Mn3O4, Cr2O3 and LOI, are normally completed using XRF methods in a globally recognised analysis laboratory. Density measurements on laboratory assay samples using a pycnometer may be useful. The density of kaolin ore can vary markedly, e.g. while kaolinite has a density of 2.65, “kaolin clay” is recorded as having a bulk density of 0.8 (BinMaster, 2021).
The potential for using a down-hole geophysical in-situ moisture testing during the RC drilling program should be investigated. For their Cadoux kaolin deposit, FYI Resources Ltd (2018) used a multi-tool GPX downhole probe followed the drilling rig and tested approximately 8 in every 10 holes. Laboratory moisture assessment may also be undertaken on individual metre
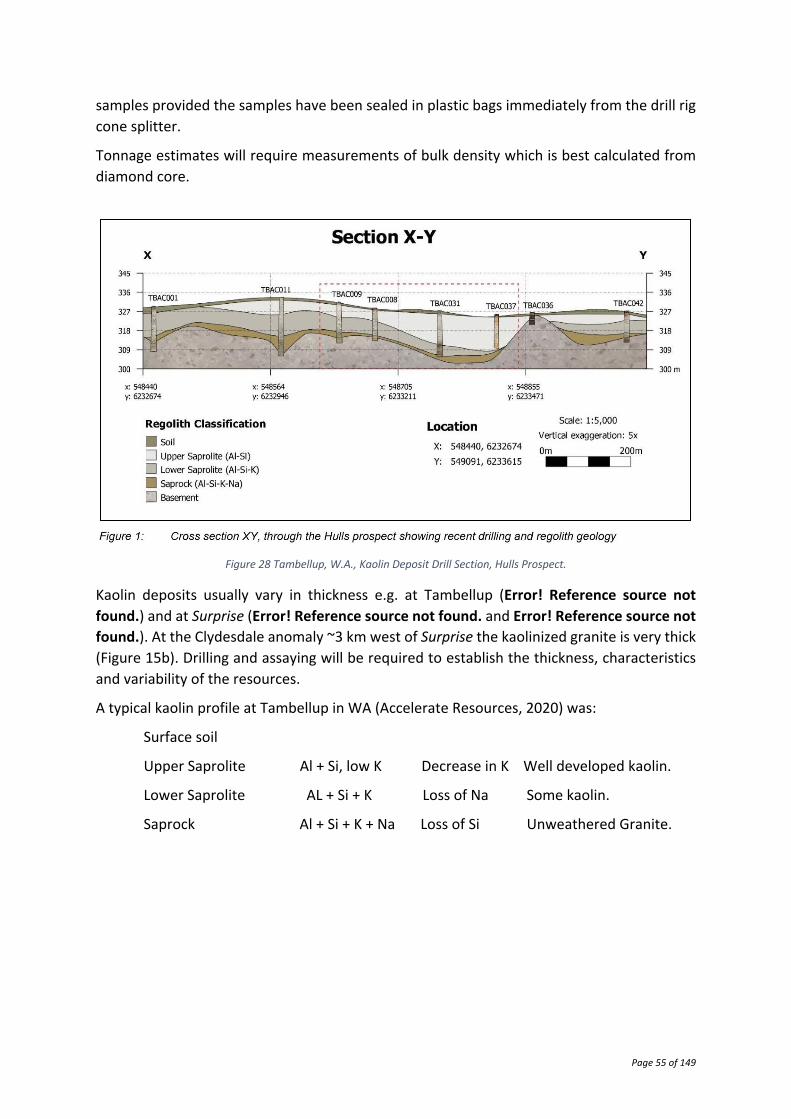
Page 55 of 149
samples provided the samples have been sealed in plastic bags immediately from the drill rig cone splitter.
Tonnage estimates will require measurements of bulk density which is best calculated from diamond core.
Figure 28 Tambellup, W.A., Kaolin Deposit Drill Section, Hulls Prospect.
Kaolin deposits usually vary in thickness e.g. at Tambellup (Error! Reference source not found.) and at Surprise (Error! Reference source not found. and Error! Reference source not found.). At the Clydesdale anomaly ~3 km west of Surprise the kaolinized granite is very thick (Figure 15b). Drilling and assaying will be required to establish the thickness, characteristics and variability of the resources.
A typical kaolin profile at Tambellup in WA (Accelerate Resources, 2020) was:
Surface soil
Upper Saprolite Al + Si, low K Decrease in K Well developed kaolin.
Lower Saprolite AL + Si + K Loss of Na Some kaolin.
Saprock Al + Si + K + Na Loss of Si Unweathered Granite.
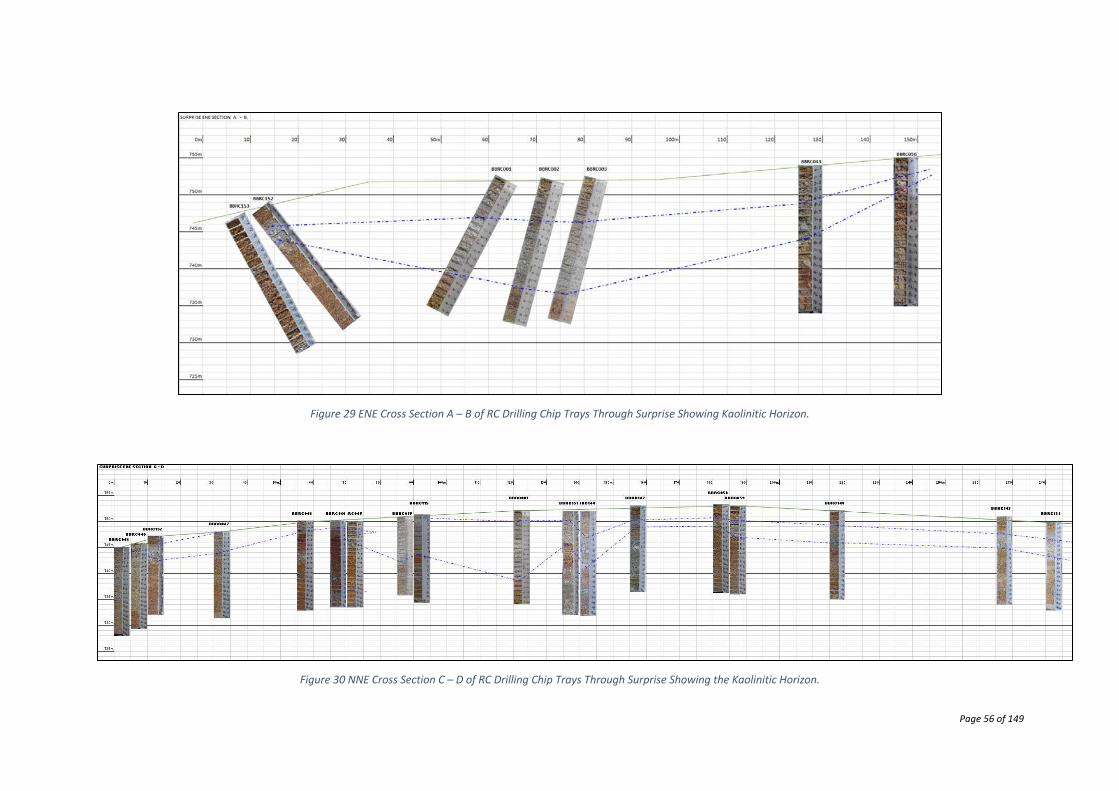
Page 56 of 149
Figure 29 ENE Cross Section A – B of RC Drilling Chip Trays Through Surprise Showing Kaolinitic Horizon.
Figure 30 NNE Cross Section C – D of RC Drilling Chip Trays Through Surprise Showing the Kaolinitic Horizon.
Page 57 of 149
12. Data Verification Due to the preliminary nature of this project, no formal data verification process has been undertaken apart from routine QA/QC checks by the assay laboratory.
As part of the JORC resource calculation, all of the inserted repeat samples, duplicates, blanks and standards QA/QC results will be checked to ensure that they are within tolerance of the original assay and without bias. If necessary, repeat assays requested will be requested from resampled bulk material.
All drill holes collars will be surveyed by differential GPS and checked by a licenced contract surveyor (+/-10cm accuracy), if necessary, for resource / reserve estimation. The down-hole orientation and inclination of the drill holes will also be surveyed using equipment supplied by the driller. The geological logs are normally reviewed by a senior geologist to confirm that high standards are maintained.
Database audits will be required to ensure the accuracy of data both in the field and in the digital material with data validation. Assay data will require checking against logs of the intercepts and the submission sheets.
13. Mineral Processing and Metallurgical Testing a) Pozzolanic Material Specifications and Testing
The definition of pozzolanic material varies widely. Under European specification for natural and calcined pozzolanic materials under EN 197-1 the sole definition is:
• The reactive silicon dioxide content shall be not less than 25%.
Under ASTM the definition is:
• A pozzolan is a siliceous and aluminous material which, in itself, possesses little or no cementitious value but which will, in finely divided form and in the presence of moisture, react chemically with calcium hydroxide at ordinary temperatures to form compounds possessing cementitious properties.
Other standards merely demand a simple strength test. If the reduction of mortar strength at 28 days of a 20% pozzolanic cement compared with ordinary Portland cement is not more than 20% then the addition is deemed to be pozzolanic.
As can be seen the definition of pozzolanic material is so flexible that a very wide range of materials can be defined as pozzolanic. Cement producers need far more rigorous testing before accepting a material as a suitable pozzolan.
The main tests required for evaluation of a pozzolan for use in the cement industry are:
• The Chapelle or Frattini test. Both are similar in conception and measure the reduction of Ca(OH)2 in a solution by combination with the active siliceous or aluminosilicates present in pozzolans. This is effectively replicating the reaction in mortars and concretes.
• The strength activity index (SAI) test. For this test a control Ordinary Portland cement is tested for compressive strength of mortar at 1, 3, 7 and 28 days using test method EN
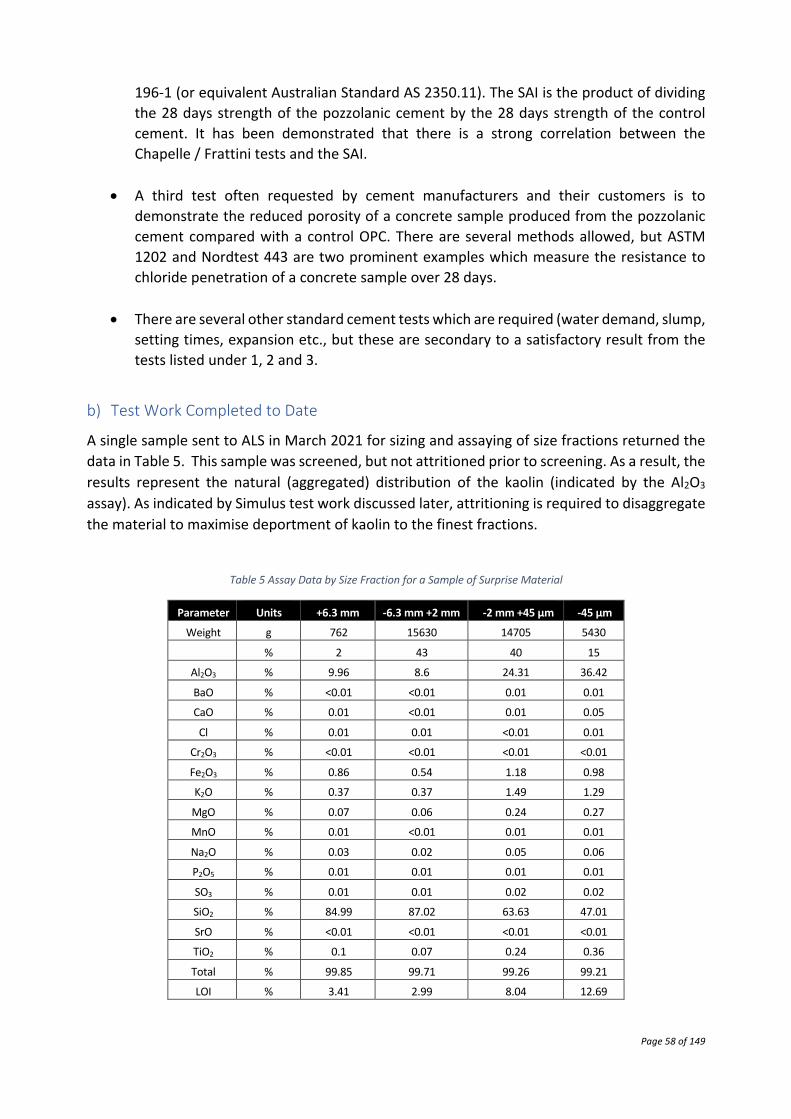
Page 58 of 149
196-1 (or equivalent Australian Standard AS 2350.11). The SAI is the product of dividing the 28 days strength of the pozzolanic cement by the 28 days strength of the control cement. It has been demonstrated that there is a strong correlation between the Chapelle / Frattini tests and the SAI.
• A third test often requested by cement manufacturers and their customers is to demonstrate the reduced porosity of a concrete sample produced from the pozzolanic cement compared with a control OPC. There are several methods allowed, but ASTM 1202 and Nordtest 443 are two prominent examples which measure the resistance to chloride penetration of a concrete sample over 28 days.
• There are several other standard cement tests which are required (water demand, slump, setting times, expansion etc., but these are secondary to a satisfactory result from the tests listed under 1, 2 and 3.
b) Test Work Completed to Date
A single sample sent to ALS in March 2021 for sizing and assaying of size fractions returned the data in Table 5. This sample was screened, but not attritioned prior to screening. As a result, the results represent the natural (aggregated) distribution of the kaolin (indicated by the Al2O3 assay). As indicated by Simulus test work discussed later, attritioning is required to disaggregate the material to maximise deportment of kaolin to the finest fractions.
Table 5 Assay Data by Size Fraction for a Sample of Surprise Material
Parameter Units +6.3 mm -6.3 mm +2 mm -2 mm +45 µm -45 µm Weight g 762 15630 14705 5430
% 2 43 40 15
Al2O3 % 9.96 8.6 24.31 36.42
BaO % <0.01 <0.01 0.01 0.01
CaO % 0.01 <0.01 0.01 0.05
Cl % 0.01 0.01 <0.01 0.01
Cr2O3 % <0.01 <0.01 <0.01 <0.01
Fe2O3 % 0.86 0.54 1.18 0.98
K2O % 0.37 0.37 1.49 1.29
MgO % 0.07 0.06 0.24 0.27
MnO % 0.01 <0.01 0.01 0.01
Na2O % 0.03 0.02 0.05 0.06
P2O5 % 0.01 0.01 0.01 0.01
SO3 % 0.01 0.01 0.02 0.02
SiO2 % 84.99 87.02 63.63 47.01
SrO % <0.01 <0.01 <0.01 <0.01
TiO2 % 0.1 0.07 0.24 0.36
Total % 99.85 99.71 99.26 99.21
LOI % 3.41 2.99 8.04 12.69
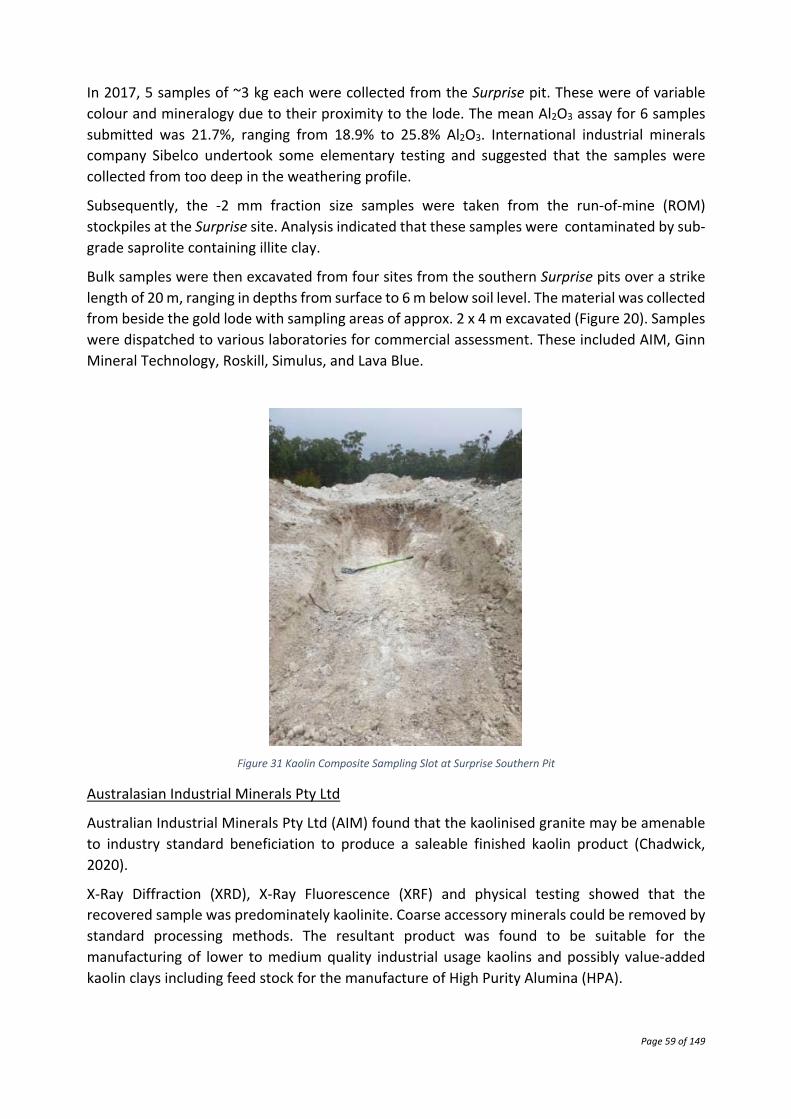
Page 59 of 149
In 2017, 5 samples of ~3 kg each were collected from the Surprise pit. These were of variable colour and mineralogy due to their proximity to the lode. The mean Al2O3 assay for 6 samples submitted was 21.7%, ranging from 18.9% to 25.8% Al2O3. International industrial minerals company Sibelco undertook some elementary testing and suggested that the samples were collected from too deep in the weathering profile.
Subsequently, the -2 mm fraction size samples were taken from the run-of-mine (ROM) stockpiles at the Surprise site. Analysis indicated that these samples were contaminated by sub-grade saprolite containing illite clay.
Bulk samples were then excavated from four sites from the southern Surprise pits over a strike length of 20 m, ranging in depths from surface to 6 m below soil level. The material was collected from beside the gold lode with sampling areas of approx. 2 x 4 m excavated (Figure 20). Samples were dispatched to various laboratories for commercial assessment. These included AIM, Ginn Mineral Technology, Roskill, Simulus, and Lava Blue.
Figure 31 Kaolin Composite Sampling Slot at Surprise Southern Pit
Australasian Industrial Minerals Pty Ltd
Australian Industrial Minerals Pty Ltd (AIM) found that the kaolinised granite may be amenable to industry standard beneficiation to produce a saleable finished kaolin product (Chadwick, 2020).
X-Ray Diffraction (XRD), X-Ray Fluorescence (XRF) and physical testing showed that the recovered sample was predominately kaolinite. Coarse accessory minerals could be removed by standard processing methods. The resultant product was found to be suitable for the manufacturing of lower to medium quality industrial usage kaolins and possibly value-added kaolin clays including feed stock for the manufacture of High Purity Alumina (HPA).
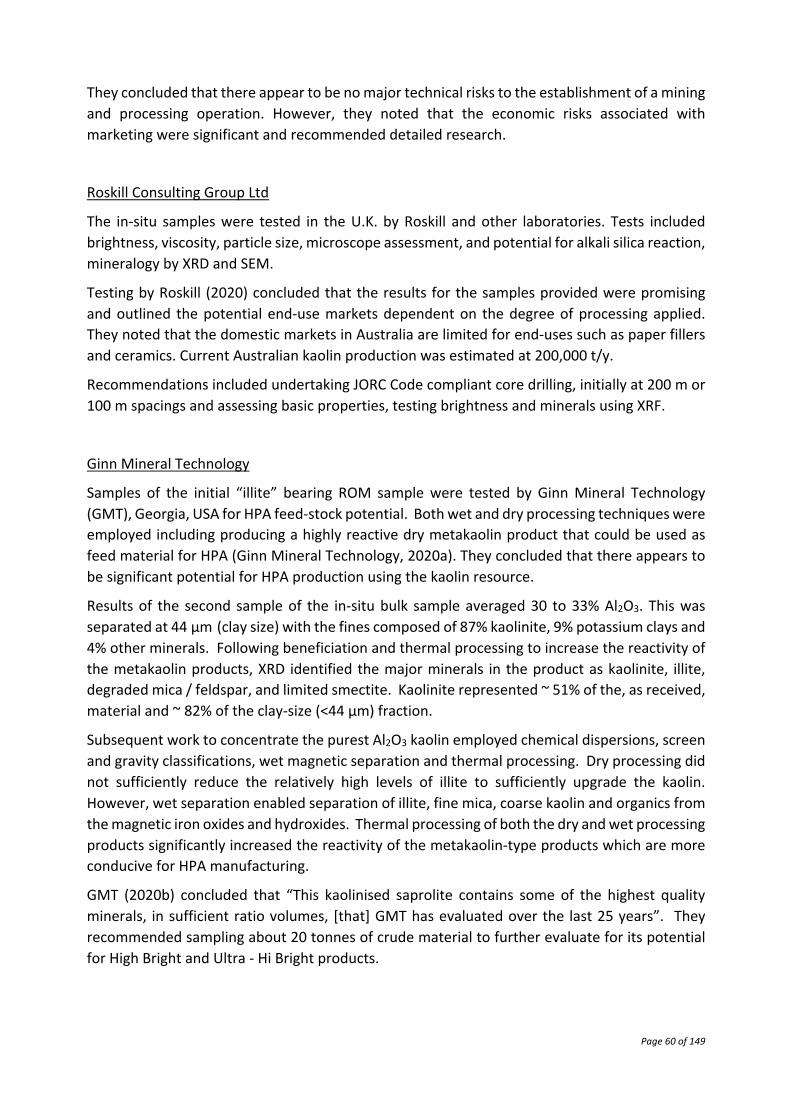
Page 60 of 149
They concluded that there appear to be no major technical risks to the establishment of a mining and processing operation. However, they noted that the economic risks associated with marketing were significant and recommended detailed research.
Roskill Consulting Group Ltd
The in-situ samples were tested in the U.K. by Roskill and other laboratories. Tests included brightness, viscosity, particle size, microscope assessment, and potential for alkali silica reaction, mineralogy by XRD and SEM.
Testing by Roskill (2020) concluded that the results for the samples provided were promising and outlined the potential end-use markets dependent on the degree of processing applied. They noted that the domestic markets in Australia are limited for end-uses such as paper fillers and ceramics. Current Australian kaolin production was estimated at 200,000 t/y.
Recommendations included undertaking JORC Code compliant core drilling, initially at 200 m or 100 m spacings and assessing basic properties, testing brightness and minerals using XRF.
Ginn Mineral Technology
Samples of the initial “illite” bearing ROM sample were tested by Ginn Mineral Technology (GMT), Georgia, USA for HPA feed-stock potential. Both wet and dry processing techniques were employed including producing a highly reactive dry metakaolin product that could be used as feed material for HPA (Ginn Mineral Technology, 2020a). They concluded that there appears to be significant potential for HPA production using the kaolin resource.
Results of the second sample of the in-situ bulk sample averaged 30 to 33% Al2O3. This was separated at 44 µm (clay size) with the fines composed of 87% kaolinite, 9% potassium clays and 4% other minerals. Following beneficiation and thermal processing to increase the reactivity of the metakaolin products, XRD identified the major minerals in the product as kaolinite, illite, degraded mica / feldspar, and limited smectite. Kaolinite represented ~ 51% of the, as received, material and ~ 82% of the clay-size (<44 µm) fraction.
Subsequent work to concentrate the purest Al2O3 kaolin employed chemical dispersions, screen and gravity classifications, wet magnetic separation and thermal processing. Dry processing did not sufficiently reduce the relatively high levels of illite to sufficiently upgrade the kaolin. However, wet separation enabled separation of illite, fine mica, coarse kaolin and organics from the magnetic iron oxides and hydroxides. Thermal processing of both the dry and wet processing products significantly increased the reactivity of the metakaolin-type products which are more conducive for HPA manufacturing.
GMT (2020b) concluded that “This kaolinised saprolite contains some of the highest quality minerals, in sufficient ratio volumes, [that] GMT has evaluated over the last 25 years”. They recommended sampling about 20 tonnes of crude material to further evaluate for its potential for High Bright and Ultra - Hi Bright products.
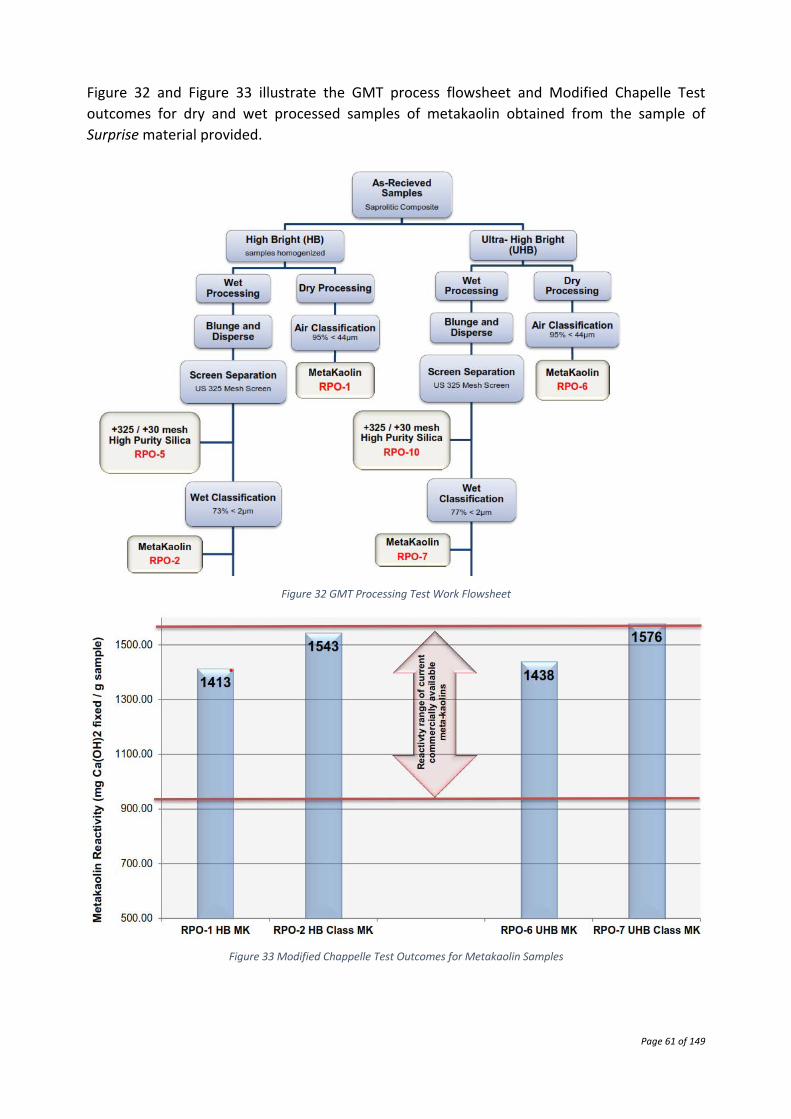
Page 61 of 149
Figure 32 and Figure 33 illustrate the GMT process flowsheet and Modified Chapelle Test outcomes for dry and wet processed samples of metakaolin obtained from the sample of Surprise material provided.
Figure 32 GMT Processing Test Work Flowsheet
Figure 33 Modified Chappelle Test Outcomes for Metakaolin Samples
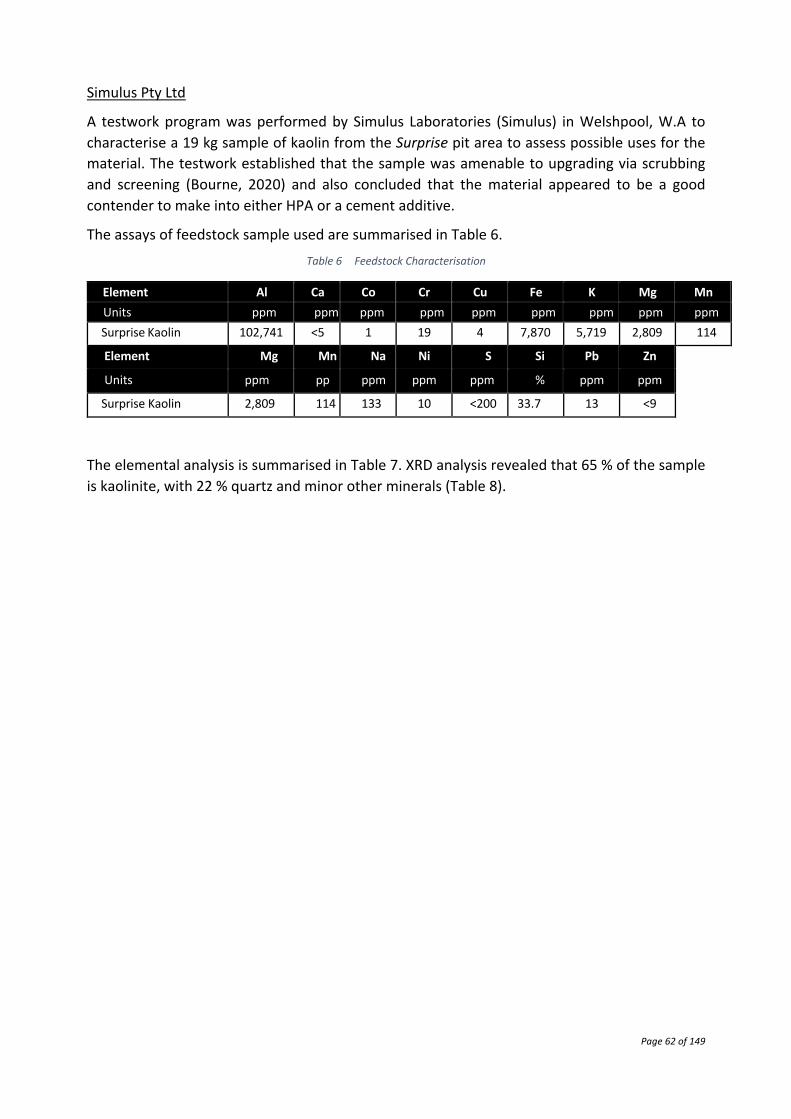
Page 62 of 149
Simulus Pty Ltd
A testwork program was performed by Simulus Laboratories (Simulus) in Welshpool, W.A to characterise a 19 kg sample of kaolin from the Surprise pit area to assess possible uses for the material. The testwork established that the sample was amenable to upgrading via scrubbing and screening (Bourne, 2020) and also concluded that the material appeared to be a good contender to make into either HPA or a cement additive.
The assays of feedstock sample used are summarised in Table 6.
Table 6 Feedstock Characterisation
Element Al Ca Co Cr Cu Fe K Mg Mn
Units ppm ppm ppm ppm ppm ppm ppm ppm ppm
Surprise Kaolin 102,741 <5 1 19 4 7,870 5,719 2,809 114
Element Mg Mn Na Ni S Si Pb Zn
Units ppm ppm
ppm ppm ppm % ppm ppm
Surprise Kaolin 2,809 114 133 10 <200 33.7 13 <9
The elemental analysis is summarised in Table 7. XRD analysis revealed that 65 % of the sample is kaolinite, with 22 % quartz and minor other minerals (Table 8).
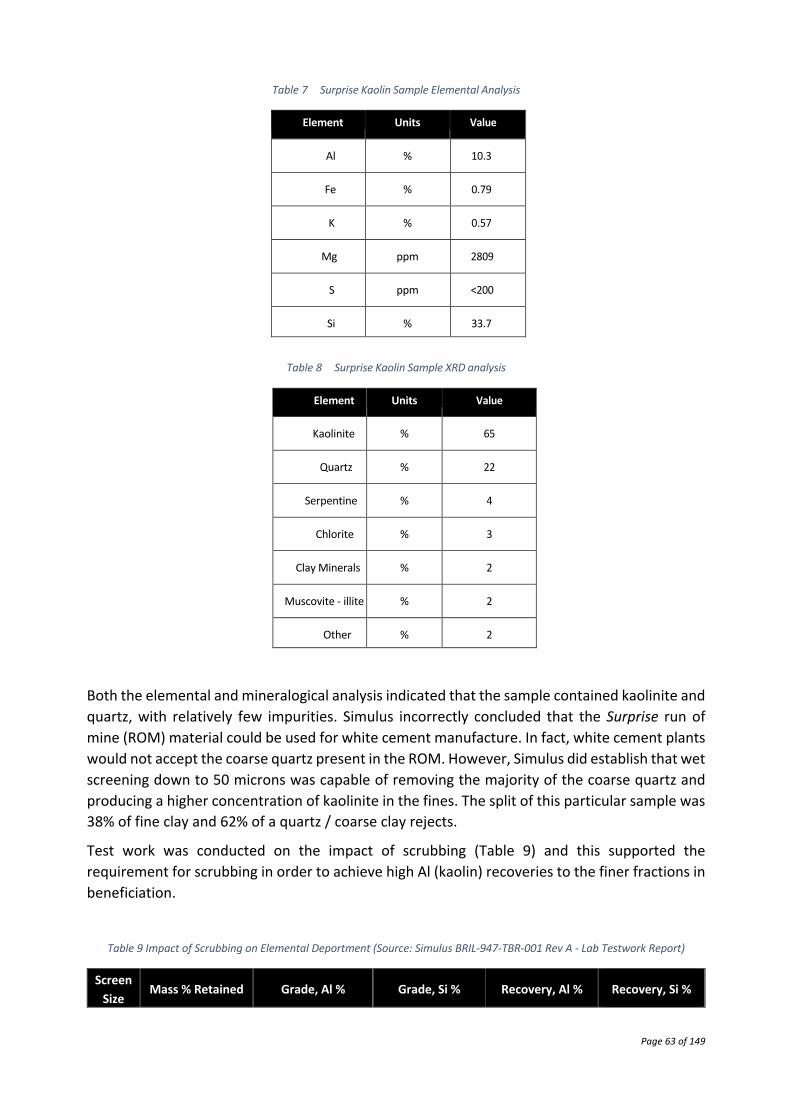
Page 63 of 149
Table 7 Surprise Kaolin Sample Elemental Analysis
Element Units Value
Al % 10.3
Fe % 0.79
K % 0.57
Mg ppm 2809
S ppm <200
Si % 33.7
Table 8 Surprise Kaolin Sample XRD analysis
Element Units Value
Kaolinite % 65
Quartz % 22
Serpentine % 4
Chlorite % 3
Clay Minerals % 2
Muscovite - illite % 2
Other % 2
Both the elemental and mineralogical analysis indicated that the sample contained kaolinite and quartz, with relatively few impurities. Simulus incorrectly concluded that the Surprise run of mine (ROM) material could be used for white cement manufacture. In fact, white cement plants would not accept the coarse quartz present in the ROM. However, Simulus did establish that wet screening down to 50 microns was capable of removing the majority of the coarse quartz and producing a higher concentration of kaolinite in the fines. The split of this particular sample was 38% of fine clay and 62% of a quartz / coarse clay rejects.
Test work was conducted on the impact of scrubbing (Table 9) and this supported the requirement for scrubbing in order to achieve high Al (kaolin) recoveries to the finer fractions in beneficiation.
Table 9 Impact of Scrubbing on Elemental Deportment (Source: Simulus BRIL-947-TBR-001 Rev A - Lab Testwork Report)
Screen Size
Mass % Retained Grade, Al % Grade, Si % Recovery, Al % Recovery, Si %
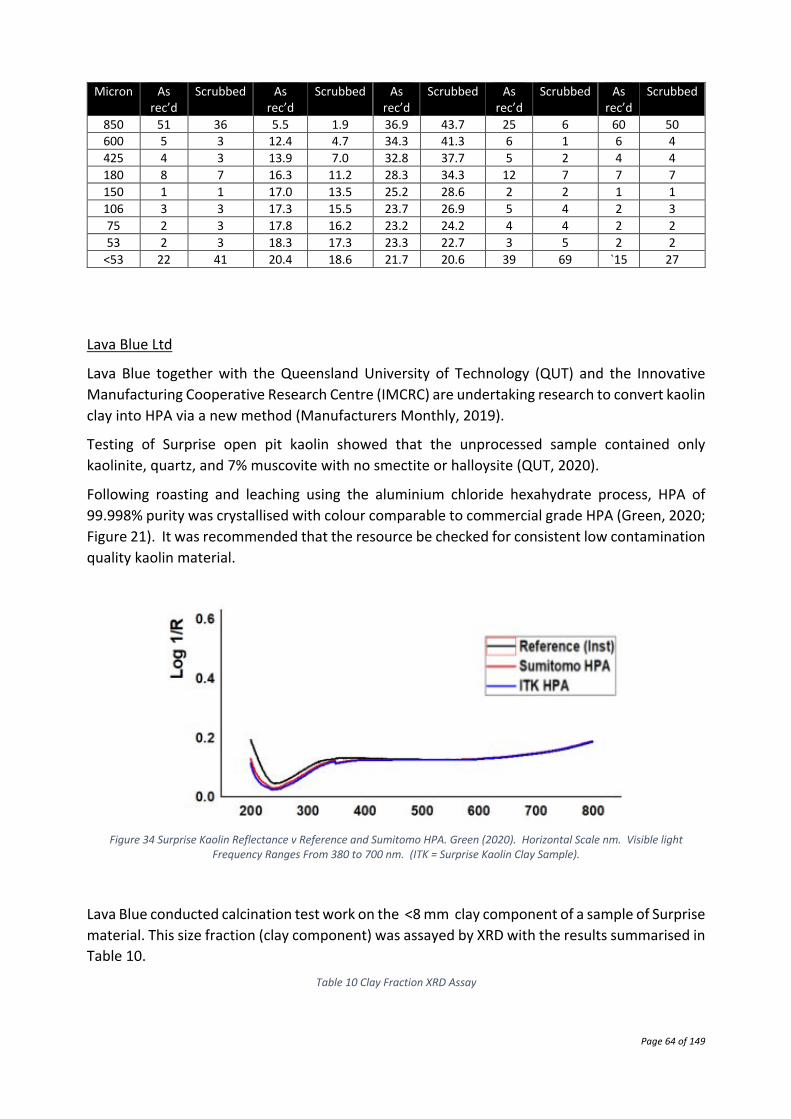
Page 64 of 149
Micron As rec’d
Scrubbed As rec’d
Scrubbed As rec’d
Scrubbed As rec’d
Scrubbed As rec’d
Scrubbed
850 51 36 5.5 1.9 36.9 43.7 25 6 60 50 600 5 3 12.4 4.7 34.3 41.3 6 1 6 4 425 4 3 13.9 7.0 32.8 37.7 5 2 4 4 180 8 7 16.3 11.2 28.3 34.3 12 7 7 7 150 1 1 17.0 13.5 25.2 28.6 2 2 1 1 106 3 3 17.3 15.5 23.7 26.9 5 4 2 3 75 2 3 17.8 16.2 23.2 24.2 4 4 2 2 53 2 3 18.3 17.3 23.3 22.7 3 5 2 2
<53 22 41 20.4 18.6 21.7 20.6 39 69 `15 27
Lava Blue Ltd
Lava Blue together with the Queensland University of Technology (QUT) and the Innovative Manufacturing Cooperative Research Centre (IMCRC) are undertaking research to convert kaolin clay into HPA via a new method (Manufacturers Monthly, 2019).
Testing of Surprise open pit kaolin showed that the unprocessed sample contained only kaolinite, quartz, and 7% muscovite with no smectite or halloysite (QUT, 2020).
Following roasting and leaching using the aluminium chloride hexahydrate process, HPA of 99.998% purity was crystallised with colour comparable to commercial grade HPA (Green, 2020; Figure 21). It was recommended that the resource be checked for consistent low contamination quality kaolin material.
Figure 34 Surprise Kaolin Reflectance v Reference and Sumitomo HPA. Green (2020). Horizontal Scale nm. Visible light
Frequency Ranges From 380 to 700 nm. (ITK = Surprise Kaolin Clay Sample).
Lava Blue conducted calcination test work on the <8 mm clay component of a sample of Surprise material. This size fraction (clay component) was assayed by XRD with the results summarised in Table 10.
Table 10 Clay Fraction XRD Assay
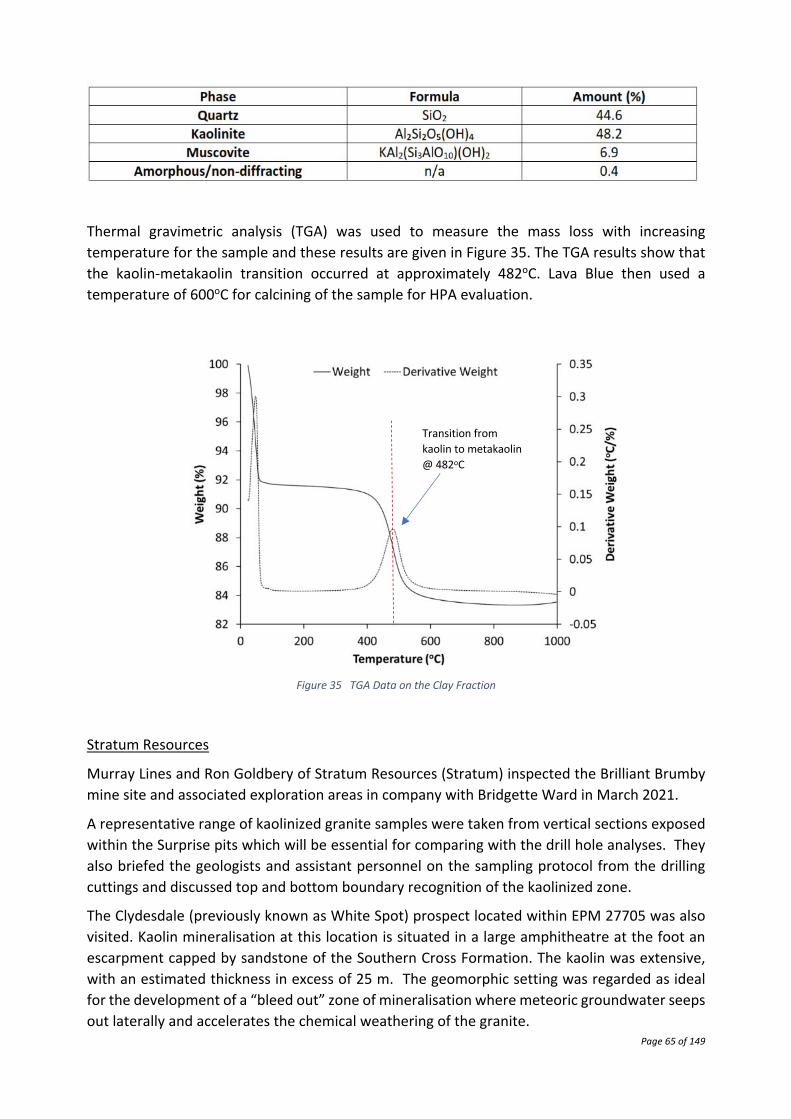
Page 65 of 149
Thermal gravimetric analysis (TGA) was used to measure the mass loss with increasing temperature for the sample and these results are given in Figure 35. The TGA results show that the kaolin-metakaolin transition occurred at approximately 482oC. Lava Blue then used a temperature of 600oC for calcining of the sample for HPA evaluation.
Figure 35 TGA Data on the Clay Fraction
Stratum Resources
Murray Lines and Ron Goldbery of Stratum Resources (Stratum) inspected the Brilliant Brumby mine site and associated exploration areas in company with Bridgette Ward in March 2021.
A representative range of kaolinized granite samples were taken from vertical sections exposed within the Surprise pits which will be essential for comparing with the drill hole analyses. They also briefed the geologists and assistant personnel on the sampling protocol from the drilling cuttings and discussed top and bottom boundary recognition of the kaolinized zone.
The Clydesdale (previously known as White Spot) prospect located within EPM 27705 was also visited. Kaolin mineralisation at this location is situated in a large amphitheatre at the foot an escarpment capped by sandstone of the Southern Cross Formation. The kaolin was extensive, with an estimated thickness in excess of 25 m. The geomorphic setting was regarded as ideal for the development of a “bleed out” zone of mineralisation where meteoric groundwater seeps out laterally and accelerates the chemical weathering of the granite.
Transition from
kaolin to metakaolin
@ 482oC
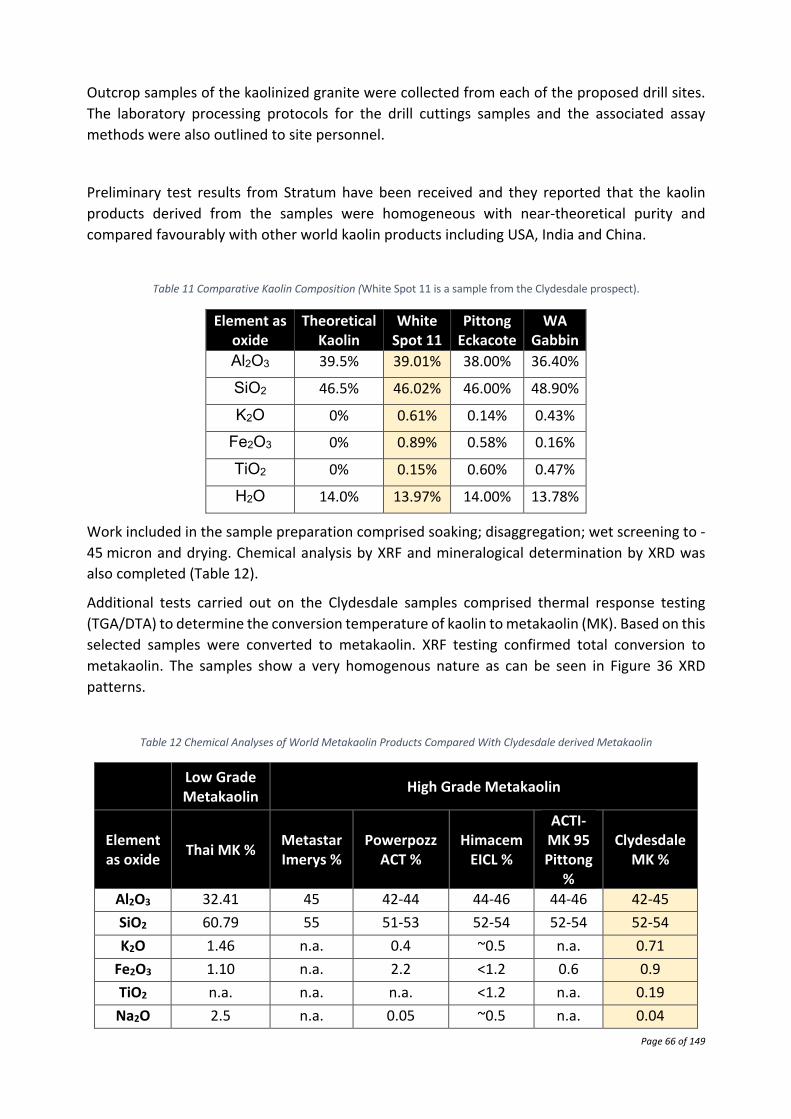
Page 66 of 149
Outcrop samples of the kaolinized granite were collected from each of the proposed drill sites. The laboratory processing protocols for the drill cuttings samples and the associated assay methods were also outlined to site personnel.
Preliminary test results from Stratum have been received and they reported that the kaolin products derived from the samples were homogeneous with near-theoretical purity and compared favourably with other world kaolin products including USA, India and China.
Table 11 Comparative Kaolin Composition (White Spot 11 is a sample from the Clydesdale prospect).
Element as oxide
Theoretical Kaolin
White Spot 11
Pittong Eckacote
WA Gabbin
Al2O3 39.5% 39.01% 38.00% 36.40%
SiO2 46.5% 46.02% 46.00% 48.90%
K2O 0% 0.61% 0.14% 0.43%
Fe2O3 0% 0.89% 0.58% 0.16%
TiO2 0% 0.15% 0.60% 0.47%
H2O 14.0% 13.97% 14.00% 13.78%
Work included in the sample preparation comprised soaking; disaggregation; wet screening to -45 micron and drying. Chemical analysis by XRF and mineralogical determination by XRD was also completed (Table 12).
Additional tests carried out on the Clydesdale samples comprised thermal response testing (TGA/DTA) to determine the conversion temperature of kaolin to metakaolin (MK). Based on this selected samples were converted to metakaolin. XRF testing confirmed total conversion to metakaolin. The samples show a very homogenous nature as can be seen in Figure 36 XRD patterns.
Table 12 Chemical Analyses of World Metakaolin Products Compared With Clydesdale derived Metakaolin
Low Grade Metakaolin High Grade Metakaolin
Element as oxide Thai MK % Metastar
Imerys % Powerpozz
ACT % Himacem
EICL %
ACTI-MK 95 Pittong
%
Clydesdale MK %
Al2O3 32.41 45 42-44 44-46 44-46 42-45
SiO2 60.79 55 51-53 52-54 52-54 52-54
K2O 1.46 n.a. 0.4 ~0.5 n.a. 0.71
Fe2O3 1.10 n.a. 2.2 <1.2 0.6 0.9
TiO2 n.a. n.a. n.a. <1.2 n.a. 0.19
Na2O 2.5 n.a. 0.05 ~0.5 n.a. 0.04
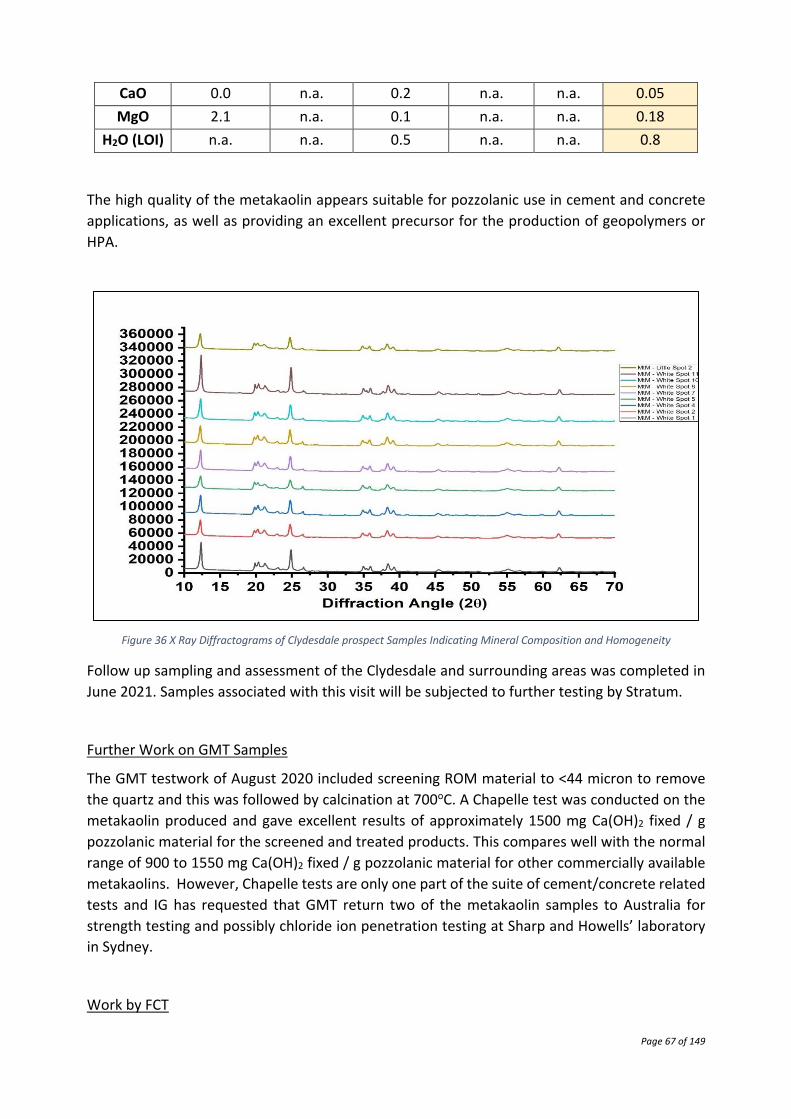
Page 67 of 149
CaO 0.0 n.a. 0.2 n.a. n.a. 0.05
MgO 2.1 n.a. 0.1 n.a. n.a. 0.18
H2O (LOI) n.a. n.a. 0.5 n.a. n.a. 0.8
The high quality of the metakaolin appears suitable for pozzolanic use in cement and concrete applications, as well as providing an excellent precursor for the production of geopolymers or HPA.
Figure 36 X Ray Diffractograms of Clydesdale prospect Samples Indicating Mineral Composition and Homogeneity
Follow up sampling and assessment of the Clydesdale and surrounding areas was completed in June 2021. Samples associated with this visit will be subjected to further testing by Stratum.
Further Work on GMT Samples
The GMT testwork of August 2020 included screening ROM material to <44 micron to remove the quartz and this was followed by calcination at 700oC. A Chapelle test was conducted on the metakaolin produced and gave excellent results of approximately 1500 mg Ca(OH)2 fixed / g pozzolanic material for the screened and treated products. This compares well with the normal range of 900 to 1550 mg Ca(OH)2 fixed / g pozzolanic material for other commercially available metakaolins. However, Chapelle tests are only one part of the suite of cement/concrete related tests and IG has requested that GMT return two of the metakaolin samples to Australia for strength testing and possibly chloride ion penetration testing at Sharp and Howells’ laboratory in Sydney.
Work by FCT
Page 68 of 149
IG has contracted FCT Combustion of Melbourne to carry out the following Phase 1 programme:
• FCT Brazil received 2 x 30 kg samples of Surprise materials and will decide, from observation, if entirety of both samples needs drying.
• Initial dry screening at approx. 150 micron, with brushing if required and recording the % passing.
• If sufficient fine material is available then re-screen the fines at 50 micron. Record % passing.
• Determine LOI for both main samples on passing (fine) material only. • Carry out TGA on both samples on passing (fine) material only to determine calcination
temperature required. • Take passing (fine) materials and calcine this in a muffle furnace at different
temperatures. • Carry out Chapelle tests (NF P 18-513) on the materials at a number of temperatures. • Return calcined samples of > 500 mg Ca(OH)2 / g pozzolanic activity by Chapelle test to
IG.
Subsequent testing by IG will include:
• Strength activity index testing relative to 100% OPC and other SCMs including fly ash and slag.
• Other common cement tests (slump, water demand etc.) • If sufficient sample quantity remains, Nord Test 443 chloride ion penetration test.
The final results of the test program will include the following:
• A pozzolanic activity result to compare with other commercially available metakaolins. • A Strength Activity Index (SAI) which will confirm that the promising Chapelle results can
be translated into improved cement strength. • Comparative performance data relative to cement and other SCMs • A demonstration that the addition of the metakaolin will improve concrete durability in
aggressive environments such as saline. • Slump test and water demand test data.
Resource Characterisation
IGM is developing a standard method to prepare and test samples for resource characterisation. The method will likely include the following steps for each characterisation sample:
• Receive sample • Soak sample overnight in water • Remove supernatant water (careful not to remove fine kaolin) • Run material through an attritioner (nature of attritioner to be defined) • Screen at 45 micron, -250 micron, 2 mm
o Assay separate fine and coarse products o XRD or similar on fine fraction (- 45 micron)
• Conduct calcination under defined conditions
Page 69 of 149
• Make standard measurements that define value, to include o Chapelle test (pass if >1000 mg Ca(OH)2) o Strength Activity Index (SAI) at 1, 3, 7, 28 days with 25% calcined clay, 75% OPC
mixes • For selected samples the following additional tests will be conducted to obtain the full
quality output to quantify product value o Setting time (AS 2350:4) o Nordtest 443 for chloride penetration (durability).
If there is the expected strong relationship between Chapelle Test and SAI, the SAI will not be conducted.
14. Mineral Resource Estimates There is no JORC Code compliant Mineral Resource estimate at this time due to the early stage nature of this project.
Exploration targets are discussed in Section 11 of this report.
15. Mineral Reserve Estimates There is no JORC Code compliant Mineral Reserve estimate at this time due to the early stage nature of this project.
16. Mining Methods a) Preamble
As stated elsewhere in this Concept Study it is proposed to start mining within ML100008 for feed to a demonstration plant and then, as the market demand is proven, increase to a full production plant based on a larger resource.
For the demonstration plant, production of 10 000 t/y metakaolin will require the mining of approximately 25 000 t/y of ROM material.
For the full production plant, 300 000 t/y production of metakaolin will require the mining of about 0.72 Mt/y of ROM material.
b) Works Preparatory to Mining
There are many inter-related activities that need to be completed to allow mining to proceed. Referring to Section 20, the current mining lease ML100008 does not provide the approval for the mining of kaolin. This needs to be amended and, while this is technically a new mining lease, it is only expected to require 4-5 months for approval. To do this a new agreement with the landowner, Mount Stewart Station is required and this will involve the provision of a detailed mining plan based on geological data. At the same time the landowner’s approval will also be sought for the following:
• a water catchment dam • a Stockpiling and Transfer Station for material being transported to Townsville
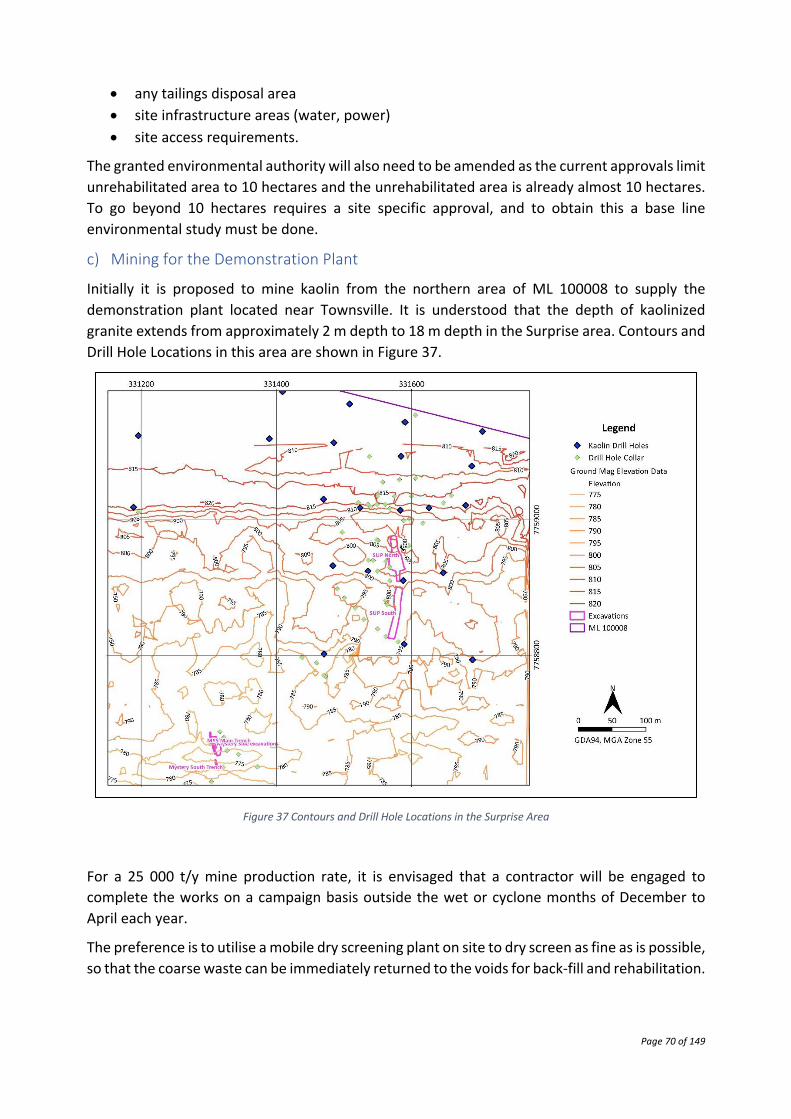
Page 70 of 149
• any tailings disposal area • site infrastructure areas (water, power) • site access requirements.
The granted environmental authority will also need to be amended as the current approvals limit unrehabilitated area to 10 hectares and the unrehabilitated area is already almost 10 hectares. To go beyond 10 hectares requires a site specific approval, and to obtain this a base line environmental study must be done.
c) Mining for the Demonstration Plant
Initially it is proposed to mine kaolin from the northern area of ML 100008 to supply the demonstration plant located near Townsville. It is understood that the depth of kaolinized granite extends from approximately 2 m depth to 18 m depth in the Surprise area. Contours and Drill Hole Locations in this area are shown in Figure 37.
Figure 37 Contours and Drill Hole Locations in the Surprise Area
For a 25 000 t/y mine production rate, it is envisaged that a contractor will be engaged to complete the works on a campaign basis outside the wet or cyclone months of December to April each year.
The preference is to utilise a mobile dry screening plant on site to dry screen as fine as is possible, so that the coarse waste can be immediately returned to the voids for back-fill and rehabilitation.
Page 71 of 149
Should any quartz veins be observed, the excavator would switch to a narrow bucket and selectively mine these out as far as possible. These quartz veins will be separately stockpiled for potential separate processing.
Mining operations will initially be completed in day light hours only to allow for grade control and the observation of quartz veins.
Once the agreements and approvals are obtained it is envisaged that the following activities will be undertaken:
1. Upgrade the 7 km steep road up the hill and change the final steep section to a lower gradient, estimated duration - 1 month and approximate cost - $200,000.
2. Road upgrade of the 20+ km of road across the Allandale Station to allow the access of road trucks.
3. Prepare an area of, say 250 m x 250 m, at the bottom of the hill as a Stockpile and Transfer Station. This station will potentially include additional dry processing, depending on the grade and particle size to be shipped to Townsville (see discussion on Recovery Methods).
4. Mining will commence as close as possible to the boundary of the kaolinized granite, to allow the progressive back filling and rehabilitation.
5. Remove and stockpile timber with a dozer. 6. Remove and stockpile topsoil and overburden, separately, with a dozer, loader or
excavator. 7. Excavate the kaolinized granite with a excavator (minimum 1.5 m3) to the depth limit of
the excavator (in the case of a cat 336DL this is 6 m) or to the granite floor. Excavation batters will be limited to a max. of 1:1, to allow for slumping in wet weather.
8. The kaolinized granite will be loaded into a 6WD truck such as a 40 t Moxy and transported to the mobile screening plant, and dumped .
9. A front end loader (FEL) will feed the screening plant and load the Moxy truck with the oversize for return to the mine void.
10. The FEL should also load the undersize into 2 x 40 t Moxy trucks for transport of the kaolinized granite down the hill to the Stockpile and Transfer Station. The hill is steep and only suitable all-terrain vehicles could accomplish this safely.
11. Road truck drivers will load themselves with the FEL located at the Stockpile and Transfer Station.
12. The road trucks will then transport the 12,500 t/y of kaolin containing material approximately 260 km to the processing and calcination plant in the Townsville area.
The minimum mining equipment needed for the above works is:
• Dozer (part time) • Excavator 40 t or larger • 3 x 40 t Moxy 6WD trucks • Water truck (part time) • 2 x FELs • Mobile screening plant with stockpile conveyor
Page 72 of 149
Based on an average depth of 5 m of kaolin and a bulk density of 1.7 t/m3, this means that there may be 85 000 tonnes per hectare. Currently around the Surprise pit there is about 10 hectares cleared.
d) Mining for the Bulk Processing Plant
The demonstration plant will allow the time for process improvement, marketing trials and the acceptance of the metakaolin product.
During this time the necessary exploration, and licensing can be completed.
The large-scale mining operation will then be designed, financed, and constructed.
17. Process Plant Requirements a) Overview
The processing of the Surprise material to produce metakaolin will be conducted in two parts:
• Processing to remove silica by attritioning, screening and hydrocyclone classification to produce kaolin with a nominal P80 of 45 microns.
• Calcining to convert kaolin to metakaolin and prepare product for shipment.
In addition, a high grade kaolin product will be produced by fine hydrocycloning, centrifuging, dewatering and drying.
Kaolin-containing material will be trucked from the mine site to Townsville for processing.
In order to manage project development risk and market establishment, the project will be scaled in two stages. The first stage (demonstration plant) will produce approximately 10,000 t/y of metakaolin. This will require a mining rate of about 25,000 t/y.
The second stage will produce 300,000 t/y of metakaolin and require a mining rate of 0.72 Mt/y (plus any pre-strip).
Broadly, the demonstration and second stage commercial plants are likely to have the same process flowsheet, but demonstration plant experience may result in improvements and process scale will facilitate greater levels of automation and improved quality control.
b) Quartz Rejection
Processing of kaolin ore can be by two different processes: wet or dry processing. Typically, wet processing is used to produce kaolin products for paper, specialty, and functional filler applications. Dry processing is commonly used for ceramic and fiberglass-grade products.
a. Wet processing
Wet processing uses de-gritting processes to remove the coarse silica-rich component. As required, de-gritting is preceded by attritioning if the kaolin is intergrown with silica or requires mild energy input for deagglomeration. This is expected to be the case for Surprise kaolin material.
Degritting is achieved by a series of classification processes including screens, hydroseparators, and/or hydrocyclones to remove coarse mineral particles (grit). Various types of centrifuges can be used to obtain desired final particle size, if required.
Page 73 of 149
Enhanced kaolin brightness, if required, may be achieved by high-intensity magnetic separation, selective flocculation, froth flotation, and/or reductive leaching. Initial testwork has not demonstrated a significant upgrade as the result of magnetic separation and these processes are not likely to be used for Surprise kaolin.
If wet processing is done at mine site then, prior to transport, the kaolin slurry needs to be dewatered sufficiently for safe handling and truck transport.
Wet processing has the disadvantages of:
• Requiring process water supply and water management systems, including tailings management
• Producing a wet kaolin product that is potentially difficult to dewater • Requiring drying of the kaolin product prior to calcining in Townsville.
The advantage of wet processing is the relative simplicity of the equipment and the lower energy consumption when compared with dry processing.
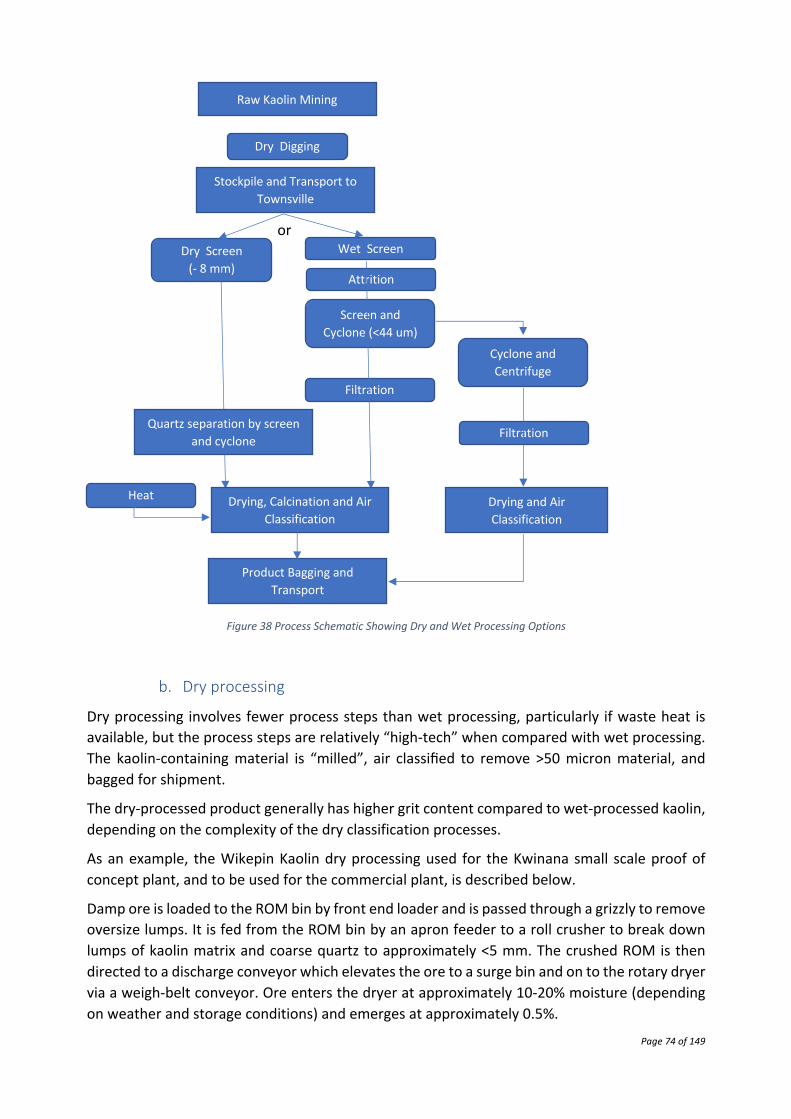
Page 74 of 149
Figure 38 Process Schematic Showing Dry and Wet Processing Options
b. Dry processing
Dry processing involves fewer process steps than wet processing, particularly if waste heat is available, but the process steps are relatively “high-tech” when compared with wet processing. The kaolin-containing material is “milled”, air classified to remove >50 micron material, and bagged for shipment.
The dry-processed product generally has higher grit content compared to wet-processed kaolin, depending on the complexity of the dry classification processes.
As an example, the Wikepin Kaolin dry processing used for the Kwinana small scale proof of concept plant, and to be used for the commercial plant, is described below.
Damp ore is loaded to the ROM bin by front end loader and is passed through a grizzly to remove oversize lumps. It is fed from the ROM bin by an apron feeder to a roll crusher to break down lumps of kaolin matrix and coarse quartz to approximately <5 mm. The crushed ROM is then directed to a discharge conveyor which elevates the ore to a surge bin and on to the rotary dryer via a weigh-belt conveyor. Ore enters the dryer at approximately 10-20% moisture (depending on weather and storage conditions) and emerges at approximately 0.5%.
Raw Kaolin Mining
Dry Digging
Dry Screen (- 8 mm)
Wet Screen
Attrition
Screen and Cyclone (<44 um)
Stockpile and Transport to Townsville
Filtration
Drying, Calcination and Air Classification
Quartz separation by screen and cyclone
or
Heat
Product Bagging and Transport
Cyclone and Centrifuge
Drying and Air Classification
Filtration
Page 75 of 149
The dry ore is then elevated and delivered to the air separation system. Waste from separation is the coarse fraction, which will be wet down in a ribbon style mixer for dust suppression then conveyed to coarse and fine waste bunkers and returned to back fill spent ore pits for land rehabilitation.
Finished product from separation is the fine fraction, which is collected in filter baghouses and transferred to product silos via conveyors and mixing equipment.
Silos will be allocated to different finished product specifications. Silo products are then elevated to bagging stations or transferred to the granulation station before bagging.
Finished products for export are trucked. Export packaging, therefore, can be bulk bags in containers, break bulk (loose bulk bags).
Dry processing has the disadvantages of requiring:
• A heat source, either waste heat or gas/fuel driven • Dust control in handling materials at the mine site and then at the Townsville site.
The advantage of dry processing is that “tailings” are dry and can be relatively easily handled as backfill.
c) Metakaolin Production
The first stage for processing of calcined clays is to ensure that the material to be calcined is capable of pozzolanic activation. For the Surprise material it is clear from previous tests (Ginn, Simulus etc.) that the kaolin can be concentrated to a satisfactory degree if the >50 micron material is removed.
If wet separation is used, wet fine kaolin slurry will be thickened and filtered prior to drying and introduction to the calciner.
The heat treatment of clays to produce cementitious materials is a technology which is relatively new, but has at least three competing technologies in the marketplace. The largest known unit produces approximately 400,000 t/y of calcined clay and was commissioned in 2019 in Colombia.
The current competing technologies employ either a rotary kiln (with or without preheater), or a flash calciner. Rotary kilns are illustrated in Figure 39 and Figure 40. Figure 41, Figure 42 and Figure 43 illustrate a flash calciner.
FLS has completed a +/- 30% estimate for the demonstration plant flash calciner and the full-scale plant. This work included a mass and heat balance, equipment list, scope outline and overall capital cost for the flash calciner equipment.
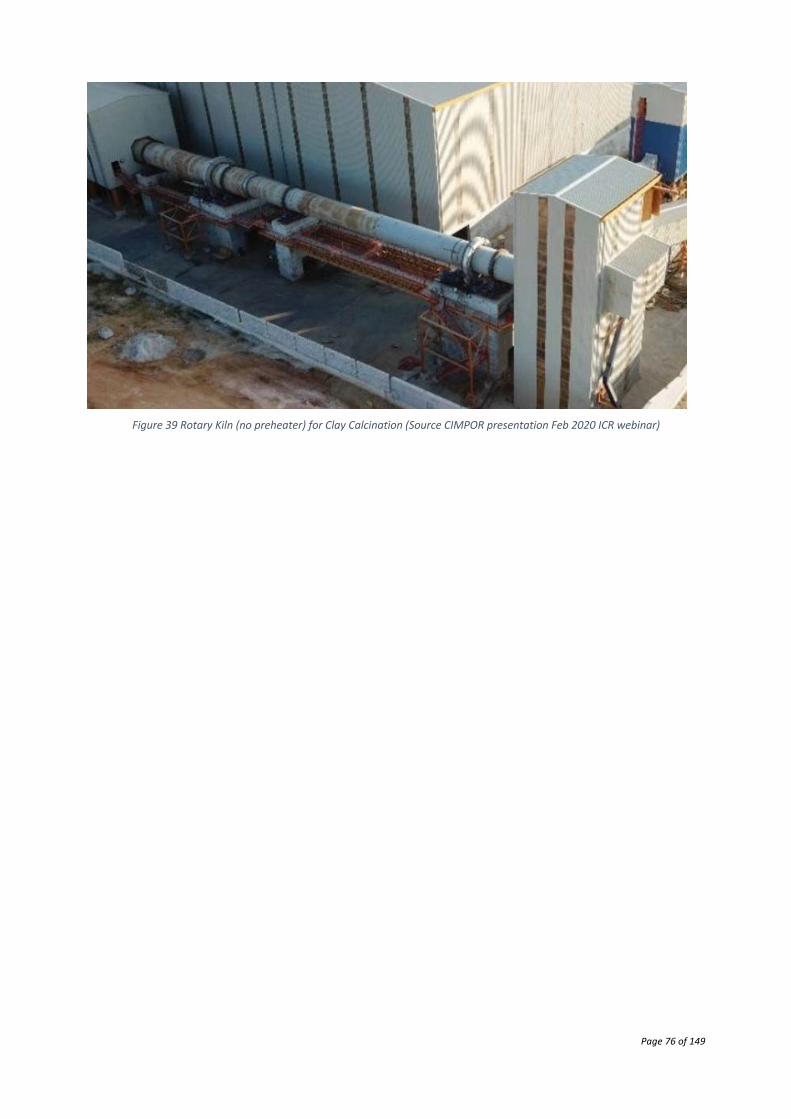
Page 76 of 149
Figure 39 Rotary Kiln (no preheater) for Clay Calcination (Source CIMPOR presentation Feb 2020 ICR webinar)
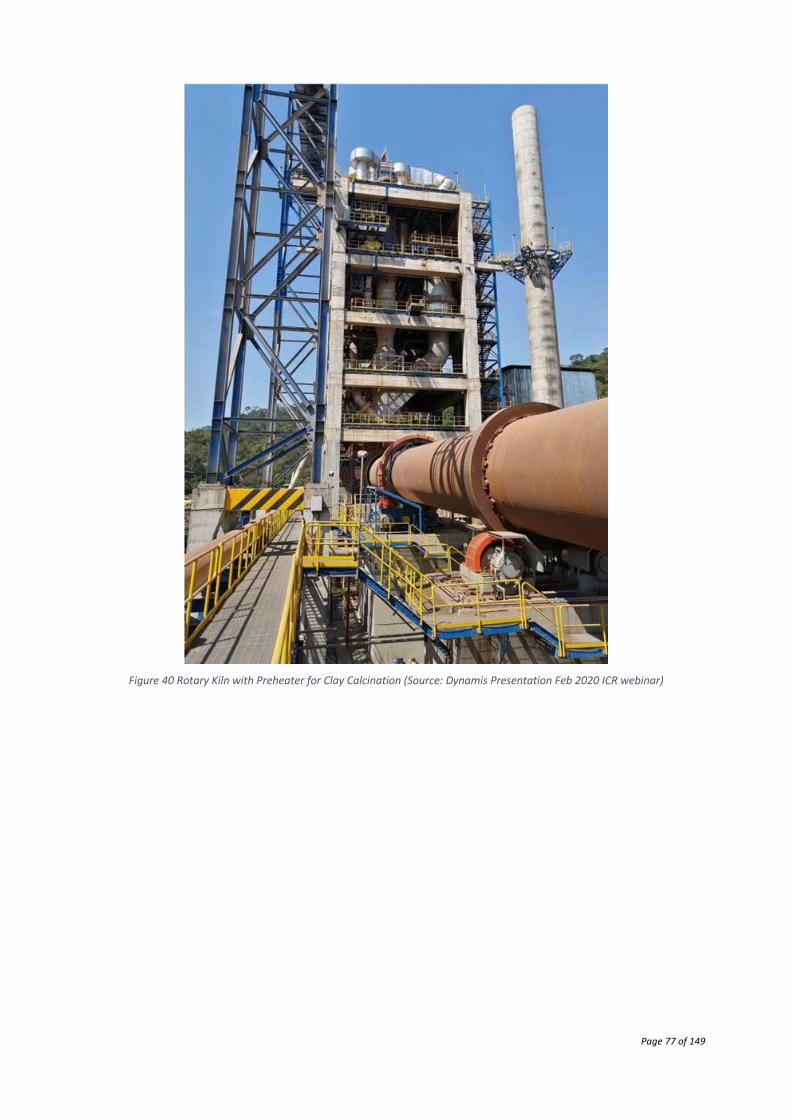
Page 77 of 149
Figure 40 Rotary Kiln with Preheater for Clay Calcination (Source: Dynamis Presentation Feb 2020 ICR webinar)
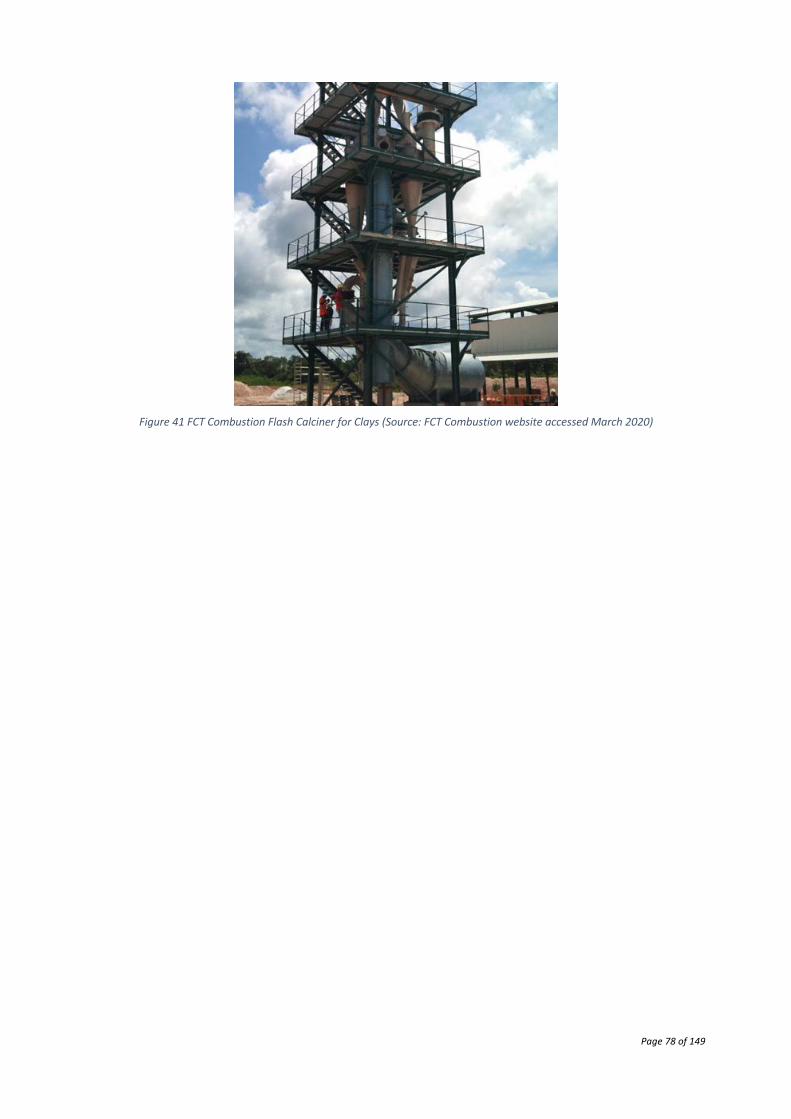
Page 78 of 149
Figure 41 FCT Combustion Flash Calciner for Clays (Source: FCT Combustion website accessed March 2020)
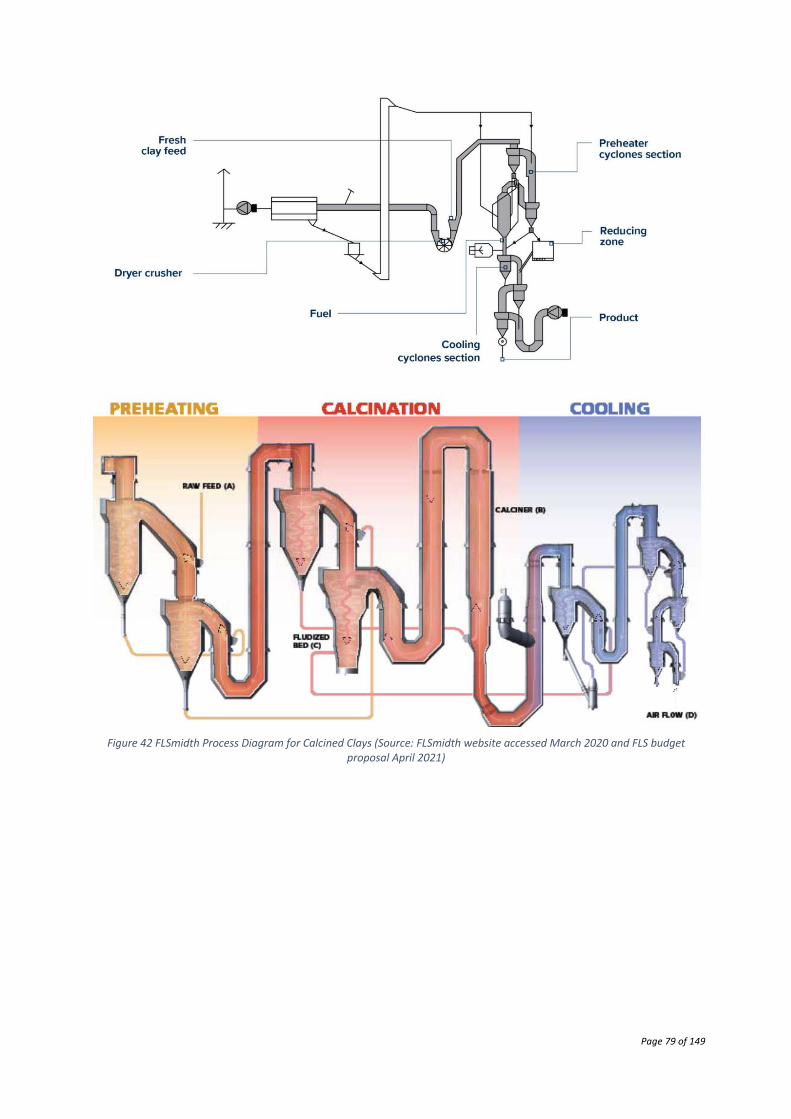
Page 79 of 149
Figure 42 FLSmidth Process Diagram for Calcined Clays (Source: FLSmidth website accessed March 2020 and FLS budget
proposal April 2021)
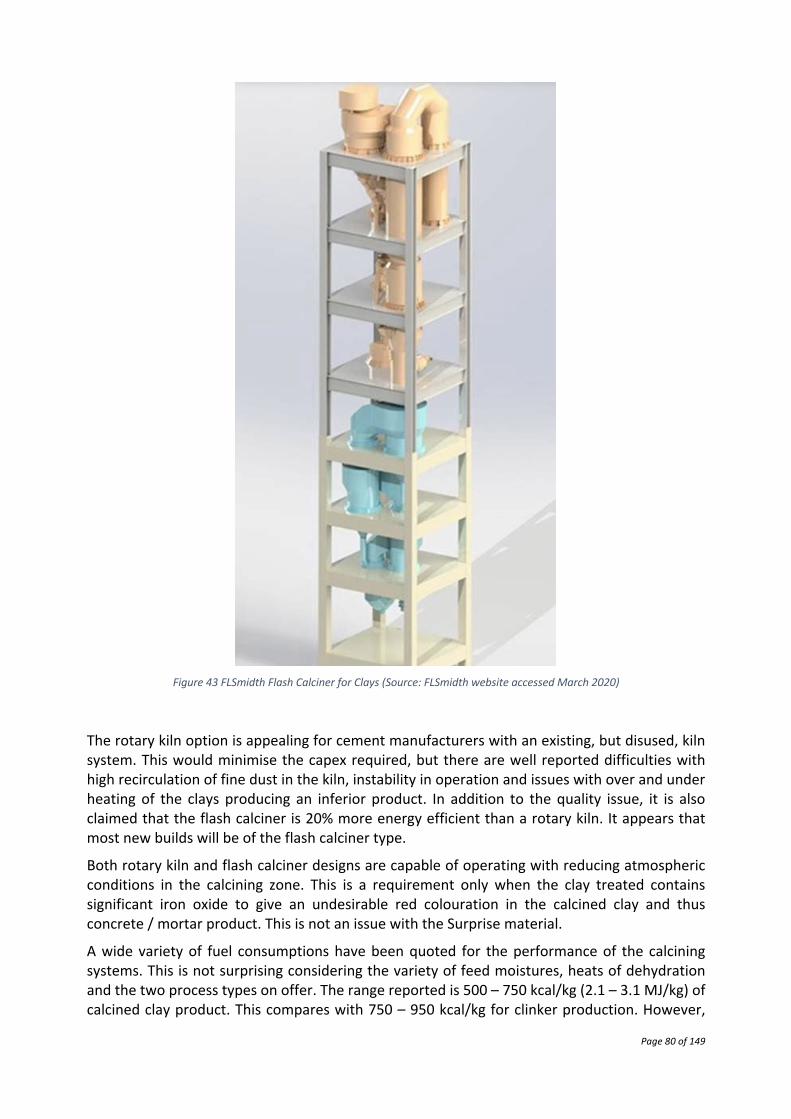
Page 80 of 149
Figure 43 FLSmidth Flash Calciner for Clays (Source: FLSmidth website accessed March 2020)
The rotary kiln option is appealing for cement manufacturers with an existing, but disused, kiln system. This would minimise the capex required, but there are well reported difficulties with high recirculation of fine dust in the kiln, instability in operation and issues with over and under heating of the clays producing an inferior product. In addition to the quality issue, it is also claimed that the flash calciner is 20% more energy efficient than a rotary kiln. It appears that most new builds will be of the flash calciner type.
Both rotary kiln and flash calciner designs are capable of operating with reducing atmospheric conditions in the calcining zone. This is a requirement only when the clay treated contains significant iron oxide to give an undesirable red colouration in the calcined clay and thus concrete / mortar product. This is not an issue with the Surprise material.
A wide variety of fuel consumptions have been quoted for the performance of the calcining systems. This is not surprising considering the variety of feed moistures, heats of dehydration and the two process types on offer. The range reported is 500 – 750 kcal/kg (2.1 – 3.1 MJ/kg) of calcined clay product. This compares with 750 – 950 kcal/kg for clinker production. However,
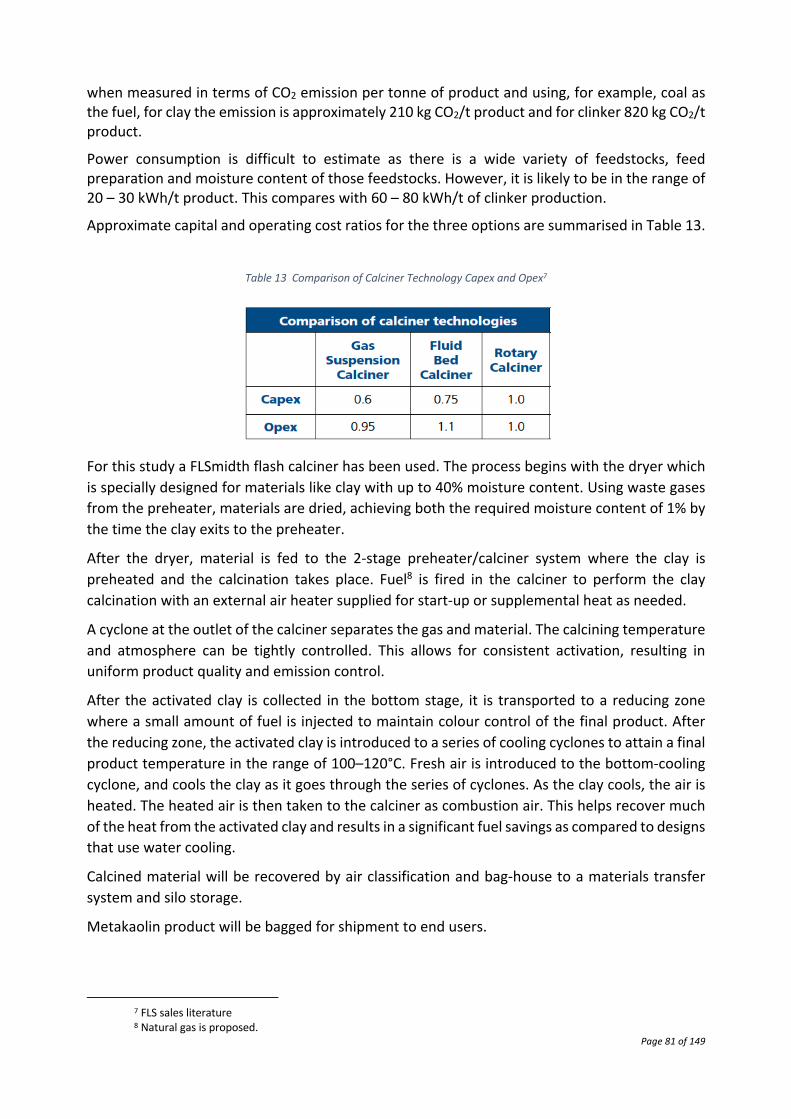
Page 81 of 149
when measured in terms of CO2 emission per tonne of product and using, for example, coal as the fuel, for clay the emission is approximately 210 kg CO2/t product and for clinker 820 kg CO2/t product.
Power consumption is difficult to estimate as there is a wide variety of feedstocks, feed preparation and moisture content of those feedstocks. However, it is likely to be in the range of 20 – 30 kWh/t product. This compares with 60 – 80 kWh/t of clinker production.
Approximate capital and operating cost ratios for the three options are summarised in Table 13.
Table 13 Comparison of Calciner Technology Capex and Opex7
For this study a FLSmidth flash calciner has been used. The process begins with the dryer which is specially designed for materials like clay with up to 40% moisture content. Using waste gases from the preheater, materials are dried, achieving both the required moisture content of 1% by the time the clay exits to the preheater.
After the dryer, material is fed to the 2-stage preheater/calciner system where the clay is preheated and the calcination takes place. Fuel8 is fired in the calciner to perform the clay calcination with an external air heater supplied for start-up or supplemental heat as needed.
A cyclone at the outlet of the calciner separates the gas and material. The calcining temperature and atmosphere can be tightly controlled. This allows for consistent activation, resulting in uniform product quality and emission control.
After the activated clay is collected in the bottom stage, it is transported to a reducing zone where a small amount of fuel is injected to maintain colour control of the final product. After the reducing zone, the activated clay is introduced to a series of cooling cyclones to attain a final product temperature in the range of 100–120°C. Fresh air is introduced to the bottom-cooling cyclone, and cools the clay as it goes through the series of cyclones. As the clay cools, the air is heated. The heated air is then taken to the calciner as combustion air. This helps recover much of the heat from the activated clay and results in a significant fuel savings as compared to designs that use water cooling.
Calcined material will be recovered by air classification and bag-house to a materials transfer system and silo storage.
Metakaolin product will be bagged for shipment to end users.
7 FLS sales literature 8 Natural gas is proposed.
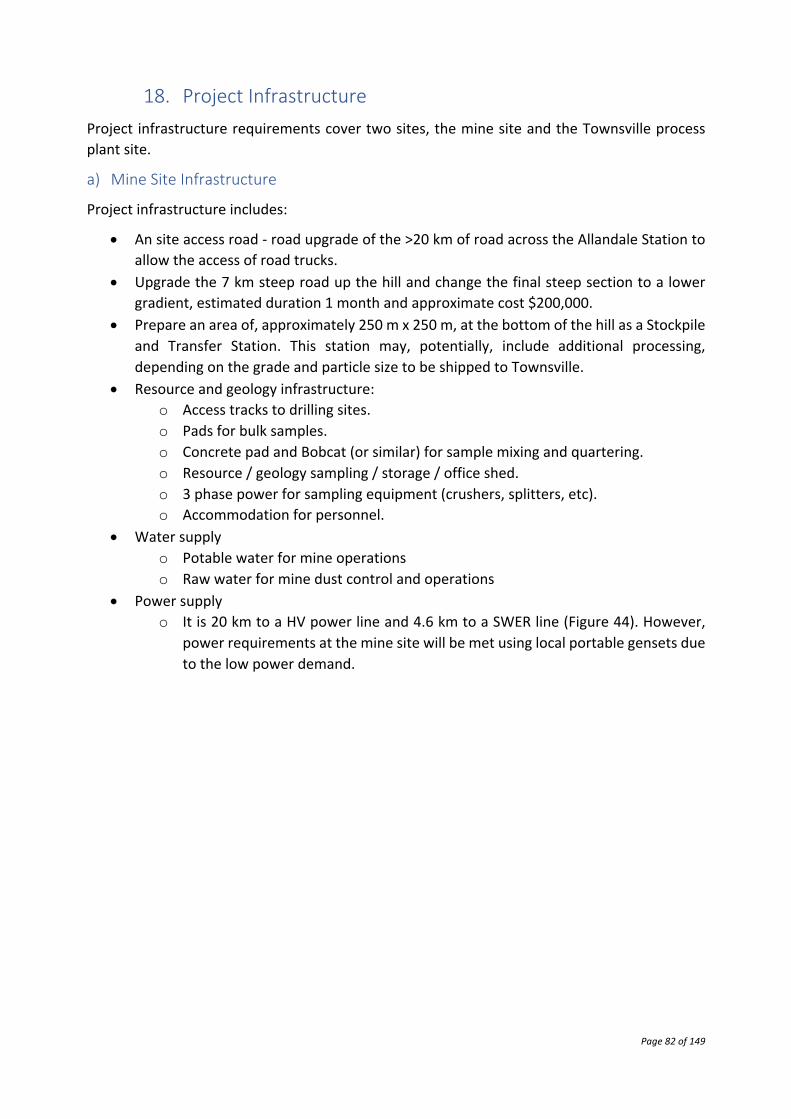
Page 82 of 149
18. Project Infrastructure Project infrastructure requirements cover two sites, the mine site and the Townsville process plant site.
a) Mine Site Infrastructure
Project infrastructure includes:
• An site access road - road upgrade of the >20 km of road across the Allandale Station to allow the access of road trucks.
• Upgrade the 7 km steep road up the hill and change the final steep section to a lower gradient, estimated duration 1 month and approximate cost $200,000.
• Prepare an area of, approximately 250 m x 250 m, at the bottom of the hill as a Stockpile and Transfer Station. This station may, potentially, include additional processing, depending on the grade and particle size to be shipped to Townsville.
• Resource and geology infrastructure: o Access tracks to drilling sites. o Pads for bulk samples. o Concrete pad and Bobcat (or similar) for sample mixing and quartering. o Resource / geology sampling / storage / office shed. o 3 phase power for sampling equipment (crushers, splitters, etc). o Accommodation for personnel.
• Water supply o Potable water for mine operations o Raw water for mine dust control and operations
• Power supply o It is 20 km to a HV power line and 4.6 km to a SWER line (Figure 44). However,
power requirements at the mine site will be met using local portable gensets due to the low power demand.
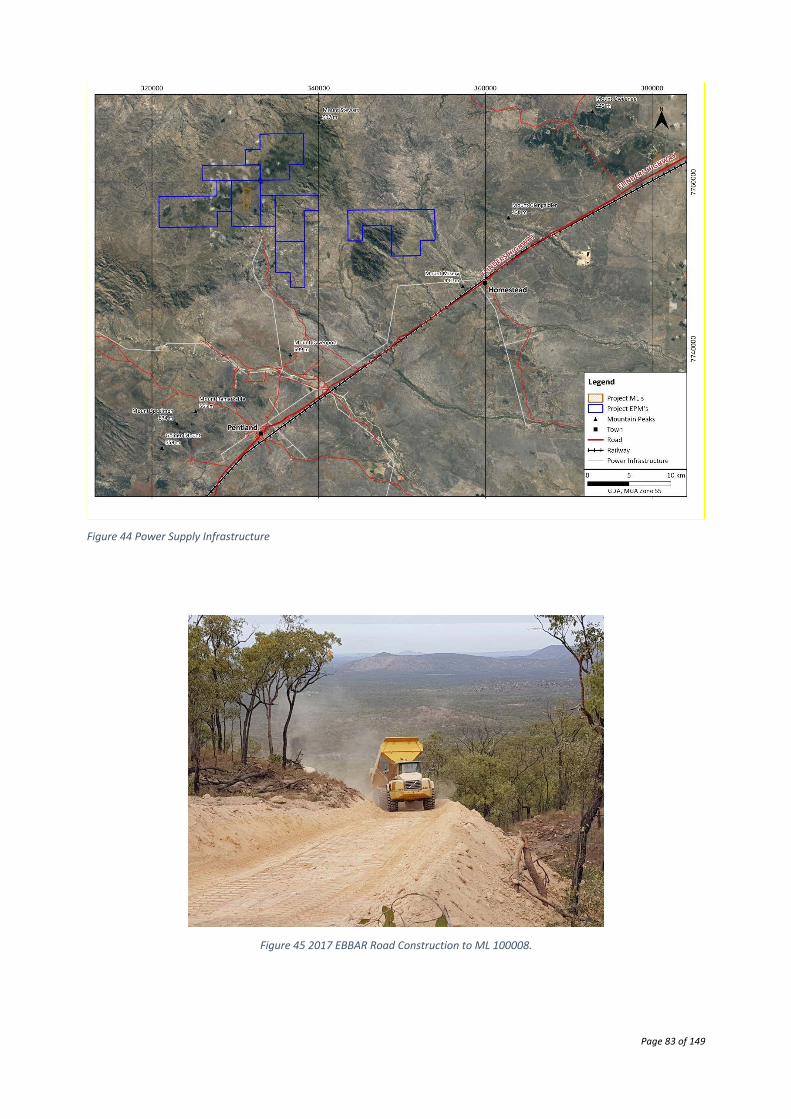
Page 83 of 149
Figure 44 Power Supply Infrastructure
Figure 45 2017 EBBAR Road Construction to ML 100008.
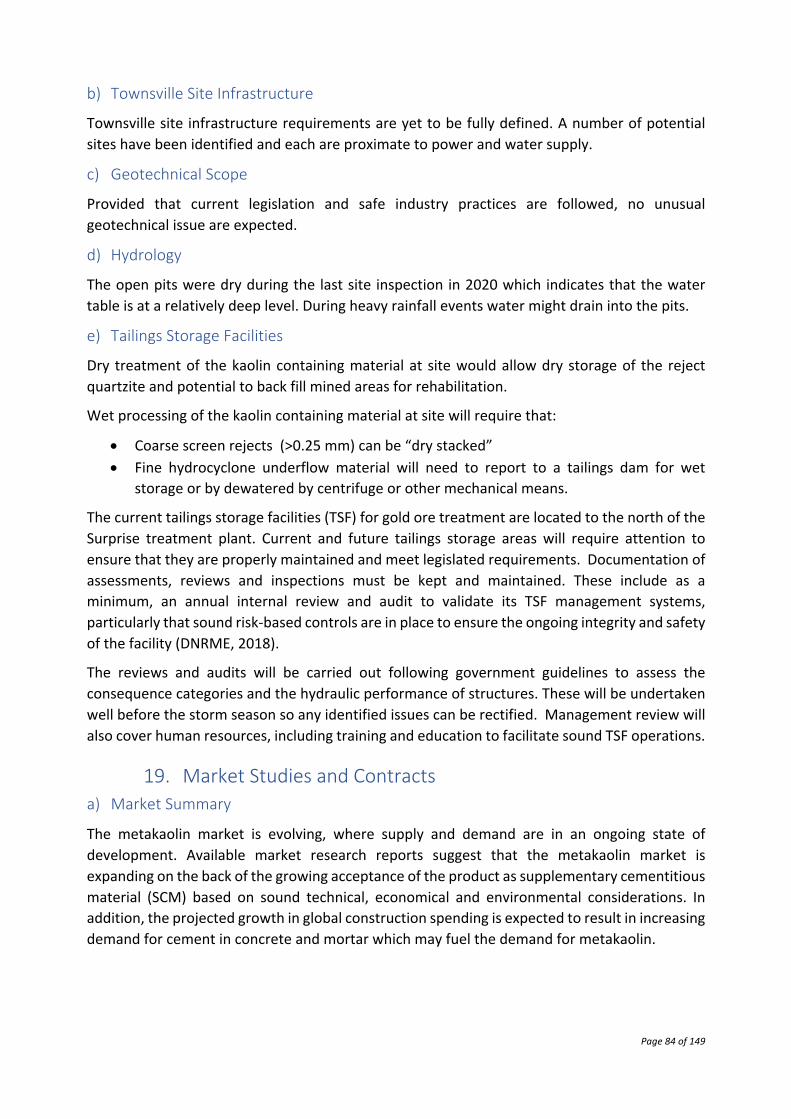
Page 84 of 149
b) Townsville Site Infrastructure
Townsville site infrastructure requirements are yet to be fully defined. A number of potential sites have been identified and each are proximate to power and water supply.
c) Geotechnical Scope
Provided that current legislation and safe industry practices are followed, no unusual geotechnical issue are expected.
d) Hydrology
The open pits were dry during the last site inspection in 2020 which indicates that the water table is at a relatively deep level. During heavy rainfall events water might drain into the pits.
e) Tailings Storage Facilities
Dry treatment of the kaolin containing material at site would allow dry storage of the reject quartzite and potential to back fill mined areas for rehabilitation.
Wet processing of the kaolin containing material at site will require that:
• Coarse screen rejects (>0.25 mm) can be “dry stacked” • Fine hydrocyclone underflow material will need to report to a tailings dam for wet
storage or by dewatered by centrifuge or other mechanical means.
The current tailings storage facilities (TSF) for gold ore treatment are located to the north of the Surprise treatment plant. Current and future tailings storage areas will require attention to ensure that they are properly maintained and meet legislated requirements. Documentation of assessments, reviews and inspections must be kept and maintained. These include as a minimum, an annual internal review and audit to validate its TSF management systems, particularly that sound risk-based controls are in place to ensure the ongoing integrity and safety of the facility (DNRME, 2018).
The reviews and audits will be carried out following government guidelines to assess the consequence categories and the hydraulic performance of structures. These will be undertaken well before the storm season so any identified issues can be rectified. Management review will also cover human resources, including training and education to facilitate sound TSF operations.
19. Market Studies and Contracts a) Market Summary
The metakaolin market is evolving, where supply and demand are in an ongoing state of development. Available market research reports suggest that the metakaolin market is expanding on the back of the growing acceptance of the product as supplementary cementitious material (SCM) based on sound technical, economical and environmental considerations. In addition, the projected growth in global construction spending is expected to result in increasing demand for cement in concrete and mortar which may fuel the demand for metakaolin.
Page 85 of 149
Figure 46 Global Construction Industry Spending 2014-19 With Forecasts for 2020-35 (US$ trillions) (Source: Statista)
Low clinker cement is seen as being a sustainable construction material. Global cement production in 2019 stood at 4.1 Gt (IEA figures - International Energy Agency). China is the largest cement producer accounting for approximately 55%, followed by India at 8%. Production of 1 t of Portland cement clinker resulting in CO2 emissions of 884 kg which means that the global cement industry is responsible for some 8% of man-made global CO2 emissions. The industry is seeking ways to reduce its carbon footprint and reducing the clinker content within cement, the clinker factor, is one pathway. The addition of SCMs is seen to reduce the clinker factor quite considerably.
Market researcher, Technavio, in its report entitled “Global Supplementary Cementitious Material Market 2020 – 2024” (published October 2020) forecasted that the SCM market size was set to grow by US$6.3 billion accelerating at a CAGR of almost 6% during this period. This remains a fragmented market with several players occupying the market share and 54% of this forecasted incremental growth coming from APAC (Asia-Pacific Countries). Key factors seen to be driving such growth are the increase in building and construction activities along with increasing investments in industrial parks and major infrastructural projects around the world that have increased the demand for SCMs. In addition, this market researcher sees the emergence of environmentally friendly cement technology as a significant trend that will further stimulate growth in this market. At the same time, the rising need for sustainable infrastructure development is serving to increase the use of eco-friendly and low-cost construction materials.
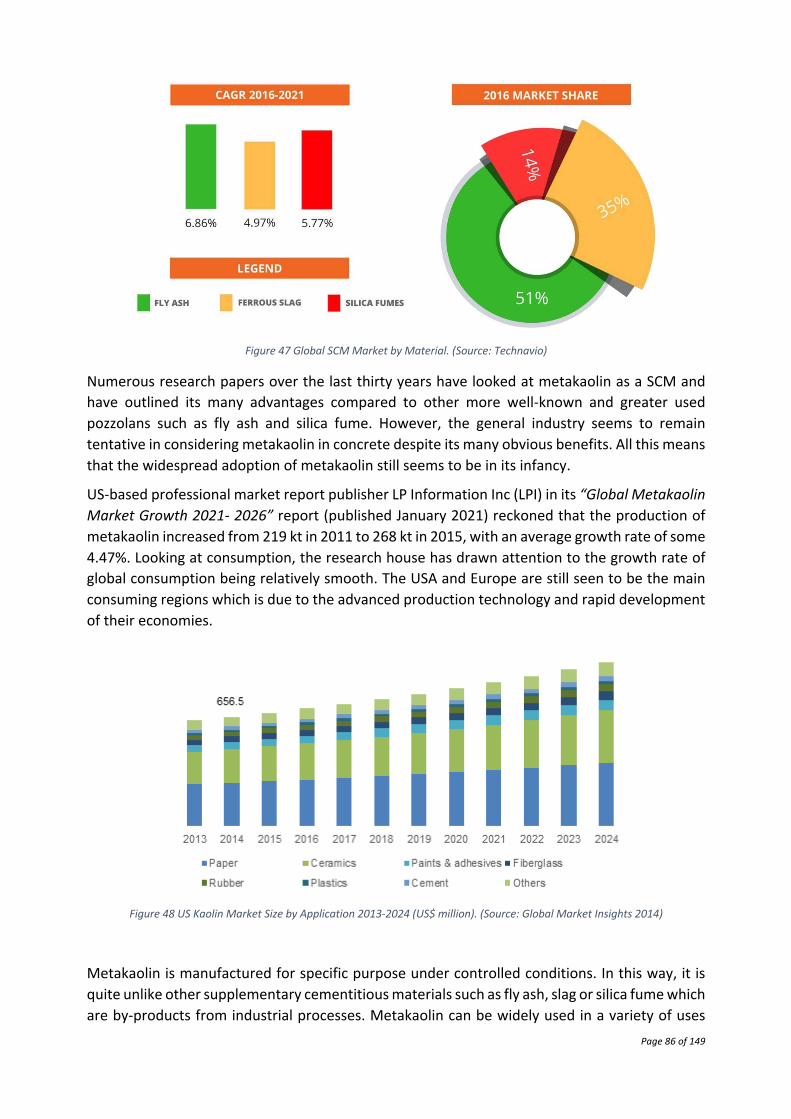
Page 86 of 149
Figure 47 Global SCM Market by Material. (Source: Technavio)
Numerous research papers over the last thirty years have looked at metakaolin as a SCM and have outlined its many advantages compared to other more well-known and greater used pozzolans such as fly ash and silica fume. However, the general industry seems to remain tentative in considering metakaolin in concrete despite its many obvious benefits. All this means that the widespread adoption of metakaolin still seems to be in its infancy.
US-based professional market report publisher LP Information Inc (LPI) in its “Global Metakaolin Market Growth 2021- 2026” report (published January 2021) reckoned that the production of metakaolin increased from 219 kt in 2011 to 268 kt in 2015, with an average growth rate of some 4.47%. Looking at consumption, the research house has drawn attention to the growth rate of global consumption being relatively smooth. The USA and Europe are still seen to be the main consuming regions which is due to the advanced production technology and rapid development of their economies.
Figure 48 US Kaolin Market Size by Application 2013-2024 (US$ million). (Source: Global Market Insights 2014)
Metakaolin is manufactured for specific purpose under controlled conditions. In this way, it is quite unlike other supplementary cementitious materials such as fly ash, slag or silica fume which are by-products from industrial processes. Metakaolin can be widely used in a variety of uses
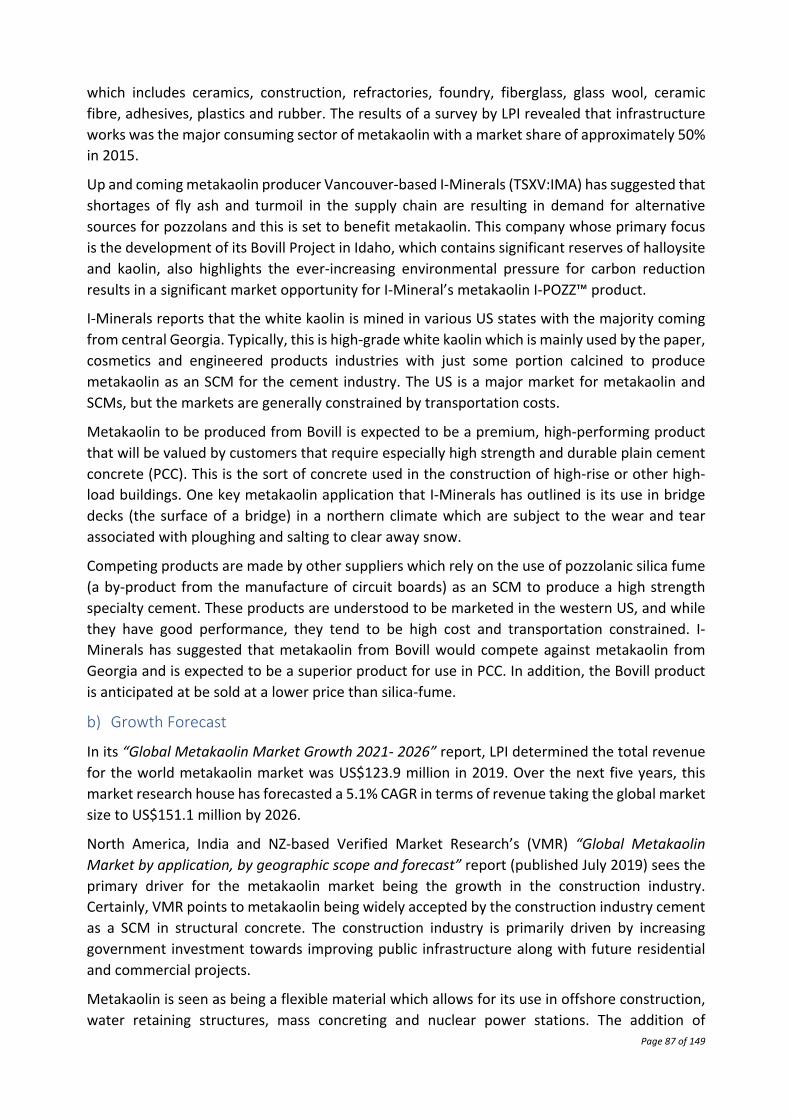
Page 87 of 149
which includes ceramics, construction, refractories, foundry, fiberglass, glass wool, ceramic fibre, adhesives, plastics and rubber. The results of a survey by LPI revealed that infrastructure works was the major consuming sector of metakaolin with a market share of approximately 50% in 2015.
Up and coming metakaolin producer Vancouver-based I-Minerals (TSXV:IMA) has suggested that shortages of fly ash and turmoil in the supply chain are resulting in demand for alternative sources for pozzolans and this is set to benefit metakaolin. This company whose primary focus is the development of its Bovill Project in Idaho, which contains significant reserves of halloysite and kaolin, also highlights the ever-increasing environmental pressure for carbon reduction results in a significant market opportunity for I-Mineral’s metakaolin I-POZZ™ product.
I-Minerals reports that the white kaolin is mined in various US states with the majority coming from central Georgia. Typically, this is high-grade white kaolin which is mainly used by the paper, cosmetics and engineered products industries with just some portion calcined to produce metakaolin as an SCM for the cement industry. The US is a major market for metakaolin and SCMs, but the markets are generally constrained by transportation costs.
Metakaolin to be produced from Bovill is expected to be a premium, high-performing product that will be valued by customers that require especially high strength and durable plain cement concrete (PCC). This is the sort of concrete used in the construction of high-rise or other high-load buildings. One key metakaolin application that I-Minerals has outlined is its use in bridge decks (the surface of a bridge) in a northern climate which are subject to the wear and tear associated with ploughing and salting to clear away snow.
Competing products are made by other suppliers which rely on the use of pozzolanic silica fume (a by-product from the manufacture of circuit boards) as an SCM to produce a high strength specialty cement. These products are understood to be marketed in the western US, and while they have good performance, they tend to be high cost and transportation constrained. I-Minerals has suggested that metakaolin from Bovill would compete against metakaolin from Georgia and is expected to be a superior product for use in PCC. In addition, the Bovill product is anticipated at be sold at a lower price than silica-fume.
b) Growth Forecast
In its “Global Metakaolin Market Growth 2021- 2026” report, LPI determined the total revenue for the world metakaolin market was US$123.9 million in 2019. Over the next five years, this market research house has forecasted a 5.1% CAGR in terms of revenue taking the global market size to US$151.1 million by 2026.
North America, India and NZ-based Verified Market Research’s (VMR) “Global Metakaolin Market by application, by geographic scope and forecast” report (published July 2019) sees the primary driver for the metakaolin market being the growth in the construction industry. Certainly, VMR points to metakaolin being widely accepted by the construction industry cement as a SCM in structural concrete. The construction industry is primarily driven by increasing government investment towards improving public infrastructure along with future residential and commercial projects.
Metakaolin is seen as being a flexible material which allows for its use in offshore construction, water retaining structures, mass concreting and nuclear power stations. The addition of
Page 88 of 149
metakaolin to concrete allows for a reduction in porosity along with a refined pore structure in the hardened pastes and concrete, all of which result in improved performance. Basically, metakaolin is seen to increase the durability of concrete by not only improving the resistance to chloride penetration, but also by the controlled expansion due to the alkali-aggregate reaction, which is being welcomed by a growing market.
In its analysis of the potential market size for metakaolin, I-Minerals has assumed that SCM sales are tied to Portland cement sales. The company reports that currently the general market uses SCM at an approximate replacement rate of 15% cement (California Department of Transportation (Caltrans) data from 2016) which combined with PCA industry data (detailed market segment cement consumptions statistics available at a state and national level in the US) was used this to determine the size of the total SCM market in its region of interest. For its Pre-Feasibility Study (March 2020), I-Minerals has assumed that 0.5% of PCC projects would require a speciality SCM or metakaolin which was subsequently reduced by 10% to remain conservative. Comparable analysis repeated on a global basis could suggest a substantial world market for metakaolin.
c) Growing Use of Metakaolin in High Strength Concretes
VMR highlighted the growing use of metakaolin in geopolymers and ceramic tiles. The material’s application in geopolymers is gaining traction as a substitute for Ordinary Portland Cement (OPC) because metakaolin provides an efficient binder with a lower carbon footprint.
Roskill Consulting Group Ltd in its reported entitled “Market Potential of Surprise Kaolin Project” dated 4 September 2020 highlighted the growing use of metakaolin in high strength concretes. The consultants went onto point out that cement producers in developed economies have moved away from using low grade kaolin in favour of materials with higher alumina contents. However, this decline has been offset to some degree by the growing use of metakaolin in high strength cements. Although Roskill also pointed out that cement production in less industrialised economies is more reliant on kaolinitic material as a source of alumina, especially in Asia.
The principal applications for metakaolin are ceramics, refractories, mortars, geopolymers and concrete admixtures which encompasses applications including infrastructure works, commercial, industrial and residential buildings, artifacts and other. Whilst ceramics tiles are popular the world over for their easy maintenance, large design choice and durability. As with the use of metakaolin in high strength concretes. VMR did highlight that the instability in the cost of the raw material or upstream product could affect the production cost of the metakaolin industry and may serve to restrain market growth.
Looking at the competitive landscape, the major players or key vendors/manufacturers of metakaolin include: Advanced Cement Technologies, Arciresa, BASF SE, Burgess Pigment Company, Dennert Poraver GmbH, Imerys, I-Minerals Inc, Jinyu Kaolin Chemical, Jinyang Kaolin, KERAMOST, Kreative, Metacaulim, MMK, OPTIPOZZ, Poraver SCR-Sibelco, Thiele Kaolin and W. R. Grace & Co.
d) Australian Metakaolin Market
Privately owned resources and development company Sydney Construction Materials (SydneyCM) based in Sydney, Australia is seeking to put its flagship project, the Newnes Junction Sand Extraction and Kaolin Mining Project, located near Lithgow, into production.
Page 89 of 149
Applications for SydneyCM’s kaolin are seen to include metakaolin, plastic filler, rubber filler, refractory clays, glass fibre reinforcement, ceramics and plasterboard filler as well as being used as a brick and tile additive. Maximum annual production from Newnes is planned to be of the order of 1.4 Mtpa of friable sandstone leaving the site producing 119,000 t/y kaolin, 127,00 t/y speciality sands and 1.15 Mt/y of construction sand.
The cement pozzolan metakaolin will comprise 25.1% of kaolin products and 2.1% of all products produced by the Newnes project at full production levels. At a projected sale price of A$300-550/t, SCM's metakaolin will compete directly with silica fume (mainly produced by Simcoa in WA) in a number of applications. Shotcrete (spray concrete) used in mining tunnels is likely to become a market replacing high-priced silica fume and colloidal silica blends. It is also likely that the shotcrete will use a blend of these three materials.
On its website, SydneyCM provides an outline on the Australian metakaolin market. Cement production in Australia is controlled by three major cement companies (Cement Australia, Blue Circle Southern and Adelaide Brighton) which produce more than 8 Mt/y. Metakaolin additives for normal usage is 5-10% for compressive structurers, 10-15% for chloride resistance and 15-20% for optimum chemical resistance and efflorescence control.
In addition, SydneyCM has pointed out that assuming an 8% average addition of pozzolanic material in cement would result in demand of 640,000 t/y. SydneyCM’s marketing objective is 25,000t/y at full production which equates to less than 4% of total pozzolan demand. Export of metakaolin to New Zealand, which is a fifth of the size of the Australian market, could account for an additional 5,000 t/y.
SydneyCM goes on to suggest that a marketing target of 65,000 t/y metakaolin would represent roughly a 10% displacement of the pozzolans market (replacing fly ash and silica fume) is not an unreasonable long-term marketing goal. This company goes onto draw attention to the fact that in the Greater Sydney Metropolitan Area there is planned to be more than A$18 billion of infrastructure in the near future which will consume a large proportion of this 65,000 t/y.
Advanced Cement Technologies is a supplier of PowerPozz™ Metakaolin, and both Densified and Undensified Silica Fume (Microsilica). They supply metakaolin and silica fume both in Australia and internationally through its sales and technical support service located in Blaine, Washington USA. Both Metakaolin and Silica Fume originate from the Eastern US and a West Coast inventory is available out of its warehouse in California.
Currently, SydneyCM believe that there is no single producer of metakaolin in Australia. The very minimal amounts being used are fully imported. So, SydneyCM, or another, would become the first producer of metakaolin in Australia.
IGM anticipates that a major source of growth in the demand for metakaolin will be derived from its use as a SCM. This will be driven by the ongoing requirement to reduce construction related CO2 emissions. Metakaolin will either replace fly ash or slag as their availability declines or be used in preference to fly ash and slag to achieve high performance concretes. Market and technical experience indicates that metakaolin can replace clinker cement in concrete by up to 25% and under these circumstances, depending on the rate of market evolution, the demand for metakaolin in Australia alone could reach and exceed 1 million tonnes per year. The current Australian market for cement is approximately 11 million tonnes. For IGM, its location in
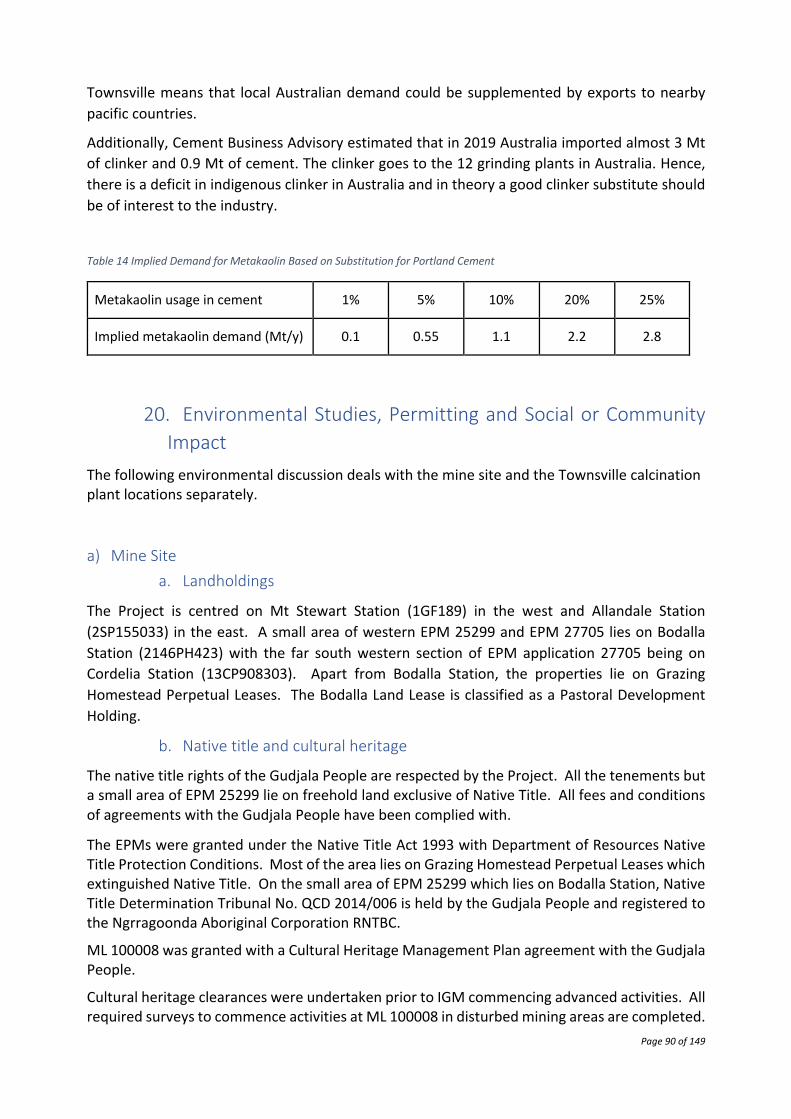
Page 90 of 149
Townsville means that local Australian demand could be supplemented by exports to nearby pacific countries.
Additionally, Cement Business Advisory estimated that in 2019 Australia imported almost 3 Mt of clinker and 0.9 Mt of cement. The clinker goes to the 12 grinding plants in Australia. Hence, there is a deficit in indigenous clinker in Australia and in theory a good clinker substitute should be of interest to the industry.
Table 14 Implied Demand for Metakaolin Based on Substitution for Portland Cement
Metakaolin usage in cement 1% 5% 10% 20% 25%
Implied metakaolin demand (Mt/y) 0.1 0.55 1.1 2.2 2.8
20. Environmental Studies, Permitting and Social or Community Impact
The following environmental discussion deals with the mine site and the Townsville calcination plant locations separately.
a) Mine Site a. Landholdings
The Project is centred on Mt Stewart Station (1GF189) in the west and Allandale Station (2SP155033) in the east. A small area of western EPM 25299 and EPM 27705 lies on Bodalla Station (2146PH423) with the far south western section of EPM application 27705 being on Cordelia Station (13CP908303). Apart from Bodalla Station, the properties lie on Grazing Homestead Perpetual Leases. The Bodalla Land Lease is classified as a Pastoral Development Holding.
b. Native title and cultural heritage
The native title rights of the Gudjala People are respected by the Project. All the tenements but a small area of EPM 25299 lie on freehold land exclusive of Native Title. All fees and conditions of agreements with the Gudjala People have been complied with.
The EPMs were granted under the Native Title Act 1993 with Department of Resources Native Title Protection Conditions. Most of the area lies on Grazing Homestead Perpetual Leases which extinguished Native Title. On the small area of EPM 25299 which lies on Bodalla Station, Native Title Determination Tribunal No. QCD 2014/006 is held by the Gudjala People and registered to the Ngrragoonda Aboriginal Corporation RNTBC.
ML 100008 was granted with a Cultural Heritage Management Plan agreement with the Gudjala People.
Cultural heritage clearances were undertaken prior to IGM commencing advanced activities. All required surveys to commence activities at ML 100008 in disturbed mining areas are completed.
Page 91 of 149
Negotiations will be required with the parties to facilitate the Brandy Creek mining lease, and for new drill sites and access tracks over the Project area.
c. Social and heritage impacts
Although no specific social studies have been conducted, the Company actively engages with the local landholders for contract work where reasonably possible. Landholders may have some machinery available sporadically for hire. No European heritage sites are known on the Project area.
Conduct and Compensation Agreements (CCA) have been negotiated with the owners of Mt Stewart and Allandale Stations to facilitate land disturbing activities. The proposed work on the Project presents no substantial or specific danger to health or safety and complies with the existing comprehensive legislation and regulations. Negotiations are proceeding to conclude a CCA with the owners of Mount Stewart Station for the Brandy Creek mining lease application.
Successful exploration on the Project may lead to mining operations which would have a beneficial impact on the economy of the State through employment, taxes and royalties. The flow on effects of improved infrastructure would provide benefits for the landholders and the wider community.
d. Assessment of obstacles
No material, existing or potential, obstacles to exploring, developing or mining activity have been identified. Delays could conceivably occur during negotiations for compensation and related agreements. The availability of water may also cause delays particularly during drought conditions.
e. Environment
The majority of the area is Category A or B remnant vegetation of least concern.
A small area on EPM 26366 on the Mundic Igneous Complex is “of concern”, apparently due to the presence of very sparse “Eucalyptus exserta and Lysicarpus angustifolius low open woodland with Triodia bitextura ground layer on sandy soils on igneous rocks.”
NRA Environmental Consultants (2019) completed a baseline environmental study on the proposed Brandy Creek Mining Lease application area. Their work included field traverses and the establishment of seven specific flora and fauna assessment sites and four water quality and stream sediment sites.
They concluded that the proposed mining activities would have the potential to impact on water and land environmental values but that potential impacts to these can be prevented or reduced by implementing their recommendations and mitigation measures. Impacts to threatened flora and fauna species are of low concern, and, provided the recommendations and mitigation measures are implemented, significant residual impacts to Matters of State Environmental Significance and Matters of National Environmental Significance are unlikely.
The mitigation measures proposed include requirements for water management and land use, plus monitoring of flora, fauna, weed/pest species, water quality, stream sediments, aquatic invertebrates and groundwater.
i. Environmental authorities held
The following Environmental Authorities are held:
EPM 25299 EPSX01448713
Page 92 of 149
EPM 25431 EPSX01697013
EPM 18419 EPVL03913716
EPM 26366 EPVL03913716
ML 100008 EPVL03913716.
EPM 27705 EA 0002574.
The EAs relate to “Environmentally relevant activity/activities Location(s) Resource Activity, Non-Scheduled, Mining Activity, Exploration Permit Mineral” on the relevant tenement.
Environmentally relevant activities (ERAs) that are prescribed activities are generally industrial or intensive animal industries with the potential to release emissions which impact on the environment and surrounding land uses.
ii. Environmental closure liabilities
Details of closure liabilities are described in Appendix 3. Estimated Rehabilitation Costs lodged with the administering authority total $42,361.
The Queensland Government’s Mined Land Rehabilitation Policy formalises its commitment to ensuring that land disturbed by mining activities is rehabilitated to a safe and stable landform that does not cause environmental harm and is able to sustain an approved post-mining land use.
Relinquishment of Exploration Permits has been free of cost with the Government returning unused Environmental Assurance provided areas disturbed have been rehabilitated to specifications. Rehabilitation is normally costed annually and conducted shortly after completion of drilling or other work involving disturbance.
The Financial Assurances for a Progressive Rehabilitation and Closure Plan are required to meet the conditions of the EA for Mining Leases. The closure costs are normally covered by the up-front ERC payment. Legislation also covers recovery of any additional rehabilitation costs.
f. Social and Facilities i. Planning Permission and Reclamation Liability
Planning permissions are required for environmental disturbance and reclamation liability as described in Appendix 3. No other specific planning permissions are known apart from what has previously been described.
ii. Third Party Obligations Obligations of the Landowner
For the term of ML100008, the Landowner agreed to:
• consent to and approve, permits or licences necessary for undertaking works on the Land,
• not to make any other claims for compensation, royalties, • not to object to the grant of ML 100008, or related approvals • not to support an objection by any third party to the grant or renewal of ML 100008, or
related approvals, • to do all things reasonably necessary for the grant and renewal of ML 100008
Page 93 of 149
Obligations of IGM
For the term of ML100008, IGM agreed to numerous conditions the main ones being:
• to give two days’ notice of commencement of activities and reasonable estimates of the number of vehicles and personnel involved in road and site preparation, drilling and rehabilitation.
• to comply with the terms of its Environmental Authority when undertaking any activities,
• to construct a new access road and to upgrade and maintain access tracks or roads to the landholder’s satisfaction,
• various conditions on the number of drill pads and on rehabilitation of access tracks, drill pads, and other facilities.
• limitations on the use of chemicals and compensation in the event of damage to livestock or contamination of water resource.
b) Townsville Site
IGM is proposing to develop and operate a metakaolin production facility at or near Townsville in North Queensland. Kaolin ore will be sourced from the Surprise mine which is located 20 kilometres north of Pentland on the Flinders Highway approximately 106 kilometres west of Charters Towers and trucked to the proposed process facility.
Caloundra Environmental undertook a desktop environmental assessment of two potential processing sites:
• to review and identify the significant environmental aspects of the processing operations
• to facilitate evaluation of a preferred site; and • to contribute to a conceptual scoping study of the proposal.
a. Metakaolin production
Metakaolin is the anhydrous calcined form of the clay mineral kaolinite. It is produced by controlled thermal treatment of kaolin to induce dehydroxylation. Dehydroxylation occurs in the heating process through which the hydroxyl group (OH) is released by forming a water molecule. The dehydroxylation of kaolin to metakaolin is an endothermic process due to the large amount of energy required to remove the chemically bonded hydroxyl ions.
The process flow sheet has not yet been finalised. For the purpose of this environmental assessment the following process elements have been assumed:
• Ore (kaolin) delivery to stockpiles by road transport. • Transfer from stockpiles by loader to feed hopper or reclaimer and conveyor delivery to
a classification system • Fine kaolin material will be dewatered and dried to produce calciner feed • 2-stage preheater/calciner system • Product storage then transfer to sale.
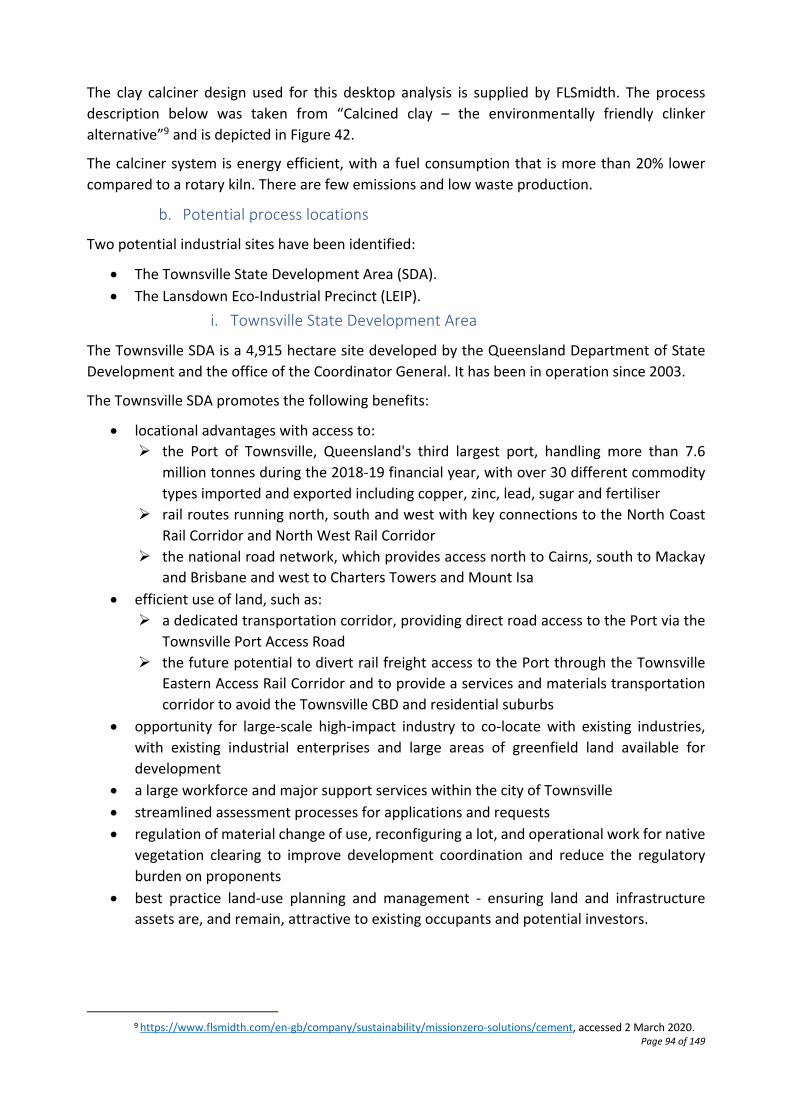
Page 94 of 149
The clay calciner design used for this desktop analysis is supplied by FLSmidth. The process description below was taken from “Calcined clay – the environmentally friendly clinker alternative”9 and is depicted in Figure 42.
The calciner system is energy efficient, with a fuel consumption that is more than 20% lower compared to a rotary kiln. There are few emissions and low waste production.
b. Potential process locations
Two potential industrial sites have been identified:
• The Townsville State Development Area (SDA). • The Lansdown Eco-Industrial Precinct (LEIP).
i. Townsville State Development Area
The Townsville SDA is a 4,915 hectare site developed by the Queensland Department of State Development and the office of the Coordinator General. It has been in operation since 2003.
The Townsville SDA promotes the following benefits:
• locational advantages with access to: Ø the Port of Townsville, Queensland's third largest port, handling more than 7.6
million tonnes during the 2018-19 financial year, with over 30 different commodity types imported and exported including copper, zinc, lead, sugar and fertiliser
Ø rail routes running north, south and west with key connections to the North Coast Rail Corridor and North West Rail Corridor
Ø the national road network, which provides access north to Cairns, south to Mackay and Brisbane and west to Charters Towers and Mount Isa
• efficient use of land, such as: Ø a dedicated transportation corridor, providing direct road access to the Port via the
Townsville Port Access Road Ø the future potential to divert rail freight access to the Port through the Townsville
Eastern Access Rail Corridor and to provide a services and materials transportation corridor to avoid the Townsville CBD and residential suburbs
• opportunity for large-scale high-impact industry to co-locate with existing industries, with existing industrial enterprises and large areas of greenfield land available for development
• a large workforce and major support services within the city of Townsville • streamlined assessment processes for applications and requests • regulation of material change of use, reconfiguring a lot, and operational work for native
vegetation clearing to improve development coordination and reduce the regulatory burden on proponents
• best practice land-use planning and management - ensuring land and infrastructure assets are, and remain, attractive to existing occupants and potential investors.
9 https://www.flsmidth.com/en-gb/company/sustainability/missionzero-solutions/cement, accessed 2 March 2020.
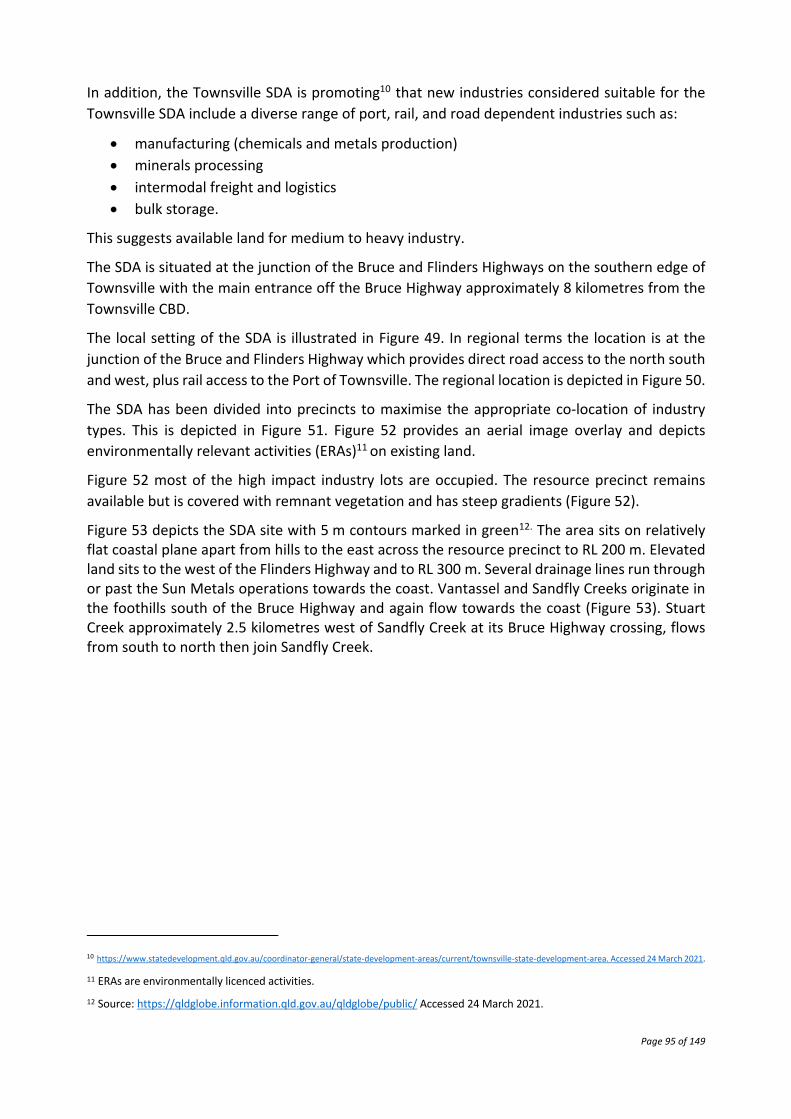
Page 95 of 149
In addition, the Townsville SDA is promoting10 that new industries considered suitable for the Townsville SDA include a diverse range of port, rail, and road dependent industries such as:
• manufacturing (chemicals and metals production) • minerals processing • intermodal freight and logistics • bulk storage.
This suggests available land for medium to heavy industry.
The SDA is situated at the junction of the Bruce and Flinders Highways on the southern edge of Townsville with the main entrance off the Bruce Highway approximately 8 kilometres from the Townsville CBD.
The local setting of the SDA is illustrated in Figure 49. In regional terms the location is at the junction of the Bruce and Flinders Highway which provides direct road access to the north south and west, plus rail access to the Port of Townsville. The regional location is depicted in Figure 50.
The SDA has been divided into precincts to maximise the appropriate co-location of industry types. This is depicted in Figure 51. Figure 52 provides an aerial image overlay and depicts environmentally relevant activities (ERAs)11 on existing land.
Figure 52 most of the high impact industry lots are occupied. The resource precinct remains available but is covered with remnant vegetation and has steep gradients (Figure 52).
Figure 53 depicts the SDA site with 5 m contours marked in green12. The area sits on relatively flat coastal plane apart from hills to the east across the resource precinct to RL 200 m. Elevated land sits to the west of the Flinders Highway and to RL 300 m. Several drainage lines run through or past the Sun Metals operations towards the coast. Vantassel and Sandfly Creeks originate in the foothills south of the Bruce Highway and again flow towards the coast (Figure 53). Stuart Creek approximately 2.5 kilometres west of Sandfly Creek at its Bruce Highway crossing, flows from south to north then join Sandfly Creek.
10 https://www.statedevelopment.qld.gov.au/coordinator-general/state-development-areas/current/townsville-state-development-area. Accessed 24 March 2021. 11 ERAs are environmentally licenced activities.
12 Source: https://qldglobe.information.qld.gov.au/qldglobe/public/ Accessed 24 March 2021.
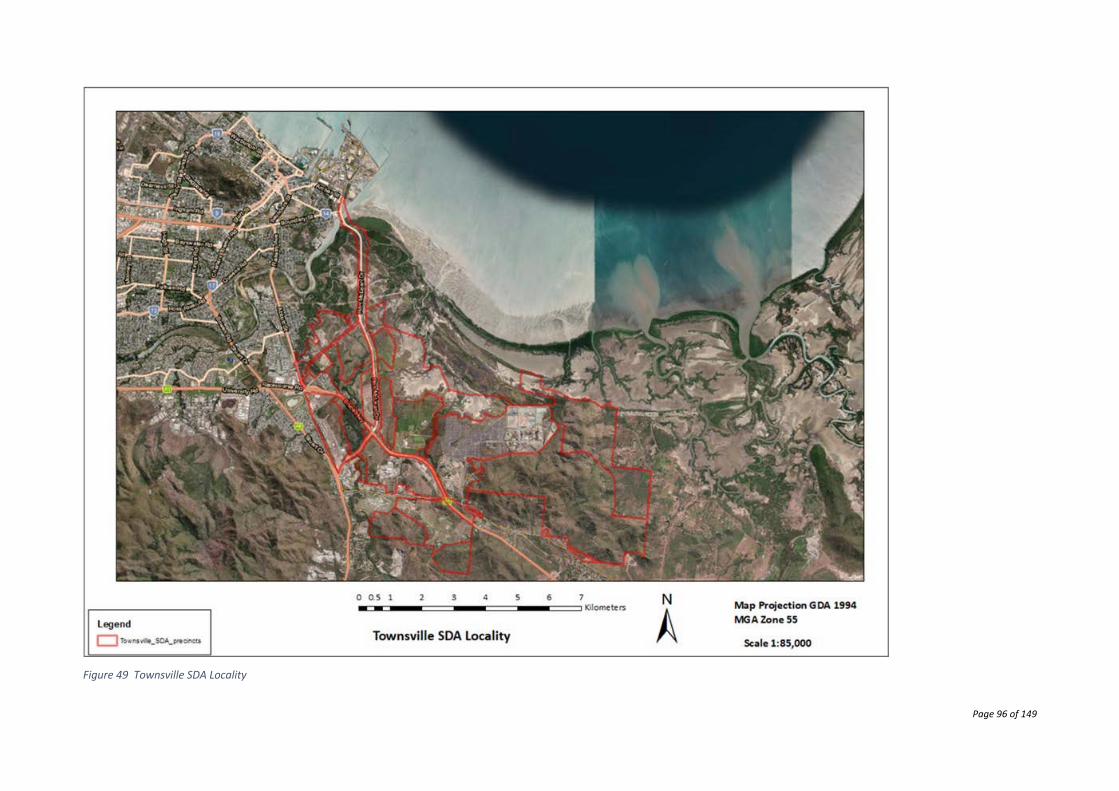
Page 96 of 149
Figure 49 Townsville SDA Locality
Page 97 of 149
Figure 50 Townsville SDA Regional Setting
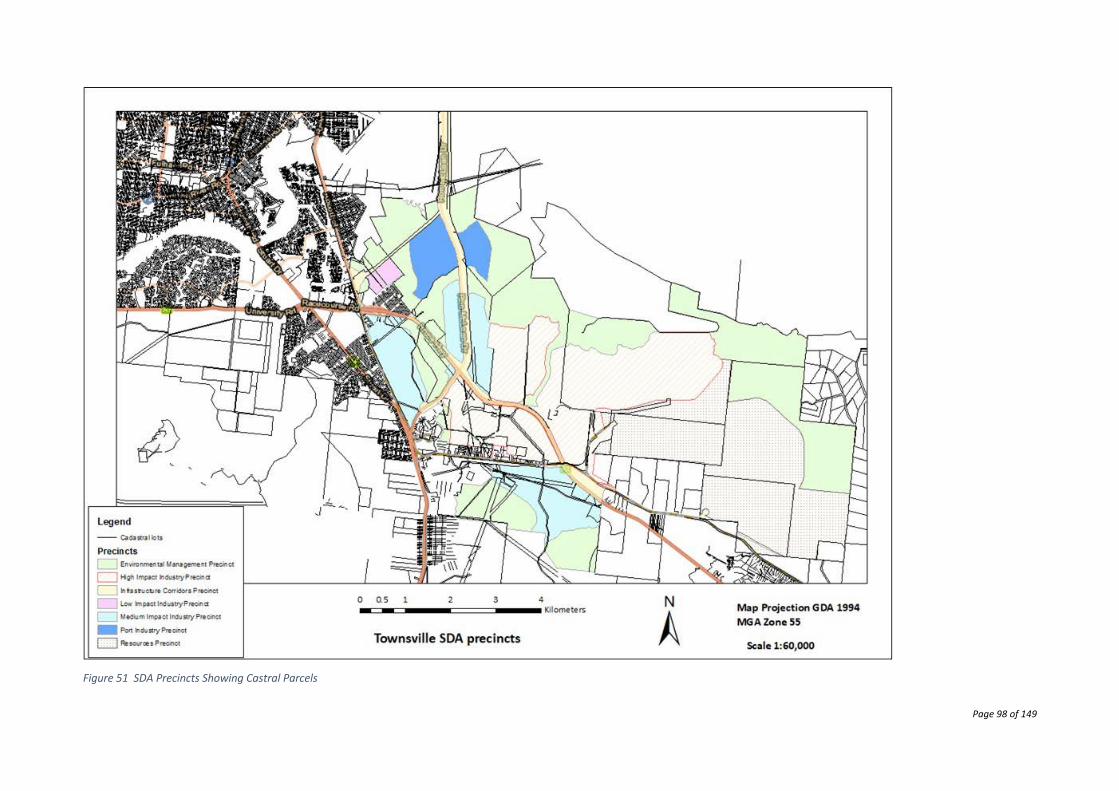
Page 98 of 149
Figure 51 SDA Precincts Showing Castral Parcels
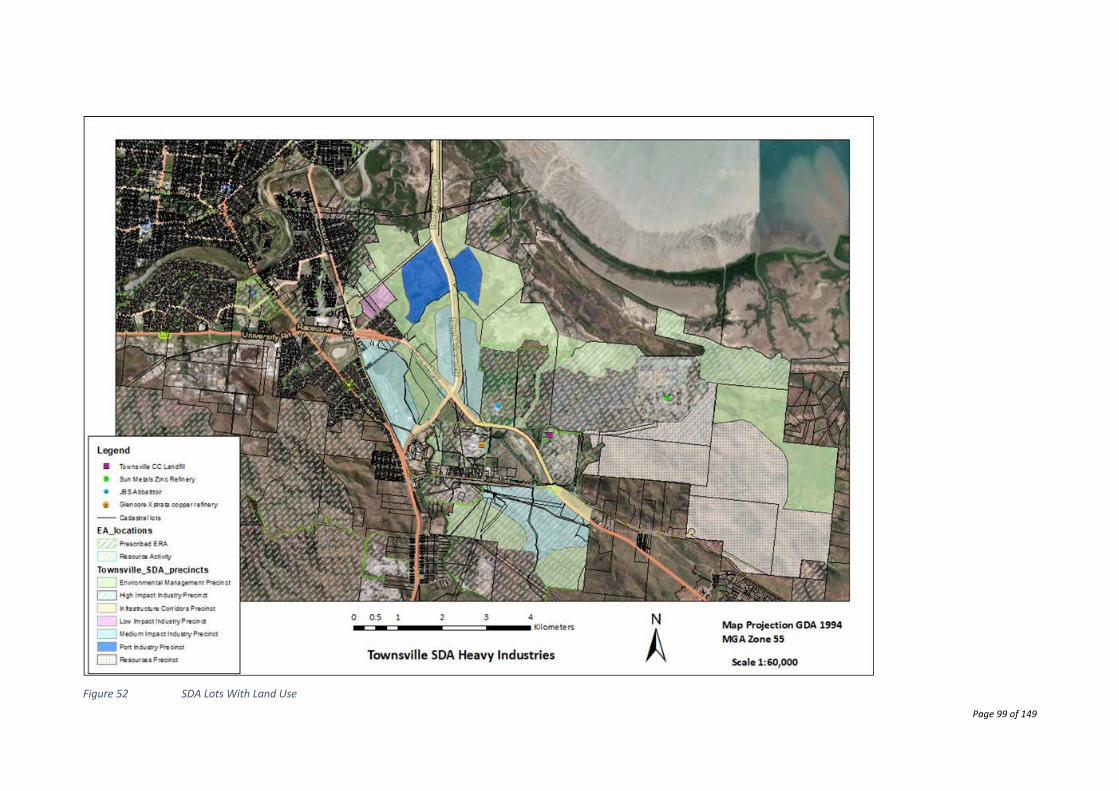
Page 99 of 149
Figure 52 SDA Lots With Land Use
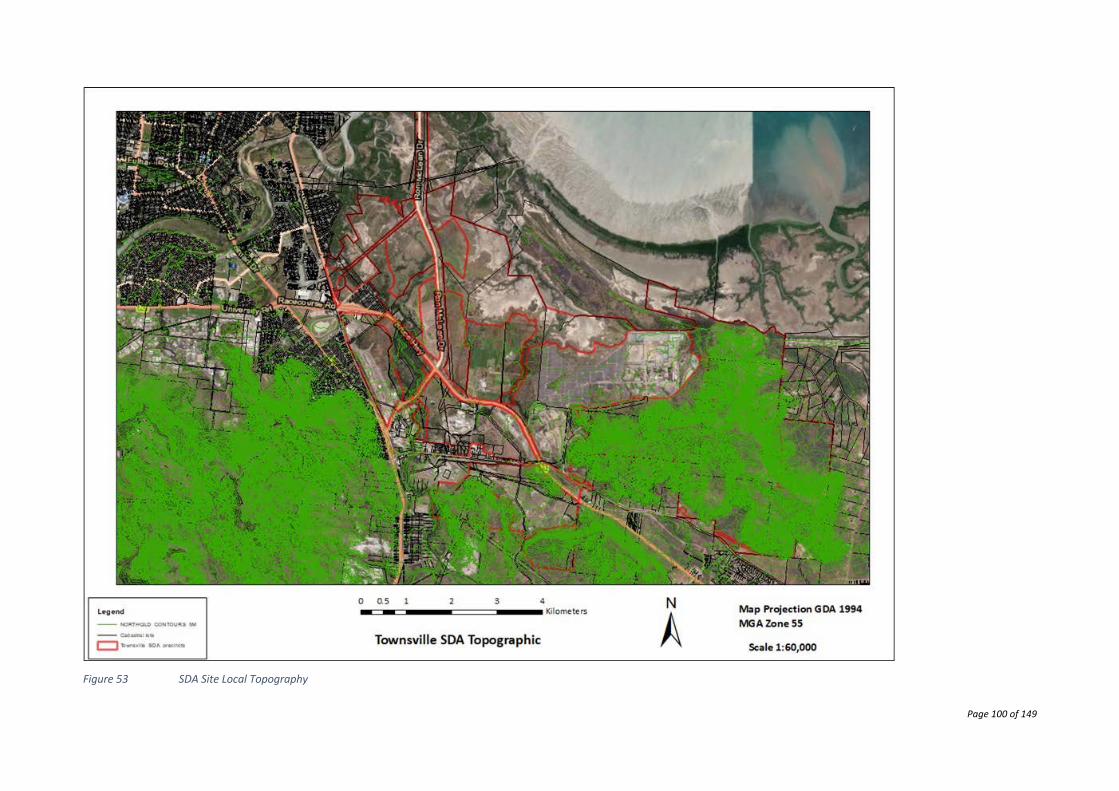
Page 100 of 149
Figure 53 SDA Site Local Topography
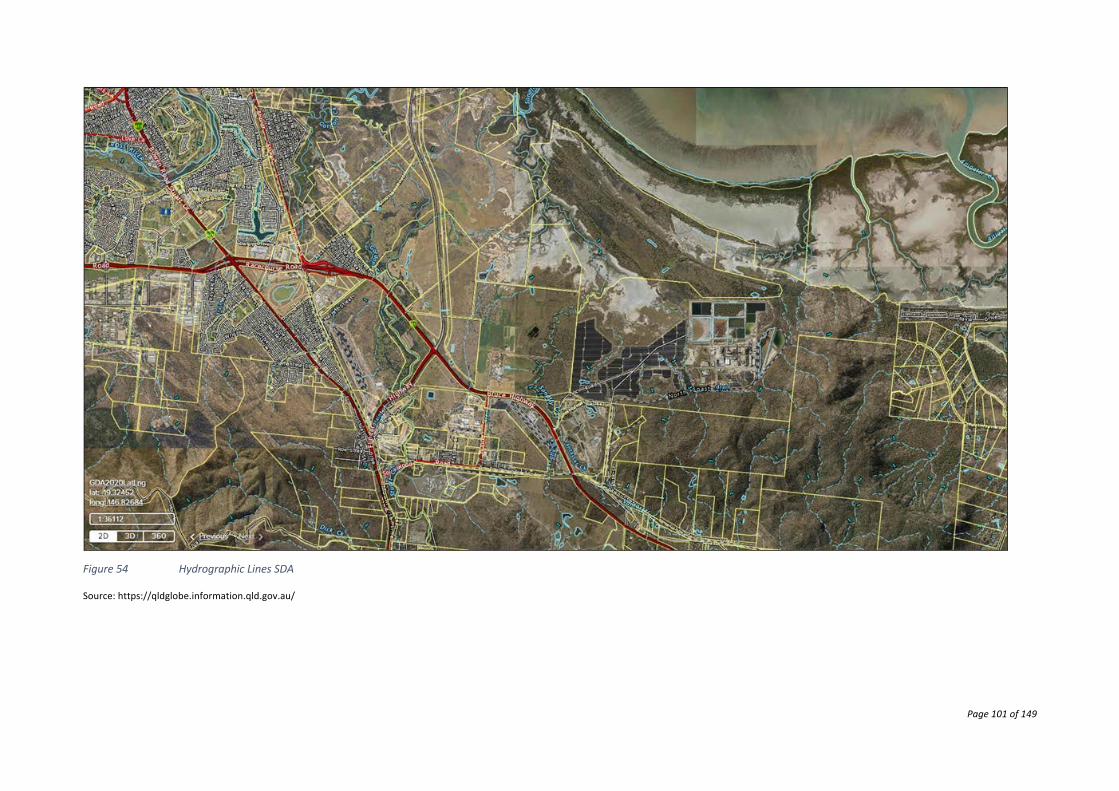
Page 101 of 149
Figure 54 Hydrographic Lines SDA
Source: https://qldglobe.information.qld.gov.au/
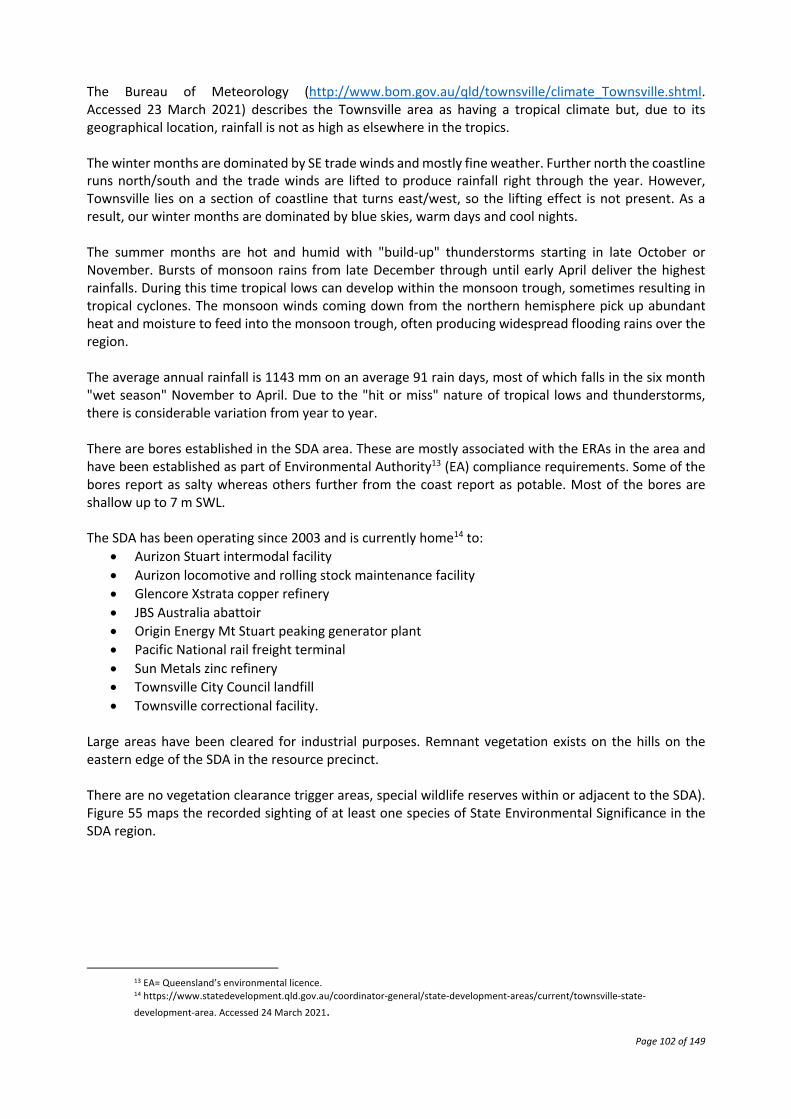
Page 102 of 149
The Bureau of Meteorology (http://www.bom.gov.au/qld/townsville/climate_Townsville.shtml. Accessed 23 March 2021) describes the Townsville area as having a tropical climate but, due to its geographical location, rainfall is not as high as elsewhere in the tropics. The winter months are dominated by SE trade winds and mostly fine weather. Further north the coastline runs north/south and the trade winds are lifted to produce rainfall right through the year. However, Townsville lies on a section of coastline that turns east/west, so the lifting effect is not present. As a result, our winter months are dominated by blue skies, warm days and cool nights. The summer months are hot and humid with "build-up" thunderstorms starting in late October or November. Bursts of monsoon rains from late December through until early April deliver the highest rainfalls. During this time tropical lows can develop within the monsoon trough, sometimes resulting in tropical cyclones. The monsoon winds coming down from the northern hemisphere pick up abundant heat and moisture to feed into the monsoon trough, often producing widespread flooding rains over the region. The average annual rainfall is 1143 mm on an average 91 rain days, most of which falls in the six month "wet season" November to April. Due to the "hit or miss" nature of tropical lows and thunderstorms, there is considerable variation from year to year. There are bores established in the SDA area. These are mostly associated with the ERAs in the area and have been established as part of Environmental Authority13 (EA) compliance requirements. Some of the bores report as salty whereas others further from the coast report as potable. Most of the bores are shallow up to 7 m SWL. The SDA has been operating since 2003 and is currently home14 to:
• Aurizon Stuart intermodal facility • Aurizon locomotive and rolling stock maintenance facility • Glencore Xstrata copper refinery • JBS Australia abattoir • Origin Energy Mt Stuart peaking generator plant • Pacific National rail freight terminal • Sun Metals zinc refinery • Townsville City Council landfill • Townsville correctional facility.
Large areas have been cleared for industrial purposes. Remnant vegetation exists on the hills on the eastern edge of the SDA in the resource precinct. There are no vegetation clearance trigger areas, special wildlife reserves within or adjacent to the SDA). Figure 55 maps the recorded sighting of at least one species of State Environmental Significance in the SDA region.
13 EA= Queensland’s environmental licence. 14 https://www.statedevelopment.qld.gov.au/coordinator-general/state-development-areas/current/townsville-state-development-area. Accessed 24 March 2021.
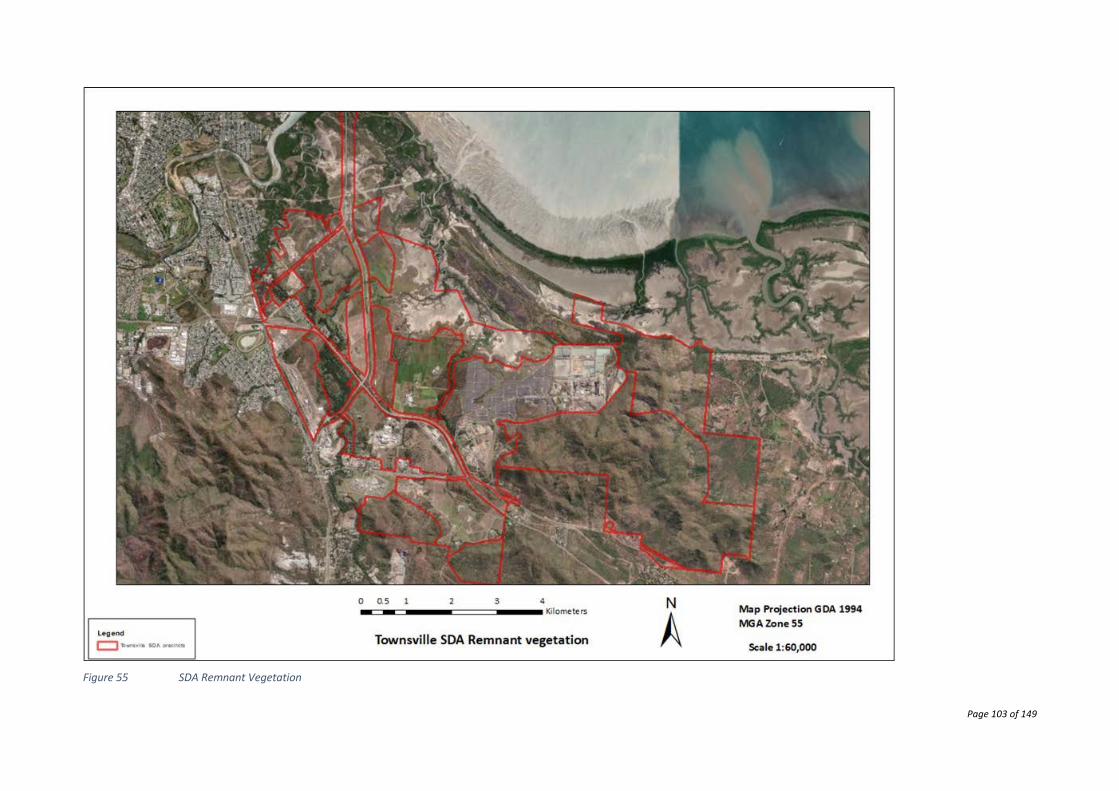
Page 103 of 149
Figure 55 SDA Remnant Vegetation
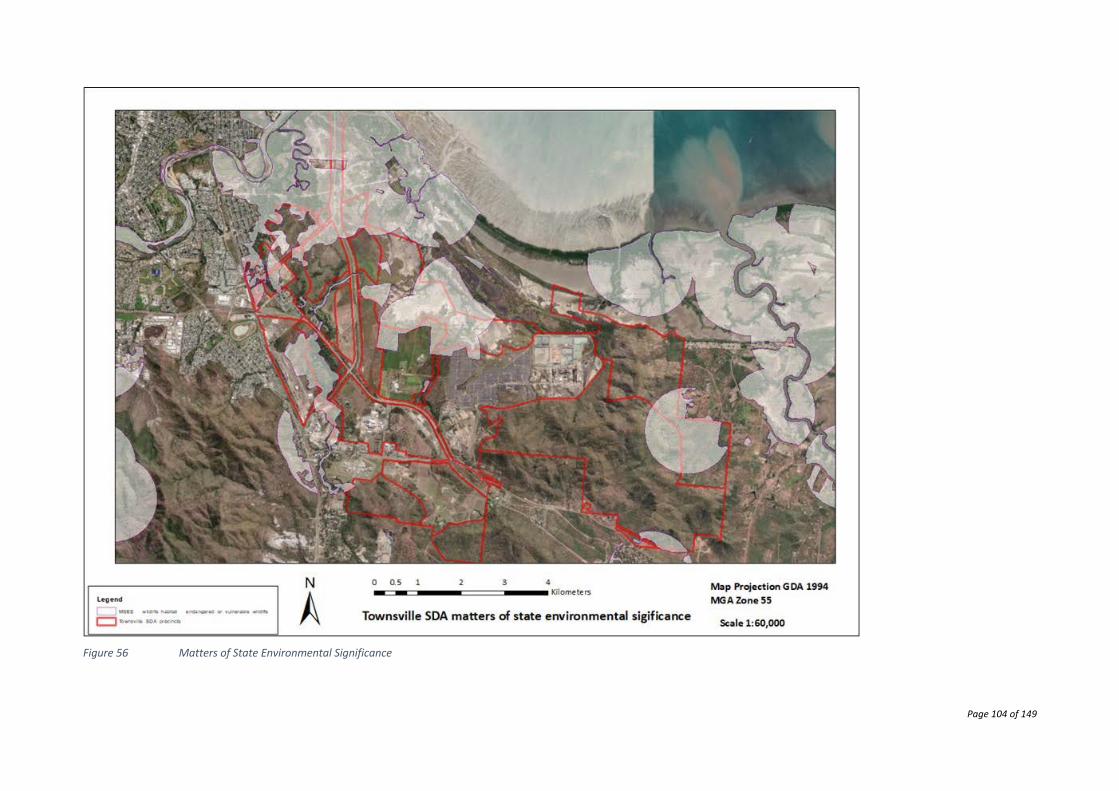
Page 104 of 149
Figure 56 Matters of State Environmental Significance
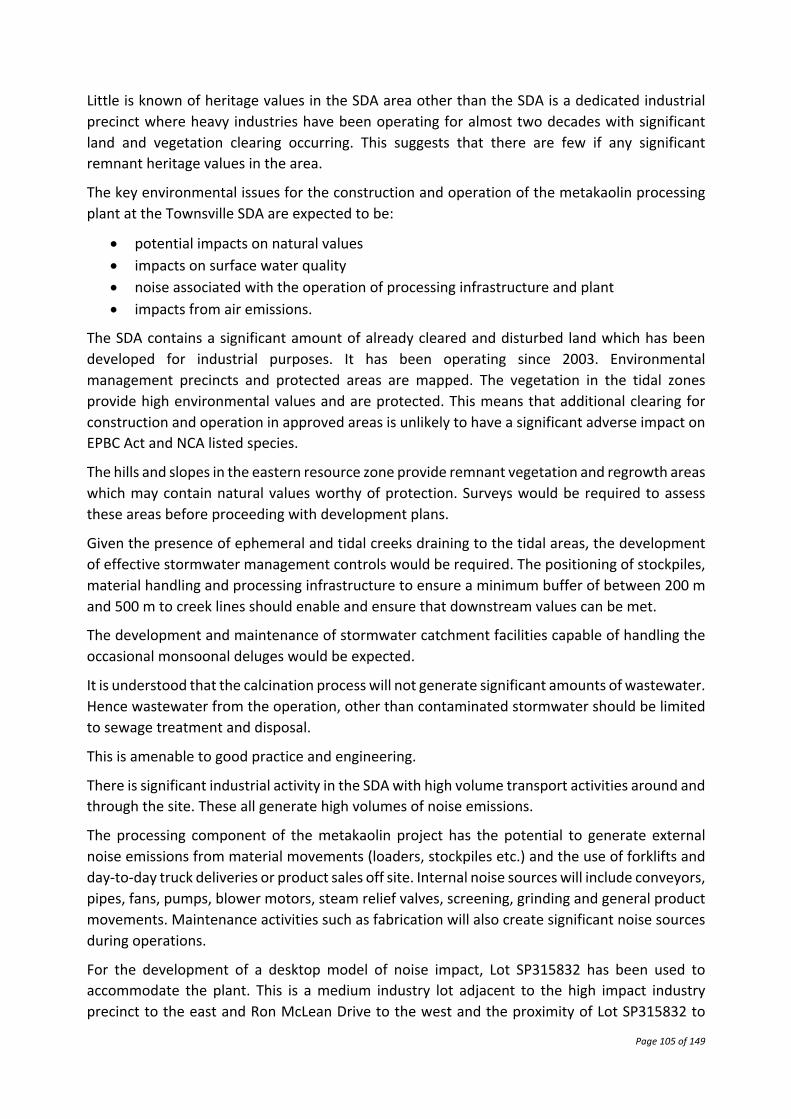
Page 105 of 149
Little is known of heritage values in the SDA area other than the SDA is a dedicated industrial precinct where heavy industries have been operating for almost two decades with significant land and vegetation clearing occurring. This suggests that there are few if any significant remnant heritage values in the area.
The key environmental issues for the construction and operation of the metakaolin processing plant at the Townsville SDA are expected to be:
• potential impacts on natural values • impacts on surface water quality • noise associated with the operation of processing infrastructure and plant • impacts from air emissions.
The SDA contains a significant amount of already cleared and disturbed land which has been developed for industrial purposes. It has been operating since 2003. Environmental management precincts and protected areas are mapped. The vegetation in the tidal zones provide high environmental values and are protected. This means that additional clearing for construction and operation in approved areas is unlikely to have a significant adverse impact on EPBC Act and NCA listed species.
The hills and slopes in the eastern resource zone provide remnant vegetation and regrowth areas which may contain natural values worthy of protection. Surveys would be required to assess these areas before proceeding with development plans.
Given the presence of ephemeral and tidal creeks draining to the tidal areas, the development of effective stormwater management controls would be required. The positioning of stockpiles, material handling and processing infrastructure to ensure a minimum buffer of between 200 m and 500 m to creek lines should enable and ensure that downstream values can be met.
The development and maintenance of stormwater catchment facilities capable of handling the occasional monsoonal deluges would be expected.
It is understood that the calcination process will not generate significant amounts of wastewater. Hence wastewater from the operation, other than contaminated stormwater should be limited to sewage treatment and disposal.
This is amenable to good practice and engineering.
There is significant industrial activity in the SDA with high volume transport activities around and through the site. These all generate high volumes of noise emissions.
The processing component of the metakaolin project has the potential to generate external noise emissions from material movements (loaders, stockpiles etc.) and the use of forklifts and day-to-day truck deliveries or product sales off site. Internal noise sources will include conveyors, pipes, fans, pumps, blower motors, steam relief valves, screening, grinding and general product movements. Maintenance activities such as fabrication will also create significant noise sources during operations.
For the development of a desktop model of noise impact, Lot SP315832 has been used to accommodate the plant. This is a medium industry lot adjacent to the high impact industry precinct to the east and Ron McLean Drive to the west and the proximity of Lot SP315832 to
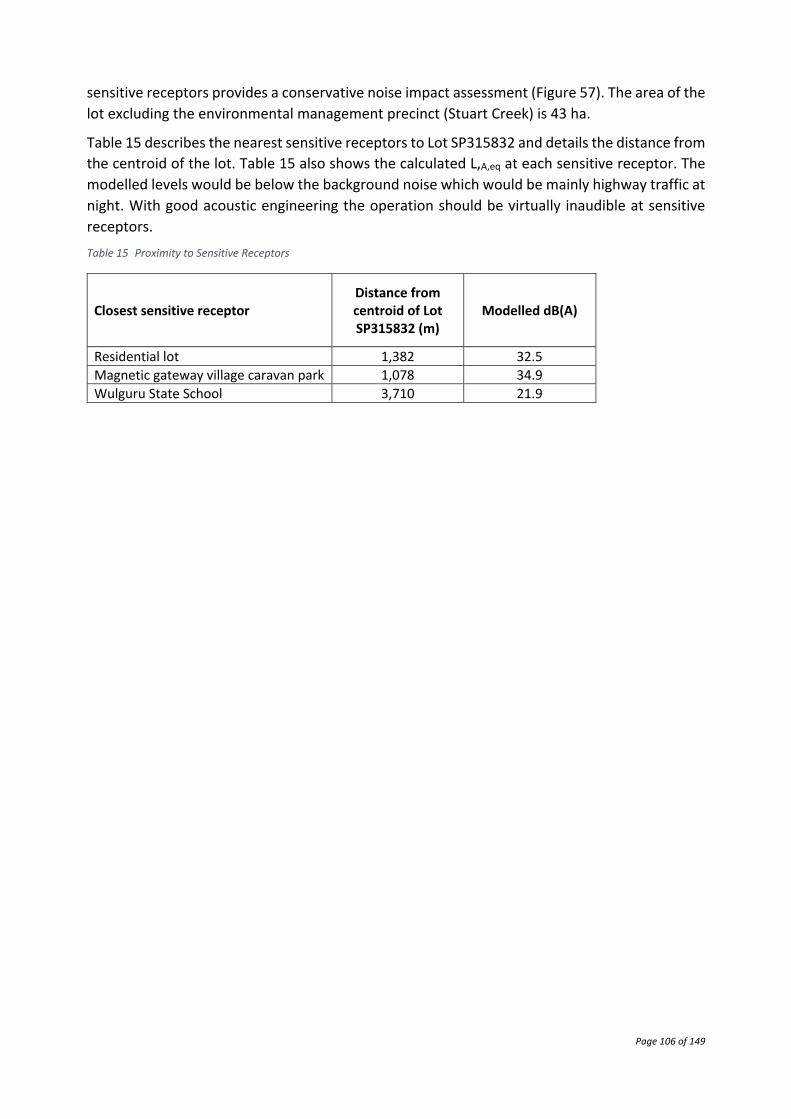
Page 106 of 149
sensitive receptors provides a conservative noise impact assessment (Figure 57). The area of the lot excluding the environmental management precinct (Stuart Creek) is 43 ha.
Table 15 describes the nearest sensitive receptors to Lot SP315832 and details the distance from the centroid of the lot. Table 15 also shows the calculated L,A,eq at each sensitive receptor. The modelled levels would be below the background noise which would be mainly highway traffic at night. With good acoustic engineering the operation should be virtually inaudible at sensitive receptors. Table 15 Proximity to Sensitive Receptors
Closest sensitive receptor Distance from centroid of Lot SP315832 (m)
Modelled dB(A)
Residential lot 1,382 32.5 Magnetic gateway village caravan park 1,078 34.9 Wulguru State School 3,710 21.9
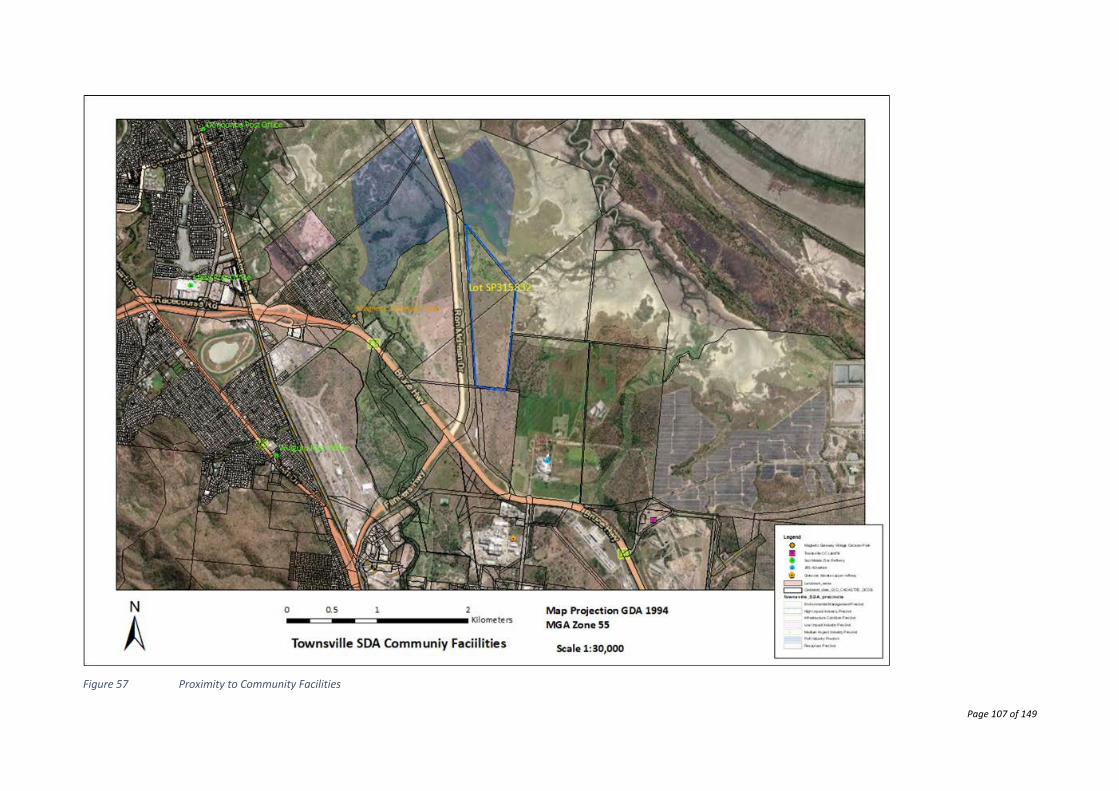
Page 107 of 149
Figure 57 Proximity to Community Facilities
Page 108 of 149
Sources of dust emissions will include road dust, material movements to and from stockpiles,
and material movement at stock bins, feeders and crushers. These will need to be mitigated with
dust control design and practice. Dust collectors will need to be installed at each external drop
points or chutes.
Queensland’s Environmental Protection (Air) Policy 2008 (Air EPP) establishes long-term
objectives for pollutants emitted into the atmosphere. Decisions regarding conditions of
approval for environmentally-relevant activities (ERAs) must consider these objectives.
Proposals for new ERAs will require atmospheric dispersion modelling to determine the potential
impact of air emissions. These standards are designed to protect sensitive members of the
community, such as children and asthmatics, hence modelling would need to demonstrate that
the objectives would be met at the nearest sensitive receptors (Table 15).
The principal air pollutants managed by the Air EPP are sulfur dioxide, nitrogen dioxide,
particulates, lead and a number of air toxics.
Sulfur dioxide
The ore is low in sulfur (Table 7). When combined with the combustion of low sulfur natural gas,
little sulfur dioxide generation is expected.
The recommended air quality standards for sulfur dioxide are:
• 0.20 parts per million (ppm) for a 1-hour exposure period
• 0.08ppm for a 24-hour exposure period
• 0.02ppm for an annual exposure period.
Nitrogen dioxide
The low temperature of combustion is unlikely to generate significant quantities of thermal
nitrogen dioxide.
The recommended air quality standards for nitrogen dioxide are:
• 0.12 parts per million (ppm) for a 1-hour exposure period
• 0.03ppm for an annual exposure period.
Particulates
Particulates will be produced from material movement and combustion. These should be easily
controlled through best practice engineering, design of control mechanisms and distance to
receptors.
The recommended air quality standards for PM2.5 are:
• 25 micrograms per cubic metre (µg/m3) for a 24-hour exposure period
• µg/m3 for an annual exposure period.
The recommended air quality standards for PM10 are:
• 50 micrograms per cubic metre (µg/m3) for a 24-hour exposure period
• 25 µg/m3 for an annual exposure period.
Page 109 of 149
The recommended air quality goal for Total Suspended Particulates for protection of human
health is 90 micrograms per cubic metre for an annual exposure period.
The SDA contains a significant amount of already cleared and disturbed land which has been
developed for industrial purposes. It has been operating since 2003. Environmental
management precincts and protected areas are mapped. The vegetation in the tidal zones
provide high environmental values and are protected. This means that additional clearing for
construction and operation in approved areas is unlikely to have a significant adverse impact on
EPBC Act and NCA listed species.
The hills and slopes in the eastern resource zone provide remnant vegetation and regrowth areas
which may contain natural values worthy of protection. Surveys would be required to assess
these areas before proceeding with development plans.
The desktop modelled noise impact of operational noise from Lot SP315832 would be below the
background noise at sensitive receptors. With good acoustic engineering the operation should
be virtually inaudible at sensitive receptors.
Proposals for new ERAs will require atmospheric dispersion modelling to determine the potential
impact of air emissions. The ore is low in sulfur. When combined with the combustion of low
sulfur natural gas, little sulfur dioxide generation is expected. The low temperature of
combustion is unlikely to generate significant quantities of thermal nitrogen dioxide. Particulates
will be produced from material movement and combustion. These should be easily controlled
through best practice engineering, design of control mechanisms and distance to receptors.
The Townsville SDA is a long term existing industrial park with many long term heavy industry
tenants and good infrastructure and facilities. As a result, there should be a high level of baseline
environmental information readily available to inform environmental approvals. With many
industries having received Commonwealth and State environmental approvals or their
operations at the SDA, an application for the low emission Metakaolin proposal is likely to be
successful.
In Queensland projects in a state development area such as the SDA are subject to Prescribed
Projects status. Approval of Prescribed Projects are facilitated by the office of the Coordinator-
General. This ensures timely decision-making in relation to prescribed processes and prescribed
decisions.
ii. Landsdown Eco Precinct
The LEIP was approved by the Department of State Development, Infrastructure, Local
Government and Planning in 2020. It is owned and operated by the Townsville City Council. The
Townsville City Council website15 promoting the LEIP notes that it offers significant strategic
positioning to existing and future infrastructure networks including:
• direct access available to the Great Northern Railway (connecting Port of Townsville to
Mount Isa)
15 https://www.townsville.qld.gov.au/building-planning-and-projects/council-projects/lansdown-industrial-precinct. Accessed 22 March 2021.
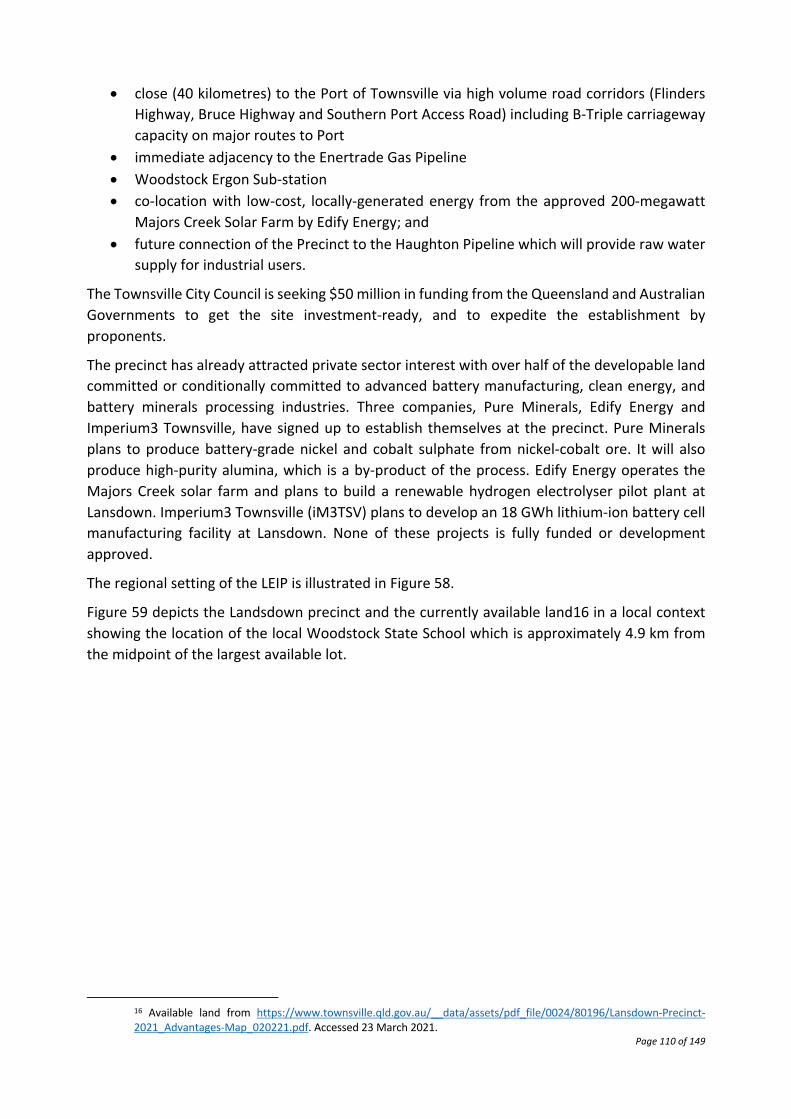
Page 110 of 149
• close (40 kilometres) to the Port of Townsville via high volume road corridors (Flinders
Highway, Bruce Highway and Southern Port Access Road) including B-Triple carriageway
capacity on major routes to Port
• immediate adjacency to the Enertrade Gas Pipeline
• Woodstock Ergon Sub-station
• co-location with low-cost, locally-generated energy from the approved 200-megawatt
Majors Creek Solar Farm by Edify Energy; and
• future connection of the Precinct to the Haughton Pipeline which will provide raw water
supply for industrial users.
The Townsville City Council is seeking $50 million in funding from the Queensland and Australian
Governments to get the site investment-ready, and to expedite the establishment by
proponents.
The precinct has already attracted private sector interest with over half of the developable land
committed or conditionally committed to advanced battery manufacturing, clean energy, and
battery minerals processing industries. Three companies, Pure Minerals, Edify Energy and
Imperium3 Townsville, have signed up to establish themselves at the precinct. Pure Minerals
plans to produce battery-grade nickel and cobalt sulphate from nickel-cobalt ore. It will also
produce high-purity alumina, which is a by-product of the process. Edify Energy operates the
Majors Creek solar farm and plans to build a renewable hydrogen electrolyser pilot plant at
Lansdown. Imperium3 Townsville (iM3TSV) plans to develop an 18 GWh lithium-ion battery cell
manufacturing facility at Lansdown. None of these projects is fully funded or development
approved.
The regional setting of the LEIP is illustrated in Figure 58.
Figure 59 depicts the Landsdown precinct and the currently available land16 in a local context
showing the location of the local Woodstock State School which is approximately 4.9 km from
the midpoint of the largest available lot.
16 Available land from https://www.townsville.qld.gov.au/__data/assets/pdf_file/0024/80196/Lansdown-Precinct-2021_Advantages-Map_020221.pdf. Accessed 23 March 2021.
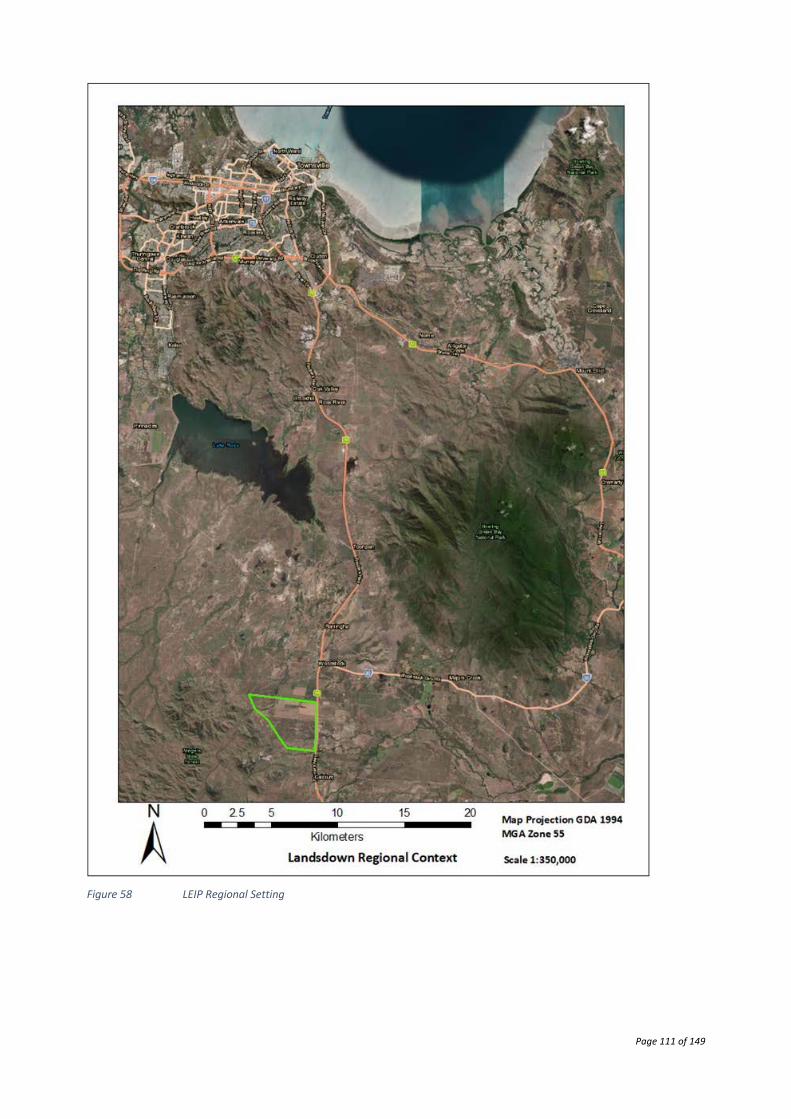
Page 111 of 149
Figure 58 LEIP Regional Setting
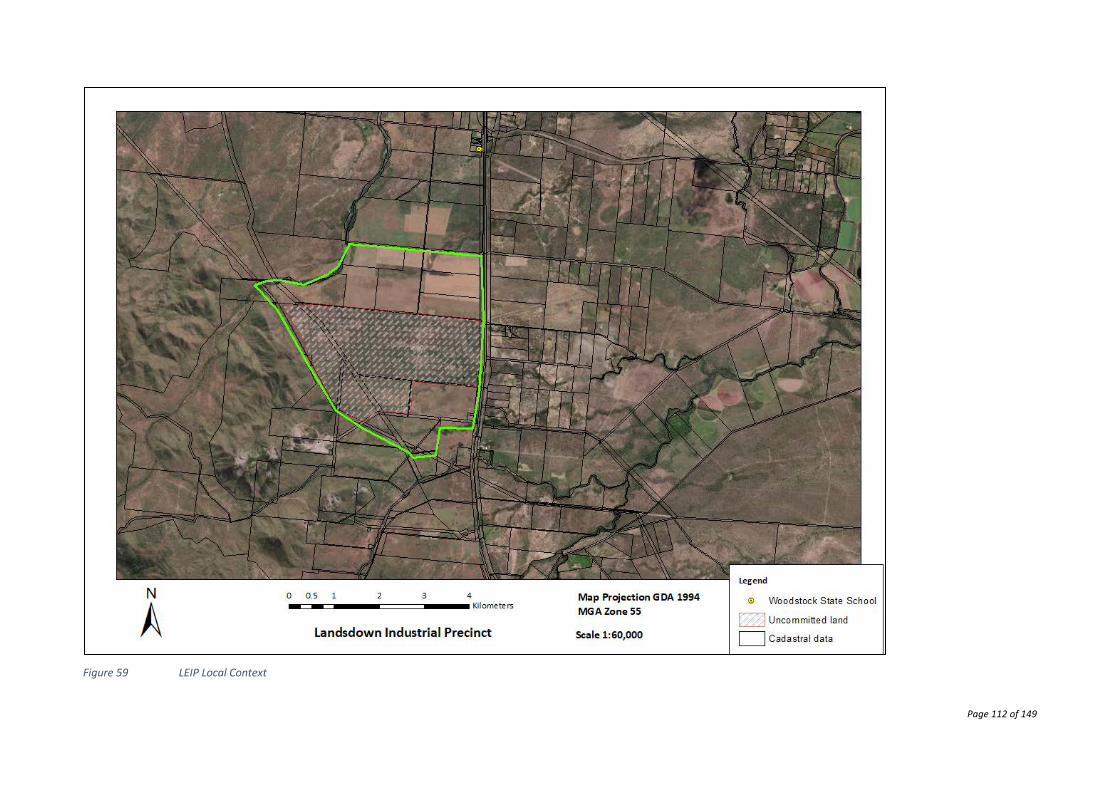
Page 112 of 149
Figure 59 LEIP Local Context
Page 113 of 149
Figure 60 LIP Cadastral Parcels
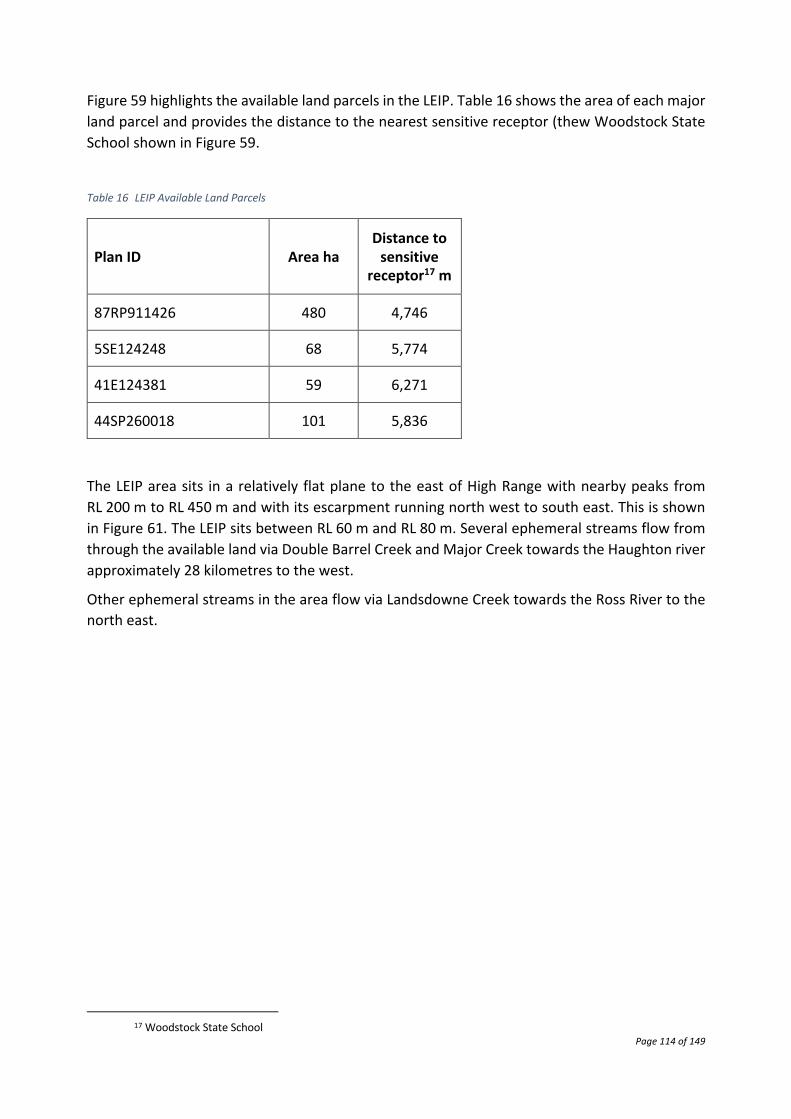
Page 114 of 149
Figure 59 highlights the available land parcels in the LEIP. Table 16 shows the area of each major land parcel and provides the distance to the nearest sensitive receptor (thew Woodstock State School shown in Figure 59.
Table 16 LEIP Available Land Parcels
Plan ID Area ha Distance to
sensitive receptor17 m
87RP911426 480 4,746
5SE124248 68 5,774
41E124381 59 6,271
44SP260018 101 5,836
The LEIP area sits in a relatively flat plane to the east of High Range with nearby peaks from RL 200 m to RL 450 m and with its escarpment running north west to south east. This is shown in Figure 61. The LEIP sits between RL 60 m and RL 80 m. Several ephemeral streams flow from through the available land via Double Barrel Creek and Major Creek towards the Haughton river approximately 28 kilometres to the west.
Other ephemeral streams in the area flow via Landsdowne Creek towards the Ross River to the north east.
17 Woodstock State School
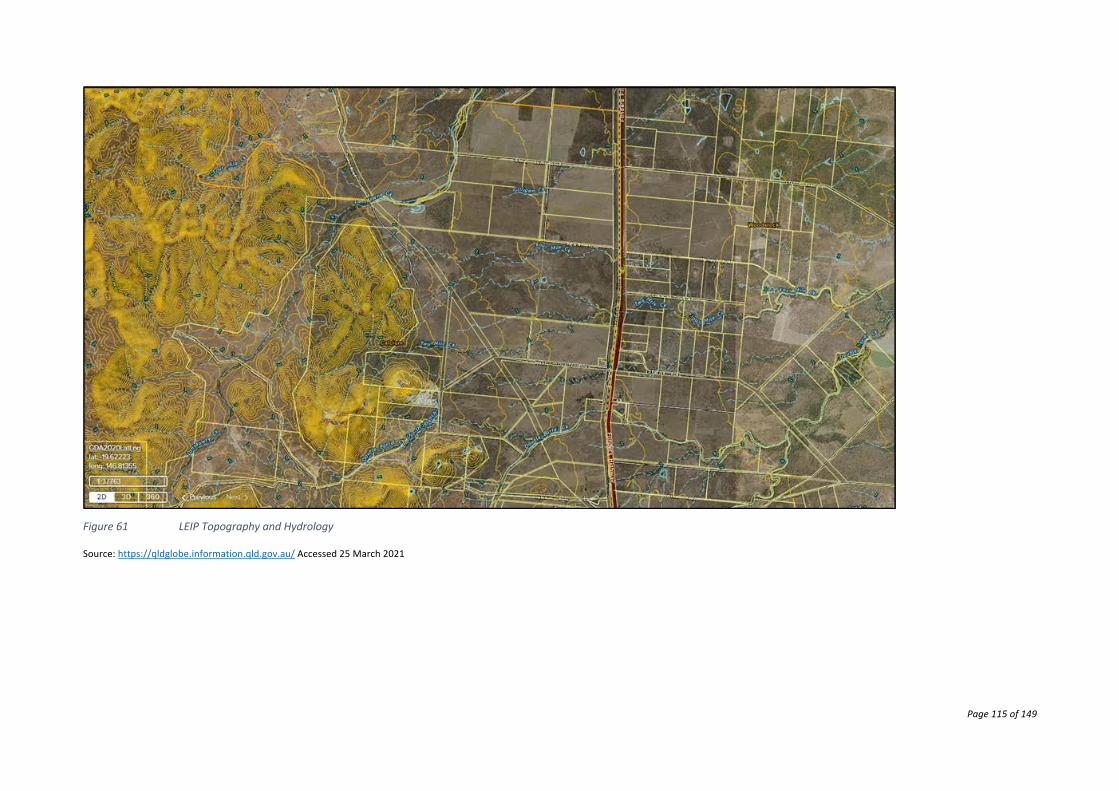
Page 115 of 149
Figure 61 LEIP Topography and Hydrology
Source: https://qldglobe.information.qld.gov.au/ Accessed 25 March 2021
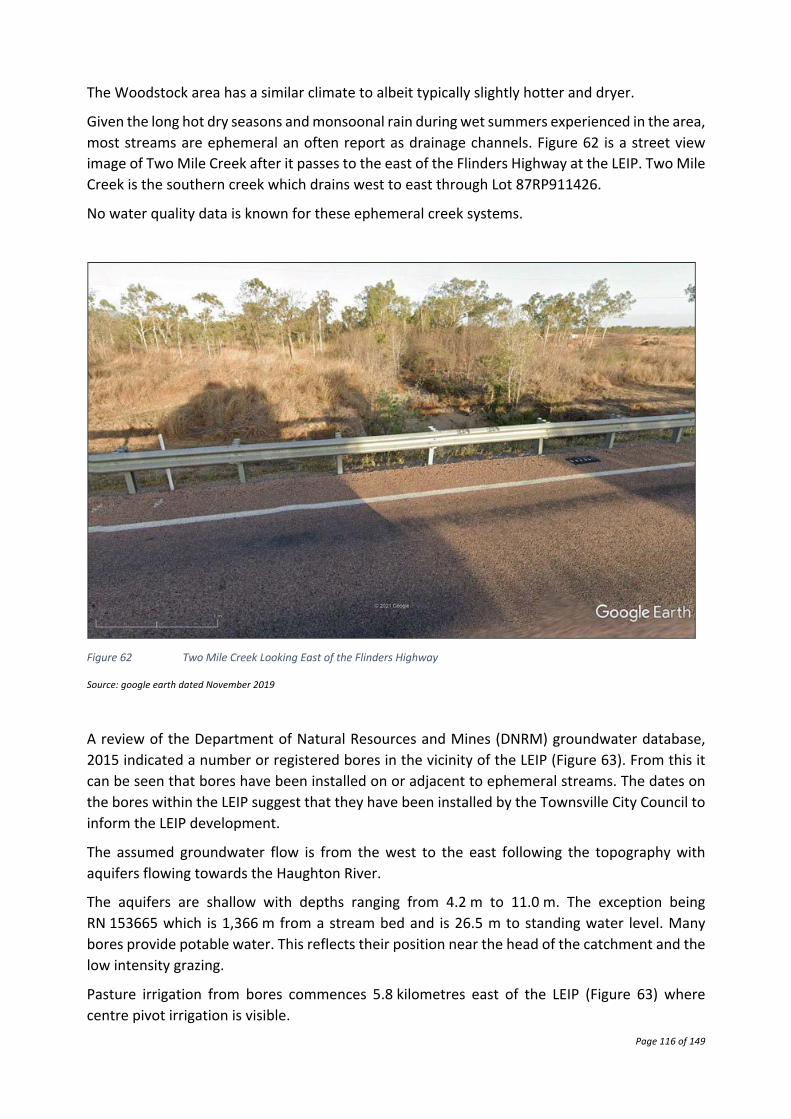
Page 116 of 149
The Woodstock area has a similar climate to albeit typically slightly hotter and dryer.
Given the long hot dry seasons and monsoonal rain during wet summers experienced in the area, most streams are ephemeral an often report as drainage channels. Figure 62 is a street view image of Two Mile Creek after it passes to the east of the Flinders Highway at the LEIP. Two Mile Creek is the southern creek which drains west to east through Lot 87RP911426.
No water quality data is known for these ephemeral creek systems.
Figure 62 Two Mile Creek Looking East of the Flinders Highway
Source: google earth dated November 2019
A review of the Department of Natural Resources and Mines (DNRM) groundwater database, 2015 indicated a number or registered bores in the vicinity of the LEIP (Figure 63). From this it can be seen that bores have been installed on or adjacent to ephemeral streams. The dates on the bores within the LEIP suggest that they have been installed by the Townsville City Council to inform the LEIP development.
The assumed groundwater flow is from the west to the east following the topography with aquifers flowing towards the Haughton River.
The aquifers are shallow with depths ranging from 4.2 m to 11.0 m. The exception being RN 153665 which is 1,366 m from a stream bed and is 26.5 m to standing water level. Many bores provide potable water. This reflects their position near the head of the catchment and the low intensity grazing.
Pasture irrigation from bores commences 5.8 kilometres east of the LEIP (Figure 63) where centre pivot irrigation is visible.

Page 117 of 149
Murtha and Crack (1966) inspected bore logs across the entire LEIP which showed parts of the alluvial plain are “underlain by 20 to 30 ft of stratified sediments which in turn overlie deeply weathered granite.” The bore logs also confirmed that granites were the underlying geological formation, which would also be the lower limit of groundwater resources. Fresh granite was not encountered until 21 m to 23 m depth. However, in several bores the granites were generally closer to the surface.
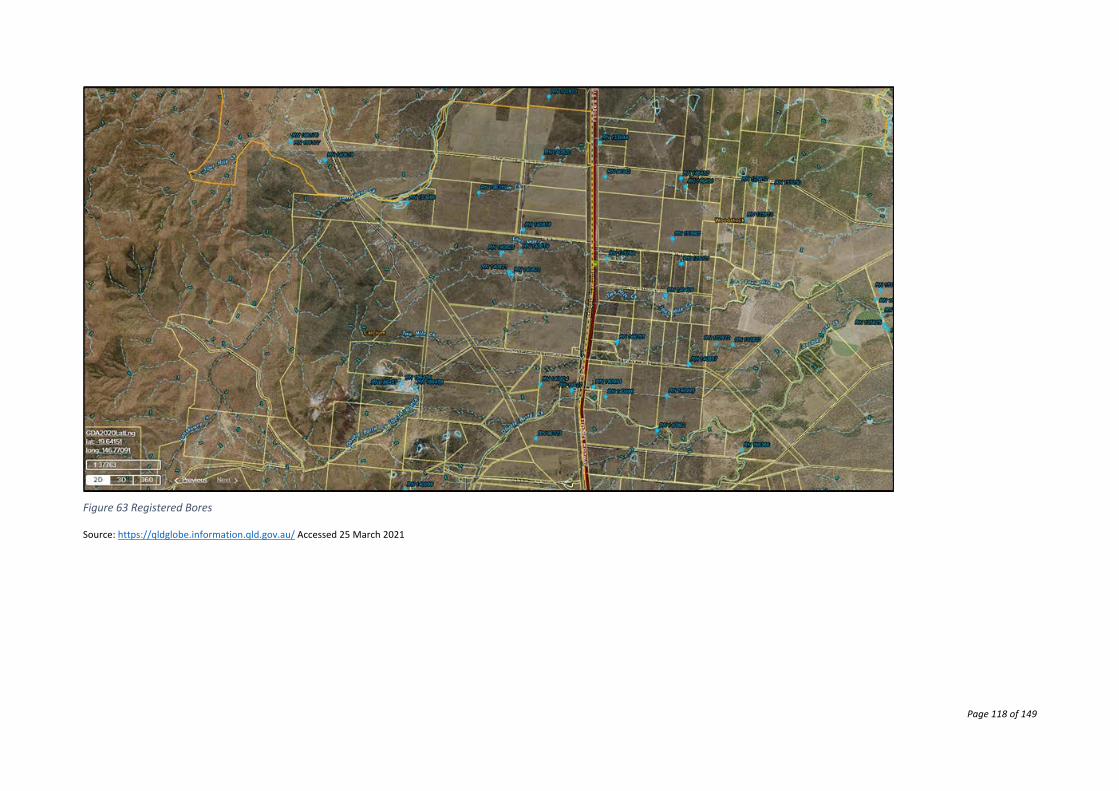
Page 118 of 149
Figure 63 Registered Bores
Source: https://qldglobe.information.qld.gov.au/ Accessed 25 March 2021
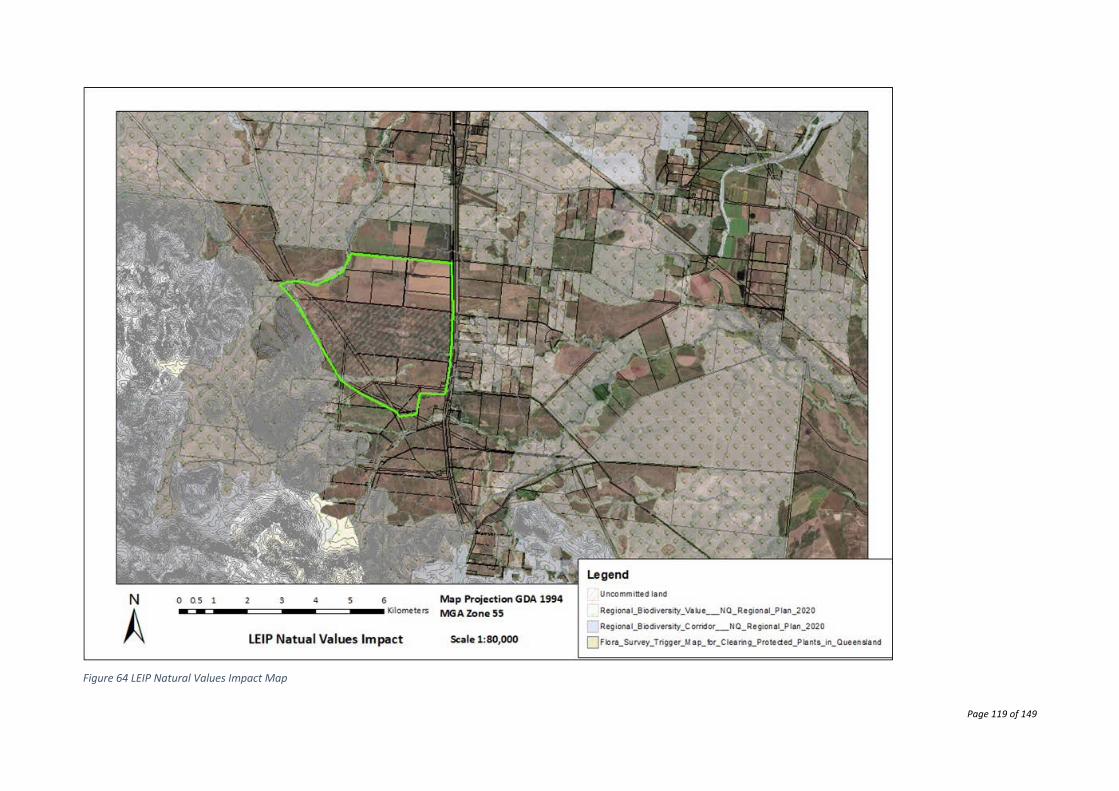
Page 119 of 149
Figure 64 LEIP Natural Values Impact Map
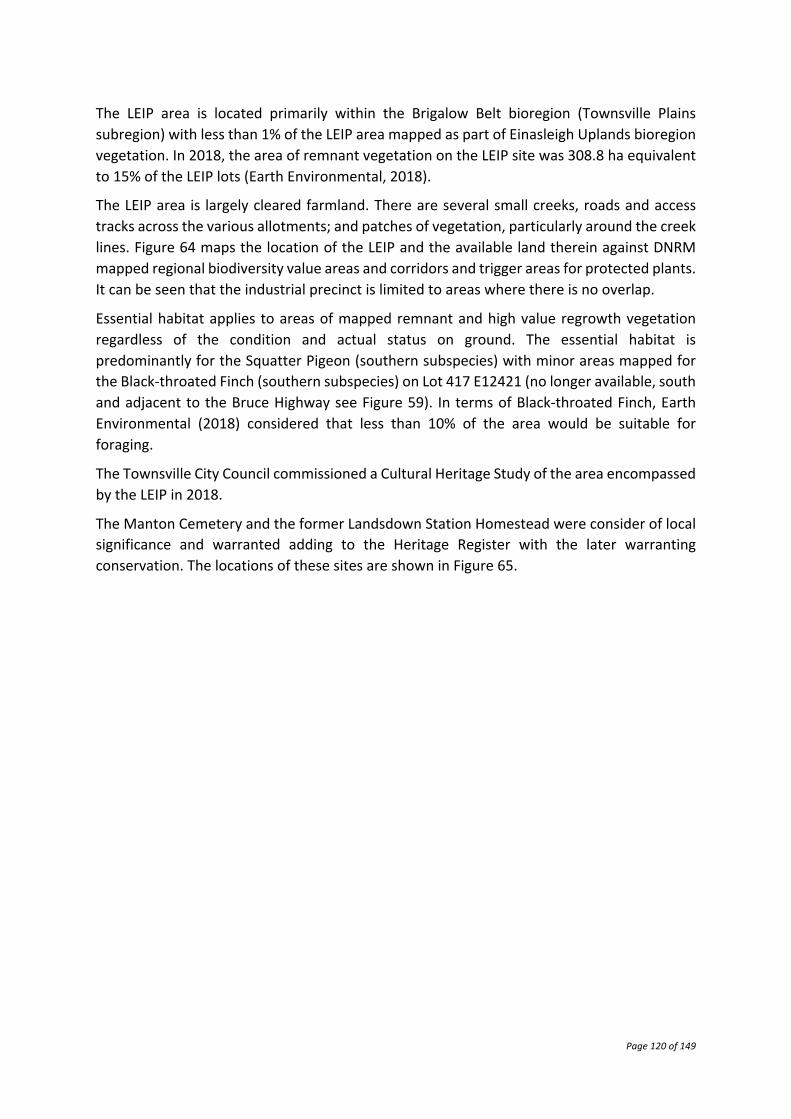
Page 120 of 149
The LEIP area is located primarily within the Brigalow Belt bioregion (Townsville Plains subregion) with less than 1% of the LEIP area mapped as part of Einasleigh Uplands bioregion vegetation. In 2018, the area of remnant vegetation on the LEIP site was 308.8 ha equivalent to 15% of the LEIP lots (Earth Environmental, 2018).
The LEIP area is largely cleared farmland. There are several small creeks, roads and access tracks across the various allotments; and patches of vegetation, particularly around the creek lines. Figure 64 maps the location of the LEIP and the available land therein against DNRM mapped regional biodiversity value areas and corridors and trigger areas for protected plants. It can be seen that the industrial precinct is limited to areas where there is no overlap.
Essential habitat applies to areas of mapped remnant and high value regrowth vegetation regardless of the condition and actual status on ground. The essential habitat is predominantly for the Squatter Pigeon (southern subspecies) with minor areas mapped for the Black-throated Finch (southern subspecies) on Lot 417 E12421 (no longer available, south and adjacent to the Bruce Highway see Figure 59). In terms of Black-throated Finch, Earth Environmental (2018) considered that less than 10% of the area would be suitable for foraging.
The Townsville City Council commissioned a Cultural Heritage Study of the area encompassed by the LEIP in 2018.
The Manton Cemetery and the former Landsdown Station Homestead were consider of local significance and warranted adding to the Heritage Register with the later warranting conservation. The locations of these sites are shown in Figure 65.
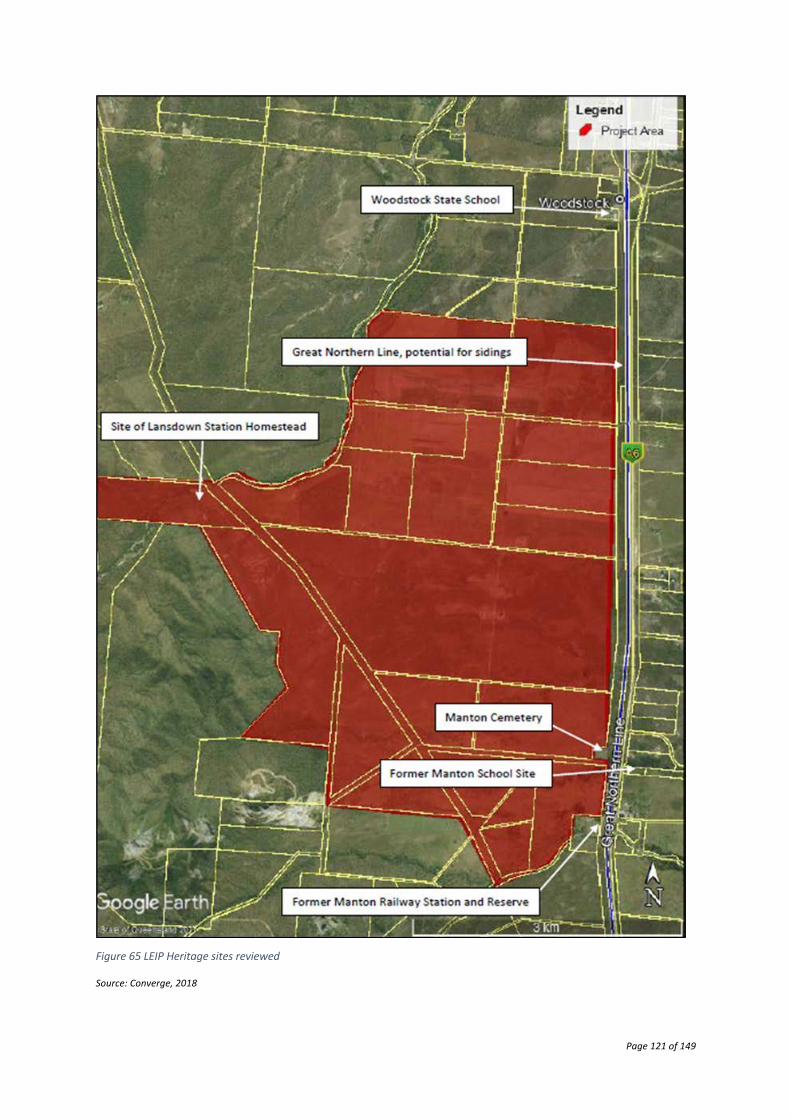
Page 121 of 149
Figure 65 LEIP Heritage sites reviewed
Source: Converge, 2018
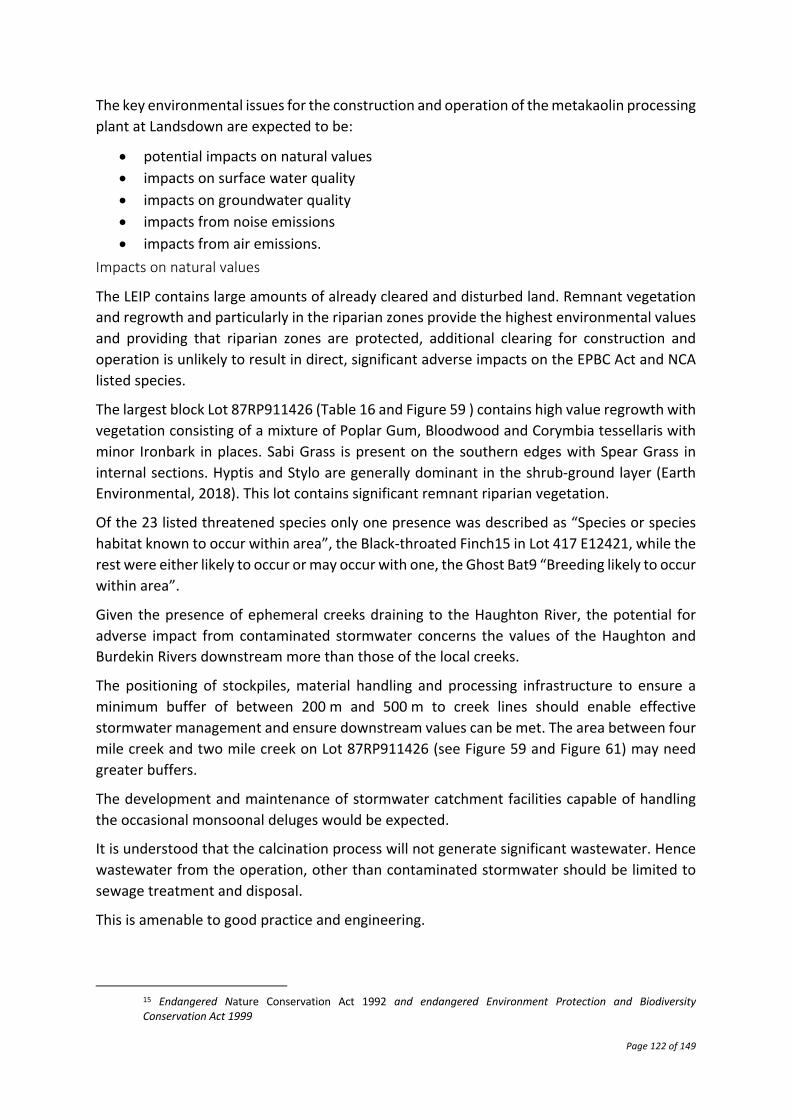
Page 122 of 149
The key environmental issues for the construction and operation of the metakaolin processing plant at Landsdown are expected to be:
• potential impacts on natural values • impacts on surface water quality • impacts on groundwater quality • impacts from noise emissions • impacts from air emissions.
Impacts on natural values
The LEIP contains large amounts of already cleared and disturbed land. Remnant vegetation and regrowth and particularly in the riparian zones provide the highest environmental values and providing that riparian zones are protected, additional clearing for construction and operation is unlikely to result in direct, significant adverse impacts on the EPBC Act and NCA listed species.
The largest block Lot 87RP911426 (Table 16 and Figure 59 ) contains high value regrowth with vegetation consisting of a mixture of Poplar Gum, Bloodwood and Corymbia tessellaris with minor Ironbark in places. Sabi Grass is present on the southern edges with Spear Grass in internal sections. Hyptis and Stylo are generally dominant in the shrub-ground layer (Earth Environmental, 2018). This lot contains significant remnant riparian vegetation.
Of the 23 listed threatened species only one presence was described as “Species or species habitat known to occur within area”, the Black-throated Finch15 in Lot 417 E12421, while the rest were either likely to occur or may occur with one, the Ghost Bat9 “Breeding likely to occur within area”.
Given the presence of ephemeral creeks draining to the Haughton River, the potential for adverse impact from contaminated stormwater concerns the values of the Haughton and Burdekin Rivers downstream more than those of the local creeks.
The positioning of stockpiles, material handling and processing infrastructure to ensure a minimum buffer of between 200 m and 500 m to creek lines should enable effective stormwater management and ensure downstream values can be met. The area between four mile creek and two mile creek on Lot 87RP911426 (see Figure 59 and Figure 61) may need greater buffers.
The development and maintenance of stormwater catchment facilities capable of handling the occasional monsoonal deluges would be expected.
It is understood that the calcination process will not generate significant wastewater. Hence wastewater from the operation, other than contaminated stormwater should be limited to sewage treatment and disposal.
This is amenable to good practice and engineering.
15 Endangered Nature Conservation Act 1992 and endangered Environment Protection and Biodiversity Conservation Act 1999
Page 123 of 149
The potential for groundwater water quality impacts from the processing activities is low and relates mainly to the potential for infiltration from fuel, hydrocarbon and hazardous chemical spills. Given the local topography and the influence of local creeks on groundwater quality, effective stormwater and wastewater management will also prevent adverse impacts on groundwater values.
The processing component of the project has the potential to generate external noise emissions from material movements (loaders, stockpiles etc.) and the use of forklifts and day-to-day truck deliveries or product sales off site. Internal noise sources will include conveyors, pipes, fans, pumps, blower motors, steam relief valves, screening, grinding and general product movements. Maintenance activities such as fabrication will also create significant noise sources during operations.
The closest noise-sensitive receptors at the Woodstock State School are between 4,746 m and 6,271 m away from prospective lots (Table 16). Lot 87RP911426 is the closest at 4,746 m and has been used to develop a desktop model of noise impact. This indicated that noise emissions from the operation should have attenuated to less than 22 dB(A) at the Woodstock State School. This would be below the background noise which would be mainly highway traffic at night. With good acoustic engineering the operation should be virtually inaudible at sensitive receptors.
Sources of dust emissions will include road dust, material movements to and from stockpiles, and material movement at stock bins, feeders and crushers. These will need to be mitigated with dust control design and practice. Dust collectors will need to be installed at each external drop points or chutes.
Queensland’s Environmental Protection (Air) Policy 2008 (Air EPP) establishes long-term objectives for pollutants emitted into the atmosphere. Decisions regarding conditions of approval for environmentally-relevant activities (ERAs) must consider these objectives. Proposals for new ERAs will require atmospheric dispersion modelling to determine the potential impact of air emissions. These standards are designed to protect sensitive members of the community, such as children and asthmatics, hence modelling would need to demonstrate that the objectives would be met at the Woodstock State School.
The principal air pollutants managed by the Air EPP are sulfur dioxide, nitrogen dioxide, particulates, lead and a number of air toxics.
Sulfur dioxide
The ore is low in sulfur When combined with the combustion of low S natural gas little sulfur dioxide generation is expected.
The recommended air quality standards for sulfur dioxide are:
• 0.20 parts per million (ppm) for a 1-hour exposure period • 0.08 ppm for a 24-hour exposure period • 0.02 ppm for an annual exposure period.
Page 124 of 149
Nitrogen dioxide
The low temperature of combustion is unlikely to generate significant quantities of thermal nitrogen dioxide.
The recommended air quality standards for nitrogen dioxide are:
• 0.12 parts per million (ppm) for a 1-hour exposure period • 0.03 ppm for an annual exposure period.
Particulates
Particulates will be produced from material movement and combustion. These should be easily controlled through best practice engineering, design of control mechanisms and distance to receptors.
The recommended air quality standards for PM2.5 are:
• 25 micrograms per cubic metre (µg/m3) for a 24-hour exposure period • µg/m3 for an annual exposure period.
The recommended air quality standards for PM10 are:
• 50 micrograms per cubic metre (µg/m3) for a 24-hour exposure period • 25 µg/m3 for an annual exposure period.
The recommended air quality goal for Total Suspended Particulates for protection of human health is 90 micrograms per cubic metre for an annual exposure period.
The LEIP, owned and operated by the Townsville City Council, was approved by the Department of State Development, Infrastructure, Local Government and Planning in 2020. It has not been developed with infrastructure or facilities. The Townsville City Council is seeking $50 million in funding from the Queensland and Australian Governments to get the site investment-ready, and to expedite the establishment by proponents.
Several companies have committed to the site however none of these projects is fully funded or development approved.
The LEIP contains large amounts of already cleared and disturbed land. Remnant vegetation and regrowth and particularly in the riparian zones provide the highest environmental values and providing that riparian zones are protected, additional clearing for construction and operation is unlikely to result in direct, significant adverse impacts on the EPBC Act and NCA listed species.
Ecological surveys will need to be undertaken to establish that the proposed development will not significant impact on breeding sites for the ghost bat or habitat for the Black–throated finch. The latter in Lot 417 E12421.
The hills and slopes in the eastern resource zone provide remnant vegetation and regrowth areas which may contain natural values worthy of protection. Surveys would be required to assess these areas before proceeding with development plans.
Page 125 of 149
The closest noise-sensitive receptors at the Woodstock State School are between 4,746 m and 6,271 m away from prospective lots. The desktop modelled noise impact of operational noise from Lot 87RP911426 would be below the background noise which would be mainly highway traffic at night, at sensitive receptors. With good acoustic engineering the operation should be virtually inaudible at sensitive receptors.
Proposals for new ERAs will require atmospheric dispersion modelling to determine the potential impact of air emissions. The ore is low in sulfur. When combined with the combustion of low sulfur natural gas, little sulfur dioxide generation is expected. The low temperature of combustion is unlikely to generate significant quantities of thermal nitrogen dioxide. Particulates will be produced from material movement and combustion. These should be easily controlled through best practice engineering, design of control mechanisms and distance to receptors.
The Townsville City Council has funded environmental assessments to inform the site’s environmental values. These suggest that of the non-committed lots, the largest Lot 87RP911426 may be best avoided due to the potential for adverse impacts on riparian zones and remnant vegetation.
21. Capital and Operating Costs Capital and operating costs provided in this report are for the demonstration plant and are based on benchmark data from similar projects. Consequently, they are not considered reliable for forecasting and project valuation other than to indicate a potential outcome.
a) Capital Costs
The demonstration plant capital costs were based on mining of the kaolin material at Surprise and coarse dry screening at the mine site to minimise site-related costs. The product transported to the Townsville site for processing would typically be 50% silica and 50% kaolin with a high separation efficiency at 45 microns due to the very fine nature of the kaolinite clays.
As a result, site capital costs are limited to infrastructure as all site works will be conducted on a contract basis.
Key elements of the Townsville demonstration plant are:
• Material receival and storage • Attritioning • Screening • Cycloning • Kaolin dewatering (thickening and filtration) • Kaolin drying • Kaolin packaging (for kaolin sales) • Kaolin calcination • Metakaolin product handling • Silica sand product handling
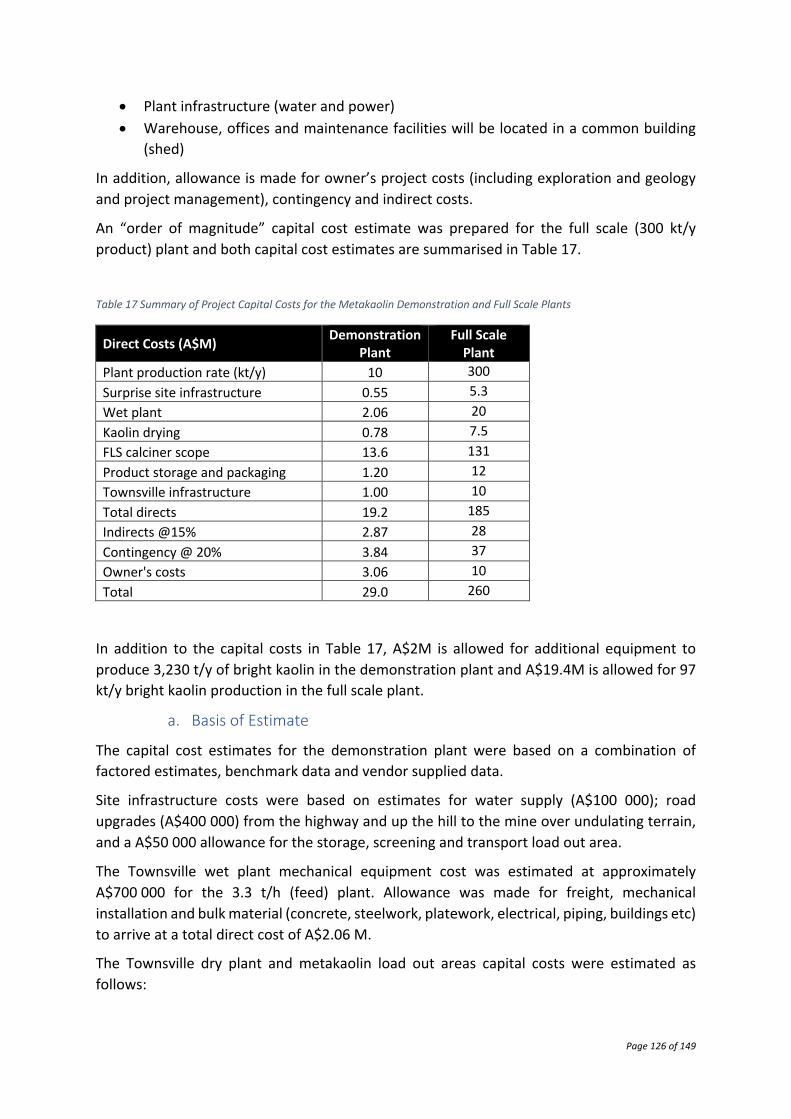
Page 126 of 149
• Plant infrastructure (water and power) • Warehouse, offices and maintenance facilities will be located in a common building
(shed)
In addition, allowance is made for owner’s project costs (including exploration and geology and project management), contingency and indirect costs.
An “order of magnitude” capital cost estimate was prepared for the full scale (300 kt/y product) plant and both capital cost estimates are summarised in Table 17.
Table 17 Summary of Project Capital Costs for the Metakaolin Demonstration and Full Scale Plants
Direct Costs (A$M) Demonstration Plant
Full Scale Plant
Plant production rate (kt/y) 10 300 Surprise site infrastructure 0.55 5.3 Wet plant 2.06 20 Kaolin drying 0.78 7.5 FLS calciner scope 13.6 131 Product storage and packaging 1.20 12 Townsville infrastructure 1.00 10 Total directs 19.2 185 Indirects @15% 2.87 28 Contingency @ 20% 3.84 37 Owner's costs 3.06 10 Total 29.0 260
In addition to the capital costs in Table 17, A$2M is allowed for additional equipment to produce 3,230 t/y of bright kaolin in the demonstration plant and A$19.4M is allowed for 97 kt/y bright kaolin production in the full scale plant.
a. Basis of Estimate
The capital cost estimates for the demonstration plant were based on a combination of factored estimates, benchmark data and vendor supplied data.
Site infrastructure costs were based on estimates for water supply (A$100 000); road upgrades (A$400 000) from the highway and up the hill to the mine over undulating terrain, and a A$50 000 allowance for the storage, screening and transport load out area.
The Townsville wet plant mechanical equipment cost was estimated at approximately A$700 000 for the 3.3 t/h (feed) plant. Allowance was made for freight, mechanical installation and bulk material (concrete, steelwork, platework, electrical, piping, buildings etc) to arrive at a total direct cost of A$2.06 M.
The Townsville dry plant and metakaolin load out areas capital costs were estimated as follows:
Page 127 of 149
• Kaolin cake drying at about 1.2 t/h in a rotary dryer was estimated separately albeit that this unit will ultimately be part of the gas suspension calciner package at A$780 000.
• The equipment cost for the gas suspension calciner was supplied by FLS at US$3.6M for the calciner; US$400 000 for the refractory lining and US$420 000 for the control system. The total installed cost of the calciner was estimated by factoring at A$13.5M.
• Calcined product storage and packaging was estimated at A$1.2M. • An allowance was made for Townsville infrastructure including buildings, water and
power at A$1M.
Indirect costs (project management and engineering) were factored at 15% of direct costs. A 20% contingency was allowed, Owner’s costs were estimated at A$3.06 M and approximately A$1.6M was included for the planned exploration and geology program.
Order of magnitude capital costs for the full scale plant were:
• Scaled from the pilot plant capital costs • Based on data provided by FLS • Factored from estimates of equipment costs, or • Factored from direct costs (for indirect costs, Owner’s costs and contingency).
b. Proposed Short Term Programs and Expenditure
An A$2.3 million work program is being developed across the aforementioned mining tenements until the end of 2022 in order to advance the exploration for mineable deposits and comply with tenement work commitments. Approximately A$1.3 million of this cost is attributed to the kaolin potential of the area. The remainder is focused on gold exploration.
The program includes: • Mapping, drilling, bulk sampling and metallurgical testing of the kaolin deposits. • Application for a mining lease over Brandy Creek. • Resource drilling and sampling of the Brilliant Brumby Line, Brandy Creek and High
Ridge prospects. • Field exploration to locate the sources of the anomalous stream sediment gold
particularly at Mundic Breccia.
The exploration programs are designed to outline, delineate high grade kaolinized granite resources, and to continue the exploration and delineation of high-grade gold. They will also comply with the 2021 approved work programs and tenure commitments.
Specific programs proposed include: • the drilling of 49 holes totalling 2,000 m, • almost 200 line-km of geophysical surveys, • 50 line-km of remote sensing survey, • topographic mapping of proposed development sites, • geological mapping and reconnaissance totalling 50 days,
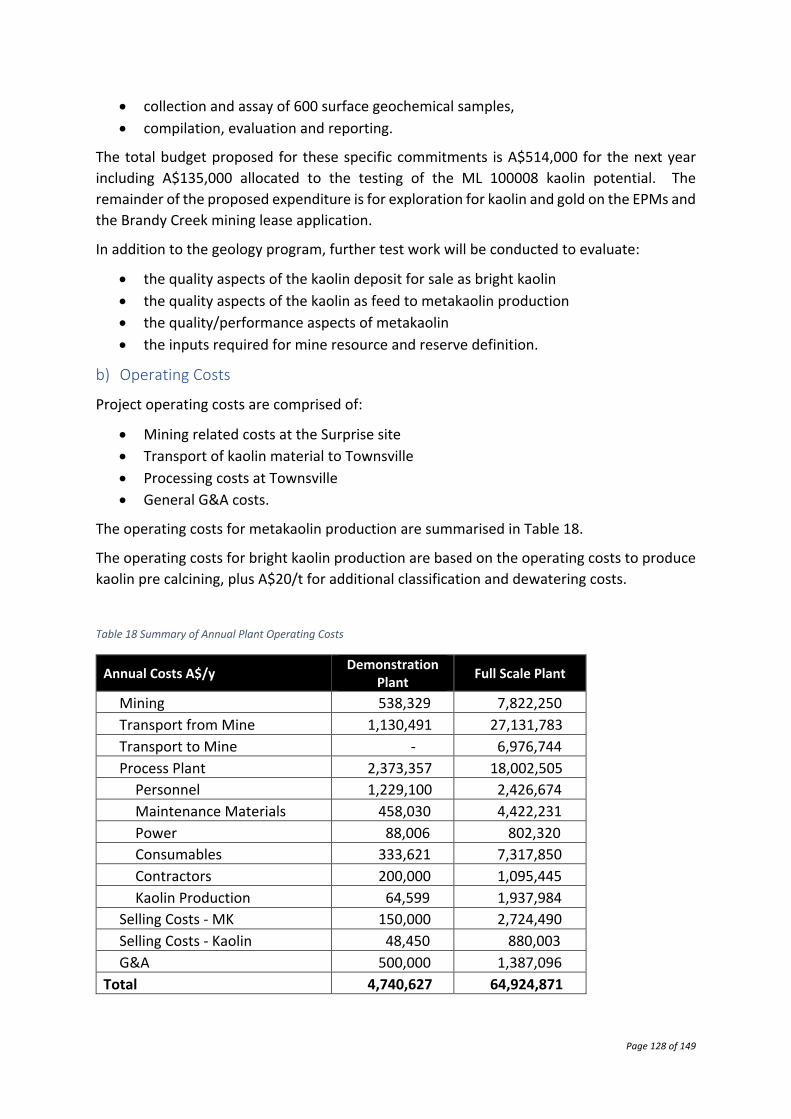
Page 128 of 149
• collection and assay of 600 surface geochemical samples, • compilation, evaluation and reporting.
The total budget proposed for these specific commitments is A$514,000 for the next year including A$135,000 allocated to the testing of the ML 100008 kaolin potential. The remainder of the proposed expenditure is for exploration for kaolin and gold on the EPMs and the Brandy Creek mining lease application.
In addition to the geology program, further test work will be conducted to evaluate:
• the quality aspects of the kaolin deposit for sale as bright kaolin • the quality aspects of the kaolin as feed to metakaolin production • the quality/performance aspects of metakaolin • the inputs required for mine resource and reserve definition.
b) Operating Costs
Project operating costs are comprised of:
• Mining related costs at the Surprise site • Transport of kaolin material to Townsville • Processing costs at Townsville • General G&A costs.
The operating costs for metakaolin production are summarised in Table 18.
The operating costs for bright kaolin production are based on the operating costs to produce kaolin pre calcining, plus A$20/t for additional classification and dewatering costs.
Table 18 Summary of Annual Plant Operating Costs
Annual Costs A$/y Demonstration Plant Full Scale Plant
Mining 538,329 7,822,250 Transport from Mine 1,130,491 27,131,783 Transport to Mine - 6,976,744 Process Plant 2,373,357 18,002,505
Personnel 1,229,100 2,426,674 Maintenance Materials 458,030 4,422,231 Power 88,006 802,320 Consumables 333,621 7,317,850 Contractors 200,000 1,095,445 Kaolin Production 64,599 1,937,984
Selling Costs - MK 150,000 2,724,490 Selling Costs - Kaolin 48,450 880,003 G&A 500,000 1,387,096
Total 4,740,627 64,924,871
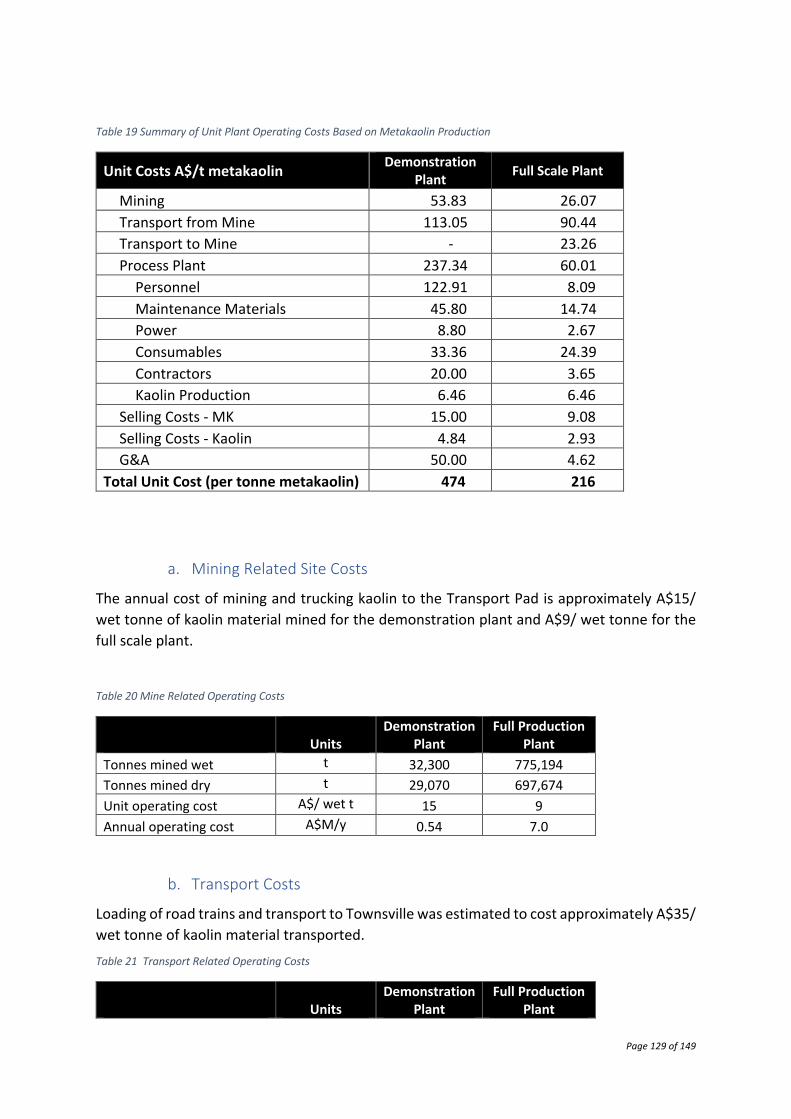
Page 129 of 149
Table 19 Summary of Unit Plant Operating Costs Based on Metakaolin Production
Unit Costs A$/t metakaolin Demonstration Plant Full Scale Plant
Mining 53.83 26.07 Transport from Mine 113.05 90.44 Transport to Mine - 23.26 Process Plant 237.34 60.01
Personnel 122.91 8.09 Maintenance Materials 45.80 14.74 Power 8.80 2.67 Consumables 33.36 24.39 Contractors 20.00 3.65 Kaolin Production 6.46 6.46
Selling Costs - MK 15.00 9.08 Selling Costs - Kaolin 4.84 2.93 G&A 50.00 4.62
Total Unit Cost (per tonne metakaolin) 474 216
a. Mining Related Site Costs
The annual cost of mining and trucking kaolin to the Transport Pad is approximately A$15/ wet tonne of kaolin material mined for the demonstration plant and A$9/ wet tonne for the full scale plant.
Table 20 Mine Related Operating Costs
Units Demonstration
Plant Full Production
Plant Tonnes mined wet t 32,300 775,194 Tonnes mined dry t 29,070 697,674 Unit operating cost A$/ wet t 15 9 Annual operating cost A$M/y 0.54 7.0
b. Transport Costs
Loading of road trains and transport to Townsville was estimated to cost approximately A$35/ wet tonne of kaolin material transported.
Table 21 Transport Related Operating Costs
Units Demonstration
Plant Full Production
Plant
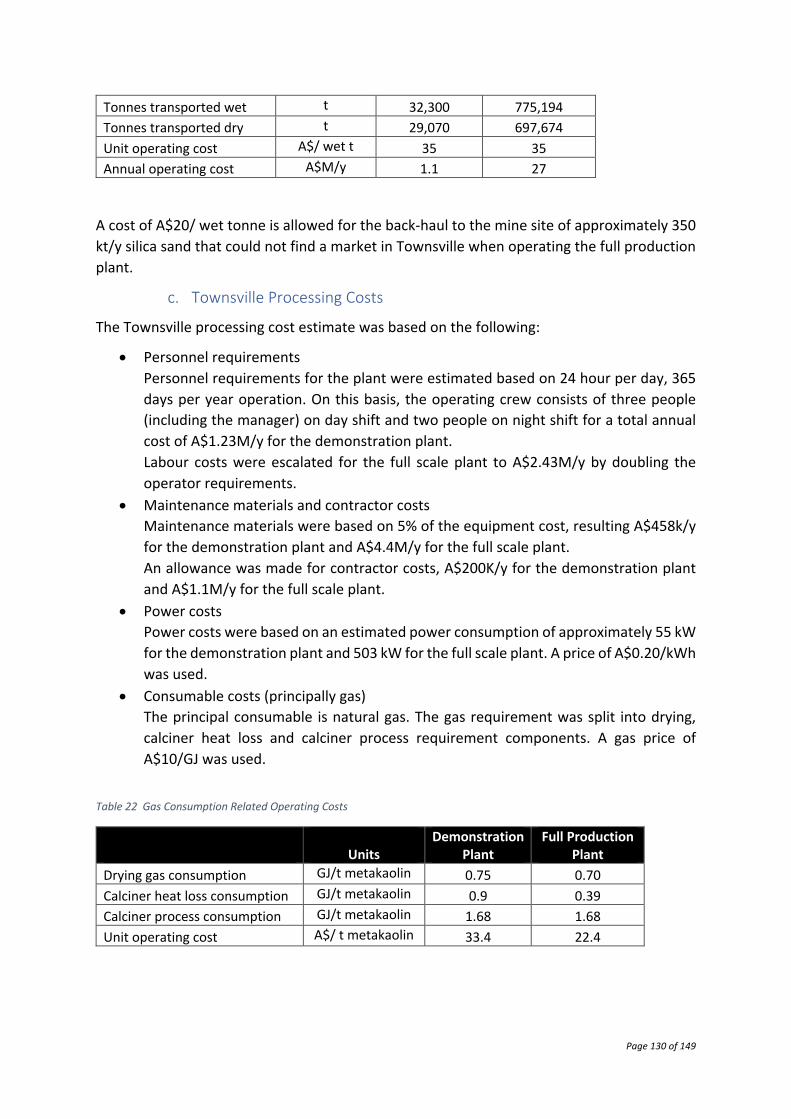
Page 130 of 149
Tonnes transported wet t 32,300 775,194 Tonnes transported dry t 29,070 697,674 Unit operating cost A$/ wet t 35 35 Annual operating cost A$M/y 1.1 27
A cost of A$20/ wet tonne is allowed for the back-haul to the mine site of approximately 350 kt/y silica sand that could not find a market in Townsville when operating the full production plant.
c. Townsville Processing Costs
The Townsville processing cost estimate was based on the following:
• Personnel requirements Personnel requirements for the plant were estimated based on 24 hour per day, 365 days per year operation. On this basis, the operating crew consists of three people (including the manager) on day shift and two people on night shift for a total annual cost of A$1.23M/y for the demonstration plant. Labour costs were escalated for the full scale plant to A$2.43M/y by doubling the operator requirements.
• Maintenance materials and contractor costs Maintenance materials were based on 5% of the equipment cost, resulting A$458k/y for the demonstration plant and A$4.4M/y for the full scale plant. An allowance was made for contractor costs, A$200K/y for the demonstration plant and A$1.1M/y for the full scale plant.
• Power costs Power costs were based on an estimated power consumption of approximately 55 kW for the demonstration plant and 503 kW for the full scale plant. A price of A$0.20/kWh was used.
• Consumable costs (principally gas) The principal consumable is natural gas. The gas requirement was split into drying, calciner heat loss and calciner process requirement components. A gas price of A$10/GJ was used.
Table 22 Gas Consumption Related Operating Costs
Units Demonstration
Plant Full Production
Plant Drying gas consumption GJ/t metakaolin 0.75 0.70 Calciner heat loss consumption GJ/t metakaolin 0.9 0.39 Calciner process consumption GJ/t metakaolin 1.68 1.68 Unit operating cost A$/ t metakaolin 33.4 22.4
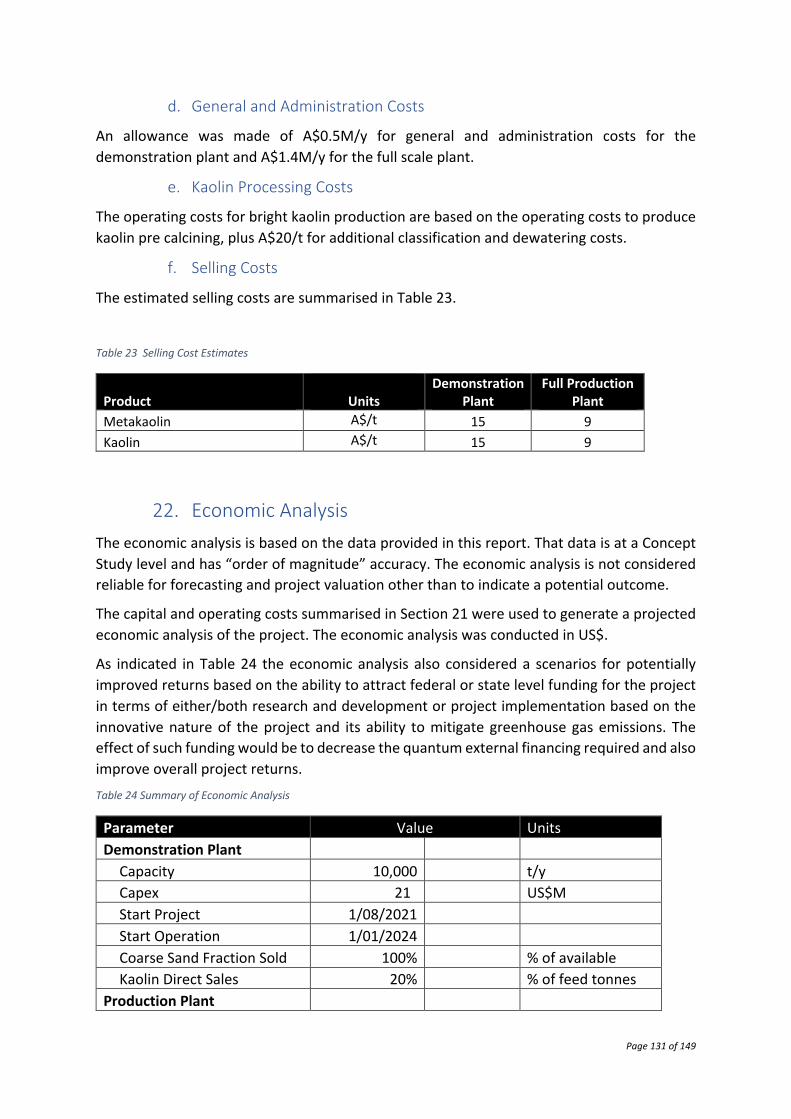
Page 131 of 149
d. General and Administration Costs
An allowance was made of A$0.5M/y for general and administration costs for the demonstration plant and A$1.4M/y for the full scale plant.
e. Kaolin Processing Costs
The operating costs for bright kaolin production are based on the operating costs to produce kaolin pre calcining, plus A$20/t for additional classification and dewatering costs.
f. Selling Costs
The estimated selling costs are summarised in Table 23.
Table 23 Selling Cost Estimates
Product
Units Demonstration
Plant Full Production
Plant Metakaolin A$/t 15 9 Kaolin A$/t 15 9
22. Economic Analysis The economic analysis is based on the data provided in this report. That data is at a Concept Study level and has “order of magnitude” accuracy. The economic analysis is not considered reliable for forecasting and project valuation other than to indicate a potential outcome.
The capital and operating costs summarised in Section 21 were used to generate a projected economic analysis of the project. The economic analysis was conducted in US$.
As indicated in Table 24 the economic analysis also considered a scenarios for potentially improved returns based on the ability to attract federal or state level funding for the project in terms of either/both research and development or project implementation based on the innovative nature of the project and its ability to mitigate greenhouse gas emissions. The effect of such funding would be to decrease the quantum external financing required and also improve overall project returns.
Table 24 Summary of Economic Analysis
Parameter Value Units Demonstration Plant
Capacity 10,000 t/y Capex 21 US$M Start Project 1/08/2021 Start Operation 1/01/2024 Coarse Sand Fraction Sold 100% % of available Kaolin Direct Sales 20% % of feed tonnes
Production Plant
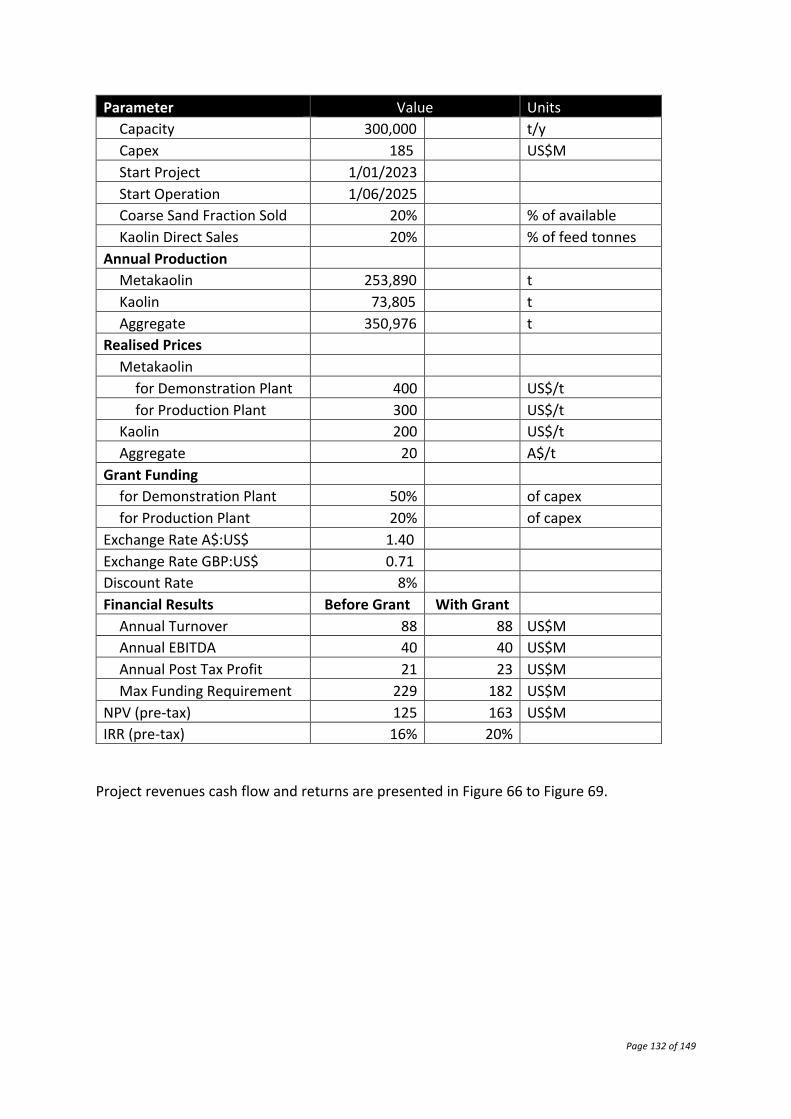
Page 132 of 149
Parameter Value Units Capacity 300,000 t/y Capex 185 US$M Start Project 1/01/2023 Start Operation 1/06/2025 Coarse Sand Fraction Sold 20% % of available Kaolin Direct Sales 20% % of feed tonnes
Annual Production Metakaolin 253,890 t Kaolin 73,805 t Aggregate 350,976 t
Realised Prices Metakaolin
for Demonstration Plant 400 US$/t for Production Plant 300 US$/t
Kaolin 200 US$/t Aggregate 20 A$/t
Grant Funding for Demonstration Plant 50% of capex for Production Plant 20% of capex
Exchange Rate A$:US$ 1.40 Exchange Rate GBP:US$ 0.71 Discount Rate 8% Financial Results Before Grant With Grant
Annual Turnover 88 88 US$M Annual EBITDA 40 40 US$M Annual Post Tax Profit 21 23 US$M Max Funding Requirement 229 182 US$M
NPV (pre-tax) 125 163 US$M IRR (pre-tax) 16% 20%
Project revenues cash flow and returns are presented in Figure 66 to Figure 69.

Page 133 of 149
Figure 66 Project Revenues Based on Metakaolin (MK), Kaolin and Aggregate (Sand)
Figure 67 Projected Project Cash Flow
-
20
40
60
80
100
120
20222023
20242025
20262027
20282029
20302031
20322033
20342035
20362037
20382039
20402041
20422043
2044
US$
Mill
ion
MK Revenues Kaolin Revenues Aggregate Revenues
(300)
(200)
(100)
-
100
200
300
400
500
600
20212022
20232024
20252026
20272028
20292030
20312032
20332034
20352036
20372038
20392040
20412042
20432044
US$
Mill
ion
Cumulative Cash Flow After Tax Cash Flow After Tax
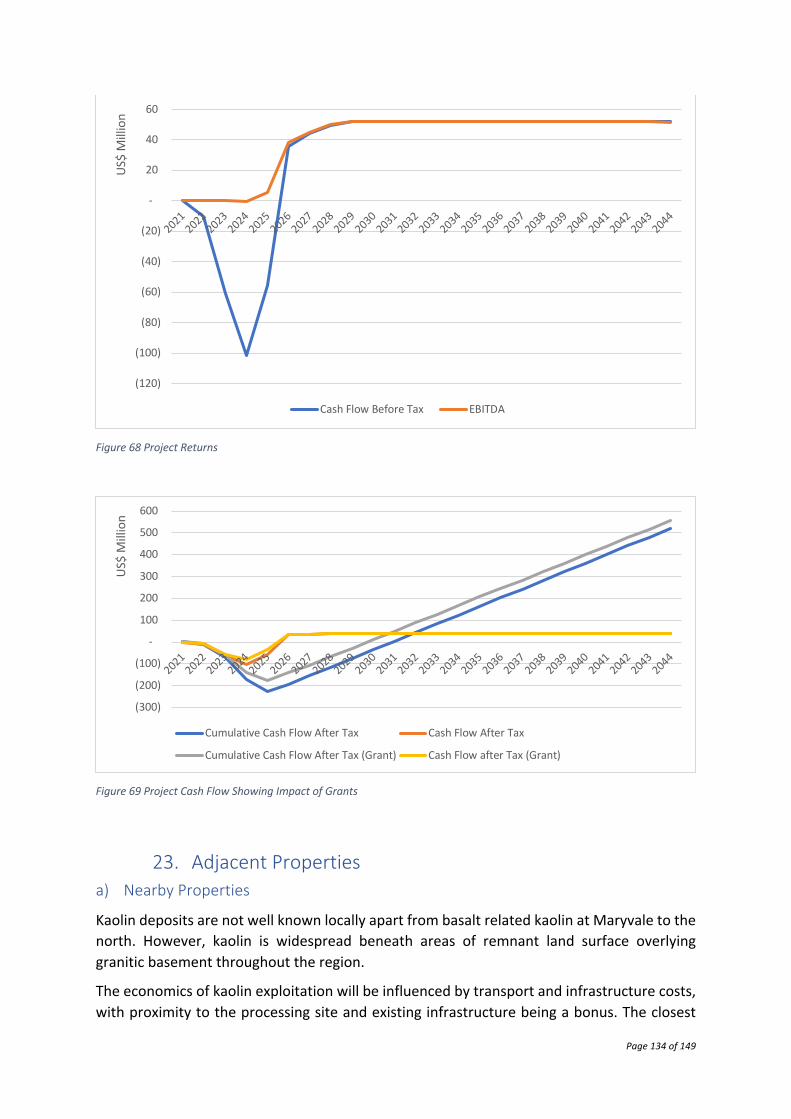
Page 134 of 149
Figure 68 Project Returns
Figure 69 Project Cash Flow Showing Impact of Grants
23. Adjacent Properties a) Nearby Properties
Kaolin deposits are not well known locally apart from basalt related kaolin at Maryvale to the north. However, kaolin is widespread beneath areas of remnant land surface overlying granitic basement throughout the region.
The economics of kaolin exploitation will be influenced by transport and infrastructure costs, with proximity to the processing site and existing infrastructure being a bonus. The closest
(120)
(100)
(80)
(60)
(40)
(20)
-
20
40
60
20212022
20232024
20252026
20272028
20292030
20312032
20332034
20352036
20372038
20392040
20412042
20432044
US$
Mill
ion
Cash Flow Before Tax EBITDA
(300)
(200)
(100)
-
100
200
300
400
500
600
20212022
20232024
20252026
20272028
20292030
20312032
20332034
20352036
20372038
20392040
20412042
20432044
US$
Mill
ion
Cumulative Cash Flow After Tax Cash Flow After Tax
Cumulative Cash Flow After Tax (Grant) Cash Flow after Tax (Grant)
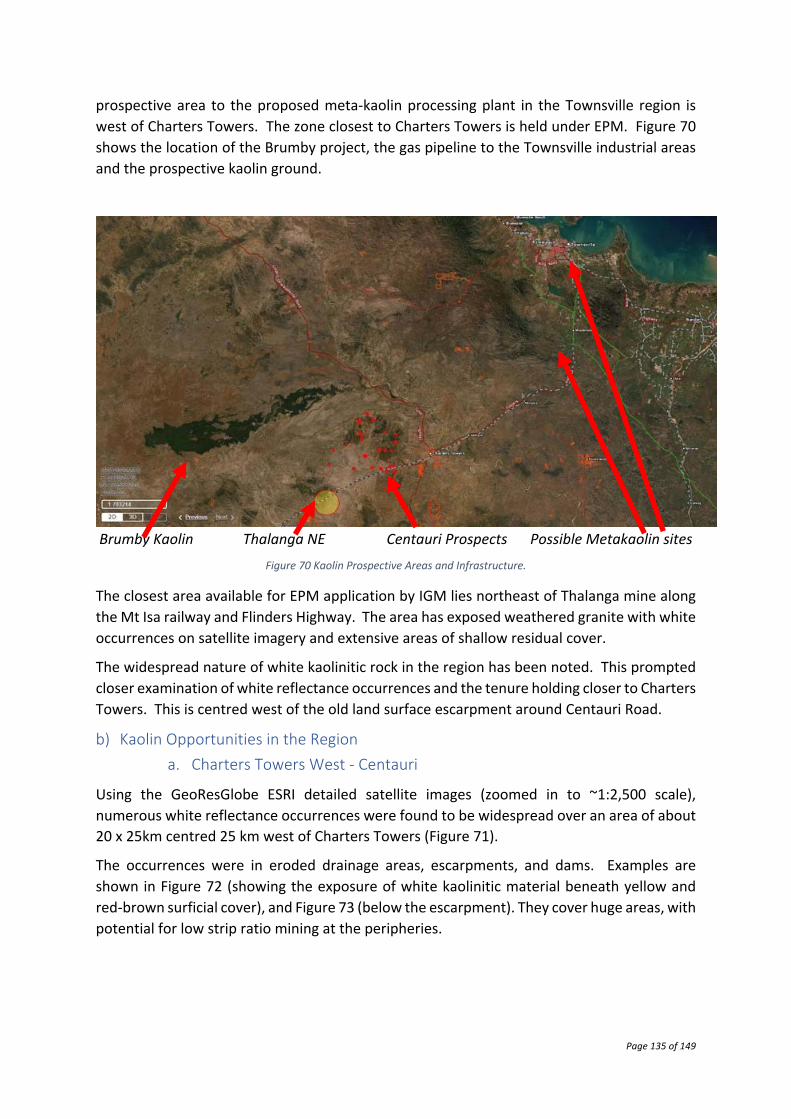
Page 135 of 149
prospective area to the proposed meta-kaolin processing plant in the Townsville region is west of Charters Towers. The zone closest to Charters Towers is held under EPM. Figure 70 shows the location of the Brumby project, the gas pipeline to the Townsville industrial areas and the prospective kaolin ground.
Brumby Kaolin Thalanga NE Centauri Prospects Possible Metakaolin sites
Figure 70 Kaolin Prospective Areas and Infrastructure.
The closest area available for EPM application by IGM lies northeast of Thalanga mine along the Mt Isa railway and Flinders Highway. The area has exposed weathered granite with white occurrences on satellite imagery and extensive areas of shallow residual cover.
The widespread nature of white kaolinitic rock in the region has been noted. This prompted closer examination of white reflectance occurrences and the tenure holding closer to Charters Towers. This is centred west of the old land surface escarpment around Centauri Road.
b) Kaolin Opportunities in the Region
a. Charters Towers West - Centauri
Using the GeoResGlobe ESRI detailed satellite images (zoomed in to ~1:2,500 scale), numerous white reflectance occurrences were found to be widespread over an area of about 20 x 25km centred 25 km west of Charters Towers (Figure 71).
The occurrences were in eroded drainage areas, escarpments, and dams. Examples are shown in Figure 72 (showing the exposure of white kaolinitic material beneath yellow and red-brown surficial cover), and Figure 73 (below the escarpment). They cover huge areas, with potential for low strip ratio mining at the peripheries.
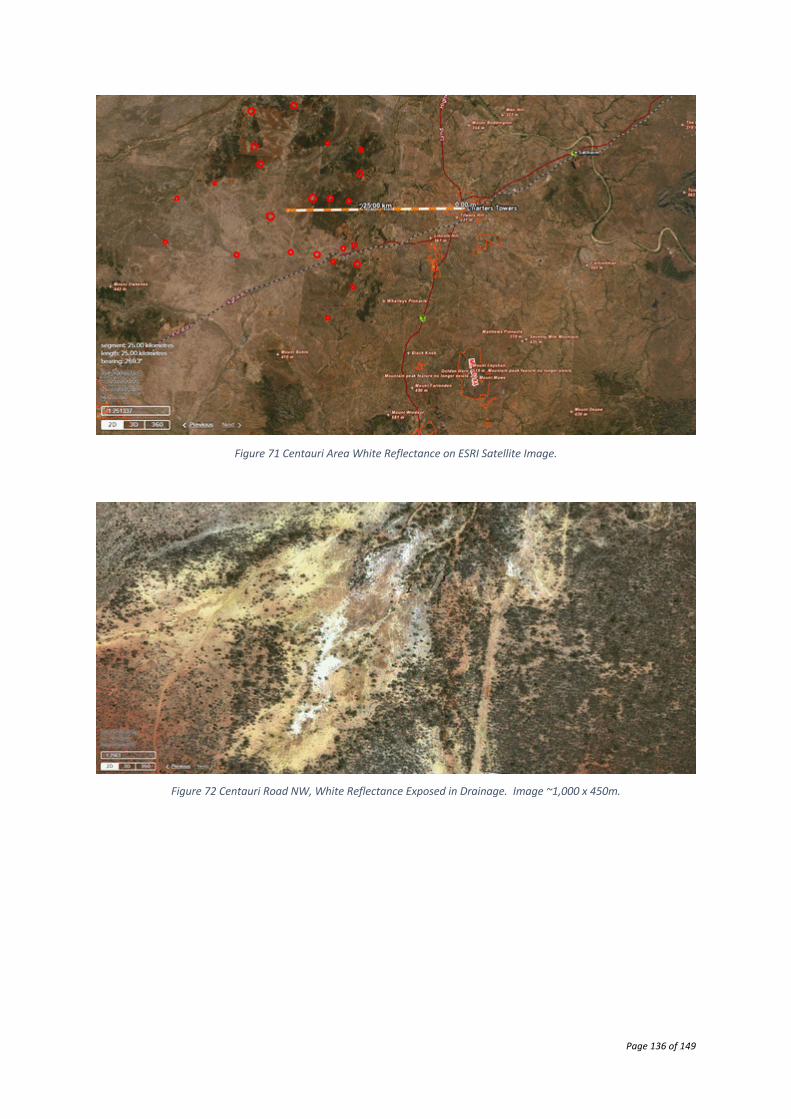
Page 136 of 149
Figure 71 Centauri Area White Reflectance on ESRI Satellite Image.
Figure 72 Centauri Road NW, White Reflectance Exposed in Drainage. Image ~1,000 x 450m.
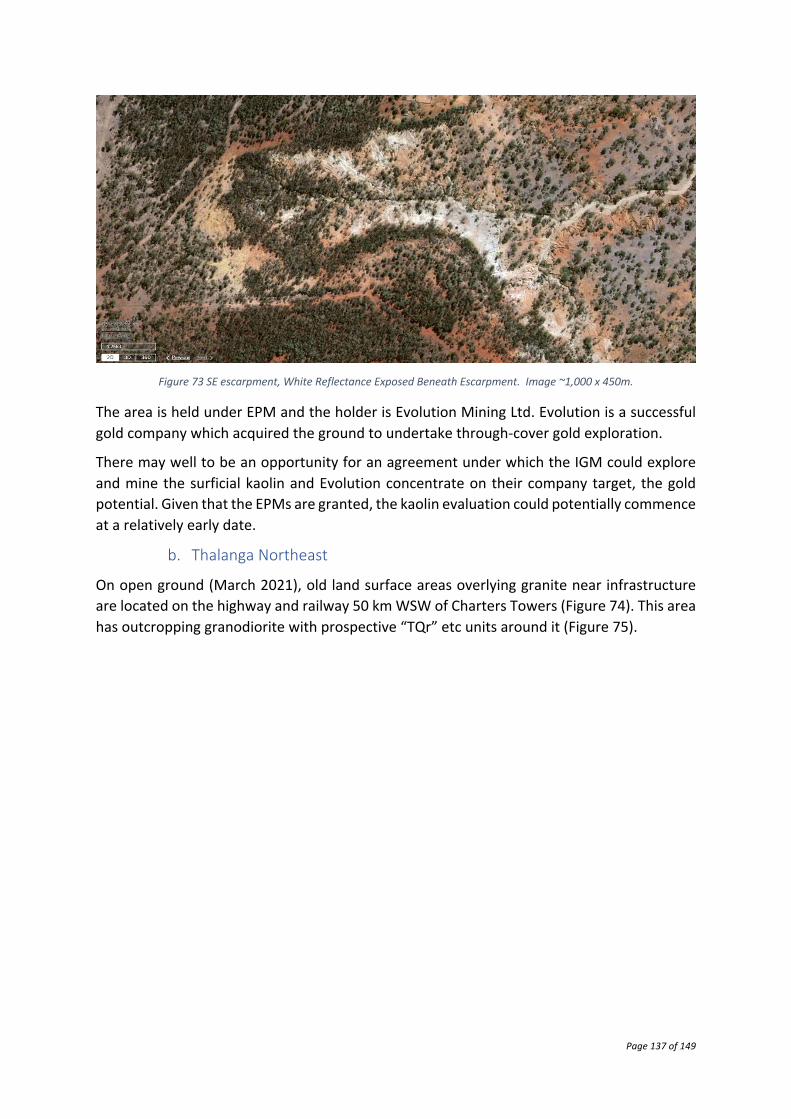
Page 137 of 149
Figure 73 SE escarpment, White Reflectance Exposed Beneath Escarpment. Image ~1,000 x 450m.
The area is held under EPM and the holder is Evolution Mining Ltd. Evolution is a successful gold company which acquired the ground to undertake through-cover gold exploration.
There may well to be an opportunity for an agreement under which the IGM could explore and mine the surficial kaolin and Evolution concentrate on their company target, the gold potential. Given that the EPMs are granted, the kaolin evaluation could potentially commence at a relatively early date.
b. Thalanga Northeast
On open ground (March 2021), old land surface areas overlying granite near infrastructure are located on the highway and railway 50 km WSW of Charters Towers (Figure 74). This area has outcropping granodiorite with prospective “TQr” etc units around it (Figure 75).
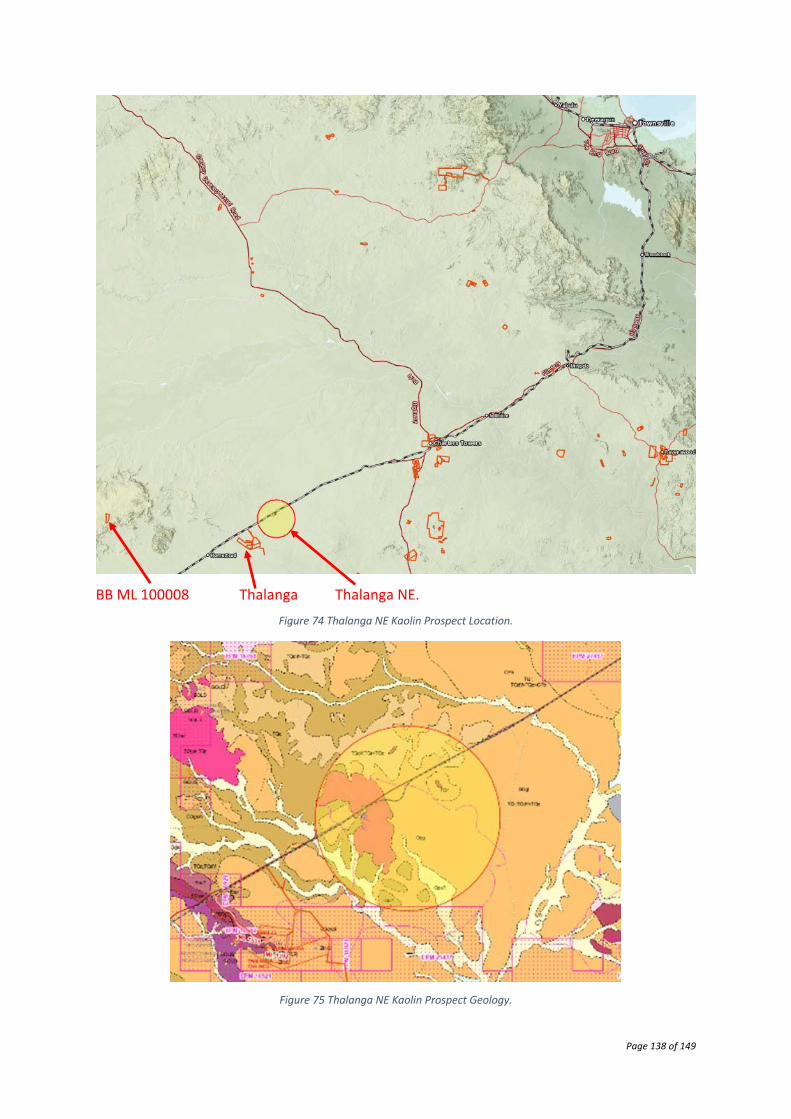
Page 138 of 149
BB ML 100008 Thalanga Thalanga NE.
Figure 74 Thalanga NE Kaolin Prospect Location.
Figure 75 Thalanga NE Kaolin Prospect Geology.
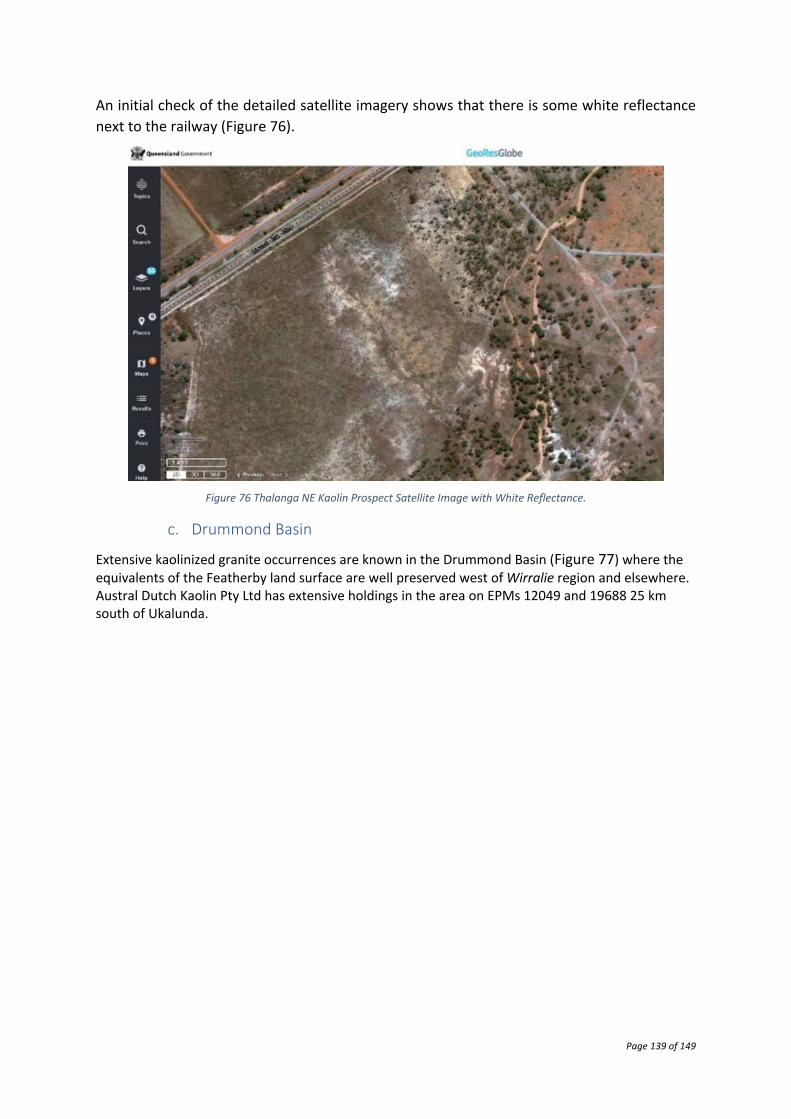
Page 139 of 149
An initial check of the detailed satellite imagery shows that there is some white reflectance next to the railway (Figure 76).
Figure 76 Thalanga NE Kaolin Prospect Satellite Image with White Reflectance.
c. Drummond Basin
Extensive kaolinized granite occurrences are known in the Drummond Basin (Figure 77) where the equivalents of the Featherby land surface are well preserved west of Wirralie region and elsewhere. Austral Dutch Kaolin Pty Ltd has extensive holdings in the area on EPMs 12049 and 19688 25 km south of Ukalunda.
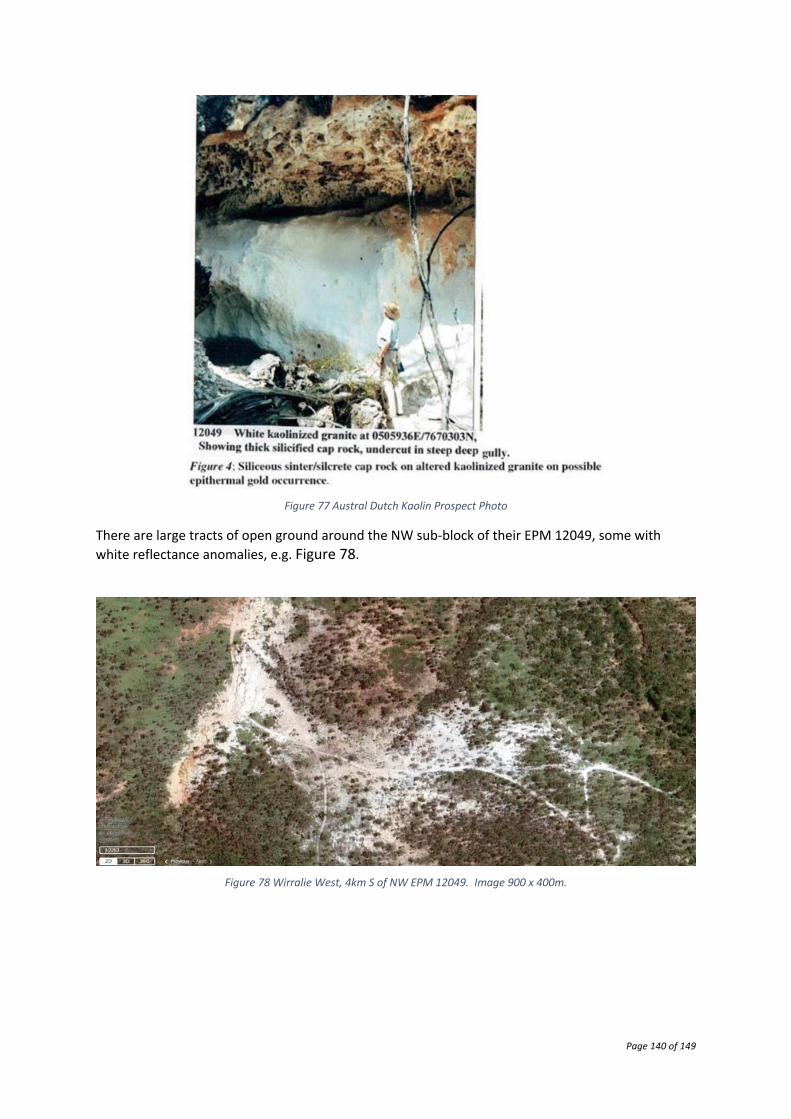
Page 140 of 149
Figure 77 Austral Dutch Kaolin Prospect Photo
There are large tracts of open ground around the NW sub-block of their EPM 12049, some with white reflectance anomalies, e.g. Figure 78.
Figure 78 Wirralie West, 4km S of NW EPM 12049. Image 900 x 400m.
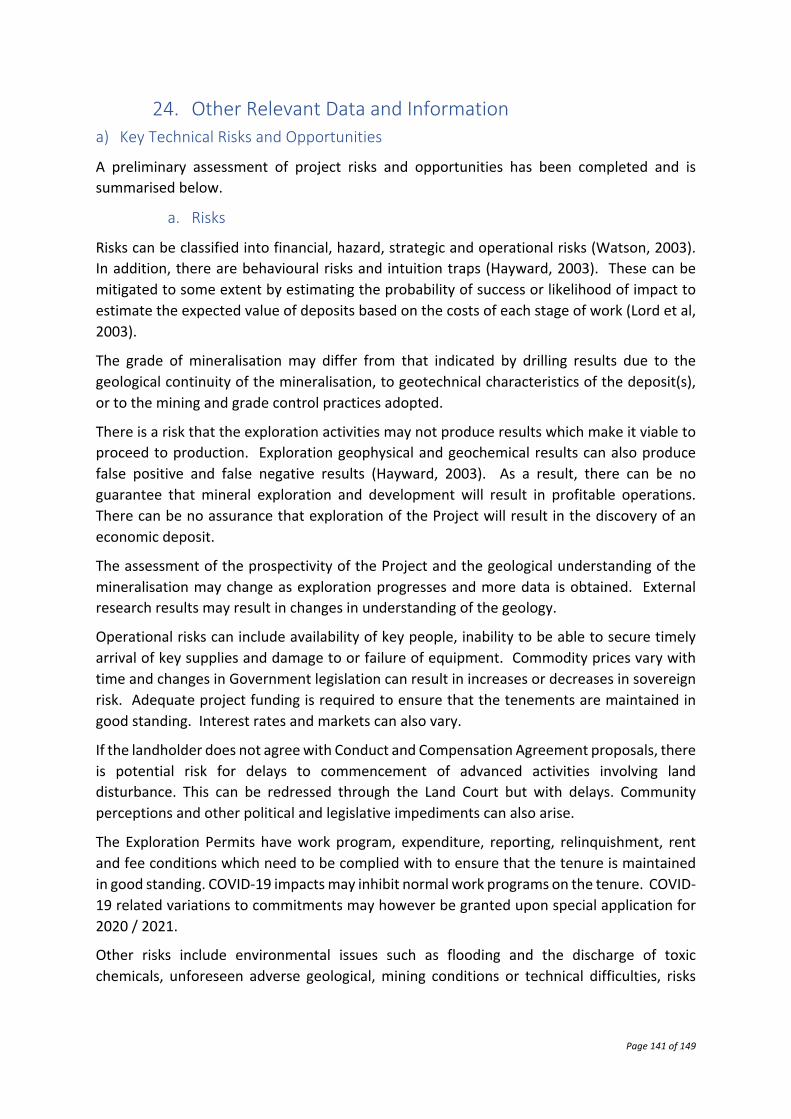
Page 141 of 149
24. Other Relevant Data and Information a) Key Technical Risks and Opportunities
A preliminary assessment of project risks and opportunities has been completed and is summarised below.
a. Risks
Risks can be classified into financial, hazard, strategic and operational risks (Watson, 2003). In addition, there are behavioural risks and intuition traps (Hayward, 2003). These can be mitigated to some extent by estimating the probability of success or likelihood of impact to estimate the expected value of deposits based on the costs of each stage of work (Lord et al, 2003).
The grade of mineralisation may differ from that indicated by drilling results due to the geological continuity of the mineralisation, to geotechnical characteristics of the deposit(s), or to the mining and grade control practices adopted.
There is a risk that the exploration activities may not produce results which make it viable to proceed to production. Exploration geophysical and geochemical results can also produce false positive and false negative results (Hayward, 2003). As a result, there can be no guarantee that mineral exploration and development will result in profitable operations. There can be no assurance that exploration of the Project will result in the discovery of an economic deposit.
The assessment of the prospectivity of the Project and the geological understanding of the mineralisation may change as exploration progresses and more data is obtained. External research results may result in changes in understanding of the geology.
Operational risks can include availability of key people, inability to be able to secure timely arrival of key supplies and damage to or failure of equipment. Commodity prices vary with time and changes in Government legislation can result in increases or decreases in sovereign risk. Adequate project funding is required to ensure that the tenements are maintained in good standing. Interest rates and markets can also vary.
If the landholder does not agree with Conduct and Compensation Agreement proposals, there is potential risk for delays to commencement of advanced activities involving land disturbance. This can be redressed through the Land Court but with delays. Community perceptions and other political and legislative impediments can also arise.
The Exploration Permits have work program, expenditure, reporting, relinquishment, rent and fee conditions which need to be complied with to ensure that the tenure is maintained in good standing. COVID-19 impacts may inhibit normal work programs on the tenure. COVID-19 related variations to commitments may however be granted upon special application for 2020 / 2021.
Other risks include environmental issues such as flooding and the discharge of toxic chemicals, unforeseen adverse geological, mining conditions or technical difficulties, risks
Page 142 of 149
associated with the various regulatory approvals, and contract default by contractors or major suppliers.
If natural disasters such as earthquakes, flood or cyclones occur, this may adversely affect the ability to undertake the exploration. Factors with potential to effect on-ground exploration include the seasonal potential for intense monsoonal rainfall events particularly during the December to April period. Related flooding and wet ground conditions may affect access to the Project and/or the ability to conduct exploration on the ground.
b. Opportunities
The Project presents a number of significant opportunities for profitable mining based on the recent recognition of the extensive kaolin resources and its perceived potential for development. The Project also has a relatively abundant density of gold occurrences per unit area, with bulk sampling trials demonstrating that the gold can be successfully extracted. The Project remains relatively underexplored and contains numerous prospects and geochemical anomalies which offer potential for significant discoveries.
25. Interpretation and Conclusions IGM has completed exploration and definition work which has identified both quartz vein hosted gold deposits, and high-quality kaolin in kaolinized granite. Work has included excavating bulk samples of both gold and kaolin from shallow open pits on ML 100008 as well as initial metallurgical testwork.
IGM has identified potential for significant kaolin resources over 16 km of strike on the Lolworth plateau where no previous exploration for kaolin has been completed. Metallurgical testwork to date has shown potential for use of the kaolin as both a feed to conventional kaolin uses, as well as in the production metakaolin pozzolan for use in the cement industry.
Systematic resource drilling and bulk sampling will be required to confirm that the kaolin is of sufficient brightness and contaminant free to establish JORC Code compliant resources and reserves.
a) Kaolin Assets Review
The inferred cumulative strike length of the newly recognised kaolin assets is approximately 16 km and runs on an east north-easterly trend through northern portion of ML 100008 and on EPMs 18419, 25299 and EPM 27705. These occurrences clearly have substantial potential tonnage and requires field mapping, drilling and bulk sampling to establish resources with high brightness, low iron content, continuity and/or suitability as metakaolin feed.
The results of preliminary metallurgical testing of samples from the southern Surprise pit on ML 100008 are promising. The samples showed a lack of contamination and were encouraging for the production of metakaolin.
Based on vegetation anomalies and scattered white reflectance on satellite images, there is unverified potential for the kaolinized granite to cover approximately 1,209 ha of the project tenements. There is also the possibility of substantial quantities of partially eroded material.
Page 143 of 149
Initial inspection of the Clydesdale area has been completed. Stratum Resources is evaluating the quality of samples collected from the Clydesdale prospect and samples collected on an additional field visit to a number of areas between Clydesdale and Surprise prospects.
Metallurgical test work has been conducted on Surprise pit samples to assess kaolin calcination and the use of metakaolin as a pozzolan in cement and concrete application. Chapelle tests conducted to date have indicated values close to the top of the quality range (1500 mg Ca(OH)2 fixed by the metakaolin) using the <44 micron size fraction of the samples tested. The samples consisted of nearly a 50:50 split of quartz and kaolin-rich clay. A 44 micron split appears to result in a low quartz/high kaolin-rich clay split.
b) Potential Project Value
Preliminary project financial analysis was aimed at determining potential value propositions, project risks and project opportunities.
Production of a mix of bright kaolin and metakaolin products results in an IRR of 16 to 21% based on a project that manages market and technical risk by commencing the project with a 10 000 t/y metakaolin plant and expanding this to 300 000 t/y of metakaolin as the market is developed and the technology is optimised.
26. Recommendations and Further Work Further work is required to develop the Project to the point where a decision can be made on the optimum value case. Focus point activities include:
• Define the principal focus areas for project implementation, e.g. Surprise pit area, Clydesdale or other kaolin rich areas.
• Complete test work that links the range of ore “types” to optimum process flowsheets and product specifications.
• Relate the mineralogy within, and across, the kaolin rich areas with product value and a viable mine plan. Future resource and project modelling will endeavour to derive a JORC mineral resource and then mineral reserve.
• Refine location options for the Townsville process plant. • Complete baseline environmental studies. • Conduct discussions with landowners and other stakeholders in the mine area. • Conduct marketing studies to determine the range of potential product values and
market options.
Table 25 provides and preliminary project execution schedule based on the technical aspects of Demonstration Plant project development. No allowance has been made in the schedule for delays due to project financing. Hence, the schedule is likely to be extended if finances are not available to maintain necessary expenditure.
The Demonstration Plant project has the following major milestones, providing funding is available:
• Concept Study acceptance and approval to proceed, set for July 2021 • Mineral resource declared August 2021

Page 144 of 149
• Mineral reserve declared February 2022 • Definition Phase completion, set for February 2022 • Partial notice to proceed and commencement of detailed planning in March 2022 • Full notice to proceed and commencement of project implementation phase in May
2022 • Commissioning in July 2023.
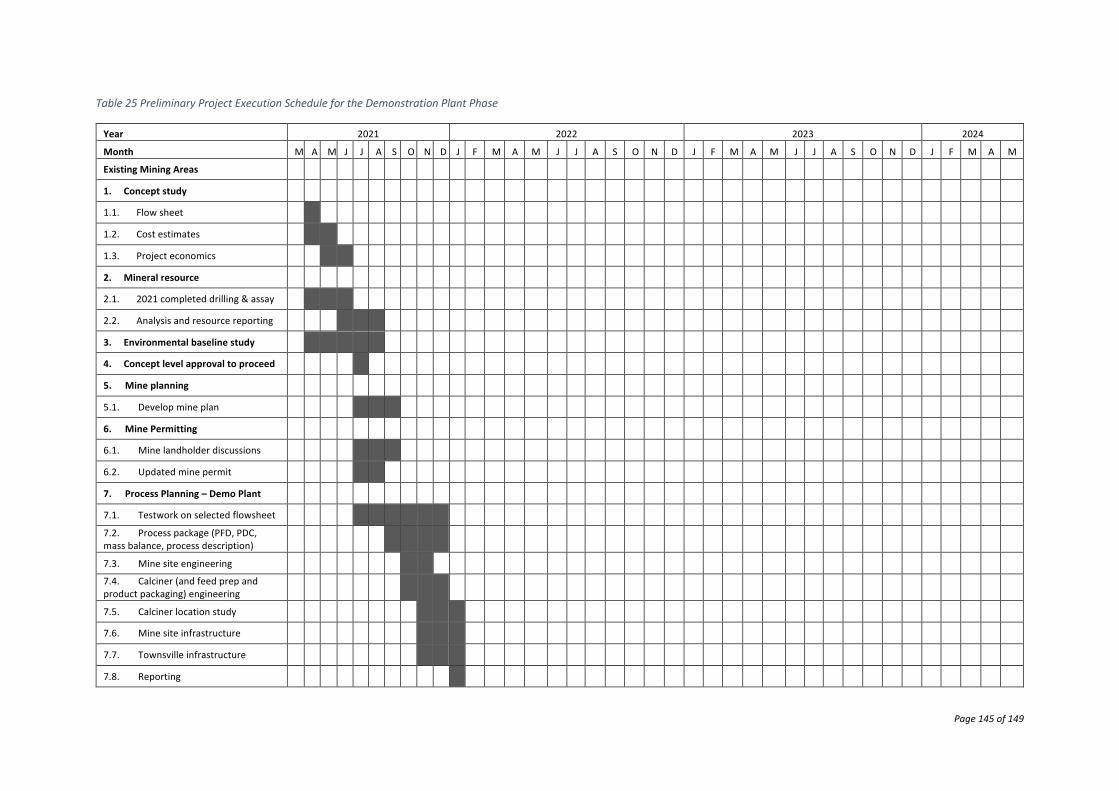
Page 145 of 149
Table 25 Preliminary Project Execution Schedule for the Demonstration Plant Phase
Year 2021 2022 2023 2024
Month M A M J J A S O N D J F M A M J J A S O N D J F M A M J J A S O N D J F M A M
Existing Mining Areas
1. Concept study
1.1. Flow sheet
1.2. Cost estimates
1.3. Project economics
2. Mineral resource
2.1. 2021 completed drilling & assay
2.2. Analysis and resource reporting 3. Environmental baseline study 4. Concept level approval to proceed 5. Mine planning 5.1. Develop mine plan 6. Mine Permitting 6.1. Mine landholder discussions 6.2. Updated mine permit 7. Process Planning – Demo Plant 7.1. Testwork on selected flowsheet 7.2. Process package (PFD, PDC,
mass balance, process description) 7.3. Mine site engineering 7.4. Calciner (and feed prep and
product packaging) engineering 7.5. Calciner location study 7.6. Mine site infrastructure 7.7. Townsville infrastructure 7.8. Reporting
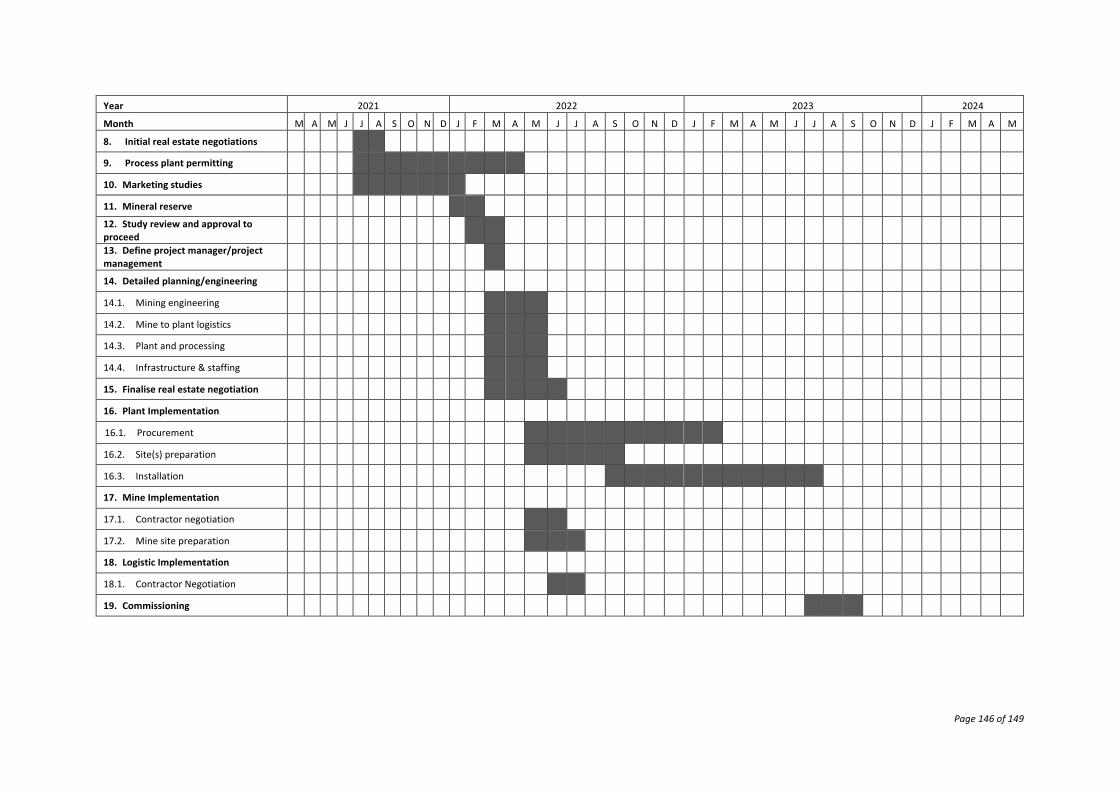
Page 146 of 149
Year 2021 2022 2023 2024
Month M A M J J A S O N D J F M A M J J A S O N D J F M A M J J A S O N D J F M A M
8. Initial real estate negotiations 9. Process plant permitting 10. Marketing studies 11. Mineral reserve 12. Study review and approval to proceed 13. Define project manager/project management 14. Detailed planning/engineering 14.1. Mining engineering 14.2. Mine to plant logistics 14.3. Plant and processing 14.4. Infrastructure & staffing 15. Finalise real estate negotiation 16. Plant Implementation 16.1. Procurement
16.2. Site(s) preparation 16.3. Installation 17. Mine Implementation 17.1. Contractor negotiation 17.2. Mine site preparation 18. Logistic Implementation 18.1. Contractor Negotiation 19. Commissioning
Page 147 of 149
Study expenditure for the implementation of the Demonstration Plant includes:
• Environmental, social and government • Geology and mineral resources • Mining and mineral reserve - • Metallurgical test work • Engineering studies • Property purchases • Logistics studies • Marketing studies • Project definition and EPCM • Project commissioning
The costs of these studies are included in the capital expenditure estimate.
27. References Acelerate Resources Ltd, 2020. ASX Announcement 26th March 2020. Exploration Update
on the Tambellup Kaolin Project. https://www.listcorp.com/asx/ax8/accelerate-resources-limited/news/exploration-update-on-the-tambellup-kaolin-project-2308359.html
BinMaster, 2021. Bulk Density Table. https://www.binmaster.com/_resources/e30d:ns5ibn-1dq/files/75343622z9caf67af/_fn/Bulk%20Density.pdf
Bloodworth A J, Highley D E and Mitchell C J, 1993. Industrial Minerals Laboratory Manual Kaolin. British Geological Survey Technical Report WG/93/1Bundy, W.M. 1993. "The Diverse Industrial Applications of Kaolin", Kaolin Genesis and Utilization, Clay Minerals Society, Special Publication Volume 1.
Bourne N, 2020. Brilliant Brumby Kaolin Assessment Testwork Report. Simulus Document: Bril-947-Tbr-001, Revision A, 09 Nov 2020.
Bureau of Meteorology, 2017, Climate data online (http://www.bom.gov.au/qld/townsville/climate_Townsville.shtml).
Chadwick D, 2020. Technical Review, Kaolin Project, Brilliant Brumby Surprise Site, Far North Queensland. Australian Industrial Minerals Pty Ltd.
Concrete Countertop Institute, 2021. The use of pozzolans in concrete. https://concretecountertopinstitute.com/free-training/the-use-of-pozzolans-in-concrete/
Converge Heritage and Community, 2018. Lansdown Station Cultural Heritage Study. Report for Townsville City Council.
Department of Natural Resources and Mines, 2015. Groundwater database
Page 148 of 149
Department of State Development, Infrastructure and Local Planning. Accessed 24 March 2021. https://www.statedevelopment.qld.gov.au/coordinator-general/state-development-areas/current/townsville-state-development-area.
Earth Environmental, 2018. Lansdown Station Environmental Study: Final Report for Townsville City Council.
Fraser, D. 2021. White Spot Mapping EPM 27705, Observations and Further Potential. Unpub Map to Mine Report MTM2021-16.
FYI Resources Ltd, 2018. Drilling successfully confirms high-grade nature of Cadoux kaolin resource, demonstrating ideal element suite as exemplary feedstock for HPA refining. ASX release (ASX: FYI) 25 June 2018. https://www.fyiresources.com.au/media/files/20180625-FYI-Successful-Results-from-RC-Drilling.pdf
Ginn Mineral Technology, 2020a. InterGroup Proposal 03022020Phases I & II. Basic Characterization and Kaolin Processing Trial, June 2020.
Ginn Mineral Technology, 2020b. IGM Kaolin and Silica Resources. Characterization and Process Evaluation of a High Quality Australian Mineral Resource, August 2020.
Green, M. 2020. Kaolin Opportunity, Potential additional revenue stream from simultaneously mining kaolin which has fast-growing high-tech applications, www.intergroup.com
InterGroup Mining Ltd, 2018. Brilliant Brumby Project Information Memorandum August 2018. https://armchairinvest.com/wp-content/uploads/2019/06/IG-IM-010818v3c1.pdf
InterGroup Mining Ltd. 2021. InterGroup Mining, About Us. https://www.igmining.com/about-us/
InterGroup Mining Ltd, 2020 https://www.igmining.com/wp-content/uploads /2020/11 /Intergroup-Mining-Summary-Brochure.pdf
Jell P A (Ed), 2013. Geology of Queensland. Geological Survey of Queensland. ISBN 9781921489761.
JORC, 2012. Australasian Code for Reporting of Exploration Results, Mineral Resources and Ore Reserves (The JORC Code) [online]. Available from: <http://www.jorc.org> (The Joint Ore Reserves Committee of The Australasian Institute of Mining and Metallurgy, Australian Institute of Geoscientists and Minerals Council of Australia).
Kennedy, M. 2021. Tenement Status Review February 2021.
Lava Blue Ltd, 2020. High Purity Alumina Al2O3. https://www.lavablue.com.au/hpa
Manufacturers Monthly, 2019. HPA to be made from sapphire mining clay. October 25, 2019News. https://www.manmonthly.com.au/HPA+to+be+made+from+sapphire+ mining +clay
Page 149 of 149
Morrison R J, and Ward B P, 2021. Competent Persons Report, Technical Assessment Report on InterGroup Mining Limited Queensland Mineral Assets. ML 100008 (Brilliant Brumby), EPM 18419 (Brilliant Brumby), EPM 25299 (Spear), EPM 25431 (Colts), EPM 26366 (Oaky Creek), EPM application 27705 (Lolworth). March 2021.. Map to Mine Report No. MTM 2020-24 (Unpubl.).
Murtha, G.G. and Crack, B.J. 1966, Soils of the CSIRO Pasture Research Station “Lansdown” Townsville, Queensland: Divisional Report 1/66, Commonwealth Scientific and Industrial Research Organization (CSIRO), Division of Soils, Adelaide.
Queensland Government. Queensland Globe. Accessed 24 March 2021. https://qldglobe.information.qld.gov.au/qldglobe/public/
QUT Lava Blue Team, 2020. HPA production from Kaolin for InterGroup Mining Ltd. Commercial in confidence: Lava Blue – QUT High purity alumina project – 20/10/20.
Townsville City Council. Accessed 22 March 2021. https://www.townsville.qld.gov.au/building-planning-and-projects/council-projects/lansdown-industrial-precinct.
Townsville City Council. Accessed 23 March 2021. https://www.townsville.qld.gov.au/__data/assets/pdf_file/0024/80196/Lansdown-Precinct-2021_Advantages-Map_020221.pdf.
Tyrer,M, Cheesman C, Greaves R, Claisse P, Ganjian E, Kay M, Churchman-Davies J, 2008. The potential for carbon dioxide reduction from the cement industry through the increased use of industrial pozzolans. Extended Abstract: Cement and Concrete Science, University of Manchester, Manchester, 15-16th September 2008. https://www.researchgate.net/publication/233542716_Potential_for_carbon_dioxide_reduction_from_cement_industry_through_increased_use_of_industrial_pozzolans.
VALMIN, 2015. Australasian Code for Public Reporting of Technical Assessments and Valuations of Mineral Assets (The VALMIN Code) [online]. Available from: <http://www.valmin.org> (The VALMIN Committee of the Australasian Institute of Mining and Metallurgy and Australian Institute of Geoscientists). http://www.valmin.org/docs/VALMIN_Code_2015_final.pdf