Kanghwa Choi DonHee Lee David L. Olson -...
24
THEORETICAL ARTICLE Service quality and productivity in the U.S. airline industry: a service quality-adjusted DEA model Kanghwa Choi • DonHee Lee • David L. Olson Received: 10 September 2013 / Accepted: 25 November 2013 / Published online: 12 December 2013 Ó Springer-Verlag Berlin Heidelberg 2013 Abstract The airline industry faces economic challenges making it paramount that they provide satisfactory service to customers relative to their expectations. This study uses a service quality-adjusted data envelopment analysis (SQ-adjusted DEA) to study US-based airline carrier operational efficiency. We found that air- lines can overcome the traditional tradeoff between quality and productivity. Using SQ-adjusted DEA, we were able to find how airlines could set service levels in accordance with their strategic purpose or operational characteristics. Low-cost airlines were found to benefit by marginal improvements in service, often unex- pected by their clientele. Network carriers, however, tended to have a harder time meeting service expectations. While there were short-term tradeoffs between ser- vice quality and productivity, in the long term a focus on service quality may help increase customer satisfaction, thus improving service productivity and overall organizational performance. SQ-adjusted DEA was found to be better suited to explore service productivity than the standard DEA. Keywords SQ-adjusted DEA Operational efficiency Service quality Service productivity The US airline K. Choi Department of Management, Hansung University, 116 Samseongyoro, 16gil, Seongbuk-gu, Seoul, South Korea e-mail: [email protected] D. Lee (&) College of Business Administration, Keimyung University, 1095, Dalgubeol-daero, Daegu, South Korea e-mail: [email protected] D. L. Olson Department of Management, 209 CBA University of Nebraska-Lincoln, Lincoln, NE 68588-0491, USA e-mail: [email protected] 123 Serv Bus (2015) 9:137–160 DOI 10.1007/s11628-013-0221-y
Transcript of Kanghwa Choi DonHee Lee David L. Olson -...

THEORETICAL ARTICLE
Service quality and productivity in the U.S. airlineindustry: a service quality-adjusted DEA model
Kanghwa Choi • DonHee Lee • David L. Olson
Received: 10 September 2013 / Accepted: 25 November 2013 / Published online: 12 December 2013
� Springer-Verlag Berlin Heidelberg 2013
Abstract The airline industry faces economic challenges making it paramount
that they provide satisfactory service to customers relative to their expectations.
This study uses a service quality-adjusted data envelopment analysis (SQ-adjusted
DEA) to study US-based airline carrier operational efficiency. We found that air-
lines can overcome the traditional tradeoff between quality and productivity. Using
SQ-adjusted DEA, we were able to find how airlines could set service levels in
accordance with their strategic purpose or operational characteristics. Low-cost
airlines were found to benefit by marginal improvements in service, often unex-
pected by their clientele. Network carriers, however, tended to have a harder time
meeting service expectations. While there were short-term tradeoffs between ser-
vice quality and productivity, in the long term a focus on service quality may help
increase customer satisfaction, thus improving service productivity and overall
organizational performance. SQ-adjusted DEA was found to be better suited to
explore service productivity than the standard DEA.
Keywords SQ-adjusted DEA � Operational efficiency � Service quality �Service productivity � The US airline
K. Choi
Department of Management, Hansung University, 116 Samseongyoro, 16gil, Seongbuk-gu, Seoul,
South Korea
e-mail: [email protected]
D. Lee (&)
College of Business Administration, Keimyung University, 1095, Dalgubeol-daero, Daegu,
South Korea
e-mail: [email protected]
D. L. Olson
Department of Management, 209 CBA University of Nebraska-Lincoln, Lincoln, NE 68588-0491,
USA
e-mail: [email protected]
123
Serv Bus (2015) 9:137–160
DOI 10.1007/s11628-013-0221-y

1 Introduction
In 2011, the air transport industry increased at about double the rate of overall
economic growth (Bhaskara 2012). In spite of its rapid expansion, the air transport
industry has faced internal and external challenges, such as the ongoing global
economic recession, the resulting financial crisis, and rising crude oil prices. In
addition, the advent of low-cost carriers (LCCs) coupled with existing network
carriers (NCs) has made the air transport market increasingly competitive. The
increased competition, rising operational costs, and lower profit margins have led to
a resurgence of mergers and acquisitions among airline companies. Given these
rapid changes, airline companies have attempted to attain competitive advantage,
improve their organizational effectiveness, and gain an edge by pursuing continuous
innovation in their operations.
Service quality and productivity are factors that indicate the degree to which
sustainable growth is possible in the airline industry (Davey et al. 2007; Parast and
Fini 2010). Although improvements to both service quality and productivity would
be ideal, there are inherent short-term tradeoffs between the two (Ferdows and De
Meyer 1990; Safizadeh et al. 2000; Lapre and Scudder 2004; Calabrese 2012). For
example, a service provider can increase productivity by reducing the firm’s use of
manpower, materials, or equipment but these strategies may result in poor product
or service quality and decreased customer satisfaction. Conversely, to increase
customer satisfaction, a service provider can customize its services, which
inherently requires greater manpower and resources. This can lead to decline in
productivity. Recently, many firms have attempted to increase long-term service
productivity by improving quality and customer satisfaction, such as just-in-time
approaches. This strategy, while potentially beneficial, often requires sacrificing
short-term productivity.
Previous research on service quality in the airline industry has shown that there is
a positive relationship between service quality and organizational performance
(Lapre and Scudder 2004; Tsikriktsis 2007; Tiernan et al. 2008). Tsikriktsis and
Heineke (2004) reported empirical results showing the impact of average and
variation of service performance on customer dissatisfaction. However, the results
of these studies do not account for the tradeoff between service quality and
productivity. In particular, the methodologies employed in these studies demon-
strate a violation of the original purpose of benchmarking. The incentive regulations
generated by existing data envelopment analysis (DEA) methodologies determine
best practices for increasing quantitative effectiveness, regardless of the quality of
the service being delivered (Charnes et al. 1991; Scheraga 2004; Lin 2005;
Tsikriktsis 2007; Parast and Fini 2010). However, DEA suffers from three key
limitations. First, some studies have demonstrated that incentive regulations that
incorporate only quantitative metrics for efficiency can cause reductions in quality
and motivate reductions of expenditures (Lin 2005). Second, even those studies that
explored both quality and efficiency suffered from methodological limitations,
making their results difficult to interpret (Thanassoulis et al. 1995; Soteriou and
Zenios 1999; Soteriou and Stavrinides 2000; Sherman and Zhu 2006; Bayraktar
et al. 2012; Brissimis and Zervopoulos 2012).
138 K. Choi et al.
123
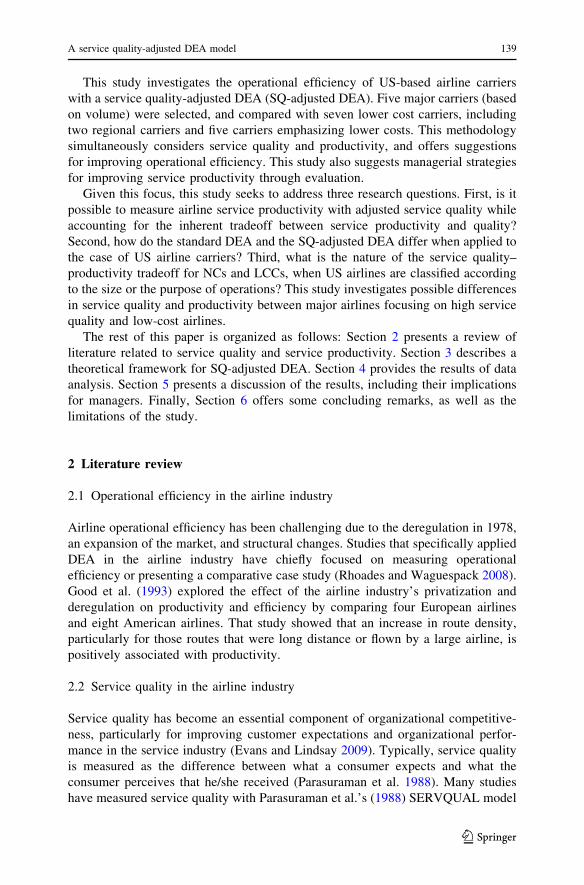
This study investigates the operational efficiency of US-based airline carriers
with a service quality-adjusted DEA (SQ-adjusted DEA). Five major carriers (based
on volume) were selected, and compared with seven lower cost carriers, including
two regional carriers and five carriers emphasizing lower costs. This methodology
simultaneously considers service quality and productivity, and offers suggestions
for improving operational efficiency. This study also suggests managerial strategies
for improving service productivity through evaluation.
Given this focus, this study seeks to address three research questions. First, is it
possible to measure airline service productivity with adjusted service quality while
accounting for the inherent tradeoff between service productivity and quality?
Second, how do the standard DEA and the SQ-adjusted DEA differ when applied to
the case of US airline carriers? Third, what is the nature of the service quality–
productivity tradeoff for NCs and LCCs, when US airlines are classified according
to the size or the purpose of operations? This study investigates possible differences
in service quality and productivity between major airlines focusing on high service
quality and low-cost airlines.
The rest of this paper is organized as follows: Section 2 presents a review of
literature related to service quality and service productivity. Section 3 describes a
theoretical framework for SQ-adjusted DEA. Section 4 provides the results of data
analysis. Section 5 presents a discussion of the results, including their implications
for managers. Finally, Section 6 offers some concluding remarks, as well as the
limitations of the study.
2 Literature review
2.1 Operational efficiency in the airline industry
Airline operational efficiency has been challenging due to the deregulation in 1978,
an expansion of the market, and structural changes. Studies that specifically applied
DEA in the airline industry have chiefly focused on measuring operational
efficiency or presenting a comparative case study (Rhoades and Waguespack 2008).
Good et al. (1993) explored the effect of the airline industry’s privatization and
deregulation on productivity and efficiency by comparing four European airlines
and eight American airlines. That study showed that an increase in route density,
particularly for those routes that were long distance or flown by a large airline, is
positively associated with productivity.
2.2 Service quality in the airline industry
Service quality has become an essential component of organizational competitive-
ness, particularly for improving customer expectations and organizational perfor-
mance in the service industry (Evans and Lindsay 2009). Typically, service quality
is measured as the difference between what a consumer expects and what the
consumer perceives that he/she received (Parasuraman et al. 1988). Many studies
have measured service quality with Parasuraman et al.’s (1988) SERVQUAL model
A service quality-adjusted DEA model 139
123

or Cronin and Taylor’s (1992) SERVPERF model. In addition to these, airline
carriers have used a variety of other measurement tools to measure the quality of the
services they provide (Lapre and Scudder 2004; Tsikriktsis 2007; Tiernan et al.
2008). Specifically, many airline carriers have focused on service quality on the
basis of consumers’ perceptions of things like schedule and price (Headley and
Bowen 1997; Tiernan et al. 2008; Gnanlet and Yayla-Kullu 2013). Airline carriers
have also recognized that customer satisfaction and high service quality are key
factors that affect customers’ decisions to choose a given airline.
Metrics have been developed by two groups of researchers. In 1991, the Aviation
Institute at the University of Nebraska-Omaha developed the airline quality rating
(AQR) scale as ‘‘an objective method for assessing airline quality on combined
multiple performance criteria’’ (Bowen and Headley 2012). As of 1993, the AQR
scale provided a weighted average of 19 factors that influence customers’
perceptions of an airline’s quality. These factors included: the average age of the
airline’s fleet, the number of aircrafts owned by the airline, the extent to which the
airline’s flights were on time, the load factor, pilot deviations, the number of
accidents an airline suffered, frequent flier awards, flight problems, overbooking,
mishandled baggage, fares, refunds, customer service, ticketing/boarding, advertis-
ing, credit, financial stability, average seat-mile cost, and a miscellaneous category
(Headley and Bowen 1997). To calculate quality scores for airlines, we consider
AQR scores from four areas (on-time performance, involuntary boarding denial,
reports of mishandled baggage, and consumer complaints).
Although the AQR model is widely used as a tool to measure service quality
within the airline industry, some scholars identified its inherent limitations. Rhoades
and Waguespack (1999) indicated that in the weighted average formula, there are
negative influences (e.g., load factor) on the financial performance of airline
carriers. Despite arguments to the contrary, we believe AQR to be a valid instrument
for measuring airline service quality. Therefore, in this study, we utilize AQR scores
of US-based airlines between 2008 and 2011 as data.
2.3 Service quality and productivity
Since the goal of a service firm is to cultivate customer satisfaction through the
delivery of a high-quality experience, a low-quality service indicates a service
failure, which can lead to customer defection. As such, a firm’s service quality
should be incorporated into any measure of that firm’s productivity (Calabrese
2012).
Although service quality and productivity are often considered conceptually
distinct, many studies (in addition to those referenced above) have assumed that
there exists a relationship between them (Lapre and Scudder 2004; Frei 2006;
Calabrese 2012). Therefore, in this study, we explore service productivity and
quality, and explain the outputs from the two (see Fig. 1). To comprehensively
explore the distinct and interrelated natures of service productivity and quality,
productivity must be observed from the perspective of both the firm and the
customer (Parasuraman 2010a, b). From the perspective of the firm, an increase in
service resources can yield an improvement in service quality. From the perspective
140 K. Choi et al.
123

of the consumer, an increase in service quality indicates improved results. These
dual perspectives of service productivity through service quality can be identified
(Parasuraman 2010a, b).
Although it is possible to examine service productivity and quality in conjunction
with each other, there exist relationships among service resource inputs, service
quality, and service output. Increased service resource inputs may improve a
customer’s perceptions of service quality but improved perceptions of service
quality may not necessarily increase service output. Given this, there are four
possible scenarios related to resource inputs, service quality, and service output.
These scenarios are illustrated in Fig. 1 and described in the following sections.
2.3.1 Quadrant I: the unwise scenario
In Quadrant I, service resource inputs are relatively ineffective with respect to
service productivity and quality. A service firm must distribute resource inputs on
the basis of customers’ needs, expectations, technical maturity, and ability to handle
the service provided. However, firms in this quadrant inefficiently increase service
resource inputs due to a lack of knowledge regarding customers’ preferences. As a
result, this scenario is referred to as ‘‘unwise.’’Service quality begins from the
comparison of service by what the customer thinks they should receive and what the
customer actually received. Customers have expectations about the quality of the
services they are provided. In short, most customers feel that a company must
provide the best service possible. However, firms that do not efficiently distribute
resource inputs to improve service quality risk causing gaps between the service
quality expectations and the actual quality of the service that is delivered
(Parasuraman 2010a). This situation poses a constant threat to firms, as it is very
difficult to continuously provide a high-quality service.
Input ( ) + Service Quality ( ) + Output ( ) Δ Δ Δ
Fig. 1 Excelling in themarketplace through servicequality and productivity
A service quality-adjusted DEA model 141
123

2.3.2 Quadrant II: the myopic scenario
In Quadrant II, consumer perceptions of service quality are low relative to the
amount of resource inputs provided by the firm. Despite low perceptions of service
quality, high levels of output are nonetheless experienced. For example, consider a
hotel that develops a device that allows a guest to control all the electronic
equipment in a room as a means to improve service quality. Although this may
improve the customer’s experience, he/she may be unfamiliar with its use, resulting
in customer dissatisfaction. Nevertheless, the hotel will likely increase its
productivity through the implementation of the device. This scenario is referred
to as ‘‘myopic.’’In the Myopic Scenario, service productivity may increase in the
short term. However, customer complaints will gradually multiply, resulting in
customers’ reduced intention to purchase the services. Taken together, these
conditions will eventually decrease service productivity. If the company tends to
overemphasize service productivity, then service quality will suffer. As a result,
service quality improvement strategies are needed in conjunction with strategies that
focus on service productivity.
2.3.3 Quadrant III: the fruitless scenario
In Quadrant III, service quality is relatively high as a result of increased levels of
service resource inputs, but service productivity is relatively low. This scenario,
which demonstrates the traditional tradeoff relationship between service quality and
productivity, is called the ‘‘fruitless’’ scenario. This scenario occurs when
improvements in service quality do not generate customers’ purchase intentions.
This, in turn, results in low organizational performance for the firm. In the Fruitless
Scenario, there exists no significant, positive relationship between service quality,
customer satisfaction, or organizational performance.In the Fruitless Scenario,
efforts to improve service quality through resource inputs cause short-term decrease
in productivity resulting from high initial expenses. However, the strategy can
ultimately produce long-term benefits to organizational performance through
improvements in service quality and subsequent customer satisfaction (Gronroos
and Ojasalo 2004; Parasuraman 2010a, b). Therefore, an increase in service resource
inputs may contribute to the improvement of service productivity in the long term.
Given these relationships, the Fruitless Scenario requires a measurement of service
productivity that accounts for service quality. A firm may risk a decrease in service
productivity in the short term if the firm excessively pursues a service-oriented
strategy. As such, firms must establish a strategy that considers both service
productivity and quality.
Input + Service Quality + Output Δ Δ Δ
Input ( ) + Service Quality ( ) + Output ( ) Δ Δ Δ
142 K. Choi et al.
123

2.3.4 Quadrant IV: the win–win scenario
In Quadrant IV, service resource inputs are sufficiently high to improve service
quality, which allows gains in service outputs. As a result of the increased service
inputs dedicated to both service quality and productivity, and the resulting financial
gains earned by the firm, this is called a ‘‘win–win’’ scenario.According to previous
studies (Nachum 1999; Gronroos and Ojasalo 2004; Parasuraman 2010b), a firm’s
dedication of resources (e.g., human resources and material) to increase service
quality leads to customer satisfaction, subsequent purchase intention, and overall
improved organizational performance. Given this, the win–win scenario represents
the optimal strategy for the firm.
To choose the optimal service type from the perspectives of both the firm and the
customer, firms must identify the characteristics of its customers that influence their
preferences. The redistribution of resources is a critical issue when a firm considers
which operational strategy to pursue. As such, firms must consider consumers’
expectations in making resource investment decisions.
To develop methods by which a ‘‘win–win’’ strategy can be realized, this study
identifies conceptual problems in previous studies that utilized the standard DEA
model to gauge service productivity. In addition, this study provides an alternative
to the standard DEA model whereby service productivity is measured in conjunction
with service quality. This alternative method, the SQ-adjusted DEA, is explicated in
the following section.
3 Theoretical framework: SQ-adjusted DEA
Generally, service productivity is defined as a measure of how effectively resource
inputs are converted into outputs. As such, high levels of productivity result from
the use of small amounts of resources to maximize performance. Stated simply,
service productivity is the ratio of outputs (e.g., high product quality and customer
satisfaction) to inputs (e.g., raw materials and manpower). Using the DEA method
without considering quality aspects to perform an analysis of organizational
efficiency can result in managerial problems (Thanassoulis et al. 1995; Lin 2005).
There is not an automatic conflict among objectives. For instance, Toyota’s lean
management approach seeks to improve both quality and productivity simulta-
neously. Nonetheless, airlines face a number of factors where improvement on one
factor can lead to detriment of another.
For example, if a decision-marking unit (DMU) uses resources to improve the
quality of its goods or services rather than increase its output, the DMU can be
considered efficient on the basis of quality-related criteria, but inefficient with
respect to quantitative output (Schmenner 1986). In contrast, another DMU may
utilize its resources to improve the firm’s productive capacity rather than the quality
of its products. In this case, that firm will be judged as efficient with respect to
Input + Service Quality + Output Δ Δ Δ
A service quality-adjusted DEA model 143
123

quantitative output but inefficient with respect to quality. The latter case represents a
situation in which the original purpose for benchmarking is violated.
There are two types of models that analyze organizational efficiency using
quality attributes. The first type of model adds desirable output attributes into output
variables. The other type of model is referred to as a ‘‘negative DEA’’ which adds
undesirable output attributes into the model on the basis of the DMU’s choices.
Consequently, the efficiency is higher when desirable output attributes using DEA
with larger desirable output attributes and smaller undesirable output attributes.
Thanassoulis et al. (1995) added two output variables in their study of DEA on
perinatal medical treatment in the UK. These output variables included patients’
perceptions of the quality of health service and survival rate of babies at risk (as a
proxy measure for the quality of prenatal medical outcomes). Prior (2006) analyzed
the model by adding the level of nosocomial infections as a negative outcome.
Prior’s (2006) study proposed that positive quality attributes are considered to be
desirable inputs and that negative quality attributes are considered to be strongly
desirable disposable inputs. Finally, in their study on power transmission networks
in the UK, Giannakis et al. (2005) incorporated a number of interruptions and
customer time loss due to those interruptions in their model.
Despite the number of studies that incorporated various inputs into their model, a
question remains. Although quality attributes have been reasonably selected in past
research, the inclusion of too much quality attributes as inputs can inflate estimates
of organizational efficiency, providing a skewed representation of the firm’s true
operational effectiveness. Though useful for understanding how a number of inputs
and outputs relate, results derived from the attribute approach to gauging efficiency
are difficult to interpret given that quantitative scores are not considered. The
second type of model for evaluating organizational efficiency redresses this
shortcoming.
Rouse et al. (2002) utilized quality score indices to evaluate efficiency. Soteriou
and Zenios (1999) and Soteriou and Stavrinides (2000) analyzed DEA with a single
indicator for service quality that was recognized by internal and external customers.
In their studies, the model stipulates that input variables are quantitatively
conceptualized but output variables are not. As a result, increases in inputs but not
outputs are relative to the DMU. Hence, this model may be useful for explaining
efficiency in terms of the size of the DMU. By using output variables that relate only
to service quality, this model violates the DEA’s assumption that the DMU is a
productive unit that converts input into output. For example, in their study related to
international airline carriers’ service performance, Rouse et al. (2002) conceptu-
alized delivery performance, total hours charged, and time spent on capital
improvements as quantitative outputs. In addition to these quantitative output
measures, this model also included an output variable based on a quality score
index. They argued that the inclusion of the quality score index provided a more
balanced evaluation of organizational performance. However, this model has an
issue that the DMU with lower service quality is considered as a target of
benchmarking.
Sherman and Zhu (2006) treated quality and efficiency as independent factors for
organizational efficiency and, respectively, represented them on the x- and y-axis of
144 K. Choi et al.
123

a graph. This approach was applied to banking services (Sherman and Zhu 2009). In
their study, they considered DMUs that produced high-quality and high-productivity
services (HQ-HP) as benchmarks, and excluded low-quality and high-productivity
firms (LQ-HP) on the basis of the reference group. They suggested the use of a
multi-stage DEA model called quality-adjusted DEA (Q-DEA), which incorporates
service quality into an algorithm by controlling for the influence of LQ-HP. Despite
its strengths, this model has a limitation in that it is reliant on low-quality DMU. As
such, it may be difficult to identify benchmarks if DMUs are in the LQ-HP quadrant.
Brissimis and Zervopoulos (2012) proposed a modified version of the DEA which is
inherently quality-driven (MQE-DEA) to address the limitations encountered by
Sherman and Zhu (2006). The MQE-DEA establishes target values for endogenous
and exogenous inputs. In this way, the MQE-DEA model provides estimates for
feasible short- and long-term optimization solutions for the process by which goods
and services are produced.
This study further extends the quality-adjusted DEA model. As a result of the
quality-adjusted DEA model’s extensive use in the public sector, such as the
education (Fare et al. 2006; Khan et al. 2008) and healthcare industries (Chang et al.
2011), it has become clear that the value of the model’s output that can be increased
to a degree that is proportional to the level of service quality the model means to
evaluate. Given this, our new model is called the SQ-adjusted DEA.
Depending on the cost associated with improving the quality of a service, DMUs
that deliver services of higher quality produce higher service outcomes and DMUs
with lower service quality produce lower service outcomes. This generated a new
variable by multiplying the service output by the service quality index. In addition,
service quality as conceptualized with quality criteria generates a new variable
through the conversion of a service quality index (Fare et al. 2006; Chang et al.
2011).
Empirical research by Fixler and Zieschang (1992) developed a ‘‘multifactor
productivity index’’ for commercial banks. In their model, the ‘‘Fisher input-
oriented multifactor productivity index’’ is calculated as PxF(x0, x1, a0, a1, y0, y1) =
B 9 Pxccd through multiplication of ‘‘the characteristics conditional productivity
index’’ of Caves et al. (1982), Pxccd, and quality adjustment factor B. Friesner (2003)
defined the service output of a healthcare provider as a quality-adjusted output (Yi).
Yi was computed by multiplying the total number of patients in the hospital (Xi) by
the quality of the service provided (qi). Fare et al. (2006) and Chang et al. (2011)
suggested that the quality-augmented Malmquist productivity change index (QMI)
is computed by multiplying relative efficiency change (EC), technical change (TC),
and quality change (QC).
Following in respective traditions of these conceptualizations, the SQ-adjusted
DEA computes service productivity by multiplying service output by a service
quality index (SQI) that is converted into a ratio scale such that it ranges from 0 to 1.
Specifically, the SQ-adjusted DEA in this study is calculated as:
A service quality-adjusted DEA model 145
123

Service Quality� adjusted Output
¼ Quantity of Output � Service Quality Index
ðif; 0\Service Quality Index� 1ÞThe SQ-adjusted CCR Model (output-oriented) used in this study is calculated as:
/k� ¼ maxh;k;s�;sþ
/k þ ePM
m¼1
s�mþPN
n¼1
sþm
� �
s:txkm�
PJ
j¼1
xjmkj þ s�m ðm ¼ 1; 2; � � � ;MÞ;
/k ykn �
PJ
j¼1
Qjnyj
nkj � sþn ðn ¼ 1; 2; � � � ;NÞ;
kj� 0; 0\Qjn� 1 ðj ¼ 1; 2; � � � ; JÞ
The SQI that represents service quality is computed by standardizing the
measured score of service quality such that it ranges from 0 to 1 (i.e., service quality
score = 100, SQI = 1). When the service quality index score is less than 1 (i.e.,
0 \ service quality score B 100, 0 \ service quality index B 1), output decreases
proportionally with the SQI score. This model indicates that service quality is
inversely and proportionally related to the distance from the origin.
4 From theory to empirics
In this study, we develop assessment criteria for service productivity in the airline
industry and analyze the service productivity of 12 American airline carriers using
the SQ-adjusted DEA. In addition, we use the SQ-adjusted DEA to identify
differences between NCs and LCCs.
Given that we utilize a novel approach for measuring efficiency, this study
significantly deviates from previous research in three key ways. First, we utilize the
SQ-adjusted DEA to consider measurement items for service quality. Second, we
compare the standard DEA and the SQ-adjusted DEA in terms of calculation
efficiency. Finally, we employ longitudinal data from 2008 to 2011.
4.1 Data collection
Data for this study were acquired from the US Department of Transportation’s
monthly Air Travel Consumer Report and the Bureau of Transportation Statistics.
From these sources, we collected data from 12 US-based airlines over a four-year
period, from 2008 to 2011. These airlines included AirTran Airways (FL), Alaska
Airlines (AS), American Airlines (AA), American Eagle (MQ), Delta Air Lines
(DL), Frontier Airlines (F9), Hawaiian Airlines (HA), JetBlue Airways (B6),
SkyWest Airlines (OO), Southwest Airlines (WN), United Airlines (UA), and US
Airways (US). In addition, SQI scores, which are announced annually by AQR,
were used as proxy variables for the measurement of service quality.
146 K. Choi et al.
123

To measure service productivity for each respective airline, we treated total
number of employees and available seat miles (ASM) as input variables, and
revenue passenger miles (RPM) and operating revenue as outcome measures. Since
the airline industry is labor-intensive, our incorporation of the total number of
employees into the model as an input variable was intended to reflect the degree of
interaction that a particular airline carrier’s employees may have with customers.
The inclusion of ASM as an input variable and RPM as an outcome measure is well-
established in the literature on DEA analyses of the airline industry (Barbot et al.
2008; Barros and Peypoch 2009; Merkert and Hensher 2011). Further, we treated
operating revenue as an outcome measure because it is particularly sensitive to, and
thus, highly indicative of, changes in service quality (see Table 1).
As discussed above, we used Bowen and Headley’s (1991) AQR to assess
functional service quality in the airline industry. Based on a report by the US
Table 1 Descriptive statistics for inputs and outputs
2008 2009 2010 2011
Total number of
employees
Arithmetic
mean
24,987 24,744 27,221 27,691
Standard
deviation
22,961.12 22,371.49 26,625.49 26,580.12
Maximum 75,074 71,450 82,424 81,853
Minimum 3,707 3,844 4,023 4,314
Available seat miles
(ASM)
Arithmetic
mean
60,710,001 57,117,210 64,109,455 60,167,768
Standard
deviation
56,746,984.76 52,381,540.10 63,488,681.21 58,517,270.67
Maximum 163,384,378 151,587,373 195,540,168 182,400,046
Minimum 9,490,183 9,694,579 10,125,903 10,812,158
Revenue passenger
miles (RPM)
Arithmetic
mean
48,200,846 45,944,952 52,826,528 49,782,051
Standard
deviation
45,649,222.10 42,517,181.84 52,918,647.10 48,517,446.28
Maximum 131,663,198 122,304,104 164,152,874 151,750,839
Minimum 7,383,756 7,146,149 7,985,814 8,335,335
Operating revenue Arithmetic
mean
8,701,899 7,495,356 9,531,576 10,554,623
Standard
deviation
8,633,479.01 7,216,181.73 10,199,111.87 11,099,107.75
Maximum 23,696,100 19,898,245 31,893,702 35,271,378
Minimum 1,211,733 1,113,397 1,312,221 1,651,121
Service quality index Arithmetic
mean
0.63 0.58 0.66 0.67
Standard
deviation
0.24 0.20 0.21 0.22
Maximum 0.94 0.84 0.91 0.90
Minimum 0.08 0.09 0.08 0.07
A service quality-adjusted DEA model 147
123

Department of Transportation (DOT), the primary role of the AQR is to establish
the respective importance of four factors that could influence consumers’
perceptions of airline quality, and then determine each airline’s service quality
through a weighted average calculation that incorporates those factors.
The AQR uses the following four factors to determine an airline’s service
quality: on-time arrival (OT), mishandled baggage (MB), involuntary denied
boarding (DB), and 12 types of customer complaint. In addition, a constant value in
the denominator represents the relative importance of each factor (see Table 2).
4.2 Calculation of service quality index (SQI)
Since SQ-adjusted DEA is calculated by multiplying the service output by SQI,
existing AQR scores must be converted to a standardized SQI value that falls
Table 2 The definition & formulation of AQR (Source Airline Quality Rating Reports)
Factor Weight Description
On-time performance
(OT)
?8.63 Regularly published data regarding on-time arrival performance is
obtained from the U.S. Department of Transportation’s Air Travel
Consumer Report. According to the DOT, a flight is counted ‘‘on
time’’ if it is operated within 15 min of the scheduled time shown
in the carriers’ Computerized Reservations Systems. The AQR
calculations use the percentage of flights arriving on time for each
airline for each month
Mishandled baggage
reports (MB)
-7.92 Regularly published data regarding consumer reports to the carriers
of mishandled baggage can be obtained from the U.S. Department
of Transportation’s Air Travel Consumer Report. According to the
DOT, a mishandled bag includes claims for lost, damaged, delayed,
or pilfered baggage. Data are reported by carriers as to the rate of
mishandled baggage reports per 1,000 passengers and for the
industry. The AQR ratio is based on the total number of reports
each carrier received from passengers concerning lost, damaged,
delayed, or pilfered baggage per 1,000 passengers served
Involuntary denied
boardings (DB)
-8.03 This criterion includes involuntary denied boardings. Data regarding
denied boardings can be obtained from the U.S. Department of
Transportation’s Air Travel Consumer Report. Data include the
number of passengers who hold confirmed reservations and are
involuntarily denied boarding on a flight that is oversold. These
figures include only passengers whose oversold flight departs
without them onboard. The AQR uses the ratio of involuntary
denied boardings per 10,000 passengers boarded by month
Consumer complaints
(CC)
-7.17 The criteria of consumer complaints are made up of 12 specific
complaint categories monitored by the U. S. Department of
Transportation and reported monthly in the Air Travel Consumer
Report. Consumers can file complaints with the DOT in writing, by
telephone, via e-mail, or in person. The AQR uses complaints about
the various categories as part of the larger customer complaint
criteria and calculates the consumer complaint ratio on the number
of complaints received per 100,000 passengers flown for each
airline
AQR ¼ 8:63�OT�7:92�MB�8:03�DB�7:17�CC8:63þ7:92þ8:03þ7:17
148 K. Choi et al.
123

somewhere between 0 and 1. An SQI value of 1 indicates a service quality score of
100 (i.e., perfect output). When an airline’s SQI value is less than 1, output
decreases proportionally with it.
Upper bound (f) and lower bound (f) are computed with f (upper bound) = max
OT ? min (MB, DB, CC) and f (lower bound) = min OT ? max (MB, DB, CC),
respectively. The upper and lower bound values are calculated by a range of setting
of years. Additionally, the AQR score for each DMU is converted to its
corresponding value between 0 and 1, and the converted score is further transformed
to an SQI score. For example, the ranges of SQI scores for each airline are depicted
in Fig. 2. Each DMU is marked with its respective upper and lower bound. The
numbers in parentheses are the SQI scores for each respective airline carrier.
4.3 Results of SQ-adjusted DEA on US airlines
The chief goals of this study are to analyze differences between the standard DEA
and the SQ-adjusted DEA, and examine airline efficiency using the SQ-adjusted
DEA on 12 US airlines consisting of NCs and LCCs. This section reports the results
of the analyses we conducted to achieve these goals.
First, the average AQR score for all the LCCs, FL, F9, HA, B6, OO, and WN,
except MQ, was 0.73. MQ not used to calculate average AQR because its score was
an outlier (too low). The average AQR score for NCs was 0.63. Among the LCCs,
FL, MQ, HA, UA, and US were shown to be efficient prior to quality adjustment. Of
these airlines, only FL and HA remained efficient after quality adjustments. There
were no efficient NCs after quality adjustments were made.
As stated above, LCCs provide cheaper fares than those offered by other airlines.
Because of decreased revenue associated with these lower fares, LCCs have largely
adopted an approach that provides minimal services to reduce operating costs. For
example, many LCCs have eliminated VIP lounges at airports, reduced the number
FL AS AA MQ CO DL F9 HA B6 OO WN UA US
Range(2.82)
f (Upper Bound)=maxOT +min(DB, MB,CC)f (Lower Bound)=minOT +max(DB, MB,CC)
Upper Bound(-0.53)
-0.84(0.89)
-1.16(0.78)
-1.71(0.38)
-3.12(0.08)
-1.39(0.69)
-2.09(0.45)
-1.31(0.72)
-0.69(0.94)
-0.90(0.87)
-2.13(0.43)
-1.23(0.75)
-1.83(0.54)
-1.77(0.56)
LowerBound(-3.35)
Fig. 2 The change of service quality index from AQL score in 2008 year
A service quality-adjusted DEA model 149
123

of flight attendants to their legal minimum per flight, and done away with first- and
business-class flight options. Nevertheless, the fact that the AQR scores for LCCs
are higher than those for NCs suggests that the NCs suffer operational problems
while the LCCs are operationally efficient. Since customers who use NCs typically
have high expectations about the quality of the airline service they are to receive,
the gap between expected and actual service quality can be significant.
On the contrary, passengers who use LCCs typically expect a low level of service
quality. Therefore, small improvements can translate to perceptions of high service
quality among passengers. To exploit this, LCCs have recently begun to provide a
number of services to customers that they had previously not offered. These
improvements have resulted in higher perceptions of service quality among
passengers and an increase in service productivity. These results, as well as those for
the NCs, are shown in Table 3.
The analyses also demonstrated that among LCCs, MQ is the most efficient
airline. Regardless of its service quality, MQ generates high levels of service
productivity. In contrast, WN is perceived well in terms of service quality but
service productivity is low. Taken together, MQ and WN demonstrate the long-
established negative correlation between service quality and service productivity.
FL and HA demonstrated high levels of service quality and productivity. In
contrast, OO was shown to have lower levels of service productivity and service
quality. In contrast to the relationships depicted above, the mutually positive
relationships for service productivity and quality associated with FL and HA, in
conjunction with the mutually negative relationships for service productivity and
quality associated with OO collectively demonstrated a positive correlation between
service productivity and quality. B6 was shown to have service quality and
productivity levels that were relatively close to the average. As a consequence, it is
difficult to interpret the relationship between service quality and service produc-
tivity for that airline carrier.
Finally, among the NCs, DL, UA, and US showed higher levels of service
productivity and lower levels of service quality in 2008 and 2009. Additionally, AS
demonstrated relatively better service productivity associated with higher levels of
service quality. As such, UA, US, and AS illustrated the existence of a tradeoff
between service quality and service productivity. Like OO, however, AA was
characterized as low service quality and productivity, thus providing evidence
against the presence of an inherent tradeoff.
4.4 Mann–Whitney test between NC and LCC
The respective efficiencies of the individual airline carriers may be attributable to
the group for which they were assigned. This seems common sense, as different
levels of efficiency were expected for NCs and LCCs. Therefore, to compare LCCs
and NCs on the basis of their collective efficiencies, we employed a Mann–Whitney
test to analyze the differences between the two groups. The Mann–Whitney test is
used to empirically examine differences between two groups when one (or both)
group(s) are either non-normally distributed or comprised fewer than 30
observations.
150 K. Choi et al.
123

Ta
ble
3T
he
resu
lts
of
U.S
.ai
rlin
est
andar
dD
EA
and
SQ
-ad
just
edD
EA
Car
rier
DM
UY
ear
Sta
nd
ard
DE
AS
Q-a
dju
sted
ou
tpu
tD
EA
AQ
Lsc
ore
Sco
rev
aria
tio
n
Effi
cien
cyE
xce
ssiv
ein
put
Ref
eren
ceE
ffici
ency
Exce
ssiv
ein
put
Ref
eren
ce
Inp
ut
1In
pu
t2
Inp
ut
1In
pu
t2
LC
CA
irT
ran
(FL
)2
00
81
.00
00
0F
L1
.000
00
FL
0.8
9œ
20
09
1.0
00
00
FL
1.0
00
00
FL
0.8
2o
20
10
1.0
00
00
FL
1.0
00
00
FL
0.9
1œ
20
11
1.0
00
00
FL
1.0
00
00
FL
0.9
0œ
Am
eric
anE
agle
(MQ
)2
00
81
.00
00
0M
Q0
.144
9,3
91
8,8
74
,077
HA
0.0
8.
0.8
56
20
09
1.0
00
00
MQ
0.1
69
9,1
63
8,1
57
,396
HA
0.0
9.
0.8
32
20
10
1.0
00
00
MQ
0.1
30
9,7
56
9,3
93
,304
US
0.0
8.
0.8
70
20
11
0.9
82
5,7
24
20
7,8
88
US
0.0
98
10
,56
71
0,0
90
,09
3D
L0
.07
.0
.884
Fro
nti
er(F
9)
20
08
0.9
90
19
41
14
,77
1H
A0
.759
1,2
80
2,8
95
,395
HA
0.7
2o
0.2
31
20
09
0.9
66
1,6
84
35
4,7
75
HA
0.7
22
2,7
06
2,9
30
,625
HA
0.6
3.
0.2
44
20
10
0.9
77
1,2
83
25
3,9
55
HA
0.7
04
2,4
79
3,2
63
,374
HA
0.6
3.
0.2
73
20
11
1.0
00
00
F9
0.9
51
1,2
22
53
3,7
22
FL
,HA
0.7
9o
0.0
49
Haw
aiia
n(H
A)
20
08
1.0
00
00
HA
1.0
00
00
HA
0.9
4œ
20
09
1.0
00
00
HA
1.0
00
00
HA
0.8
4o
20
10
1.0
00
00
HA
1.0
00
00
HA
0.8
7œ
20
11
0.9
96
18
45
,45
1F
L,A
S1
.000
00
HA
0.8
5œ
-0
.00
4
JetB
lue
(B6
)2
00
80
.98
91
34
36
5,2
66
FL
,DL
0.9
34
78
82
,155
,456
FL
,HA
0.8
7œ
0.0
55
20
09
0.9
63
46
41
,205
,54
4F
L,H
A0
.893
1,3
46
3,4
97
,491
FL
,HA
0.7
8o
0.0
71
20
10
0.9
77
29
98
01
,08
1F
L,H
A0
.911
1,1
59
3,1
10
,226
FL
,HA
0.8
3o
0.0
66
20
11
0.9
68
45
41
,097
,10
1A
S,F
90
.957
2,0
28
1,4
49
,251
FL
,HA
0.8
5œ
0.0
10
A service quality-adjusted DEA model 151
123

Ta
ble
3co
nti
nu
ed
Car
rier
DM
UY
ear
Sta
nd
ard
DE
AS
Q-a
dju
sted
ou
tpu
tD
EA
AQ
Lsc
ore
Sco
rev
aria
tio
n
Effi
cien
cyE
xce
ssiv
ein
put
Ref
eren
ceE
ffici
ency
Exce
ssiv
ein
put
Ref
eren
ce
Inp
ut
1In
pu
t2
Inp
ut
1In
pu
t2
Sk
yW
est
(OO
)2
00
80
.927
4,7
10
1,0
65
,850
DL
,HA
0.5
07
6,9
96
7,2
11
,338
HA
0.4
3.
0.4
21
20
09
0.9
32
4,0
08
1,0
15
,119
DL
,HA
0.5
40
6,3
81
6,9
02
,422
HA
0.4
8.
0.3
92
20
10
0.9
26
3,9
41
1,2
35
,617
HA
0.6
63
5,6
90
5,6
37
,347
HA
0.6
2.
0.2
63
20
11
0.9
17
3,4
59
1,2
98
,957
F9
0.6
81
6,4
92
4,9
91
,987
FL
,HA
0.6
3.
0.2
36
South
wes
t(W
N)
2008
0.8
89
3,9
94
11,5
04,6
00
FL
,DL
0.7
60
8,6
11
30,5
40,4
95
FL
,HA
0.7
5o
0.1
29
20
09
0.9
88
40
65
,228
,919
FL
,UA
0.7
97
6,9
06
26
,59
5,0
28
FL
,HA
0.6
6D
0.1
91
20
10
0.9
74
90
73
,535
,145
FL
,UA
0.8
66
4,7
31
13
,19
5,8
61
FL
,HA
0.7
2o
0.1
08
20
11
0.9
51
1,8
84
4,7
18
,472
AS
,F9
0.8
01
8,1
17
18
,95
5,9
48
FL
,HA
0.7
2o
0.1
49
Maj
or
Ala
ska
(AS
)2008
0.9
38
1,4
53
1,5
14,4
42
DL
,HA
0.8
59
2,0
82
3,4
12,7
85
HA
0.7
8o
0.0
79
20
09
0.9
55
66
81
,033
,591
DL
,HA
0.6
80
3,6
90
7,3
87
,311
HA
0.5
4.
0.2
75
20
10
0.9
80
18
94
81
,31
1F
L,H
A,U
A0
.936
61
71
,56
8,7
39
FL
,HA
0.7
4o
0.0
45
20
11
1.0
00
00
AS
1.0
00
00
AS
0.7
7o
Am
eric
an(A
A)
20
08
0.9
78
13
,76
63
,530
,604
DL
,HA
0.7
00
30
,39
74
9,0
07
,74
3H
A0
.58
.0
.278
20
09
0.9
70
10
,04
24
,551
,331
DL
,HA
0.7
40
26
,96
13
9,3
85
,22
4H
A0
.58
.0
.230
20
10
0.9
66
12
,23
85
,195
,585
HA
,UA
0.8
00
18
,78
03
0,6
91
,56
1H
A,U
S0
.62
.0
.167
20
11
0.9
59
8,3
01
5,7
97
,967
F9
,UA
0.7
15
27
,66
74
0,2
87
,90
4D
L,H
A0
.59
.0
.244
Del
ta(D
L)
20
08
1.0
00
00
DL
0.6
30
17
,87
74
9,8
94
,81
7H
A0
.45
.0
.371
20
09
1.0
00
00
DL
0.6
24
23
,24
74
5,6
53
,74
7H
A0
.43
.0
.376
20
10
0.9
96
6,7
51
78
5,1
40
HA
,UA
0.9
32
5,6
38
13
,37
5,6
42
HA
,US
0.6
5D
0.0
64
20
11
0.9
87
3,2
08
2,3
31
,958
F9
,UA
1.0
00
00
DL
0.7
7o
-0
.01
3
152 K. Choi et al.
123

Ta
ble
3co
nti
nu
ed
Car
rier
DM
UY
ear
Sta
nd
ard
DE
AS
Q-a
dju
sted
ou
tpu
tD
EA
AQ
Lsc
ore
Sco
rev
aria
tio
n
Effi
cien
cyE
xce
ssiv
ein
put
Ref
eren
ceE
ffici
ency
Exce
ssiv
ein
put
Ref
eren
ce
Inp
ut
1In
pu
t2
Inp
ut
1In
pu
t2
Un
ited
(UA
)2
00
81
.000
00
UA
0.7
28
13
,21
04
2,6
95
,03
6H
A0
.54
.0
.272
20
09
1.0
00
00
UA
0.7
11
13
,46
73
6,3
94
,49
3H
A0
.53
.0
.289
20
10
1.0
00
00
UA
0.9
18
3,8
04
9,7
98
,788
FL
,HA
0.6
1.
0.0
82
20
11
1.0
00
00
UA
0.6
85
14
,62
63
3,6
55
,13
1A
S,D
L0
.51
.0
.315
US
Air
way
s(U
S)
20
08
1.0
00
00
US
0.7
82
11
,17
91
6,1
61
,83
0H
A0
.56
.0
.218
20
09
1.0
00
00
US
0.8
88
7,1
47
7,9
36
,198
HA
0.6
0.
0.1
12
20
10
1.0
00
00
US
1.0
00
00
US
0.6
6D
20
11
1.0
00
00
US
0.8
56
6,7
85
9,6
01
,685
DL
0.6
4.
0.1
44
œ:
AQ
LC
0.8
5,o:
0.7
0\
AQ
LB
0.8
5,D
:0
.65\
AQ
LB
0.7
0,
.:
AQ
LB
0.6
5
A service quality-adjusted DEA model 153
123

As demonstrated by Table 4, between 2008 and 2011, the NCs and LCCs
maintain nearly the same level of efficiency according to the standard DEA and the
SQ-adjusted DEA. In the study, the Mann–Whitney test verifies this perceptible
trend, as there is no overall significant difference between NCs and LCCs with
respect to efficiency. However, when the analysis is isolated to 2010 and 2011,
results of the SQ-adjusted DEA suggest that LCCs may be more efficient than NCs.
Despite this possibility, the failure of the Mann–Whitney test to identify a
statistically significant difference in the efficiency of the two groups makes it
difficult to conclude that the respective efficiencies of the groups differ.
5 Managerial implications
Given the findings reported above, there are several implications of this study that
may be important for understanding the airline industry and its operations. First,
after quality adjustment, WN moved from Quadrant III (Fruitless Scenario) to
Quadrant IV (win–win scenario). This indicates that DMUs do not exist in the
Fruitless Scenario. By analyzing service productivity with SQ-adjusted DEA, this
result illustrates that quality and productivity can both be attained. As service
quality improves, customer satisfaction also improves, which leads to an increase in
service productivity. Therefore, the results of this study suggest that organizations
must develop strategic methods for improving service quality (and, as a result,
service productivity) by leveraging inputs of service resources.
Second, the results show that the ways in which the airlines are evaluated with
respect to service productivity differs as a function of the methodology employed
(see Fig. 3). For example, the results show that after the quality adjustment, several
DMUs’ (DL, UA, and US) respective levels of service productivity were reduced.
However, AA and AS, which initially suffered from low levels of service
productivity, experienced a service productivity increase after adjustment. B6, OO,
and WN also showed general increases in service productivity as a result of the SQ-
adjusted DEA. On the other hand, MQ, which was considered to be an effective
company among DMUs, was shown to be inefficient by the SQ-adjusted DEA.
These results suggest that SQ-adjusted DEA generates a more comprehensive view
of service productivity than had previously been possible through the standard DEA.
As such, this study has shown that the SQ-adjusted DEA model is an effective tool
for gauging service productivity through comparative evaluation among DMUs.
Third, when evaluating their own service productivity, rather than using a
universal method for evaluation, service firms must use a method that is in
accordance with the firm’s purpose or operational characteristics. Consider, for
example, the differences that emerged between the LCCs and NCs. Analysis of the
LCCs demonstrated that there is no relationship between service quality and
productivity. As a result, low-cost airlines are better suited to be evaluated by the
standard DEA because of a more complex relationship between service equality and
productivity. Further, LCCs attain competitive advantages through price competi-
tiveness and cost reduction rather than service quality. In contrast, it would be more
154 K. Choi et al.
123

Ta
ble
4M
ann–
Wh
itn
eyte
stb
etw
een
NC
and
LC
C
Var
iab
les
NC
LC
CM
ann–
Wh
itn
eyU
ZP
val
ue
(tw
o-s
ide)
Av
erag
e
effi
cien
cy
Av
erag
e
ran
k
Ran
k
sum
Av
erag
e
effi
cien
cy
Av
erag
e
ran
k
Ran
ksu
m
Effi
cien
cy(2
00
8)
Sta
nd
ard
0.9
71
7.1
03
5.5
00
.98
36
.07
42
.50
14
.50
-0
.520
0.6
03
SQ
-ad
j.0
.729
5.8
02
9.0
00
.74
07
.00
49
.00
14
.00
-0
.569
0.5
69
Effi
cien
cy(2
00
9)
Sta
nd
ard
0.9
78
7.1
03
5.5
00
.98
56
.07
42
.50
14
.50
-0
.520
0.6
03
SQ
-ad
j.0
.731
5.6
02
8.0
00
.72
87
.14
50
.00
13
.00
-0
.732
0.4
64
Effi
cien
cy(2
01
0)
Sta
nd
ard
0.9
79
7.0
03
5.0
00
.98
86
.14
43
.00
15
.00
-0
.422
0.6
73
SQ
-ad
j.0
.753
7.8
03
9.0
00
.91
75
.57
39
.00
11
.00
-1
.063
0.2
88
Effi
cien
cy(2
01
1)
Sta
nd
ard
0.9
73
7.8
03
9.0
00
.98
95
.57
39
.00
11
.00
-1
.095
0.2
74
SQ
-ad
j.0
.784
6.8
03
4.0
00
.85
26
.29
44
.00
16
.00
-0
.248
0.8
04
A service quality-adjusted DEA model 155
123

appropriate to evaluate the service productivity of NCs with the SQ-adjusted DEA
because NCs highlight the quality of their services to attain a competitive advantage.
Finally, the results of this study suggest that while service quality is an attractive
quality element for LCCs, it is a required quality element in NCs (Kano et al. 1984).
For LCCs, a high degree of service quality can provide satisfaction to customers
whether it meets their expectations or not. For NCs, however, customers anticipate
having their expectations met. Therefore, for NCs, increases in service quality may
generate a relatively small increase in customer satisfaction, but a decrease in
service quality results in large decrease in customer satisfaction. Consequently,
service firms must strategically provide service quality that matches the firm’s
classification.
While customers who select NCs expect to receive the highest level of service
quality, customers of LCCs are more motivated by the cost of the flight. Therefore,
NCs must seek to improve service quality but LCCs can attain success through a
strategic approach that forgoes service quality for the sake of lower airfares.
6 Conclusions
In response to the assertion that a measurement tool for service productivity that
integrates service quality would be critically important for various service
industries, this study proposed a model for evaluating the service productivity of
airline carriers called the SQ-adjusted DEA. Relative to the standard DEA, the SQ-
adjusted DEA places a greater emphasis on service quality as a factor that relates to
service productivity.
As firms increasingly dedicate resources to improving service quality, they tend
to focus on efficiency in the short term. However, in the long term, a focus on
service quality may help to increase customer satisfaction, thus improving service
productivity and overall organizational performance. However, because standard
Fig. 3 The change of service productivity in U.S. airlines
156 K. Choi et al.
123

DEA does not incorporate service quality into its calculations, it is limited in its
ability to evaluate service productivity. In contrast, the SQ-adjusted DEA, which
bases its calculations on service quality, is better suited to explore service
productivity.
As mentioned above, firms that pursue an excessively quality-oriented strategy in
the short term may risk decreasing their service productivity. Therefore, firms would
do well to establish strategies that account for service productivity and quality.
Doing so allows firms to pursue a ‘‘win–win’’ strategy that is characterized by a
balance of service quality and productivity. The use of the SQ-adjusted DEA to
measure service productivity may be especially useful for helping a firm to establish
a strategy that can resolve balancing service quality and productivity.
Although the SQ-adjusted DEA model is clearly useful for firms that seek to
develop optimal strategies for balancing quality with productivity, it can be a
helpful tool for customers as well. Previous research has shown that improvements
in service quality yields increased customer satisfaction (Gronroos and Ojasalo
2004; Parasuraman 2010a, b). In addition, increases in service output can be
interpreted as increases in service productivity. Since the SQ-adjusted DEA model
integrates these two concepts into one strategic measurement tool, it could be useful
for customers that value service quality as a criterion with which to select an airline
carrier.
According to Shmenner’s service process matrix (1986), service firms are
categorized into four areas on the basis of customization and labor intensity.
According to the matrix, emphases on service quality or productivity are a function
of the characteristics and operational tendencies of firms. The respective weights for
service quality and productivity must be set on the basis of the stage of the life cycle
in which the firm currently exists. Additionally, the weights must be set established
as a function of a service quality (SQ)-focused strategy for NC customers and
service productivity (SP)-focused strategy for LCC customers. This method of
evaluation is contingent upon the careful identification of the strategic position or
operational purpose of the firm. Given its incorporation of two evaluation indices
(priority and weight), the SQ-adjusted DEA model may be useful for this type of
integrated analysis.
Despite the contributions offered by this study, it does suffer from a few
limitations. First, the AQR, which we used to measure airline service quality, is
limited in its ability to sufficiently evaluate the nature or delivery of service quality.
As such, service quality as evaluated by the AQR is likely different from service
quality as perceived by customers (Gardner 2004). To remedy this issue, the
development of a widely applicable service quality index that incorporates customer
perceptions is required. For example, there are currently a number of tools that
evaluate the service quality of airlines around the world. Some of these tools include
the Airline of the year distinction by ATW, the World’s 5-Star Airlines by Skytrax,
and the Global Traveler Tested Awards by Global Traveler. Each of these measures
of airline service quality incorporates some degree of customer perception. The use
of these tools may assist in identifying critical factors related to service quality.
These factors can then be applied to the SQ-adjusted DEA to more effectively
measure service productivity.
A service quality-adjusted DEA model 157
123

Second, improved service quality does not necessarily lead to an immediate
purchase. Generally, there is a time lag between customers’ perceptions of the
service quality and the purchase of that service. SQ-adjusted DEA does not account
for this time lag. In this model, service productivity is calculated by multiplying SQI
by service outcomes, both of which are measured during a fixed time period. Future
studies can redress this shortcoming by incorporating variables that account for the
time lag effect.
Third, because direct customer interaction is a critical component of service in
the airline industry, all input and output variables in the SQ-adjusted DEA model
relate to face-to-face interactions with customers. Since the SQ-adjusted DEA
model does not account for other variables that might affect the quality of a service
(e.g., available tonne-miles and passenger load factors), their respective influences
on service quality and productivity cannot be inferred. A consideration of these
variables in future research would produce a more comprehensive model for
evaluating service quality.
Acknowledgments This Research was financially supported by Hansung University during sabbatical
year (2013).
References
Barbot C, Costa A, Sochirca E (2008) Airlines performance in the new market context: a comparative
productivity and efficiency analysis. J Air Transp Manag 14:270–274
Barros CP, Peypoch N (2009) An evaluation of European airlines’ operational performance. Int J Prod
Econ 122(2):525–533
Bayraktar E, Tatoglu E, Turkyilmaz A, Delen D, Zaim S (2012) Measuring the efficiency of customer
satisfaction and loyalty for mobile phone brands with DEA. Expert Syst Appl 39(1):99–106
Bhaskara V (2012) US air travelers face higher airfares in 2012. Aspire Aviation. http://www.
aspireaviation.com/2012/01/05/us-airtravellers-face-higher-airfares-in-2012/. Accessed 9 Dec 2013
Bowen BD, Headley DE (2012) Airline quality rating report 2012. W. Frank Barton School of Business,
Wichita, KS. www.aqr.aero
Brissimis NS, Zervopoulos DP (2012) Developing a step-by-step effectiveness assessment model for
customer-oriented service organizations. Eur J Oper Res 223(1):226–233
Calabrese A (2012) Service productivity and service quality: a necessary trade-off? Int J Prod Econ
135(2):800–812
Caves DW, Christensen LR, Diewert WE (1982) The economic theory of index numbers and
measurement of input, output, and productivity. Econometrica 50(6):1393–1414
Chang S, Hsiao H, Huang L, Chang H (2011) Taiwan quality indicator project and hospital productivity
growth. Omega 39(1):14–22
Charnes A, Cooper WW, Thrall RM (1991) A structure for characterizing and classifying efficiency and
inefficiency in data envelopment analysis. J Prod Anal 2(3):197–237
Cronin JJ, Taylor SA (1992) Measuring Service Quality: a Re-Examination and Extension. J Mark
56(3):55–68
Davey A, Heracleous L, Wirts J, Pangarkar N (2007) Flying high in a competitive industry. Serv Bus
1(2):177–179
Evans J, Lindsay W (2009) Managing for quality and performance excellence. South-Western Cengage
Learning, Mason
Fare R, Grosskopf S, Forsund FR, Hayes K, Heshmati A (2006) Measurement of productivity and quality
in non-marketable services: with application to schools. Qual Assur Educ 14(1):21–36
Ferdows K, De Meyer A (1990) Lasting improvements in manufacturing performance: in search of a new
theory. J Oper Manag 9(2):168–184
158 K. Choi et al.
123

Fixler D, Zieschang K (1992) Incorporating ancillary measures of process and quality change into a
superlative productivity index. J Prod Anal 2(4):245–267
Frei FX (2006) Breaking the trade-off between efficiency and service. Harvard Bus Rev 88(11):93–101
Friesner LD (2003) An empirical examination of cost-adjusting in outpatient clinics. J Socio-Econ
31(6):745–759
Gardner ES (2004) Dimensional analysis of airline quality. Interfaces 34(4):272–279
Giannakis D, Jamasb T, Pollitt M (2005) Benchmarking and incentive regulation of quality of service: an
application to the UK electricity distribution network. Energy Policy 33(17):2256–2271
Gnanlet A, Yayla-Kullu H (2013) Impact of national culture on the quality of information delivery in
service. Serv Bus 2013:1–35
Good DH, Nadiri I, Roller L-H, Sickles RC (1993) Efficiency and productivity growth comparisons of
European and U.S. air carriers: a first look at the data. J Prod Anal 4:115–125
Gronroos C, Ojasalo K (2004) Service productivity. Towards a conceptualization of the transformation of
inputs into economic results in services. J Bus Res 57(4):414–423
Headley DE, Bowen BD (1997) International airline quality measurement. J Air Trans World Wide
2(1):55–63
Kano N, Seraku N, Takahashi F, Tsuji S (1984) Attractive quality and must-be quality. Hinshitsu
14:39–48
Khan MS, Mahapatra SS, Sreekumar NA (2008) Service quality evaluation of technical institutions using
data envelopment analysis. Int J Prod Qual Manag 3(1):127–143
Lapre MA, Scudder GD (2004) Performance improvement paths in the U.S. airline industry: linking
trade-offs to asset frontiers. Prod Oper Manag 13(2):53–71
Lin C (2005) Service quality and prospects for benchmarking: evidence from the Peru water sector. Util
Policy 13(3):230–239
Merkert R, Hensher DA (2011) The impact of strategic management and fleet planning on airline
efficiency: a random effects Tobit model based on DEA efficiency scores. Trans Res A 45:686–695
Nachum L (1999) The productivity of intangible factors of production: some measurement issues applied
to Swedish consulting firms. J Serv Res 2:123–137
Parast MM, Fini EH (2010) The effect of productivity and quality on profitability in US airline industry:
an empirical investigation. Manag Serv Qual 20(5):458–474
Parasuraman A (2010a) Service productivity, quality and innovation: implications for service-design
practice and research. Int J Qual Serv Sci 2(3):277–286
Parasuraman A (2010b) Service quality and productivity: a synergistic perspective. Manag Serv Qual
12(1):6–9
Parasuraman A, Zeithaml VA, Berry LL (1988) SERVQUAL: a multiple item scale for measuring
consumer perceptions of service quality. J Retail 64(1):12–40
Prior D (2006) Efficiency and total quality management in healthcare organization: a dynamic frontier
approach. Ann Oper Res 145(1):281–299
Rhoades DL, Waguespack B (1999) Better safe than service? The relationship between service and safety
quality in the US airline industry. Manag Serv Qual 9(6):396–400
Rhoades DL, Waguespack B (2008) Twenty years of service quality performance in the US airline
industry. Manag Serv Qual 18(1):20–33
Rouse P, Puterill M, Ryan D (2002) Integrated performance measurement design: insights from an
application in aircraft maintenance. Manag Account Res 13(2):229–248
Safizadeh MH, Ritzman LP, Mallick D (2000) Revisiting alternative theoretical paradigms in
manufacturing strategy. Prod Oper Manag 9(2):111–127
Scheraga CA (2004) Operational efficiency versus financial mobility in the global airline industry: a data
envelopment and Tobit analysis. Trans Res A 38(5):383–404
Schmenner WR (1986) How can service businesses survive and prosper. Sloan Manag Rev 27(3):21–32
Sherman HD, Zhu J (2006) Benchmarking with quality-adjusted DEA(Q-DEA) to seek lower cost high
quality service: evidence from U.S. bank application. Ann Oper Res 145(1):301–319
Sherman HD, Zhu J (2009) Case study: improving branch profitability and service with data envelopment
analysis. Bank Account Finance 22(3):15–24
Soteriou A, Stavrinides Y (2000) An internal customer service quality data envelopment analysis model
for bank branches. Int J Bank Mark 18(5):246–252
Soteriou A, Zenios SA (1999) Operations, quality, and profitability in the provision of banking services.
Manag Sci 45(9):1221–1238
A service quality-adjusted DEA model 159
123

Thanassoulis E, Boussoufiane A, Dyson RG (1995) Exploring output quality targets in the provision of
perinatal care in England using data envelopment analysis. Eur J Oper Res 80(3):588–607
Tiernan S, Rhoades DL, Waguespack B (2008) An exploratory cross-country analysis of the disconnect
between consumer perception and actual performance in the airline. Manag Serv Qual
18(3):212–224
Tsikriktsis N (2007) The effect of operational performance and focus on profitability: a longitudinal study
of the U.S. airline industry. Manuf Serv Oper Manag 9(4):506–517
Tsikriktsis N, Heineke J (2004) The impact of process variation on customer dissatisfaction: evidence
from the U.S. domestic airline industry. Decis Sci 35(1):129–141
160 K. Choi et al.
123