Kaizen Implementation to reduce “No Stock” in Stores · 1.3 Kaizen Kaizen is an internationally...
15
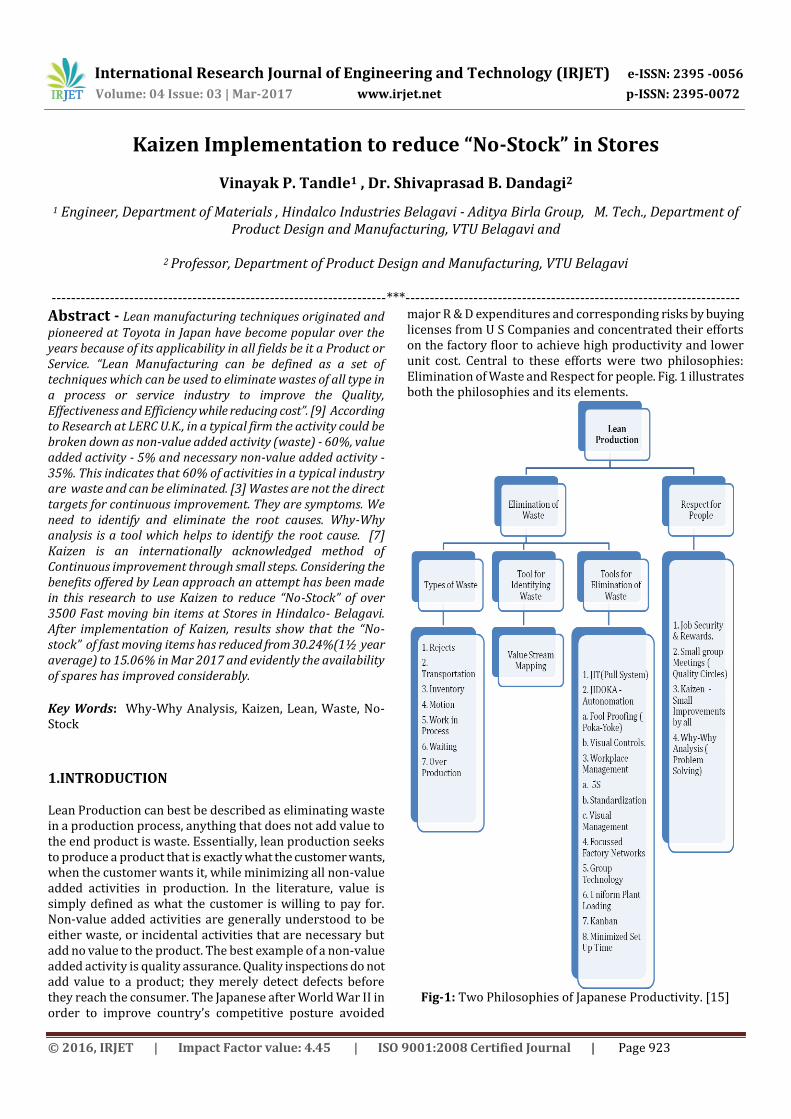
International Research Journal of Engineering and Technology (IRJET) e-ISSN: 2395 -0056 Volume: 04 Issue: 03 | Mar-2017 www.irjet.net p-ISSN: 2395-0072 © 2016, IRJET | Impact Factor value: 4.45 | ISO 9001:2008 Certified Journal | Page 923 Kaizen Implementation to reduce “No-Stock” in Stores Vinayak P. Tandle 1 , Dr. Shivaprasad B. Dandagi 2 1 Engineer, Department of Materials , Hindalco Industries Belagavi - Aditya Birla Group, M. Tech., Department of Product Design and Manufacturing, VTU Belagavi and 2 Professor, Department of Product Design and Manufacturing, VTU Belagavi ---------------------------------------------------------------------***--------------------------------------------------------------------- Abstract - Lean manufacturing techniques originated and pioneered at Toyota in Japan have become popular over the years because of its applicability in all fields be it a Product or Service. “Lean Manufacturing can be defined as a set of techniques which can be used to eliminate wastes of all type in a process or service industry to improve the Quality, Effectiveness and Efficiency while reducing cost”. [9] According to Research at LERC U.K., in a typical firm the activity could be broken down as non-value added activity (waste) - 60%, value added activity - 5% and necessary non-value added activity - 35%. This indicates that 60% of activities in a typical industry are waste and can be eliminated. [3] Wastes are not the direct targets for continuous improvement. They are symptoms. We need to identify and eliminate the root causes. Why-Why analysis is a tool which helps to identify the root cause. [7] Kaizen is an internationally acknowledged method of Continuous improvement through small steps. Considering the benefits offered by Lean approach an attempt has been made in this research to use Kaizen to reduce “No-Stock” of over 3500 Fast moving bin items at Stores in Hindalco- Belagavi. After implementation of Kaizen, results show that the “No- stock” of fast moving items has reduced from 30.24%(1½ year average) to 15.06% in Mar 2017 and evidently the availability of spares has improved considerably. Key Words: Why-Why Analysis, Kaizen, Lean, Waste, No- Stock 1.INTRODUCTION Lean Production can best be described as eliminating waste in a production process, anything that does not add value to the end product is waste. Essentially, lean production seeks to produce a product that is exactly what the customer wants, when the customer wants it, while minimizing all non-value added activities in production. In the literature, value is simply defined as what the customer is willing to pay for. Non-value added activities are generally understood to be either waste, or incidental activities that are necessary but add no value to the product. The best example of a non-value added activity is quality assurance. Quality inspections do not add value to a product; they merely detect defects before they reach the consumer. The Japanese after World War II in order to improve country’s competitive posture avoided major R & D expenditures and corresponding risks by buying licenses from U S Companies and concentrated their efforts on the factory floor to achieve high productivity and lower unit cost. Central to these efforts were two philosophies: Elimination of Waste and Respect for people. Fig. 1 illustrates both the philosophies and its elements. Fig-1: Two Philosophies of Japanese Productivity. [15]
Transcript of Kaizen Implementation to reduce “No Stock” in Stores · 1.3 Kaizen Kaizen is an internationally...
International Research Journal of Engineering and Technology (IRJET) e-ISSN: 2395 -0056
Volume: 04 Issue: 03 | Mar-2017 www.irjet.net p-ISSN: 2395-0072
© 2016, IRJET | Impact Factor value: 4.45 | ISO 9001:2008 Certified Journal | Page 923
Kaizen Implementation to reduce “No-Stock” in Stores
Vinayak P. Tandle1 , Dr. Shivaprasad B. Dandagi2
1 Engineer, Department of Materials , Hindalco Industries Belagavi - Aditya Birla Group, M. Tech., Department of Product Design and Manufacturing, VTU Belagavi and
2 Professor, Department of Product Design and Manufacturing, VTU Belagavi
---------------------------------------------------------------------***---------------------------------------------------------------------
Abstract - Lean manufacturing techniques originated and pioneered at Toyota in Japan have become popular over the years because of its applicability in all fields be it a Product or Service. “Lean Manufacturing can be defined as a set of techniques which can be used to eliminate wastes of all type in a process or service industry to improve the Quality, Effectiveness and Efficiency while reducing cost”. [9] According to Research at LERC U.K., in a typical firm the activity could be broken down as non-value added activity (waste) - 60%, value added activity - 5% and necessary non-value added activity - 35%. This indicates that 60% of activities in a typical industry are waste and can be eliminated. [3] Wastes are not the direct targets for continuous improvement. They are symptoms. We need to identify and eliminate the root causes. Why-Why analysis is a tool which helps to identify the root cause. [7] Kaizen is an internationally acknowledged method of Continuous improvement through small steps. Considering the benefits offered by Lean approach an attempt has been made in this research to use Kaizen to reduce “No-Stock” of over 3500 Fast moving bin items at Stores in Hindalco- Belagavi. After implementation of Kaizen, results show that the “No-stock” of fast moving items has reduced from 30.24%(1½ year average) to 15.06% in Mar 2017 and evidently the availability of spares has improved considerably.
Key Words: Why-Why Analysis, Kaizen, Lean, Waste, No-Stock
1.INTRODUCTION Lean Production can best be described as eliminating waste in a production process, anything that does not add value to the end product is waste. Essentially, lean production seeks to produce a product that is exactly what the customer wants, when the customer wants it, while minimizing all non-value added activities in production. In the literature, value is simply defined as what the customer is willing to pay for. Non-value added activities are generally understood to be either waste, or incidental activities that are necessary but add no value to the product. The best example of a non-value added activity is quality assurance. Quality inspections do not add value to a product; they merely detect defects before they reach the consumer. The Japanese after World War II in order to improve country’s competitive posture avoided
major R & D expenditures and corresponding risks by buying licenses from U S Companies and concentrated their efforts on the factory floor to achieve high productivity and lower unit cost. Central to these efforts were two philosophies: Elimination of Waste and Respect for people. Fig. 1 illustrates both the philosophies and its elements.
Fig-1: Two Philosophies of Japanese Productivity. [15]

International Research Journal of Engineering and Technology (IRJET) e-ISSN: 2395 -0056
Volume: 04 Issue: 03 | Mar -2017 www.irjet.net p-ISSN: 2395-0072
© 2017, IRJET | Impact Factor value: 5.181 | ISO 9001:2008 Certified Journal | Page 924
Fig. 2 shows that in a typical firm as per LERC research only 5% is the Value added activity while 95% is Non-Value added activity. [14]
Fig 2 Activities in a typical firm. [14]
1.1 Types of Waste Waste is any activity that does not add value to the product/service and the one which the customer is not at all interested in paying. The main principle of Lean is that waste ("Muda") is the key driver of inefficiency in any process or operation related to Service or Product. To improve efficiency, companies need to identify all types of waste and find ways to eliminate it. Toyota identified seven major types of non value-adding activities (waste) in business or manufacturing processes. These can be applied to product development, order taking, and the office, not just to a production line. [10].The 7 Deadly Wastes (Muda) shown in Fig. 3 are as defined by Taiichi ohono. [13]
Fig. 3 Seven Waste(Muda) and Value addition. [13]
It is interesting to note that 95% of the activities in a typical firm are waste and only 5% activities are value adding. These types of waste are not the direct targets for continuous improvement. They are symptoms. We need identify and eliminate the root causes. When these elements of waste exist, all they do is increase costs and add zero value to the product/service.
1.2 Value Stream Mapping Value stream mapping & analysis is a tool that allows
us to see the waste, and plan to eliminate it. A tool originally used by the Toyota Production System experts to study processes. Developed and refined by John Shook and Mike Rother in “Learning to See”. Used in manufacturing, engineering and administrative offices by lean experts to improve business processes. Value steam mapping reveals the waste.
A value stream involves all the steps, both value added and non value added, required to complete a product or service from beginning to end. This includes all the activities, even the in process storage of inventory and key metrics of the process. This visible understanding of current flow of activities allows for developing a future state map that will significantly reduce waste, decrease flow time, and make the process flow more efficiently and more effectively.
Fig.4 illustrates the Red-Yellow-Green Dot analysis to identify the Value added and Non-Value added activities. Value is defined as information /material in a form that the customer is willing to pay for. Value is defined by customer and created by the producer. A Value added activity is any action that transforms information/material into a capability for our ultimate customer at the right time and the right quality. Waste is any activity that consumes resources yet adds no value.
Fig.4 Red-Yellow-Green Dot Analysis. [17] Strategies can then be developed for specific actions
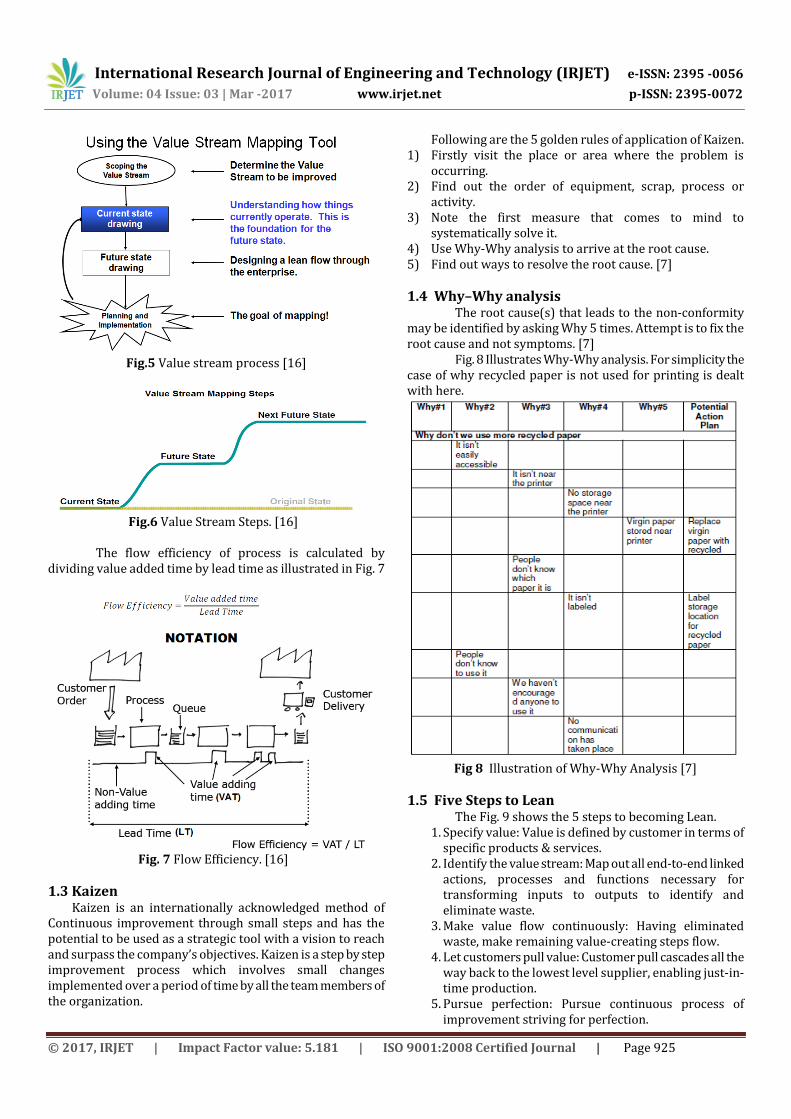
that will lead the operation toward the future state. Fig. 5 and 6 illustrates the value stream process & steps respectively.
International Research Journal of Engineering and Technology (IRJET) e-ISSN: 2395 -0056
Volume: 04 Issue: 03 | Mar -2017 www.irjet.net p-ISSN: 2395-0072
© 2017, IRJET | Impact Factor value: 5.181 | ISO 9001:2008 Certified Journal | Page 925
Fig.5 Value stream process [16]
Fig.6 Value Stream Steps. [16]
The flow efficiency of process is calculated by
dividing value added time by lead time as illustrated in Fig. 7
Fig. 7 Flow Efficiency. [16]
1.3 Kaizen Kaizen is an internationally acknowledged method of
Continuous improvement through small steps and has the potential to be used as a strategic tool with a vision to reach and surpass the company’s objectives. Kaizen is a step by step improvement process which involves small changes implemented over a period of time by all the team members of the organization.
Following are the 5 golden rules of application of Kaizen. 1) Firstly visit the place or area where the problem is
occurring. 2) Find out the order of equipment, scrap, process or
activity. 3) Note the first measure that comes to mind to
systematically solve it. 4) Use Why-Why analysis to arrive at the root cause. 5) Find out ways to resolve the root cause. [7]
1.4 Why–Why analysis The root cause(s) that leads to the non-conformity
may be identified by asking Why 5 times. Attempt is to fix the root cause and not symptoms. [7]
Fig. 8 Illustrates Why-Why analysis. For simplicity the case of why recycled paper is not used for printing is dealt with here.
Fig 8 Illustration of Why-Why Analysis [7]
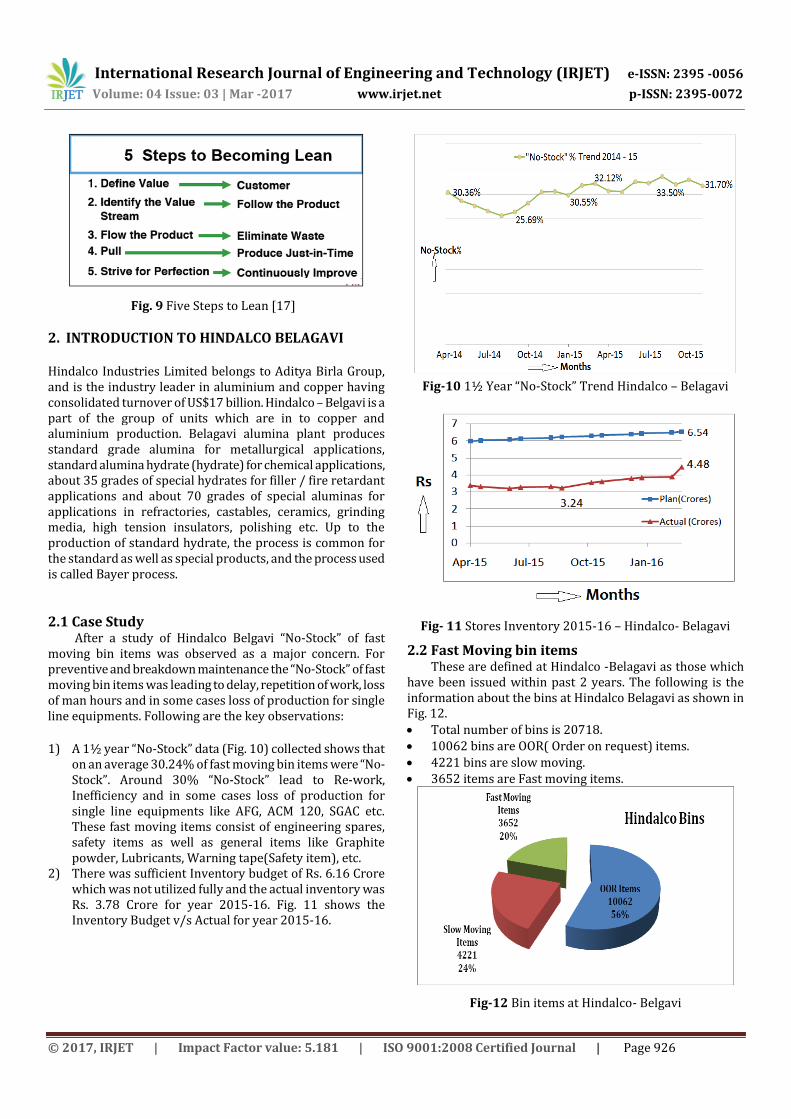
1.5 Five Steps to Lean The Fig. 9 shows the 5 steps to becoming Lean.
1. Specify value: Value is defined by customer in terms of specific products & services.
2. Identify the value stream: Map out all end-to-end linked actions, processes and functions necessary for transforming inputs to outputs to identify and eliminate waste.
3. Make value flow continuously: Having eliminated waste, make remaining value-creating steps flow.
4. Let customers pull value: Customer pull cascades all the way back to the lowest level supplier, enabling just-in-time production.
5. Pursue perfection: Pursue continuous process of improvement striving for perfection.
International Research Journal of Engineering and Technology (IRJET) e-ISSN: 2395 -0056
Volume: 04 Issue: 03 | Mar -2017 www.irjet.net p-ISSN: 2395-0072
© 2017, IRJET | Impact Factor value: 5.181 | ISO 9001:2008 Certified Journal | Page 926
Fig. 9 Five Steps to Lean [17]
2. INTRODUCTION TO HINDALCO BELAGAVI Hindalco Industries Limited belongs to Aditya Birla Group, and is the industry leader in aluminium and copper having consolidated turnover of US$17 billion. Hindalco – Belgavi is a part of the group of units which are in to copper and aluminium production. Belagavi alumina plant produces standard grade alumina for metallurgical applications, standard alumina hydrate (hydrate) for chemical applications, about 35 grades of special hydrates for filler / fire retardant applications and about 70 grades of special aluminas for applications in refractories, castables, ceramics, grinding media, high tension insulators, polishing etc. Up to the production of standard hydrate, the process is common for the standard as well as special products, and the process used is called Bayer process.
2.1 Case Study After a study of Hindalco Belgavi “No-Stock” of fast moving bin items was observed as a major concern. For preventive and breakdown maintenance the “No-Stock” of fast moving bin items was leading to delay, repetition of work, loss of man hours and in some cases loss of production for single line equipments. Following are the key observations:
1) A 1½ year “No-Stock” data (Fig. 10) collected shows that
on an average 30.24% of fast moving bin items were “No-Stock”. Around 30% “No-Stock” lead to Re-work, Inefficiency and in some cases loss of production for single line equipments like AFG, ACM 120, SGAC etc. These fast moving items consist of engineering spares, safety items as well as general items like Graphite powder, Lubricants, Warning tape(Safety item), etc.
2) There was sufficient Inventory budget of Rs. 6.16 Crore which was not utilized fully and the actual inventory was Rs. 3.78 Crore for year 2015-16. Fig. 11 shows the Inventory Budget v/s Actual for year 2015-16.
Fig-10 1½ Year “No-Stock” Trend Hindalco – Belagavi
Fig- 11 Stores Inventory 2015-16 – Hindalco- Belagavi
2.2 Fast Moving bin items These are defined at Hindalco -Belagavi as those which
have been issued within past 2 years. The following is the information about the bins at Hindalco Belagavi as shown in Fig. 12. Total number of bins is 20718. 10062 bins are OOR( Order on request) items. 4221 bins are slow moving. 3652 items are Fast moving items.
Fig-12 Bin items at Hindalco- Belgavi

International Research Journal of Engineering and Technology (IRJET) e-ISSN: 2395 -0056
Volume: 04 Issue: 03 | Mar -2017 www.irjet.net p-ISSN: 2395-0072
© 2017, IRJET | Impact Factor value: 5.181 | ISO 9001:2008 Certified Journal | Page 927
OOR items are procured only on request after approval by the respective HOD. Items which are not issued for more than 2 years are termed as Slow moving and such items will not be procured even if they have reached ROP or No-Stock levels. Slow moving items if needed will be procured after the user department gets the approval of Unit head.
3. LITERATURE REVIEW
The purpose of literature review is to gain insight into applications of Lean Principles in industries to explore the potential of its use in solving the problem faced at Hindalco Belagavi. Akhil kumar [1] in his research has identified the barriers
for implementation of lean. An attempt was made to find relationship among the identified barriers. A Study Survey instrument was used to find the importance of barriers of lean. The survey came out with importance of barriers but it did not clearly bring out the relation among the barriers.
Tasvir Singh et al. [2] In this paper research was done on how operational excellence can be achieved by applying the lean principles. All the factors that can contribute to implement lean were thoroughly studied. Also the challenges the companies face while implementing lean have been outlined.
P. M. Rojasra & M. N. Qureshi [3] This paper deals with the implementation of 5S in a small scale industry Krishna Plastic Company, Udhyognagar, Amreli, Gujarat. Among the available lean techniques, 5S was chosen and a Ten week study was carried out. After the 5S implementation production system efficiencies improved from 67% to 88.8% and this was achieved by eliminating the non value added activities.
Norani Nordin et al. [4] In this paper the extent to which lean implementation was done in the automotive industries in Malaysia was explored. The results show that most of the firms have implemented lean to some extent and are in transition phase. Also the main barrier to implementation of lean was the lack of understanding about lean principles by the management and the attitude of employees.
A. P. Chaple et al. [5] In this paper they have explored the extent to which Lean was being followed in the Indian industries. Effort has been made to find the enablers and barriers to implement lean principles in Indian industries. It was found that other than automotive and electronics industries the implementation of lean was found to be very weak in other industries.
R.T. Salunkhe et al. [6] In this paper they have carried out work at ABC industry in field of Inventory and spare part management by applying the lean principles. The lean principles used were 5S, Kaizen and Kanban. Due to Kanban system the inventory reduced to some extent. Kaizens & 5S helped find the spares faster and keep the spares in systematic way.
Mihail Aurel Titu et al. [7] In this paper have used the lean techniques like Kaizen and 5S. One very significant aspect which the paper brings our attention to is that the application of Kaizen does not require much of financial inputs in most of the cases but requires only the attention & intelligence of each and every individual who have the potential to create such results with very small and continual changes.
C. Yamagar et al. [8] In this paper have used the Lean manufacturing principles to solve problems in Material management. Review is done to see how the flow of material is managed by using lean principles. Basically the focus was to use lean to eliminate waste and make the system more efficient. Paper stresses that Lean is not a onetime activity and rather a continuous process over a considerable period of time.
3.1 Gap in Literature Survey. After the literature survey it was found that although Kaizen, Kanban, 5S etc., were used to improve product/service the use of why-why analysis was not much evident and elaborate. Also PDCA is an inherent part of improvement activity which did not find a clear mention and elaboration in the case studies undertaken. Thus in this research the gap is filled in by elaborating Why-Why analysis in combination with Kaizen and PDCA to address the problem in case study at Hindalco- Belagavi.
3.2 Problem formulation. R.T. Salunkhe et al. [6], Mihail Aurel Titu et al. [7] and C. Yamagar et al. [8] have utilized Lean principles like Kaizen, 5S and Kanban to solve problems related to Spare part and Inventory management faced at Industries. Similarly an attempt will be made in this research to use suitable Lean principles for solving the problem being faced at Hindalco Belgavi. Through preliminary study of Hindalco Belagavi it was observed that “No-Stock” of over 3500 Fast moving bin items was a major concern. A 1.5 year (April 2014 to Nov 2015) “No-Stock” data collected shows that on an average 30.24% of fast moving bin items were “No-Stock”. For preventive and breakdown maintenance the “No-Stock” of fast moving bin items leads to delay, poor quality work, repetition of work, ineffective and inefficient work, loss of man hours and in some cases loss of production for single line equipments. These fast moving bin items consist of engineering spares, safety items as well as general items like Graphite powder, Lubricants, Warning tape(Safety item), etc., Lean offers several tools like Kaizen, 5S, Kanban, JIT, Why-Why etc., Considering the benefits offered by Lean approach an attempt was made in this research to use these tools to arrive at suggestions to reduce “No-Stock” of fast moving bin items.
3.3 Problem Definition. To investigate the existing procurement system and propose solution to reduce the “No-Stock” of over 3500 fast moving bin items at Hindalco Belagavi.

International Research Journal of Engineering and Technology (IRJET) e-ISSN: 2395 -0056
Volume: 04 Issue: 03 | Mar -2017 www.irjet.net p-ISSN: 2395-0072
© 2017, IRJET | Impact Factor value: 5.181 | ISO 9001:2008 Certified Journal | Page 928
3.4 Objective of the Research Objective of research is to study the procurement activity in Stores & Purchase at Hindalco Belgavi to identify the bottle neck, find the root cause by Why-Why analysis and suggest Kaizen to eliminate the problem leading to “No-Stock” of fast moving items.
4. METHODOLOGY
In order to solve the defined problem at Hindalco - Belagavi the Methodology used is shown in Fig. 13.
Fig-13 Methodology Flow Chart
4.1 Why-Why Analysis. Table 1 illustrates the Why-Why analysis to go to the root cause of why the material is getting “No-Stock”.
Table 1 Why Why Analysis Why#1 Why#2 Why#3 Why
#4 Why
#5 Action
Plan 1. Why is the material getting “No-Stock” PR being
raised only for
No-Stock & No PRPO items
Generate PR for <=ROP
items and No PRPO
Items
Manually
difficult to
calculate pending
PRPO
Not aware of
excel function
for calculating pending
PRPO
Use PIVOT
TABLE to deduct
pending PRPO
Quantity and raise
PR for <=ROP items.
No training in Excel
Attend Excel
training
Negligence
Lead time is High
Monitor and
reduce Manual
Hard copy
routing of PR
Stop hard copy and use report
Old PO’s not yet closed
Lengthy process
for placing
PO
1)Revise DOA
2)Rate contracts
Buyer wise
Status of Bin wise
Lead time, No-
Stock data not available
Flagging to be done buyerwise in Maximo

International Research Journal of Engineering and Technology (IRJET) e-ISSN: 2395 -0056
Volume: 04 Issue: 03 | Mar -2017 www.irjet.net p-ISSN: 2395-0072
© 2017, IRJET | Impact Factor value: 5.181 | ISO 9001:2008 Certified Journal | Page 929
Table 1 Why Why Analysis Why#1 Why#2 Why#3 Why
#4 Why
#5 Action
Plan 2. Why is the material getting “No-Stock” The ROP
& EOQ levels set
are incorrect
Correct the Bin Levels
Levels set are
not based
on Consum
ption
Users are not aware of how to
get the consumption data
Awareness on how
to get consumption data
from Maximo
The
flagging of OOR
and Critical items is incorrec
t in many cases
Flag properly
Incomplete Bin
description is
leading to delay in placing
PO
Correct the Bin
Descriptions
The Change in Level and Descripti
on is done by hard
copy which
may not be
convenient.
Develop and Use System
application for Soft approval of Change
in Bin Level and Descripti
on
Table 1 Why Why Analysis Why#1 Why#2 Why#
3 Why#
4 Why#5
Action Plan
3. Why is the material getting “No-Stock” PR
Generation frequency is 2 weeks
Generate PR every week
It takes consider
able time to
manually
calculate the PR
Quantity
The TDN Quantity is noted manually from hard
copies
Maximo
TDN report is not used
Use the TDN & MRR
Report to Save
time V
Look function was not
used
Learn and
use V-Lookup
to deduct
TDN Qty
Auto PR in Maximo
not in use as it
generates PR for all
open work orders
which will lead to excess
procurement.
In Auto PR TDN quantity
is automat
ically deducted but it is not in
use

International Research Journal of Engineering and Technology (IRJET) e-ISSN: 2395 -0056
Volume: 04 Issue: 03 | Mar -2017 www.irjet.net p-ISSN: 2395-0072
© 2017, IRJET | Impact Factor value: 5.181 | ISO 9001:2008 Certified Journal | Page 930
4.2 Kaizen Table 2 Kaizen’s Identified in Stores
Stores
Sl
Problem/ Issues
Root Cause Kaizen
Benefits
Kaizen Imple
mented
1
In some cases Slow moving item procurement took long time as the hard copy sent for approval went missing or was untraceable
Hard copy approval system
Started using Soft approval system for Slow moving items from 4th Sep 2015 and application was enhanced in July 2016
1. Cycle time for approval can be monitored and reduced. 2. Requests are easily traceable with dates.
Yes
July 2016
2
Takes considerable time to manually calculate PR quantity
The TDN Quantity is deducted manually from hard copies.
TDN/PDN report from Maximo and VLookup being used.
Using Excel it is easy to deduct TDN quantity.
Yes
Oct 2015
3
PR was raised only for No Stock & No PRPO items. PR was not raised for ROP items. This lead to increase in “No-Stock”
As per standard practice PR has to be raised when ever Items reach ROP level which was not followed
Started to Raise PR for ROP items with no pending PRPO from 26 Oct 2015
Effective Procurement process and reduction in No-Stock %
Yes
Oct 2015
4
PR was not raised for ROP items with pending PRPO. Actually Auto PR facility of Maximo is not in use as the PR gets raised for all WO reservations and present Maximo version does not allow excluding WO reservations.Up gradation cost of Maximo is Rs 4 Crore.
Manually it is difficult to calculate pending PRPO quantity. Not aware about the use of excel functions to calculate the pending PRPO.
Started to Raise PR for ROP items deducting pending PRPO quantity, TDN quantity and current balance from 5 Dec 2015 using Pivot table and VLookup function in Excel. Improved in July 2016.
1. Effective Procurement process and Reduction in No-Stock % 2. Presently we can do away with investment of Rs 4 Crore
Yes
July 2016
Table 2 Kaizen’s Identified in Stores Stores
Sl
Problem/ Issues Root Cause Kaizen
Benefits Kaizen Imple
mented
5
Due to incorrect bin levels the bins were getting “No-Stock”.
1. Earlier the Bin levels were not set based on consumption and were rather targeted to reduce inventory which was already less than budget. e.g., GGL003416 O Ring Cord’s yearly consumption is 165 meter but the level set is ROP 3 and EOQ 6, which is very low. 2. The Hard copy approval system may be inconvenient for user’s cause of which levels are not revised on a regular and case to case basis.
Started using Soft approval system application for Change in Level of Bin items from 2nd April 2016.
1. Cycle time for approval can be monitored and reduced. 2. Requests are easily traceable with dates. 3. Effective Procurement and reduction in No-Stock %
Yes
April 2016
6
Due to incomplete bin descriptions the placing of PO is getting delayed. In most of cases it is observed that the Bin descriptions are incomplete. This in turn is leading to “No-Stock”
1.Negligence during new bin creation which did not include all the necessary information like Model, Make, Serial Number, Part number etc., e.g., ACG008034 RUNNER HALF COUPLING. 2. Also the Procedure to change the description is through hard copy. And it may be inconvenient for user’s cause of which corrections are not done on a regular and case to case basis.
Started using Soft approval system application for Change in Description of Bin April 2016 and improved in Aug 2016
1. Cycle time for approval can be monitored and reduced. 2. Requests are easily traceable with dates. 3. Effective Procurement and reduction in No-Stock %
Yes Aug
2016
7
Incorrect PR quantity
Old PR’s neither closed nor processed are reducing effectiveness of procurement process
More than 1 year old PR’s closed
Effective Procurement and reduction in No-Stock %
Yes

International Research Journal of Engineering and Technology (IRJET) e-ISSN: 2395 -0056
Volume: 04 Issue: 03 | Mar -2017 www.irjet.net p-ISSN: 2395-0072
© 2017, IRJET | Impact Factor value: 5.181 | ISO 9001:2008 Certified Journal | Page 931
Table 2 Kaizen’s Identified in Stores Stores
Sl
Problem/ Issues Root Cause Kaizen
Benefits Kaizen Imple
mented
8
For some Bin items PR is not being raised for stores stock if there is pending PRPO >=ROP+EOQ and if such quantity is requested by users.
PR quantity is calculated by deducting pending PRPO quantity from sum of ROP+EOQ. In some cases if there is already pending PRPO >= ROP+EOQ and if that quantity is requested by some users, then such items will get filtered out and PR will not be raised for stores stock. The root cause of this error is that presently there is no flagging facility available while making PR to flag such items as OOR or Fast moving Request or Slow moving and also against a specific user.
Flagging facility to be made available in Maximo which should allow while making PR to flag the following in the PR lines against each Bin item and later a report of the same would help solve this issue. 1)Requested User Name 2)OOR 3) Fast Moving Request 4) Slow Moving 5) Capex 6) Stores Stock
This will be very useful and will provide the following benefits. 1) PR for stores stock of such items can be raised after analysis. 2) It will be very helpful to segregate Slow moving, OOR and Capex requirement and also to follow up for consumption of requested items on receipt.
No
9
Presently buyer wise status of bin item wise pending PRPO or “No-Stock” % is not available through system report.
Bin items have not been flagged buyer wise
1) Bin items can be flagged buyer wise in Maximo. Or 2) Can be flagged in an excel sheet
Buyer wise monitoring will help to reduce “No-Stock, assess the workload on purchasers and distribute workload properly
Yes
July 2016
Table 2 Kaizen’s Identified in Stores Stores
Sl Problem/
Issues Root
Cause Kaizen Benefits
Kaizen Imple
mented
10
1] Physical effort needed for searching hard copy of material procurement request(memo/email print)filed in files. 2] Time consumed in searching the files
Hard copy print is required for filing
The PR number is mentioned in the Subject of email communication given to the purchase and Users.
1]Vvery easy to search the request communication and physical work to search it from files is eliminated. 2] Time saved 3] Paperless system
Yes
11
No Stock & Last Issue is entered in a Note book and by end of month it is again entered in excel sheet required for calculation and making PR
Entry in Hard copy
The entry into notebook is eliminated and is being directly done in excel sheet.
1] Repeat work is eliminate and time saved 2] Helps in daily monitoring of no stock items.
Yes
12
PR for No-stock items needs to be raised every alternate day which is being done along with ROP items presently being done every week.
If Kaizen no.4 for ROP items is used for No-Stock items it will be time consuming process if done alternate days.
Analysis sheet from Kaizen no. 4 along with Kaizen no. 11 used for raising PR for No-Stock items alternate days
Will help in reducing the procurement lead time of No-Stock items
Yes Mar
2017
13
Hard copy of PR took 2 to 3 days time to reach Purchase dept.
Manual routing process
Hard copy of PR was eliminated
Reductions in ead time by 2 to 3 days.
Yes

International Research Journal of Engineering and Technology (IRJET) e-ISSN: 2395 -0056
Volume: 04 Issue: 03 | Mar -2017 www.irjet.net p-ISSN: 2395-0072
© 2017, IRJET | Impact Factor value: 5.181 | ISO 9001:2008 Certified Journal | Page 932
Kaizen no. 8 will be very helpful to track PRPO user wise and will also help to segregate material procurement based on Capex, Stores Stock, OOR etc., The following drop down list should be made available in PR lines in Maximo while generating PR. Fig. 14 and 15 shows the dropdown list for users and PR type respectively which need to be added in the PR lines. In case if it is not possible to add the dropdown list in PR lines then it should be made available at least in the opening main page of PR. This will also help in easily identifying as to whom the material belongs to directly from the TDN itself.
Fig. 14 Drop down list of User to be added in PR lines in
Maximo PR page
Fig.15 Drop down list of PR type to be added in PR lines in Maximo PR page
Kaizen no. 9 has been implemented using the excel sheet. In Maximo flagging has to be done in Bin item master and then reports have to be generated accordingly. Since the version of Maximo is not updated this may be difficult to achieve. The excel sheet solution is presently feasible and thus implemented.
4.3 Kaizen for Calculating PR Quantity. This Kaizen is with regard to making use of reports
from Maximo like TDN/PDN, Total bins, All bins, 2 year consumption etc., along with excel functions like V Lookup, Pivot Table, IF, AND etc., to calculate the PR quantity of <=ROP items deducting pending PRPO quantity, TDN/PDN quantity and Current balance from sum of ROP & EOQ and make the PR generation process effective and efficient. Apart from the points mentioned in Why-Why analysis there are some other improvements done as well. For example some items like Oil have different issue and order units viz., Barrels and Liters. For such items conversion factor has been used in excel sheet. Fig. 16 is the screen shot of excel sheet being used every week for calculating the PR quantity. The PR is generated every week using excel sheet and the information about the PR generated, Pending PRPO and “No-Stock” trend is sent to Purchase team. With the support of purchase team under the leadership of Materials head the “No-Stock” % improved from a 1½ year average of 30.24% to 15.06% in March 2017 Methodology of PR Generation: Presently there are 20,718 Bins. Of these the slow moving and OOR bins are filtered out. The bins which have reached ROP are considered. Next the Bins with positive PR quantity obtained from the equation 1 are considered for making PR.
Fig-16 Kaizen for calculating PR Quantity using Excel Sheet
The functions and formula used in the Analysis Excel Sheet are given in Fig. 17
Fig-17 Function and Formula used in Analysis Excel Sheet

International Research Journal of Engineering and Technology (IRJET) e-ISSN: 2395 -0056
Volume: 04 Issue: 03 | Mar -2017 www.irjet.net p-ISSN: 2395-0072
© 2017, IRJET | Impact Factor value: 5.181 | ISO 9001:2008 Certified Journal | Page 933
Following excel data sheets are needed for calculating the PR quantity. Total bins data sheet obtained from Maximo reports. All bins data sheet obtained from Maximo reports. 2 Year Consumption data sheet obtained from Maximo
reports. TDN data sheet obtained from Maximo reports. MRR data sheet obtained from Maximo reports. Pending PRPO quantity data sheet obtained from Total
bin report by using PIVOT table function. Analysis data sheet is obtained by using functions like V
Lookup, IF, AND etc., using specific data from all the above data sheets.
The <=ROP items data sheet is obtained by filtering those items whose PR need to be raised from the Analysis data sheet.
4.4 Kaizen for Changing the Bin Levels and Description by Soft Approval System application.
One among other reasons for “No-Stock” of fast moving bin items is the bin levels are not correct in most of the cases and are not based on consumption. For example if we consider the Bin GGL000159 Graphite powder which is very critical for the proper functioning of kilns we see that the one year consumption is 988 tins which means the monthly consumption is 82 tins. This being a fast moving item was getting out of stock most of times. Hence the level was revised to ROP 200 & EOQ 200 considering the present lead time. The ROP & EOQ are not calculated based on standard equations as the lead time is not certain and the consumption is also varying in most cases. A constant lead time and consumption is a pre-requisite for the equations to be used. The procurement was held up for some bin items as the description available was incomplete e.g., ALB010001 Top pulley for oil skimmer. Here the Pulley diameter and type is not mentioned. Like these there are many cases where the Bin description is incomplete. The hard copy system was in practice for Changing Level/Description which was replaced by a simple soft approval system. Change in Bin Level/Description in Soft approval system was developed in house by systems department and this Kaizen was implemented on 2nd April 2016. The total bin items requested for change in level /description through this system from 2nd April 16 to 16th May 16 is 237 and the average cycle time for approval is 11 days with Range of 2 to 13 days. Since lot of Bins need to be revised the list of Bin items with 2 year consumption is sent to all users for review and changes will take place gradually. Fig. 18 Shows the list of some of the bin items which were revised. Fig. 19 is the screen shot of main screen of System application. Fig. 20 is the screen shot of opening screen of Change in Level/Description
Fig. 18 List of Bin items revised.
Fig 19 System Application Main Screen
Fig 20 Main Screen of Change in Level/Description
The screen shown in Fig 20 was not found to be user friendly as it did not display the name of initiator and name of approvers at one glance which made it difficult to find as to with whom the request is pending for approval. It was further improved as shown in Fig. 21 which was proposed to be so at the time of initiation itself foreseeing the considerations expressed before.

International Research Journal of Engineering and Technology (IRJET) e-ISSN: 2395 -0056
Volume: 04 Issue: 03 | Mar -2017 www.irjet.net p-ISSN: 2395-0072
© 2017, IRJET | Impact Factor value: 5.181 | ISO 9001:2008 Certified Journal | Page 934
Fig. 21 Improved Main Screen of Change in Level and
Description. The improved opening screen shows the name of the initiator and name of all approvers. Once the initiator fills the necessary details and saves it then an automated reference number is generated and an email is sent to the initiator and first approver for approval. After first approver approves the button turns to green from red color and the date of approval appears above the name and so on till the final approver approves after which an email is sent to Accounts in charge, stores team and the initiator about the final approval. The accounts person will make the approved changes in maximo and intimate to stores. This is a 100% paperless system.
4.5 Kaizen for Slow Moving Item Approval Any bin item which is not consumed in past 2 years
is termed a slow moving item and a justification note is required to be approved by the Unit head for procurement of the same. Earlier the approval was done through a hard copy which was replaced with the soft approval system as show in Fig. 22 and 23.
Fig 22 Slow moving Note Screen
Fig 23 Improved Slow moving Note Screen
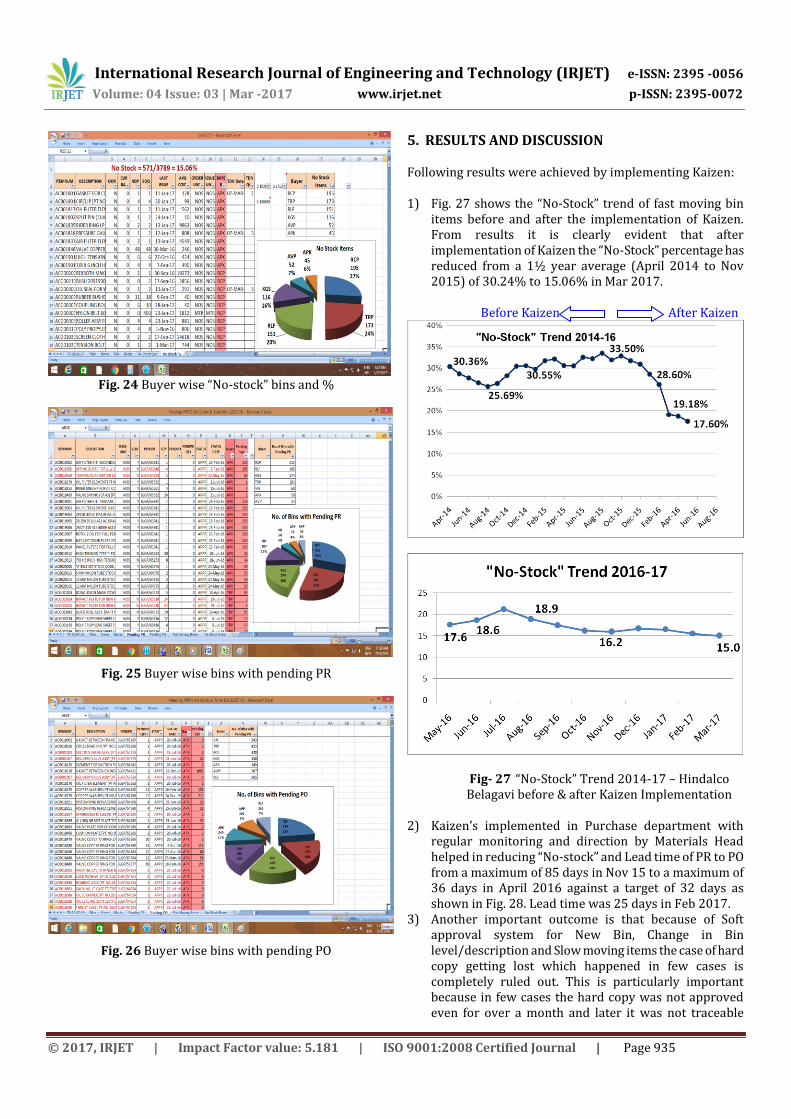
4.6 Kaizen for Buyer wise Pending PRPO and No-Stock % In the existing Maximo system the buyer wise report of pending PRPO or No-Stock items is not available as mentioned in Kaizen no 9 of Stores list in Table 2. In Maximo flagging has to be done in Bin item master and then reports have to be generated accordingly. Since the version of Maximo is not updated this may be difficult to achieve. The excel sheet solution is presently feasible and thus implemented using the V-lookup function. Buyerwise flagging will help to monitor and reduce No-Stock. Fig. 24 shows the screen shot of “No-stock” report where in after the kaizen buyer wise “No-stock” list is available which was not possible before. This report will be sent to the buyer’s on weekly basis which will help in reducing the “”No-stock” of items. This Kaizen was implemented in 2nd week of July 2016. Fig. 25 & 26 shows buyer wise pending PR and PO respectively.
Fig. 24 Buyer wise “No-stock” bins and %
International Research Journal of Engineering and Technology (IRJET) e-ISSN: 2395 -0056
Volume: 04 Issue: 03 | Mar -2017 www.irjet.net p-ISSN: 2395-0072
© 2017, IRJET | Impact Factor value: 5.181 | ISO 9001:2008 Certified Journal | Page 935
Fig. 24 Buyer wise “No-stock” bins and %
Fig. 25 Buyer wise bins with pending PR
Fig. 26 Buyer wise bins with pending PO
5. RESULTS AND DISCUSSION Following results were achieved by implementing Kaizen: 1) Fig. 27 shows the “No-Stock” trend of fast moving bin
items before and after the implementation of Kaizen. From results it is clearly evident that after implementation of Kaizen the “No-Stock” percentage has reduced from a 1½ year average (April 2014 to Nov 2015) of 30.24% to 15.06% in Mar 2017. Before Kaizen After Kaizen
Fig- 27 “No-Stock” Trend 2014-17 – Hindalco Belagavi before & after Kaizen Implementation
2) Kaizen’s implemented in Purchase department with
regular monitoring and direction by Materials Head helped in reducing “No-stock” and Lead time of PR to PO from a maximum of 85 days in Nov 15 to a maximum of 36 days in April 2016 against a target of 32 days as shown in Fig. 28. Lead time was 25 days in Feb 2017.
3) Another important outcome is that because of Soft approval system for New Bin, Change in Bin level/description and Slow moving items the case of hard copy getting lost which happened in few cases is completely ruled out. This is particularly important because in few cases the hard copy was not approved even for over a month and later it was not traceable

International Research Journal of Engineering and Technology (IRJET) e-ISSN: 2395 -0056
Volume: 04 Issue: 03 | Mar -2017 www.irjet.net p-ISSN: 2395-0072
© 2017, IRJET | Impact Factor value: 5.181 | ISO 9001:2008 Certified Journal | Page 936
cause of which another hard copy was used. Soft approval system has given the following benefits: 1) Paperless 2) Monitoring of Cycle time of approval through the system report can be helpful in reducing cycle time of approval. 3) Record keeping is easier with report of the entire requests which can be generated with system application and saved as soft copy.
Fig-28 Trend of PR to PR Lead time
6. CONCLUSION From results achieved it is clearly evident that Why-Why analysis and Kaizen implementation have proved to be effective tools for improving the effectiveness of procurement process. Why-Why analysis helped to find the root cause, Kaizen helped step by step improvement and PDCA helped to refine. Following were identified as the main reasons which lead to higher “No-Stock”. 1) PR was raised only for “No-Stock” and No PRPO items. 2) PR was not raised for pending ROP items with partial
pending PRPO. 3) Incorrect bin levels lead to frequent “No-Stock” and
incomplete bin descriptions lead to delay in procurement.
4) Higher lead time, paper work, manual hard copy routing process.
The objective of research was achieved as the “No-Stock” % of fast moving items( issued within past 2 years) reduced from 30.24%(1½ year average from April 2014 to Nov 2015)
to 15.06% in March 2017 with the implementation of following major Kaizen’s one after other apart from other Kaizen’s mentioned in Table 2. 1) Raising weekly PR for ROP bin items with partial
pending PRPO. The PR quantity was calculated in an Excel sheet using functions like V Lookup, IF, AND, PIVOT table and maximo reports like TDN/PDN, Total Bins etc., .
2) Bin level revision based on 2 year consumption data through a paperless and convenient Soft approval system initiated on 2nd April 2016. Till 16th Mar 2017, 303 items bin levels were revised.
3) Change in bin description through a paperless and convenient Soft approval system initiated on 2nd April 2016. Till 16th Mar 2017, 271 bin item descriptions have been revised.
4) Revision of DOA, elimination of hard copy of PR, Rate contracts combined with regular monitoring and direction by Materials Head helped in reducing No-stock and lead time.
KAIZEN AWARDS Following Kaizen’s were awarded by Hindalco Kaizen Committee Belagavi.
1. Kaizen for Calculating PR quantity using Excel Sheet formula & functions. ( This Kaizen is a combination of 4 kaizens w.r.t. TDN report, Use of SUMIF etc.,)
2. Kaizen for paperless System application for Change in Bin Level and Description.
3. Kaizen for paperless System application for approval of New Bin and Slow moving item.
4. Kaizen for paperless record keeping of OOR and above level user request’s using the email.
5. Kaizen for maintaining the paperless No-stock and Last issue data directly in Excel sheet instead of hard copy entry.
ACKNOWLEDGEMENT We express deepest gratitude to Mr. Manoj Kumar - HOD Materials & Logistics Hindalco- Belagavi for his support and co-operation, Mr. Sandesh Patil – Systems Department Hindalco Belgavi for developing the System application for Soft approval of Slow moving items, Change in Level and Description of Bin items and incorporating all the requested changes, Mr. Sunil Sawant – Systems department Hindalco for providing the necessary Maximo report, Mr. Debashish Misra – Manager Stores, Purchase and Mr. R. S. Gavane – Manager Stores, Mr. Niyaz Jamadar – Stores Officer and Mr. Suhas Patil – Stores Officer for facilitating the implementation of Kaizen’s. Also we would like to express our gratitude to the Engineering team for supporting and using the soft approval system application and giving the necessary inputs which led to the enhanced version of present system.

International Research Journal of Engineering and Technology (IRJET) e-ISSN: 2395 -0056
Volume: 04 Issue: 03 | Mar -2017 www.irjet.net p-ISSN: 2395-0072
© 2017, IRJET | Impact Factor value: 5.181 | ISO 9001:2008 Certified Journal | Page 937
REFERENCES [1] Akhil kumar, “A Qualitative Study on the Barriers of Lean
manufacturing Implementation: An Indian Context” The International Journal of Engineering and Science (IJES), Volume 3, Issue 4, pp 21-28.
[2] Tasvir Singh1, Mr. Yogesh Sharma “A comprehensive study on Lean ManufacturingImplementation and its Applications”. International Journal of Enhanced Research in Science Technology & Engineering ISSN: 2319-7463 Vol. 3 Issue 9, Sept.-2014, pp 215-222.
[3] P. M. Rojasra1, M. N. Qureshi “Performance Improvement through 5S in Small Scale Industry: A case study” International Journal of Modern Engineering Research (IJMER) ISSN: 2249-6645 www.ijmer.com Vol. 3, Issue. 3, May - June 2013 pp 1654-1660
[4] Norani Nordin, Baba Md Deros and Dzuraidah Abd Wahab “A survey on Lean Manufacturing Implementation in Malaysian automotive industry” International Journal of Innovation, Management and technology, ISSN: 2010-0248, Vol. 1, No. 4, October 2010, pp 374-380
[5] A. P. Chaple, B. E. Narkhede, M. M. Akarte “Status of implementation of Lean manufacturing principles in the context of Indian industry: A Literature Review” 5th International & 26th All India Manufacturing Technology, Design and Research Conference (AIMTDR 2014) December 12th–14th, 2014, IIT Guwahati, Assam, India, pp 567-1 -6
[6] R.T. Salunkhe, G.S. Kamble, Prasad Malage Inventory Control and Spare Part Management through 5S, KANBAN and Kaizen at ABC Industry, IOSR Journal of Mechanical and Civil Engineering (IOSR-JMCE) ISSN: 2278-1684, PP: 43-47
[7] Mihail Aurel Titu; Constantin Oprean and Daniel Grecu Applying the Kaizen Method and the 5S Technique in the Activity of Post-Sale Services in the Knowledge-Based Organization - Proceedings of International Multi Conference of Engineers and Computer Scientists 2010 Vol 3 IMECS 2010, Mar 17-19 Hong Kong.
[8] A. C. amagar and P. M. Ravanan MATERIAL MANAGEMENT BY USING LEAN MANUFACTURING PRINCIPLES A CASE STUDY Proceedings of the 2nd International Conference on Manufacturing Engineering, Quality and Production Systems.
[9] Yasuhiro Monden, “Toyoto Production System -An integrated approach to Just in Time”, - Engineering aild Management Press -Institute of Industrial Engineers Norcross Georgia, 1998.
[10] James P Womack, Daniel T Jones, and Daniel Roos, “The Machine that changed the World. The Story of Lean Production”, -Harper Perennial edition published 1991.
[11] P. Gopalakrishnan, M. Sundaresan Materials Management – An integrated approach. PHI Feb 2009.
[12] Alumina R&D HIL Belagavi, Belgaum Alumina Refinery Process Manual , Version 1 April 2006.
[13] Pascal Dennis Lean Production System Simplified, 2nd Edition 2007.
[14] Mária Mičietová Lean production, Lean vs. Mass Production, TPM as a tool of Lean Production University of Žilina, Number 5, Volume VI, December 2011, pp 210-216.
[15] Chase Aquilino, “Productions and Operations Management” Dreamtech latest edition.
BIOGRAPHIES
Vinayak P. Tandle –Engineer, Materials Department, Hindalco Belagavi (Aditya Birla Group) and M. Tech. Department of Product Design and Manufacturing P. G. Centre VTU Belgavi. Dr. Shivaprasad B. Dandagi – Prefessor and P. G. coordinator at P. G. Centre VTU Belagavi