Kaiser Health Tracking Poll: August-September 2014
20
Topline Kaiser Health Tracking Poll: August-September 2014 August-September 2014
Transcript of Kaiser Health Tracking Poll: August-September 2014

Topline
Kaiser Health Tracking Poll: August-September 2014
August-September 2014
METHODOLOGY
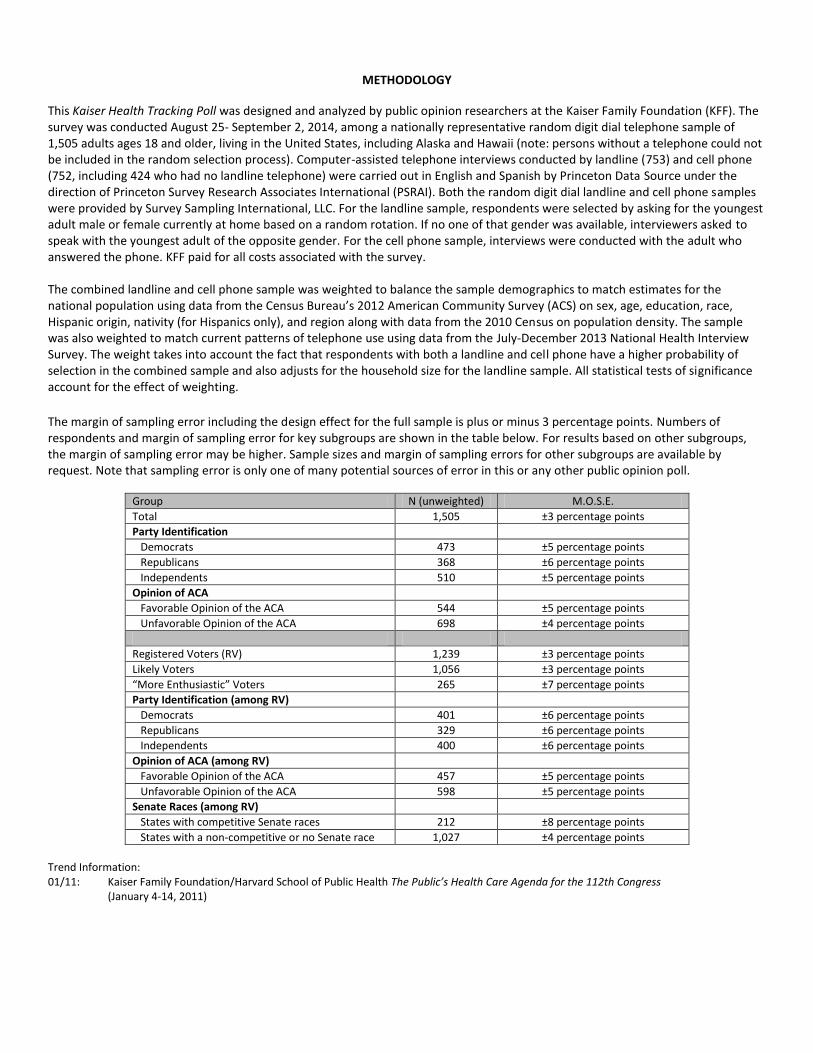
This Kaiser Health Tracking Poll was designed and analyzed by public opinion researchers at the Kaiser Family Foundation (KFF). The survey was conducted August 25- September 2, 2014, among a nationally representative random digit dial telephone sample of 1,505 adults ages 18 and older, living in the United States, including Alaska and Hawaii (note: persons without a telephone could not be included in the random selection process). Computer-assisted telephone interviews conducted by landline (753) and cell phone (752, including 424 who had no landline telephone) were carried out in English and Spanish by Princeton Data Source under the direction of Princeton Survey Research Associates International (PSRAI). Both the random digit dial landline and cell phone samples were provided by Survey Sampling International, LLC. For the landline sample, respondents were selected by asking for the youngest adult male or female currently at home based on a random rotation. If no one of that gender was available, interviewers asked to speak with the youngest adult of the opposite gender. For the cell phone sample, interviews were conducted with the adult who answered the phone. KFF paid for all costs associated with the survey. The combined landline and cell phone sample was weighted to balance the sample demographics to match estimates for the national population using data from the Census Bureau’s 2012 American Community Survey (ACS) on sex, age, education, race, Hispanic origin, nativity (for Hispanics only), and region along with data from the 2010 Census on population density. The sample was also weighted to match current patterns of telephone use using data from the July-December 2013 National Health Interview Survey. The weight takes into account the fact that respondents with both a landline and cell phone have a higher probability of selection in the combined sample and also adjusts for the household size for the landline sample. All statistical tests of significance account for the effect of weighting.
The margin of sampling error including the design effect for the full sample is plus or minus 3 percentage points. Numbers of respondents and margin of sampling error for key subgroups are shown in the table below. For results based on other subgroups, the margin of sampling error may be higher. Sample sizes and margin of sampling errors for other subgroups are available by request. Note that sampling error is only one of many potential sources of error in this or any other public opinion poll.
Group N (unweighted) M.O.S.E.
Total 1,505 ±3 percentage points
Party Identification
Democrats 473 ±5 percentage points
Republicans 368 ±6 percentage points
Independents 510 ±5 percentage points
Opinion of ACA
Favorable Opinion of the ACA 544 ±5 percentage points
Unfavorable Opinion of the ACA 698 ±4 percentage points
Registered Voters (RV) 1,239 ±3 percentage points
Likely Voters 1,056 ±3 percentage points
“More Enthusiastic” Voters 265 ±7 percentage points
Party Identification (among RV)
Democrats 401 ±6 percentage points
Republicans 329 ±6 percentage points
Independents 400 ±6 percentage points
Opinion of ACA (among RV)
Favorable Opinion of the ACA 457 ±5 percentage points
Unfavorable Opinion of the ACA 598 ±5 percentage points
Senate Races (among RV)
States with competitive Senate races 212 ±8 percentage points
States with a non-competitive or no Senate race 1,027 ±4 percentage points
Trend Information: 01/11: Kaiser Family Foundation/Harvard School of Public Health The Public’s Health Care Agenda for the 112th Congress
(January 4-14, 2011)

Kaiser Family Foundation Health Tracking Poll (conducted August 25-September 2, 2014) 3
COMM Overall, how would you rate your community as a place to live? Would you say it is excellent, good, only fair, or poor?
09/14
Excellent 37 Good 45 Only fair 14 Poor 5 Don't know/Refused *

Kaiser Family Foundation Health Tracking Poll (conducted August 25-September 2, 2014) 4
1. Thinking ahead to the November elections for the U.S. House and Senate, what is the most important issue to you in deciding how to
vote for Congress? And what is the second most important issue to you in deciding how to vote for Congress? (OPEN-END. ACCEPT UP TO
TWO RESPONSES)
09/14 Total
09/14 RVs
Economy/Jobs (NET) 20 21 Economy (general) 11 12 Jobs/unemployment 9 9 Economy/jobs - other 2 2 Foreign policy/military/defense (NET) 12 13 Foreign policy (general) 4 4 Military/National security/Defense/terrorism 4 4 End wars/World peace 2 3 Situation with Iraq/Syria/Islamic State 2 2 Health care (NET) 12 13 Health care (general) 9 9 ACA/Obamacare/Health care reform 3 3 Medicare * * Dissatisfaction with government (NET) 10 12 Gridlock/need to work together 4 5 Dissatisfaction with current politicians/Want them all out of office 4 4 Dissatisfaction with government/politics (other/general) 2 3 Term limits * * Immigration/Border security 10 9 Education/Education costs/Student loans 9 9 Candidate's personal characteristics (NET) 5 6 Honesty/integrity/trustworthiness 3 4 Candidate's personal characteristics (general) 3 3 Debt/Budget/Deficit/Government spending 5 6 Taxes 5 5 Crime/violence/public safety 5 5 Preference for one party/Control of Senate (NET) 4 4 Vote Republican/Republican control of Senate/Get rid of Democrats 2 2 Vote Democratic/Get rid of Republicans 1 1 Party affiliation/Party control of Senate (general) 1 1 Candidate/Candidate’s platform/vision /opinion on multiple issues/track record 4 4 Constitution/Civil rights/Equality/Women’s rights 3 2 Gun control/rights 2 2 What is in state's/community’s best interest 2 3 Environment (NET) 2 2 Environment (general) 2 2 Global warming/climate change * * Opposition to President Obama 2 2 Legalization of marijuana 1 1 Welfare/Social services/Food stamps 1 1 Social Security 1 1 Veterans' issues 1 1 Abortion 1 1 Conservativism/get rid of liberals (general) 1 1 Moral/religious values 1 * Seniors' issues 1 1 Gay marriage * * Transportation/Roads/Infrastructure * * Corruption * * Liberalism (general) * * Everything/No specific issue 1 1 Nothing/Haven’t given it much thought 1 2 Don't intend/Not eligible to vote 2 1 Other 5 5 Don’t know/Refused 24 20
Percentages will add to more than 100 due to multiple responses.
Kaiser Family Foundation Health Tracking Poll (conducted August 25-September 2, 2014) 5
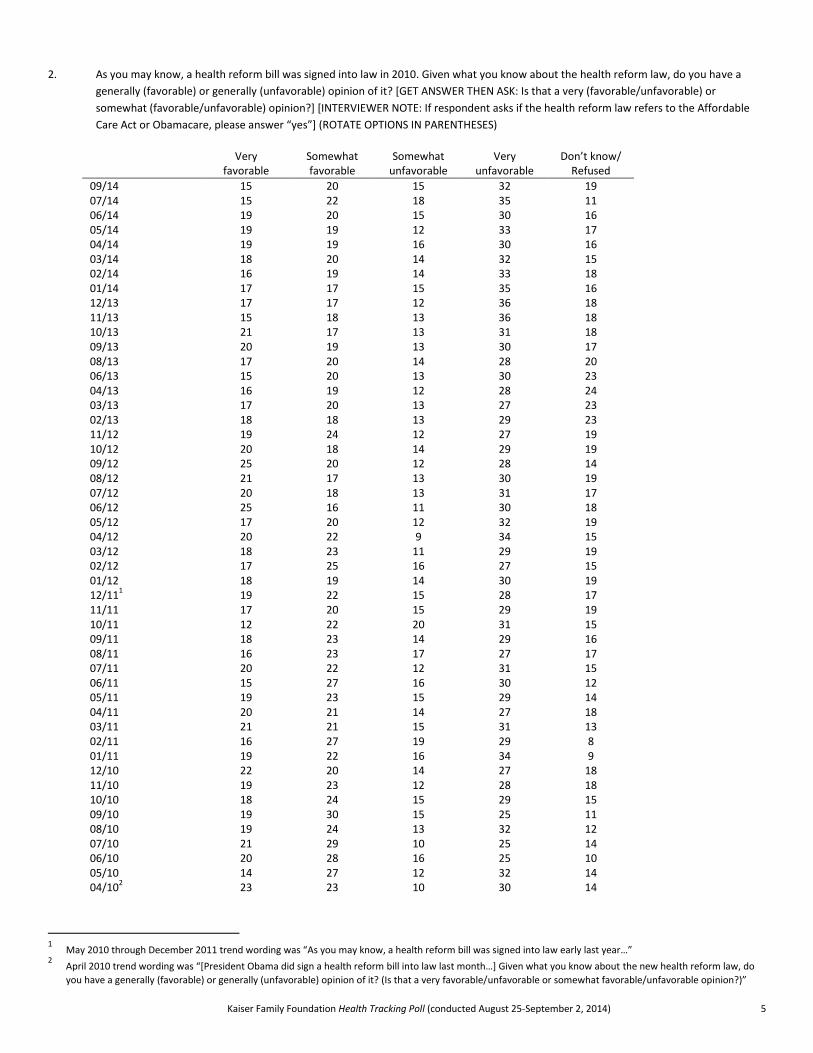
2. As you may know, a health reform bill was signed into law in 2010. Given what you know about the health reform law, do you have a
generally (favorable) or generally (unfavorable) opinion of it? [GET ANSWER THEN ASK: Is that a very (favorable/unfavorable) or
somewhat (favorable/unfavorable) opinion?] [INTERVIEWER NOTE: If respondent asks if the health reform law refers to the Affordable
Care Act or Obamacare, please answer “yes”] (ROTATE OPTIONS IN PARENTHESES)
Very
favorable Somewhat favorable
Somewhat unfavorable
Very unfavorable
Don’t know/ Refused
09/14 15 20 15 32 19 07/14 15 22 18 35 11 06/14 19 20 15 30 16 05/14 19 19 12 33 17 04/14 19 19 16 30 16 03/14 18 20 14 32 15 02/14 16 19 14 33 18 01/14 17 17 15 35 16 12/13 17 17 12 36 18 11/13 15 18 13 36 18 10/13 21 17 13 31 18 09/13 20 19 13 30 17 08/13 17 20 14 28 20 06/13 15 20 13 30 23 04/13 16 19 12 28 24 03/13 17 20 13 27 23 02/13 18 18 13 29 23 11/12 19 24 12 27 19 10/12 20 18 14 29 19 09/12 25 20 12 28 14 08/12 21 17 13 30 19 07/12 20 18 13 31 17 06/12 25 16 11 30 18 05/12 17 20 12 32 19 04/12 20 22 9 34 15 03/12 18 23 11 29 19 02/12 17 25 16 27 15 01/12 18 19 14 30 19 12/11
1 19 22 15 28 17
11/11 17 20 15 29 19 10/11 12 22 20 31 15 09/11 18 23 14 29 16 08/11 16 23 17 27 17 07/11 20 22 12 31 15 06/11 15 27 16 30 12 05/11 19 23 15 29 14 04/11 20 21 14 27 18 03/11 21 21 15 31 13 02/11 16 27 19 29 8 01/11 19 22 16 34 9 12/10 22 20 14 27 18 11/10 19 23 12 28 18 10/10 18 24 15 29 15 09/10 19 30 15 25 11 08/10 19 24 13 32 12 07/10 21 29 10 25 14 06/10 20 28 16 25 10 05/10 14 27 12 32 14 04/10
2 23 23 10 30 14
1 May 2010 through December 2011 trend wording was “As you may know, a health reform bill was signed into law early last year…”
2 April 2010 trend wording was “[President Obama did sign a health reform bill into law last month…] Given what you know about the new health reform law, do
you have a generally (favorable) or generally (unfavorable) opinion of it? (Is that a very favorable/unfavorable or somewhat favorable/unfavorable opinion?)”

Kaiser Family Foundation Health Tracking Poll (conducted August 25-September 2, 2014) 6
READ: Thinking again about the upcoming Congressional election in November…
3. Would you prefer to see (the Senate Democrats stay in the majority) in the U.S. Senate, or do you want to see (the Senate Republicans in
the majority)? (ROTATE ITEMS IN PARENS)
09/14 Total
09/14 RV
Prefer to see Senate Democrats stay in the majority 43 43 Prefer to see Senate Republicans in the majority 36 40 Neither/Other/No preference (VOL.) 15 13 Don’t know/Refused 6 4
4. Compared to previous Congressional elections, this year are you (more) enthusiastic about voting than usual, (less) enthusiastic, or about
the same as in previous elections? (ROTATE ITEMS IN PARENS)
09/14 Total
09/14 RV
More enthusiastic 20 20 Less enthusiastic 18 20 About the same as previous elections 56 57 Don’t vote, not registered to vote, don’t plan to vote (VOL.) 4 1 Don’t know/Refused 2 2

Kaiser Family Foundation Health Tracking Poll (conducted August 25-September 2, 2014) 7
5MORE. What is the main reason you are more enthusiastic than usual about voting in this year’s Congressional election compared to previous
years? (OPEN-END. ACCEPT ONE RESPONSE)
Based on those who say they are more enthusiastic about voting this year
09/14 Total
09/14 RVs
Opposition to Democrats/Elect more Republicans/Republican control of Congress/Senate 10 13
Important to participate/want vote counted/more knowledgeable/involved this election 10 10
Change who's in office/get rid of incumbents/get the right person in the job 9 10 Desire for change (general) 9 8 Dissatisfaction with government/politics (NET) 8 8
Don't like the way things are going/what government is doing (general) 4 3
Government dysfunction/Need to break gridlock/Get things done 3 4
Lack of leadership * *
Politicians are out for themselves/don’t care about the people/Lie * *
Way things are going/Direction of the country 7 8
Able to vote/First time voting 5 4
Oppose Obama 4 5
Opposition to Republicans/Elect more Democrats/Democratic control of Congress/Senate 4 4 Issues – general/other 3 4
Health care/ACA/Obamacare 2 3
State/local issues/governor's race 2 3
Good/better candidates/enthusiastic about particular candidate 2 2
Party control of Senate/Congress (no specific party mention) 2 2 Party - other 2 2 Economy 2 2 Immigration 2 1 Military/war/foreign policy/bring home our troops 1 1 Obama - other 1 1 Personal reasons 1 * Budget/Deficit/Government spending * 1
Support Obama * * No good candidates/Don't like candidates * * Don't like the advertising/Negative advertising * * Other 7 6 Don’t know/Refused 3 3 (309) (265)
Percentages will add to more than 100 due to multiple responses
Kaiser Family Foundation Health Tracking Poll (conducted August 25-September 2, 2014) 8
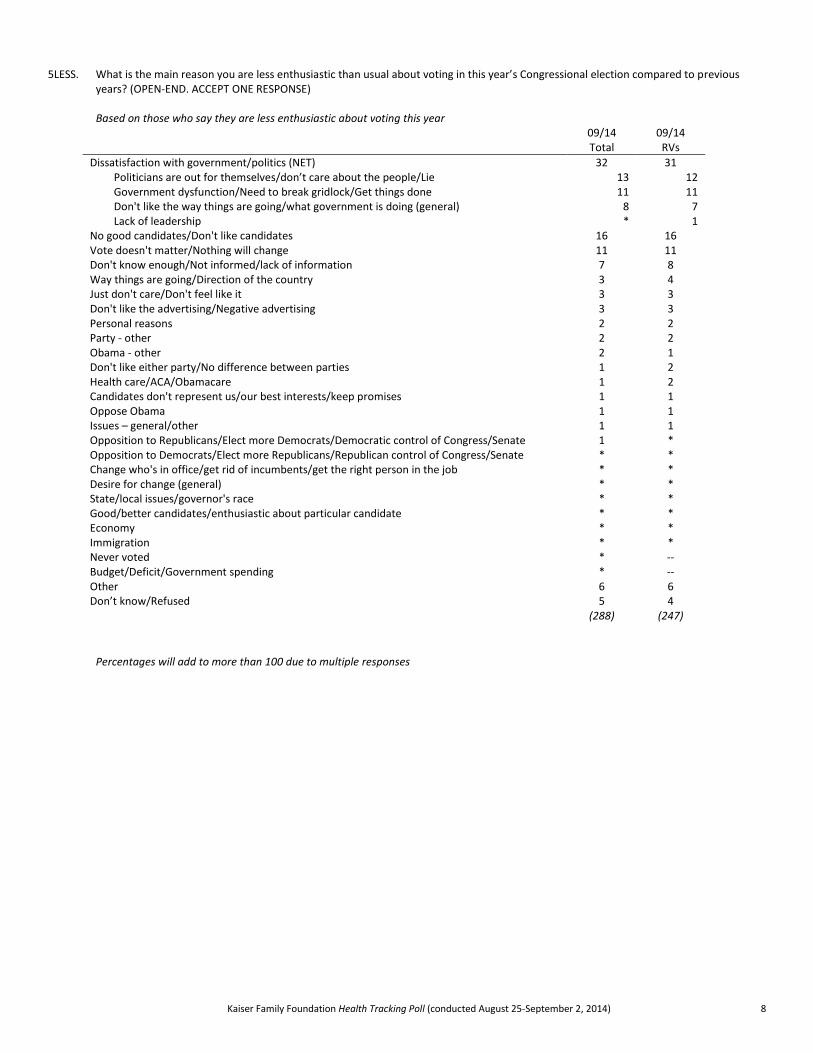
5LESS. What is the main reason you are less enthusiastic than usual about voting in this year’s Congressional election compared to previous years? (OPEN-END. ACCEPT ONE RESPONSE)
Based on those who say they are less enthusiastic about voting this year
09/14 Total
09/14 RVs
Dissatisfaction with government/politics (NET) 32 31 Politicians are out for themselves/don’t care about the people/Lie 13 12 Government dysfunction/Need to break gridlock/Get things done 11 11 Don't like the way things are going/what government is doing (general) 8 7 Lack of leadership * 1 No good candidates/Don't like candidates 16 16 Vote doesn't matter/Nothing will change 11 11 Don't know enough/Not informed/lack of information 7 8 Way things are going/Direction of the country 3 4 Just don't care/Don't feel like it 3 3 Don't like the advertising/Negative advertising 3 3 Personal reasons 2 2 Party - other 2 2
Obama - other 2 1 Don't like either party/No difference between parties 1 2
Health care/ACA/Obamacare 1 2
Candidates don't represent us/our best interests/keep promises 1 1 Oppose Obama 1 1 Issues – general/other 1 1
Opposition to Republicans/Elect more Democrats/Democratic control of Congress/Senate 1 *
Opposition to Democrats/Elect more Republicans/Republican control of Congress/Senate * *
Change who's in office/get rid of incumbents/get the right person in the job * * Desire for change (general) * * State/local issues/governor's race * * Good/better candidates/enthusiastic about particular candidate * * Economy * *
Immigration * *
Never voted * -- Budget/Deficit/Government spending * -- Other 6 6 Don’t know/Refused 5 4 (288) (247)
Percentages will add to more than 100 due to multiple responses
Kaiser Family Foundation Health Tracking Poll (conducted August 25-September 2, 2014) 9
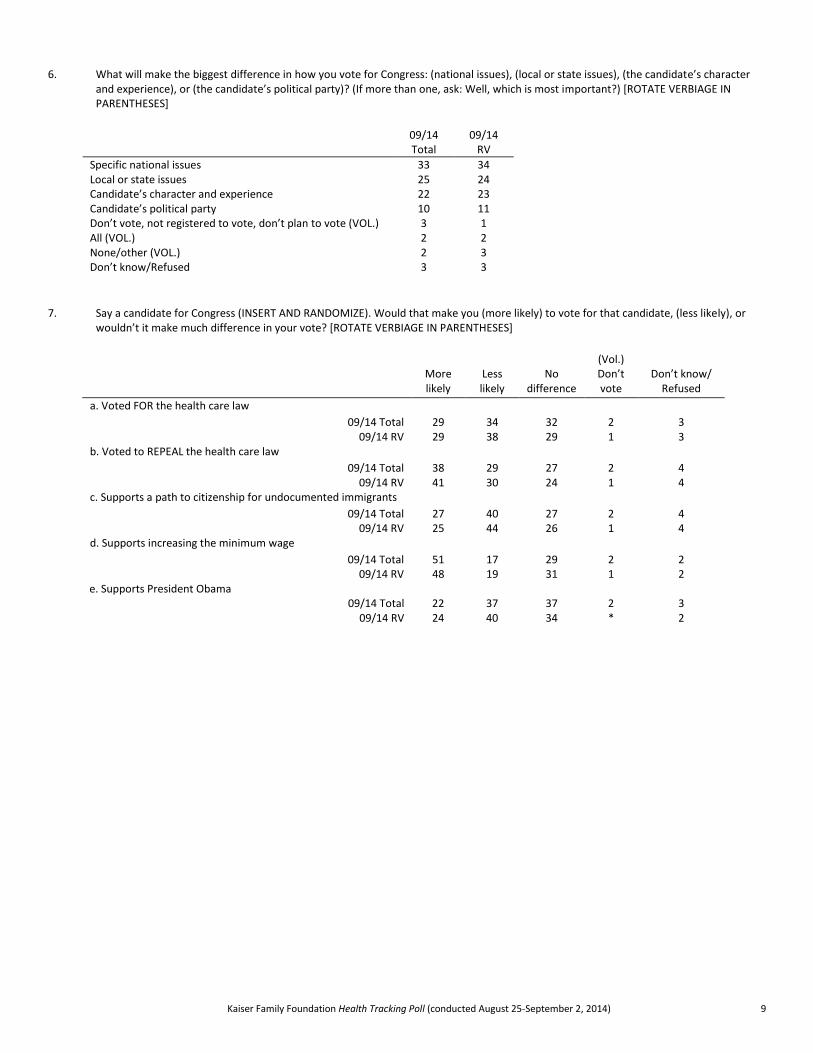
6. What will make the biggest difference in how you vote for Congress: (national issues), (local or state issues), (the candidate’s character and experience), or (the candidate’s political party)? (If more than one, ask: Well, which is most important?) [ROTATE VERBIAGE IN PARENTHESES]
09/14 Total
09/14 RV
Specific national issues 33 34 Local or state issues 25 24 Candidate’s character and experience 22 23 Candidate’s political party 10 11 Don’t vote, not registered to vote, don’t plan to vote (VOL.) 3 1 All (VOL.) 2 2 None/other (VOL.) 2 3 Don’t know/Refused 3 3
7. Say a candidate for Congress (INSERT AND RANDOMIZE). Would that make you (more likely) to vote for that candidate, (less likely), or wouldn’t it make much difference in your vote? [ROTATE VERBIAGE IN PARENTHESES]
More likely
Less likely
No difference
(Vol.) Don’t vote
Don’t know/ Refused
a. Voted FOR the health care law
09/14 Total 29 34 32 2 3 09/14 RV 29 38 29 1 3
b. Voted to REPEAL the health care law
09/14 Total 38 29 27 2 4 09/14 RV 41 30 24 1 4
c. Supports a path to citizenship for undocumented immigrants
09/14 Total 27 40 27 2 4 09/14 RV 25 44 26 1 4
d. Supports increasing the minimum wage
09/14 Total 51 17 29 2 2 09/14 RV 48 19 31 1 2
e. Supports President Obama 09/14 Total 22 37 37 2 3
09/14 RV 24 40 34 * 2

Kaiser Family Foundation Health Tracking Poll (conducted August 25-September 2, 2014) 10
8. Which political party, the (Democratic party) or (Republican party), do you trust to do a better job (INSERT AND RANDOMIZE)? How about
(NEXT ITEM)? (ROTATE OPTIONS IN PARENTHESES ACROSS INTERVIEWS, BUT NOT WITHIN SAME INTERVIEW) [READ IF NECESSARY: Do
you trust the (Democratic party) or (Republican party) to do a better job (INSERT ITEM)?]
Dem Party
Rep Party
(Vol.) Both
(Vol.) Neither/
Other Don’t know/
Refused
a. Dealing with the future of the 2010 health care law 09/14 Total 43 37 1 13 7
09/14 RV 42 39 1 12 6 b. Handling the Medicaid program
09/14 Total 42 33 1 15 8 09/14 RV 42 35 1 15 7
c. Handling the Medicare program 09/14 Total 43 34 1 15 7
09/14 RV 42 36 1 15 6 d. Lowering health costs for people like you
09/14 Total 43 35 1 14 7 09/14 RV 42 36 1 14 6
READ: Thinking again about the health care law that was passed in 2010, also referred to as the Affordable Care Act or Obamacare…
9. Is your impression of the health care law based mainly on (your own experience), (what you’ve seen and heard on television, radio, and in
newspapers), (what you’ve learned from friends and family), or some other source? (READ AND RANDOMIZE OPTIONS IN PARENTHESES)
09/14 06/14 02/14 02/13
What you’ve seen and heard on television, radio, and newspapers 37 37 44 45 Your own experience 26 26 23 22 What you’ve learned from friends and family 22 22 18 14 Personal research (online, read the law, books, etc.) (VOL.) 4 2 2 -- Combination/All of the above (VOL.) 3 1 3 -- Some other source 3 5 5 11 Don’t know/Refused 5 7 5 8
10. Which would you rather see your representative in Congress do when it comes to the health care law? (READ AND ROTATE)
09/14 07/14 05/14 04/14
They should work to improve the law 63 60 59 58 They should work to repeal the law and replace it with something else
33 35 34 35
Neither of these/they should do something else (VOL.) 2 2 3 3 Don’t know/Refused 2 2 4 4
11. So far, would you say the health care law has directly (helped) you and your family, directly (hurt) you and your family, or has it not had a direct impact? (ROTATE ITEMS IN PARENTHESES)
09/14 07/14 05/14
Helped 14 15 14 Hurt 27 28 24 No direct impact 56 56 60 Both helped and hurt (VOL.) 1 * * Don't know/ Refused 1 1 2

Kaiser Family Foundation Health Tracking Poll (conducted August 25-September 2, 2014) 11
12. What would you say is the MAIN way the health care law has helped you and your family? Has it… (READ LIST, RANDOMIZE 1-3, KEEP 4 ALWAYS LAST)
Based on those who say the health care law has helped or both helped and hurt them
09/14 07/14 05/14
Allowed someone in your family to get or keep health coverage 42 46 36 Lowered your health care or health insurance costs 18 12 19 Made it easier for you to get the health care you need 29 25 26 OR has it helped in some other way? 6 6 14 Don't know/ Refused 5 10 5 (224) (220) (203)
13. What would you say is the MAIN way the health care law has hurt you and your family? Has it… (READ LIST, RANDOMIZE 1-3, KEEP 4
ALWAYS LAST)
Based on those who say the health care law has hurt or both helped and hurt them
09/14 07/14 05/14
Caused someone in your family to lose their insurance 7 10 8 Increased your health care or health insurance costs 58 59 60 Made it more difficult for you to get the health care you need 20 18 12 OR has it hurt in some other way? 11 10 18 Don't know/ Refused 4 3 2 (402) (422) (385)
Summary of Q11, Q12, and Q13 based on total
09/14 07/14 05/14
Helped/Both helped and hurt 15 15 15 Allowed someone in your family to get or keep health coverage 6 7 5 Lowered your health care costs 3 2 3 Made it easier for you to get the health care you need 4 4 4 Helped in some other way 1 1 2 Don't know/ Refused 1 2 1
Hurt/Both helped and hurt 28 28 24 Caused someone in your family to lose their insurance 2 3 2 Increased your health care costs 16 17 14 Made it more difficult for you to get the health care you need 6 5 3 Hurt in some other way 3 3 4 Don't know/ Refused 1 1 1
No direct impact 56 56 60 Don't know/ Refused 1 1 2

Kaiser Family Foundation Health Tracking Poll (conducted August 25-September 2, 2014) 12
14. Thinking about what you’re hearing from candidates running for elected office this November, including in their advertising, speeches, and other materials… How much, if anything, have you heard from political candidates about (INSERT AND RANDOMIZE) – a lot, some, only a little, or nothing at all? What about (INSERT AND RANDOMIZE)? READ IF NECESSARY: Have you heard a lot, some, only a little, or nothing at all?
A lot Some
Only a little
Nothing at all
Don’t know/ Refused
a. The health care law 09/14 Total 33 18 30 18 1
09/14 RV 32 19 30 18 1 b. The issue of immigration
09/14 Total 34 18 28 18 1 09/14 RV 35 19 28 17 1
c. The economy and jobs 09/14 Total 30 23 28 18 2
09/14 RV 32 24 27 16 1 d. Education
09/14 Total 17 20 38 24 1 09/14 RV 16 22 37 23 1
e. State and local issues 09/14 Total 19 23 35 20 1
09/14 RV 21 25 34 18 1
15. Which comes closer to your view? (READ AND ROTATE)
09/14 Total
09/14 RV
05/14 Total
05/14 RV
I’m tired of hearing candidates for Congress talk about the health care law and I think they should focus more on other issues (or)
49 48 533 51
I think it is important for candidates for Congress to continue the debate over the health care law (or)
46 47 40 43
Don’t know/Refused 5 5 7 6
3 Trend wording for the first category was “I’m tired of hearing candidates for Congress talk about the health care law and I think they should focus more on other
issues like jobs”.
Kaiser Family Foundation Health Tracking Poll (conducted August 25-September 2, 2014) 13
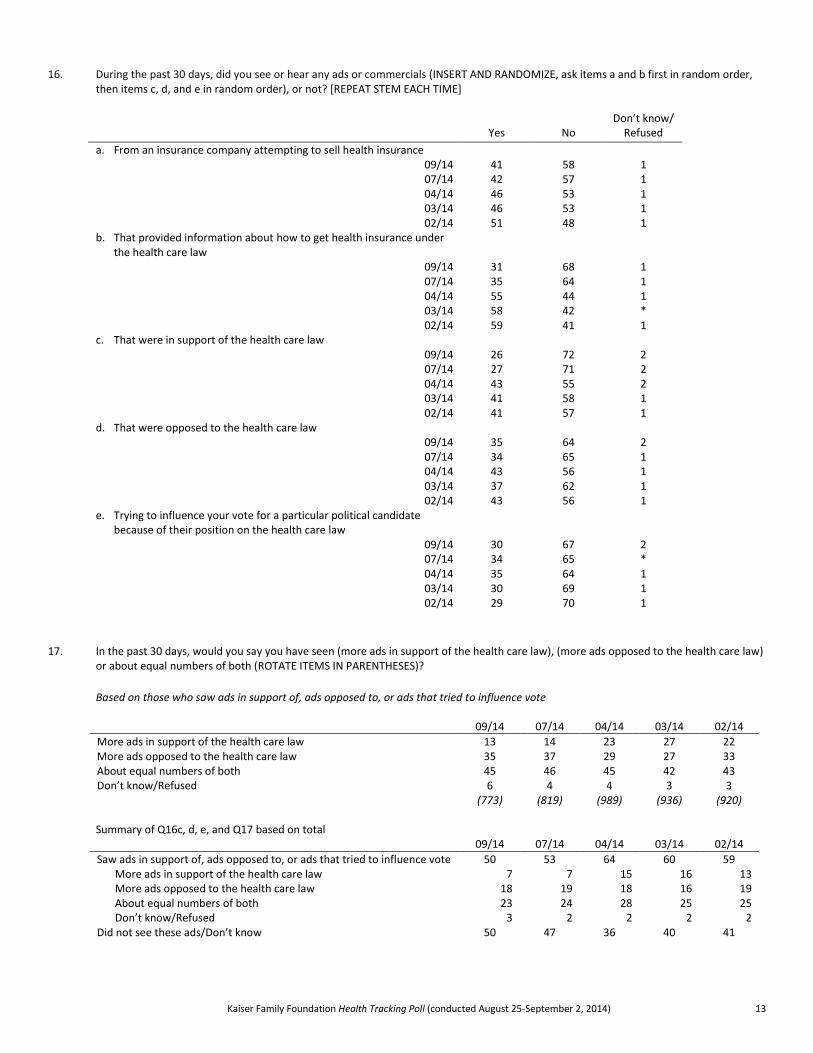
16. During the past 30 days, did you see or hear any ads or commercials (INSERT AND RANDOMIZE, ask items a and b first in random order, then items c, d, and e in random order), or not? [REPEAT STEM EACH TIME]
Yes No Don’t know/
Refused
a. From an insurance company attempting to sell health insurance 09/14 41 58 1 07/14 42 57 1 04/14 46 53 1 03/14 46 53 1 02/14 51 48 1
b. That provided information about how to get health insurance under the health care law
09/14 31 68 1 07/14 35 64 1 04/14 55 44 1 03/14 58 42 * 02/14 59 41 1
c. That were in support of the health care law 09/14 26 72 2 07/14 27 71 2 04/14 43 55 2 03/14 41 58 1 02/14 41 57 1
d. That were opposed to the health care law 09/14 35 64 2 07/14 34 65 1 04/14 43 56 1 03/14 37 62 1 02/14 43 56 1
e. Trying to influence your vote for a particular political candidate because of their position on the health care law
09/14 30 67 2 07/14 34 65 * 04/14 35 64 1 03/14 30 69 1 02/14 29 70 1
17. In the past 30 days, would you say you have seen (more ads in support of the health care law), (more ads opposed to the health care law) or about equal numbers of both (ROTATE ITEMS IN PARENTHESES)?
Based on those who saw ads in support of, ads opposed to, or ads that tried to influence vote 09/14 07/14 04/14 03/14 02/14
More ads in support of the health care law 13 14 23 27 22 More ads opposed to the health care law 35 37 29 27 33 About equal numbers of both 45 46 45 42 43 Don’t know/Refused 6 4 4 3 3 (773) (819) (989) (936) (920)
Summary of Q16c, d, e, and Q17 based on total 09/14 07/14 04/14 03/14 02/14
Saw ads in support of, ads opposed to, or ads that tried to influence vote 50 53 64 60 59 More ads in support of the health care law 7 7 15 16 13 More ads opposed to the health care law 18 19 18 16 19 About equal numbers of both 23 24 28 25 25 Don’t know/Refused 3 2 2 2 2
Did not see these ads/Don’t know 50 47 36 40 41

Kaiser Family Foundation Health Tracking Poll (conducted August 25-September 2, 2014) 14
18. Next, please tell me how closely you have followed these stories that have been in the news recently. (First/Next,) (INSERT--READ AND RANDOMIZE). READ FOR FIRST ITEM THEN AS NECESSARY: Did you follow this story very closely, fairly closely, not too closely, or not at all closely?
Very
closely Fairly
closely Not too closely
Not at all closely
Don’t know/ Refused
a. Legal action challenging the health care law’s subsidies to help individuals buy insurance
09/14 10 19 28 41 2 b. Controversy over an expensive new drug to treat hepatitis C
09/14 5 9 19 65 2 c. The release of 2015 health insurance premium rates by insurers
in some states
09/14 8 12 23 55 3 07/14 10 20 24 45 1 06/14 8 19 25 46 1
d. The passage of a bill in Congress to overhaul the Veterans Affairs, or V.A. health system
09/14 24 27 21 27 1
e. News about fraud and abuse in Medicare
09/14 14 21 26 38 1 f. The Ebola outbreak in West Africa
09/14 30 32 22 15 1 g. The death of actor Robin Williams
09/14 27 31 23 17 2 h. Conflicts between police and protestors in Ferguson, Missouri
following the police shooting of a black teenager
09/14 40 33 15 12 1 i. Military and political conflict between Israel and Hamas
09/14 34 30 18 18 1 07/14 33 33 17 16 1
j. The conflict between Ukraine and Russia 09/14 28 33 19 19 1 05/14 30 35 17 17 1 04/14 28 37 18 15 1 03/14 36 32 12 19 1
k. The execution of an American journalist by Islamic State militants 09/14 34 29 20 17 1
READ TO ALL: Finally, I have just a few questions we will use to describe the people who took part in our survey… D5. What is your age? (RECORD EXACT AGE AS TWO-DIGIT CODE.)
D6. (ASK IF DON’T KNOW OR REFUSED AGE) Could you please tell me if you are between the ages of (READ LIST)…?
09/14
18-29 22 30-49 33 50-64 28 65 and older 18 Don’t know/Refused *
Kaiser Family Foundation Health Tracking Poll (conducted August 25-September 2, 2014) 15
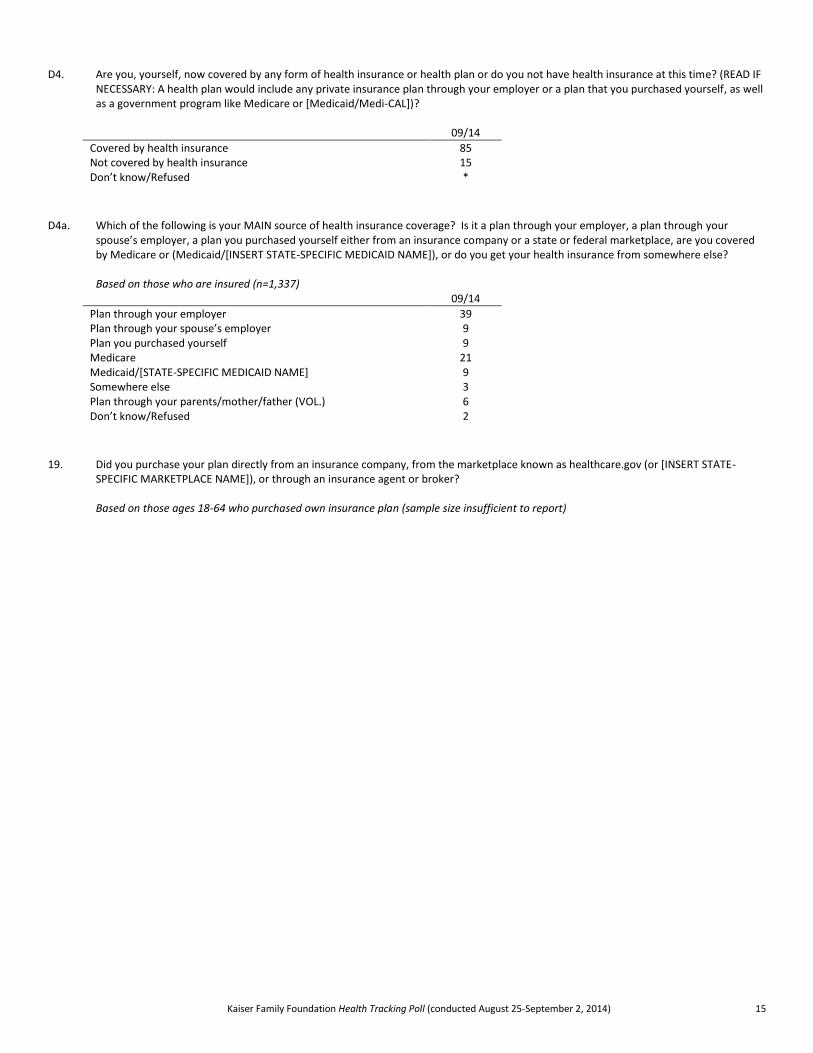
D4. Are you, yourself, now covered by any form of health insurance or health plan or do you not have health insurance at this time? (READ IF NECESSARY: A health plan would include any private insurance plan through your employer or a plan that you purchased yourself, as well as a government program like Medicare or [Medicaid/Medi-CAL])?
09/14
Covered by health insurance 85 Not covered by health insurance 15 Don’t know/Refused *
D4a. Which of the following is your MAIN source of health insurance coverage? Is it a plan through your employer, a plan through your spouse’s employer, a plan you purchased yourself either from an insurance company or a state or federal marketplace, are you covered by Medicare or (Medicaid/[INSERT STATE-SPECIFIC MEDICAID NAME]), or do you get your health insurance from somewhere else?
Based on those who are insured (n=1,337)
09/14
Plan through your employer 39 Plan through your spouse’s employer 9 Plan you purchased yourself 9 Medicare 21 Medicaid/[STATE-SPECIFIC MEDICAID NAME] 9 Somewhere else 3 Plan through your parents/mother/father (VOL.) 6 Don’t know/Refused 2
19. Did you purchase your plan directly from an insurance company, from the marketplace known as healthcare.gov (or [INSERT STATE-SPECIFIC MARKETPLACE NAME]), or through an insurance agent or broker?
Based on those ages 18-64 who purchased own insurance plan (sample size insufficient to report)

Kaiser Family Foundation Health Tracking Poll (conducted August 25-September 2, 2014) 16
20. Do you know if the plan you purchased through a broker was a plan from the state or federal health insurance marketplace known as healthcare.gov (or [INSERT STATE-SPECIFIC MARKETPLACE NAME]), or was it a plan purchased directly from an insurance company and not through an exchange or marketplace?
Based on purchased through an agent or broker (sample size insufficient to report)
Summary D4, D4a, Q19, and Q20 based on those ages 18-64 (n=1,080)
09/14
Covered by health insurance 82 Employer 39 Spouse’s employer 9 Self-purchased plan 8
Directly from an insurance company 3 From healthcare.gov or [STATE MARKETPLACE NAME] 2 Through an insurance agent or broker 2
Plan purchased from a state or federal marketplace 1 Plan purchased directly from an insurance company 1 Don’t know/Refused *
Somewhere else (VOL.) 1 Don’t know/Refused *
Medicare 6 Medicaid/State-specific Medicaid name 9 Somewhere else 3 Plan through parents/mother/father (VOL.) 7 Don’t know/Refused 2
Not covered by health insurance 17 Don’t know/Refused *
21. In general, the term “pre-existing condition” is used by insurance companies to describe an illness or medical condition that a person had before they began looking for insurance. For example, if you were looking to buy health insurance but had a history of asthma, diabetes or high blood pressure, those would be considered pre-existing conditions, along with illnesses such as cancer. Given that definition, would you say that you or someone else in your household would be considered to have a “pre-existing condition” of some sort, or not?
09/14
Yes, someone in household has pre-existing condition 50 No, no one in household has pre-existing condition 49 Don’t know/Refused 1
D1. Record respondent’s sex
Male 49 Female 51
D2. In general, would you say your health is excellent, very good, good, only fair, or poor?
Excellent 21 Very good 32 Good 30 Only fair 12 Poor 4 Don’t know/Refused *
Kaiser Family Foundation Health Tracking Poll (conducted August 25-September 2, 2014) 17
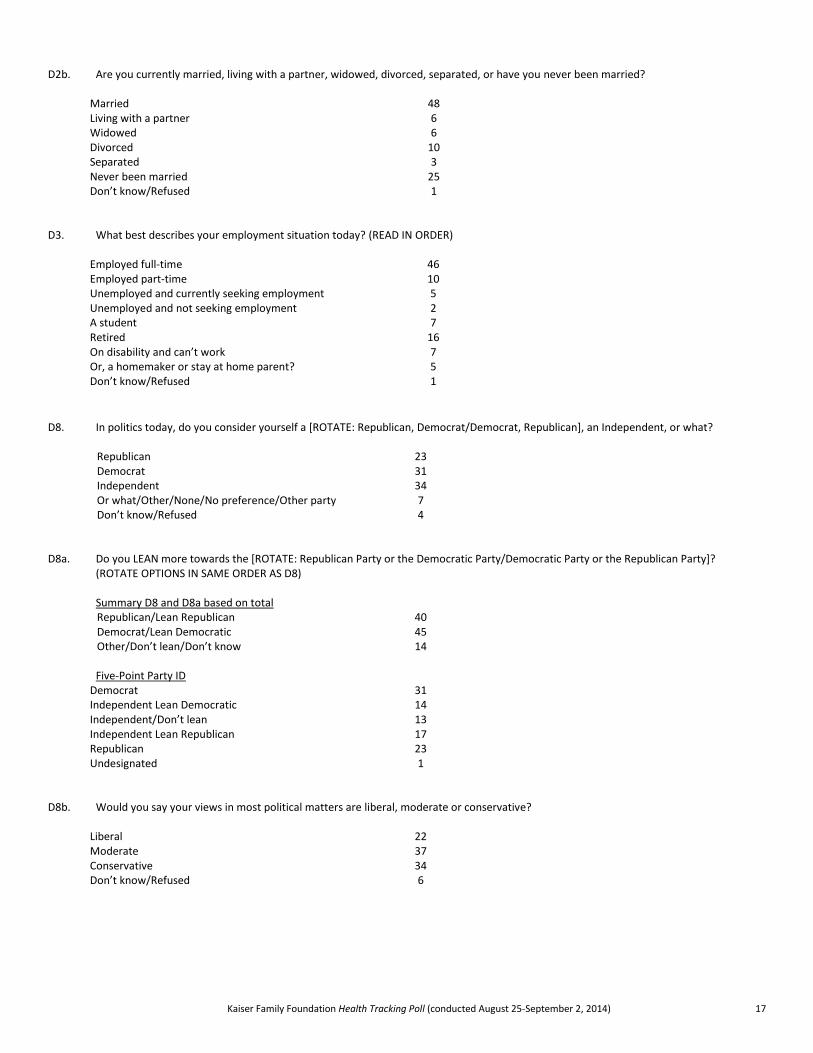
D2b. Are you currently married, living with a partner, widowed, divorced, separated, or have you never been married?
Married 48 Living with a partner 6 Widowed 6 Divorced 10 Separated 3 Never been married 25 Don’t know/Refused 1
D3. What best describes your employment situation today? (READ IN ORDER)
Employed full-time 46 Employed part-time 10 Unemployed and currently seeking employment 5 Unemployed and not seeking employment 2 A student 7 Retired 16 On disability and can’t work 7 Or, a homemaker or stay at home parent? 5 Don’t know/Refused 1
D8. In politics today, do you consider yourself a [ROTATE: Republican, Democrat/Democrat, Republican], an Independent, or what?
Republican 23 Democrat 31 Independent 34 Or what/Other/None/No preference/Other party 7 Don’t know/Refused 4
D8a. Do you LEAN more towards the [ROTATE: Republican Party or the Democratic Party/Democratic Party or the Republican Party]? (ROTATE OPTIONS IN SAME ORDER AS D8)
Summary D8 and D8a based on total Republican/Lean Republican 40 Democrat/Lean Democratic 45 Other/Don’t lean/Don’t know 14
Five-Point Party ID
Democrat 31 Independent Lean Democratic 14 Independent/Don’t lean 13 Independent Lean Republican 17 Republican 23 Undesignated 1
D8b. Would you say your views in most political matters are liberal, moderate or conservative?
Liberal 22 Moderate 37 Conservative 34 Don’t know/Refused 6
Kaiser Family Foundation Health Tracking Poll (conducted August 25-September 2, 2014) 18
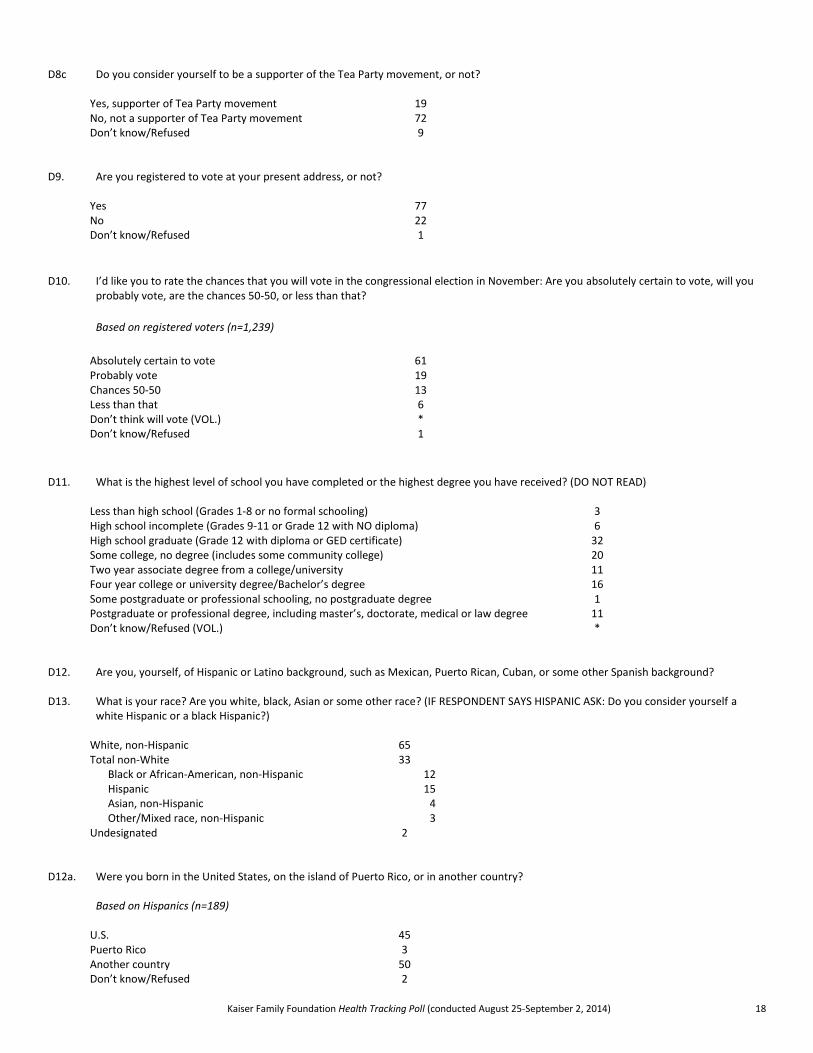
D8c Do you consider yourself to be a supporter of the Tea Party movement, or not?
Yes, supporter of Tea Party movement 19 No, not a supporter of Tea Party movement 72 Don’t know/Refused 9
D9. Are you registered to vote at your present address, or not?
Yes 77 No 22 Don’t know/Refused 1
D10. I’d like you to rate the chances that you will vote in the congressional election in November: Are you absolutely certain to vote, will you probably vote, are the chances 50-50, or less than that?
Based on registered voters (n=1,239)
Absolutely certain to vote 61 Probably vote 19 Chances 50-50 13 Less than that 6 Don’t think will vote (VOL.) * Don’t know/Refused 1
D11. What is the highest level of school you have completed or the highest degree you have received? (DO NOT READ)
Less than high school (Grades 1-8 or no formal schooling) 3 High school incomplete (Grades 9-11 or Grade 12 with NO diploma) 6 High school graduate (Grade 12 with diploma or GED certificate) 32 Some college, no degree (includes some community college) 20 Two year associate degree from a college/university 11 Four year college or university degree/Bachelor’s degree 16 Some postgraduate or professional schooling, no postgraduate degree 1 Postgraduate or professional degree, including master’s, doctorate, medical or law degree 11 Don’t know/Refused (VOL.) *
D12. Are you, yourself, of Hispanic or Latino background, such as Mexican, Puerto Rican, Cuban, or some other Spanish background? D13. What is your race? Are you white, black, Asian or some other race? (IF RESPONDENT SAYS HISPANIC ASK: Do you consider yourself a
white Hispanic or a black Hispanic?)
White, non-Hispanic 65 Total non-White 33
Black or African-American, non-Hispanic 12 Hispanic 15 Asian, non-Hispanic 4 Other/Mixed race, non-Hispanic 3
Undesignated 2 D12a. Were you born in the United States, on the island of Puerto Rico, or in another country? Based on Hispanics (n=189)
U.S. 45 Puerto Rico 3 Another country 50 Don’t know/Refused 2
Kaiser Family Foundation Health Tracking Poll (conducted August 25-September 2, 2014) 19
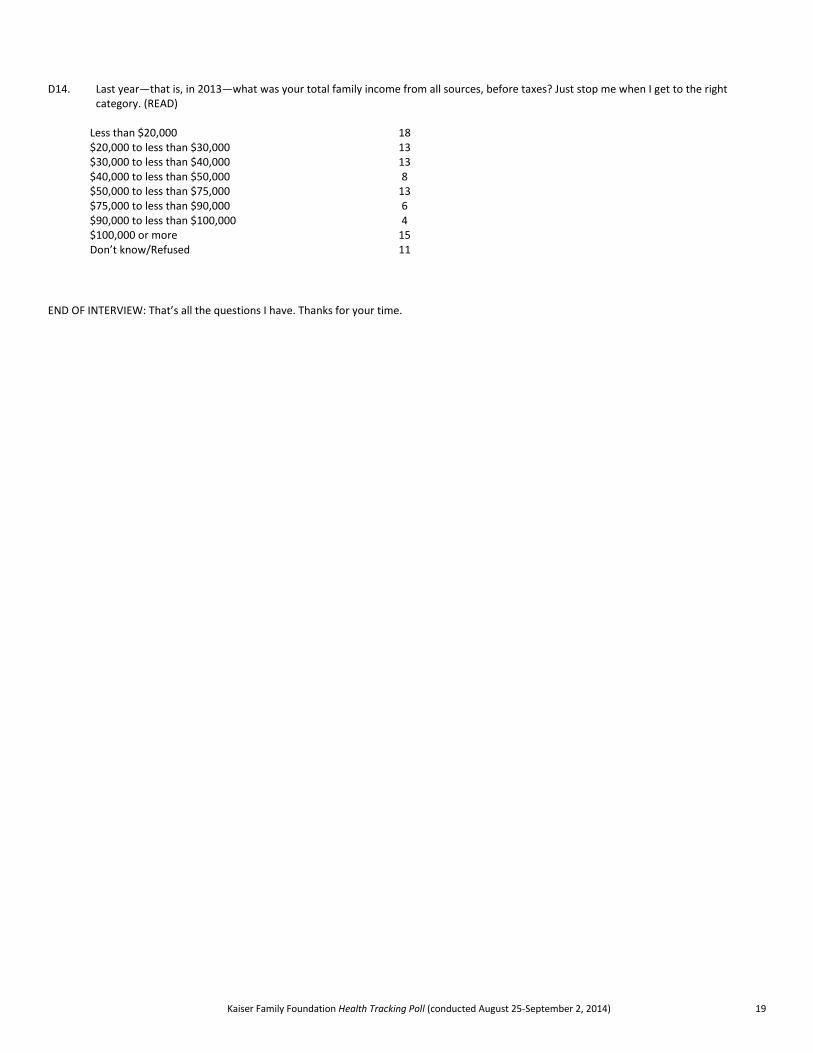
D14. Last year—that is, in 2013—what was your total family income from all sources, before taxes? Just stop me when I get to the right
category. (READ)
Less than $20,000 18 $20,000 to less than $30,000 13 $30,000 to less than $40,000 13 $40,000 to less than $50,000 8 $50,000 to less than $75,000 13 $75,000 to less than $90,000 6 $90,000 to less than $100,000 4 $100,000 or more 15 Don’t know/Refused 11
END OF INTERVIEW: That’s all the questions I have. Thanks for your time.

The Henry J. Kaiser Family Foundation
Headquarters 2400 Sand Hill Road
Menlo Park, CA 94025 Phone: (650) 854-9400 Fax: (650) 854-4800
Washington Offices and Barbara Jordan Conference Center
1330 G Street, NW Washington, DC 20005
Phone: (202) 347-5270 Fax: (202) 347-5274
www.kff.org
This publication (#8628-T) is available on the Kaiser Family Foundation website at www.kff.org.
Filling the need for trusted information on national health issues,
the Kaiser Family Foundation is a nonprofit organization based in Menlo Park, California.