K4C Building Energy Benchmarking Report - King County
31
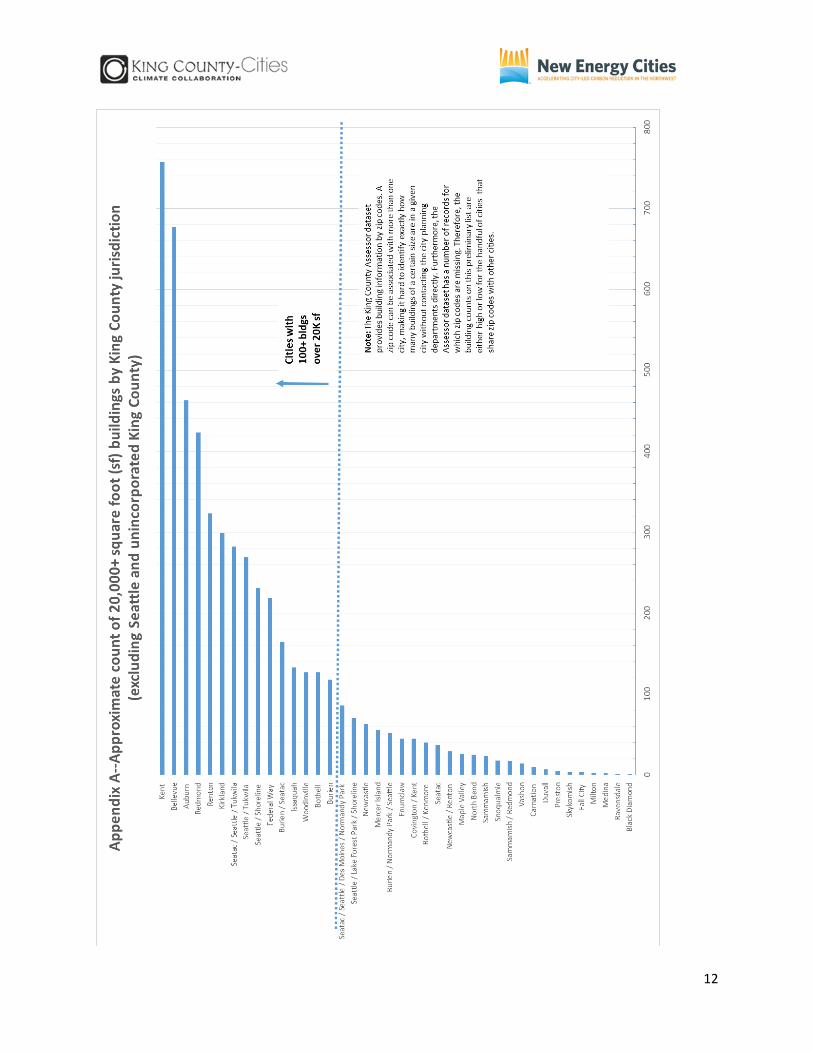
1 _____________________________________________________________________________________ MEMO Date: January 22, 2016 TO: King County-Cities Climate Collaboration (K4C) Steering Committee FROM: K4C Commercial Energy Benchmarking Subcommittee & New Energy Cities RE: Building Energy Benchmarking Policy, Program, and Partnership Options I. Executive Summary This memo updates the King County-Cities Climate Collaboration (K4C) Steering Committee on building energy benchmarking (“benchmarking”) policy and program options that the K4C Commercial Energy Benchmarking Subcommittee reviewed between September and December 2015, and makes recommendations for K4C member action. The subcommittee examined benchmarking as a key element of a larger suite of policies, programmatic actions, and incentives necessary to achieve the K4C’s commitment of 25% building energy use reduction by 2030. In considering options for building energy benchmarking, the subcommittee recommends that the K4C collective body and individual jurisdictions keep in mind the following principles for action: Driving energy use reductions across maximum floor area. Adding value for owners, managers, tenants, and utility partners to inspire action. Aligning regionally with existing policies and initiatives. Collaborating to share fixed costs. Pursuing an opt-in model with common elements. Linking to existing incentives and resources. Leading by example, focusing on public buildings first. After reviewing models from across the U.S., the subcommittee recommends that each K4C member jurisdiction adopt an ordinance that includes the following components: 1. Mandatory Public Building Benchmarking and Disclosure. Requires annual energy benchmarking and reporting for all city and county buildings and campuses of buildings that are: 20,000 square feet or greater; An office, library, or public safety building with a floor area of 5,000 square feet or greater; A wastewater treatment plant; or Leased buildings greater than 20,000 square feet where the city or county is the sole occupant and controls the building utility accounts. 2. Voluntary Commercial Building Benchmarking and Disclosure. Outlines a program of voluntary annual energy benchmarking and reporting for commercial buildings with floor area of 20,000 square feet or greater within a jurisdiction. Participating buildings may receive technical assistance from the State of Washington and a third-party provider on the condition that they agree to disclose their annual energy use information publicly, using a collective mechanism that the K4C will determine. Such a program could lay the foundation for a future mandatory policy. (See Appendix A for the estimated numbers by King County jurisdiction of buildings that have floor area of 20,000 square feet or greater, and see Appendix B for model ordinance language.)
Transcript of K4C Building Energy Benchmarking Report - King County

1
_____________________________________________________________________________________
MEMO Date: January 22, 2016 TO: King County-Cities Climate Collaboration (K4C) Steering Committee FROM: K4C Commercial Energy Benchmarking Subcommittee & New Energy Cities RE: Building Energy Benchmarking Policy, Program, and Partnership Options
I. Executive Summary This memo updates the King County-Cities Climate Collaboration (K4C) Steering Committee on building energy benchmarking (“benchmarking”) policy and program options that the K4C Commercial Energy Benchmarking Subcommittee reviewed between September and December 2015, and makes recommendations for K4C member action. The subcommittee examined benchmarking as a key element of a larger suite of policies, programmatic actions, and incentives necessary to achieve the K4C’s commitment of 25% building energy use reduction by 2030. In considering options for building energy benchmarking, the subcommittee recommends that the K4C collective body and individual jurisdictions keep in mind the following principles for action:
Driving energy use reductions across maximum floor area. Adding value for owners, managers, tenants, and utility partners to inspire action. Aligning regionally with existing policies and initiatives. Collaborating to share fixed costs. Pursuing an opt-in model with common elements. Linking to existing incentives and resources. Leading by example, focusing on public buildings first.
After reviewing models from across the U.S., the subcommittee recommends that each K4C member jurisdiction adopt an ordinance that includes the following components:
1. Mandatory Public Building Benchmarking and Disclosure. Requires annual energy benchmarking and reporting for all city and county buildings and campuses of buildings that are:
20,000 square feet or greater; An office, library, or public safety building with a floor area of 5,000 square feet or
greater; A wastewater treatment plant; or Leased buildings greater than 20,000 square feet where the city or county is the sole
occupant and controls the building utility accounts.
2. Voluntary Commercial Building Benchmarking and Disclosure. Outlines a program of voluntary annual energy benchmarking and reporting for commercial buildings with floor area of 20,000 square feet or greater within a jurisdiction. Participating buildings may receive technical assistance from the State of Washington and a third-party provider on the condition that they agree to disclose their annual energy use information publicly, using a collective mechanism that the K4C will determine. Such a program could lay the foundation for a future mandatory policy. (See Appendix A for the estimated numbers by King County jurisdiction of buildings that have floor area of 20,000 square feet or greater, and see Appendix B for model ordinance language.)
2
The K4C’s target of 25% energy use reduction in existing buildings is ambitious, and requires bold steps to drive deeper energy efficiency community-wide. A crucial step on this path is to increase awareness of building energy consumption among building owners, managers, tenants, prospective buyers, and government officials. While public building benchmarking and voluntary commercial benchmarking are practical first actions, this subcommittee recommends that the K4C consider them a transitional phase, and remain focused on mandatory benchmarking, reporting, and disclosure of energy use information in commercial buildings in the next several years. II. What Are Benchmarking and Disclosure, and Why Are They Valuable? The building sector represents approximately 40 percent of total U.S. energy consumption, making it the largest user of energy nationally.1 The worst performing buildings use 3 to 7 times as much energy as the best performing buildings.2 In King County, buildings represent over half of energy consumption countywide.3 Building energy benchmarking represents “the process of tracking the energy consumed, over time, of an existing building and comparing the results to similar buildings or an applicable standard.”4 Benchmarking may also compare a building to its own historical performance, and may be valuable in “validating and managing utility bills.”5 Many public and private building owners use benchmarking to manage the energy use of a building or portfolio of buildings. (See Appendix C for a description of related energy measurement and management approaches.) The purpose of a benchmarking and disclosure policy is to direct building owners to report information about building energy performance, with the goal of motivating investment in efficiency upgrades and undertaking other actions that save energy and reduce carbon emissions. Benchmarking is thus considered a “market-based policy tool to increase building energy performance awareness among key stakeholders and create demand for energy efficiency improvements.”6 Such policies may require building owners to disclose benchmarking results during real estate transactions, or to report benchmarking information to a regulating jurisdiction. The benefits of benchmarking are powerful. The U.S. Environmental Protection Agency found that “organizations benchmarking consistently in Portfolio Manager have achieved average energy savings of 2.4% per year [for a total savings of 7% over the four-year period of analysis], and an average increase in ENERGY STAR score of 2 points per year in their buildings [for a total score increase of 6 points over the period of analysis]. If all buildings in the U.S. followed a similar trend, over 18 million metric tons of
1 “Energy Benchmarking and Transparency Benefits.” Summary document. Institute for Market Transformation and
Pacific Coast Collaborative. 2015. 2 Ibid.
3 “What Will It Take? Meaningful Carbon Reductions in King County.” Climate Solutions presentation to the King
County-Cities Climate Collaboration Elected Official Working Summit. June 12, 2014. 4 “Introduction to Benchmarking or Tracking Energy Consumption in Commercial and Public Buildings.” Midwest
Energy Efficiency Alliance. Accessed December 7, 2015. Online: http://tinyurl.com/zvmjbam. 5 Granderson, Jessica, et al. “EMIS: Crash Course.” U.S. Department of Energy Better Buildings EMIS Project Team
Meeting, December 12, 2013. Online: http://eis.lbl.gov/pubs/emis-crash-course.pdf. 6 “State and Local Energy Benchmarking and Disclosure Policy.” U.S. Department of Energy Office of Energy
Efficiency and Renewable Energy. Accessed December 7, 2015. Online: http://tinyurl.com/hhn5dpy.
3
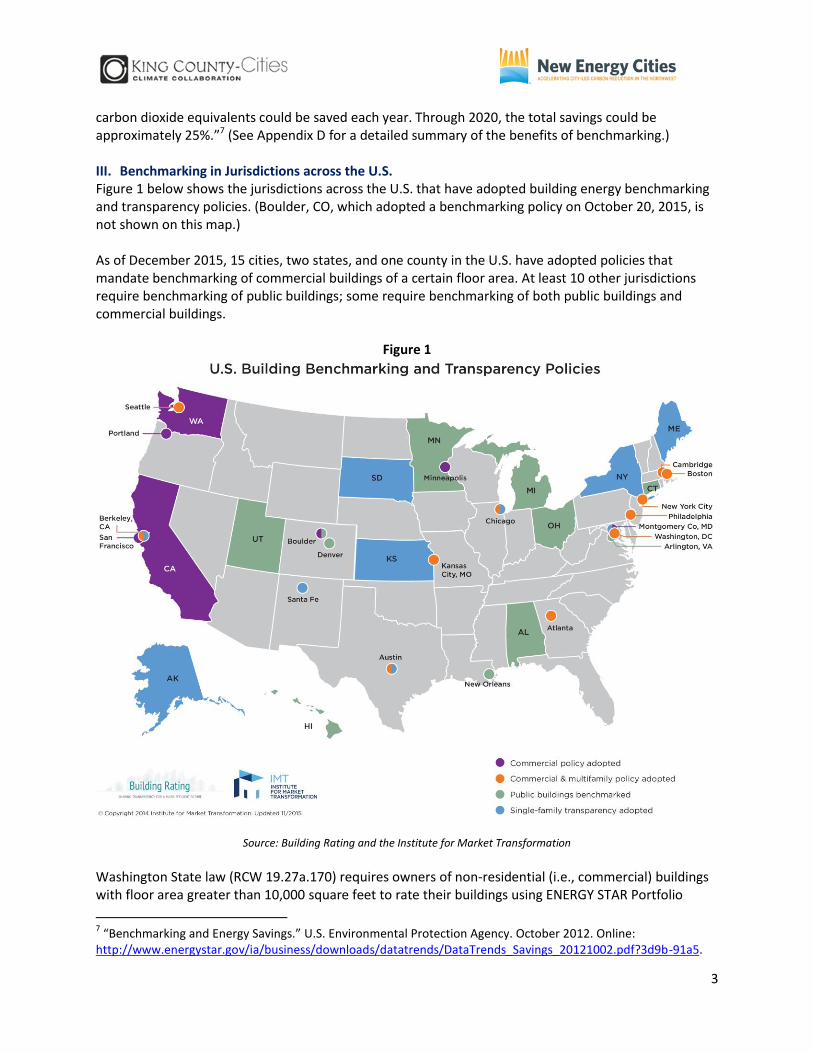
carbon dioxide equivalents could be saved each year. Through 2020, the total savings could be approximately 25%.”7 (See Appendix D for a detailed summary of the benefits of benchmarking.) III. Benchmarking in Jurisdictions across the U.S. Figure 1 below shows the jurisdictions across the U.S. that have adopted building energy benchmarking and transparency policies. (Boulder, CO, which adopted a benchmarking policy on October 20, 2015, is not shown on this map.) As of December 2015, 15 cities, two states, and one county in the U.S. have adopted policies that mandate benchmarking of commercial buildings of a certain floor area. At least 10 other jurisdictions require benchmarking of public buildings; some require benchmarking of both public buildings and commercial buildings.
Figure 1
Source: Building Rating and the Institute for Market Transformation
Washington State law (RCW 19.27a.170) requires owners of non-residential (i.e., commercial) buildings with floor area greater than 10,000 square feet to rate their buildings using ENERGY STAR Portfolio
7 “Benchmarking and Energy Savings.” U.S. Environmental Protection Agency. October 2012. Online:
http://www.energystar.gov/ia/business/downloads/datatrends/DataTrends_Savings_20121002.pdf?3d9b-91a5.

4
Manager software and to disclose those ratings to potential buyers, tenants, and lenders in advance of the closing of a transaction.8 It also requires benchmarking of Washington State Department of General Administration buildings and other qualifying state agency buildings, and state agencies have made progress in benchmarking state-owned facilities. However, the state law does not include an enforcement mechanism to confirm benchmarking of private facilities. The Washington State Legislature has considered revisions to the existing benchmarking law. Proposed bill HB 1278 (2015-2016) would have set a requirement that all large non-residential buildings report to a state account. The state would provide aggregated reporting of the results in the first compliance year, then make individual building energy benchmarking results public in year two. This provision is intended to ensure building owner participation, and to make the resulting information open and available to the real estate market. The City of Seattle requires owners of non-residential and multifamily buildings with floor area of 20,000 square feet or larger to track energy performance and report annually to the city using ENERGY STAR Portfolio Manager. Seattle also tracks and publicly discloses municipal building data as part of the program.9 IV. Common Elements of a Benchmarking and Disclosure Program As described by the City Energy Project’s Benchmarking Implementation Guide,10 a benchmarking and disclosure program typically consists of:
Adopting an ordinance requiring that public, commercial, and/or multifamily buildings of a certain floor area to report their energy use to a local or state jurisdiction on an annual basis—most commonly to the U.S. Environmental Protection Agency’s ENERGY STAR Portfolio Manager, an online tool for measuring and tracking energy and water consumption.11 (See Appendix E for a sample ENERGY STAR statement of energy performance.)
Developing a target building list for compliance and outreach, using local assessor/tax data on property ownership.
Notifying target buildings that they are required to comply with the policy. Developing compliance materials, and reaching out to covered building owners. Technical assistance, including providing training, education, and data verification support. Creating a benchmarking help center. Enforcing the law. Analyzing data and creating reports for policymakers and stakeholders. (See Appendix F for a
sample City of Seattle benchmarking scorecard.) Partnering with utilities to share findings and drive participation in efficiency incentive
programs.
8 “Washington State Energy Benchmarking Law.” Building Rating. Accessed December 15, 2015. Online at:
http://www.buildingrating.org/jurisdiction/Washington. 9 “Energy Benchmarking.” City of Seattle. Accessed December 21, 2015. Online at:
http://www.seattle.gov/environment/buildings-and-energy/energy-benchmarking-and-reporting. 10
“Benchmarking Implementation Guide.” City Energy Project, a joint project of Natural Resources Defense Council and the Institute for Market Transformation. Rev. 1, June 2015. Unpublished. 11
“Use Portfolio Manager.” U.S. Environmental Protection Agency and U.S. Department of Energy. Accessed December 7, 2015. Online: http://www.energystar.gov/buildings/facility-owners-and-managers/existing-buildings/use-portfolio-manager.
5
Leading benchmarking and disclosure programs are also working on how to create business value and inspire action among building owners and managers through the use of performance reports, dashboards, and other energy intelligence tools for individual buildings.12 The City of Seattle, for example, conducted focus groups with building owners, managers, and service providers that had complied with Seattle’s benchmarking and reporting ordinance, to understand what motivates these stakeholders to improve building energy efficiency. (See Appendix G for a summary of Seattle focus group findings, and see Appendix H for further resources.) In 2015 the Pacific Coast Collaborative developed a model policy for building energy benchmarking to encourage uniformity across local jurisdictions (see Appendix B), with the goals of 1) simplifying implementation for building owners with impacted facilities in multiple jurisdictions, and 2) helping administrators find efficiencies through cooperation. Mandatory vs. Voluntary Initiatives Some jurisdictions have voluntary commercial energy reduction programs and initiatives that encourage building owners to participate through marketing, incentives, and technical assistance, but do not require building owners to benchmark their energy use. Denver, CO, for example, has a recognition program for buildings over 10,000 square feet, through which participants benchmark their buildings’ energy use with ENERGY STAR Portfolio Manager and report their ENERGY STAR score annually to the City. However, current participants account for only 4.6% of the square footage of buildings over 10,000 square feet.13 Analysis by the American Council for an Energy-Efficient Economy and the Institute for Market Transformation indicates that mandatory policies impact 4 to 16 times greater floor area compared to voluntary initiatives (see Figure 2 below).
12
Resource Media. “What Inspires Action? Understanding Motivations for Improving Building Energy Efficiency.” Prepared for the City of Seattle. April 2015. 13
“Unlocking the Value of Building Energy Efficiency.” Denver City Energy Project. Accessed December 7, 2015. Online: http://tinyurl.com/htk9p4t. Also see: “Denver City Energy Project Benchmarking Program Update.” June 2015. Online: http://tinyurl.com/z6794h8.

6
Figure 2: Floor Area Impact of Mandatory Policies vs. Voluntary Initiatives
V. Recommended Components of a K4C Building Energy Benchmarking Program After reviewing models from across the U.S. and considering local conditions, the subcommittee recommends that K4C member jurisdictions start with a program of mandatory public building benchmarking and voluntary commercial benchmarking. This initial focus on public building benchmarking emerged from the perception that local governments should lead by example in benchmarking their own buildings before asking commercial buildings owners to do so. In addition, the systems and capacity required for public benchmarking are directly adaptable to commercial building benchmarking. The subcommittee specifically recommends that K4C member jurisdictions adopt an ordinance (see Appendix B) that includes:
1. Mandatory Public Building Benchmarking. This would require annual energy benchmarking and reporting for all city and county buildings and campuses of buildings that are:
20,000 square feet or greater; An office, library, or public safety building with a floor area of 5,000 square feet or
greater; A wastewater treatment plant; or

7
Leased buildings greater than 20,000 square feet where the city or county is the sole occupant and controls the building utility accounts.
Many jurisdictions that adopt benchmarking and disclosure policies take the lead by benchmarking their own buildings first. We recommend that the K4C adopt this approach. Steps would include:
Making a list of municipal buildings to measure. Collecting required building characteristics. Signing up for automatic data upload and Portfolio Manager. Analyzing the data and creating a report for senior leadership and elected officials. Publishing the report with related context and findings. Working with building staff and others to identify priority projects to reduce energy use
through operational improvements, behavior change, and implementation of energy efficiency upgrades.
Repeating the cycle on a regular (e.g., annual) basis. To drive reductions in energy use based on benchmarking data, the K4C will also need to develop tools and resources to support efforts across jurisdictions, such as a loan program for resource efficiency efforts and support for shared Resource Conservation Management (RCM) efforts.14 The Washington State Department of Commerce and the Smart Buildings Center (SBC) will be able to support local jurisdictions with technical assistance, and partner with the K4C to reduce costs. The Department of Commerce and NEEC are also interested in creating a portfolio of public buildings in Puget Sound jurisdictions, and supporting participating jurisdictions with technical assistance, data management, and analysis. Participating in such a program could help K4C jurisdictions to understand how the energy performance of their buildings and facilities compare to those of other K4C members. In the future, jurisdictions may also want to explore how to promote benchmarking in other
public buildings that are not municipally owned (e.g., schools and other public institutions).
2. Voluntary Commercial Benchmarking with Public Disclosure. This would be a program of
voluntary annual energy benchmarking and reporting for commercial buildings with floor area of
20,000 square feet or greater within the jurisdiction. Participating buildings may receive
technical assistance on the condition that they agree to disclose their annual energy use
information publicly, using a mechanism that the K4C will determine. (See Appendix A for the
14
Resource Conservation Managers are advisors who help building owners and managers: 1) identify energy-savings opportunities; 2) track utility cost and usage with utility accounting software; 3) analyze energy usage patterns with data from advanced meters; and 4) developing internal capacity through free training. More information available online at: https://pse.com/savingsandenergycenter/ForBusinesses/energy-management-programs/Pages/Resource-Conservation-Manager.aspx.

8
estimated numbers of buildings that have floor area of 20,000 square feet or greater, by King
County jurisdiction.15)
Steps could include:
Setting a community goal for building energy benchmarking and recruiting building
owners to join the U.S. Department of Energy’s Better Buildings Challenge, or another
voluntary campaign.
Convening private building owners to promote benchmarking and review examples of
success, including in public buildings.
Partnering with Puget Sound Energy and Seattle City Light major account / large
customer account managers to conduct outreach to large building owners, inviting them
to participate in a voluntary assessment of energy use, and encouraging their
participation in existing utility incentive programs.
Supporting private building owners with technical assistance to sign up for automatic
data upload and Portfolio Manager.
K4C jurisdictions could pursue these steps individually or collectively. The Department of
Commerce and Smart Buildings Center may be willing to provide technical assistance for a
voluntary program, on the condition that participating property owners agree to disclose their
energy use information publicly. The K4C would also have to develop an approach (e.g., an
online data visualization tool or website) to share results publicly.
Cities with sufficient interest may consider a stretch recommendation of making the commercial energy benchmarking program mandatory rather than voluntary.
3. Stretch Recommendation: Mandatory Commercial Benchmarking and Disclosure. Interested
cities could modify the ordinance in Appendix B to require annual benchmarking and reporting
from commercial buildings over 20,000 square feet, consistent with the City of Seattle’s law.
This approach would reach the greatest floor area community-wide, and therefore would
require more significant level of technical assistance, as well as enforcement capacity. However,
similar to a voluntary commercial approach, K4C jurisdictions would also collaborate on
outreach to connect owners of covered buildings with utility and other support services,
technical assistance from Commerce and Smart Buildings Center, and enforcement.
In all of the above tiers, the subcommittee recommends ENERGY STAR Portfolio Manager as the
reporting mechanism, using automatic data upload from Puget Sound Energy and Seattle City Light.
Rulemaking would address further specifics.
15
Each jurisdiction may choose to analyze its building distribution by different size categories (e.g., between 10,000 and 20,000 square feet, and below 10,000 square feet). Depending on the number of buildings identified, the jurisdiction may consider a timeline to expand its efforts beyond the largest buildings. However, Washington State Department of Commerce staff recommend against expanding the covered building pool too greatly, as it could make a program complex and hard to manage. For reference, the City of Seattle does not currently have plans to expand its covered building pool to buildings smaller than 20,000 square feet.

9
This tiered approach supports the K4C’s commitment to reduce energy use in all existing buildings by
starting on a path to building energy benchmarking while maintaining a long-term focus on mandatory
benchmarking at a community scale.
VI. Known Challenges and Potential Solutions Launching a benchmarking program, whether voluntary or mandatory, is challenging. Known issues and potential solutions include the following: Staff Capacity A number of K4C jurisdictions have cited staffing constraints as a reason for not pursuing building energy benchmarking programs. With the above recommendations, each jurisdiction will still need to identify a staff person to collect background data (e.g., number of computers, number of building occupants), enroll in a Portfolio Manager account, request automatic upload of energy data from the jurisdiction’s energy utility, and maintain the accounts for public buildings. However, roles and responsibilities will vary according to jurisdiction (i.e., the person who collects data does not need to be a busy facility manager), and a collaborative approach could reduce operational costs. In addition, Department of Commerce has received funding to support early adopters of benchmarking and disclosure programs. Working with the Smart Buildings Center, Commerce will provide much of the needed infrastructure and staff required to initiate a benchmarking and disclosure program. While program details are still under development, it will specifically focus on fulfilling both state and local government needs. Table 1 below outlines potential staffing approaches (e.g., in-house staffing, consultant, or multi-jurisdictional partnership) and cost information to execute the most common steps of setting up a public building benchmarking program. Table 2 outlines similar information for setting up a commercial building benchmarking program; costs will be determined as the K4C program develops. (Information in the tables below is based on conversations with Seattle and Bellevue city staff). Table 1: Elements of a Public Building Benchmarking Program and Potential K4C Staffing Approaches
Element Potential K4C Staffing Approach Costs
In-house Consultant Multi-jurisdictional partnership
One-time Ongoing
Benchmark public buildings
x x x 2-6 hours per building
1 hour per building
Manage data x x x TBD TBD
Trainings for city operators
x x TBD TBD
Data analysis & report writing
x x $6,000-$8,000 $4,000 per report cycle

10
Table 2: Elements of a Commercial Benchmarking Program and Potential K4C Staffing Approaches
Element Potential K4C Staffing Approach Costs
In-house Consultant Multi-jurisdictional partnership
One-time Ongoing
Outreach to covered buildings
x x x TBD TBD
Collect and manage benchmarking data
x x x TBD TBD
Website creation x x $10,000-90,00016
TBD
Help center x x TBD TBD
Trainings x x TBD TBD
Enforcement x x TBD TBD
Data analysis & report writing
x x $50,000-70,00017
TBD
Technical assistance x x TBD TBD
Stakeholder Concerns Building owners and managers nationwide have expressed concern that benchmarking and disclosure laws can unfairly stigmatize property owners with poorly performing buildings.18 As one of the first cities in the U.S. to pass a benchmarking law, Seattle initially addressed this concern by not requiring public disclosure. As of early 2016, Seattle now requires public disclosure, as do almost all cities with benchmarking laws. Cities with benchmarking have avoided or overcome backlash by listening early and often to input from building owners and managers. From these conversations, several best practices for city staff have emerged, including:
1. Walking the talk by benchmarking and disclosing the energy use of city buildings first; 2. Displaying data with helpful context about building types (e.g., that supermarkets inherently
tend to use more energy than office buildings) and unique uses (e.g., city public safety buildings that host 24-hour call centers); and
3. Highlighting improvements and progress as much as possible. Most importantly, city staff should reach out to covered building owners and managers to determine their specific concerns and explore ways to move forward collaboratively.
16
The City of Seattle notes that an off-the-shelf website could cost as little as $10,000, whereas an online visualization tool could range from $30,000 (based on a tool the City of Philadelphia has developed that is now open-source) to $90,000 (for a more robust tool similar to the one that New York City has). 17
According to the City of Seattle, the analysis could cost $40,000-50,000, and the report writing, design, and production could cost $10,000-20,000. Lawrence Berkeley National Laboratory also offers a free service of data cleaning and organization when a jurisdiction submits its data to the U.S. Department of Energy Building Performance Database. 18
Lacey, Stephen. “Sticker Shock: How Do You Get the Real Estate Community to Embrace Energy Disclosure?” Green Tech Media. July 16, 2013. Online: http://www.greentechmedia.com/articles/read/sticker-shock-will-the-real-estate-community-embrace-energy-disclosure.

11
Many cities with benchmarking laws have also committed to support property owners with advice and to connect underperforming properties with incentives to improve their energy efficiency. Instead of issuing fines, for example, some cities provide additional technical assistance and outreach to help non-compliant property owners report their energy use. Data Access Local governments have inconsistent access to data about buildings and property ownership. County assessor/tax data is not always accurate, and does not include building operator contact information. Moreover, different stakeholders (e.g., cities, state agencies, and building owners) may use different addresses or identifying information, which make it difficult to match and link database information for outreach and analyses. In the future, the K4C should consider jointly approaching the King County Assessor’s Office to identify common data issues and explore potential solutions. (Note: K4C jurisdictions are fortunate that Puget Sound Energy and Seattle City Light have already instituted automatic energy data upload for building owners, which results in significant time savings compared to manual entry.)
VII. Conclusion The K4C’s target of 25% energy use reduction in existing buildings is ambitious, and requires a suite of
policy, program, and partnership actions to drive deeper energy efficiency community-wide. A crucial
step on this path is to increase awareness of building energy consumption among building owners,
managers, tenants, prospective buyers, and government officials. While public building benchmarking is
a practical first step, this subcommittee recommends that the K4C consider it a transitional phase, and
remain focused on mandatory benchmarking, reporting, and disclosure of energy use information in
commercial buildings in the next several years.
12

13
Appendix B – Sample Building Energy Benchmarking Ordinance Language 1. INTRODUCTION This sample ordinance language has been developed to encourage consistency in the adoption and implementation of commercial building benchmarking policies for several reasons:
Uniformity in application of commercial benchmarking policies, whether voluntary or
mandatory, will simplify implementation;
Market participants working across jurisdictions will more readily anticipate and comply with
requirements; and
Administrators will benefit from cooperative development and implementation of support
mechanisms.
Significant elements of this language were developed by the Pacific Coast Collaborative benchmarking workgroup, which consists of the British Columbia Ministry of Energy and Mines, California Energy Commission, Oregon Department of Energy, and the Washington State Energy Office.19 The K4C Commercial Energy Benchmarking Subcommittee has further modified it for local application.
2. MANDATORY PUBLIC BENCHMARKING AND VOLUNTARY COMMERCIAL BENCHMARKING The sample language for a program of mandatory public benchmarking and voluntary commercial benchmarking is as follows. (Note: not all definitions will be relevant, as some apply to the sample ordinance language for mandatory commercial benchmarking.)
PURPOSE The purpose of these policies is to promote sharing of information about building energy performance and motivate investment in efficiency improvements that save energy and reduce carbon emissions. Section A. DEFINITIONS (1) “Benchmark” means to input benchmarking information into the benchmarking tool as required by
this policy.
(2) “Benchmarking information” means descriptive and resource inputs required to benchmark a building and the output information generated by the benchmarking tool. The information may include, but need not be limited to: (a) Descriptive inputs
i. Building address; ii. Building occupancy type;
iii. Gross floor area; iv. Number of occupants; and
19
In October 2013, four of the five Pacific Coast Collaborative jurisdictions—British Columbia, Washington, Oregon, and California—established the Pacific Coast Action Plan on Climate and Energy. This plan includes a priority on adopting common approaches to building energy benchmarking, which the Pacific Coast Collaborative workgroup is responsible for developing. Online at: http://www.pacificcoastcollaborative.org/Pages/Agreements.aspx.

14
v. Contextual information related to energy use in the building provided by the building owner. (b) Resource inputs
i. Purchased energy; ii. On-site energy generation; and
iii. Water. (c) Output information
i. Building address; ii. Building occupancy type;
iii. Gross floor area; iv. Site energy use intensity (EUI); v. Weather normalized site EUI;
vi. Weather normalized source EUI; vii. Total annual greenhouse gas emissions;
viii. Water use per gross square foot; and ix. The energy performance score for qualified property types.
(d) Compliance or noncompliance with this ordinance. (e) Contextual information related to energy use in the building provided by the building owner.
(3) “Benchmarking tool” means the U.S. Environmental Protection Agency’s ENERGY STAR Portfolio Manager tool, or an equivalent tool adopted by the Administrator.
(4) “Building owner” means any of the following: (a) An individual or entity possessing title to a covered building; (b) The net lessee in the case of a building subject to a triple net lease with a single tenant; (c) The net lessee in the case of a building subject to a net lease with a term of at least forty-nine
years, inclusive of all renewal options; (d) The board of managers in the case of a condominium; (e) The board of directors in the case of a cooperative apartment corporation; or (f) An agent authorized to act on behalf of any of the above.
(5) “Covered building” means a building that is specified in Sections B and C.
(6) “Administrator” means an organization created or designated to manage a mandatory or voluntary benchmarking program, including the development of rules, data management and collection, and reporting of the results of the voluntary program.
(7) “Energy” means electricity (grid, on-site solar, onsite wind), natural gas, district steam, district hot water, district chilled water, propane, fuel oil, wood, coal, or other fuels used to meet the loads of the covered property.
(8) “Energy performance score” means the numeric rating generated by the ENERGY STAR Portfolio Manager tool or equivalent tool approved by the Administrator.
(9) “ENERGY STAR Portfolio Manager” means the tool developed and maintained by the U.S. Environmental Protection Agency to track and assess the relative energy performance of buildings nationwide.

15
(10) “Energy use intensity” or “EUI” means the energy use per square foot of gross floor area. This is reported as 1,000 British thermal unit per gross square foot of floor area (kBtu/SF). EUI may be reported as “site EUI” or “source EUI”. (a) “site EUI” is a measurement of energy used in the building per gross square foot of floor area,
and (b) “Source EUI” is a measurement of all energy use including generation, transmission, distribution
and on-site building energy use per gross square foot of building.
(11) “Financial hardship” (of a building) means a building that: (a) Had arrears of property taxes or water or wastewater charges that resulted in the property's
inclusion, within the prior two years, on the city’s annual tax lien sale list; or (b) Has a court appointed receiver in control of the asset due to financial distress; or (c) Is owned by a financial institution through default by the borrower; or (d) Has been acquired by a deed in lieu of foreclosure; or (e) Has a senior mortgage subject to a notice of default.
(12) "Gross floor area" means the total number of enclosed square feet measured between the principal
exterior surfaces of the fixed walls of a building, as detailed in the ENERGY STAR Portfolio Manager glossary.
(13) “Library building” refers to buildings used to store and manage collections of literary and artistic materials such as books, periodicals, newspapers, films, etc. that can be used for reference or lending.
(14) “Office building” refers to buildings used for the conduct of commercial or governmental business activities. This includes administrative and professional offices.
(15) “Public Safety building” means fire station, police station, or Prison/Incarceration. Fire Station refers to buildings used to provide emergency response services associated with fires. Fire stations may be staffed by either volunteer or full-time paid firemen. Police Station applies to buildings used for federal, state, or local police forces and their associated office space. Prison/incarceration refers to federal, state, local, or private-sector buildings used for the detention of persons awaiting trial or convicted of crimes.
(16) “Tenant” means a person or entity occupying or holding possession of a building or premises pursuant to a rental agreement.
(17) “Utility” means an entity that distributes and sells natural gas, electric, thermal energy, or water for buildings.
(18) “Wastewater Treatment Plant” refers to facilities designed to treat municipal wastewater. The level of treatment at a plant will vary based on the biochemical oxygen demand (BOD) limits and the specific processes involved. This property use is intended for primary, secondary, and advanced treatment facilities with or without nutrient removal. Treatment processes may include biological, chemical, and physical treatment. This property use does not apply to drinking water treatment and distribution facilities.

16
Section B. MANDATORY BENCHMARKING OF PUBLIC BUILDINGS (1) Participating jurisdictions shall annually benchmark and report benchmarking information to the
Administrator for the previous calendar year for each public building and wastewater treatment facility, in such form as established by the Administrator: (a) For all public facilities with more than [20,000] gross square feet of floor area, including all leased
facilities in which the jurisdiction is the sole occupant and has control of utility accounts. (b) For each public building or campus of buildings categorized as an office, library, or public safety
building with a floor area greater than 5,000 square feet, by May 1, [year] and by every May 1 thereafter; and
(c) For all municipal wastewater treatment plants, by May 1, [year], or as established by the Administrator’s rule and by every May 1 thereafter.
(2) Before reporting benchmarking information to the Administrator, the jurisdiction shall run all automated data quality checker functions available within the benchmarking tool, and shall correct all missing or incorrect information identified.
(3) Jurisdictions shall provide additional data verification, as defined by the Administrator.
(4) If the jurisdiction learns that any information reported as part of the benchmarking submission is inaccurate or incomplete, the information so reported shall be amended in the benchmarking tool by the jurisdiction and the jurisdiction shall provide an updated benchmarking submission to the Administrator within 30 days of learning of the inaccuracy.
(5) If public buildings or wastewater treatment facilities are excluded from a jurisdiction’s benchmarking reporting, a list of the excluded public buildings or facilities shall be provided to the Administrator.
Section C. VOLUNTARY BENCHMARKING OF PRIVATE BUILDINGS (1) Participating building owners may annually benchmark and report benchmarking information to the
Administrator for the previous calendar year for each covered building, in such form as established by the Administrator: (a) For each covered building with more than [20,000] gross square feet of floor area, by May 1,
[year] and by every May 1 thereafter; and
(2) Before reporting benchmarking information to the Administrator, the jurisdiction shall run all automated data quality checker functions available within the benchmarking tool, and shall correct all missing or incorrect information identified.
(3) Building owners shall provide additional data verification, as defined by the Administrator.
(4) If the building owners learns that any information reported as part of the benchmarking submission is inaccurate or incomplete, the information so reported shall be amended in the benchmarking tool by the building owners and the building owners shall provide an updated benchmarking submission to the Administrator within 30 days of learning of the inaccuracy.
(5) Participating building owners shall disclose energy use information publicly, through a mechanism to be determined.

17
Section D. SHARING OF VOLUNTARY BENCHMARKING INFORMATION (1) Administrators’ Report: By Sept 1, [ year], and annually thereafter, the Administrator shall publish a
report including the following information: (a) Aggregated statistics of the benchmarking information provided to the Administrator by building
owners and/or jurisdictions. (b) Summary statistics on overall participation, an assessment of accuracy and issues affecting
accuracy, summary energy and water consumption statistics, and trends observed across the portfolio of buildings and public works facilities over time.
(2) Public sharing of benchmarking data: The Administrator shall make available on a public website by Sept 1 [year] and annually thereafter key metrics (such as site EUI, ENERGY STAR score, floor area, and other metrics as defined by the Administrator) from the most recent benchmarking output information for each building and public works facility reporting in the previous calendar year.
(3) Sharing with research organizations: The Administrator may share data from benchmarking submissions with a third party for academic or other non-commercial research purposes.
(4) Sharing with conservation program Administrators: The Administrator may provide non-anonymized data from benchmarking submissions to any utility serving a building or public works facility.
3. MANDATORY COMMERCIAL BENCHMARKING The sample language for a program of mandatory commercial building benchmarking is as follows.
Purpose See Mandatory Public Benchmarking and Voluntary Commercial Benchmarking language above.
Section A. DEFINITIONS See Mandatory Public Benchmarking and Voluntary Commercial Benchmarking language above.
Section B. REQUIREMENTS FOR BENCHMARKING AND REPORTING OF COVERED BUILDINGS (1) For each covered building with more than [20,000] gross square feet of floor area, building owners
shall annually benchmark and report such benchmarking information to the Administrator for the previous calendar year for each covered building, in such form as established by the Administrator’s rule: (a) For each covered building with more than [50,000] gross square feet of floor area, by May 1,
[year] and by every May 1 thereafter; and (b) For all remaining covered buildings, by May 1, [year], or as established by the Administrator’s rule
and by every May 1 thereafter.
(2) Before reporting benchmarking information to the Administrator, the building owner shall run all automated data quality checker functions available within the benchmarking tool, and shall correct all missing or incorrect information identified.
(3) Building owners shall provide additional data verification, as defined by the Administrator’s rule
(4) If the building owner learns that any information reported as part of the benchmarking submission is inaccurate or incomplete, the information so reported shall be amended in the benchmarking tool by
18
the building owner and the building owner shall provide an updated benchmarking submission to the Administrator within 30 days of learning of the inaccuracy.
(5) Exceptions: Compliance with this policy is not required for a covered building if one of the following apply: (a) The building did not have a certificate of occupancy or temporary certificate of occupancy for all
12 months of the calendar year being benchmarked. (b) The building did not have an average physical occupancy of at least 50 percent throughout the
calendar year for which benchmarking is required. (c) The building does not receive energy services. (d) The building’s primary use is manufacturing or other industrial purposes, as defined under the
following building use designations of the International Building Code: i. Factory Group F
ii. High-hazard Group H (e) Full demolition work has commenced or legal occupancy is no longer possible prior to May 1. (f) The Administrator determines that strict compliance with provisions of this ordinance would
cause undue harm to the occupant’s business interests or to the public interest. (g) The property is under financial hardship.
(6) Any building owner requesting an exemption from benchmarking shall be required to provide the Administrator documentation to substantiate the request or otherwise assist the Administrator in the exemption determination. Any exemption granted shall be limited to the Benchmarking Submission for which the request was made and does not extend to past or future submittals.
Section C. SHARING OF BENCHMARKING INFORMATION (1) Administrator’s Report: By Sept 1, [ year], and annually thereafter, the Administrator shall publish a
report including the following information: (a) Aggregated statistics of the benchmarking information provided to the Administrator by building
owners. (b) Summary statistics on overall compliance with this chapter, an assessment of accuracy and
issues affecting accuracy, summary energy and water consumption statistics, and trends observed across the portfolio of covered buildings over time.
(2) Public sharing of benchmarking data: The Administrator shall make available on a public website by Sept 1 [year] and annually thereafter key metrics (such as site EUI, Energy Star score, floor area, and other metrics as defined by the Administrator) from the most recent benchmarking output information for each covered building required to report in the previous calendar year.
(3) Sharing with research organizations: The Administrator may share data from benchmarking submissions with a third party for academic or other non-commercial research purposes, provided that such data is anonymized.
(4) Sharing with conservation program Administrators: The Administrator may provide non-anonymized data from benchmarking submissions to any utility serving a covered building or to the Administrator of any federal, state, or city-managed sustainability or energy efficiency program.

19
(5) All third parties receiving non-anonymized data from benchmarking submissions shall sign a non-disclosure agreement with the governing agency stipulating terms for acceptable use of the data, including assurances that such data shall not be disclosed to other entities, before receiving such data.
Section D. TENANT BENCHMARKING INFORMATION TO THE BUILDING OWNER
(1) Within 30 days of a request by the building owner, each tenant located in a covered building shall provide the number of occupants, number of computers, operational hours and other information required by Portfolio Manager.
(2) Where the building owner is unable to benchmark due to the failure of any or all tenants to report the information required by Section (E)(1), the owner shall complete benchmarking using default values provided by Portfolio Manager or as specified by the Administrator’s rules and shall indicate that alternate values have been used.
Section E. VIOLATIONS AND ENFORCEMENT (1) If the Administrator determines that a building owner has failed to report accurate energy
benchmarking information pursuant to Section (B)(1), the Administrator may seek the following remedies: (a) A written warning may be issued for the first violation; and (b) If benchmarking information is not reported within 45 days of the date the written warning is
issued, the Administrator may issue a notice of violation with a penalty of up to $[xxx] per day for the first 10 days of noncompliance, then up to $[xxx] per day for each day in violation past the 10th day until compliance is achieved.
(2) If the Administrator determines that a tenant has failed to provide information to a building owner
pursuant to Section (E)(1), the Administrator may seek the following remedies on a quarterly basis: (a) A citation of up to $[xxx] may be issued for the first violation; (b) A citation of up to $[xxx] may be issued for the second violation within a 12-month period; and (c) A citation of up to $[xxx] may be issued for the third and subsequent violation within a 12-month
period.
(3) Right of Appeal and Payment of Assessments [by the jurisdiction]
Section F. RULES (1) The Administrator shall promulgate such rules as deemed necessary to carry out the provisions of
this article.

20
Appendix C – Related Energy Management Approaches According to the U.S. Department of Energy,20 “energy management information systems (EMIS) [are] a broad family of tools and services used to manage commercial building energy use.” These approaches include:
Energy information systems, which display hourly or 15-minute meter data in energy dashboard or kiosk format. For example, Bellevue, WA is launching Urban Smart │ Bellevue, a partnership with Puget Sound Energy that will use 15-minute interval data or a monthly energy feed to analyze energy use trends in downtown buildings, and will provide resource conservation advice through a private contractor. Urban Smart has a goal of reaching 23 million square feet of building floor area.
Building automation systems, fault detection diagnosis, and automated system optimization, which use 15-minute or less interval data from elements of a large building system to investigate energy use trends, notify building managers about faults (i.e., operational issues leading to energy waste), and optimize the settings of certain building systems (e.g., heating, cooling, and ventilation).
These systems are significantly more costly than basic benchmarking that a building manager would conduct using Portfolio Manager. The cities of Bellevue and Redmond have also used analysis of building energy use information to motivate internal operational action:
Bellevue’s Resource Conservation Manager program reduces energy, water use, and solid waste generation in city operations, cutting energy costs by $905,000 cumulatively from April 2009 to April 2014.21 Bellevue’s RCM has been instrumental in creating Urban Smart | Bellevue.
Redmond staff have reported the city’s annual energy costs to the City Council since 2008, and
found that the city was spending over $2 million annually for operational use of electricity, natural gas, and transportation fuels.22 These annual briefings motivated the Council in 2014 to allocate $820,000 in a biennial budget to fund the city’s energy and climate commitments.
20
Granderson, Jessica. “Energy Management and Information Systems Technology Classification Framework.” Prepared for the US Department of Energy Building Technologies Office. August 2013. Online at: http://eis.lbl.gov/pubs/emis-tech-class-framework.pdf. 21
“Resource Conservation.” City of Bellevue website. Accessed December 21, 2015. Online at: http://www.ci.bellevue.wa.us/9152.htm. 22
Willmott, Elizabeth. “Redmond, WA gets its clean energy house in order.” Climate Solutions blog. May 19, 2015. Online at: http://climatesolutions.org/article/1432078603-redmond-wa-gets-its-clean-energy-house-order.

21
Appendix D – Benefits of Benchmarking Benefits of benchmarking include: goal-setting that leads to action; energy savings, lower operating costs, and greenhouse gas emissions reduction; higher building valuation; and economic development. Goal-Setting and Action Benchmarking can provide valuable data that assists in:
Goal-setting at the building level (e.g., achieve a certain energy use intensity, or a specific ENERGY STAR rating, by a target date), which has a demonstrated impact on energy performance.23
Tracking progress. Prioritization of projects and incentives.24
A California Energy Commission report on benchmarking found that for customers who registered for utility benchmarking workshops and benchmarked with Portfolio Manager, benchmarking resulted in or was associated with:
Subsequent building energy management actions. Energy efficiency improvements in buildings. Utility [incentive] program participation. 25
Positive experiences with benchmarking may also inspire building owners and managers to adopt more in-depth energy management approaches, such as energy information systems, building automation systems, fault detection diagnosis, and automated system optimization. Energy Savings, Lower Operating Costs, and Greenhouse Gas Emissions Reduction Benchmarking leads to energy savings, lower energy costs, and greenhouse gas emissions reduction.
The U.S. Environmental Protection Agency found that “organizations benchmarking consistently in Portfolio Manager have achieved average energy savings of 2.4% per year, and an average increase in ENERGY STAR score of 2 points per year in their buildings. If all buildings in the U.S. followed a similar trend, over 18 million metric tons of carbon dioxide equivalents could be saved each year. Through 2020, the total savings could be approximately 25%.”26
A Resources for the Future study found that utility (e.g., electricity and natural gas) expenditures in office buildings decreased approximately 3% per square foot after implementation of benchmarking laws in Austin, New York, San Francisco, and Seattle. 27
Table 3 below describes the findings of recent studies of specific city benchmarking laws and programs.
23
“Manage Energy by Setting Goals.” Johnson Controls. 2013. Online at: http://tinyurl.com/z6dmmd7. 24
Granderson, et al. December 2013. 25
NMR Group, Inc. and Optimal Energy, Inc. “Statewide Benchmarking Process Evaluation Volume 1 Report.” Submitted to California Public Utilities Commission. April 2012. Online: http://tinyurl.com/hcey4lx. 26
“Benchmarking and Energy Savings.” U.S. Environmental Protection Agency. October 2012. Online: http://www.energystar.gov/ia/business/downloads/datatrends/DataTrends_Savings_20121002.pdf?3d9b-91a5. 27
Palmer, Karen and Margaret Walls. “Does Information Provision Shrink the Energy Efficiency Gap? A Cross-City Comparison of Commercial Building Benchmarking and Disclosure Laws.” Resources for the Future. April 9, 2015. Online: http://tinyurl.com/jt3hbyl.

22
Table 3: Outcomes of Benchmarking Laws in Four U.S. Cities
City Floor Area Covered (# Buildings)
Outcomes
New York City28
2.8 billion sf (23,417) 5.7% energy use reduction (2010-201329) Over $267 million savings 9.9% carbon emissions reduction (in covered
buildings) Over 7,000 jobs created
Washington, DC
357 million sf (2,000) 9% energy use reduction over 3 years
San Francisco, CA
203 million sf (2,312) 7.9% energy use reduction over 4 years
Seattle, WA 281 million sf (3,250) 0.6% energy use reduction from 2012 to 2013
Real Estate Value and Economic Development In addition to increasing consumer awareness, benchmarking may also lead to higher valuation of energy efficient buildings, by inspiring building owners to invest in energy efficiency upgrades that make buildings more appealing for prospective buyers and/or tenants. For example:
In a meta-analysis of national studies, the Institute for Market Transformation and the Appraisal Institute found that LEED and ENERGY STAR ratings consistently lead to premiums on rents, sales prices, and occupancy.30
CoStar found that LEED-certified buildings “command rent premiums of $11.33 per square foot over their non-LEED peers and have 4.1 percent higher occupancy,” and that ENERGY STAR buildings “represent a $2.40 per square foot premium over comparable non-ENERGY STAR buildings and have 3.6 percent higher occupancy.”31 Subsequent studies have also found that LEED and ENERGY STAR buildings have higher rents and sale prices.32
Real estate services firm DTZ found that ENERGY STAR-certified buildings have tenant satisfaction scores that are 30 points higher than those without.33
28
Navigant Consulting, Steven Winter Associates, and Newport Partners. “New York City Benchmarking and Transparency Policy Impact Evaluation Report.” Prepared for U.S. Department of Energy. May 2015. Online: http://tinyurl.com/zwznd5o. 29
Ibid. All New York City outcomes are for the period from 2010 to 2013. The authors also noted that during this time period the city gross domestic product increased by 4.2% and electricity cost fell by 8.4%. 30
“Green Building and Property Value: A Primer for Building Owners and Developers.” Institute for Market Transformation and Appraisal Institute. 2013. Online: http://tinyurl.com/jgky4sd. 31
Burr, Andrew. “CoStar Study Finds Energy Star, LEED Buildings Outperform Peers.” CoStar. March 26, 2008. Online: http://tinyurl.com/z7u7uy8. 32
Eichholtz, Piet, Nils Kok, and John M. Quigley. 2010. Doing Well by Doing Good? Green Office Buildings. American Economic Review. 100(5): 2492-2509. Also see: Eichholtz, et al. 2013. The Economics of Green Building. Review of Economics and Statistics 95(1): 50-63. 33
McNulty, Laura. “Do Green Upgrades Lead to Happier Residents?” Multifamily Executive. March 26, 2015. Online: http://tinyurl.com/hkou84u.

23
Benchmarking will likely have different and possibly greater impacts on building valuation, in that a certification only provides an indicator of whether a building had specific green characteristics and whether it met a threshold for energy use. As Resources for the Future wrote, “Benchmarking and disclosure ordinances. . . go further than certification in two ways: first, by providing energy use information and ratings for all buildings covered by the law, not just buildings that are voluntarily certified; and second, by providing actual energy use and not just an indicator of being above or below a threshold.”34 The U.S. Department of Energy evaluation of New York City’s benchmarking law concluded that “awareness of building energy performance [in New York City] is growing, and building energy use information is playing an increasingly important role in real estate decisions.”35 As described in Table 1 above, the same report also found that New York City’s benchmarking law led to the creation of over 7,000 jobs from 2010 to 2013. The Bellevue Energy Efficiency Market Transformation Strategy, developed by the City of Bellevue in collaboration with the Massachusetts Institute of Technology, contains a valuable list of assessments of the economic impacts of energy efficiency and energy management, as well as studies that show the positive impact of energy efficiency on employee health and productivity. All of the studies “suggest that energy savings policies will realize net positive economic outcomes,” with a range of 1-2% net increase in employment as a result of energy efficiency investments.36 The Bellevue strategy also noted that the Seattle-Bellevue-Tacoma area already has a geographic cluster of local energy efficiency firms that could grow into a larger market, with conducive policy signals.
34
Palmer and Walls. April 2015. 35
Navigant Consulting. May 2015. 36
McEwen, Brendan, et al. “Bellevue Energy Efficiency Market Transformation Strategy.” Massachusetts Institute of Technology Community Innovators Lab Green Economic Development Initiative. Report for the City of Bellevue. October 2013. Online: http://web.mit.edu/colab/gedi/pdf/eemts/MIT-CoLab-Bellevue.pdf.

24
Appendix E – Sample ENERGY STAR Statement of Energy Performance37
37
“Sample ENERGY STAR performance documents.” U.S. Environmental Protection Agency and U.S. Department of Energy. Accessed December 2015. Online at: http://www.energystar.gov/buildings/facility-owners-and-managers/existing-buildings/use-portfolio-manager/verify-and-document/sample.

25
Appendix F – Sample City of Seattle Benchmarking Scorecard

26

27
Appendix G – Summary of Findings from City of Seattle Focus Group Research Below are the high-level findings of the City of Seattle’s April 2015 focus group report on what motivates building owners and managers to improve energy efficiency38:
1. Personalize building energy profiles as much as possible, including building information, rebate information, and a call to action
2. Share examples of similar buildings that have saved energy and money 3. Connect owners and managers with peers who have already conducted upgrades 4. Promote financial incentives 5. Train managers on how to use ENERGY STAR Portfolio Manager data to advise building owners
on key energy decisions 6. Expand opportunities for building managers and owners to have personal contact with city staff,
especially to navigate benchmarking and rebate/incentive processes 7. Help managers plan for equipment replacement
Appendix H – Reports and Other Resources on Building Energy Benchmarking
REPORTS
Title Author Publication Date Summary
The Benefits of Benchmarking Building Performance39
Institute for Market Transformation
December 2015 Overview of energy benchmarking and related benefits
Denver City Energy Project40
City and County of Denver
Accessed December 2015
Website with information about Denver City Energy Project
Boston Energy Reporting and Disclosure Ordinance website41
City of Boston / Greenovate Boston
Accessed November 2015
Website with background, analysis, and map showing metrics for all reporting buildings
San Francisco Existing Commercial Buildings Performance Report42
SF Environment and Urban Land Institute Greenprint Center for Building Performance
October 2015 Analysis of San Francisco’s ordinance indicated a 7.9% reduction in energy use from 2010 to 2014
Seattle Building Energy Seattle Office of September 2015 Analysis of commercial
38
Slobe, Debbie. “What Inspires Action? Understanding Motivations for Improving Building Energy Efficiency.” Resource Media for the City of Seattle. April 2015. Available on request. 39
Hart, Zachary. “The Benefits of Benchmarking Building Performance.” Institute for Market Transformation. December 2015. Online at: http://www.imt.org/uploads/resources/files/PCC_Benefits_of_Benchmarking.pdf. 40
“Denver City Energy Project: Unlocking the Value of Building Efficiency.” City of Denver. Accessed December 2015. Online at: https://www.denvergov.org/content/denvergov/en/environmental-health/environmental-quality/denver-city-energy-project.html. 41
“Greenovate Boston.” City of Boston. Accessed December 2015. Online at: http://berdo.greenovateboston.org/. 42
“San Francisco Existing Commercial Building Performance Report: 2010-2014.” City of San Francisco. Accessed December 2015. Online at: http://uli.org/wp-content/uploads/ULI-Documents/SFenergybenchmarkingreport.pdf.
28
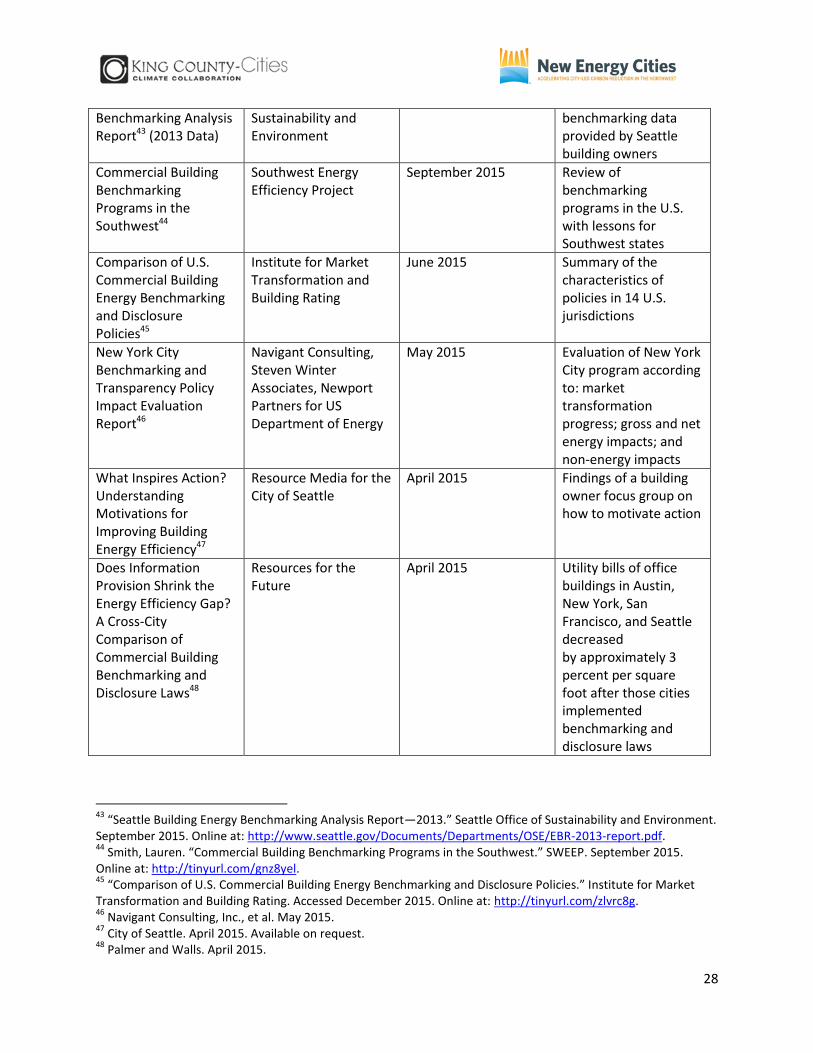
Benchmarking Analysis Report43 (2013 Data)
Sustainability and Environment
benchmarking data provided by Seattle building owners
Commercial Building Benchmarking Programs in the Southwest44
Southwest Energy Efficiency Project
September 2015 Review of benchmarking programs in the U.S. with lessons for Southwest states
Comparison of U.S. Commercial Building Energy Benchmarking and Disclosure Policies45
Institute for Market Transformation and Building Rating
June 2015 Summary of the characteristics of policies in 14 U.S. jurisdictions
New York City Benchmarking and Transparency Policy Impact Evaluation Report46
Navigant Consulting, Steven Winter Associates, Newport Partners for US Department of Energy
May 2015 Evaluation of New York City program according to: market transformation progress; gross and net energy impacts; and non-energy impacts
What Inspires Action? Understanding Motivations for Improving Building Energy Efficiency47
Resource Media for the City of Seattle
April 2015 Findings of a building owner focus group on how to motivate action
Does Information Provision Shrink the Energy Efficiency Gap? A Cross-City Comparison of Commercial Building Benchmarking and Disclosure Laws48
Resources for the Future
April 2015 Utility bills of office buildings in Austin, New York, San Francisco, and Seattle decreased by approximately 3 percent per square foot after those cities implemented benchmarking and disclosure laws
43
“Seattle Building Energy Benchmarking Analysis Report—2013.” Seattle Office of Sustainability and Environment. September 2015. Online at: http://www.seattle.gov/Documents/Departments/OSE/EBR-2013-report.pdf. 44
Smith, Lauren. “Commercial Building Benchmarking Programs in the Southwest.” SWEEP. September 2015. Online at: http://tinyurl.com/gnz8yel. 45
“Comparison of U.S. Commercial Building Energy Benchmarking and Disclosure Policies.” Institute for Market Transformation and Building Rating. Accessed December 2015. Online at: http://tinyurl.com/zlvrc8g. 46
Navigant Consulting, Inc., et al. May 2015. 47
City of Seattle. April 2015. Available on request. 48
Palmer and Walls. April 2015.

29
Washington, DC Private Building Benchmarking Disclosure49
District of Columbia January 2015 Savings of 9% over three years in buildings required to benchmark
Benchmarking and Transparency Policy and Program Impact Evaluation Handbook50
Navigant Consulting and Steven Winter Associates
2015 Methodology to determine the benefits of benchmarking and transparency policies and programs, with a guide for how to assess the impacts of policies
Bellevue Energy Efficiency Market Transformation Study51
Massachusetts Institute of Technology CoLab / City of Bellevue
October 2013 Analysis of market conditions for different energy management approaches in Bellevue
2013 Energy Efficiency Indicator Survey52
Institute for Building Efficiency
June 2013 Seventh annual survey of global building decision-makers indicates a correlation between energy goal-setting and key efficiency behaviors and investments
Manage Energy by Setting Goals53
Johnson Controls 2013 Goal-setting is critical to energy management success
2012 Energy Benchmarking Report54
City of Minneapolis 2013 Analysis of 2013 Minneapolis building benchmarking data
Building Energy Rating and Disclosure Policies: Update and Lessons from the Field55
Northeast Energy Efficiency Partnerships
2013 Assessment of policy options and roadmap for implementing building energy rating and disclosure policies
49
“Private Building Benchmarking Disclosure 2013.” DC Department of Energy and Environment. January 28, 2015. Online at: http://doee.dc.gov/node/970312. 50
Navigant Consulting, Inc., et al. “Benchmarking and Transparency Policy and Program Impact Evaluation Handbook.” Prepared for the U.S. Department of Energy. May 2015. Online at: http://energy.gov/eere/slsc/downloads/benchmarking-and-transparency-policy-and-program-impact-evaluation-handbook. 51
McEwen, et al. October 2013. 52
“2013 Energy Efficiency Indicator Survey.” International Facility Management Association, Urban Land Institute, and Johnson Controls. June 2013. Online at: http://tinyurl.com/z4wcyt5. 53
“Manage Energy by Setting Goals.” Johnson Controls. 2013. 54
“Energy Benchmarking Results for Public and Large Commercial Buildings.” City of Minneapolis. Accessed December 2015. Online at: http://www.ci.minneapolis.mn.us/environment/energy/WCMS1P-116916. 55
“Building Energy Rating and Disclosure Policies Update and Lessons from the Field.” Northeast Energy Efficiency Partnerships. February 2013. Online at: http://www.neep.org/building-energy-rating-and-disclosure-policies.

30
Benchmarking and Disclosure: State and Local Policy Design Guide & Sample Policy Language56
SEE Action 2012 Guide for policymakers on design of commercial benchmarking and disclosure policy, with sample language
Lessons Learned from the Implementation of Rating and Disclosure Policies in U.S. Cities57
Institute for Market Transformation
2012 Early evaluation of policies
ENERGY STAR Portfolio Manager and Energy Savings Handout58
EPA 2012 Analysis of buildings that benchmarked using ENERGY STAR Portfolio Manager indicated an average annual savings of 2.4%
Introduction to Benchmarking or Tracking Energy Consumption in Commercial and Public Buildings59
Midwest Energy Efficiency Alliance
Unknown Briefing document that outlines the process and overall benefits of benchmarking existing building energy consumption
RESOURCES
Better Buildings Accelerator60
U.S. Department of Energy
Accessed November 2015
Innovative policies and approaches in energy efficiency
Building Performance Database61
U.S. Department of Energy
Accessed November 2015
U.S.’s largest dataset of commercial and residential building energy characteristics
56 Burr, A., Institute for Market Transformation. “Benchmarking and Disclosure: State and Local Policy
Design Guide and Sample Policy Language” Prepared for State and Local Energy Efficiency Action Network. 2012. Online at: https://www4.eere.energy.gov/seeaction/publication/benchmarking-and-disclosure-state-and-local-policy-design-guide-and-sample-policy. 57
Keicher, Caroline, et al. “Lessons Learned from Implementation of Rating and Disclosure Policies in U.S. Cities.” Institute for Market Transformation. 2012. Online at: http://www.imt.org/resources/detail/lessons-learned-from-the-implementation-of-rating-and-disclosure-policies-i. 58
“ENERGY STAR Portfolio Manager and Energy Savings.” U.S. Environmental Protection Agency. October 2012. Online at: http://tinyurl.com/zvmjbam. 59
“Introduction to Benchmarking or Tracking Energy Consumption in Commercial and Public Buildings.” Midwest Energy Efficiency Alliance. Accessed December 2015. Online at: http://www.mwalliance.org/sites/default/files/uploads/MEEA%20Benchmarking%20FactSheet%20for%20Comm%20and%20Public%20Buildings%202013.pdf. 60
“Better Buildings Accelerators.” U.S. Department of Energy. Accessed December 2015. Online at: http://www1.eere.energy.gov/buildings/betterbuildings/accelerators/. 61
“Building Performance Database.” U.S. Department of Energy. Accessed December 2015. Online at: http://energy.gov/eere/buildings/building-performance-database.

31
ENERGY STAR Portfolio Manager Quick Start Guide62
U.S. Environmental Protection Agency
Accessed November 2015
Two-page guide to start using Portfolio Manager to benchmark properties
Institute for Market Transformation Building Energy Performance Policy Website63
Institute for Market Transformation
Accessed November 2015
Overview and examples of state and local building energy benchmarking policies
BuildingRating64 BuildingRating Accessed November 2015
International exchange for information on building rating policies and programs
State and Local Energy Efficiency Action65
U.S. Department of Energy and U.S. Environmental Protection Agency
Accessed November 2015
State- and local-led effort to take energy efficiency to scale and achieve all cost-effective energy efficiency by 2020
City of Seattle Energy Benchmarking and Reporting How To Guide66
City of Seattle November 2014 Step-by-step instructions to use Portfolio Manager to comply with the City of Seattle’s benchmarking and reporting requirements
62
“Portfolio Manager Quick Start Guide.” U.S. Environmental Protection Agency and U.S. Department of Energy. September 2015. Online at: http://www.energystar.gov/buildings/tools-and-resources/portfolio-manager-quick-start-guide. 63
“Building Energy Performance Policy.” Institute for Market Transformation website. Accessed December 2015. Online at: http://www.imt.org/policy/building-energy-performance-policy 64
“Building Rating.” Building Rating website. Accessed December 2015. Online at: http://buildingrating.org/ 65
“State and Local Energy Efficiency Action Network.” U.S. Department of Energy and U.S. Environmental Protection Agency. Accessed December 2015. Online at: https://www4.eere.energy.gov/seeaction/ 66
“Seattle Energy Benchmarking and Reporting How To Guide.” Seattle Office of Sustainability and Environment. November 20, 2014. Online at: http://www.seattle.gov/Documents/Departments/OSE/EBR-how-to-guide.pdf