k3/K4 DESIGN BASIS - vegvesen.no 04 18.05.2016 General update SAH et al ... massive investments and...
57
REPORT BJØRNAFJORDEN SUBMERGED FLOATING TUBE BRIDGE K3/K4 DESIGN BASIS
Transcript of k3/K4 DESIGN BASIS - vegvesen.no 04 18.05.2016 General update SAH et al ... massive investments and...
REPORT
BJØRNAFJORDEN SUBMERGED FLOATING TUBE BRIDGE K3/K4 DESIGN BASIS

K3/K4 DESIGN BASIS / 12149-OO-R-002, rev. 04
Revision Date Reason for Issue Prep. by Contr. by Appr. by
04 18.05.2016 General update SAH et al. TS SAH
03 28.04.2015 IFA SF et al. AN THS
02 01.02.2015 IFC SF et al. AN THS
01 05.11.2014 1st draft SAH TS SAH
REPORT
Project name:
BJØRNAFJORDEN SUBMERGED FLOATING TUBE BRIDGE Document name:
K3/K4 DESIGN BASIS Project number : 12149-01 Document number : 12149-OO-R-002 Date : 18.05.2016 Revision : 04 Number of pages : 57 Prepared by : Arne Nestegård, Stein Atle Haugerud, Jon Solemsli, Knut Beck
Engebretsen, Kasper Wåsjø, Anders Myhr Controlled by : Tore Søreide Approved by : Stein Atle Haugerud

K3/K4 DESIGN BASIS / 12149-OO-R-002, rev. 04
Table of Content 1 INTRODUCTION .............................................................. 5
1.1 Project description ....................................................................................... 5 1.2 Objective and scope ..................................................................................... 5 1.3 Terms and definitions ................................................................................... 6
2 REGULATIONS AND CODES .............................................. 7
2.1 Regulations ................................................................................................. 7 2.2 Codes ......................................................................................................... 7
3 SITE CONDITIONS ........................................................ 10
3.1 The crossing site ........................................................................................ 10 3.2 Water density and salinity ............................................................................ 11 3.3 Wave conditions ......................................................................................... 11 3.4 Tidal variation ............................................................................................ 16 3.5 Sea level increase ....................................................................................... 17 3.6 Wind ......................................................................................................... 19 3.7 Temperature .............................................................................................. 23 3.8 Snow and icing ........................................................................................... 23 3.9 Marine growth ............................................................................................ 24 3.10 Earthquake ................................................................................................ 24 3.11 Ship traffic ................................................................................................. 25 3.12 Geotechnical .............................................................................................. 26 3.13 Engineering geology .................................................................................... 30
4 FUNCTIONAL REQUIREMENTS ......................................... 32
4.1 Design life ................................................................................................. 32 4.2 Reliability class ........................................................................................... 32 4.3 Structural requirements ............................................................................... 32 4.4 Floating stability ......................................................................................... 33 4.5 Traffic requirements .................................................................................... 33 4.6 Navigational channel ................................................................................... 35 4.7 Equipment ................................................................................................. 35 4.8 Inspection ................................................................................................. 35 4.9 Instrumentation ......................................................................................... 35
5 DESIGN LOAD COMBINATIONS ....................................... 36
5.1 Limit state design ....................................................................................... 36 5.2 Loads ........................................................................................................ 37

K3/K4 DESIGN BASIS / 12149-OO-R-002, rev. 04
5.3 Load Combinations ..................................................................................... 38 5.4 Load factors ............................................................................................... 39
6 MATERIALS .................................................................. 45
6.1 Concrete .................................................................................................... 45 6.2 Steel ......................................................................................................... 48 6.3 Corrosion protection .................................................................................... 49
7 RISK ANALYSIS ............................................................ 51
7.1 Design assumptions operation phase ............................................................. 51 7.2 Design assumptions in temporary phases ...................................................... 53
8 REFERENCES ................................................................ 55
8.1 Regulations and codes ................................................................................. 55 8.2 Project specific documents ........................................................................... 56 8.3 Other sources............................................................................................. 57

K3/K4 DESIGN BASIS / 12149-OO-R-002, rev. 04
5 1 INTRODUCTION 1.1 Project description The Norwegian Public Roads Administration (NPRA) has been commissioned by the Norwegian Ministry of Transport and Communications to develop plans for a ferry free coastal highway (E39) between Kristiansand and Trondheim. The 1 100 km long coastal corridor comprise today 8 ferry connections, most of them are wide and deep fjord crossings that will require massive investments and longer spanning structures than previously installed in Norway. For these fjords the Submerged Floating Tube Bridge (SFTB) is regarded as an attractive crossing solution. One of the crossings for which a fixed link is to be assessed is the 5 km wide Bjørnafjord between Reksteren and Os as part of development plan for the E39 Aksdal – Bergen section. NPRA pursues the development of a permeant link over the Bjørnafjord through parallel studies comprising both floating- and submerged floating bridge concepts. The assessment study for the SFTB is carried out by the design group REINERTSEN – Olav Olsen – Norconsult et al. The objective of the SFTB assessment study is to consider both pontoon- and tether stabilized SFTB solutions for the western of the two different crossing trajectories as identified by NPRA (Figure 1.1-1).
> Figure 1.1-1: Relevant route for crossing the Bjørnafjord between Reksteren and Os
1.2 Objective and scope The objective of this document is to provide the basis of design for the development and assessment of SFTB concepts for the planned crossing trajectory across the Bjørnafjord. The primary scope is to establish design criteria, requirements and premises for the structural and geotechnical design of the SFTB. The basis of the design applies to both the in-place condition as well as the execution stage including marine operations.

K3/K4 DESIGN BASIS / 12149-OO-R-002, rev. 04
6 1.3 Terms and definitions
1.3.1 Terminology
Atmospheric zone: The external surfaces of the unit above the splash zone Compartment: Enclosed volume bounded by watertight structural elements consisting of a single cell or an array of communicative cells Cell: Unit volume in a compartment bounded by structural elements. Return period: Average interval of time in years between exceedances of an event magnitude Splash zone: The external surfaces that are periodically in and out of the water. The area from 3 meters below Mid Spring Low Water (MSLW) and 3 meter above Mid Spring High Water (MSHW)
1.3.2 Abbreviations
MSL Mean Sea water Level SFTB Submerged Floating Tube Bridge NPRA Norwegian Public Roads Administration TLP Tension Leg Platform

K3/K4 DESIGN BASIS / 12149-OO-R-002, rev. 04
7 2 REGULATIONS AND CODES 2.1 Regulations The Public Road Act regulates rules and regulations used for the foundation of public roads in Norway. The Public Roads Act § 13 state that the ministry provides guidelines for construction of public roads (road standards). The regulation on construction of public roads is guidance to the law. The regulation also gives requirements to the road standards (Figure 2.1-1).
> Figure 2.1-1: Rules and regulation hierarchy The Road norms is a general term for standards in the Norwegian Public Roads Administration’s (NPRA) Handbook series that contains requirements for road construction, road design, tunnels, rails, bridges and ferry docks, signs and markings. The Road standards are documents containing requirements which are authorized by Veglovens § 13 for construction of all public roads (applies to handbook N100, N101, N200, N400, N500, R412, R510, V430). Guidelines, standards and publications contain no requirements for road design, but are means to satisfy the requirements given in the norms. Relevant standards used in the oil and gas industry will be considered where these complement Handbook N400 (former Handbook 185).
2.2 Codes For the assessment study for the Submerged Floating Tube Bridge (SFTB), NPRA’s Handbook N400 will be applicable as a road standard. This manual provides reference to other relevant standards combined with a document hierarchy with priority order A - I. Within each group, the order of priority is: 1. Regulations, 2. Standards and 3. Guidelines.
Public Road Act
Injunction on building and public roadsInjunction on minimum safety requirements for certain tunnels (tunnelsikkerhetsforskriften)Injunction on safety management of road infrastructure(vegsikkerhetsforskriften)
Road norms (Requirements)
Guidelines, standards, publications

K3/K4 DESIGN BASIS / 12149-OO-R-002, rev. 04
8 The documents relevant for the current study are listed in order of priority:
A Handbooks - Norms - Handbook N400 sec. 13.12 “Flytebruer og rørbruer” B Guideline Handbooks
C Other NPRA books / internal reports D Norwegian engineering standards (NS and Eurocode) E Norwegian materials and workmanship standards F Standards for drawings and project documents G Regulations, policies, standards or publications not covered above H Other Standards I Publications from industry associations
Where relevant information is missing in NPRA’s handbooks and Norwegian engineering standards, the project group will suggest using supplemental standards. These will be in the category G (Table 2.2-1). The safety level of the Eurocode system shall be obtained even if other standards are used. As per Handbook N400 structural analysis and design is to be in compliance with the Eurocodes. NS-EN 1992-1-1 for concrete design does not cover specific aspects of marine structures, and a clarification has been made with Standard Norge that the concrete design still may follow Eurocode. The background is that a revision of EN 1992-1-1 is under development including marine structures.
> Table 2.2-1: Relevant standards
Priority Most relevant standards Description
A Håndbok N400, kap. 13.11 Floating and tube bridges
A Håndbok N100 Road and Street Design
B Håndbok V420 Guidance, design of bridges
C Rapport: Krav til plass og rom i rørbru, SVV, 2011
Overview of the requirements and challenges in the current legislation with respect to space and room in tube bridges.
D NS-EN 1990 Basis of structural design
D NS-EN 1991 - Eurocode 1 Actions on structures
D NS-EN 1992 - Eurocode 2 Design of concrete structures
D NS3473 Design of concrete structures
D NS-EN 1993 - Eurocode 3 Design of steel structures
G DNV-RP-C205 Environmental Conditions and Environmental Loads
G DNV-RP-F105 Free Spanning Pipelines

K3/K4 DESIGN BASIS / 12149-OO-R-002, rev. 04
9 G ISO-21650 Actions from waves and current on coastal structures
G NORSOK N-003 Actions and action effects
G Estimat på bølge og strøm, Mulighetsstudie for kryssing av Sognefjorden Oppedal – Lavik, Sintef
Site-dependent wave and current for design purpose
G DNV-OS-H101 Marine Operations, General
G DNV-RP-H103 Modeling and Analysis of Marine Operations

K3/K4 DESIGN BASIS / 12149-OO-R-002, rev. 04
10 3 SITE CONDITIONS 3.1 The crossing site Two main crossing trajectories have been pointed out as relevant for the SFTB study [28] (Figure 3.1-1). Western corridor The western corridor is given by the trajectory between Reksteren (near Svarvehelleholmen) in the south and Røtinga in the north, with a total crossing length of 5.1 km. The exact location of the land interfaces is to be developed considering both an optimal SFTB configuration, tunnel interface and minimum environmental impact. Eastern corridor The crossing trajectory between Vernøya in the south and Bjørnatrynet in the north has a longer crossing length (5.6 km) than the western corridor. Since the eastern corridor implies a longer span and no other apparent benefits compared to the western corridor are identified, the western corridor has been chosen in this study.
3.1.1 Sea bed condition
An acoustic survey has been conducted at the shore ends to determine sediment thickness and bedrock horizon [32]. Generally, at both shores there are little sediments with soft deposits only in some small patches. In the fjord, outside the slopes, the seabed is generally assumed to consist of soft deposits. Four Ø100 mm core samples has been collected from the middle of the strait, all indicating soft clay with high water content with un-drained shear strength su ranging from 4 – 8 kPa. For laboratory results refer [33].
> Figure 3.1-1: Topography and bathymetry at the crossing site Reksteren – Os (source:
Norgeskart) including three alternative crossing trajectories (red, blue, green)

K3/K4 DESIGN BASIS / 12149-OO-R-002, rev. 04
11 3.2 Water density and salinity Recent measurements of salinity (S) in Bjørnafjorden [36] for the period January – March 2015 show a variation of S in the range 28-33.6 ‰ for z = -2 m and in the narrower range 33 – 34.6 ‰ for z = -50 m. We will assume that due to extreme rain and/or snow melting the salinity in the surface layer may go down to 25 ‰. The seawater density depends on sea water temperature T (oC) and salinity S (‰) according to the formula; 𝜌𝜌𝑤𝑤 = 1027− 0.16(𝑇𝑇 − 10) + 0.75(𝑆𝑆 − 35) Combining the range 25 ‰ < S < 35 ‰ with a temperature variation within the range 5 < T < 20 oC, the sea water density will be within the range 1018 < ρw < 1028 kg/m3 with a mean value ρw=1023 kg/m3. The corresponding range of specific weight is 9.987 < gρw < 10.085 kN/m3 with a mean value gρw =10.035 kN/m3. The most unfavourable value shall be used for the action effect considered.
> Table 3.2-1: Sea water mass density and specific weight
Minimum Mean Maximum
Mass density (kg/m3) 1018 1023 1028
Specific weight (kN/m3) 9.987 10.035 10.085
It should be noted that according to HB N400 [1] the seawater weight density should be taken as Ww = 9.955 kN/m3 ± 1%, i.e. the seawater weight density shall be within the range 9.855 – 10.055 kN/m3. The corresponding sea water mass density is 𝜌𝜌𝑤𝑤 = 𝑊𝑊𝑤𝑤/𝑔𝑔 = 1015 kg/m3 ± 1 %, i.e. the seawater mass density shall be within the range 1005 – 1025 kg/m3. The range specified by HB N400 [1] is determined by the density of fresh water 1005 kg/m3 as the lower value and the average density of seawater 1025 kg/m3 as the higher value.
3.3 Wave conditions Since no in situ wave measurements are available, the design values for significant wave height Hs and spectral peak period Tp are based on measured offshore wave and wind data. Swell sea states in the fjord are determined by transferring offshore wave conditions to the bridge location by applying a numerical wave model [29] & [42]. Design wave conditions are taken from [42]. Sea states for local wind generated waves in the fjord are determined numerically by assuming offshore wind conditions in the fjord and estimating average fetch length in the wind direction. Wave conditions have been modelled at ten points along two alternative crossing corridors, Figure 3.3-1.

K3/K4 DESIGN BASIS / 12149-OO-R-002, rev. 04
12
> Figure 3.3-1: Ten points (A1-A5, B1-B5) along the two alternative crossings where
modelled wave and current conditions have been extracted [29].
3.3.1 Sea states
The environmental data supporting the sea state conditions are based on the data received from SVV 08.05.2015. When calculating dynamic response of the tube bridge in a sea state, the sea state characteristics (Hs, Tp, direction) should be considered constant along the bridge (Error! Reference source not found.). Highest value for Hs is chosen. The relevant wave spectrum to be used for calculation of wave forces is the Jonswap spectrum (DNV-RP-C205), determined by three parameters, significant wave height Hs, peak period Tp (or peak frequency fp = 1/Tp) and peak shape parameter γ ;
−−−
−
−⋅⋅⋅−⋅=
2
5.0exp4
542
45exp)ln287.01(
165)( p
p
ppSHS
ωσ
ωω
γωωωωγω ( 1 )
where
>≤
=p
p
ffff
for09.0for07.0
σ
For developing wind induced waves the peak enhancement factor is in the range 1 < γ < 5. In lack of data for the spectral peak period the recommended peak enhancement factor in DNV-RP-C205 can be used,

K3/K4 DESIGN BASIS / 12149-OO-R-002, rev. 04
13 𝛾𝛾 = 𝑒𝑒𝑒𝑒𝑒𝑒 �5.75 − 1.15𝑇𝑇𝑝𝑝�𝐻𝐻𝑠𝑠
� for 3.6 <𝑇𝑇𝑝𝑝�𝐻𝐻𝑠𝑠
< 5
For wind sea a 𝛾𝛾 of 3.2 is used. For swell, a 𝛾𝛾 factor of 5 is used. Wave spreading should be taken according to a directional spectrum (DNV-RP-C205),
)(cos)2/2/1(
)2/1()( pn
nnD θθ
πθ −
+Γ
+Γ= ( 2 )
where θp is the wave direction and n should be taken in the range 4 < n < 6. The maximum individual wave event (modelled as a regular Airy or Stokes waves) can be taken as 𝐻𝐻𝑚𝑚𝑚𝑚𝑚𝑚 = 1.9 𝐻𝐻𝑠𝑠 with corresponding wave period 𝑇𝑇𝐻𝐻,𝑚𝑚𝑚𝑚𝑚𝑚 = 0.9 𝑇𝑇𝑝𝑝 . Based on a sensitivity study, the wave directions shall be chosen to give the highest dynamic response of the tube bridge. The following description of the sea states are given: Wind generated waves from west:
A) From NW to SW: Hs = 3.0 m B) From N to NW: Linearly increasing from Hs = 2.0 m (N) to 3.0 m (NW) C) From S to SW: Linearly increasing from Hs = 1.5 m (S) to 3.0 m (SW)
Wind generated waves from east:
D) From N to SE: Hs = 2.0 m E) From S to SE: Linearly increasing from Hs = 1.5 m (S) to 2.0 m (SE)
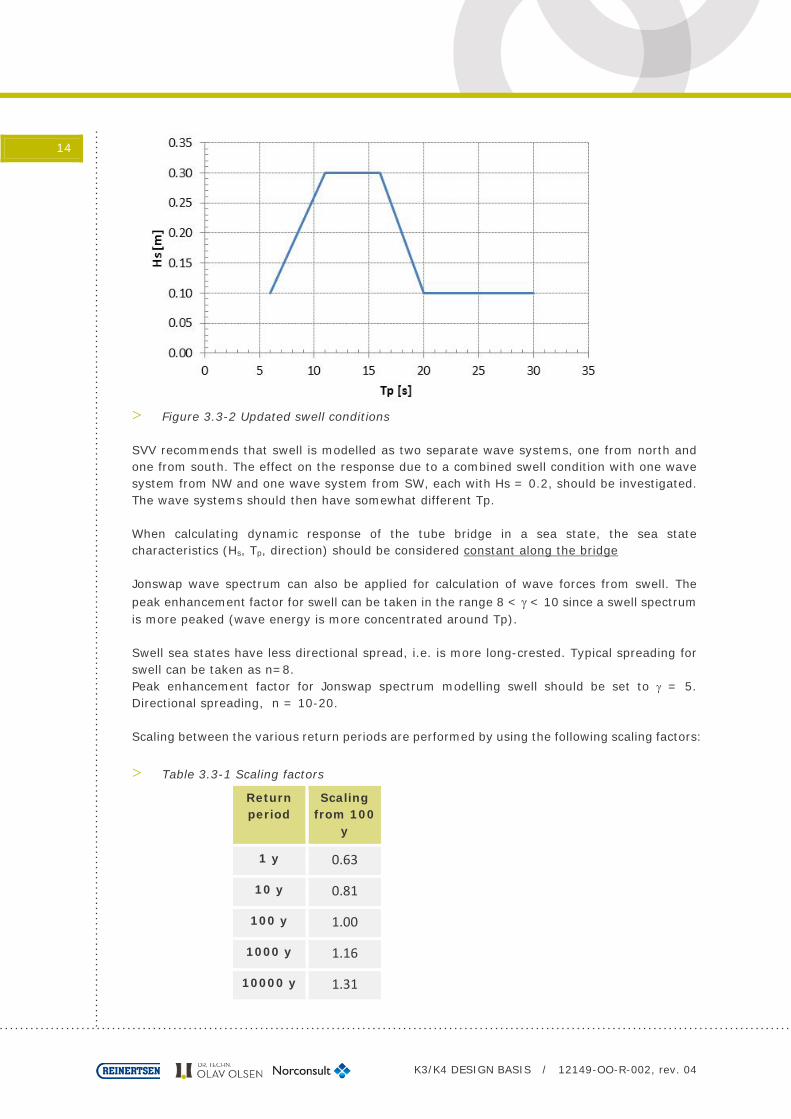
Spectral peak period Tp shall be varied between 4 and 6. Jonswap wave spectrum with peak enhancement factor γ = 2-4. Directional spreading n = 5-10. The corresponding extreme Hs to Tp ratios for swell: Tp = 6-11 s: Hs increases linearly from 0.1 m to 0.3 m Tp = 11-16 s: Hs = 0.3 m Tp = 16-20 s: Hs decreases linearly from 0.3 m to 0.1 m Tp = 20-30 s: Hs = 0.1 m (Hs, Tp) contour for swell is plotted in Figure 3.3-2. Direction of swell is from SW to NW.
A
B
C
D
E
K3/K4 DESIGN BASIS / 12149-OO-R-002, rev. 04
14
> Figure 3.3-2 Updated swell conditions SVV recommends that swell is modelled as two separate wave systems, one from north and one from south. The effect on the response due to a combined swell condition with one wave system from NW and one wave system from SW, each with Hs = 0.2, should be investigated. The wave systems should then have somewhat different Tp. When calculating dynamic response of the tube bridge in a sea state, the sea state characteristics (Hs, Tp, direction) should be considered constant along the bridge Jonswap wave spectrum can also be applied for calculation of wave forces from swell. The peak enhancement factor for swell can be taken in the range 8 < γ < 10 since a swell spectrum is more peaked (wave energy is more concentrated around Tp). Swell sea states have less directional spread, i.e. is more long-crested. Typical spreading for swell can be taken as n=8. Peak enhancement factor for Jonswap spectrum modelling swell should be set to γ = 5. Directional spreading, n = 10-20. Scaling between the various return periods are performed by using the following scaling factors:
> Table 3.3-1 Scaling factors
Return period
Scaling from 100
y
1 y 0.63
10 y 0.81
100 y 1.00
1000 y 1.16
10000 y 1.31

K3/K4 DESIGN BASIS / 12149-OO-R-002, rev. 04
15 3.3.2 Combination of sea states
All three wave effects (wind sea, primary swell and secondary swell) can occur together for waves from westerly sector. For waves from easterly sector, only wind sea shall be considered.
3.3.3 Wave conditions for temporary phase
For temporary conditions 10y summer storm values will be applied. A ratio of 0.7 on the extreme all-year value is assumed to estimate the summer extremes.
> Table 3.3-2: Sea state conditions for unrestricted operations during installation
Sea state Hs (m) Tp (s)
Wind sea 1.86 3-6 s
Swell 1 0.23 12-16 s
0.28 6-8 s
Swell 2 0.11 17-20 s
0.11 8.5 – 10 s
3.3.4 Land slide generated wave
Possible action effects from waves generated by land slide shall be considered.
3.3.5 Wave generated by passing ship
Possible action effects from waves generated by passing ship shall be considered. Hull geometry of largest ship passing the tube bridge shall be chosen for analysis.
3.3.6 Current
Numerical simulations of the current conditions at the site have been conducted [29]. The simulations are updated in ref. [30]. The extreme omni-directional current velocities for return periods 1y, 10y, 50y, 100y and 10000 y are given for various depths. In analysis of tether supported and pontoon supported bridge design current velocities are taken at surface defined as 4 m water depth (for loads on pontoon) and at 30 m depth (for loads on tubes). For SLS and ULS, the 10y and 100y extreme values are needed. For ALS the 10000y condition is relevant. Extracting these from ref. [30],
> Table 3.3-3: Omnidirectional extreme surface current velocity (cm/s) for given return period
St 19 St 21 St 23 St 25
10 year 89 102 113 121
100 year 105 121 133 143
10000 year 135 155 169 180

K3/K4 DESIGN BASIS / 12149-OO-R-002, rev. 04
16 > Table 3.3-4: Omnidirectional extreme current velocity (cm/s) at 30 m depth for given return period.
St 19 St 21 St 23 St 25
10 year 43 46 46 43
100 year 51 54 54 50
10000 year 64 69 69 63
The velocities above are not taken simultaneously, but are extremes at each location. There is a large variation in the extreme surface current between the different locations along the bridge, while the extremes at 30 m water depth are more equal. For VIV analysis one may assume constant current velocity along the submerged tube. This should be taken conservatively as the highest value,
10y : 46 cm/s 100y : 54 cm/s 10000y : 69 cm/s
Ref. [30] gives directional extreme currents at the surface. For St 19 and 21 the strongest currents are from direction 270-300º (WNW) while for St 23 and 25 the strongest currents are from 120º (ESE). It is assumed conservatively that the extreme current is in a direction approximately normal to the bridge. The current force based on the velocities given above is assumed to act in a normal direction relative to the axis of the structural member considered. It shall be assumed that the same current velocities (surface current velocity and current profile) apply both to the current towards west and to the current towards east. Current scenarios shall be selected in accordance with the bridge’s fundamental modes shapes in sway. As a minimum, three theoretical current scenarios shall be considered as prescribed in [1]: 1) Constant current uc acting over the full width of the fjord 2) Constant current uc acting over the mid half of the fjord 3) Shear current, opposite directions for each half width of the fjord. For the shear current
it can be assumed a current velocity ushear=2/3 uc
3.4 Tidal variation The tidal range is specified by HAT (Highest Astronomical Tide) and LAT (Lowest Astronomical Tide). HAT and LAT are the highest and lowest levels which can be predicted to occur under average meteorological conditions. LAT, the height of the water at the lowest possible theoretical tide is also defined as Chart Datum (at zero level). The Mean High Water (MHW) and Mean Low Water (MLW) are the average amplitudes of tidal oscillations which are relevant for assessment of fatigue due to possible buoyancy effects caused by changing water level. Sjøkartverket [38] provides tables for tidal amplitudes for a series of primary harbours along the Norwegian coast. The closest primary harbour is Bergen with the following tidal ranges relative to Chart Datum:

K3/K4 DESIGN BASIS / 12149-OO-R-002, rev. 04
17 HAT = 1.80 m MHW = 1.35 m MLW = 0.45 m Osøyro in Bjørnafjord is a secondary harbour where numerically predicted tidal amplitudes are given by a correction factor relative to nearest primary harbour. The correction factor for Osøyro is 0.81. However, tidal conditions along the bridge are conservatively taken to be the same as for Bergen (Table 3.4-1).
> Table 3.4-1: Tidal amplitudes [m]
Tidal level (m)
Lowest Astronomical Tide (LAT) 0.00
Mean Low Water (MLW) 0.45
Mean Sea Level (MSL) 0.90
Mean High Water (MHW) 1.35
Highest Astronomical Tide (HAT) 1.80
Calculation of the HAT and LAT only allows for gravitational effects due to moon and sun. The highest and lowest water levels are a combination of both asterological and meterologicalcontributions. (e.g. meteorological effects such as high or low atmospheric pressure and the effect of wind). Change of water level due to meteorological effects are called surge (positive or negative). The total combined changes in water level are given in Table 3.4-2.
> Table 3.4-2: Highest and lowest water levels for given return periods for meteorological and astronomical contributions combined.
Return period [years]
Highest water level [m]
Lowest water level [m]
1 2.00 -0.10
10 2.17 -0.22
20 2.20 -0.25
50 2.28 -0.29
100 2.32 -0.32
1000 2.44 -0.40
3.5 Sea level increase The local sea level variation is the difference between the global sea level and the local land heave. For Bergen, the predicted increase in water level based on two scenarios is shown in Figure 3.5-1, ref. [39].

K3/K4 DESIGN BASIS / 12149-OO-R-002, rev. 04
18
> Figure 3.5-1: Predicted water level in Bergen [39] As depicted in Figure 3.5-1, the maximum water level in year 2100 has increased with 35 cm based on the numbers by Intergovernmental Panel on Climate Change (FNs klimapanel), and 75 cm based on Vasskog/Drange, ref. [41].

K3/K4 DESIGN BASIS / 12149-OO-R-002, rev. 04
19 3.6 Wind
3.6.1 General
The format of the design basis is in accordance with NS-EN 1991-1-4:2005 and the national annex NS-EN 1991-1-4:2005/NA:2009. A description of the analysis underlying the design basis can be found in background reports reference [43] and [44]. For the basic wind speed, it is recommended to apply the value of the national annex of Eurocode 1 for the municipalities of Os and Tysnes. To verify that the value of Eurocode 1 is appropriate for the design of the bridge, wind data from Slåtterøy lighthouse for the years 1998 – 2014 has been applied to perform a statistical extreme wind analysis. The results are compared to Eurocode 1 for the municipality of Bømlo, where the lighthouse is located. It is concluded that the value of Eurocode 1 gives a precise description of the local wind characteristics. This applies not only for the basic wind speed, but also for the directional factors.
> Figure 3.6-1: Location of Slåtterøy lighthouse relative to crossing in Bjørnafjord Regarding the turbulent part of the wind, a usable wind description cannot be based on the data at Slåtterøy lighthouse due to the long averaging time and single point measurements. The presented design basis for the turbulence is therefore entirely based on well-established empirical and statistical models found in academic papers and structural design norms. The suggested description of turbulence is closely related to the technical specifications of Eurocode 1. However, to account for the distinct low-frequency behaviour of the structure, a modified power spectrum redefining the turbulent length scale is suggested. Furthermore, to better facilitate correlation at low frequencies, a modified normalized co-spectrum is suggested. For the bridge in use, an annual probability of exceedance of 0.01 corresponding to a return period of 100 years shall be used to determine the wind characteristics. For the bridge during construction, an annual probability of exceedance of 0.095 corresponding to a return period of 10 years shall be used.

K3/K4 DESIGN BASIS / 12149-OO-R-002, rev. 04
20 3.6.2 Site characteristics
In the directions perpendicular to and along the bridge axis, the terrain roughness lengths from Table 3.6-1 shall be used.
> Table 3.6-1: Roughness lengths for the terrain perpendicular to and along the bridge axis.
Direction Roughness length 𝒛𝒛𝟎𝟎 [m]
Perpendicular to the bridge axis 0.003
Along the bridge axis 0.01
For elevations below the minimum height zmin = 1 m, z = zmin should be used in all expressions presented in this section.
3.6.3 Mean wind
The basic wind velocity is defined as the 50-year 10-min. mean wind velocity at elevation 𝑧𝑧 =10 m over flat terrain of roughness length 𝑧𝑧0 = 0.05 m . Recommended directional dependent values of the basic wind velocity 𝑣𝑣𝑏𝑏 are listed in Table 3.6-2.
> Table 3.6-2: Basic wind velocities in m/s.
Direction N NE E SE S SW W NW
𝑣𝑣𝑏𝑏 23.4 15.6 20.8 23.4 26.0 26.0 26.0 26.0
The mean wind velocity 𝑣𝑣𝑚𝑚 at height 𝑧𝑧 above terrain, shall be calculated using the expression
𝑣𝑣𝑚𝑚(𝑧𝑧) = 𝑐𝑐𝑜𝑜(𝑧𝑧) ⋅ 𝑐𝑐𝑝𝑝𝑝𝑝𝑜𝑜𝑏𝑏 ⋅ 0.19 ⋅ �𝑧𝑧0
0.05 m�0.07
ln �𝑧𝑧𝑧𝑧0� 𝑣𝑣𝑏𝑏 ,
where 𝑐𝑐𝑜𝑜(𝑧𝑧) is the orography factor at height 𝑧𝑧 and 𝑐𝑐𝑝𝑝𝑝𝑝𝑜𝑜𝑏𝑏 is the probability factor. The orography factor 𝑐𝑐0(𝑧𝑧) shall be 1.0 for winds perpendicular to the bridge axis. For winds along the bridge axis, the orography factor shall be estimated according to the procedure explained in NS-EN 1991-1-4:2005. Return periods other than 50 years are taken into account by the probability factor 𝑐𝑐𝑝𝑝𝑝𝑝𝑜𝑜𝑏𝑏 defined by
𝑐𝑐𝑝𝑝𝑝𝑝𝑜𝑜𝑏𝑏 = �1 − 𝐾𝐾1 ln(− ln(1 − 𝑒𝑒))1 − 𝐾𝐾1 ln(− ln(0.98)) �
𝑛𝑛
,
where 𝑒𝑒 is the probability for an annual exceedance, and the parameters 𝐾𝐾1 and 𝑛𝑛 determine the shape of the extreme value distribution. The values 𝐾𝐾1 = 0.2 and 𝑛𝑛 = 0.5 shall be used giving the probability factors specified in Table 3.6-3.

K3/K4 DESIGN BASIS / 12149-OO-R-002, rev. 04
21 > Table 3.6-3: Probability factors for return periods of 10, 50 and 100 years
Return period [years]:
10 50 100
Probability 𝑒𝑒 0.095 0.02 0.01
Probability factor 𝑐𝑐𝑝𝑝𝑝𝑝𝑜𝑜𝑏𝑏 0.906 1.00 1.04
3.6.4 Turbulence intensity
The longitudinal turbulence intensity at height 𝑧𝑧 above terrain shall be modelled by the relation
𝐼𝐼𝑢𝑢(𝑧𝑧) = 𝑘𝑘𝐼𝐼
𝑐𝑐0(𝑧𝑧) ln � 𝑧𝑧𝑧𝑧0�
The turbulence factor 𝑘𝑘𝐼𝐼 and the orography factor 𝑐𝑐0(𝑧𝑧) shall both be 1.0 for winds perpendicular to the bridge axis. For winds along to the bridge axis, the two factors shall be estimated according to the procedure explained in NS-EN 1991-1-4:2005. The turbulence intensity for the lateral turbulence component v and for the vertical turbulence componentw , respectively, are determined by 𝐼𝐼𝑣𝑣 = 0.75 𝐼𝐼𝑢𝑢(𝑧𝑧) and 𝐼𝐼𝑤𝑤(𝑧𝑧) = 0.5 𝐼𝐼𝑢𝑢(𝑧𝑧). Using the estimated terrain parameters, see Table 3.6-1, the following longitudinal turbulence intensities have been estimated.
> Table 3.6-4: Turbulence intensities at 10 m elevation, perpendicular to and along the bridge axis.
Wind direction 𝑰𝑰𝒖𝒖 𝑰𝑰𝒗𝒗 𝑰𝑰𝒘𝒘
Perpendicular to the bridge axis 0.12 0.09 0.06
Along the bridge axis1 0.14 0.11 0.07
3.6.5 Peak velocity pressure
The mean velocity pressure 𝑞𝑞𝑚𝑚(𝑧𝑧) at height 𝑧𝑧 above terrain shall be determined from
𝑞𝑞𝑚𝑚(𝑧𝑧) =12 ⋅ 𝜌𝜌 ⋅ 𝑣𝑣𝑚𝑚
2 ,
where 𝜌𝜌 = 1.25 kg/m3 is the density of air. The peak velocity pressure 𝑞𝑞𝑝𝑝(𝑧𝑧) at height 𝑧𝑧 above terrain shall be determined from
𝑞𝑞𝑝𝑝(𝑧𝑧) = [1 + 7𝐼𝐼𝑢𝑢(𝑧𝑧)] ⋅ 𝑞𝑞𝑚𝑚, for the longitudinal turbulence intensity 𝐼𝐼𝑢𝑢.
1 Calculated under the assumption that 𝑘𝑘𝐼𝐼 = 1.0 and 𝑐𝑐0 = 1.0.

K3/K4 DESIGN BASIS / 12149-OO-R-002, rev. 04
22 3.6.6 Integral length scales
The length scale of the turbulence component measured in the longitudinal direction shall be chosen as three times the size of the expression in Eurocode 1, i.e.
𝐿𝐿𝑢𝑢𝑚𝑚(𝑧𝑧) = 3 ⋅ 𝐿𝐿𝑢𝑢,𝐸𝐸𝐸𝐸𝑚𝑚 (𝑧𝑧) = 3 ⋅ 300 m ⋅ �
𝑧𝑧200 m�
0.67+0.05 ln(𝑧𝑧0)
The integral length scale for the longitudinal turbulence component in the horizontal plane perpendicular to the mean wind direction shall be determined by 𝐿𝐿𝑢𝑢
𝑦𝑦(𝑧𝑧) = 0.3𝐿𝐿𝑢𝑢𝑚𝑚 (𝑧𝑧) (Dyrbye & Hansen, 1997). Using the estimated terrain parameters, see Table 3.6-1, the following longitudinal turbulence length scales have been estimated.
> Table 3.6-5: Longitudinal turbulence length scales at 10 m elevation, perpendicular to and along the bridge axis.
Wind direction 𝑳𝑳𝒖𝒖𝒙𝒙(𝒛𝒛) [m] 𝑳𝑳𝒖𝒖𝒚𝒚(𝒛𝒛) [m]
Perpendicular to the bridge axis 288 86
Along the bridge axis 240 72
3.6.7 Correlation
For points in a plane perpendicular to the wind direction, the correlation of simultaneous longitudinal turbulence components shall be described by the cross correlation function
𝜌𝜌𝑢𝑢(𝑟𝑟𝑚𝑚) = exp �−3𝑟𝑟𝑚𝑚𝐿𝐿𝑢𝑢𝑚𝑚�,
where 𝑟𝑟𝑚𝑚 is the distance between the two points, and 𝐿𝐿𝑢𝑢𝑚𝑚 is the integral length scale. Note that the length scale 𝐿𝐿𝑢𝑢𝑚𝑚 shall be determined by the expression presented in section 3.7.6.
3.6.8 Power spectrum
The turbulent velocity fluctuations parallel to the direction of the mean wind velocity, shall be described by the non-dimensional power spectral density function
𝑅𝑅𝑁𝑁(𝑧𝑧,𝑛𝑛) =6.8 𝑓𝑓𝐿𝐿(𝑧𝑧,𝑛𝑛)
�1 + 10.2 𝑓𝑓𝐿𝐿(𝑧𝑧,𝑛𝑛)�5/3,
where 𝑓𝑓𝐿𝐿(𝑧𝑧,𝑛𝑛) = 𝑛𝑛𝐿𝐿𝑢𝑢𝑥𝑥 (𝑧𝑧)
𝑣𝑣𝑚𝑚, 𝑛𝑛 is the frequency and 𝑣𝑣𝑚𝑚 is the mean wind velocity. Note that the length
scale 𝐿𝐿𝑢𝑢𝑚𝑚 shall be determined by the expression presented previously in this document.
3.6.9 Co-spectrum
For points with transverse separation �𝑟𝑟𝑦𝑦, 𝑟𝑟𝑧𝑧�, the spatial frequency domain properties of the wind field shall be described by the following normalized co-spectrum,
𝜓𝜓𝑢𝑢�𝑟𝑟𝑦𝑦, 𝑟𝑟𝑧𝑧,𝑛𝑛� = �1 −12𝑛𝑛𝑚𝑚𝑣𝑣𝑚𝑚
��𝐶𝐶𝑦𝑦𝑟𝑟𝑦𝑦�2 + (𝐶𝐶𝑧𝑧𝑟𝑟𝑧𝑧)2� exp�−
𝑛𝑛𝑚𝑚𝑣𝑣𝑚𝑚
��𝐶𝐶𝑦𝑦𝑟𝑟𝑦𝑦�2 + (𝐶𝐶𝑧𝑧𝑟𝑟𝑧𝑧)2�,

K3/K4 DESIGN BASIS / 12149-OO-R-002, rev. 04
23 where 𝐶𝐶𝑦𝑦 = 𝐶𝐶𝑧𝑧 = 2𝜋𝜋, 𝑣𝑣𝑚𝑚 is the mean value of the wind velocities at the two points and the modified frequency 𝑛𝑛𝑚𝑚 is given by
𝑛𝑛𝑚𝑚 = �𝑛𝑛2 + �𝑣𝑣𝑚𝑚
2π ⋅ 1.34𝐿𝐿𝑢𝑢𝑚𝑚�2
.
Note that the length scale 𝐿𝐿𝑢𝑢𝑚𝑚 shall be determined by the expression presented in section 3.7.6.
3.6.10 Variation along the bridge
The mean wind shall be considered a function of elevation only along the structure. The angular orientation of each pontoon with respect to the wind direction shall be taken into account defining the wind area and corresponding drag factor for each pontoon. The contribution from the fluctuating load shall be calculated for both of the two scenarios presented below:
1. Correlated fluctuating wind loads on the pontoons, with the correlation modelled by the presented correlation function and the modified exponential description of the co-spectrum.
2. Non-correlated (independent) fluctuating wind loads on the pontoons. In practice this means to apply a correlation function and co-spectrum both equals zero.
3.7 Temperature The design air temperatures for the crossing site are according to EN 1991-1-5 [9]. Table 3.7-1 gives the extreme values for sea temperature. > Table 3.7-1: Maximum and minimum sea water temperature
Location Temperature oC
Maximum Minimum
Open sea 20 0
Inside pontoon 10 0
Inside tube 30? 0
Temperature gradients over the thickness of walls shall be assumed to be minimum ±10 oC.
3.8 Snow and icing The characteristic snow load on top of pontoons is 2.5 kN/m2 [7]. NORSOK N-003 [40] gives two design cases for accumulated ice (Table 3.8-1).

K3/K4 DESIGN BASIS / 12149-OO-R-002, rev. 04
24 > Table 3.8-1: Ice actions
Action case 1 Action case 1
Ice caused by sea-spray Ice caused by rain/show
Thickness (mm) Density (kg/m3) Thickness (mm) Density (kg/m3)
80 850 10 900
3.9 Marine growth Marine growth shall be assumed to develop on fully submerged structural elements and structural elements in the splash zone (Table 3.9-1). Detailed numbers for specific weight are given in Handbook N400 [1]. Marine growth shall not be considered in the calculation of buoyancy.
> Table 3.9-1: Marine growth [1]
Depth (m)
Thickness (mm)
Dry mass (kg/m2)
Submerged weight (N/m2)
+0.5 to -12 150 200 468
< -12 75 100 234
Possible increase in hydrodynamic drag and added mass due to marine growth shall be taken into consideration when relevant.
3.10 Earthquake The acceleration (ag40Hz) with return period 475 year is 0.9 m/s2 for the crossing site according to NS-EN-1998-1 [12]. Possible earthquake effects on the foundations and propagating through the tethers shall be assessed.

K3/K4 DESIGN BASIS / 12149-OO-R-002, rev. 04
25 3.11 Ship traffic Accidental events and wave/current generated by ship passage shall be considered.The marine traffic in the Bjørnafjord comprise cargo ships, tankers, passenger vessels, high speed crafts and fishing boats. Annually the crossing site is passed by some 1 700 vessels, while 5 500 vessels are transiting the fairway outside the Bjørnafjord entrance (Figure 3.11-1).
> Figure 3.11-1: Density plot of yearly AIS movements [31].
3.11.1 Surface vessels
In a deterministic risk analysis [31] based on a forecasted sea traffic (2070) and a preliminary pontoon configuration the overall probability for accidental ship collisions is predicted to 2.5 ⋅ 10-3 per year. A 200 m LOA container vessel with a displacement of 40 000 mt has been nominated as preliminary design ship for pontoon collisions from passing ships (tentatively estimated representative also for transiting ships). The probability of a vessel sinking on top of the tunnel is in the risk analysis [31] predicted to 2.4 ⋅ 10-6 per year and thus not a relevant accidental scenario. Moreover, the risk for accidental dropped or dragged anchor is considered extremely low or negligible.
3.11.2 Submarines
Bjørnafjord are used by the Royal Norwegian Navy as naval training area for submarines. The prediction of the overall probability for submarine impact is not possible due to lack of official data on frequency of submarine passages. A credible method for estimation of submarine – SFTB collision probability and collision energy has been developed by SSPA in [31] Appendix 11, taking into account a number of main parameters characterising the submarine exercises. The model is intended to be applied in cooperation with the Navy in order to derive credible risk figures and to define a range of reasonable accuracy and to identify possible needs and measures for reduction of collision risks. Pending conclusive results, impact from a ULA submarine with a displacement of 1 050 mt displacement (included added mass) and 20 knots speed should be considered for the main tubes and tethers.

K3/K4 DESIGN BASIS / 12149-OO-R-002, rev. 04
26 3.12 Geotechnical
3.12.1 General
Information on soil conditions and soil parameters are provided in:
— Report 613863-001 from Multiconsult; Bjørnafjorden, Bunn- og grunnundersøkelser
— Report 322402.01 from GeoMap; Bjørnafjorden – Bruforbindelse, Løsmassekartlegging med akustisk profilering
— Report 141007-1 from GeoMap; E39 State municipal plan Aksdal – Bergen, Acoustic profiling with boomer to map bedrock horizon
NPRA has planned an updated survey in 2016 to provide more accurate seabed topography and further geotechnical data. Generally, there are steep and undulation outcropping rock with depressions filled with soil in the near shore areas, with very steep out-cropping rock down to the deep areas. In the deep middle part of the fjord, there are areas covered by soil, consisting of clay, moraine and mixed soil. Samples taken from areas with clay in the upper layers, show that the clay is soft with a high plasticity index. Samples are taken from depths down to about 4 m below seabed.
3.12.2 Design principles
For the tether stabilized SFTB there are typically 3 tether anchor principles which may be considered for the Bjørnafjord crossing. These are:
1. Suction anchors – for operation in soft clay – these may also be gravity anchors 2. Gravity anchors - to be placed on prepared gravel base 3. Drilled and grouted piles – drilled through sediment layers and grouted to bed rock
A special study has been carried out considering using drilled and grouted pile foundations for individual tether. The documentation ref. [45] includes demonstration of feasibility, reference to relevant concepts/regulations and a proposed drilled and grouted pile concept including installation method considerations. According to the mandatory document N400 section 11.3.4 [1], there is a restriction as to apply geotechnical capacity for permanent tensile load in piled foundations 2 . Report [45] has been provided and presented to Vegdirektoratet to clarify whether the “the geotechnical capacity” restriction in N400 applies to drilled and grouted piles into bedrock. Unless advised otherwise by Vegdirektoratet, this design basis interpretes that a drilled and grouted connection to bed rock is not the same as geotechnical capacity and thus that this concept can be applied in design of tether piles. As mentioned in [45], further work is required to nominate standards for design, execution and compliance testing of the grouted connection, see references [19], [20], [23], [24], [26] and [27].
2 Ref. 11.3.4.1 in Norwegian “I bruddgrensetilstand regnes en pel ikke å ha geoteknisk bæreevne for strekk forårsaket av permanente laster i kombinasjon med temperaturlaster, samt sykliske laster og eventuelle andre laster med varighet over en time (lastvirkning beregnes ved pelespiss, dvs. inkludert neddykket tyngde av pel). “

K3/K4 DESIGN BASIS / 12149-OO-R-002, rev. 04
27 Upon more detailed geological data, the piled foundations need to be located outside weakness zones and away from areas where it is impossible to utilize tools to support initial drilling. If bucket foundations are relevant, the overall design principles will be as described in the Recommended Practice by DNV, referred to above. For the design of the caissons in the shallow water, traditional bearing capacity calculations as described in the guidance V220 from NPRA, will be used. In the following chapters, description of the design of suction anchors is emphasized. The design of suction anchors is assumed to represent a more "advanced technology", compared to the caissons on levelled friction materials. The limit state method of design will be used, using partial factors for ULS (Ultimate Limit State) and ALS (Accidental Limit State). The loads factors will be in accordance with the codes and standards listed in the Design Basis. Reduction of acting line tension force between the dip-down point and pad-eye will not be accounted for at this stage of the project. This is a conservative approach. For suction anchors in clay, the design shall generally be based on Direct Cyclic Shear strength (DSS cyclic). Only results from static testing are available. We will evaluate and estimate the effect of cyclic degradation based on data from the soil parameter report, dynamic part of the total loads and In-house experience. Correction for the "set-up" effects along outside skirt wall, due to the remoulding and reconsolidation of the clay after installation, will be roughly estimated. The anisotropy factors given in the soil report from Multiconsult will be applied.
3.12.3 Codes and standards
The foundation design will be based on the following codes and standards:
— NS-EN 1990:2002+NA:2008, Basis for structural design — NS-EN 1997-1:2004+NA:2008, Geotechnical design – General rules — Veiledning Håndbok V499 – 2014, Statens vegvesen, Bruprosjektering
Eurocodeutgave — Veiledning Håndbok V220 – 2014, Statens vegvesen, Geoteknikk i veibygging — Peleveiledningen 2012, Norges Geotekniske Forening — DNV-RP-E303, Recommended practice for geotechnical design and installation of
suction anchors in clay — Report 13863-001 from Multiconsult, Bjørnåfjorden, Bunn- og
grunnundersøkelser
3.12.4 Strength parameters in clay
For stability, bearing capacity and skirt penetration calculations the following parameters will be used: Unit weight of soil
— Unit weight, total: γ = 15 kN/m3 — Effective unit weight: γ’ = 5 kN/m3

K3/K4 DESIGN BASIS / 12149-OO-R-002, rev. 04
28 Undrained shear strength by depth
— Compression: cuC = 0,42 • (γ’ • z + 3)
where z is depth below sea-bed. Strength anisotropy
— Extension: cuE = 0,55 • cuC = 0,23 • (γ’ • z + 3) — Direct: cuD = 0,75 • cuC = 0,32 • (γ’ • z + 3)
In lack of soil information for the deep soil layers, linear interpolation by depth will be assumed. Shear strength by depth will therefore be as follows:
> Figure 3.12-1: Undrained shear strength cu by depth Drained strength parameters
— Angle of internal friction: φ’= 23° — Attraction: a = 5kN/m2
3.12.5 Strength parameters in non-cohesive soil
For stability and bearing capacity calculations parameters listed below will be used: Moraine and mixed non-cohesive soil As no information on this type of soil is available, conservative and common parameters are assumed.
— Unit weight: γ = 19 kN/m3 — Effective unit weight: γ’ = 9 kN/m3 — Angle of internal friction: φ’= 33° — Attraction: a = 10 kN/m2

K3/K4 DESIGN BASIS / 12149-OO-R-002, rev. 04
29 Submerged non-compacted rock-fill
— Unit weight: γ = 19 kN/m3 — Effective unit weight: γ’ = 9 kN/m3 — Angle of internal friction: φ’= 36° — Attraction: a = 5 kN/m2
3.12.6 Parameters for settlement calcualtions in clay
For clay the ES-model (extra sensitive soil) according to Janbu will be used, as recommended by Multiconsult in report 613863-001.
— Module number: m = 10 — Module exponent: a = -0,23
For comparison the values of the settlements will be checked by us of the PL-model (plastic soil) according to Janbu, with the following parameters:
— Module number: m = 11,4 — Module exponent: a = 0
Development by time will be calculated according to Janbu, using Coefficient of consolidation: cv = 5 – 15 m2/year Both values will be checked, for control of parameter sensitivity.
3.12.7 Parameters for settlement calculations in non-cohesive soil
Soil model EP (Elasto Plastic) according to Janbu will be used:
— Modul numer: m = 200 — Modul exponent: a = 0,5
Coefficient of consolidation: cv = 1000 m2/year.
3.12.8 Material factors
The minimum material factors for the soil will be as follows:
> Table 3.12-1: Material factors for foundation design
Limit state Undrained soil parameters Shear strength
Drained soil parameters Angle of internal friction
φ
ULS 1.4 1.25
ALS 1.0 1.0

K3/K4 DESIGN BASIS / 12149-OO-R-002, rev. 04
30 3.13 Engineering geology The scope of the engineering geological design for the tube bridge includes the length of the bridge itself and the physical anchoring of the bridge to land at each end. A main principle of the tube bridge is that it shall be submerged along its entire length; thereby the connection to continued road at each end shall be at a submerged location to a hard rock tunnel. Horizontal anchoring of the bridge shall reach beyond the limit of the bridge on-land and it will be natural to cater for such anchoring within the areas of the hard rock tunnels at the northern and southern connection points. It is expected that the design principle for anchoring shall be included in the bridge design, though the construction of the anchors will largely be part of the hard rock tunnel excavation. Being a submerged connection it is evident that the solution must include principles for submerged connection in water filled chambers established in both the tube bridge itself and in the rock tunnel. The rock tunnel must at some point include a submerged piercing of the sea bed; either into open water, or in a dry solution in a preinstalled and sealed connection of the tube/tunnel. Possible solutions, however challenging, does comprise known and proven methods and technology, thus at this stage of the bridge design the element will not be a main concern, other than verification of feasibility. Further, along the bridge alignment the bridge shall be anchored either in floating pontoons or at the sea bed. The first option does not include any elements for geology/engineering geology. The latter does include solution for either tensile or gravitational anchors in/on either hard rock or sediments. Anchoring in/on thick sediments shall be included mainly in the geotechnical (soil mechanical) design. Anchoring in/on hard rock shall (or with only thin layers of sediments) will be the main focus for the engineering geological design. Important elements for the engineering geological design are:
(1) Topography (on land and in shallow and deep water) (2) Sediments; type and thickness (3) Rock type, rock mass quality and permeability, jointing and weakness zones (4) Feasible construction methodology for anchoring
In addition to study of literature, aerial photos, topographical and geological maps, areas above water and in shallow water close to the shore a geological survey may include visual inspection and mapping. Underwater the design must rely on indirect mapping, measurements and observations. Some information on the conditions underwater is available from earlier studies, and the need for further investigations shall be described and recommended as part of the first stage of the engineering geological design. Design of anchoring shall consider:
— Sufficient capacity of anchor, anchoring and foundation, with relevant safety factors — Stability of the area of the anchor/foundation and surroundings — Ability to document the capacity and reliability of chosen location and method for
anchoring/foundation — Constructability/feasibility for establishment of the solution for anchoring at the given
location

K3/K4 DESIGN BASIS / 12149-OO-R-002, rev. 04
31 With regards to the latter in this list, it is suggested that the main philosophy shall be to rely on known and well-proven technology in order to keep overall risk and uncertainties low. Innovative solutions are welcomed, though with adequate requirements to documentation of feasibility. Further it is of great importance to evaluated solutions based on the principle that requirements for inspection and maintenance shall be as low as possible – and if necessary, the chosen solution must allow for adequate inspection and replacement of elements.

K3/K4 DESIGN BASIS / 12149-OO-R-002, rev. 04
32 4 FUNCTIONAL REQUIREMENTS 4.1 Design life The operational design life for the crossing shall be 100 years, [1]. Easily replaceable components, moving parts and outfitting may be designed for a shorter design life, minimum 20 years.
4.2 Reliability class The bridge structure has the Reliability Class RC3 according to [1]. Elements may have different classification, depending on importance for structural integrity.
4.3 Structural requirements 4.3.1 Deflections The limitation of short time deflections is controlled for infrequent load combinations in the Serviceability Limit State. No requirements to deflections are given specifically for SFTBs in [1], hence NPRA has advised the limiting values as per Table 4.3-1.
> Table 4.3-1: Limiting deflections
Direction Total deflection
Horizontal L / 200
Vertical L / 350
For deflections in the horizontal direction, L will be taken as the total length between the abutments. The dynamic contribution shall not exceed L / 350. For vertical deflections L will be taken as the distance between the vertical supports, i.e. pontoons or tether groups.
4.3.2 Accelerations and vibrations Accelerations and vibrations shall be evaluated with respect to user comfort. NPRA has recommended the following maximum accelerations to ensure pedestrian comfort:
− 0.5 m/s2 for vertical vibrations − 0.3 m/s2 for horizontal vibrations
4.3.3 Water tightness Structural elements subjected to permanent or potential water pressure difference shall be watertight. Particularly strict requirements for tightness according to NS 3473:2003 A.15.5 [13] shall be applied for ensuring water tightness in operation and temporary conditions:
− The minimum depth of the compression zone xc shall not be smaller than the lesser of 0.25 h and 100 mm
− If the tensile membrane stress is larger than zero, the minimum compression zone shall be larger than 200 mm
Water tightness criteria are checked in the Serviceability limit state for characteristic load combinations.

K3/K4 DESIGN BASIS / 12149-OO-R-002, rev. 04
33 In Ultimate and Accidental Limit State the reinforcement strain shall be limited to the elastic domain.
4.4 Floating stability 4.4.1 Intact stability criteria Watertight integrity and hydrostatic stability in temporary phases shall comply with requirements given in DNV-OS-C301 [15].
4.4.2 Damage stability criteria The SFTB shall provide sufficient buoyancy and stability in accordance with the requirements in DNV-OS-C301 [15]. The extent of the damage shall be assumed to two compartments unless it is proven that the bulkheads remain intact. The consequences on the tubes shall be evaluated. The bulkheads are to be designed for plausible impact loads in addition to the pertinent water pressure difference.
4.5 Traffic requirements 4.5.1 Road category The road standard and tube bridge class shall be selected based on the following parameters:
– Annual Average Daily Traffic (ADT) : >20 000 ADT – Design speed limit : 110 km/h
The crossing shall at least satisfy the requirements for primary road class H9.
4.5.2 Bicycle access The tube bridge shall accommodate a bicycle access in a dedicated gallery separated from the road traffic compartments. Tube tunnel profile T4 may be adopted provided the accessibility for emergency vehicles can be demonstrated.
4.5.3 Alignment The horizontal alignment is chosen based on what is most favourable for the concept considered. The minimum radius for horizontal alignment without width extension is taken as 2 350 m reflecting a future design speed limit of 120 km/h. For the tube bridge the maximum gradient shall not exceed 5 % [4] including potential tidal variations (1 yrp). The vertical alignment shall satisfy a ship clearance of minimum 20 m above the tube bridge within the fairway(s). Minimum radii for vertical alignment shall be taken in compliance with Handbook N100 Tab. C.2 [3] to:
– Minimum radius, crest curve : 2 356 m – Minimum radius, sag-curve : 4 112 m
4.5.4 Slope discontinuity Reference is made to Handbook N400, [1], section 13.11.1. The requirements regarding maximum admissible angular change in joints according to [1] are not deemed relevant for the SFTB.

K3/K4 DESIGN BASIS / 12149-OO-R-002, rev. 04
34 4.5.5 Tube bridge cross section
Tube bridge class and tube bridge configuration for circular cross sections are determined according to Handbook N500 [4] and is based on Annual Average Daily Traffic (ADT) and tube bridge length. For the anticipated ADT (15 000 in 2040), tunnel class E with tunnel profile T9.5 with a total road width of 9.5 m is used (Figure 4.5-1). The requirement for free headroom measured normal to the road surface from the edge line is 4.60 m. Minimum inner radius for a circular tube bridge cross section is 5.02 m with centre 1.57 m above road surface.
> Figure 4.5-1: Tunnel profile T9,5 [3] and minimum inner tube diameter The road design manual Handbook N100 [3] requires the possibility to pass damaged vehicles and tunnel class E requires emergency lay-bys at 500 m ±50 m intervals (Handbook N500). For the 3.0 m lay-by lane tunnel profile T12,5 (Figure 4.5-2) shall be used. Minimum inner radius for a circular tube bridge cross section is 6.52 m with centre 1.44 m above road surface. For plan layout of the lay-by lane reference is made to Handbook N500 sec. 4.6.1 [4].
> Figure 4.5-2: Tunnel profile T12.5 [3] for lay-by and minimum inner tube diameter

K3/K4 DESIGN BASIS / 12149-OO-R-002, rev. 04
35 Emergency evacuation of persons shall be accommodated every 250 m [3]. Tube bridge profile for bicycle gallery shall be T4 and need to be accessible for emergency vehicles. Reference is made to N500 [4].
4.6 Navigational channel The required navigation channel will be determined on the basis of a risk assessment in dialogue with the bridge designers. The following numbers have been established as a starting point for the design: Dimensions of ship clearance (fairway)
Width : 400 m Depth : 20 m
Outside the fairway Depth : 15 m at shores
4.7 Equipment 4.7.1 Technical rooms in tube bridges Tube bridges with a length of more than 2 000 m shall provide place for technical rooms in order to house cabling for electrical installations, emergency power supply, telecommunications and accumulators. Specifications on operation criteria and placement of technical rooms are included in [2].
4.7.2 Ventilation in channel Tube bridges need appropriate ventilation for operational phases and accidental phases (fire). For the case of fire, ventilation should provide overpressure in emergency exits and exhaust dangerous gasses through separate canals. Maintenance on the ventilation system should not require taking the tube bridge out of operation, e.g. by using sufficiently redundant systems.
4.7.3 Drainage in tube bridge Any water in the tube bridge has to be collected and pumped out of the tube bridge. Penetrations of the main hull in permanent condition are not permitted. The draining system, reservoirs, pumping stations and conduits for the traffic compartments shall be designed to collect and handle surface water, wall washing water, firefighting water and spillage from a road tanker. If transport of dangerous goods is permitted, the safe drainage of flammable and toxic liquids shall be given due consideration.
4.8 Inspection All equipment requiring regular inspection or maintenance must be accessible.
4.9 Instrumentation The structural behaviour and any protective systems (corrosion protection etc.) shall be surveyed. The measurement of water levels in each compartment shall be connected to an alarm system.

K3/K4 DESIGN BASIS / 12149-OO-R-002, rev. 04
36 5 DESIGN LOAD COMBINATIONS The design is carried out in accordance with NS-EN 1990 [5], meaning that the safety format from this standard is the basis. The structural safety is assured through so-called safety classes based on failure consequences.
5.1 Limit state design The limit states to be considered are:
— ULS – Ultimate Limit State. Corresponding to the predicted extreme load situation, after which the structure shall be fully operative
— FLS – Fatigue Limit State. Simulating the accumulated damage through cyclic loading, both high frequency and low frequency loading (if any) to be considered. Fully operational structure after load history
— ALS – Accidental Limit State. To handle rare events with probability of occurrence below the ULS loads, and to prove post damage integrity
— SLS – Serviceability Limit State. Requirements on functionality during normal use or durability.
Basis for the safety format chosen is for ULS and ALS an annual failure probability of 10-4 in Reliability Class 3.
The partial safety factor method in general states that the design load effect Fd shall not exceed the design resistance Xd in the way:
𝐹𝐹𝑑𝑑 ≤ 𝑋𝑋𝑑𝑑 ( 3 )
𝐹𝐹𝑑𝑑 = �𝛾𝛾𝑓𝑓𝑓𝑓 ∙ ψ𝑓𝑓 ∙ 𝐹𝐹𝑘𝑘𝑓𝑓 ( 4 )
𝑋𝑋𝑑𝑑 = η𝑋𝑋𝑘𝑘𝛾𝛾𝑚𝑚
( 5 )
Here, Sd is the design load multiplied with a partialfactor, which accounts for any deviations between the characteristic load value and the representative value. ψi is the combination factor for a the relevant limit state of a load combined with other loads. η is a middle value of a korrectionfactor given for a specific material. Load factors account for:
— Possible unfavourable deviations of the loads from characteristic values — Reduced probability that various loads act simultaneously with their characteristic
values — Uncertainties in model and analysis of load effects
Material factors accounts for:
— Possible unfavourable deviations in resistance from characteristic value, due to material or geometry deviations
— Uncertainty in the model used for determining characteristic resistance

K3/K4 DESIGN BASIS / 12149-OO-R-002, rev. 04
37 5.2 Loads Loads are classified as: P Permanent loads L Live loads D Deformation loads E Environmental loads A Accidental loads
5.2.1 Permanent loads – P
− Permanent self-weight G1 − Variable self-weight G2 − Free self-weight G3 − Buoyancy
5.2.2 Live loads - L
− Traffic load
5.2.3 Deformation loads - D
− Pre-stressing − Shrinkage and creep − Applied deformation during fabrication/construction and assembly/installation phase − Settlement of tether foundations
5.2.4 Environmental loads – E
– Wave loads – Current load – Wind – Tidal variation – Sea level increase – Snow – Temperature – Earthquake
5.2.5 Accidental loads - A
– Ship impact – Sinking ship – Dropped / dragged anchor – Explosion – Fire – Vehicle impact – Underwater landslide

K3/K4 DESIGN BASIS / 12149-OO-R-002, rev. 04
38 5.3 Load Combinations
5.3.1 Limit states
Based on the requirement given in NS-EN 1990 [5], and a risk analysis for the project [34], the following design situations have been identified and considered relevant for this project: Ultimate Limit States (ULS)
− Maximum characteristic traffic loading with accompanying actions
− Maximum characteristic tidal variation, with accompanying actions
− Extreme waves, wind and current loading, with accompanying actions
− Maximum ship impact on pontoon for 100-year return period, with accompanying
actions
− Extreme effects of other variable actions (temperature, specific weight of water)
− Tether slack control
Serviceability Limit States (SLS)
− Limit state of water tightness for characteristic load combinations
− Limitation of vibrations for infrequent combinations
− Limitation of short time deflections for infrequent combinations
− Crack limitation according to NS-EN 1992-1-1 for relevant exposure classes
Accidental Limit States (ALS) Temporary phases during construction / transport / installation:
− Accidental filling of buffer compartment at end of tube bridge segment
− Maloperation of tugs (one tug / maximum force / 30 degrees deviation)
Operational phase: − Accidental filling of 2 pontoon compartments
− Accidental filling of 2 tube bridge compartments
− Loss of 1 pontoon due to ship impact and activation of weak link / loss of one set of
tethers due to submarine impact
− Vehicle impact
− Failure of ballast system (no compensation of tidal variation)
− Land-slide generated waves
− Explosion in tube bridge / technical room
− Fire in tube bridge / technical room
− Earthquake
Self-weight is well defined due to rigorous control in dry dock. Accurate self-weight is essential for transportation and operation and potential weight deviations can be compensated with solid ballast prior to tow out of dock. Consequently no upper / lower load factor is defined for self-weight, in agreement with NS-EN 1990:2002 4.1.2 [5]. Reference is made to N400, [1], on weight control during fabrication, installation and operation.

K3/K4 DESIGN BASIS / 12149-OO-R-002, rev. 04
39 For this kind of long span bridges there might be possibility for reducing the traffic load. This is not considered in this stage of the project, but might be room for discussion in a later stage.
5.3.2 Combination of environmental loads
Load combinations for environmental loads are based on NS-EN1990 [5]. According to NPRA, handbook N400 [1], a dynamic analysis with hydrodynamic and aerodynamic loads should be perform. Since the bridge is fully submerged in an operational condition, only hydrodynamic loads are relevant to describe the structural behaviour. The different hydrodynamic loads, or environmental loads, included in the analysis are shown in Error! Reference source not found. for different return periods. Total global load effects are found by combination of environmental load from the dynamic analysis and the static analysis. Environmental loads are considered as a single load group with a load factors according to NS-EN 1991-2 [6] Environmental loads are in this project included with a return period of 100 years.
> Table 5.3-1: Return periods for environmental loads to be combined in different limit states and in temporary conditions
Return period
Wind Wind sea Swell Current Sea Level
1 1 1 1 1 Mean
10
10 10 1 10 10
1 1 10 1 Mean
100 100 100 10 100 100
10 10 100 10 10
10000 10 000 10 000 100 10 000 Mean
100 100 10 000 100 Mean
5.4 Load factors The load factors to be used for the various load categories and limit states are given in NS-EN 1990 [5] and summarized in Sec. 5.4.1 and 5.4.2.
5.4.1 Ultimate limit state
Load combination for the ultimate limit state follow the rules given in eq. 6.10a) and 6.10b), table NA.A2.4(B) NS-EN 1990:20002/A1:2005/NA:2010 [5]. In addition the equilibrium combination given in table NA.A2.4(A) is used to check the stability criterion by means that no slack should occur for the Tether SFTB in the ultimate limit state. The uplift of tether foundations are checked with the same combination but with different load factors. The combinations are presented below.

K3/K4 DESIGN BASIS / 12149-OO-R-002, rev. 04
40 > Table 5.4-1: Ultimate limit state with traffic, Table NA.A2.4 (B), equation 6.10a) [5]
Load
Dominant load P L EWave/Wind/current/Tide
γ x ψ0 γ x ψ0 γ x ψ0
Permanent 1) P 1.35/1.0 1.35/1.0 1.35/1.0 Traffic L 0.945 0.945 0.945
Deformation 2) D 1.0 1.0 1.0 Temperature E 0.84 0.84 0.84
Wave/Wind/Current/Tide E 1.12 1.12 1.12 1) Load factor of 1.0 is used on permanent loads, when more unfavourable. 2) The load factor for post-tensioning load is 1.1/0.9
> Table 5.4-2 Ultimate limit state with traffic, Table NA.A2.4 (B), equation 6.10b) [5]
Load
Dominant load
P L EWave/Wind/current/Tide
γ x ψ0 γ x ψ0 γ x ψ0
Permanent 1) P 1.2/1.0 1.2/1.0 1.2/1.0 Traffic L 0.945 1.35 0.945
Deformation 2) D 1.0 1.0 1.0 Temperature E 0.84 0.84 0.84
Wave/Wind/Current/Tide E 1.12 1.12 1.6 1) Load factor of 1.0 is used on permanent loads, when more unfavourable. 2) The load factor for post-tensioning load is 1.1/0.9 ψ is the reduction or combination factor according to table NA.A2.1 in NS-EN 1990:2002/A1:2005/NA:2010 [5]. For the design of the SFTB it is not clear which combination that gives the governing response. Based on initial static analysis runs with different combination rules a manual calculation of Stadium 1 stresses is carried out for the bridge tubes, including axial forces and biaxial bending. This will give an indication of which actions govern the stress results. Since the hydrodynamic analysis produces characteristic response values, the correct combination is found by superposition of the correct static analysis and the dynamic analysis with load factor from the governing combination rule. Only one load model from NS-EN1991-2 [6] is considered so far in the project. Load model 1 together with load on footways and bicycle lane, known as group 1a from table NA.4.4a, is considered as the governing traffic load model for the SFTB. > Table 5.4-3 Global stability in ultimate limit state, Table NA.A2.4 (A) [5]
Load
Dominant load P L EWave/Wind/current/Tide
γ x ψ0 γ x ψ0 γ x ψ0
Permanent 1) P 1.0/0.9 1.0/0.9 1.0/0.9 Traffic L 0.945 1.35 0.945
Deformation 2) D 1.0 1.0 1.0 Temperature E 0.84 0.84 0.84
Wave/Wind/Current/Tide E 1.12 1.12 1.6 1) Load factor of 0.9 is used on permanent loads, when more unfavourable.

K3/K4 DESIGN BASIS / 12149-OO-R-002, rev. 04
41 For a tether slack control, the structural system might be seen as a bridge supported by abutments as for a normal road bridge. According to NS-EN 1991-2, 4.2.4(6), a carriageway consisting of two separate parts on separate deck should be considered as two carriageways. Separate lane numbering then applies in the design of the decks. But if the two decks are supported by the same piers, or in this case tethers, there should be one numbering for the two parts together in the design of the abutments or tethers. From Sec. Error! Reference source not found. the most loaded lane has a surface load equal to 5.4 kN/m2, a total of 10.8 kN/m2 in total for both decks when two separate numbering are used. I.e. when only one numbering applies the total load will be 7.9 kN/m2. This is illustrated in Figure 5.4-1.
> Figure 5.4-1: Lane numbering - carriageway consisting of two separate parts on two
separated decks.
5.4.2 Serviceability limit state
Control in service limit state is based on the requirements according to NS-EN-1991-2 [6] supplied with reqirements for water tightness given in NS3473:2003 [13]. To insure water tightness of concrete structures with one sided water pressure, they should be designed such that the concrete has compression in both directions. The load kombinations for service limit states are given in Table NA.A2.6 in NS-EN 1990:2002/A1:2005/NA:2010, and shown below. Combination RARE or characteristic
> Table 5.4-4: Characteristic serviceability limit state (RARE), Table NA.A2.6 [5]
Load
Dominant load
L EWave/Wind/current/Tide
1.0/ Ψ0 1.0/ Ψ0
Permanent P 1.0 1.0 Traffic L 1.0 0.7
Deformation D 1.0 1.0 Temperature E 0.7 0.7
Wave/Wind/Current/Tide E 0.7 1.0 Other variable loads Q 0.7 0.7
1)Tidal loads are used with a characteristic value since the astronomic value doesn`t vary

K3/K4 DESIGN BASIS / 12149-OO-R-002, rev. 04
42 Non-frequent combination
> Table 5.4-5 Non-frequent serviceability limit state with traffic (NONF), Table NA.A2.6 [5]
Load
Dominant load
L EWave/Wind/current/Tide
Ψ1,infg/ Ψ1 Ψ1,infg/ Ψ1
Permanent P 1.0 1.0 Traffic L 0.8 0.7
Deformation D 1.0 1.0 Temperature E 0.6 0.6
Wave/Wind/Current/Tide E 0.6 0.8 Other variable loads Q 0.6 0.6
1)Tidal loads are used with a characteristic value since the astronomic value doesn`t vary Frequent combination
> Table 5.4-6 Frequent serviceability limit state with traffic (FREQ), Table NA.A2.6 [5]
Load
Dominant load L EWave/Wind/current/Tide
Ψ1/ Ψ2 Ψ1/ Ψ2
Permanent P 1.0 1.0 Traffic L 0.7 0.5
Deformation D 1.0 1.0 Temperature E 0.5 0.5
Wave/Wind/Current/Tide E 0.5 0.6 Other variable loads Q 0.5 0.5
1) Tidal loads are used with a characteristic value since the astronomic value doesn`t vary Permanent combination
> Table 5.4-7 Permanent serviceability limit state with traffic (NONF), Table NA.A2.6 [5]
Load
Dominant load
L EWave/Wind/current/Tide
Ψ2 Ψ2
Permanent P 1.0 1.0 Traffic L 0.5 0.5
Deformation D 1.0 1.0 Temperature E 0.5 0.5
Wave/Wind/Current/Tide E 0.5 0.5 The characteristic combination is used as a basis for all service limit conditions, basically control of water tightness. If results are too conservative the permanent combination may be used, in accordance with footnote 5) of table NA.A2.1 in NS-EN 1990:2002/A1:2005/NA:2010.

K3/K4 DESIGN BASIS / 12149-OO-R-002, rev. 04
43 5.4.3 Accidental limit state
Load
Dominant load A (skip impact) A (Loss of pontoon)
1.0/Ψ2 1.0/Ψ2
Permanent P 1.0 1.0 Traffic L 0.5 0.5 Deformation D 1.0 1.0 Temperature E 0.5 0.5 Wave/Wind/Current/Tide E 0.5 0.5
Accidental loads Ship impact A 1 0 Loss of pontoon A 0 1 Compartment flooding A 0 0 Explosion A 0 0 Sinking ship A 0 0
*The load factor on all other loads then the accidental load is the same for every case
To avoid permanent leakage through the outer concrete wall, the reinforcement strain should be within the elastic area, meaning that the crack will close after the accident. The same requirement applies for the tendons. Plastic deformation will give loss in pretension, and must be avoided. Accidental loads should be controlled in two steps, described in section 13.12.4.5, Handbook N400 [1]:
(1) Cause of an accidental load combined with relevant loads. Local damage is acceptable, but not a global collapse. Damage that gives considerable leakage can be seen as a global collapse.
(2) Survival of the structure after an accident in step 1. I.e. a global collapse of the damaged structure cannot occur.
I.e. the check for ship impact towards a pontoon in accidental limit state is carried out in just one step. Step two of the check is not relevant for this case, since the structure keep its integrity after such event. The standard states that a factor 0.5 for ψ2 is used for crack calculations in loadcombination permanent. A factor of 0.2/0 on traffic load or other loads respectively, can be used for calculation of long term effects of time dependant characteristics, interpreted as creep and shrinkage effects. The NPRA, handbook N400 section 13.12.4.5 states that environmental and accidental loads should be investigated for a return period of 10 000-years. Further the handbook says that in step 1 the accidental load should be combined with other relevant loads. Which loads that are relevant is not given explicitly, and therefore no clear guidance is given for combinating traffic and environmental loads. Environmental loads included in the accidental load combinations are calculated for 100 year return period, reduced by a factor of ψ2=0.5. The reduction factor ψ2=0.5 is also chosen for traffic loads according to table NA.A2.1 [5].

K3/K4 DESIGN BASIS / 12149-OO-R-002, rev. 04
44 The cases investigated in this project so far:
• Ship impact towards pontoon with combination of environmental loads from a 100-years return period, traffic loads and other variable loads. All reduced by a combination factor ψ2=0.5
• Loss of pontoon with combination of environmental loads from a 100-years return period, traffic loads and other variable loads. All reduced by a combination factor ψ2=0.5
• Compartment flooding with combination of environmental loads from a 100-years return period, traffic loads and other variable loads. All reduced by a combination factor ψ2=0.5
• Explosion with combination of environmental loads from a 100-years return period, traffic loads and other variable loads. All reduced by a combination factor ψ2=0.5
• with combination of environmental loads from a 100-years return period, traffic loads and other variable loads. All reduced by a combination factor ψ2=0.5
5.4.4 Fatigue limit state
Fatigue is not deemed governing for the main tubes and consequently not assessed at this stage.

K3/K4 DESIGN BASIS / 12149-OO-R-002, rev. 04
45 6 MATERIALS
6.1 Concrete The concrete design shall be according to NS-EN 1992-1-1 [10]. Depending on the exposure class for environmental action, the material composition shall conform to the requirements in NS-EN 206-1:2001 Concrete - Part 1: Specification, performance, production and conformity including national annex NA-NS206. The use of low heat concrete mix to avoid thermal cracking needs to be evaluated.
6.1.1 Material grade
Base case for concrete material grade for the SFTB is B55 MF40. Selection of higher material grade is possible if required. The material parameters for B55, B65 and B75 are reproduced below.
> Table 6.1-1 Material properties for concrete, Ref. [10]
B55 B60 B70
Structural compressive strength, 𝑓𝑓𝑐𝑐𝑘𝑘 (MPa) 55 60 70
Structural tensile strength 𝑓𝑓𝑐𝑐𝑐𝑐𝑘𝑘,0.05 (MPa) 3.0 3.1 3.2 Modulus of elasticity 𝐸𝐸𝑐𝑐𝑚𝑚- Mean value (GPa) 38 39 41
Poisson’s ratio for uncracked concrete: 0.2 Coefficient of thermal expansion: 10 ∙ 10−6𝐾𝐾−1 For control of water tightness (SLS), the control is made according to NS3473, Ref, [13]. The main difference between NS-EN 1992 and NS3473 is the modulus of elasticity. For the water tightness control a value of 30.2 GPa is used according to NS3473. For the hydrodynamic analyses where the response is dependent of the structural stiffness the modulus should be varied between 30 to 40 GPa to account for variance in the material parameter.
6.1.2 Concrete structural damping
The structural damping ratio of 0.8 % for uncracked concrete shall be applied for the analyses according to ref. [1]. In the dynamic analyses the structural damping is included as a four coefficient Rayleigh damping, tuned to cover the relevant structural modes of the SFTB. The following values are to be used for hydrodynamic analyses: Range of interest: Between 4s and 31 s. Corresponding damping ratios: 0.8 %. The above values results in the damping curve presented in Figure 6.1-1.

K3/K4 DESIGN BASIS / 12149-OO-R-002, rev. 04
46
> Figure 6.1-1 Damping ratio as function of structural period of oscillation
6.1.3 Density The design shall account for an anticipated variation in mass density of concrete (Table 6.1-2). The variation in dry density shall correspond to characteristic maximum (95 %) and minimum (5 %) quantiles. A variation of ±2.0 % for structural concrete and ±2.5 % for concrete ballast may be assumed for the tube bridge structure.
> Table 6.1-2 Characteristic dry density of concrete [kN/m3]
Concrete Mean Maximum Minimum
Ballast concrete 24.0 24.6 23.4
Structural concrete
100 kg/m3 reinforcement 24.7 25.1 24.2 150 kg/m3 25.0 25.5 24.5 300 kg/m3 26.0 26.5 25.6 500 kg/m3 27.4 27.8 26.9
The minimal characteristic density shall be used for control of stability; the maximum characteristic density shall be used for control of floating phases. For other design checks in ULS, SLS and ALS the mean characteristic density applies.
6.1.4 Durability and cover The exposure classes are determined in accordance with NS-EN 1992-1-1 [10] (Table 6.1-3).
> Table 6.1-3 Exposure classes
Environmental zones Corrosion Freeze / thaw
Splash and spray zones XS3 XF4
Permanently submerged XS2 XF3
Dry compartments XC3 XF3

K3/K4 DESIGN BASIS / 12149-OO-R-002, rev. 04
47 The minimum concrete cover to reinforcing steel cmin,dur is specified according to prevailing environmental conditions in Table 6.1-3. The requirements for minimum concrete cover for corrosion protection shall comply with NS-EN 1992-1-1:2004 Table NA.4.4N if not overruled by a more stringent requirement in HB N400 [1].
𝑐𝑐𝑛𝑛𝑛𝑛𝑛𝑛 = 𝑐𝑐𝑛𝑛𝑚𝑚𝑛𝑛,𝑑𝑑𝑑𝑑𝑟𝑟 + ∆𝑐𝑐𝑆𝑆𝑆𝑆𝑆𝑆 + ∆𝑐𝑐𝑑𝑑𝑒𝑒𝑣𝑣
> Table 6.1-4 Concrete cover to reinforcing steel (mm)
Location Exposure
class cmin,dur ∆cSVV ∆cdev cnom
Splash and spray zones XS3 100 - ±20 120
Permanently submerged XS2 50 - ±15 65
Dry compartments XC3 35 - ±15 50
6.1.5 Reinforcing steel Ordinary reinforcement shall comply with class B500NC acc. to NS 3576-3:
Yield stress : fyk = 500 MPa Yield strain : 𝜖𝜖𝑦𝑦 = 2.5 ∙ 10−3 Modulus of elasticity : 𝐸𝐸𝑠𝑠 = 200 000 𝑀𝑀𝑀𝑀𝑀𝑀
6.1.6 Pre-stressing reinforcement The pre-stressing steel shall be of type Y1860S7 15.3 as per EN 10138-3:
Characteristic proof stress : fp,01k = 1 640 N/mm2 Ultimate tensile strength : fpk =1860 N/mm2
Modulus of elasticity : 𝐸𝐸𝑠𝑠 = 195 000 𝑀𝑀𝑀𝑀𝑀𝑀
6.1.7 Partial factors for materials
Partial factors for material for ultimate limit states are given in Table 6.1-5.
> Table 6.1-5 Partial factors for ultimate limit states NS-EN 1991-1-1 NA.2.4.2.4 (1)
Design situation Concrete
γc Reinforcing steel
γs Post-tensioning
γs
Persistent & transient 1.5 1.15 1.15
Accidental 1.2 1.0 1.0
6.1.8 Strain limitation
In structural elements where requirements for tightness is decisive for the overall structural integrity, the strain in the reinforcement and prestressing steel shall be limited to 0.9 𝜀𝜀𝑠𝑠𝑦𝑦𝑘𝑘 and
0.9 𝑓𝑓𝑝𝑝,0.1𝑘𝑘, respectively, in the Ultimate and Accidental limit state.

K3/K4 DESIGN BASIS / 12149-OO-R-002, rev. 04
48 6.2 Steel The steel used for the SFTB will be according to [1], 5.4.2. A summary of the materials planned used are further reproduced.
6.2.1 Material grades The nominal values for yield strength of the main load carrying system of the SFTB shall be in the range 355 – 400 MPa [1]. For secondary structures, other grades may be applicable. For the material grades, Table NA.3, [11], gives the requirements to the material grade with respect to the material thickness. Other steel qualities will be considered in tether design.
6.2.2 Steel quality The specification for structural steel for the SFTB is chosen according to EN10025: 2004. In Table 6.2-1 the characteristic strength for steel grade S355 is given in accordance with EN10025. However, other steel qualities may be selected for the different parts of the SFTB.

K3/K4 DESIGN BASIS / 12149-OO-R-002, rev. 04
49 > Table 6.2-1 Strength characteristics for steel grade S355 [MPa]
Description Plate thickness
t < 16 mm 16 mm < t < 40 mm 40 mm < t < 63 mm Yield strength 355 345 335
Ultimate strength 490
For materials at welded and bolted connections, z-quality shall be indicated in technical drawings. The following properties for standard steel can be used in design:
– Elastic modulus : 210 GPa – Poisson’s ratio : 0.3 - – Density : 7 850 kg/m3 – Coefficient of thermal expansion : 1.2∙10-5 1 / ºC
For the tethers the idea is to use subsea pipeline steel quality for which weldability is well proven through longer term experience. API grade X70 with yield stress SMYS=480 MPa is used as tethers for the offshore oil and gas platform Heidrun TLP, and has been in service for 20 years. Diameter/thickness ratio of 30 gives a neutral pipe in water. If the tethers design for the SFTB is governed by requirement to stiffness (steel area), rather than strength, a lower grade (eg. SMYS = 235 MPa) may be considered for the tethers to save cost, improve weldability and reduce requirements to interface components (which are to be designed with larger strength compared to the tether).
6.2.3 Material factors The material factors for the steel structures are based on NS-EN 1993-2:2006 [11]:
γM0 = 1.10 - Capacity for extensive yield and local buckling
γM1 = 1.10 - Buckling of members
γM2 = 1.25 - Ultimate resistance in tension, capacity of connections
γM3 = 1.25 - Friction capacity, ULS
γM3,ser = 1.10 - Friction capacity, SLS
γM4 = 1.10 - Bearing pressure, injection bolts
γM5 = 1.10 - Connections in truss structures, hollow sections
γM6,ser = 1.00 - Bolt capacity in SLS
γM7 = 1.10 - Pre-tensioning of high-strength bolts
6.3 Corrosion protection 6.3.1 Coating Anti–corrosion coating will be applied for steel details in the atmospheric zone and in the splash zone.
6.3.2 Corrosion allowance For steel details in the splash zone, a corrosion allowance is used in combination with coating. This applies to the pontoons, if a steel pontoon is chosen and possible impact fendering.

K3/K4 DESIGN BASIS / 12149-OO-R-002, rev. 04
50 6.3.3 Cathodic protection Cathodic protection shall be used for preventing corrosion of submerged steel elements in the entire structure. This requires installation of sacrificial anodes on the tube bridge, pontoons /bracings or tether system. Sacrificial anodes shall be effective over the entire design life without renewal. Means of replacing anodes during operation must be considered.

K3/K4 DESIGN BASIS / 12149-OO-R-002, rev. 04
51 7 RISK ANALYSIS Design assumptions for operation and temporary phases are based on the risk assessment carried out in the feasibility study for the Sognefjord SFTB crossing [34], [37].
7.1 Design assumptions operation phase The design assumptions for the operation phase are summarized in Table 7.1-1.
> Table 7.1-1: Design assumptions for operation phase
Risk Design assumption
Tube bridge ramming by ship Tube bridge top below ship keel (> 20 m)
Tube bridge ramming by submarine
Submarines avoide tube bridge. Robustness check of tube for shear-punching.
Explosion in tube bridge Design for internal pressure as accidental load in ALS. Restrictions to transportation of explosives with detonation potential
Fire in tube bridge Design for the RMS (Rijkswaterstaat) fire exposure curve. Add plastic fibres to the concrete to avoid spalling
Warfare, terrorism Preparedness systems to keep the probability at an acceptable level. Otherwise ref. Explosions
Loss of oxygen supply Redundant ventilation system to provide adequate oxygen in all wind conditions and fire. Restrictions on transportation of toxic gases
Failure/maloperation of bilge/ballast
Passive system, filled from reservoir with limited volume. Back-up bilge system. Design for filling of compartments at a probability level less than 10-4 /year in ALS
Failure/ maloperation of control systems
Redundant systems. Experienced and well educated operators
Water filling of pontoon compartment
Pontoons to be divided in water tight compartments. Floatability and stability to be controlled in the ALS with two compartments flooded
Pontoon ramming by ship Weak link connection between tube bridge and pontoon. Tube bridge to be designed for the connection strength in ALS. Acceptance criteria include water tightness after the impact. The tube bridge to be designed (SLS) to avoid any impairment by loss of buoyancy of anyone pontoon
Water filling of tube bridge compartment
Redundant (3x50 %) ballast system. Control floatability for filling of two consecutive compartments in ALS
Earthquake Natural period of the tube bridge to be much higher than period of credible earthquakes, i.e. 2-6 sec.
Land slide generated waves The probability of severe landslides in proximity of the Bjørnafjord is considered low. If design against a credible slide will be requested a design in ALS will be performed
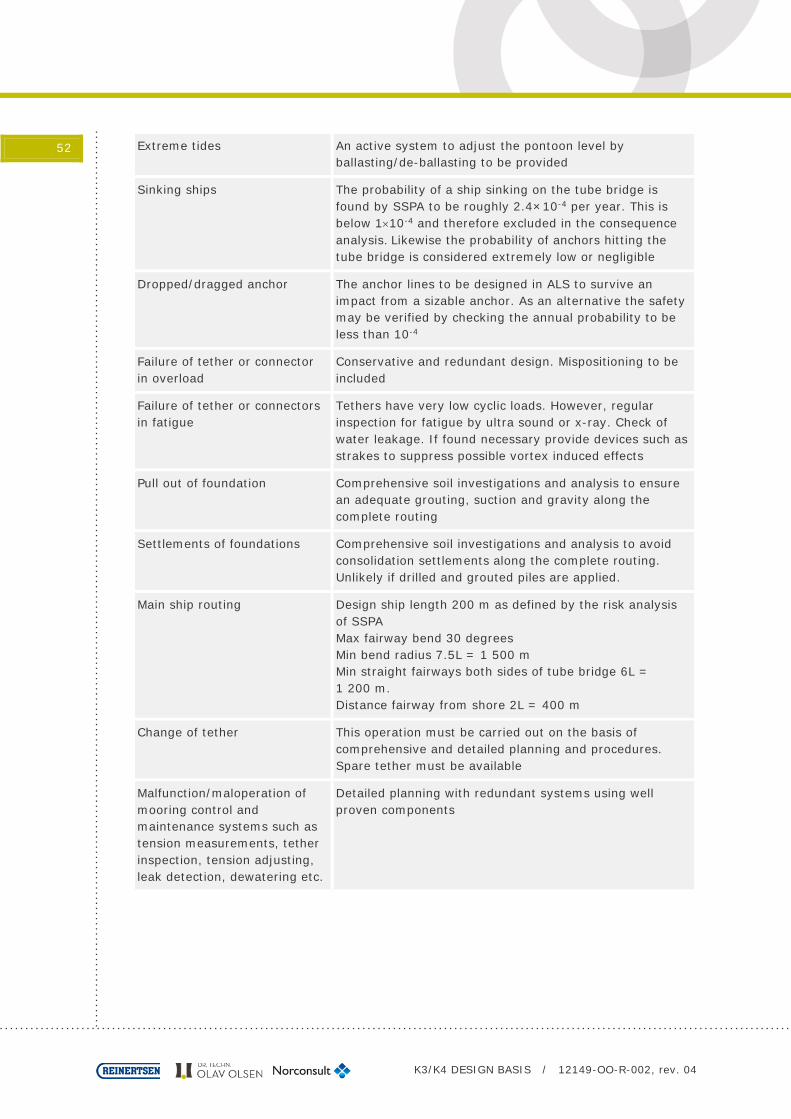
K3/K4 DESIGN BASIS / 12149-OO-R-002, rev. 04
52 Extreme tides An active system to adjust the pontoon level by ballasting/de-ballasting to be provided
Sinking ships The probability of a ship sinking on the tube bridge is found by SSPA to be roughly 2.4×10⁻⁴ per year. This is below 1×10⁻⁴ and therefore excluded in the consequence analysis. Likewise the probability of anchors hitting the tube bridge is considered extremely low or negligible
Dropped/dragged anchor The anchor lines to be designed in ALS to survive an impact from a sizable anchor. As an alternative the safety may be verified by checking the annual probability to be less than 10-4
Failure of tether or connector in overload
Conservative and redundant design. Mispositioning to be included
Failure of tether or connectors in fatigue
Tethers have very low cyclic loads. However, regular inspection for fatigue by ultra sound or x-ray. Check of water leakage. If found necessary provide devices such as strakes to suppress possible vortex induced effects
Pull out of foundation Comprehensive soil investigations and analysis to ensure an adequate grouting, suction and gravity along the complete routing
Settlements of foundations Comprehensive soil investigations and analysis to avoid consolidation settlements along the complete routing. Unlikely if drilled and grouted piles are applied.
Main ship routing Design ship length 200 m as defined by the risk analysis of SSPA Max fairway bend 30 degrees Min bend radius 7.5L = 1 500 m Min straight fairways both sides of tube bridge 6L = 1 200 m. Distance fairway from shore 2L = 400 m
Change of tether This operation must be carried out on the basis of comprehensive and detailed planning and procedures. Spare tether must be available
Malfunction/maloperation of mooring control and maintenance systems such as tension measurements, tether inspection, tension adjusting, leak detection, dewatering etc.
Detailed planning with redundant systems using well proven components
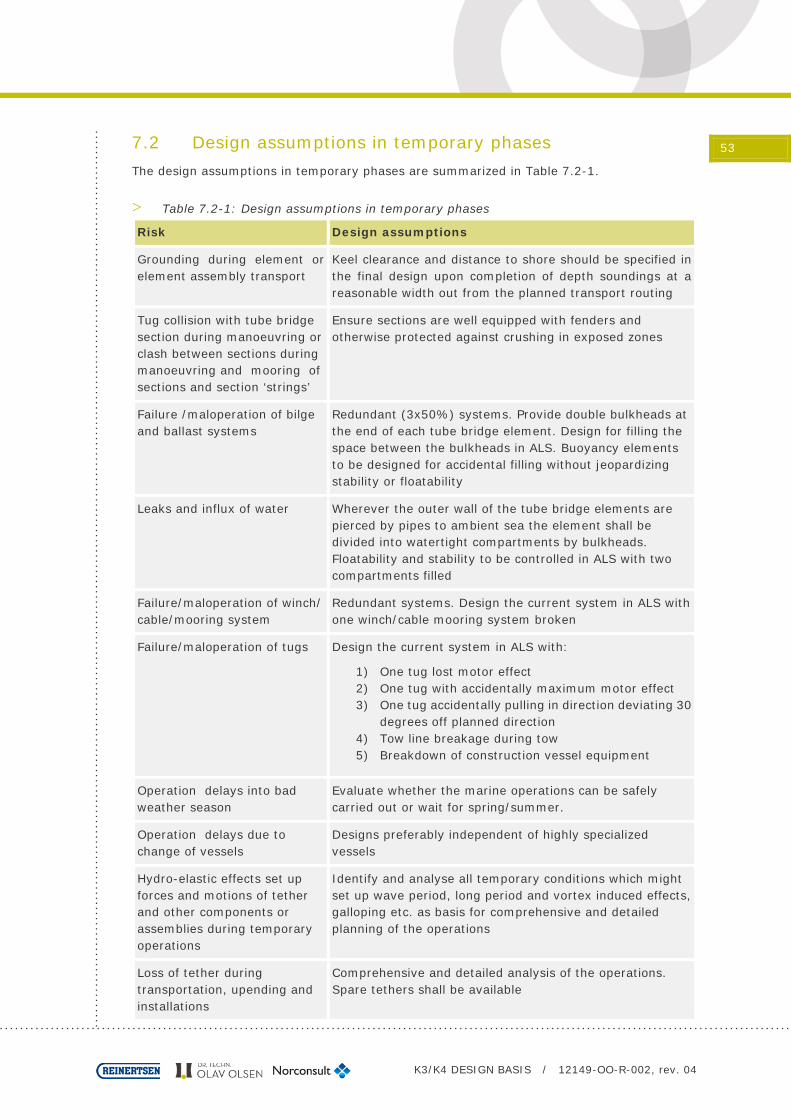
K3/K4 DESIGN BASIS / 12149-OO-R-002, rev. 04
53 7.2 Design assumptions in temporary phases The design assumptions in temporary phases are summarized in Table 7.2-1.
> Table 7.2-1: Design assumptions in temporary phases
Risk Design assumptions
Grounding during element or element assembly transport
Keel clearance and distance to shore should be specified in the final design upon completion of depth soundings at a reasonable width out from the planned transport routing
Tug collision with tube bridge section during manoeuvring or clash between sections during manoeuvring and mooring of sections and section ‘strings’
Ensure sections are well equipped with fenders and otherwise protected against crushing in exposed zones
Failure /maloperation of bilge and ballast systems
Redundant (3x50%) systems. Provide double bulkheads at the end of each tube bridge element. Design for filling the space between the bulkheads in ALS. Buoyancy elements to be designed for accidental filling without jeopardizing stability or floatability
Leaks and influx of water Wherever the outer wall of the tube bridge elements are pierced by pipes to ambient sea the element shall be divided into watertight compartments by bulkheads. Floatability and stability to be controlled in ALS with two compartments filled
Failure/maloperation of winch/ cable/mooring system
Redundant systems. Design the current system in ALS with one winch/cable mooring system broken
Failure/maloperation of tugs Design the current system in ALS with:
1) One tug lost motor effect 2) One tug with accidentally maximum motor effect 3) One tug accidentally pulling in direction deviating 30
degrees off planned direction 4) Tow line breakage during tow 5) Breakdown of construction vessel equipment
Operation delays into bad weather season
Evaluate whether the marine operations can be safely carried out or wait for spring/summer.
Operation delays due to change of vessels
Designs preferably independent of highly specialized vessels
Hydro-elastic effects set up forces and motions of tether and other components or assemblies during temporary operations
Identify and analyse all temporary conditions which might set up wave period, long period and vortex induced effects, galloping etc. as basis for comprehensive and detailed planning of the operations
Loss of tether during transportation, upending and installations
Comprehensive and detailed analysis of the operations. Spare tethers shall be available

K3/K4 DESIGN BASIS / 12149-OO-R-002, rev. 04
54 Loss of foundations during installation caused by uncontrolled operations
Comprehensive design analysis and planning of suction anchors or gravity anchors. Spare piles if drilled and grouted piles are selected.
Damage to tether and other components or assemblies during transportation
Comprehensive and coordinated planning to avoid collisions and other impact during simultaneous operation of a large number of tugs and other vessels
Location of docks Hanøytangen, Lutelandet and special made dock
Location of temporary assembly site
In a sheltered fjord in the vicinity of the Bjørnafjord.
Location of tether fabrication site
Suitable site for launching tether horizontally, sheltered tow to Bjørnafjord. Alternative tether installation methods without tow also to be considered.
Marine operations are planned and designed according to the guidelines given by DNV [14], [15], [16].

K3/K4 DESIGN BASIS / 12149-OO-R-002, rev. 04
55 8 REFERENCES 8.1 Regulations and codes [1] Norwegian Public Roads Administration: Håndbok N400 Bruprosjektering, Edition Feb.
2015.
[2] Norwegian Public Roads Administration: Krav til plass og rom i rørbru. Edition Dec. 2011.
[3] Norwegian Public Roads Administration: Håndbok N100 Veg- og gateutforming. Edition June 2014.
[4] Norwegian Public Roads Administration: Håndbok N500 Vegtunneler. Edition Jun. 2014.
[5] Standards Norway: NS-EN 1990:2002+NA:2008 Eurocode - Basis of structural design. Incl. Amendment A1:2005+NA:2010 and Corrigendum AC:2010. 1st edition, Feb. 2008.
[6] Standards Norway: NS-EN 1991-2:2003/AC:2010+NA:2010 Eurocode – Actions on structures. Part 2: Trafiic loads on bridges. Incl. Corrigendum AC:2010 and National Annex NA:2010. 1st edition, April. 2010.
[7] Standards Norway: NS-EN 1991-1-3:2003+NA:2008 Eurocode 1: Actions on structures - Part 1-3: General actions - Snow loads. 1st edition, Feb. 2008.
[8] Standards Norway: NS-EN 1991-1-4:2005+NA:2009 Eurocode 1: Actions on structures - Part 1-4: General actions - Wind actions. Incl. Amendment A1:2010 and Corrigendum AC:2010. 1st edition, Sep. 2009.
[9] Standards Norway: NS-EN 1991-1-5:2003+NA2008 Eurocode 1: Actions on structures
– Part 1-5: General actions – Thermal actions.
[10] Standards Norway: NS-EN 1992-1-1:2004+NA:2008 Eurocode 2: Design of concrete structures - Part 1-1: General rules and rules for buildings. Incl. Corrigendum AC:2010. 1st edition, Nov. 2008.
[11] Standards Norway: NS-EN 1993-2:2006+NA:2009 Eurocode 3: Design of Steel Structures - Part 2: Steel Bridges. 1st edition, Jan. 2006.
[12] Standards Norway: NS-EN 1998-1:2004+NA:2008 Eurocode 8: Design of structures
for earthquake resistance - Part 1: General rules, seismic actions and rules for buildings. Incl. Corrigendum AC:2009. 1st edition, Feb. 2008.
[13] Standards Norway: NS3473.E Concrete structures, Design and detailing rules. 6th edition, Sep. 2003.
[14] DNV GL: DNV-RP-H103 Modeling and Analysis of Marine Operations, Apr. 2011. [15] DNV GL: DNV-OS-C301 Stability and watertight integrity, Apr. 2011.

K3/K4 DESIGN BASIS / 12149-OO-R-002, rev. 04
56 [16] DNV GL: DNV-OS-H101 Marine Operations, General. VMO Standard (DNV – Rules for
Planning and Execution of Marine Operations), edition Oct. 2011. [17] DNV GL: DNV-RP-C205 Environmental Conditions and Environmental Loads, Apr.
2014. [18] Norsok N-003 Actions and Action Effects, Sept. 2007. [19] ISO 19902 (2007) Petroleum and natural gas industries - Specific requirements of
offshore structures – Fixed Steel Offshore structures - chapters 17 and 19.6.
[20] Eurocode 7 (NS-EN 1997-1) – Geotechnical design
[21] API RP 2T (2010) Planning, Designing and Constructing Tension Leg Platforms
[22] DNVGL-OS-C105 (2015) Structural design of TLPs - LRFD method
[23] NORSOK N-004 (2013) Design of Steel Structures
[24] NS-EN 1536 Execution of special geotechnical works - Bored piles
[25] NS-EN 1537 Execution of special geotechnical works - Ground anchors
[26] NS-EN 12715 Execution of special geotechnical work – Grouting
[27] Peleveiledningen (2012) – Norsk Geoteknisk Forening
8.2 Project specific documents [28] Norwegian Public Roads Administration: Konkurransegrunnlag – Kjøp av
rådgivningstjenester for utredning av rørbru over Bjørnafjorden. Dated 25.06.2014.
[29] SINTEF: Bridge across Bjørnafjorden Metocean conditions - Environmental values based on statistics and model results. Report F26109, Rev. 02, dated 08.05.2014.
[30] Sintef Fisheries and Aquaculture (2015) “Simulation of current and hydrography in Bjørnafjorden”. Report F26848. Dated 2015-05-04.
[31] SSPA Sweden AB: Risk assessment for the planned crossing of Bjørnafjorden. Report incl. Appendicies 1 – 6, 1st draft, dated 26.10.2014.
[32] GeoMap: E39 state municipal plan Aksdal-Bergen - Acoustic profiling with boomer to map bedrock horizon. Report 141007.1, dated 20.11.2014.
[33] Multiconsult: Bjørnafjorden bunn- og grunnundersøkelser – Prøvetaking laboratorieundersøkelser. Report 613863-001, dated 25.06.2012.
[34] REINERTSEN Olav Olsen Group: Feasibility study for crossing the Sognefjord - Submerged floating tunnel. Report 11744-ROO-R-01, Rev. 01, dated 28.11.2012.
[35] REINERTSEN, Dr.techn Olav Olsen, Norconsult, et al. Bjørnafjorden Submerged
Floating Tube Bridge – Design Brief. Report 12149-OO-R-003, Rev. 02, dated 02.02.2015.

K3/K4 DESIGN BASIS / 12149-OO-R-002, rev. 04
57 [36] DHI, Wave and Current Measurements in Bjørnafjorden, Hordaland, Norway, dated
27.03.2015
8.3 Other sources [37] Reinertsen AS: Neddykket Rørbro over Høgsfjorden, Vurdering av tidligere
undersøkelser innen dynamisk lastvirkning. 1996.
[38] Statens Kartverk, ressursnettsted for tidevann og vannstandsnivå (http://sehavnivå.no), visited 03.11.2014.
[39] Statens Kartverk, temasider havnivå, http://www.statkarthavniva.no/index.php?id=24, visited 17.09.2012.
[40] Standards Norway: NORSOK standard N-003, Actions and action effects, 2007.
[41] Vasskog, K. med Drange, H. og Nesje, A. 2009: Havnivåstigning, Estimater av framtidig havnivåstigning i Norske kystkommuner. Det nasjonale klimatilpasningssekretariatet ved Direktoratet for samfunnssikkerhet og beredskap, september 2009, Tønsberg (Bjerknesrapporten 2009).
[42] Musch, O. & Lothe, A.E. (2015) Utvikling av rørbru over Bjørnafjorden – Simulering av sjøtilstand. Norconsult Notat Nr. 1 Rev. R0. Oppdragsnr. 5146702. 05/02/2015.
[43] Svend Ole Hansen Aps: Annex A: Standarized Winds at Slåtterøy fyr. 11.02.2015.
[44] Svend Ole Hansen Aps: Bjørnafjorden Submerged Floating Tube Bridge, Bakcground for Design Basis –Wind Characteristics. 11.02.2015.
[45] Bjørnafjord Submerged Floating Tube Bridge – Drilled and grouted pile foundations for tethers, 1249-OO-R-301, rev.01 (10.11.2015).