
K eyboar ds, CR Ts, LCDs and Noisy...
73
Keyboards, CRTs, LCDs and Noisy Computers R!zvan Mus!loiu-E.
Transcript of K eyboar ds, CR Ts, LCDs and Noisy...

Keyboards, CRTs, LCDs and
Noisy ComputersR!zvan Mus!loiu-E.

Part I“Back to Keyboards”

Clarifications
• “... what exactly 1st, 2nd, and 3rd supervised feedback entail in the authors’ testing.”
• “There is a lot of supervision in this unsupervised attack.”

How it will work
FeatureExtraction
ModuleWAV
KeystrokeClassifier
Labelsof
keystrokes
features

How to build the classifier
FeatureExtraction
ModuleWAV
UnsupervisedLearningModule
KeystrokeClassifierBuilder
LanguageModel
Correction
SampleCollector
features
labelsof
keystrokes
probablycorrectlabels of
keystrokes
labels ofkeystrokes
KeystrokeClassifier

Recap
• Feature Extraction Module
• FFT
• Cepstrum
• Unsupervised Learning Module
• standard data clustering
• HMM
• Sample Collector
• Keystroke Classifier Builder
• Linear Classfication
• Neural Network
• Gaussian Mixtures

How to improve the classifier
FeatureExtraction
ModuleWAV
KeystrokeClassifier
LanguageModel
Correction
SampleCollector
features
labelsof
keystrokes
probablycorrectlabels of
keystrokes
labels ofkeystrokes
BetterKeystrokeClassifier
KeystrokeClassifierBuilder

Other view

Problems
“In particular, I think a major weakness of the paper is that all of their experimental data is provided by one single user.”

Problems
“So why is it that 5 minutes is the magic number?”

Clarifications
“Also, does the typing style matter? We know from the previous paper that is should not matter, but it’s not clear to me that this will be true for cepstrum feature.”

Clarifications
“Also, does the typing style matter? We know from the previous paper that is should not matter, but it’s not clear to me that this will be true for cepstrum feature.”

Crazy idea 1
“... specific domains with limited vocabulary can be easily modeled in such a manner, general domains with large vocabularies often suffer from out-of-vocabulary errors. [...] This makes it extremely unlikely that any such attack would produce meaningful recognition.”

Crazy idea 2
• Reconstructing the victim’s entire desktop state from sound
• detect mouse clicks, sound chimes
• “Another similar attack that may be more feasible would be to see if and attacker could tell what type of application a user was running based on keyboard acoustics and timing”
• Detecting the switches between applications
• why: to be able to apply crazy idea 1 :-)

Crazy idea 2 (cont)
“Perhaps some of the techniques presented in this paper might improve the accuracy of previous efforts to continuously authenticate users based upon their keyboard behavior.”

Extensions
“As I mention in the discussion, this system really does not truly implement the acoustic and language models as defined in voice recognition literature.”

Questions
“Of course, digital watermarking techniques are widely researched, but they do not provide the type of cryptographic protocols that visual cryptography provide.”

Questions
“ING Direct’s authentication scheme is another good example of how to defeat even keystroke devices or thermal imaging while still using passwords.”

Questions
“ING Direct’s authentication scheme is another good example of how to defeat even keystroke devices or thermal imaging while still using passwords.”

Extensions
• Using both touch peaks and hit peaks to get more information
• Will more information help?
• Impact of punctuation and other special characters
• Can we still guess passwords if we don’t take them in consideration?
• Acoustic encryptions
• Idea: randomize the sound slightly

Fabian’s project idea

End of part I.

Part II“Other Emanations”

MottoHow can some people have so many ideas?

Optical Time-Domain Eavesdroppings Risk of
CRT DisplaysMarkus G. Kuhn

Wim van Eck, “Electromagnetic Radiation from Video Display Units: An Eavesdropping Risk?” Computers & Security, 1985
Result: radio signal originating from a video display unit can be eavesdrop using a black and white TV receiver, a directional antenna and an antenna amplifier.

TV versus VDU
!"#$%
&'()*+%(",-."%(
/"($0'()
/"($0'()
/"($0'()
1+-2$0'()
/"($34 /"($35 /"($36/"($3475
8*".$39$:$9
;9-)439$:$9
TV signal
VDU signal
Optical intensity
Electron beam intensity

How it works
!"#$%&'()*&"+"',"&
!'-"&
./0
/'123"*#(4"((#
5.*&"+"',"&
67(+*&"+2,"&7*+'&+%'4
8%9:"&*2;$+&""(*3'("$
<29:'("=*$7(+>&2('?#4'2(*$')(#3$
@A2%41%4
.BA+>#(("3
/'$4#(+"
!#)("4'+3221*#(4"((#

Other attacks
• Projective observation with telescopes
• requirement: line of sight
• performance: a simple amateur astronomy telescope can be sufficient for reading the text from a computer display from up to 60 m under an angle less than 60 degrees.
• drawback: easy to defend against

A novel attack
• Time-domain observation of CRT light
• requirement: raster scan CRT
• performance: much powerful than the previous one
• drawback: CRT are no longer popular
But this is still way cool! :-)

Raster-Scan
• What does a raster-scan mean?
• horizontal and vertical frequencies are standardized
• light emitted by a CRT is a weighted average of the luminosity of the last few thousand pixels hit by the electron beam

Phosphor is a luminescent substance
Chemistry
green, blue, or white on a black background. Using both
short and long pulses provides the data necessary to char-
acterize very fast (tens of nanoseconds) as well as much
slower (millisecond) features. The signal timing used was
the VESA 640!480@85Hz video mode, in which the elec-tron beam traverses a 320 mm wide screen with 18 km/s.
The decay curves of zinc-sulfide based phosphors can
vary significantly under different drive conditions [16]. The
EIA standard for the characterization of CRT phosphor de-
cay times [11] therefore requires for measurements a fixed
beam current of 100 µA. Lacking the equipment to measuresuch a current directly at the high-voltage anode connection,
I simply used a default setting of monitor controls (100%
contrast, 50% brightness, color temperature 6500 K, mon-
itor powered up for at least 30 min) and the full intensity
color combinations that are most frequently used for text
display. The resulting luminosity measurement is therefore
with respect to a known video signal voltage, not a beam
current.
Placed 0.25 m in front of the center of the screen sur-
face with an aperture of 50 mm2, the photosensor, as seen
from a pixel, covered a solid angle of around 0.8 msr. The
oscilloscope that recorded the photosensor signal was trig-
gered from the vertical sync signal on pin 12 of the feature
connector of the driving VGA card. It recorded with 8-bit
resolution at a sampling rate of 5 GHz over 40 µs the single-pixel signal and with 125 MHz over 2 ms the 320-pixel line.
Averaging each signal over 256 frame repetitions reduced
noise.
4.3. Results
Taking into account the solid angle covered by the photo
sensor, its exact control voltage and resulting radiant sen-
sitivity, as well as the input impedance of the oscilloscope,
the recorded voltage can be converted into a radiant inten-
sity (power per solid angle). The radiant sensitivity used
is the one given in the sensor data sheet for 420 nm (blue)
and can vary for up to a factor of two for other wavelengths.
Because of this, and since no calibration source for radiant
intensity was available, the resulting absolute values should
only be seen as estimates. Figure 2 shows as an example
the measured light output of the blue phosphor as well as
the video input signal.
For further theoretical analysis as well as for optimizing
the processing of signals for best readability, it is helpful to
have a simple closed-form approximation of the phosphor
impulse response. I manually adjusted the coefficients and
number of terms in a sum of several exponential and power-
law decay functions until the convolution of the resulting
function with the video signal closely fitted the recorded
photosensor output on a number of linear, logarithmic and
double-logarithmic plots. This semi-manual fitting process
0 0.1 0.2 0.3 0.4 0.5
0
10
20
30
40
50
µs
µW
/sr
(a) Emission decay of a single pixel (fp = 36 MHz)
measurementmodelvideo signal
0 25 50 75 100
0
200
400
600
800
1000
µs
µW
/sr
(b) Emission decay of a 320!pixel line
Figure 2. Blue phosphor decaymeasurement.
led to compacter and more accurately fitting impulse re-
sponse functions than various parameter fitting algorithms
that I tried.
I ended up with the following closed form approximation
for the impulse response of the three phosphors:
PP22R(t) /W
V · s · sr =
4 ! e!2!t" 360 Hz + 1.75 ! e!2!t" 1.6 kHz +2 ! e!2!t" 8 kHz + 2.25 ! e!2!t" 25 kHz +15 ! e!2!t" 700 kHz + 29 ! e!2!t" 7 MHz (8)
7
Emission decay of a single pixel
Important property: after the electron beam hits a pixel the emitted light intensity reaches its maximum within a single pixel period.

Phosphor types
• P22 is the names gave to the entire class of phosphors designed for color TV.
• The Worldwide Type Designation System lists 7 different TV RBG phosphor types and more than 15 types developed for data-display applications.
The author’s question:Which one is used in a certain CRT?

CRTs
• Usually based on sulfides of zinc and cadmium.
• Decay of typical excited phosphorescent substances follows an exponential law.
• ... but Zinc-sulfide based phosphors have a power-law decay curve.
Implication: a CRT phosphorus decay will be a sum of several exponential and power-law curves.

Power law versus Exponential law
0
0.1
0.2
0.3
0.4
0.5
0.6
0.7
0.8
0.9
1
1e-09 1e-08 1e-07 1e-06 1e-05 0.0001 0.001 0.01
ExpPow

Power law versus Exponential law
0
0.2
0.4
0.6
0.8
1
1.2
1.4
1.6
1.8
1e-09 1e-08 1e-07 1e-06 1e-05 0.0001 0.001 0.01
Exp+Pow

Roadmap
• Find a way to measure the phosphor decay
• Build a model
• Demonstrate the attack
• Provide a threat analysis
• Look at countermeasures

How can we measure decay?
• Requires a very sensitive light sensor with a very fast reaction time (or less than 5 ns rise and fall time*)
• Candidates:
• PIN (positive-intrinsic-negative) photodiode
• avalanche photodiodes (APD)
• photomultipliers tube (PMT)
$ cat /var/log/XFree86.0.log | grep PixClock(II) I810(0): Ranges: V min: 50 V max: 160 Hz, H min: 30 H max: 96 kHz, PixClock max 210 MHz*

Our photomultiplier
• Packaged in a small robust enclosure
• can be operated from a 12V source
• radiant sensitivity can be adjusted using a 0.25-0.90V control signal
• rise time of 0.78ns
• max. output current is 100uA
• wavelength sensibility: 300-850nm
Since commonly used phosphors are mixtures of vari-
ous substances and different excitation modes occur (result-
ing in various wavelengths), actual decay curves have to be
modeled as the sum of several exponential and power-law
curves.
The TEP116-C standard provides decay curves for most
phosphor types, but these are plotted on a linear time scale
extending over many milliseconds. These curves give no in-
dication about the detailed decay during the first microsec-
ond and they are therefore not suitable for estimating the
frequency characteristic of the phosphors above 1 MHz.
The decay curves published in TEP116-C were measured
primarily to provide information about how the phosphor
type might affect the perceived flicker caused by the frame
refresh. Since suitable fast decay curves or even closed form
approximations were not available from the existing CRT
phosphor literature, I performed my own measurements on
a typical example monitor.
4.1. Instrumentation
We are primarily interested in the rapid decay within a
time interval not much longer than tp, therefore we need avery sensitive light sensor with, ideally, more than 100MHz
bandwidth or less than 5 ns rise and fall time.
One fast light sensor is the PIN photodiode in photocon-
ductive mode, in which a reverse bias voltage is applied and
the resulting current is measured. The PIN photodiode has
an undoped “intrinsic” layer between the p- and n-doped
regions (hence the name). Compared with normal photo-
diodes, PIN diodes have reduced capacity and can be used
with a higher bias voltage, which increases their response
time. For example, a PIN diode with a “rise and fall time
of about 20 µs” was used in [14] to evaluate the luminancedecay of the P31 phosphor in a CRT used in vision research.
Photodiodes are now available with down to 1 ns re-
sponse time for applications such as optical Gbit/s com-
munication links and laser range finding. However their
low sensitivity of typically 0.5 A/W makes significant ad-
ditional amplification necessary, which would lead to ad-
ditional noise and further limit the bandwidth. Avalanche
photodiodes (APDs) provide greater sensitivity (102 A/W)
and are also available with 1 ns response times.
Photomultiplier tubes (PMTs) are evacuated electron
tubes with a photocathode. Received photons can trigger
the emission of electrons, which are then accelerated with
high voltage and multiplied in a cascade of further elec-
trodes. A single received photon results in an entire cloud
of electrons hitting the anode, contributing to the measured
current. Photomultiplier tubes have response times in the
nanosecond range and their sensitivity can be adjusted eas-
ily over many orders of magnitude.
Figure 1. Photomultiplier tube module.
I used a Hamamatsu H6780-01 photosensor module
(Fig. 1), which can be operated with radiant sensitivity lev-
els in the 101–105 A/W range [15]. It can therefore be used
under a quite wide range of light conditions. This device
consists of a small robust metal package containing a pho-
tomultiplier tube and a high-voltage generating circuit. It
can be operated conveniently from a 12 V lab power sup-
ply. A separately applied 0.25–0.90 V control voltage Uc
adjusts the radiant sensitivity of the sensor to
1.5 ! 105 A/W ·!
Uc
1 V
"7.2
.
The radiant sensitivity is the quotient of the output current
generated by the sensor and the radiant energy received by
the sensor on its aperture (8 mm diameter). When oper-
ated within the specified parameters, a photomultiplier is
a highly linear light-controlled current source. To prevent
damage to the sensor, care must be taken to ensure that the
maximum allowed average output current of 100 µA is notexceeded, by selecting the control voltage appropriately.
According to the data sheet, the anode-current rise time
of the H6780 photomultiplier module is 0.78 ns, an order of
magnitude faster than the pixel time tp of commonly usedvideo modes. Its high sensitivity allowed me to connect it
directly to the 50 ! input of a digital storage oscilloscope
with a resolution of 40 µV.
4.2. Measurement method
In order to characterize phosphor response times, I used
several test video signals that showed either a single pixel or
a 320-pixel-long horizontal line, each in full intensity red,
6

Testing setup
• VESA (Video Electronics Standards Association) 640x480 at 85Hz
• Two video signals were used
• a single pixel
• a 320 pixel line
• Display settings: 100% contrast, 50% brightness, color temperature 6500K, power up at least 30 min.
• Photosensor is placed 0.25 meters in front of the the center of the display

Testing setup (cont)
• Oscilloscope is triggered from the vertical sync of the VGA connector.
• Oscilloscope settings: 8-bit resolution, averaging over 256 frames
• 5 GHz sampling rate for 40 us for single pixel
• 125 MHz sampling rate for 2 ms for the 320 pixel line

Observationsgreen, blue, or white on a black background. Using both
short and long pulses provides the data necessary to char-
acterize very fast (tens of nanoseconds) as well as much
slower (millisecond) features. The signal timing used was
the VESA 640!480@85Hz video mode, in which the elec-tron beam traverses a 320 mm wide screen with 18 km/s.
The decay curves of zinc-sulfide based phosphors can
vary significantly under different drive conditions [16]. The
EIA standard for the characterization of CRT phosphor de-
cay times [11] therefore requires for measurements a fixed
beam current of 100 µA. Lacking the equipment to measuresuch a current directly at the high-voltage anode connection,
I simply used a default setting of monitor controls (100%
contrast, 50% brightness, color temperature 6500 K, mon-
itor powered up for at least 30 min) and the full intensity
color combinations that are most frequently used for text
display. The resulting luminosity measurement is therefore
with respect to a known video signal voltage, not a beam
current.
Placed 0.25 m in front of the center of the screen sur-
face with an aperture of 50 mm2, the photosensor, as seen
from a pixel, covered a solid angle of around 0.8 msr. The
oscilloscope that recorded the photosensor signal was trig-
gered from the vertical sync signal on pin 12 of the feature
connector of the driving VGA card. It recorded with 8-bit
resolution at a sampling rate of 5 GHz over 40 µs the single-pixel signal and with 125 MHz over 2 ms the 320-pixel line.
Averaging each signal over 256 frame repetitions reduced
noise.
4.3. Results
Taking into account the solid angle covered by the photo
sensor, its exact control voltage and resulting radiant sen-
sitivity, as well as the input impedance of the oscilloscope,
the recorded voltage can be converted into a radiant inten-
sity (power per solid angle). The radiant sensitivity used
is the one given in the sensor data sheet for 420 nm (blue)
and can vary for up to a factor of two for other wavelengths.
Because of this, and since no calibration source for radiant
intensity was available, the resulting absolute values should
only be seen as estimates. Figure 2 shows as an example
the measured light output of the blue phosphor as well as
the video input signal.
For further theoretical analysis as well as for optimizing
the processing of signals for best readability, it is helpful to
have a simple closed-form approximation of the phosphor
impulse response. I manually adjusted the coefficients and
number of terms in a sum of several exponential and power-
law decay functions until the convolution of the resulting
function with the video signal closely fitted the recorded
photosensor output on a number of linear, logarithmic and
double-logarithmic plots. This semi-manual fitting process
0 0.1 0.2 0.3 0.4 0.5
0
10
20
30
40
50
µs
µW
/sr
(a) Emission decay of a single pixel (fp = 36 MHz)
measurementmodelvideo signal
0 25 50 75 100
0
200
400
600
800
1000
µs
µW
/sr
(b) Emission decay of a 320!pixel line
Figure 2. Blue phosphor decaymeasurement.
led to compacter and more accurately fitting impulse re-
sponse functions than various parameter fitting algorithms
that I tried.
I ended up with the following closed form approximation
for the impulse response of the three phosphors:
PP22R(t) /W
V · s · sr =
4 ! e!2!t" 360 Hz + 1.75 ! e!2!t" 1.6 kHz +2 ! e!2!t" 8 kHz + 2.25 ! e!2!t" 25 kHz +15 ! e!2!t" 700 kHz + 29 ! e!2!t" 7 MHz (8)
7
green, blue, or white on a black background. Using both
short and long pulses provides the data necessary to char-
acterize very fast (tens of nanoseconds) as well as much
slower (millisecond) features. The signal timing used was
the VESA 640!480@85Hz video mode, in which the elec-tron beam traverses a 320 mm wide screen with 18 km/s.
The decay curves of zinc-sulfide based phosphors can
vary significantly under different drive conditions [16]. The
EIA standard for the characterization of CRT phosphor de-
cay times [11] therefore requires for measurements a fixed
beam current of 100 µA. Lacking the equipment to measuresuch a current directly at the high-voltage anode connection,
I simply used a default setting of monitor controls (100%
contrast, 50% brightness, color temperature 6500 K, mon-
itor powered up for at least 30 min) and the full intensity
color combinations that are most frequently used for text
display. The resulting luminosity measurement is therefore
with respect to a known video signal voltage, not a beam
current.
Placed 0.25 m in front of the center of the screen sur-
face with an aperture of 50 mm2, the photosensor, as seen
from a pixel, covered a solid angle of around 0.8 msr. The
oscilloscope that recorded the photosensor signal was trig-
gered from the vertical sync signal on pin 12 of the feature
connector of the driving VGA card. It recorded with 8-bit
resolution at a sampling rate of 5 GHz over 40 µs the single-pixel signal and with 125 MHz over 2 ms the 320-pixel line.
Averaging each signal over 256 frame repetitions reduced
noise.
4.3. Results
Taking into account the solid angle covered by the photo
sensor, its exact control voltage and resulting radiant sen-
sitivity, as well as the input impedance of the oscilloscope,
the recorded voltage can be converted into a radiant inten-
sity (power per solid angle). The radiant sensitivity used
is the one given in the sensor data sheet for 420 nm (blue)
and can vary for up to a factor of two for other wavelengths.
Because of this, and since no calibration source for radiant
intensity was available, the resulting absolute values should
only be seen as estimates. Figure 2 shows as an example
the measured light output of the blue phosphor as well as
the video input signal.
For further theoretical analysis as well as for optimizing
the processing of signals for best readability, it is helpful to
have a simple closed-form approximation of the phosphor
impulse response. I manually adjusted the coefficients and
number of terms in a sum of several exponential and power-
law decay functions until the convolution of the resulting
function with the video signal closely fitted the recorded
photosensor output on a number of linear, logarithmic and
double-logarithmic plots. This semi-manual fitting process
0 0.1 0.2 0.3 0.4 0.5
0
10
20
30
40
50
µs
µW
/sr
(a) Emission decay of a single pixel (fp = 36 MHz)
measurementmodelvideo signal
0 25 50 75 100
0
200
400
600
800
1000
µsµ
W/s
r
(b) Emission decay of a 320!pixel line
Figure 2. Blue phosphor decaymeasurement.
led to compacter and more accurately fitting impulse re-
sponse functions than various parameter fitting algorithms
that I tried.
I ended up with the following closed form approximation
for the impulse response of the three phosphors:
PP22R(t) /W
V · s · sr =
4 ! e!2!t" 360 Hz + 1.75 ! e!2!t" 1.6 kHz +2 ! e!2!t" 8 kHz + 2.25 ! e!2!t" 25 kHz +15 ! e!2!t" 700 kHz + 29 ! e!2!t" 7 MHz (8)
7
Why are we interested in this graphs?
We need to model this behavior!

The Model
green, blue, or white on a black background. Using both
short and long pulses provides the data necessary to char-
acterize very fast (tens of nanoseconds) as well as much
slower (millisecond) features. The signal timing used was
the VESA 640!480@85Hz video mode, in which the elec-tron beam traverses a 320 mm wide screen with 18 km/s.
The decay curves of zinc-sulfide based phosphors can
vary significantly under different drive conditions [16]. The
EIA standard for the characterization of CRT phosphor de-
cay times [11] therefore requires for measurements a fixed
beam current of 100 µA. Lacking the equipment to measuresuch a current directly at the high-voltage anode connection,
I simply used a default setting of monitor controls (100%
contrast, 50% brightness, color temperature 6500 K, mon-
itor powered up for at least 30 min) and the full intensity
color combinations that are most frequently used for text
display. The resulting luminosity measurement is therefore
with respect to a known video signal voltage, not a beam
current.
Placed 0.25 m in front of the center of the screen sur-
face with an aperture of 50 mm2, the photosensor, as seen
from a pixel, covered a solid angle of around 0.8 msr. The
oscilloscope that recorded the photosensor signal was trig-
gered from the vertical sync signal on pin 12 of the feature
connector of the driving VGA card. It recorded with 8-bit
resolution at a sampling rate of 5 GHz over 40 µs the single-pixel signal and with 125 MHz over 2 ms the 320-pixel line.
Averaging each signal over 256 frame repetitions reduced
noise.
4.3. Results
Taking into account the solid angle covered by the photo
sensor, its exact control voltage and resulting radiant sen-
sitivity, as well as the input impedance of the oscilloscope,
the recorded voltage can be converted into a radiant inten-
sity (power per solid angle). The radiant sensitivity used
is the one given in the sensor data sheet for 420 nm (blue)
and can vary for up to a factor of two for other wavelengths.
Because of this, and since no calibration source for radiant
intensity was available, the resulting absolute values should
only be seen as estimates. Figure 2 shows as an example
the measured light output of the blue phosphor as well as
the video input signal.
For further theoretical analysis as well as for optimizing
the processing of signals for best readability, it is helpful to
have a simple closed-form approximation of the phosphor
impulse response. I manually adjusted the coefficients and
number of terms in a sum of several exponential and power-
law decay functions until the convolution of the resulting
function with the video signal closely fitted the recorded
photosensor output on a number of linear, logarithmic and
double-logarithmic plots. This semi-manual fitting process
0 0.1 0.2 0.3 0.4 0.5
0
10
20
30
40
50
µs
µW
/sr
(a) Emission decay of a single pixel (fp = 36 MHz)
measurementmodelvideo signal
0 25 50 75 100
0
200
400
600
800
1000
µs
µW
/sr
(b) Emission decay of a 320!pixel line
Figure 2. Blue phosphor decaymeasurement.
led to compacter and more accurately fitting impulse re-
sponse functions than various parameter fitting algorithms
that I tried.
I ended up with the following closed form approximation
for the impulse response of the three phosphors:
PP22R(t) /W
V · s · sr =
4 ! e!2!t" 360 Hz + 1.75 ! e!2!t" 1.6 kHz +2 ! e!2!t" 8 kHz + 2.25 ! e!2!t" 25 kHz +15 ! e!2!t" 700 kHz + 29 ! e!2!t" 7 MHz (8)
7
10!9
10!8
10!7
10!6
10!5
10!4
10!3
10!2
10!1
100
101
102
103
s
WV!1s!1sr!1
whitebluegreenred
Figure 3. The numeric model of the measured P22 phosphor impulse response.
PP22G(t) /W
V · s · sr =
210 ! 10!6 !!
t + 5.5 µs1 s
"!1.1
+
37 ! e!2!t" 150 kHz +100 ! e!2!t" 700 kHz + 90 ! e!2!t" 5 MHz (9)
PP22B(t) /W
V · s · sr =
190 ! 10!6 !!
t + 5 µs1 s
"!1.11
+
75 ! e!2!t" 100 kHz +1000 ! e!2!t" 1.1 MHz +1100 ! e!2!t" 4 MHz (10)
PP22 = PP22R + PP22G + PP22B (11)
After convolution with the 1 V video signal according
to (3) and a delay of 29 ns (transmission times in electron
tubes and signal cables), these impulse response functions
lead to the excellently matching dashed lines in Fig. 2.
All three phosphors show a very noticeable relative drop
of radiant intensity in the first tenth of a microsecond. Fig-
ure 3 shows that of all three phosphors, the blue one has
with"1500 W/(V ·s ·sr) by far the largest drop in absoluteintensity in the first 100 ns and therefore will provide the
strongest high-frequency signal, while the red phosphor has
with "34 W/(V · s · sr) the smallest absolute drop.The Fourier transforms of the impulse response curves in
Fig. 5 show that the blue phosphor applies to the video sig-
nal a low-pass filter in which for example a 10 MHz compo-
nent is less than 40 dB more attenuated than a 1 kHz signal.
Only for frequencies above around 5–10 MHz, the phos-
phors show the continuous 20 dB per decade roll-off typical
for a first order low-pass filter.
Figure 4 shows as continuous lines the impulse response
curves on a logarithmic time scale. Their amplitudes have
been normalized to P (0) = 1 in this representation in or-der to make the curve forms more comparable. The dashed
lines represent the integrals of the decay functions and show
which fraction of the totally emitted energy after stimula-
tion ceased has already been given off at any point in time.
The red phosphor, which decays purely exponentially,
emits practically all of its stored energy within 1–2 ms, but
it still has not lost a significant part of its energy within the
first 10 µs. The blue and green phosphors show a far moreheavy-tailed behavior, thanks to the power-law component
in their impulse response. Even long after the stimulus, they
still have not emitted all of their stored energy and as a re-
sult, even an unaided human observer with fully adapted
scotopic vision can notice an afterglow on a CRT screen in
an otherwise completely dark room for several minutes.
It might be worth noting that the integral of PP22G(t)shows even hours after the excitation some unreleased en-
ergy in this phosphor type. Although this measurement was
not designed to estimate the here significant parameter !
8
“I manually adjusted the coefficients and number of terms in a sum of several exponential and power-law decay functions until the convolution of the resulting function with the video signal closely fitted the recorded photosensor output on a number of linear, logarithmic and double-logarithmic plots.”

Normalized linear intensity
10!9
10!8
10!7
10!6
10!5
10!4
10!3
10!2
0
0.1
0.2
0.3
0.4
0.5
0.6
0.7
0.8
0.9
1
s
greenbluered
Figure 4. Normalized linear intensity impulse response curves and corresponding integrals (dashed).
in (6) with good accuracy, this observation still leads to the
question whether CRT phosphors could leak confidential in-
formation not only via instantaneous compromising emana-
tion, but also via data remanence.
5. Optical eavesdropping demonstration
Perhaps more interesting than a theoretical discussion of
phosphor decay frequency characteristics is a visually con-
vincing actual reconstruction of a displayed image from an
out-of-sight CRT surface.
In the following experiment, the same monitor (Dell
D1025HE) faces a white office wall at around a meter dis-
tance. The photomultiplier is now located behind the mon-
itor, facing the same wall at around 1.5 m distance. There
is no direct line of sight between the sensor and the screen
surface.
As the wall illuminated by the monitor covers a large
solid angle as seen from the photosensor, no additional op-
tical elements such as a focusing lens are needed in this
demonstration. The experiment was performed at night with
the room lights switched off, however the room was far
from completely dark, being illuminated by several com-
puter displays and stray light from outside lamps.
Figure 6 shows a simple readability test chart with text
in various sizes, which the monitor displayed as the tar-
get video signal during the test. This test image was dis-
played in the same video mode as before (VESA 640 !480@85Hz). The text is in full white on black, and ad-ditional test letters show all full intensity combinations of
the three phosphor colors. The oscilloscope averaged 256
frames (or equivalently 3 s of signal) at a sampling fre-
quency of 250 MHz. (These exact parameters are not crit-
ical and quite acceptable readability of small text can also
be achieved with lower sampling rates and numbers of av-
eraged frames as well as higher video modes.)
Figure 7 shows the recorded and averaged photocurrent
as a gray-scale image, much like a monitor driven with ap-
propriate sync pulses would present it. The largest font sizes
are readable, though the slow decay smears the luminos-
ity of each white pixel along the path of the electron beam
across the rest of the line and further. The gray values of
all the rastered signals shown here were adjusted such that
the values of the 0.1% highest and 0.1% lowest pixels in a
histogram are all mapped to full white or full dark respec-
tively, and the remaining values are linearly mapped to the
corresponding points on a gray scale.
The raw photomultiplier current in Fig. 7 clearly has to
be processed further in order to make text readable. Ana-
log preprocessing has the advantage that it can improve sig-
nificantly the signal-to-noise ratio before any amplification
and quantization steps limit the dynamic range of the sig-
9
Dashed lines shows which fraction of the totally emitted has already been given off at any points in time.

Insights
• Red phosphor emits almost all of its stored energy within 1-2 ms but it still had not lost a significant part of its energy within the first 10 us.
• Blue and green are far more heavy-tailed (due to power law).
• Green has not released all its energy even hours after the excitation is over!

Show me the money!
• Setup: at night in a regular office with several desktop computers and stray light from outside lamps.
• The display faces a white office wall located at around a meter distance.
• The photomultiplier is located behind the monitor, facing the wall at around 1.5 m from the wall.
• Oscilloscope setings:
• sample frequency of 250 MHz
• average of 256 frames.

Test chart
READ THIS?
CAN YOU
RGM
Y
B WC
B
This image was captured
with the help of a light sensor
from the high!frequency fluctuations in the
light emitted by a cathode!ray tube computer monitor
which I picked up as a diffuse reflection from a nearby wall.
Markus Kuhn, University of Cambridge, Computer Laboratory, 2001
Figure 6. Testchart displayed on the target monitor in VESA 640x480@85Hz video mode.
Figure 7. Unprocessed photomultiplier output signal after diffuse reflection from a wall.
11
VESA 640x480 at 85Hz

Photomultiplier output
READ THIS?
CAN YOU
RGM
Y
B WC
B
This image was captured
with the help of a light sensor
from the high!frequency fluctuations in the
light emitted by a cathode!ray tube computer monitor
which I picked up as a diffuse reflection from a nearby wall.
Markus Kuhn, University of Cambridge, Computer Laboratory, 2001
Figure 6. Testchart displayed on the target monitor in VESA 640x480@85Hz video mode.
Figure 7. Unprocessed photomultiplier output signal after diffuse reflection from a wall.
11
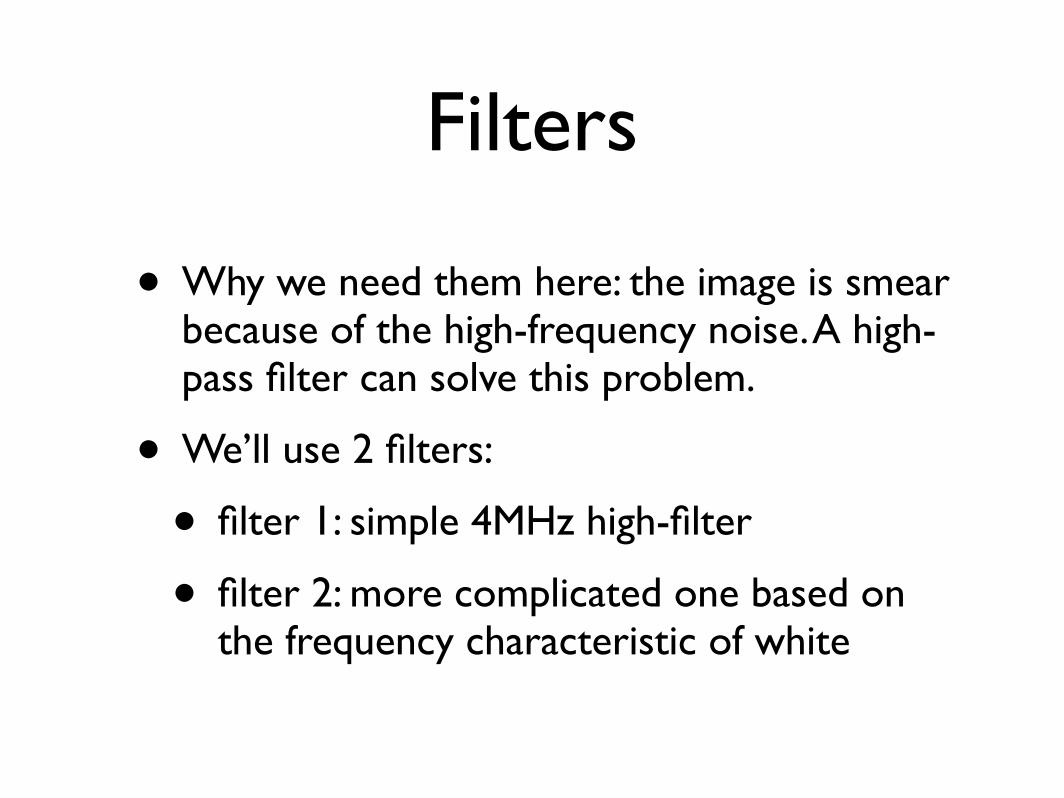
Filters
• Why we need them here: the image is smear because of the high-frequency noise. A high-pass filter can solve this problem.
• We’ll use 2 filters:
• filter 1: simple 4MHz high-filter
• filter 2: more complicated one based on the frequency characteristic of white

... after a 4 MHz high-pass filter
Figure 8. Signal from Fig. 7 after application of a 4 MHz Butterworth high-pass filter.
Figure 9. Signal from Fig. 7 after application of a matched deconvolution filter (inverse frequencycharacteristic to that of white shown in Fig. 5).
12

... after the second filterFigure 8. Signal from Fig. 7 after application of a 4 MHz Butterworth high-pass filter.
Figure 9. Signal from Fig. 7 after application of a matched deconvolution filter (inverse frequencycharacteristic to that of white shown in Fig. 5).
12
NoRED!

Threat analysis
• Two cases:
• Direct observation
• Indirect observation
• A simplification: screen, wall and the display are all roughly parallel

Direct observation
• We are interesting in the relations between the aperture of a telescope and the distance to the screen.
• Essentially we look when the signal-to-noise ratio is greater than 1.
Practical results: for a well-lit office a simple telescope can receive the signal up to 80m.

Indirect observation
• This time we also need to consider the distance (d!) from the CRT to the wall.
• Again we look at the a signal-to-noise ratio greater than 1.
Practical results: for a “late twilight” office and a d!=2m, a simple telescope can receive the signal up to 50m. For full day the required distance is less than 1m.

Optimizations
• The main limitation is the light from unwanted sources.
• A way to fight against it is to take in consideration the wavelength of the phosphors. Green and blue have a bell-shape distribution while red has several narrower lines.
• Color filters or a spectrometer can help in separate the contribution of each type of phosphors.

Countermeasures
• Displays should be kept out of line of sight of a potential eavesdropper.
• Reflected light should also be considerate as potentially compromising emanation.
• Jamming:
• broad background light (solar, incandescent or fluorescent lights with emissions closer to the one produced by phosphors)
• monitors could be enhanced to detect compromising low ambient light
• better specs of the CRT phosphors to guide selection for builders of secure CRTs.

Electromagnetic Eavesdropping Risks of
Flat-Panel DisplaysMarkus G. Kuhn

Status
• Wim van Eck was right in 1986 but since then new grounding and shielding regulations became standard.
• The previous described attack is not feasible for LCDs because they are much slower and update a line a time.
• But digital signaling (DVI for example) is also becoming prevalent.

Where is the threat?
• LCD can only buffer a small number of pixels.
• Therefore the image need to be continuously refreshed.
• Any periodic signal has a frequency spectrum that consists of narrow lines.
• Although the signals are baseband we can still pick them up at higher frequencies.

How we can attack?
• Theoretically is easy: just as van Win we just need an antenna, an amplifier and a recording device (oscilloscope).
• More complicated in practice:
• we need to be able to search for a freq. range with good signal-to-noise ratio
• a way to do this is using an AM receiver to shift the band to a known one and then us a RF bandpass filter.

Main Actor
• AM receiver: Dynamic Sciences R1250
• Meets the confidential requirement of TEMPEST
• Google returns 71 hits for its name... only two relevant, both from Markus F. Kuhn homepage
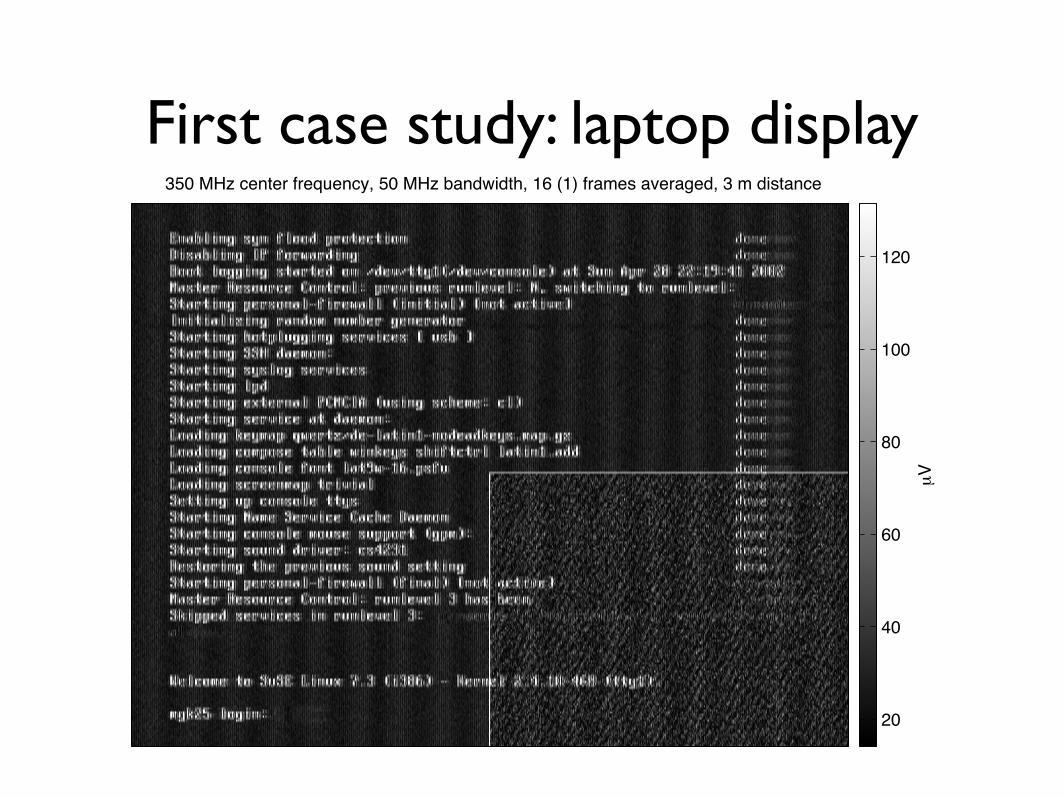
First case study: laptop display6 Markus G. Kuhn
350 MHz center frequency, 50 MHz bandwidth, 16 (1) frames averaged, 3 m distance
µV
20
40
60
80
100
120
magnified image section
µV
20
40
60
80
100
120
Fig. 1. Eavesdropped Linux boot screen visible on the LCD of a Toshiba 440CDXlaptop (log-periodic antenna, vertical polarization).
amplitude were somehow related to the binary representation of the pixelvalue.
– Using a simple improvised near-field probe (a coaxial cable whose ends areshaped into a 50 mm dipole) instead of an antenna, to scan the immediatevicinity of the laptop, it became clear that no significant emissions came fromthe display module itself, but that the source appeared to be the interconnectcable between the LCD module and the mainboard.

Detail
6 Markus G. Kuhn
350 MHz center frequency, 50 MHz bandwidth, 16 (1) frames averaged, 3 m distance
µV
20
40
60
80
100
120
magnified image section
µV
20
40
60
80
100
120
Fig. 1. Eavesdropped Linux boot screen visible on the LCD of a Toshiba 440CDXlaptop (log-periodic antenna, vertical polarization).
amplitude were somehow related to the binary representation of the pixelvalue.
– Using a simple improvised near-field probe (a coaxial cable whose ends areshaped into a 50 mm dipole) instead of an antenna, to scan the immediatevicinity of the laptop, it became clear that no significant emissions came fromthe display module itself, but that the source appeared to be the interconnectcable between the LCD module and the mainboard.

Why is this possible?
• The link between the video card and the display is done via 8 twisted pairs, each about 30 cm long.
• The encoding uses is LVDS (low voltage differential signaling) which is designed to minimize RF interference but not to be resistant to eavesdropping.

How bad can it be?10 m distance, two office away (3 plasterboard walls)
8 Markus G. Kuhn
75.557 75.558 75.559 75.56 75.561 75.562 75.563 75.564 75.565 75.566 75.5670
0.02
0.04
0.06
0.08
0.1
0.12
0.14
0.16
75.562372 Hz
75.561531 Hz
75.562880 Hz
fv/Hz
Fig. 2. Determination of the frame rate fv for the multi-frame signal recorded inFig. 3 through crosscorrelation between the first and last frame in the recordedseries.
350 MHz, 50 MHz BW, 12 frames (160 ms) averaged
µV
10
12
14
16
18
20
22
Fig. 3. Text signal received from a 440CDX laptop at 10 m distance throughtwo intermediate o!ces (3 plasterboard walls).

Good news: we can try to hide
10 Markus G. Kuhn
foreground backgroundline description RGB signal RGB signal1 black on white 00 00 00 000000x
0x00000xxx0000
ff ff ff 111111X1X11111xxx1111
2 maximum contrast a8 50 a0 010101x0x01010xxx1010
00 00 00 000000x0x00000xxx0000
3 maximum contrast(gray)
a8 a8 a8 010101x1x10101xxx1010
00 00 00 000000x0x00000xxx0000
4 minimum contrast 78 00 00 001111x0x00000xxx0000
00 f0 00 000000x0x11110xxx0000
5 minimum contrast 78 60 00 001111x0x01100xxx0000
30 f0 00 000110x0x11110xxx0000
6 minimum contrast(phase shift)
70 70 00 001110x0x01110xxx0000
38 e0 00 000111x0x11100xxx0000
7 text in most significantbit, rest random
— r1rrrrxrx1rrrrxxx1rrr
— r0rrrrxrx0rrrrxxx0rrr
8 text in green two msb,rest random
— rrrrrrxrx11rrrxxxrrrr
— rrrrrrxrx00rrrxxxrrrr
9 text in green msb, restrandom
— rrrrrrxrx1rrrrxxxrrrr
— rrrrrrxrx0rrrrxxxrrrr
Fig. 5. Test text to compare the emission characteristics of selected foregroundand background color combinations.
Electromagnetic Eavesdropping Risks of Flat-Panel Displays 11
350 MHz center frequency, 50 MHz bandwidth, 16 frames averaged, 3 m distance
µV
20
40
60
80
100
120
140
285 MHz center frequency, 50 MHz bandwidth, 16 frames averaged, 3 m distance
µV
30
40
50
60
70
80
90
100
Fig. 6. Signals received from the test display in Fig. 5.
contrast and readability for the eavesdropper. Line 3 attempts the same, butmaximizes the visible contrast in favor of having identical signal polarity onall three lines for the foreground pixels. (In a symmetric transmission channel,signal polarity should in principle not make a di!erence for an eavesdropper.)
Line 4 is a first attempt to find a combination of two colors whose radiosignature is di"cult to distinguish under the assumption that the eavesdroppercan evaluate only the total number of bit transitions that happen on all channelstogether. The idea is to let bit transitions always happen at the same time duringthe cycle, but in di!erent channels.
Line 5 is a variant that keeps even the total number of transitions in eachline constant and line 6 keeps in addition the length of positive pulses constantand encodes the di!erence between foreground and background color only as aone-bit phase shift in two of the channels.
The last three lines finally demonstrate what happens if most of the bits arefilled randomly, in order to jam the eavesdropper’s periodic averaging process

Even better... for DVI
• There are two optional extensions that could reduce the signal leak:
• selective refresh
• High-bandwidth Digital Content Protection

Acoustic cryptanalysisAdi Shamir Eran Tromer
http://www.wisdom.weizmann.ac.il/~tromer/acoustic/

Crazy (but cool) idea
• “... on most computers, each type of operations has an acoustic signature -- a characteristic sound.”
• What they prove:
• HLT instruction is very easy to detect
• some operations have significant different sound pattern

Setup
Røde NT3 condenser microphone US$170
Alto S-6 mixer US$55
Creative Labs Audigy 2 sound card US$70
Baudline signal analysis softwarefree
binary
Intel Celeron 666Mhz

The sound of GnuPG RSA signatures
one RSA signature
mod p
mod q
}

But...
• The authors haven’t publish yet any paper why it really does or doesn’t work.
• A possible reason: if the signal-to-noise is high enough it will not be possible to recover enough information to mount an attack that compromise the security.

The End.