K aletra BID vs L EXIVA BID, Both with E PIVIR and A bacavir QD, in ART- N aïve Patients: The KLEAN...
20
Kaletra BID vs LEXIVA BID, Both with EPIVIR and Abacavir QD, in ART-Naïve Patients: The KLEAN Study Joseph J. Eron, Jr., MD Professor of Medicine, University of North Carolina Chapel Hill, NC
-
Upload
matthew-clark -
Category
Documents
-
view
214 -
download
0
Transcript of K aletra BID vs L EXIVA BID, Both with E PIVIR and A bacavir QD, in ART- N aïve Patients: The KLEAN...

Kaletra BID vs LEXIVA BID, Both with EPIVIR and Abacavir QD, in
ART-Naïve Patients: The KLEAN Study
Joseph J. Eron, Jr., MDProfessor of Medicine, University of North Carolina
Chapel Hill, NC

AcknowledgementsAustriaA RiegerH M Schalk
BelgiumN ClumeckJ C LegrandJ C SchmitD VogelaersE Van Wijngaerden
CanadaJ G BarilH DionJ GillK GoughD KilbyK LogueA RachlisS Walmsley
FranceJ F BergmannJ F DelfraissyC KatlamaM A Khuong JossesJ M LivrozetJ M RagnaudD Salmon CeronD SereniC TrepoG P Yeni
Investigators:
GermanyW BeckerB KuhlmannA PlettenbergK ScheweL SchneiderD SchuermannS Staszewski
ItalyA CapettiG Di PerriA LazzarinM MoroniP OrtolaniG RizzardiniL Sighinolfi
LatviaB Rozentale
PolandA Boron-KaczmarskaA GladyszW Halota
PortugalJ Vera
RomaniaD DuiculescuL J PrisecariuS RuginaA Streinu-Cercel
SpainC BarrosB ClotetD DalmauP DomingoV EstradaM J GalindoF GutierrezH KnobelL López CortesM MarquezA OcampoJ M PeňaM J Perez EliasD PodzanczerF Pulido
M RieraR Rubio
SwitzerlandE BernasconiM OpravilR PisoP Vernazza
United StatesB AkilD AlvarezC AneziokoroR BarnesJ BarrettN Bellos
Study Participants
StudyCoordinators
GlaxoSmithKlineA CameronS GoodingM ShaeferD Sutherland-PhillipsP TabonaC VavroP WannamakerL YauV GarayS ChriscoeJ YeoMB WireC GarrisL Patel
D BergerM BochanJ BrandR BrennanS BrownA BurnsideM ByersW CauseyJ CollinsP CookT CooleyR CoralesE DeJesusJ DugganJ EronM FischlJ FlammG Frechette
J GatheE GodofskyM GoldmanS GreenR GreenbergP KumarA LaMarcaP LackeyC LucastiC McDonaldP McLerothJ MobleyK Mounzer
R MyersJ NadlerR NahassJ NarroD NorrisD ParksR PobleteB RashbaumJ RodriguezG SimonL SlaterL SloanR SpitzerR SteigbigelD SteinK TashimaN ThielmanM ThompsonL ThorntonG TownsendJ UyW WeinbergM WeinertB YangcoB Young
Background
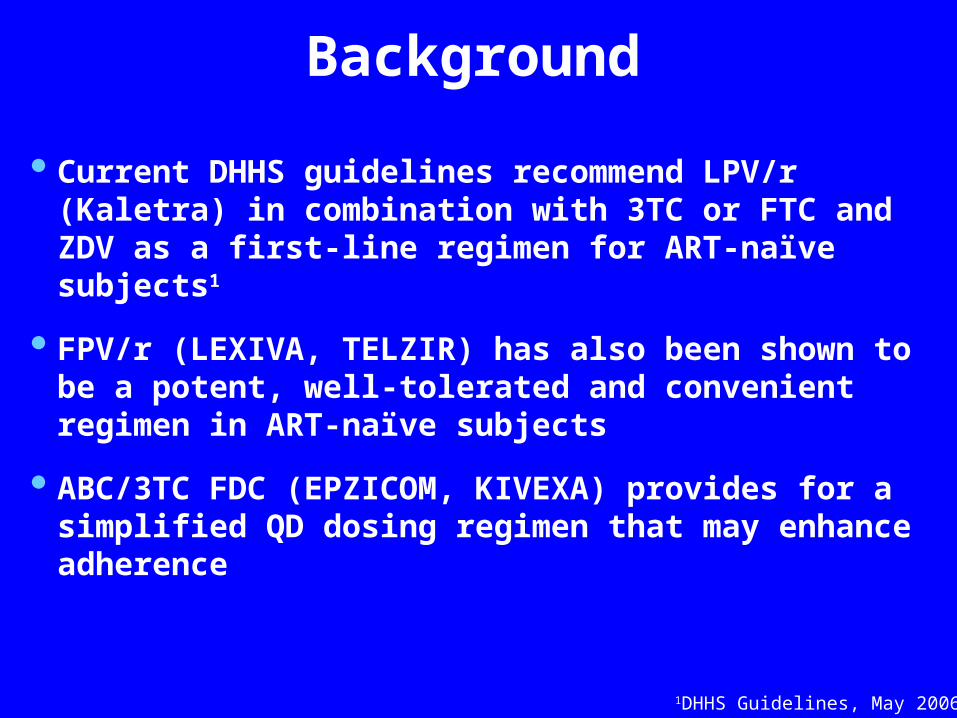
Current DHHS guidelines recommend LPV/r (Kaletra) in combination with 3TC or FTC and ZDV as a first-line regimen for ART-naïve subjects1
FPV/r (LEXIVA, TELZIR) has also been shown to be a potent, well-tolerated and convenient regimen in ART-naïve subjects
ABC/3TC FDC (EPZICOM, KIVEXA) provides for a simplified QD dosing regimen that may enhance adherence
1DHHS Guidelines, May 2006.

Study DesignPhase IIIb, randomized (1:1), open-label, 48 week study conducted at 131 sites in the US, Europe, and Canada
•Entry criteria: HIV-1 RNA 1000 c/mL No CD4 cell count restrictions
•Stratified by entry HIV-1 RNA <100,000 c/mL or 100,000 c/mL
•KLEAN had 90% power to detect non-inferiority of FPV/r to LPV/r within a 12% difference
ART-naïve subjects
FPV/r 700mg/100mg BID + ABC/3TC
(600mg/300mg) FDC QD n=434
LPV/r 400mg/100mg BID + ABC/3TC
(600mg/300mg) FDC QD n=444
Loss of Virologic Response
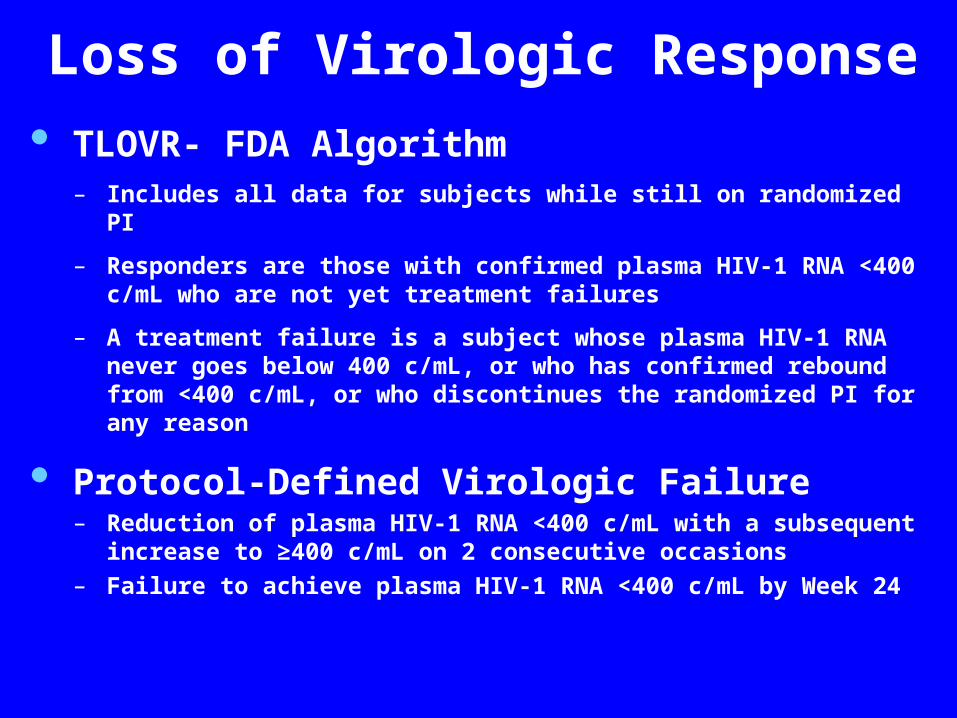
TLOVR- FDA Algorithm – Includes all data for subjects while still on randomized PI
– Responders are those with confirmed plasma HIV-1 RNA <400 c/mL who are not yet treatment failures
– A treatment failure is a subject whose plasma HIV-1 RNA never goes below 400 c/mL, or who has confirmed rebound from <400 c/mL, or who discontinues the randomized PI for any reason
Protocol-Defined Virologic Failure– Reduction of plasma HIV-1 RNA <400 c/mL with a subsequent
increase to ≥400 c/mL on 2 consecutive occasions– Failure to achieve plasma HIV-1 RNA <400 c/mL by Week 24
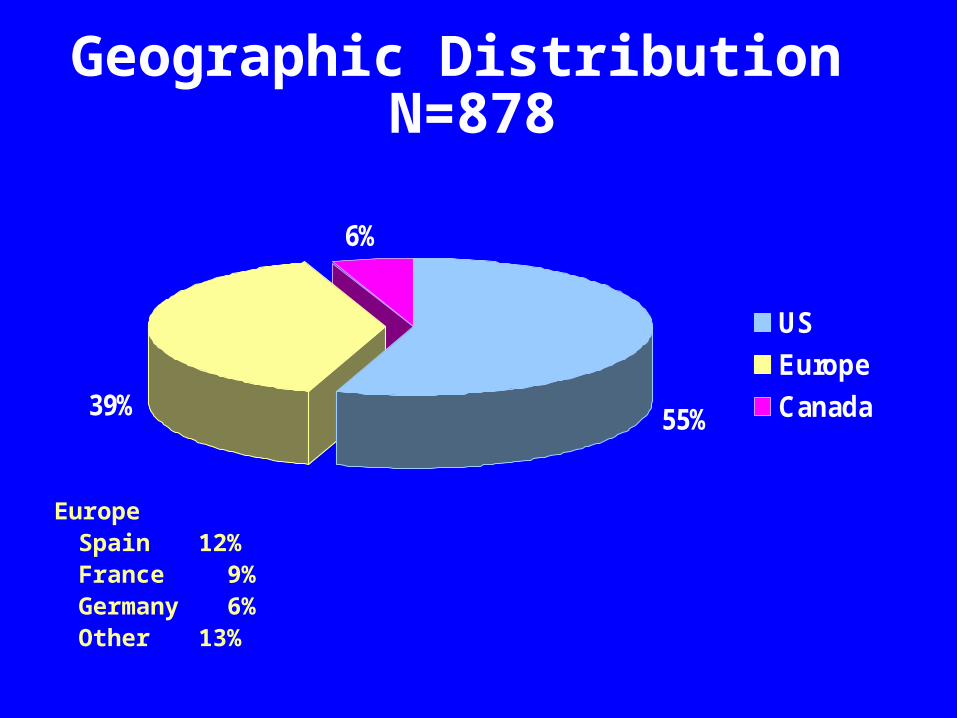
55%39%
6%
US
Europe
Canada
Geographic Distribution N=878
EuropeSpain 12% France 9%Germany 6%Other 13%

Baseline Demographics FPV/r LPV/r Total(N=434) (N=444) (N=878)
Median age, years 38 37 38
Female 22% 22% 22%
Racial DistributionCaucasian 61% 56% 58%Black 29% 33% 31%American Hispanic 7% 9% 8%
Other 3% 2% 3%
CDC Class C 42 (10%) 53 (12%) 95 (11%)
HepatitisHep B Positive 17 ( 4%) 14 (3%) 31 ( 4%)Hep C Positive 50 (12%) 40 (9%) 90 (10%)Hep B & C Positive 3 (<1%) 2 (<1%) 5 (<1%)

Baseline Characteristics
FPV/r LPV/r Totaln (%) (N=434) (N=444) (N=878)
Median HIV-1 RNA, log10 c/mL 5.08 5.06 5.07
HIV-1 RNA <100,000 c/mL 197 (45%) 209 (47%) 406 (46%)
HIV-1 RNA 100,000 c/mL 237 (55%) 235 (53%) 472 (54%)
Median CD4 count, cells/mm3 188 194 192
<50 cells/mm3 67 (15%) 80 (18%) 147 (17%)
50 - <200 cells/mm3 163 (38%) 152 (34%) 315 (36%)
200 cells/mm3 204 (47%) 212 (48%) 416 (47%)

Study Outcomes
TLOVR (HIV-1 RNA <400 c/mL) FPV/r
(N=434) LPV/r
(N=444)
Responder through Week 48 315 (73%) 317 (71%)
Virologic Non-responders 26 ( 6%) 30 ( 7%)
Discontinuations 93 (21%) 97 (22%) Lost to follow-up 20 ( 5%) 31 ( 7%)
Adverse event 23 ( 5%) 24 ( 5%)
Subject decision 16 ( 4%) 8 ( 2%)
Non-compliance 13 ( 3%) 8 ( 2%)
No data at week 48 or beyond 6 ( 1%) 12 ( 3%)
Other 6 ( 1%) 8 ( 2%)
Pregnancy 4 (<1%) 2 (<1%)
Death 3 (<1%) 1 (<1%)
Protocol violation 2 (<1%) 2 (<1%)
Insufficient viral load response 0 1 (<1%)

0
20
40
60
80
100
0 8 16 24 32 40 48
Study Week
Pro
po
rtio
n o
f S
ub
ject
s
FPV/r, TLOVRLPV/r, TLOVRFPV/r, ObservedLPV/r, Observed
9697
7371
Virologic Response HIV-1 RNA <400 c/mL
n (obs)
FPV/r = 434 399 387 375 358 340 328
LPV/r = 444 408 396 389 371 359 341

HIV-1 RNA <400 c/mL at Week 48
73 71
0
20
40
60
80
100
FPV/r BID LPV/r BID
TLOVR
Pro
po
rtio
n o
f S
ub
ject
s
Stratified 95% CI: (-4.84, 7.05)
FPV/r n = 434
LPV/r n = 444

HIV-1 RNA <400 c/mL at Week 48
73 71 70 6975 73
7074 74
7073 72
0
20
40
60
80
100
FPV/r BID LPV/r BID
TLOVR HIV-1 RNA <100,000 c/mL
HIV-1 RNA ≥100,000 c/mL
CD4+ <50 cells/mm3
CD4+ 50-199 cells/mm3
CD4+ ≥200 cells/mm3
Pro
po
rtio
n o
f S
ub
ject
s
FPV/r n = 434 197 237 67 163 204
LPV/r n = 444 209 235 80 152 212

HIV-1 RNA <50 c/mL at Week 48
66 65 67 64 65 6663
7066
6367 64
0
20
40
60
80
100
FPV/r BID LPV/r BID
TLOVR HIV-1 RNA <100,000 c/mL
HIV-1 RNA ≥100,000 c/mL
CD4+ <50 cells/mm3
CD4+ 50-199 cells/mm3
CD4+ ≥200 cells/mm3
Pro
po
rtio
n o
f S
ub
ject
s
FPV/r n = 434 197 237 67 163 204
LPV/r n = 444 209 235 80 152 212

0
50
100
150
200
250
300
0 8 16 24 32 40 48
Study Week
Med
ian
Ch
ang
e fr
om
Bas
elin
e,
cell
s/m
m3
FPV/r LPV/r
176191
Change from Baseline in CD4+ Cell Count (ITT-E, Obs)
Median CD4+, 188 375 cells/mm3 194 397
n (obs) FPV/r = 434 395 381 371 357 337 323 LPV/r = 444 401 394 388 368 355 336
IQR
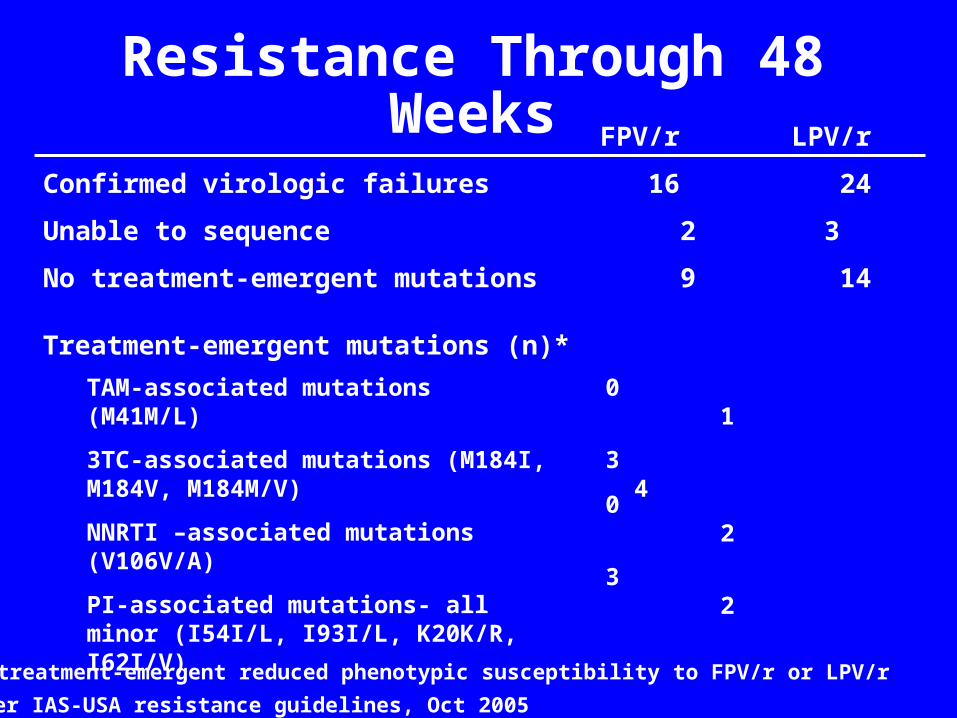
Resistance Through 48 Weeks FPV/r LPV/r
Confirmed virologic failures 16 24
Unable to sequence 2 3
No treatment-emergent mutations 9 14
No treatment-emergent reduced phenotypic susceptibility to FPV/r or LPV/r* per IAS-USA resistance guidelines, Oct 2005
Treatment-emergent mutations (n)*
TAM-associated mutations (M41M/L)
3TC-associated mutations (M184I, M184V, M184M/V)
NNRTI –associated mutations (V106V/A)
PI-associated mutations- all minor (I54I/L, I93I/L, K20K/R, I62I/V)
0 1
3 4
0 2
3 2

Clinical Treatment-Related Grade 2-4 AEs ≥2%
FPV/r LPV/r Total% (%Grade 3/4) (N=436) (N=443) (N=879)
Diarrhea 13% (2%) 11% (<1%) 12% (1%)
Nausea 6% (<1%) 5% (<1%) 6% (<1%)
Suspected HSR to ABC 6% (2%) 4% (2%) 5% (2%)
Headache 3% (<1%) 1% (0) 2% (<1%)
Rash 3% (0) <1% (<1%) 2% (<1%)
Vomiting 2% (0) 2% (<1%) 2% (<1%)
Fatigue 2% (<1%) 1% (<1%) 2% (<1%)
All Grades ABC HSR 7% 5% 6%
The safety population consisted of all subjects randomized who received at least one dose of study drug and were analyzed by treatment actually received
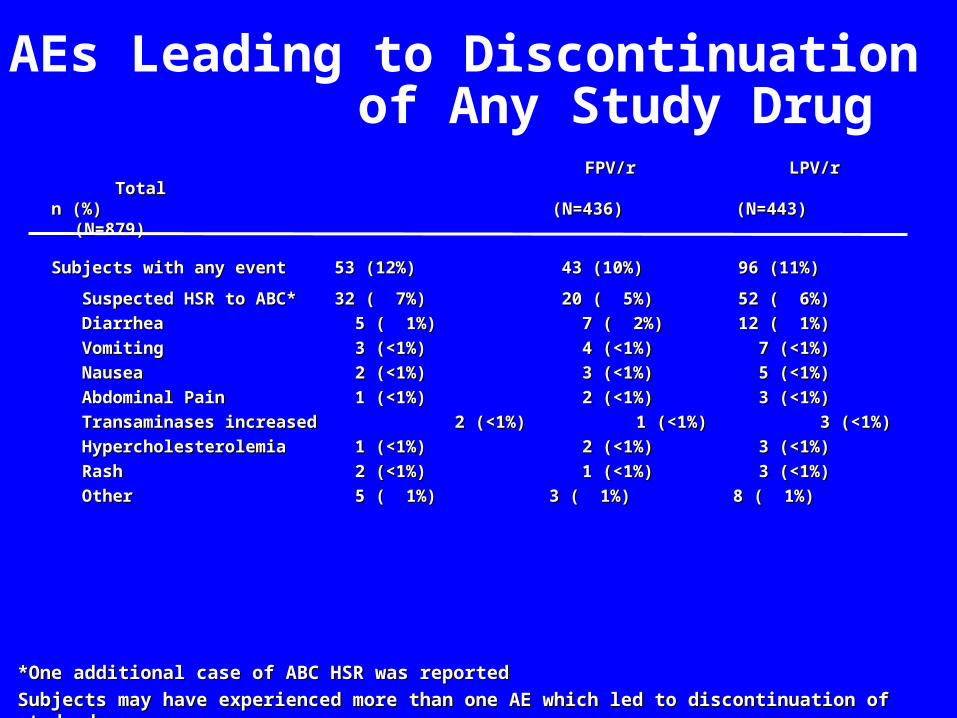
AEs Leading to Discontinuation of Any Study Drug
FPV/r LPV/r TotalFPV/r LPV/r Totaln (%) (N=436) (N=443) (N=879)n (%) (N=436) (N=443) (N=879)
Subjects with any eventSubjects with any event 53 (12%) 53 (12%) 43 (10%) 43 (10%) 96 (11%) 96 (11%)
Suspected HSR to ABC*Suspected HSR to ABC* 32 ( 7%) 32 ( 7%) 20 ( 5%) 20 ( 5%) 52 ( 6%) 52 ( 6%)
DiarrheaDiarrhea 5 ( 1%) 5 ( 1%) 7 ( 2%) 7 ( 2%) 12 ( 1%) 12 ( 1%)
VomitingVomiting 3 (<1%) 3 (<1%) 4 (<1%) 4 (<1%) 7 (<1%) 7 (<1%)
NauseaNausea 2 (<1%) 2 (<1%) 3 (<1%) 3 (<1%) 5 (<1%) 5 (<1%)
Abdominal PainAbdominal Pain 1 (<1%) 1 (<1%) 2 (<1%) 2 (<1%) 3 (<1%) 3 (<1%)
Transaminases increasedTransaminases increased 2 (<1%) 2 (<1%) 1 (<1%) 1 (<1%) 3 (<1%) 3 (<1%)
HypercholesterolemiaHypercholesterolemia 1 (<1%) 1 (<1%) 2 (<1%) 2 (<1%) 3 (<1%) 3 (<1%)
RashRash 2 (<1%) 2 (<1%) 1 (<1%) 1 (<1%) 3 (<1%) 3 (<1%)
OtherOther 5 ( 1%) 3 ( 1%) 8 ( 1%) 5 ( 1%) 3 ( 1%) 8 ( 1%)
*One additional case of ABC HSR was reported*One additional case of ABC HSR was reported
Subjects may have experienced more than one AE which led to discontinuation of study drugSubjects may have experienced more than one AE which led to discontinuation of study drug

0
50
100
150
200
250
FPV/r LPV/r FPV/r LPV/r
Baseline
Week 48
Cholesterol Triglycerides
Baseline n= 363 377 363 377
Week 48 n= 287 294 287 294
Median Fasting Lipids (mg/dL) at Baseline and Week 48
Use of lipid-lowering medications was similar in the FPV/r and LPV/r groups (11%)
mg
/dL
0
50
100
150
FPV/r LPV/r FPV/r LPV/r
Baseline
Week 48
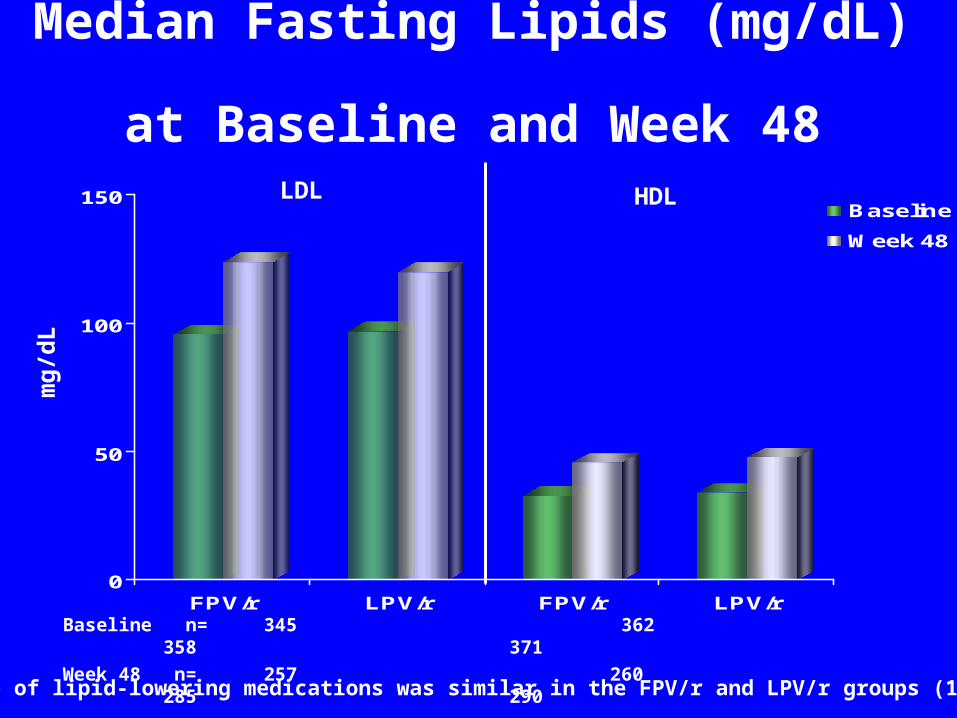
LDL HDL
Baseline n= 345 362 358 371
Week 48 n= 257 260 285 290
Median Fasting Lipids (mg/dL) at Baseline and Week 48
Use of lipid-lowering medications was similar in the FPV/r and LPV/r groups (11%)
mg
/dL

Conclusions
FPV/r BID had comparable efficacy to LPV/r BID in this study using an ABC/3TC FDC QD backbone
Few subjects had protocol-defined virologic failure– No major PI-associated mutations (IAS-USA) or reduced
phenotypic susceptibility emerged to either PI.
Both regimens were well-tolerated with few study discontinuations due to AEs
FPV/r and ABC/3TC FDC are now recommended components for initial antiretroviral therapy in the IAS-USA Adult Treatment Guidelines (JAMA Aug. 16, 2006)