jw,~v. Beach and Dune Profiles - WHOI...
6
Phone: (508) 289-2398 • Fax: (508 ) 457- 2172 • E-mail : seagrmt@ whoi. c:du • Internet: http:/ whoi.edu jseagrant Sea Grant Program, Woods Hole: Oc eanographic Institution, MS#2, Woods Hole:, MA 02543 Beach and Dune Profiles: An Educational Tool for Observing and Comparing Dynamic Coastal Environments Beaches and dunes are in constant motion, continually changing shape and shifting position in response to winds, waves, tides, relative sea level, and hu- man activities. The most significant changes occur seasonally and foll owing storms. During summe r, beaches are generally higher and sandier than they are in winter. During the \vinter, the 'missing' sand moves from the beach to nearshore areas to form sandbars. This happens as a result of ch anging wave shape due to more intense storm activity. During spring and early summer, or following a storm, the sand in the nearshore region moves back toward- and eventu all y attaches to-th e beach. Once on the beach, the finer sand grains are moved by wind action to form higher, wider sand dunes. These seasonal and storm-related interactions and changes in the form, vol ume, and posi- tion of beaches, dunes, and nearshore areas produce what is known as 'dynamic equilibrium' (Figure A). Dune Emery Rod Method for obtaining beach and dune profiles. Beach and dune profiling is one way to obtain information about seasonal and storm -induced beach and dune shapes. Co mparing season-to-season profiles and profiles taken before and after a significant storm clearly illustrates the important changes taking place al o ng the shoreline and how quickly coastal landforms change. There arc several methods for obtain- ing beach and dune profiles, and each has its advantages and disadvantages. The U.S. Army Corps of Engineers h as published descriptions of each method .... , ____ Be_rm_ ....._ profile Hightide level ...... ....... -- ....... - ..... Sandbar Winter/Siorm profile .•. --······- •• _ / Sandbar .· ·. Figure A: Typical summer and winte r beach and dune profiles.v Janu ary 2001 Sea lJfant Woods Hole ( see references). One of the simplest, rapid, and inexpensive methods is known as th e Emery Rod M ethod, named for a former Woods Hole Oceanographic Institution (WHOI ) geologist, Kenneth "KO." Emery . Emery Rod Constru ction Emery Rod construction is quite simple. Necessary components include four wooden rods, each l -inch square and 5 feet in length. Two rods are painted one side only with alternating bright colors (such as red and whit e), with each block painted in increments of tenths of feet, or in inches or centime- ters, beginning at the top. The remain- ing tv,ro rods are connected to the painted rods (with bolts and \vingnuts) to form a parallelogram (Figure B, p. 2). NOTE: To prevent the rods from sinking into the sand and thus giving inaccurate elevation readings, it is rec- ommended that 'foot pads ,' made of small discs of wood or large bottle caps, be attached to the bottom of the two vertical rods . Beach and Dune Profiling How-tos Setting the Permanent Mon ument and Pr ofile Stake The most active and changing part of the dry beach system is the area slightly landward of the foredune crest and sea- ward to the surf wne C, p. 4). As
-
Upload
hoangnguyet -
Category
Documents
-
view
213 -
download
0
Transcript of jw,~v. Beach and Dune Profiles - WHOI...
Phone: (508) 289-2398 • Fax: (508 ) 457-2172 • E-mail: [email protected]:du • Internet: http:/ jw,~v. whoi.edujseagrant Sea Grant Program, Woods Hole: Oceanographic Institution, MS#2, Woods Hole:, MA 02543
Beach and Dune Profiles: An Educational Tool for Observing and Comparing Dynamic Coastal Environments
Beaches and dunes are in constant motion, continually changing shape and shifting position in response to winds, waves, tides, relative sea level, and human activities. The most significant changes occur seasonally and following storms. During summer, beaches are generally higher and sandier than they are in winter. During the \vinter, the 'missing' sand moves from the beach to nearshore areas to form sandbars. This happens as a result of changing wave shape due to more intense storm activity. During spring and early summer, or following a storm, the sand in the nearshore region moves back towardand eventually attaches to-the beach. Once on the beach, the finer sand grains are moved by wind action to form higher, wider sand dunes. These seasonal and storm-related interactions and changes in the form, volume, and position of beaches, dunes, and nearshore areas produce what is known as 'dynamic equilibrium' (Figure A).
Dune
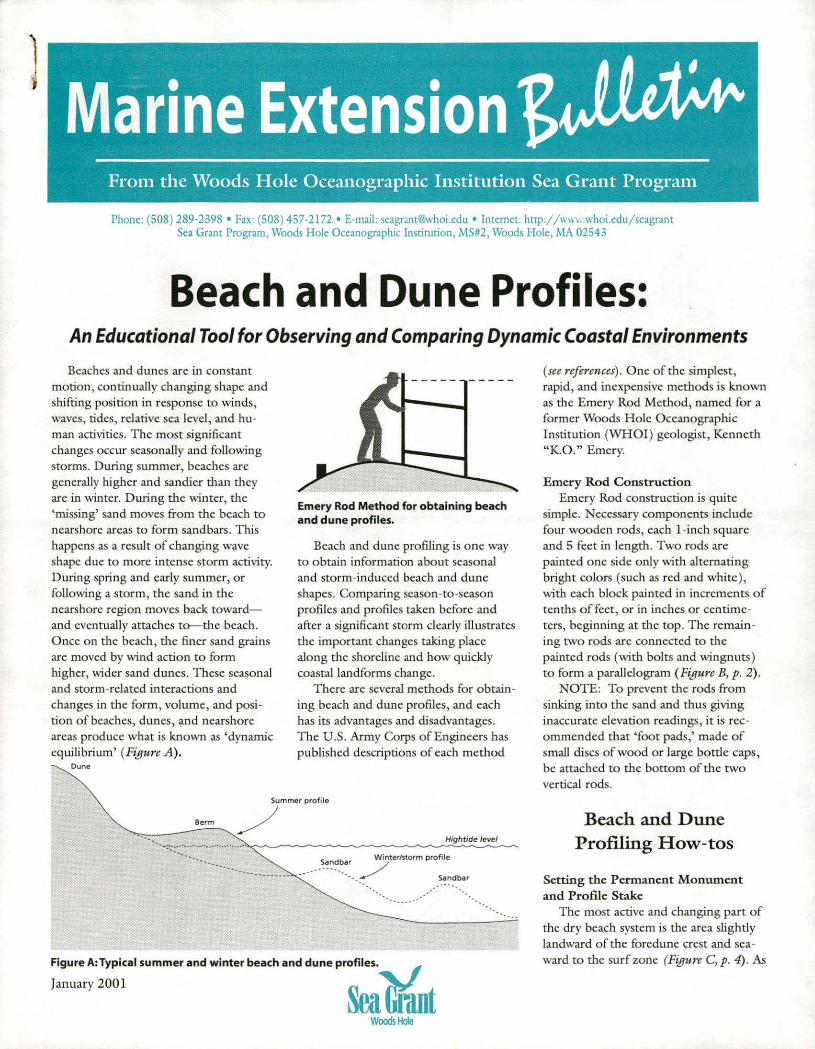
Emery Rod Method for obtaining beach and dune profiles.
Beach and dune profiling is one way to obtain information about seasonal and storm-induced beach and dun e shapes. Comparing season-to-season profiles and profiles taken before and after a significant storm clearly illustrates the important changes taking place along the shoreline and how quickly coastal landforms change.
There arc several methods for obtaining beach and dune profiles, and each has its advantages and disadvantages. The U.S. Army Corps of Engineers has published descriptions of each method
...., ____ Be_rm_....._ ~mmer profile
Hightide level
...... ~~ ....... -- ....... -..... Sandbar Winter/Siorm profile
.•. --······-•• _ / Sandbar
.· ·.
Figure A: Typical summer and winter beach and dune p rofiles.v
January 200 1 Sea lJfant Woods Hole
(see references). One of the simplest, rapid, and inexpensive methods is known as the Emery Rod Method, named for a former Woods Hole Oceanographic Institution (WHOI) geologist, Kenneth "KO." Emery.
Emer y Rod Construction Emery Rod construction is quite
simple. Necessary components include four wooden rods, each l -inch square and 5 feet in length. Two rods are painted one side only with alternating bright colors (such as red and white), with each block painted in increments of tenths of feet, or in inches or centimeters, beginning at the top. The remaining tv,ro rods are connected to the painted rods (with bolts and \vingnuts) to form a parallelogram (Figure B, p. 2).
NOTE: To prevent the rods from sinking into the sand and thus giving inaccurate elevation readings, it is recommended that 'foot pads,' made of small discs of wood or large bottle caps, be attached to the bottom of the two vertical rods .
Beach and Dune Profiling How-tos
Setting the Permanent Monument and P rofile Stake
The most active and changing part of the dry beach system is the area slightly landward of the foredune crest and seaward to the surf wne (Figz~re C, p. 4). As

;.
SmGifu.t Woods Hole
Phone: (508) 289-2398 • Fax: (508) 457-2172 • E-mail: scagrant:Cwhoi.cdu • Internet: hrtp://www.whoi.edu/ scagrant Sea Granr Program, Woods Hole Oceanographic lnsrirurion, MS#2, Woods Hole, MA 02543
Read this number from the rod. It is the difference in elevation of the rods; therefore, it is the difference in elevation of the dune area between the rods.
.... -- ·"" --
Figure 8: Dune and beach profiling using modified Emery Rods.
such, it is a good place to conduct profiles. It is very important to establish a point of reference- a fixed point that can be easily relocated during furure visitsin o rder to record seasonal and stormrelated changes.
NOTE: To ensure a reliable reference point, we recommend installing a permanent monument in the back, stable area of the dune (Figtm C). A 6-foot long wooden stake, measuring 4 inches square, would serve as an inexpensive and simple permanent monument.
The next step in conducting an Emery Rod profile is to install a profiling stake. Using this profiling method requires that the horizon be visible. With the horizon in view, install a profiling stake just landward of the foredune crest (Figures B & C). A wooden stake or copper pipe can
serve as a profiling stake; it should be at least 5 feet long and driven into the dune with approximately 1 foot of the stake exposed. This is the point from which most profiles will begin .
NOTE: Only on the rare occasion that a portion of the backdune has changed or if the profiling stake has been lost (perhaps due to a major storm), will it be necessary to repeat the profile from the permanent monument to the profiling stake location.
Obtaining Dune and Beach E levations Once the permanent monument and
profiling stakes have been established, it is time to record various elevations and measurements. Recording this information is best done on a data sheet. An example of a beach profile data sheet is
- _-....c -
J
included in Attachmmt 1. Some examples of measurements to be recorded include: • the distance from the top of the per
manent monument or profiling stake to the sand surface
• the geographic coordinates of the monument and stake ( using a compass for triangulation* or GPS), and
• the compass bearing of the desired transect
"Triangulation is obtained by taking compass beari ngs from your stake to three easily observable objects, such as a water tank, transmission tower, or roof chimney, etc.
NOTE: Triangulation or GPS data \viU aUow you to easily relocate your markers and "vill allow you to plot your
c C! l!l ~ VI
5
! Gi c c
~ 0 E =; >.
..0 0 0 ~ a..

Sm¥nt Woods Hole
Phone: (508) 289-2398 • Fax: (508) 457-2172 • E-mail: [email protected] • Internet: hnp:/ / www.whoi.edu/scagrant Sca Grant Program, Woods Hole Occanographic Institution, MS#2, Woods Hole, MA 02543
- Relatively stable area -1- Unstable area
Permanent
Interdune
Profile stake
Foredune
Une of slghr to horizon
Figure C: Terms describing a typical dune and beach profile. Note the location of the permanent monument and profile stake.
transect locations on a topographic map, nautical chart, or orthophotograph.
Most likely, the horizon will not be visible from the permanent monument. To obtain the backdune profile for the area between the permanent monument and profile stake (Figttre D, p. 4), a standard surveying technique is required. One simple option is to attach a sighting level to the top of the back rod. Looking through the sighting level to the front rod, read the number on the front rod. This number represents the dune elevation change between the rods. An inexpensive sighting level can be purchased at most hardware stores for approximately $20. Another simple method is to string a taut line between the two vertical poles and suspend a line level from the string. When the line is taut and level, read the numbers from each rod where the line intersects the poles. The difference in elevation between the rods, and thus the dune elevation change between the poles, is the difference between the numbers read from each rod.
Once the initial elevations have been recorded, it is time to record data for the area seaward of the profiling stake, where the horizon is visible (Figttre B). For the first reading, place the back Emery Rod against the profiling stake, making sure the rods do not sink into the sand and that the rods are vertical . A
one-ounce fishing weight or plum-bob can be hung from the side of the back stake \vith a cup hook to ensure that they arc vertical . Standing behind the landward rod, line up your eye with the top of the lower of the two rods and the horizon (Figures Band C). This imaginary line-of-sight will intersect one of the two rods. Note the elevation number where the line-of-sight intersects the rod. The difference represents the elevation change of the dune or beach between the two rods. If the number came from the front rod, the slope went up and should be recorded as a positive number. If the number came from the back rod, the slope went down and should be recorded as a negative (see example, Figt-tre C). Always make sure a plus o r minus sign is recorded. (This technique is prone to cumulative error. If one number is recorded incorrectly, then all subsequent numbers for the profi le 'viii be affected.)
To obtain the next reading, move seaward and place the back rod in the same location previously occupied by the front rod, and repeat the line-ofsight step outlined in the previous paragraph. Continue this sequence all the way to low water, or preferably to wading depth to obtain as much of the profile as possible. (To capture the profile of the winter o r storm-derived sandbars, one would have to go into the
breaker zone or farther. ) As you record the profile numbers
along your transect, it is useful to record other interesting beach and dune features on tl1c profile data sheet Things worth noting include the seaward edge of dune vegetation, wrack lines, wet/ dry interface, and low water line. Also record vegetation type and density and noticeable grain size changes (sand, pebble, cobble) along the beach and dune.
NOTE: Whenever possible, arrange to take profiles at low tide, preferably at the lowest tides of the month, to get the maximum profile distance. Also note the time of high tide and its published elevation on the data sheet, and record the time you reach low water. (Tide charts arc available from most marine supply stores or bait shops.)
Graphing the Profile Once you have documented the el
evation changes along your transect on the profile data sheet, you are ready to graph the profile. This can be done manually (on graph paper) or by using computer software. Figttre D and the accompanying Sample Profile Data Sheet in Attachment 1 represent an actual beach and dune profile taken at Rexhamc Beach in Marshfield, Mass., and graphed using Microsoft Excel. Note that the profile begins at elevation 13.4 NGVD. This is because the top of the permanent monument was surveyed at elevation 14.4 NGVD and the sand surface was 12 inches down from the top of the monument making the beginning sand surface elevation at 13.4 NGVD. Knowing the beginning elevation of your profile enables you to compare your results \vith published tide and storm wave heights.
Comparing Dune and Beach Profile Changes
While obtaining dune and beach profiles at the peak of each season is optimal, at least two arc needed for comparison: one in winter and one in summer. This allows for the observation

'J
.) Sm~ Woods Hole
Phone: (508) 289-2398 • Fax: (508) 457-2172 • E-mail: [email protected] • Internet: http:/ /www.whoi.edu/seagrant Sea Grant Program, Woods Hole Oceanographic Institution, MS#2, Woods Hole, MA 02543
of dynamic seasonal changes in the beach and dune. Conducting a profile following significant storms is also recommended to get a sense of the dynamic response of the beach and dune to storm waves, winds, and currents. Be quick in obtaining post-storm profiles, however. Research has revealed that beaches can recover quickly following a storm. Geologists at the U.S. Geological Survey, for example, discovered that beaches at the Cape Cod National Seashore recovered to pre-storm conditions within approximately one week.
While conducting profiles from the same transects helps yield both a visual and quantitative understanding of the dynamic nature of beaches and dunes, obtaining profiles from different areas will reveal interesting relationships, such as slope variation based on sediment grain size. For example, cobble or coarse-grained sandy beaches are generally much steeper than fine-grained sandy beaches. Reasons for this include shape differences of the beach material and the unique interlocking characteristics oflarge vs. small grain sizes. In one study, for example, the slope of cobble beaches with a grain size of 65-256 mm measured between 19-23 degrees, while the slope of a sandy beach with a grain size of .25-.5 mm measured approximately 5 degrees. To test this hypothesis, conduct profiles at both cobbled beaches and sandy beaches and compare your results.
In -depth Investigation Dune and beach profiling can be an
essential part of a dune rebuilding or dune and beach restoration project. By taking one additional profiling measure-surveying the top elevation of your permanent monument-a dune and beach can be designed or engineered to a specific known elevation. Often, this is done in an attempt to prevent or minimize storm wave and surge overtopping, or to provide profiles
REXHAME DUNE & BEACH PROALES, MARSHFIELD, MA 35,---------------------------------,
/
25 , I ,
-20 1><-,' ~ permament ~ ... , monument ~ 15 , - --m I
~ a;
10
dune crest
- 1 00-yr flood~ elevation
seaward toe of dune
-- ·-. ··-- - - •profile ltRB2 8/30199 (Emery Rod)
--profile IRB2 10123199 (Emery Rod)
(O'Connell, 1999) -5L---------------------------------~
0 25 50 75 100 125 150 175 200 225 250 275 300 325 350 375 400 425 450 475 500 525 550 di~nce seaward (ft)
Figure D: Rexhame dune and beach profiles measured by modified Emery Rods.
to a local conservation commission as a condition for seawall or revetment construction. This will allow comparison of your dune profile elevations to published storm surge and wave heights. In Figure D, note that the dune crest is higher than the 100-year flood elevation. Thus, the dune may provide some protection to landward areas. Dune volume is also critical for storm protection. Surveying the top of the permanent monument need only be done once. Contact a local engineer to survey the top of the permanent monument, if desired.
In the classroom, students may be interested in learning about high and low water elevations and elevations of various storms, including the so-called 1 00-year storm elevation. (The 1 00-year storm elevation is defined as a stormrelated ocean elevation having a 1 percent chance of occurring in any given year.) This information can be obtained from community flood insurance rate maps and accompanying flood insurance studies, usually available for viewing at the office of the town building inspector.
References • Emery, K.O., 1965, A Simple Method
of Measuring Beach Profiles, Limnology &Oceanography, V.6, No.1, pps. 90-93.
• Lawlor, E, 1992, Discover Nature at the Seashore. (Stackpole Books)
• U.S. Army Corps of Engineers, 1997, Beach and Nearshore Survey Technology, Coastal Engineering Technical Note, CETN II-38 (available by calling the Corps, (334) 690-3139).
This bulletin should be referenced as follows: WHOI Sea Grant Program, 2001, Marine Extension Bulletin, "Beach and Dune Profiles: An Educational Tool for Observing and Comparing Dynamic Coastal Environments," by Jim O'Connell.
For assistance in planning a beach and dune profiling program, or to obtain information about coastal processes, contact the WHOI Sea Grant Program or the Barnstable County Cape Cod Cooperative Extension Service.

'l
BEACH PROFILE DATA SHEET TOWN/BEACH: Marshfield/Rexhame Town Beach PAGE: 1 ofS Transect# RB2 Date: 8/30/99 Name: Jim O'Connell Top elevation of permanent monument (optional) 14.4 feetNGVD Sand surface from top of permanent monument 13.4 feetNGVD Top elevation ofprofile stake (optional) 29.29 feetNGVD Sand surface elevation at profile stake . 28.29 feet NGVD Geographic coordinates: permanent monument Geographic coordinates: profile stake N42o-07'-22.5" I W70o-40'-41.3" Transect compass bearing N89E
Distance Rod Cumulative Remarks: I surveyed the top of my permanent From Reading Elevation monument at 14.4 NGVD. The sand surface was 12 Penn (feet& (add inches down from the top of the monument. Thus, I Monume ·tenths of previous rod began my profile at 13.4 feet NGVD (see Figure D). nt (ft) feet) reading) xxxx xxxx 13.4 sand surface elevation at¥"'' ,....,~nt monument 5 +0~8 14.2 10 +2.1 16.3 15 -0.35 15.95 20 +0.85 16.8 25 -0.25 17.1 30 +0.25 17.35 35 +0.3 17.65 40 +0.85 18.5 45 +1.4 19.9 50 +1.25 21.15 55 +1.35 22.5 1 00-year flood elevation (obtained :from Flood Ins Study}·. 60 +1.6 24.1 65 +1.52 25.62 70 +1.12 26.74 75 +1.55 28.29 Profile stake 80 +1.1 29.39 85 +0.45 29.84 Dune crest (top elevation of dune): see Figme D 90 -0.32 29.52
95 -0.25 29.27
100 -0.37 28.9
105 -2.0 26.9
NOTES: The highest point of the chme ('dt.me crest') is at 29.84 NGVD. The top is above the 100-year flood elevation. Therefore, my chme may prevent storm wave overtopping and thus some degree of flood protection to landward areas (see Figure D).
(WHO! Sea Grant. Jim O'Connell)
Attachment 1: Profile Data Sheet' (page 1 of 5) used to Plot Figure D. This page shows the dune elevations for the first 105 feet of the profile from the Permanent Monument.

l I
BEACH PROFILE DATA SHEET TOWN/BEACH: (Page_of__) Transect# Date: Name: Surveyed elevation: top of permanent monument (optional) Sand surface measured from top of permanent monument Surveyed elevation: top of profile stake (optional) Sand surface elevation measured from top of profile stake Geographic coordinates: permanent monument Geographic coordinates: profile stake Transect compass bearing
Distance Rod Cumulative Remarks From Reading elevation profile (tenths stake of feet) (ft) xxxx xxxx sand surface elevation at profile stake
NOTES:
Distance = cumulative distance from origin of profile (e.g. profile stake or permanent marker) Reading = current Emery Rod reading Elevation = cumulative elevation: add to or subtract from the prior 'rod reading' to give the sand elevation at each location Remarks = observations along the transect (e.g. wrack line, berm crest, wet/ dry interface)
(Jim O'Connell, WHOI, Sea Grant)