Justice Defended, Justice Denied Council on Litigation Management New Orleans, LA March 24, 2011...
37
Justice Defended, Justice Denied Council on Litigation Management New Orleans, LA March 24, 2011 Download at www.iii.org/presentations Robert P. Hartwig, Ph.D., CPCU, President & Economist Insurance Information Institute 110 William Street New York, NY 10038 Tel: 212.346.5520 Cell: 917.453.1885 [email protected]
-
Upload
morgan-gallagher -
Category
Documents
-
view
218 -
download
0
Transcript of Justice Defended, Justice Denied Council on Litigation Management New Orleans, LA March 24, 2011...

Justice Defended, Justice Denied
Council on Litigation ManagementNew Orleans, LAMarch 24, 2011
Download at www.iii.org/presentationsRobert P. Hartwig, Ph.D., CPCU, President & Economist
Insurance Information Institute 110 William Street New York, NY 10038Tel: 212.346.5520 Cell: 917.453.1885 [email protected] www.iii.org
2
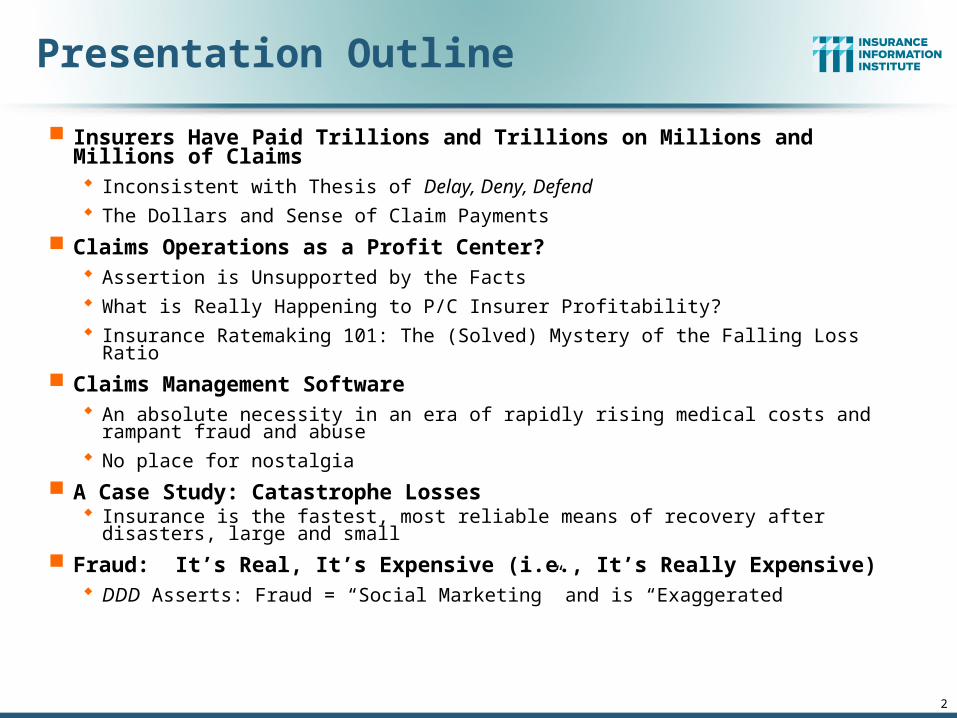
Presentation Outline
Insurers Have Paid Trillions and Trillions on Millions and Millions of Claims Inconsistent with Thesis of Delay, Deny, Defend The Dollars and Sense of Claim Payments
Claims Operations as a Profit Center? Assertion is Unsupported by the Facts What is Really Happening to P/C Insurer Profitability? Insurance Ratemaking 101: The (Solved) Mystery of the Falling Loss Ratio
Claims Management Software An absolute necessity in an era of rapidly rising medical costs and rampant fraud and
abuse No place for nostalgia
A Case Study: Catastrophe Losses Insurance is the fastest, most reliable means of recovery after disasters, large and
small
Fraud: It’s Real, It’s Expensive (i.e., It’s Really Expensive) DDD Asserts: Fraud = “Social Marketing” and is “Exaggerated”

3
The Central Thesis of “Delay, Deny, Defend” Is Unsupported
by the Facts
THE FACTS: The P/C Insurance Industry Pays Millions of Claims
Totaling $1 Trillion in Claims Every 2-3 Years

4
With $12.6 Trillion of Paid Claims, Thesis Of a Book Like This Has to Be Challenged
Delay, Deny, Defend makes broad assertions based largely on
anecdote and dated information. A more comprehensive and
analytical approach debunks the book’s central thesis that insurers
seek to profit by squeezing consumers out the claims dollars
that are due to them.

5
Dollar Value of Claims Paid by P/C Insurers to Policyholders, 1925–2010E*
*1925 – 1934 stock companies only. Includes workers compensation state funds 1998-2006.Note: Data are not adjusted for inflation.Sources: Insurance Information Institute research and calculations from A.M. Best data.
$0
$50
$100
$150
$200
$250
$300
$350
$400
1925
1930
1935
1940
1945
1950
1955
1960
1965
1970
1975
1980
1985
1990
1995
*200
0
*200
5
2010
E
Since 1925, P/C insurers have paid more than $7.2 trillion in claims to policyholders ($12.6
trillion in 2010 dollars)
Claim payouts increased
exponentially for decades
Claim payouts in recent years are volatile but have reached a jagged plateau
Catastrophe losses, underwriting cycle
contribute to volatility; Prolonged
soft market, recession to plateau
$ Billions

6
Cumulative Value of Claims Paid by P/C Insurers to Policyholders, 1925–2010E*
*1925 – 1934 stock companies only. Includes workers compensation state funds 1998-2006.Note: Data are not adjusted for inflation.Sources: Insurance Information Institute research and calculations from A.M. Best data.
$0
$1,000
$2,000
$3,000
$4,000
$5,000
$6,000
$7,000
$8,000
1925
1930
1935
1940
1945
1950
1955
1960
1965
1970
1975
1980
1985
1990
1995
*200
0
*200
5
2010
E
It took 60 years for the industry to pay its first $1 trillion in claims in the years since 1925. Today, the industry pays
$1 trillion in claims every 3 to 4 years.
60 years (1925 – 1984)
$ Billions
7 years (1991)
4 years (1995)
5 years (2000)
3 years (2003)
3 years (2006)
4 years (2010)

7
Inflation-Adjusted Dollar Value of Claims Paid by P/C Insurers, 1925–2010E*
*1925 – 1934 stock companies only. Includes workers compensation state funds 1998-2006.Sources: Insurance Information Institute research and calculations from A.M. Best data.
$0
$50
$100
$150
$200
$250
$300
$350
$400
1925
1930
1935
1940
1945
1950
1955
1960
1965
1970
1975
1980
1985
1990
1995
2000
2005
2010
E
Since 1925, P/C insurers have paid more than $12.6
trillion in claims to policyholders on an
inflation-adjusted basis
Claim payouts increased
exponentially for decades, but
more erratically in the post-1980 era
On an inflation-adjusted basis, claims paid have fallen to 1990s
levels, reflecting improved underwriting results, exposure
loss during the “Great Recession” and leakage to alternative markets
$ Billions

8
Cumulative Value of Inflation-Adjusted Claims Paid by P/C Insurers, 1925–2010E*
*1925 – 1934 stock companies only. Includes workers compensation state funds 1998-2006.Sources: Insurance Information Institute research and calculations from A.M. Best data.
$0$1,000$2,000$3,000$4,000$5,000$6,000$7,000$8,000$9,000
$10,000$11,000$12,000$13,000$14,000
1925
1930
1935
1940
1945
1950
1955
1960
1965
1970
1975
1980
1985
1990
1995
*200
0
*200
5
2010
E
Adjusted for inflation, it took 36 years for the
industry to pay its first $1 trillion in claims in the years since 1925. Today, the industry
pays $1 trillion in claims every 2 to 3 years after adjusting for inflation.
36 years (1925 – 1961)
$ Billions
9 years (1970)
7 years (1977)
5 years (1982)
4 years (1986)
4 years (1990)
3 years (1993)
3 years (1996)
4 years (2000)
2 years (2002)
3 years (2005)
3 years (2008)
9
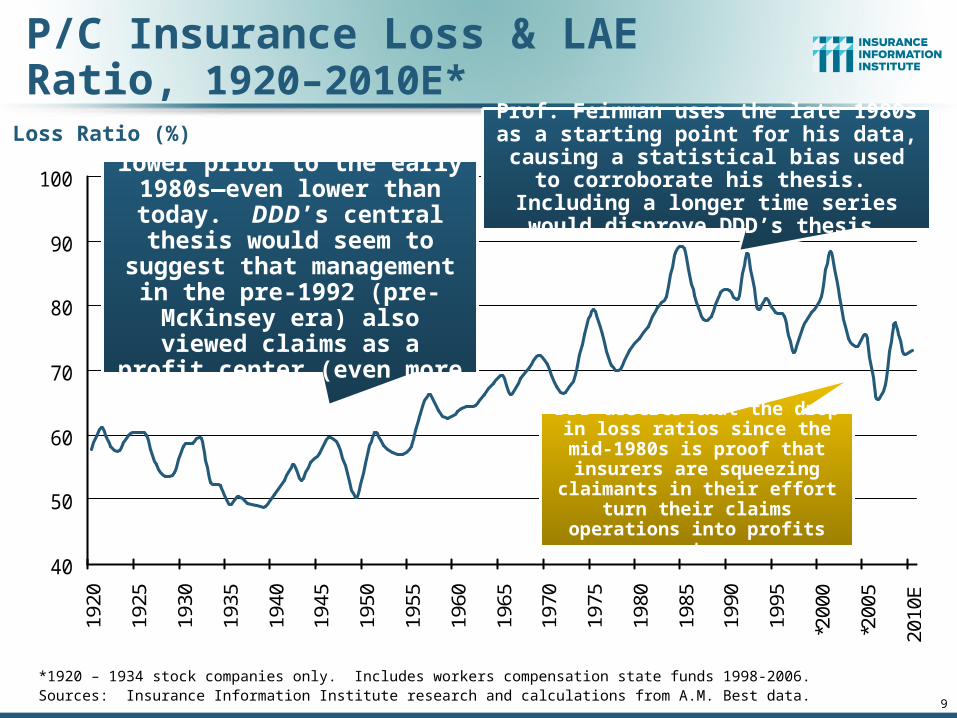
P/C Insurance Loss & LAE Ratio, 1920–2010E*
*1920 – 1934 stock companies only. Includes workers compensation state funds 1998-2006.Sources: Insurance Information Institute research and calculations from A.M. Best data.
40
50
60
70
80
90
100
1920
1925
1930
1935
1940
1945
1950
1955
1960
1965
1970
1975
1980
1985
1990
1995
*200
0
*200
5
2010
E
Loss ratios were much lower prior to the early 1980s—even
lower than today. DDD’s central thesis would seem to suggest that management in the pre-1992 (pre-McKinsey era) also viewed claims as a
profit center (even more so)…
Prof. Feinman uses the late 1980s as a starting point for his data, causing a
statistical bias used to corroborate his thesis. Including a longer time series
would disprove DDD’s thesis.
DDD asserts that the drop in loss ratios since the mid-1980s
is proof that insurers are squeezing claimants in their
effort turn their claims operations into profits centers
Loss Ratio (%)
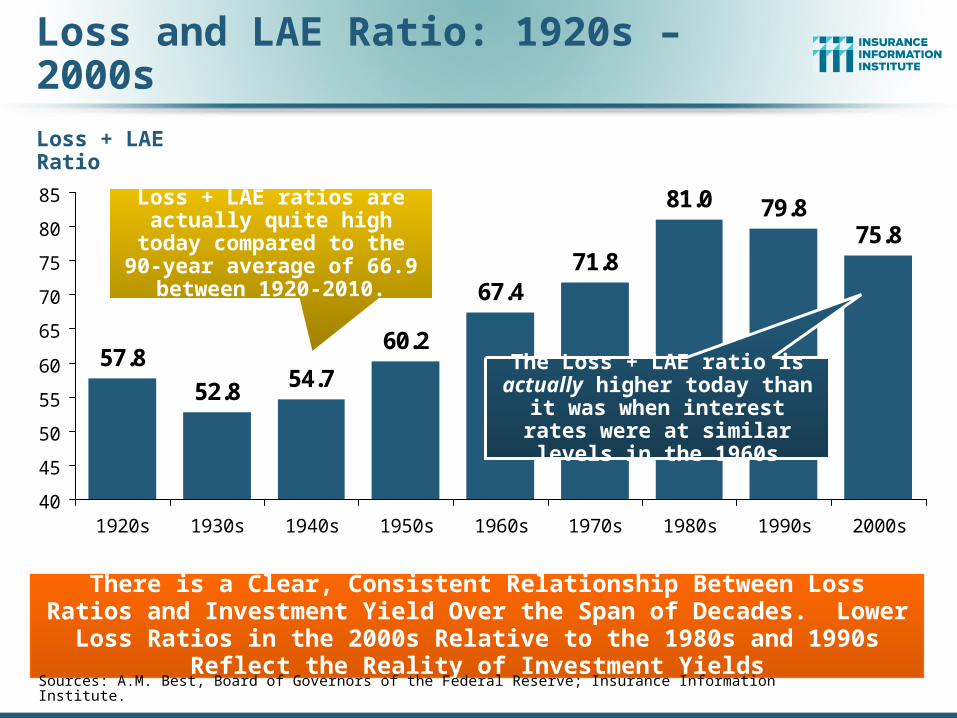
Loss and LAE Ratio: 1920s – 2000s
Loss + LAE Ratio
57.8
52.8 54.7
60.2
67.4
81.0 79.875.8
71.8
40
45
50
55
60
65
70
75
80
85
1920s 1930s 1940s 1950s 1960s 1970s 1980s 1990s 2000s
There is a Clear, Consistent Relationship Between Loss Ratios and Investment Yield Over the Span of Decades. Lower Loss Ratios in the 2000s
Relative to the 1980s and 1990s Reflect the Reality of Investment Yields
Sources: A.M. Best, Board of Governors of the Federal Reserve; Insurance Information Institute.
The Loss + LAE ratio is actually higher today than it was when interest rates were at similar
levels in the 1960s
Loss + LAE ratios are actually quite high today compared to
the 90-year average of 66.9 between 1920-2010.

11
Loss and LAE Ratio vs. 10-Year Treasury Yield, 1962-2010
50
55
60
65
70
75
80
85
90
95
62 65 68 71 74 77 80 83 86 89 92 95 98 01 04 07 10E
Lo
ss
& L
AE
Ra
tio
0
2
4
6
8
10
12
14
16
10
-Ye
ar T
rea
su
ry Y
ield
Loss and LAE Ratio
10-Year Treasury Yield
(%)(%)
Sources: A.M. Best, Board of Governors of the Federal Reserve; Insurance Information Institute.
Higher yields support higher loss ratios, since a higher proportion of losses can be
covered by investment earnings
As yields have trended downward, so too have loss
ratios, since a smaller proportion of losses can be
covered by investment earnings
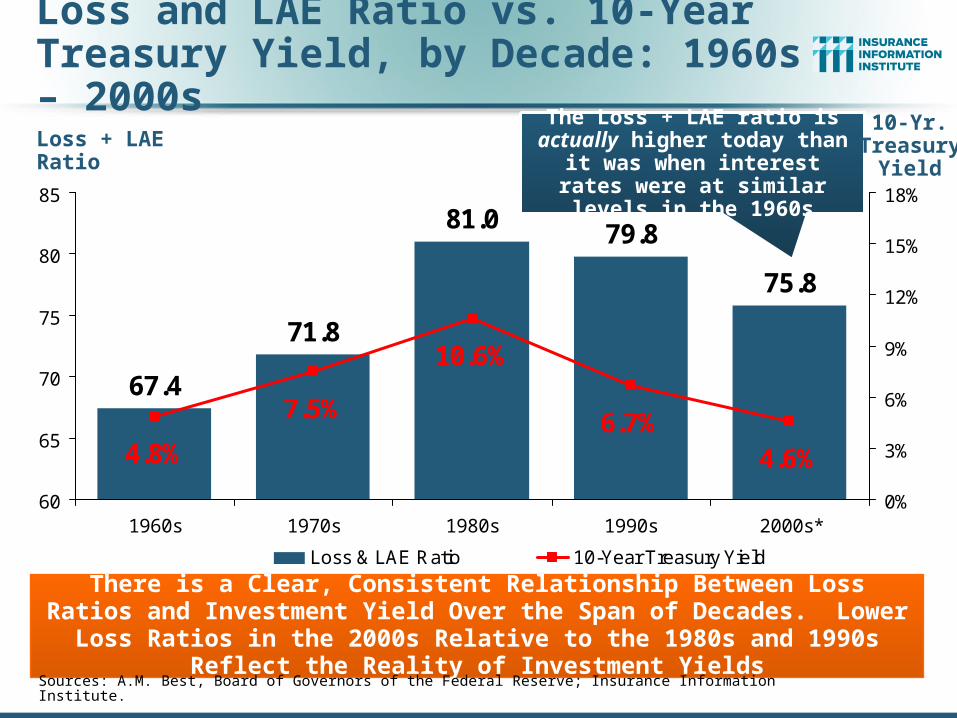
Loss and LAE Ratio vs. 10-Year Treasury Yield, by Decade: 1960s – 2000s
Loss + LAE Ratio
67.4
71.8
81.0 79.8
75.8
6.7%7.5%
4.8% 4.6%
10.6%
60
65
70
75
80
85
1960s 1970s 1980s 1990s 2000s*0%
3%
6%
9%
12%
15%
18%
Loss & LAE Ratio 10-Year Treasury Yield
There is a Clear, Consistent Relationship Between Loss Ratios and Investment Yield Over the Span of Decades. Lower Loss Ratios in the 2000s
Relative to the 1980s and 1990s Reflect the Reality of Investment Yields
Sources: A.M. Best, Board of Governors of the Federal Reserve; Insurance Information Institute.
The Loss + LAE ratio is actually higher today than it was when interest rates were at similar
levels in the 1960s
10-Yr. Treasury
Yield

Underwriting Gain (Loss)1975–2010:Q3*
* Includes mortgage and financial guarantee insurers.Sources: A.M. Best, ISO; Insurance Information Institute.
Large Underwriting Losses Are NOT Sustainable in Current Investment Environment
-$55
-$45
-$35
-$25
-$15
-$5
$5
$15
$25
$35
75 77 79 81 83 85 87 89 91 93 95 97 99 01 03 05 07 09
In an era of low interest rates,
insurers need to operate with lower
underwriting losses or with an underwriting
profit
After interest rates began to rise in the late 1970s, insurers
began to run large underwriting losses (implying a high loss
ratio), offsetting those losses with investment earnings
($ Billions)

14
Number of Years with Underwriting Profits by Decade, 1920s–2000s
0 0
3
54
8
10
76
0
2
4
6
8
10
12
1920s 1930s 1940s 1950s 1960s 1970s 1980s 1990s 2000s*
* 2000 through 2009. 2009 combined ratio excluding mortgage and financial guaranty insurers was 99.3, which would bring the 2000s total to 4 years with an underwriting profit.Note: Data for 1920–1934 based on stock companies only.Sources: Insurance Information Institute research from A.M. Best Data.
Number of Years with Underwriting Profits
Underwriting Profits Were Common Before the 1980s (40 of the 60 Years Before 1980 Had Combined Ratios Below 100) –
But Then They Vanished. Not a Single Underwriting Profit Was Recorded in the 25 Years from 1979 Through 2003
Insurers ran underwriting profits consistently prior to the 1980s. Therefore, loss
ratios then were, on average, lower than today.

15
Empirical Evidence that the Central Thesis of “Delay, Deny, Defend” Is Wrong
No Evidence that Claims Practices Are Anything Other
Than Fair; Certainly Not Used as a Profit Center

16
16
Data source: Best’s Aggregates & Averages – Property/Casualty
P/C industry, pure loss ratio, 1989-2008
50
60
70
80
1985 1990 1995 2000 2005 2010
P/C Pure Loss Ratios, 1989-2008
Source: Council on Litigation Management presentation by Jay Feinman, March 24, 2011, from A.M. Best data.
DDD’s thesis would suggest that falling loss
ratios support the assertion of insurers
squeezing claimants to raise profits
If the thesis is true, then ROEs should
be steadily increasing. What does the evidence
say?

17
ROE: Property/Casualty Insurance,1987–2010E*
* Excludes Mortgage & Financial Guarantee in 2008 - 2010.Sources: ISO, Fortune; Insurance Information Institute figure for 2010 is actual through 2010:Q3.
-5%
0%
5%
10%
15%
20%
87 88 89 90 91 92 93 94 95 96 97 98 99 00 01 02 03 04 05 06 07 08 09 10E
P/C Profitability Is Both by Cyclicality and Ordinary Volatile
Hugo
Andrew
Northridge
Lowest CAT Losses in 15 Years
Sept. 11
Katrina, Rita, Wilma
4 Hurricanes
Financial Crisis*
(Percent)

18
ROE vs. Equity Cost of Capital:U.S. P/C Insurance:1991-2010:9-Months*
* Return on average surplus in 2008-2010 excluding mortgage and financial guaranty insurers.Source: The Geneva Association, Insurance Information Institute
-2%
0%
2%
4%
6%
8%
10%
12%
14%
16%
18%
91 92 93 94 95 96 97 98 99 00 01 02 03 04 05 06 07 08* 09* 10*
ROE Cost of Capital
-13
.2 p
ts +1
.7 p
ts
+2
.3 p
ts
-9.0
pts
-6.4
pts
-3.2
pts
The P/C Insurance Industry Fell WellShort of Its Cost of Capital in 2008 but
Narrowed the Gap in 2009 and 2010
US P/C Insurers Missed Their Cost of Capital by an Average 6.7 Points from
1991 to 2002, but on Target or Better 2003-07, Fell Short in 2008-2010
The Cost of Capital is the Rate of Return Insurers Need to
Attract and Retain Capital to the Business
(Percent)
-2.7
pts

A 100 Combined Ratio Isn’t What ItOnce Was: Investment Impact on ROEs
Combined Ratio / ROE
* 2009 and 2010:Q3 figures are return on average statutory surplus. 2008, 2009 and 2010:H1figures exclude mortgage and financial guaranty insurersSource: Insurance Information Institute from A.M. Best and ISO data.
97.5
100.6 100.1 100.7
92.6
99.5 99.7101.0
7.7%7.3%
9.6%
15.9%
14.3%
12.7%
4.4%
8.9%
80
85
90
95
100
105
110
1978 1979 2003 2005 2006 2008* 2009* 2010:Q3*0%
3%
6%
9%
12%
15%
18%
Combined Ratio ROE*
Combined Ratios Must Be Lower in Today’s DepressedInvestment Environment to Generate Risk Appropriate ROEs
A combined ratio of about 100 generated ~7.5% ROE in 2009/10,
10% in 2005 and 16% in 1979

20
P/C Profitability Components Are Highly Variable But ROE Is Not Trending Upward
All of the components of P/C insurer profits are highly volatile, but net
investment yield shows a steady downward trend. The ONLY way to counter
this is to reduce underwriting losses, the magnitude of which has been shrinking in recent years. Delay, Deny, Deny
inappropriately and inaccurately ascribes this as evidence of an effort
deprive policyholders out of what is due them.
Falling Investment
Yield
Smaller Underwriting
Losses

$0
$50
$100
$150
$200
$250
$300
$350
$400
$450
$500
$550
$600
75 77 79 81 83 85 87 89 91 93 95 97 99 01 03 05 07 09
US Policyholder Surplus:1975–2010*
* As of 6/30/10; **Calculated using annualized net premiums written based on H1 2010 data.Source: A.M. Best, ISO, Insurance Information Institute.
“Surplus” is a measure of underwriting capacity. It is
analogous to “Owners Equity” or “Net Worth” in
non-insurance organizations
($ Billions)
Surplus as of 6/30/10 was a near-record $530.5B, up from $437.1B at the crisis trough at 3/31/09.
Prior peak was $521.8 as of 9/30/07. Surplus as of 6/30/10 is now 1.7% above 2007 peak; Crisis trough
was as of 3/31/0916.2% below 2007 peak.

22
Claims Management Software
Assertion that Use of Software Results in a Systematic Bias Against Claimants is False

23
Claims Management Software
Claims Management Software (such as Colossus) is Used to Increase Consistency and Reduce Subjectivity in the Claims Evaluation Process (CSC)
Sophisticated processes are necessary to ensure consistent and fair payments to millions of claims involving tens of billions in cost each year
The use of computer software is necessary to achieve this goal
NY Insurance Department (Oct. 2010):
“It is important to note that we found no systemic underpayment of bodily injury claims.”– Comments of NY Superintendent Wrynn following a recent carrier examination
There is Nothing Nostalgic About the Era of 100% Manual Claims Adjusting in an Era of Rapid Medical Cost Inflation and Rampant Fraud and Abuse Without claims management software, overall system costs would be higher Incidence rate of fraud and abuse would be higher
The Role of Technology in Claims Adjusting Will Evolve and Grow
This transformational role of information is not unique to insurance
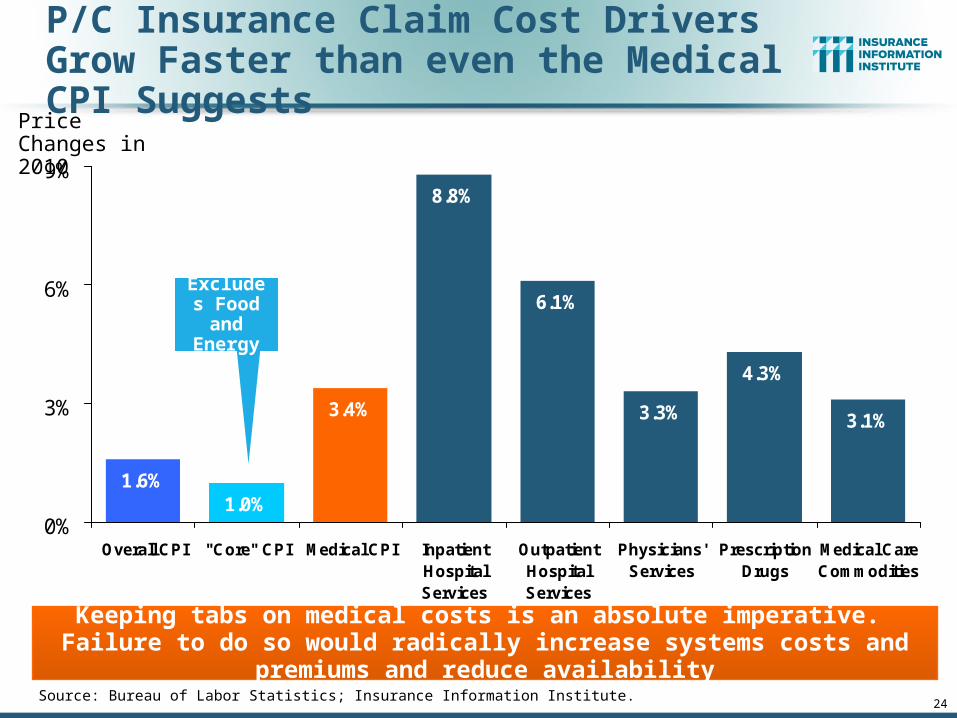
P/C Insurance Claim Cost Drivers Grow Faster than even the Medical CPI Suggests
Source: Bureau of Labor Statistics; Insurance Information Institute.
1.6%1.0%
3.4%
8.8%
6.1%
3.3%
4.3%
3.1%
0%
3%
6%
9%
Overall CPI "Core" CPI Medical CPI InpatientHospitalServices
OutpatientHospitalServices
Physicians'Services
PrescriptionDrugs
Medical CareCommodities
Price Changes in 2010
Keeping tabs on medical costs is an absolute imperative. Failure to do so would radically increase systems costs and premiums and reduce availability
24
Excludes Food and Energy
25
Case Study: Catastrophe Losses Are Increasing in
Number and Cost
THE FACTS: The P/C Insurance Industry Pays Millions of Claims
Totaling $1 Trillion in Claims Every 2-3 Years

26
$8
.3
$7
.4
$2
.6 $1
0.1
$8
.3
$4
.6
$2
6.5
$5
.9 $1
2.9 $
27
.5
$6
1.9
$9
.2
$6
.7
$2
7.1
$1
0.6
$1
3.6
$1
00
.0
$7
.5
$2
.7
$4
.7
$2
2.9
$5
.5 $1
6.9
$0
$20
$40
$60
$80
$100
$120
89 90 91 92 93 94 95 96 97 98 99 00 01 02 03 04 05 06 07 08 09 10*20??
US Insured Catastrophe Losses
*Estimate from Munich Re.Note: 2001 figure includes $20.3B for 9/11 losses reported through 12/31/01. Includes only business and personal property claims, business interruption and auto claims. Non-prop/BI losses = $12.2B.Sources: Property Claims Service/ISO; Munich Re; Insurance Information Institute.
CAT Losses in the Future are Guaranteed to Rise
$100 Billion CAT Year is Coming Eventually
First Half 2010 CAT
Losses Were Down 19% or $1.4B from
first half 2009
($ Billions)
2000s: A Decade of Disaster
2000s: $193B (up 117%)
1990s: $89B

27
Combined Ratio Points Associated with Catastrophe Losses: 1960 – 2010E
Notes: Private carrier losses only. Excludes loss adjustment expenses and reinsurance reinstatement premiums. Figures are adjusted for losses ultimately paid by foreign insurers and reinsurers.Source: ISO; Insurance Information Institute estimate for 2010.
0.4
1.2
0.4 0.
8 1.3
0.3 0.4 0.
71.
51.
00.
40.
4 0.7
1.8
1.1
0.6
1.4 2.
01.
3 2.0
0.5
0.5 0.7
3.0
1.2
2.1
8.8
2.3
5.9
3.3
2.8
1.0
3.6
2.9
1.6
5.4
1.6
3.3
3.3
8.1
2.7
1.6
5.0
2.6 3.
33.6
0.9
0.1
1.1
1.1
0.8
0
1
2
3
4
5
6
7
8
9
10
1960
1962
1964
1966
1968
1970
1972
1974
1976
1978
1980
1982
1984
1986
1988
1990
1992
1994
1996
1998
2000
2002
2004
2006
2008
2010
E
The Catastrophe Loss Component of Private Insurer Losses Has Increased Sharply in Recent Decades
Avg. CAT Loss Component of the Combined Ratio
by Decade
1960s: 1.04 1970s: 0.85 1980s: 1.31 1990s: 3.39
2000s: 3.52
Combined Ratio Points

Nu
mb
er
Geophysical (earthquake, tsunami, volcanic activity)
Climatological (temperature extremes, drought, wildfire)
Meteorological (storm)
Hydrological (flood, mass movement)
Natural Disasters in the United States, 1980 – 2010Number of Events (Annual Totals 1980 – 2010)
Source: MR NatCatSERVICE 28
There were a record 247 natural disaster events in
the US in 2010

29
Recent Major Global Catastrophe Losses
(Insured Losses, $US Billions)
*Midpoint of AIR Worldwide estimated insured loss range of $15 billion to $35 billion as of March 13, 2011. Does not include tsunami losses.Sources: Insurance Council of Australia, Munich Re, AIR Worldwide; Insurance Information Institute.
$25.0
$10.0$8.0
$5.0$2.0
$0.5$0
$5
$10
$15
$20
$25
$30
Cyclone Yasi(Australia) Feb
2011
Australia Floods(Dec - Feb 2011)
New ZealandQuake (Sep 2010)
Chile Earthquake(Feb 2010)
New ZealandQuake (Feb 2011)
Japan Earthquake(Mar 2011)*
Insured Losses from Recent Major Catastrophe Events Exceed $50 Billion, an Estimated $48 Billion of that from Earthquakes
The March 2011 earthquake in Japan will become among the most expensive in world history in terms of insured losses (current
leader is the 1994 Northridge earthquake with $22.5B in insured losses in 2010 dollars)
30
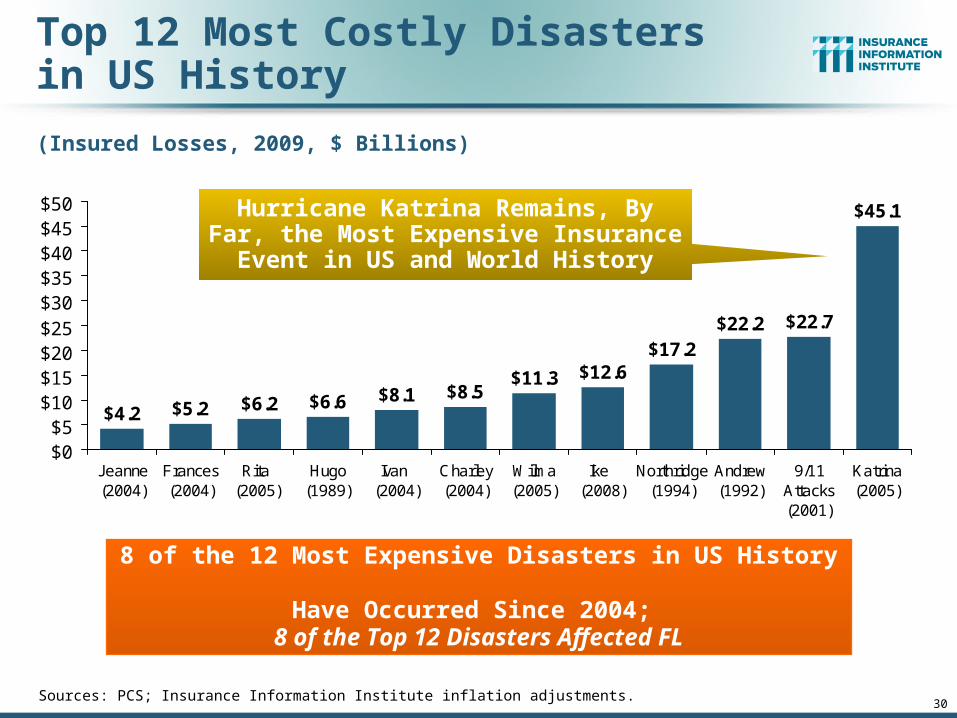
Top 12 Most Costly Disastersin US History
(Insured Losses, 2009, $ Billions)
Sources: PCS; Insurance Information Institute inflation adjustments.
$11.3 $12.6$17.2
$22.2 $22.7
$45.1
$8.5$8.1$6.6$6.2$5.2$4.2
$0$5
$10$15$20$25$30$35$40$45$50
Jeanne(2004)
Frances(2004)
Rita (2005)
Hugo(1989)
Ivan (2004)
Charley(2004)
Wilma(2005)
Ike (2008)
Northridge(1994)
Andrew(1992)
9/11Attacks(2001)
Katrina(2005)
8 of the 12 Most Expensive Disasters in US History Have Occurred Since 2004;
8 of the Top 12 Disasters Affected FL
Hurricane Katrina Remains, By Far, the Most Expensive Insurance Event in US
and World History

31
Total Value of Insured Coastal Exposure
(2007, $ Billions)
Source: AIR Worldwide
$224.4$191.9
$158.8$146.9$132.8
$92.5$85.6$60.6$55.7$51.8$54.1
$14.9
$479.9$635.5
$772.8$895.1
$2,378.9$2,458.6
$0 $500 $1,000 $1,500 $2,000 $2,500 $3,000
FloridaNew York
TexasMassachusetts
New JerseyConnecticut
LouisianaS. Carolina
VirginiaMaine
North CarolinaAlabamaGeorgia
DelawareNew Hampshire
MississippiRhode Island
Maryland
In 2007, Florida Still Ranked as the #1 Most Exposed State to Hurricane Loss, with
$2.459 Trillion Exposure, but Texas is very exposed too, and ranked #3 with $895B
in insured coastal exposure
The Insured Value of All Coastal Property Was $8.9 Trillion in 2007, Up 24% from $7.2 Trillion in 2004
32
Global Catastrophe Loss Trends
Claims Paying Capacity Will Need to Increase in the Future if Current
Disaster Trends Continue

Natural Catastrophes Worldwide, 1980 – 2010 (Number of events with trend)
Number
Meteorological events(Storm)
Hydrological events(Flood, mass movement)
Climatological events(Extreme temperature, drought, forest fire)
Geophysical events(Earthquake, tsunami,
volcanic eruption)
200
400
600
800
1 000
1 200
1980 1982 1984 1986 1988 1990 1992 1994 1996 1998 2000 2002 2004 2006 2008 2010
Source: Geo Risks Research, NatCatSERVICE 33© 2011 Munich Re
Increased claims paying capacity will be required on
a global scale if current trends continue (as is
expected)
34
Fraud Is a Serious Problem
Delay, Deny, Defend: Fraud = “Social Marketing” and Is “Exaggerated”

35
Florida’s No-Fault Fraud Tax: Estimated Aggregate Annual Cost, 2009-2011F ($ Millions)
$945.8
$548.9
$303.8
$0
$100
$200
$300
$400
$500
$600
$700
$800
$900
$1,000
2009 2010E 2011F
Fra
ud
Ta
x (
$ M
illio
ns
)
*2010 estimate is based on data through Q3:2010. 2011 forecast is based on an assumed increase in pure premium of 25% (pure premium increased 27% in the 4 quarters ending with 2010:Q3). Estimates assume 11.288 million insured vehicles in FL in 2009-2011 (11.288 million is 2008 actual figure from AIPSO).Source: Insurance Information Institute calculations and research from ISO/PCI and AIPSO data.
Unscrupulous Medical Providers and Attorneys Are Costing Honest Florida Drivers Hundreds of Millions of Dollars
The total fraud tax levied on Florida
vehicle owners was and estimated $549
million in 2010.
+80.7%
+72.3%
If nothing is done to address Florida’s runaway no-fault fraud problem, the
aggregate fraud tax on Florida vehicle owners
could rise to $946 in 2011

36
New York State No-Fault Claim Severity, 1997–2010:Q3
Sources: ISO/PCI Fast Track data; Insurance Information Institute.
$5,6
75 $6,0
63$6
,699
$8,3
47$8
,327
$7,8
88$7
,507
$8,2
34$9
,235
$8,7
27$8
,577
$7,7
73$7
,311
$6,9
58$6
,870
$6,1
56$6
,052
$5,8
20$5
,991
$5,6
15$6
,094
$5,9
14 $6,2
50$6
,269 $6
,530
$6,6
06$7
,063 $7
,323
$7,3
78$7
,297 $7
,670
$7,7
40$8
,443
$8,1
77 $8,5
07$8
,025
$8,5
63$8
,726
$8,6
46$8
,830
$8,6
46 $8,9
90$8
,647
$5,000
$5,500
$6,000
$6,500
$7,000
$7,500
$8,000
$8,500
$9,000
$9,500
1997
1999
1:01
1:03
2:01
2:03
3:01
3:03
4:01
4:03
5:01
5:03
6:01
6:03
7:01
7:03
8:01
8:03
9:01
9:03
10:0
1
10:0
3
No
-Fa
ult
Cla
im S
ev
eri
ty
1.0%
1.2%
1.4%
1.6%
1.8%
2.0%
2.2%
2.4%
No
-Fa
ult C
laim
Fre
qu
en
cy
Avg. Claim Severity
Frequency
About 20% of No-Fault Claim Costs Are Attributable to Fraud and Abuse
No-Fault Claim Severity
Claim Severity reached a record high in 2010:Q2: $8,990
Avg. Claim Severity Rose 63% in 5 years
after 1997 Presbyterian
Decision
Avg. Claim Severity is up 54% since 2004:Q4
www.iii.org
Thank you for your timeand your attention!
Download at www.iii.org/presentations
Twitter: twitter.com/bob_hartwig
Insurance Information Institute Online: