Just-in-time - مصطفى الطواشي · o Backflush costing is utilized with just-in-time...
21
Prepared by: Sameh.Y.El-lithy. CMA,CIA. 1 Just-in-time Definitions: Just-in-time system :A comprehensive production and inventory system that purchases or produces materials and parts only as needed and just in time to be used at each stage of the production process. Just-in-time (JIT) production (Also called lean production): Demand-pull manufacturing system in which each component in a production line is produced as soon as and only when needed by the next step in the production line.. Just-in-time (JIT) purchasing: The purchase of goods or materials so that they are delivered just as needed for production. Just-In-Time Inventory management systems are based on a manufacturing philosophy that combines purchasing, production and Inventory control into one function. Purpose minimize the level of inventories because many-inventory-related activities are viewed as nonvalue-added. meet customer demand in a timely manner, with high-quality products, and at the lowest possible cost,Higher productivity, reduced order costs as well as carrying costs, faster and cheaper setups, shorter manufacturing cycle times, better due date performance, improved quality, and more flexible processes are objectives of JIT methods. The ultimate objectives are increased competitiveness and higher profits. JIT (Demand Pull ) System vs. Traditional (push) systems In a push system, a department produces and sends all that it can to the next step for further processing, which means that the manufacturer is producing something without understanding consumer demand. This can result in large, useless stocks of inventory. The main Idea of JIT is that nothing is produced until the next process in the assembly line needs it. This demand-pull feature requires close coordination between workstations. Benefits o Reduction in the cost of carrying the inventory and reduces nonvalue adding activities. o Greater emphasis on improving quality by eliminating the causes of rework, scrap and waste. o Setup times are decreased. o Lower investments in space o The focus of quality control under JIT shifts from the discovery of defective parts to the prevention of quality problems, so zero machine breakdowns (achieved through preventive maintenance) and zero defects are ultimate goals. Higher quality and lower inventory go together. o JIT increases inventory turnover (cost of sales ÷ average inventory) and decreases inventory as a percentage of total assets. o Backflush costing is utilized with just-in-time production as a planning and control system. Backflush costing is less costly to operate than most traditional costing systems. STUDY UNIT SIX OPERATIONAL EFFICIENCY AND BUSINESS PROCESS PERFORMANCE Lot sizes based on immediate need are typical of just-in-time systems, while lot sizes based on formulas are characteristic of traditional inventory management systems.
-
Upload
trinhnguyet -
Category
Documents
-
view
231 -
download
6
Transcript of Just-in-time - مصطفى الطواشي · o Backflush costing is utilized with just-in-time...

Prepared by: Sameh.Y.El-lithy. CMA,CIA. 1
Just-in-time Definitions: Just-in-time system :A comprehensive production and inventory system that purchases or produces materials and parts only as needed and just in time to be used at each stage of the production process. Just-in-time (JIT) production (Also called lean production): Demand-pull manufacturing system in which each component in a production line is produced as soon as and only when needed by the next step in the production line.. Just-in-time (JIT) purchasing: The purchase of goods or materials so that they are delivered just as needed for production. Just-In-Time Inventory management systems are based on a manufacturing philosophy that combines purchasing, production and Inventory control into one function.
Purpose
minimize the level of inventories because many-inventory-related activities are viewed as nonvalue-added.
meet customer demand in a timely manner, with high-quality products, and at the lowest possible cost,Higher productivity, reduced order costs as well as carrying costs, faster and cheaper setups, shorter manufacturing cycle times, better due date performance, improved quality, and more flexible processes are objectives of JIT methods.
The ultimate objectives are increased competitiveness and higher profits.
JIT (Demand Pull ) System vs. Traditional (push) systems In a push system, a department produces and sends all that it can to the next step for further processing, which means that the manufacturer is producing something without understanding consumer demand. This can result in large, useless stocks of inventory. The main Idea of JIT is that nothing is produced until the next process in the assembly line needs it. This demand-pull feature requires close coordination between workstations.
Benefits o Reduction in the cost of carrying the inventory and reduces nonvalue adding activities. o Greater emphasis on improving quality by eliminating the causes of rework, scrap and waste. o Setup times are decreased. o Lower investments in space o The focus of quality control under JIT shifts from the discovery of defective parts to the prevention
of quality problems, so zero machine breakdowns (achieved through preventive maintenance) and zero defects are ultimate goals. Higher quality and lower inventory go together.
o JIT increases inventory turnover (cost of sales ÷ average inventory) and decreases inventory as a percentage of total assets.
o Backflush costing is utilized with just-in-time production as a planning and control system. Backflush costing is less costly to operate than most traditional costing systems.
STUDY UNIT SIX OPERATIONAL EFFICIENCY
AND BUSINESS PROCESS PERFORMANCE
Lot sizes based on immediate need are typical of just-in-time systems, while lot sizes based on formulas are characteristic of traditional inventory management systems.

Prepared by: Sameh.Y.El-lithy. CMA,CIA. 2
Limitations o an increased risk of stockout costs o JIT implementation is not appropriate for high-mix manufacturing environments, which often have
thousands of products and dozens of work centers.
Characteristics of JIT Systems The major characteristics of a JIT environment are:
Production organized into manufacturing work cells o Each work cell produces a product or product type. Each worker in each cell knows how
to operate all the machines in that cell and can perform supporting tasks within that cell. This reduces the downtime resulting from breakdowns or employee absences.
Multiskilled workers o cross-functional training of workers so they can perform a variety of operations and tasks
on an as-needed basis to maintain smooth production flow.
Reduced setup times o reduction of the time required to get tools, equipment, and materials ready for a
production run.
Reduced manufacturing lead times o reduction of the time from when an order is initiated to when a finished good is produced.
Reliable suppliers o careful screening of suppliers to ensure on-time deliveries of high-quality goods for just-
in-time use possibly within a day or less. Supplier’s dependability is crucial in JIT system because inventory levels are kept low in a JIT system, the company must have a very close relationship with its suppliers to make certain that the supplier makes frequent deliveries of smaller amounts of Inventory, thus long-term contracts are typically negotiated to reduce order costs.
o Buyer-supplier relationships are further facilitated by electronic data interchange (EDI), a technology that allows the supplier access to the buyer's online inventory management system. Thus, electronic messages replace paper documents (purchase orders and sales invoices), and the production schedules and deliveries of the parties can be more readily coordinated.
kanban A set of control cards used by workers to signal the need for materials and products to move from one operation to the next in an assembly line Kanban is one of the many elements in the JIT system it means “ticket " "card" or "sign" or "visual record" or “markers” in Japanese.Workers respond only after receiving a kanban. When production is complete, the kanban is attached to the finished order and sent downstream to the next work cell
The minimization of inventory reduces the number of suppliers, storage costs, transaction costs, etc
Carrying costs vs. Stockout costs The objective of a JIT system is to reduce carrying costs by eliminating inventories and increasing the deliveries made by suppliers. Ideally, shipments are received just in time to be incorporated into the manufacturing process. This system increases the risk of stockout costs because the inventory buffer is reduced or eliminated.

Prepared by: Sameh.Y.El-lithy. CMA,CIA. 3
Material requirements or Material Resource planning (MRP)
Definition It is an approach that uses computer software to help manage a manufacturing process. MRP is a “Push- through” system that manufactures finished goods for inventory on the basis of demand forecasts. The system of production traditionally used in manufacturing is materials requirements planning (MRP). Taking a product from raw material through delivery is often treated as a series of discreet events. The concept is to “push” the product through production to reach a market. The premises underlying MRP push-though systems include:
Demand forecasts
A materials order specifying the materials, components, and subunit tasks required to produce a final product
A production order specifying the quantities of materials, components, subunits, and product inventories needed to meet the demand forecast
In MRP systems, a master production schedule indicates the quantities and timing of each part to be produced. Once the scheduled production run begins, departments push output through a system, regardless of whether that output is needed.
Benefits of MRP Systems The benefits of MRP systems include:
Less coordination required between functional areas; everyone follows the bill of materials.
Scheduling improvements; levels load when demand is variable or relatively unpredictable.
Predictable raw material needs; can take advantage of bulk purchasing and other price breaks.
More efficient inventory control; schedules to use up raw materials or build finished goods.
Additional inventory on hand to cover orders should product be damaged or lost in transit to a customer.
Quick response to new customer demand; can supply new customers from existing inventory rather than building product after the order is received.
Better manufacturing process control; minimizes retooling and machine setup time.
Reduced idle time.
Lower setup costs.
Lower inventory carrying costs.
Increased flexibility in responding to market change
Limitations The primary disadvantage of an MRP environment is potential inventory accumulation. Workstations may receive parts that they are not ready to process. Manufacturing resource planning (MRP II) is a closed-loop manufacturing system that integrates all facets of a manufacturing business, including production, sales, inventories, . schedules, and cash flows.. The same system is used for both the financial reporting and managing operations (both use the same transactions and numbers). Because manufacturing resource planning encompasses materials requirements planning, MRP is a component of an MRP system.

Prepared by: Sameh.Y.El-lithy. CMA,CIA. 4
Outsourcing
Definition Process of purchasing goods and services from outside vendors rather than producing the same goods or providing the same services within the organization. For smaller business, outsourcing may provide access to resources and expertise for capabilities they may not have internally. For larger businesses, outsourcing can improve specific functions.
Benefits By Outsourcing certain functions to a specialist, management can free up resources within the
company in order to focus on the primary operations of the company and strategic revenue-generating activities.
It may also be cheaper to outsource a function to a company that specializes in an area than It Is to run and support that function internally.
Benefits of outsourcing include reliable service, reduced costs, avoidance of the risk of obsolescence, and access to technology.
Can improve efficiency and effectiveness by gaining outside expertise or scale
Can provide access to current technologies at reasonable cost without the risk of obsolescence
Can reduce expenses by gaining capabilities without incurring overhead costs (for example, staffing, benefits, space)
May improve the quality and/or timeliness of products or services
Limitations Despite many attractive advantages, outsourcing is not the answer for all activities or functions and should consider the following key cautions: May cost more to go outside for specific expertise • Can result in a loss of in-house expertise and capabilities • Can reduce process control • May reduce control over quality • May lead to less flexibility (depending on the external supplier) • May result in less-personalized service • Creates privacy and confidentiality issues • Can result in “giving knowledge away” and lead to competitors obtaining expertise, scale, customers, etc. • Potential for employee morale and loyalty issues
Prepared by: Sameh.Y.El-lithy. CMA,CIA. 5
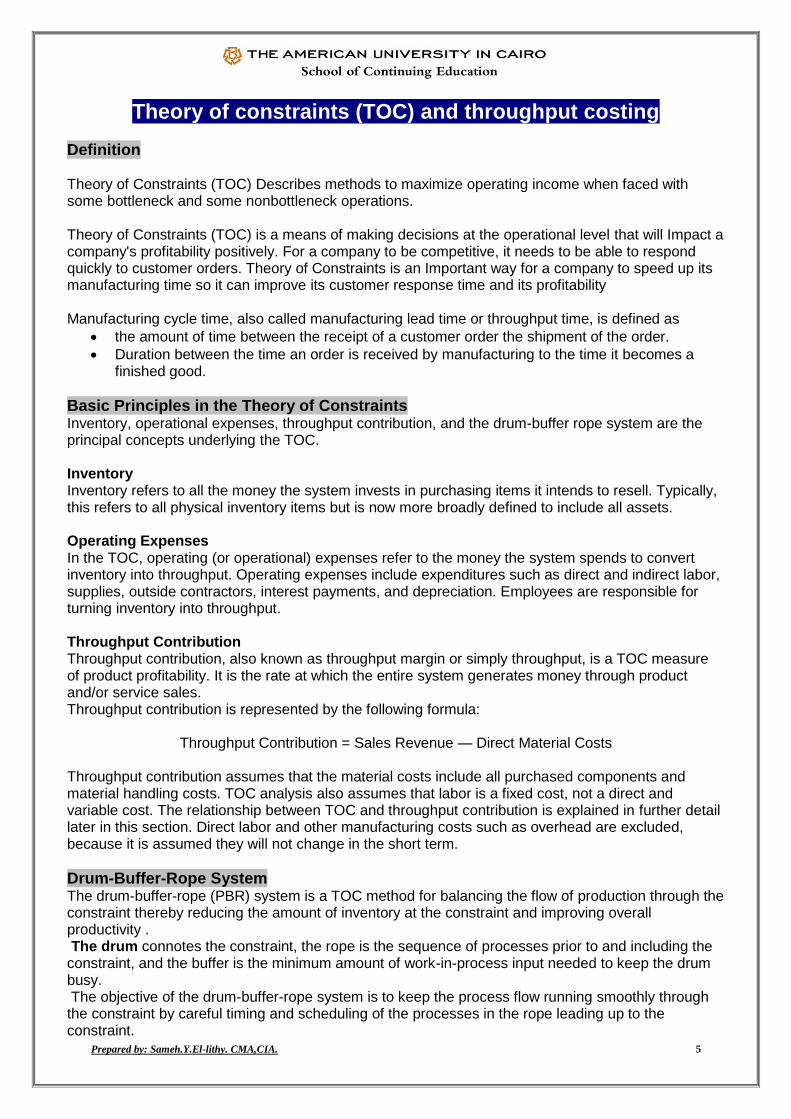
Theory of constraints (TOC) and throughput costing
Definition Theory of Constraints (TOC) Describes methods to maximize operating income when faced with some bottleneck and some nonbottleneck operations. Theory of Constraints (TOC) is a means of making decisions at the operational level that will Impact a company's profitability positively. For a company to be competitive, it needs to be able to respond quickly to customer orders. Theory of Constraints is an Important way for a company to speed up its manufacturing time so it can improve its customer response time and its profitability Manufacturing cycle time, also called manufacturing lead time or throughput time, is defined as
the amount of time between the receipt of a customer order the shipment of the order.
Duration between the time an order is received by manufacturing to the time it becomes a finished good.
Basic Principles in the Theory of Constraints Inventory, operational expenses, throughput contribution, and the drum-buffer rope system are the principal concepts underlying the TOC. Inventory Inventory refers to all the money the system invests in purchasing items it intends to resell. Typically, this refers to all physical inventory items but is now more broadly defined to include all assets. Operating Expenses In the TOC, operating (or operational) expenses refer to the money the system spends to convert inventory into throughput. Operating expenses include expenditures such as direct and indirect labor, supplies, outside contractors, interest payments, and depreciation. Employees are responsible for turning inventory into throughput. Throughput Contribution Throughput contribution, also known as throughput margin or simply throughput, is a TOC measure of product profitability. It is the rate at which the entire system generates money through product and/or service sales. Throughput contribution is represented by the following formula:
Throughput Contribution = Sales Revenue — Direct Material Costs Throughput contribution assumes that the material costs include all purchased components and material handling costs. TOC analysis also assumes that labor is a fixed cost, not a direct and variable cost. The relationship between TOC and throughput contribution is explained in further detail later in this section. Direct labor and other manufacturing costs such as overhead are excluded, because it is assumed they will not change in the short term.
Drum-Buffer-Rope System The drum-buffer-rope (PBR) system is a TOC method for balancing the flow of production through the constraint thereby reducing the amount of inventory at the constraint and improving overall productivity . The drum connotes the constraint, the rope is the sequence of processes prior to and including the constraint, and the buffer is the minimum amount of work-in-process input needed to keep the drum busy. The objective of the drum-buffer-rope system is to keep the process flow running smoothly through the constraint by careful timing and scheduling of the processes in the rope leading up to the constraint.

Prepared by: Sameh.Y.El-lithy. CMA,CIA. 6
The steps in a TOC analysis are as follows: 1. Identify the constraint. 2. Determine the most profitable product mix given the constraint. 3. Maximize the flow through the constraint. 4. Increase capacity at the constraint. . 5. Redesign the manufacturing process for greater flexibility and speed. Throughput margin A TOC measure of product profitability; it equals price less materials cost, including all purchased components and materials handling costs
Steps in the Theory of Constraints The theory of constraints includes five focusing steps designed to concentrate improvement efforts on the constraint most likely to have a positive impact on a system. Figure 1C-26 summarizes the five steps.
1. Identify the constraint.
2.Determine the most profitable product mix given the constraint. maximizing the contribution margin through the constraint called the throughput margin or throughput contribution
Throughput costing Companies involved in TOC use a form of variable costing(Throughput costing, sometimes called supervariable costing). However, one difference of the TOC approach is that it treats direct labor as a fixed cost for three reasons:
Many companies have a commitment to guarantee workers a minimum number of paid hours.
Direct labor is usually not the constraint.
TOC emphasizes the role direct laborers play in driving continuous improvement. Since layoffs often devastate morale, managers involved in TOC are extremely reluctant to lay off employees.
Throughput costing, sometimes called supervariable costing recognizes only direct materials costs as being truly variable and thus relevant to the calculation of throughput margin. All other manufacturing costs are ignored because they are considered fixed in the short run.
Throughput Contribution = Sales Revenue — Direct Material Costs Throughput costing puts a penalty on production without a corresponding sale in the same period. Costs other than direct materials that are variable with respect to production are expensed in the period of incurrence, whereas under variable costing they would be capitalized. As a result,
The constraint in a system is determined by the step that has the smallest capacity
Theory of constraints (TOC) analysis describes three basic measurements: throughput contribution (sales – direct materials), investments (raw materials; work-in-process; finished goods; R&D costs; and property, plant, and equipment), and operating costs (all costs except direct materials).

Prepared by: Sameh.Y.El-lithy. CMA,CIA. 7
throughput costing provides less incentive to produce for inventory than either variable costing or absorption costing. Advocates of throughput costing maintain that, in the short run, manufacturing costs other than direct materials are relatively fixed. They view costs relating to workers, equipment, occupancy, and so on as relatively fixed with respect to providing productive capacity during the period.
3.Maximize the flow through the constraint.
4.Increase capacity at the constraint.
5.Redesign the manufacturing process for greater flexibility and fast cycle time. Value engineering is useful for this purpose because it explicitly balances product cost and
the needs of potential customers (product functions).
TOC vs. ABC (complementary analytical tools)
TOC ABC
Main Objective
Short-term focus: through put margin analysis based on materials and materials-related costs
Long-term focus; analysis of all product costs, concerned with strategic pricing and profit planning
Resource constraints
Included explicitly, a principal focus of TOC
Not included explicitly
Cost drivers No direct utilization of cost drivers Develop an understanding of cost drivers at all levels
Major Use Optimization of production flow and short-term product mix
Strategic pricing and profit planning
Throughput is product produced and shipped.
Throughput time or manufacturing cycle time is the time that elapses between the receipt of a customer's order and the shipment of the order.
Throughput contribution margin Is revenue minus direct materials cost for a given period of time.
Only strictly variable costs which are usually only direct materials are considered Inventory costs. All other costs, even direct labor, are considered operating, or fixed, costs.
Theory of Constraints assumes that operating costs are fixed costs because it regards them as difficult to change in the short run.
Theory of Constraints focuses on short-run maximization of throughput contribution margin by managing operations at the constraint In order to improve the performance of production as a whole.
Three items that are measured in the theory of constraints are throughput contribution, inventory (or investments), and operating expenses.
• Throughput contribution = Sales revenue — Direct material costs • Inventory = (Materials costs in direct materials, Work-in-process, and Finished goods
inventories) + (R & D costs) + (Costs of equipment and buildings) • Operating expenses = All costs of operations, not including direct materials
Using this method, the objective is to maximize throughput contribution while reducing investments and operating costs.

Prepared by: Sameh.Y.El-lithy. CMA,CIA. 8
Capacity management and analysis
Intro A key issue in costing is choosing the capacity level for computing the allocation of manufacturing overhead. Determining the correct level of capacity to use is a difficult strategic decision for managers. The choice of capacity level used to allocate overhead can have a great effect on product cost information used by managers.
Excess capacity vs. too little capacity If a company has capacity in excess of what it needs, then it will incur large costs of unused capacity. Likewise, if a company has too little capacity to meet demand, then it may have trouble filling customer orders.
Determining the Level of Activity In relation to the allocation rate, the company must decide what activity to use for its budgeted amount of the activity level. The traditional method uses either machine hours or direct labor hours to allocate overhead. The company must decide how much output it will produce during the coming year. And, as a function of output, how many machine hours, or how many direct labor hours, it plans to use during the year. As this is one of the two figures used in the determination of the manufacturing overhead rate, it will greatly impact the allocation rate. The allocation rate is established for the full year. The budgeted overhead rate for the year multiplied by each month's budgeted activity level will be used to calculate the monthly budgeted overhead (see example following this explanation]*
Four choices to determine the output level In general, a company has four choices to determine the output level. Two relate to what the plant can supply; and two relate to the demand to the plant's output. These are called denominator-level capacity concepts, because they describe the denominators that can be used in the calculation of per unit overheat costs.
Supply Denominator-Level Concepts Theoretical or Ideal (perfect ) capacity - This is the level of activity that will occur IF the company produces at Its absolute most efficient level at all times(under ideal conditions). (This means no allowances for idle time and downtime and no machine breakdowns or maintenance, delays and no decrease in sales demand and no waste and no time lost to illness and that the workers are already working at maximum efficiency.). This is not a good basis to use because a company will not be able to achieve this level in the long run. Theoretical capacity represents the largest volume of output possible, but is unattainable and unrealistic.
Calculating overhead allocations Using theoretical capacity when calculating overhead allocations would mean that a large denominator activity level would be used, resulting in a lower overhead allocation to individual units of product. This would distort the allocated costs (making them too low) and provide management with product cost information that is not representative of actual costs. Practical (or currently attainable) capacity - This is the theoretical level reduced by allowances For idle time and downtime, but not For a decrease in sales demand. Thus it represents the highest level of capacity that can be achieved, while allowing for unavoidable losses of productive time, such as machine breakdowns, employee vacations, maintenance, etc. Unlike theoretical capacity, it is the level of capacity that can realistically be achieved.

Prepared by: Sameh.Y.El-lithy. CMA,CIA. 9
This is the level that will be achieved given the normal amount of time lost, normal amount of waste and a normal learning curve for employees. The goal is to use a level that Is attainable, but difficult to attain. This will motivate the workers and still require them to work diligently. Practical capacity is a better choice to use as the denominator activity level for allocating overhead, because it is realistic and will generate product costs that accurately reflect the cost of the product. By using practical capacity to calculate product costs, the company is not over- or under-allocating costs to each unit of product. Instead, a “practical” or “realistic” amount of overhead is allocated to each unit produced. As a result, many companies prefer to use practical capacity as the denominator to calculate the allocated overhead rate.
Demand Denominator-Level Concepts Master budget capacity utilization (or expected actual capacity utilization) - Master budget capacity, also called expected actual capacity, is the amount of output actually expected during the next budget period based on expected demand. This level will result in a different overhead rate for each budget period because of increases or decreases in planned production due to expected increases or decreases in demand. Normal capacity utilization - This is the level of activity that will be achieved in the long run, taking into account seasonal changes in the business and cyclical changes. Seasonal changes in business result From the seasons during the year and cyclical changes are connected to the larger business cycle. Normal capacity utilization is the level of activity that will satisfy average customer demand over a long-term period such as 2-3 years. Though this will cause inaccuracies in some years, they will be offset in others. This is the method that a company should generally use to determine the overhead standard cost. Usually normal capacity or expected actual capacity (also called master budget capacity) is used as the denominator in calculating the overhead standard rate. It is much simpler if the activity level used in developing the overhead standard is the same activity level as is used in developing the budgeted overhead costs. If it is not, differences between budgeted costs and standard costs due to the: different activity levels will appear in variance reports as additional variances.
Example: Total overhead is budgeted to be $900,000 for the budget year.
Output, based on normal capacity utilization, is budgeted at 500,000 units for the year. The overhead allocation rate, based on units of production, is $1.80 per unit ($900,000÷ 500,000). Overhead is allocated based on machine hours. So we need to convert that to a rate per machine hour. The standard number of machine hours for each unit produced is 1.5 machine hours, so total machine hours budgeted for the year is 500,000 * 1.5, or 750,000. Therefore, the amount of overhead to be budgeted for each machine hour allowed For the budgeted output is $ 1.20 ($1.80 per unit ÷ 1.5 machine hours per unit OR $900,000 ÷ 750,000 machine hours). Production is not planned to take place evenly throughout the year. The production budget For the first quarter calls for 40,000 units to be produced in January, 50,000 in February, and 45,000 in March. Therefore, budgeted overhead will be (40,000 K $1.80) or $72,000 in January, (50,000 X $1.80) or $90,000 in February, and (45,000 X $1.80) or $81,000 in March. We can calculate the same amounts by using machine hours: January's budgeted machine hours is 40,000 production units X 1.5 machine hours per unit, or 60,000 machine hours. 60,000 machine hours x $1.20 per machine hour = $72,000 budgeted overhead for January, and so forth for February and March. At the end of the year, the total budgeted overhead for the year should equal $900,000. We will have allocated it unequally to each month in the year, based upon each month's budgeted output.

Prepared by: Sameh.Y.El-lithy. CMA,CIA. 10
Contemporary Productivity Approaches
(Technique / Description)
Automation/robots Uses reprogrammable, multifunctional robots (machines) designed to manipulate materials, parts, tools, or specialized devices through variable programmed motions Applies robots to the performance of a variety of repetitive tasks
Capacity management and analysis (capacity planning) Represents an important decision-making area involving strategic, tactical, and operational aspects Includes an iterative procedure that: Reviews long-term demand forecasts Translates forecasts into capacity requirements Matches the capacity requirements to present facilities Identifies mismatches between capacity requirements and projected availability Devises plans to overcome mismatches and selects the best alternative
Computer-aided design (CAD) Uses computers in product development, analysis, and design modification to improve the quality and performance of the product Usually entails the drawing or physical layout steps of engineering design
Computer-aided manufacturing (CAM) Applies the computer to the planning, control, and operation of a production facility
Computer- integrated manufacturing (CIM) Involves a manufacturing system that completely integrates all factory and office functions within a company via a computer-based information network Uses computers to control the integration and flow of information between design, engineering, manufacturing, logistics, warehousing and distribution, customers and suppliers, sales and marketing activities, and accounting Facilitates hour-by-hour manufacturing management
Concurrent engineering (simultaneous engineering) Integrates product or service design with input from all business units and functions throughout a product’s or service’s life cycle. Emphasizes upstream prevention versus downstream correction. Attempts to balance the needs of all parties in product or service design while maintaining customer requirements
Flexible manufacturing system (FMS) Uses a computerized network of automated equipment that produces one or more groups of parts or variations of a product in a flexible manner

Prepared by: Sameh.Y.El-lithy. CMA,CIA. 11
Value-chain analysis
Definition Value chain The sequence of business functions in which usefulness is added to the products of services of a company. Value-chain analysis A strategic analysis tool used to
identify where value to customers can be increased or costs reduced, and
to better understand the firm's linkages with suppliers, customers, and other firms in the industry.
o Because the value chain identifies and connects the organization's strategic activities, value chain analysis improves the firm's knowledge of its relations with customers; suppliers, and competitors.
It also facilitates the strategic determination of the phase(s) of the industry's Value chain in which the firm should operate.
to focus on those activities that are consistent with its overall strategy.
help an organization gain competitive advantage by identifying what steps or activities do and do not increase the value to the customers.
o Once those areas are identified, the organization can increase the related benefits, or reduce (even eliminate) non value-added activities. The increase in value to the customer and/or the decrease in production costs will make the company more competitive. The firm should analyze each step in its operations carefully to determine how each activity contributes to the company's profits and its competitiveness.
offers an excellent opportunity to integrate strategic planning and management accounting to guide the firm to survival and growth.
The business functions in the value chain are • Research and development—generating and experimenting with ideas related to new products, services, or processes. • Design of products, services, and processes—the detailed planning and engineering of products, services, or processes. • Production—acquiring, coordinating, and assembling resources to produce a product or deliver a service. • Marketing—promoting and selling products or services to customers or prospective customers. • Distribution—delivering products or services to customers. • Customer service—providing after-sale support to customers.

Prepared by: Sameh.Y.El-lithy. CMA,CIA. 12
Steps in Value Chain Analysis There are three steps in value chain analysis: 1) Identify the activities that add value to the finished product. These activities depend upon the industry and what the company does (manufacturing, resale, etc.). They will be whatever activities this firm and firms in its industry perform in the processes of designing a product or service, manufacturing the product, marketing it and providing customer service after the sale. 2) Identify the cost driver or cost drivers for each activity, and 3) Develop a competitive advantage by adding value to the customer or reducing the costs of the activity. For example,
R&D can add value to established products or services by finding ways to improve them, in addition to developing new ones.
Production's function is to acquire the necessary raw materials and assemble them into finished goods. By doing this efficiently, costs can be lowered, leading to higher profits.
Marketing adds value by informing customers about the products or services, which may increase the utility that customers attribute to the product or service and enable the company to charge a higher price. Marketing can also discover what customers want and need through marketing research and communicate that to the R&D group so the R&D group can design products that match the customers' needs.
Customer service after the sale adds value by delighting customers with the responsive service received, thus creating superior value for them. Increased utility for customers because of excellent customer service can also enable the company to charge more for its products.
Value chain and supply chain analysis Supply chain describes the flow of goods, services, and information from the initial sources of materials and services to the delivery of products to consumers, regardless of whether those activities occur in the same organization or in other organizations. Cost management is most effective when it integrates and coordinates activities across all companies in the supply chain as well as across each business function in an individual company’s value chain. Attempts are made to restructure all cost areas to be more cost-effective. Value chain and supply chain analysis performed by the management accounting function can contribute to the achievement of key success factors. When each business function adds value and all business functions are coordinated and well integrated, it contributes to cost control, high quality, timely response, and innovation. Value engineering is a systematic evaluation of all aspects of the value-chain business functions, with the objective of reducing costs while satisfying customer needs. Value engineering via improvement in product and process designs is a principal technique that companies use to achieve target costs per unit.

Prepared by: Sameh.Y.El-lithy. CMA,CIA. 13
Value-added concepts Intro Process value analysis is a comprehensive understanding of how an organization generates its output. It involves a determination of which activities that use resources are value-adding or nonvalue-adding and how the latter may be reduced or eliminated.
Definition
High-value-added activity A high-value-added activity increases significantly the value of the product or service to the customers. Removal of a high-value-added activity decreases perceptively the value of the product or service to the customer. Such an activity may be mandated (e.g., a regulatory requirement) or discretionary. High-value-added activities are those: That are necessary or required to meet customer requirements or expectations. That enhance purchased materials or components of a product. That contribute to customer satisfaction. That are critical steps in a business process. That are performed to resolve or eliminate quality problems. That are performed upon request of a satisfied customer. That you would do more of, if time permitted. Examples : Inserting a flange into a part, pouring molten metal into a mold, and preparing a field for planting are examples of high-value-added activities. Installing software to protect a computer from spam is a high-value-added activity to customers annoyed by bombardments of unwanted e-mail. Designing, processing, and delivering products and services are high-value-added activities. Value-added cost A value-added cost is incurred to perform a value-added activity without waste. It is a cost that customers perceive as adding value, or utility, to a product or service. Examples are costs of materials, direct labor, tools, and machinery.
Low-value-added activity A low-value-added activity consumes time, resources, or space, but adds little in satisfying customer needs. If eliminated, customer value or satisfaction decreases inperceptively or remains unchanged. Moving parts between processes, waiting time, repairing, and rework are examples of low-value-added activities. Low-value-added activities are those that: Can be eliminated without affecting the form, fit, or function of the product or service. Begin with prefix “re” (such as rework or returned goods). Result in waste and add little or no value to the product or service. Are performed due to inefficiencies or errors in the process stream. Are duplicated in another department or add unnecessary steps to the business process. Are performed to monitor quality problems. Are performed due to a request of an unhappy or dissatisfied customer. Produce an unnecessary or unwanted output. If given the option, you would prefer to do less of. A nonvalue-added cost is caused by a nonvalue-added activity or inefficient performance of a value-added activity. It is a cost that customers do not perceive as adding value, or utility, to a product or service. Examples of nonvalue-added costs are costs of rework, scrap, expediting, and breakdown maintenance.

Prepared by: Sameh.Y.El-lithy. CMA,CIA. 14
A Classification of High-Value-Added and Low-Value-AddedActivities Activity High-Value-Added Low-Value-Added Designing product X Setting up X Waiting X Moving X Processing X Reworking X Repairing X Storing X Inspecting X Delivering product X Example of an Activity Analysis
Examples Value-added costs: Materials and labor for regular repairs Nonvalue-added costs: Rework costs, expediting costs caused by work delays, breakdown maintenance of equipment Gray area: Materials handling costs, Materials procurement and inspection costs, Preventive maintenance of equipment Classifications of value-added, nonvalue-added, and gray area costs are often not clear-cut. Other classifications of some of the cost categories are also plausible. For example, some students may include materials handling, materials procurement, and inspection costs and preventive maintenance as value-added costs (costs that customers perceive as adding value and as being necessary for good repair service) rather than as in the gray area. Preventive maintenance, for instance, might be regarded as value-added because it helps prevent nonvalueadding breakdown maintenance. The selection of value-added activities in each place of the value chain reflects the firm's determination of its competitive advantage and its choice of competitive strategy. For example, different design strategies require different activities and costs. A firm might choose to be the low-cost producer of an undifferentiated product rather than compete on the basis of superior product quality.

Prepared by: Sameh.Y.El-lithy. CMA,CIA. 15
Activity-based management (ABM)
Intro The linkage of product costing and continuous improvement of processes is activity-based management (ABM). ABM redirects and improves the use of resources to increase the value created for customers and other stakeholders. It encompasses activity analysis, cost driver analysis, and quality performance measurement.
o Kaizen is the Japanese word for the continuous pursuit of improvement in every aspect of organizational operations. For example, a budget prepared on the kaizen principle projects costs based on future improvements. The possibility of such improvements must be determined, and the cost of implementation and the savings there from must be estimated.
Definition Management decisions and activity analysis that use activity-based costing information to satisfy customers and improve operational control, management control and profitability. Activity-Based Management (ABM)
o manages activities to improve the value of products or services to customers and increase the firm’s competitiveness and profitability.
o ABM draws on ABC as its major source of information and focuses on the efficiency and effectiveness of key business processes and activities.
o Using ABM, management can pinpoint avenues for improving operations, reducing costs, or increasing values to customers.
o By identifying resources spent on customers, products, and activities, ABM improves management’s focus on the firm’s critical success factors and enhances its competitive advantage.
ABM applications can be classified into two categories: operational ABM and strategic ABM.
o Operational ABM enhances operation efficiency and asset utilization and lowers costs; its focuses are on doing things right and performing activities more efficiently.
o Operational ABM applications use management techniques such as activity management, business process reengineering, total quality management, and performance measurement.
o Strategic ABM attempts to alter the demand for activities and increase profitability through improved activity efficiency.
o Strategic ABM focuses on choosing appropriate activities for the operation, eliminating nonessential activities and selecting the most profitable customers. Strategic ABM applications use management techniques such as process design, customer profitability analysis, and value chain analysis.
Advantages and Disadvantages of ABM ABM has the following advantages over traditional cost management techniques:
• Uses continuous improvement to maintain the firm’s competitive advantage • Allocates more resources to activities, products, and customers that add more value,
strategically redirecting management focus • Eliminates non-value-added activities. • Measures process effectiveness and identifies areas to reduce costs or increase customer
value. • Works well with just-in-time processes. • Ties performance measurement to ABC to provide consistent incentives for using ABC.

Prepared by: Sameh.Y.El-lithy. CMA,CIA. 16
ABM has the following disadvantages when compared to traditional cost management: • Changing to ABC/ABM will result in different pricing, process design, manufacturing technology, and product design decisions, and the company must be prepared to support managers who embrace these methods and discourage managers who continue to use the older methods. • ABC/ABM is not used for external financial reporting, and needing to prepare reports using traditional methods may influence management decision making enough to dilute the impact of ABC/ABM. • Implementing ABC/ABM is expensive and time-consuming, so a cost-benefit analysis should be done to identify all hidden costs and benefits.
Process analysis and business process reengineering
Intro Technological advances have increased the popularity of business process reengineering. Process improvements and productivity gains achieved through total quality management (TQM) are generally incremental gains achieved by tweaking a system and reducing inputs. In contrast, process reengineering and business process reengineering offer deeper, more sweeping gains.
Definition Process A process is how something is accomplished in a firm. It is a set of activities directed toward the same objective. A process is an activity or a group of interrelated activities that takes an input of materials and/or resources, adds value to it, and provides an output to internal or external customers. Reengineering Is process innovation and core process redesign. Instead of improving existing procedures, it finds new ways of doing things. Thus, reengineering should be contrasted with process improvement. Process improvement Consists of incremental but constant changes that improve efficiency. Process reengineering Process reengineering diagrams a process in detail, evaluates and questions the process [low, and then completely redesigns the process to eliminate unnecessary steps, reduce opportunities for errors, and reduce costs. All activities that do not add value are eliminated. Process analysis a collection of analytic methods that can be used to examine and measure the basic elements for a process to operate. It can also identify those processes with the greatest need for improvement. Process analysis looks at the linkage of quality, productivity, and process improvements: • Productivity implies trying to improve upon what already exists. • Improving productivity requires continuous quality improvement. • Continuous improvement necessitates ongoing organizational learning, process improvements, and reengineering. These continuous productivity improvements, then can help an organization be competitive in the long term. Business process reengineering (BPR) Is a complete rethinking of how business functions are performed to provide value to customers, that is, radical innovation instead of mere improvement, and a disregard for current jobs, hierarchies, and reporting relationships.

Prepared by: Sameh.Y.El-lithy. CMA,CIA. 17
Business process reengineering (BPR) is the fundamental analysis and radical redesign of business processes within and between enterprises to achieve dramatic improvements in performance (for example, cost, quality, speed, and service). BPR promotes the idea that sometimes wiping the slate clean and radically redesigning and reorganizing an enterprise is necessary to lower costs and increase the quality of a product or service. BPR involves changes that are: Fundamental — BPR forces people to look at tacit rules and assumptions underlying the way they currently do business. Firms must answer two questions: Why do we do what we do? Why do we do it the way we do it? Radical — BPR is about reinvention, not improvement or modification. A radical redesign means disregarding existing processes and inventing new ways of doing work. Dramatic — BPR is not for the faint at heart. It should be used when the need for “heavy blasting” is required to alleviate a dire situation. If you need only a slight bump in process improvement, there is no need to reengineer. Process — BPR is about a process orientation with a heavy emphasis on the chain of activities that take input and create output of value to the customer. Accordingly, BPR techniques eliminate many traditional controls. They exploit modern technology to improve productivity and decrease the number of clerical workers. Thus, the emphasis is on developing controls that are automated and self-correcting and require minimal human intervention. The emphasis therefore shifts to monitoring internal control so management can determine when an operation may be out of control and corrective action is needed. Most BPR techniques also assume that humans will be motivated to work actively in improving operations when they are full participants in the process. Monitoring-assesses the quality of internal control over time. Management considers whether internal control is properly designed and operating as intended and modifies it to reflect changing conditions, Monitoring may be in the form of separate, periodic evaluations or of ongoing monitoring. Ongoing monitoring occurs as part of routine operations. It includes management and supervisory review, comparisons, reconciliations, and other actions by personnel as part of their regular activities.

Prepared by: Sameh.Y.El-lithy. CMA,CIA. 18
Benchmarking
Definition a continuous, systematic process of measuring products, services, and practices against the best levels of performance. Thus helping an organization to be competitive. Benchmarking is an ongoing process that entails quantitative and qualitative measurement of the difference between the company's performance of an activity and the performance by the best in the world. The benchmark organization need not be a competitor.
Mechanism It analyzes and measures the key outputs of a business process or function against the best and also identifies the underlying key actions and root causes that contribute to the performance difference. Many people think of benchmarking as simply capturing best-in-class information, but the practice has a much wider application. Quite often, best-in-class levels are comparisons to external benchmarks of industry leaders. However, they may also be based on internal benchmarking information or measures from other organizations (outside an industry) that have similar processes.
Benchmarking phases 1) Select and prioritize benchmarking projects. 2) The next phase is to organize benchmarking (cross functional) teams. 3) Documenting own work process: determining relevant benchmarking measurements 3) Researching and identifying best-in-class performance 4) Analyzing benchmarking data: The data analysis phase entails identifying performance gaps, understanding the reasons they exist; and prioritizing the key activities that will facilitate the behavioral and process changes needed to implement the benchmarking study's recommendations. 5) The implementation phase (Leadership is most important).
Benchmarking and Creating Competitive Advantage Benchmarking studies in various forms (best practice, functional, process, and competitive) were freely conducted, generally without a context. Invalid comparisons were often made (for example, comparing the growth of a highly leveraged company to one internally financed from earnings, or comparing the growth of a company in a low-cost environment to one in Silicon Valley). Given such misapplications, most of these benchmarking studies were not particularly cost-effective. However, well-designed and properly applied benchmarking can be a powerful tool in helping an organization to be competitive. Through benchmarking, a firm identifies best-in-class levels and conducts a study to determine how those levels can be adopted and lead to improved performance. It provides a rational method for setting performance goals and gaining market leadership; important decisions are based on facts and data, rather than on emotions. Because benchmarking is based on what the best are doing, it provides an accurate assessment of what needs to change.

Prepared by: Sameh.Y.El-lithy. CMA,CIA. 19
Best practice analysis
Definition
A best practice generally refers to a process or technique that has produced outstanding results in one situation and that can be applied and/or adapted to improve effectiveness, efficiency, quality, safety, innovativeness, and/or some other performance measure in another situation. Best practice analysis refers to the collective steps in a gap analysis.
o A gap analysis is generally described as the difference between the current state and a desired state, or “the space between what is and what an organization hopes to be.”
Best practice analysis involves assessing how a firm’s given performance level measures up to a best practice and then defining the logical next steps in transitioning to the desired performance level. Typical activities are:
o Defining the gap (through a comparison to internal operational data) o Determining the reasons for the gap o Examining the factors that contribute to the existence of the best practice(s) o Developing recommendations and an approach to implement the best practice(s)
Techniques and tools for conducting a best practice analysis vary. Qualitative and quantitative tools are used but most of the tools are common to total quality management and kaizen. It may be said that best practice analysis tools—such as value chain analysis, process analysis, business process reengineering, benchmarking, total quality management, and kaizen---are the clout behind business process improvement initiatives. Best practice analysis enables firms to identify and undertake performance improvements.

Prepared by: Sameh.Y.El-lithy. CMA,CIA. 20
Cost of quality analysis The costs of quality (COQ) refer to the costs incurred to prevent, or the costs arising as a result of, producing a low-quality product. Costs of quality are classified into four categories; examples for each category are listed in the next Exhibit. 1. Prevention costs-costs incurred to preclude the production of products that do not conform to specifications. 2. Appraisal costs-costs incurred to detect which of the individual units of products do not conform to specifications. 3. Internal failure costs-costs incurred on a defective product before it is shipped to customers. 4. External failure costs-costs incurred on a defective product after it is shipped to customers.
Items Pertaining to Costs-at-Quality Reports
SMA 4R lists four categories of costs of quality: prevention, appraisal, internal failure, and external failure. An organization should attempt to minimize its total cost of quality.
a. Conformance costs include prevention and appraisal, which are both financial measures of
internal performance. 1) Prevention attempts to avoid defective output. These costs include preventive maintenance,
employee training, review of equipment design, and evaluation of suppliers. o Prevention costs are the costs of quality system design, implementation, and maintenance,
including audits of the quality system itself. Examples include quality planning, review of new products, surveys of supplier capabilities, team meetings for quality, and training for quality, as well as related to ensuring the quality or quality improvement of the product: market research, product testing, and product design.
2) Appraisal embraces such activities as statistical quality control programs, inspection, and testing.
o Appraisal costs are the costs of auditing processes for quality, including formal and informal measurements and evaluations of quality levels and setting quality standards and performance requirements. Examples include inspection and testing of raw materials, work-in-process and finished goods testing, calibration of equipment, and audits or operations or services. In addition, they address more externally focused costs such as monitoring market reaction and competitors’ products.
b. Nonconformance costs include costs of internal failure (a financial measure of internal
performance) and external failure costs (a financial measure of customer satisfaction). 1) Internal failure costs occur when defective products are detected before shipment. a) Examples are scrap, rework, tooling changes, downtime, redesign of products or processes, lost output, reinspection and retesting, expediting of operations after delays, lost learning opportunities, and searching for and correcting problems.

Prepared by: Sameh.Y.El-lithy. CMA,CIA. 21
Internal failure costs include the costs involved with defective products and components that are caught before shipping them to the customer. Examples include scrap, rework, spoilage, retesting, and reinspection. They also include systemic problems such as the inability to meet the design, manufacturing, and service standards identified for the product. 2) The costs of external failure or lost opportunity include lost profits from a decline in market share as dissatisfied customers make no repeat purchases, return products for refunds, cancel orders, and communicate their dissatisfaction to others. a) Thus, external failure costs are incurred for customer service complaints; rejection, return, repair, or recall of products or services; warranty obligations; products liability claims; and customer losses. b) Environmental costs are also external failure costs, e.g., fines for nonadherence to environmental law and loss of customer goodwill. External failure costs are the costs involved with shipping a defective product to a customer. Examples include customer complaints, returns, product recalls, and warranty claims. Overall, these costs relate to an inability to meet customer perceptions for product quality and service. i) To minimize environmental damage and its resulting costs, the International Organization for Standardization has issued ISO 14000 standards to promote the reduction of environmental damage by an organization’s products, services, and operations and to develop environmental auditing and performance evaluation systems.
Continuous improvement concepts The term kaizen is a Japanese word that means "improvement." As used in business, it implies "continuous improvement," or slow but constant incremental improvements being made in all areas of business operations. Small-scale improvements are considered to be less risky than a major overhaul of a system or process. The slow accumulation of small developments in quality and efficiency can, over time, lead to very high quality and very low costs. Kaizen needs to be a part of the corporate culture. It requires conscious effort to think about ways that tasks could be done better. This can be difficult to maintain and takes years to show results, but if done properly, it confers a sustained competitive advantage. Kaizen also has something to say about standards in manufacturing. If you recall, we said that standard costs may be either Ideal standards, attainable only under the best possible conditions, or practical, expected costs, which are challenging to attain, but attainable under normal conditions. Toyota, the company most recognized for its use of kaizen, would say that standards are temporary and not absolutes. Improvement is always possible, and the goal is to attain the ideal standard. Even though practical standards are being attained, the ultimate goal is still not being achieved. A company may use target costing along with kaizen principles to determine what its ideal standard costs are. This puts the focus on the market because it starts with a target price based on the market price. The market determines the target price, and the company must attain the target cost in order to realize its desired profit margin for the product. The Ideal standard is thus defined as the target cost, or the standard cost that will enable the company to attain its desired cost and desired profit margin. Using Kaizen principles, the company figures out how it can manufacture the product for the target cost. The standard is achieved through development of new manufacturing methods and techniques that entail continuous improvement Or the ongoing search for new ways to reduce costs. Implementing ideal standards and quality improvements is the heart of the kaizen concept. Kaizen challenges people to imagine the ideal condition and strive to make the necessary improvements to achieve that ideal.
Ideal standards have been adopted by some companies that apply continuous improvement and other total quality management principles.