Jurnal Teknologi Full paper -...
6
70:2 (2014) 65–70 | www.jurnalteknologi.utm.my | eISSN 2180–3722 | Full paper Jurnal Teknologi Preparation and Photocatalytic Activity of Mixed Phase Anatase/rutile TiO 2 Nanoparticles for Phenol Degradation Mohamad Azuwa Mohamed a,b , Wan Norharyati Wan Salleh a,b* , Juhana Jaafar a,b , Norhaniza Yusof a,b a Advanced Membrane Technology Research Centre, Universiti Teknologi Malaysia, 81310 UTM Johor Bahru, Johor, Malaysia b Faculty of Petroleum and Renewable Energy Enginneering, Universiti Teknologi Malaysia, 81310 UTM Johor Bahru, Johor, Malaysia *Corresponding author: [email protected] Article history Received :1 November 2013 Received in revised form : 1 June 2014 Accepted :30 June 2014 Graphical abstract Abstract The evolution of desirable physico-chemical properties in high performance photocatalyst materials involves steps that must be carefully designed, controlled, and optimized. This study investigated the role of key parameter in the preparation and photocatalytic activity analysis of the mixed phase of anatase/rutile TiO2 nanoparticles, prepared via sol-gel method containing titanium-n-butoxide Ti(OBu)4 as a precursor material, nitric acid as catalyst, and isopropanol as solvent. The prepared TiO2 nanoparticles were characterized by means of XRD, SEM, and BET analyses, and UV-Vis-NIR spectroscopy. The results indicated that the calcination temperature play an important role in the physico-chemical properties and photocatalytic activity of the resulting TiO2 nanoparticles. Different calcination temperatures would result in different composition of anatase and rutile. The photocatalytic activity of the prepared mixed phase of anatase/rutile TiO2 nanoparticles was measured by photodegradation of 50 ppm phenol in an aqueous solution. The commercial anatase from Sigma- Aldrich and Degussa P25 were used for comparison purpose. The mixed phase of anatase/rutile TiO2 nanoparticles (consists of 38.3% anatase and 61.7% rutile) that was prepared at 400°C exhibited the highest photocatalytic activity of 84.88% degradation of phenol. The result was comparable with photocatalytic activity demonstrated by Degussa P25 by 1.54% difference in phenol degradation. The results also suggested that the mixed phase of anatase/rutile TiO2 nanoparticles is a promising candidate for the phenol degradation process. The high performance of photocatalyst materials may be obtained by adopting a judicious combination of anatase/rutile and optimized calcination conditions. Keywords: Mixed phase anatase/rutile; TiO2 nanoparticles; phenol degradation; calcination temperature; photocatalytic © 2014 Penerbit UTM Press. All rights reserved. 1.0 INTRODUCTION The ability to degrade organic and inorganic pollutants comes from redox environment that is generated from photoactivation, and this makes the semiconductor TiO2 to be intensively utilized as a photocatalyst in wastewater treatment [1–3]. The photoactivation of TiO2 photocatalyst occurs when the absorption of UV irradiation onto TiO2 particles surface takes place. The UV irradiation absorption can be equal or higher than the band gap value of 3.2 eV for anatase or 3.0 eV for rutile [4, 5]. The TiO2 exists in three distinct polymorphs, which are anatase, rutile (both tetragonal crystal systems), and brookite (orthorhombic crystal system) [6, 7]. Among these three TiO2, anatase possesses the best photocatalytic properties, followed by rutile, and brookite. The study on the band gap alignment of rutile and anatase TiO2 has proven that the mixed phase of anatase/rutile TiO2 would have synergistic effects and higher photocatalytic activity as compared to pure phase of either in anatase or rutile [4]. Degussa P25 and Aeroxide TiO2 P25 are the common commercial mixed phases of anatase/rutile TiO2 with 80% anatase and 20% rutile. The reason for the synergistic effects of the mixed phase of anatase/rutile TiO2 nanoparticles in photocatalytic properties has still remained elusive. It is believed that the mixed phase of anatase/rutile TiO2 can improve the charge carrier separation through electron trapping in rutile and reduce the electron recombination. As a result, the formation of radical species for oxidation of substrate molecules can be maintained [8]. Sol-gel is one of the most prominent methods used to prepare mixed phase of anatase/rutile TiO2 nanoparticles since it provides simplicity and low equipment requirements. The preparation of TiO2 from sol-gel gives some advantages, such as the production of high purity nanocrystalline through precipitation, and the flexibility to control the synthesis process [9]. There are three main chemical reagents required in the preparation of TiO2 via sol-gel method, which are precursor or the starting material for Ti source, acid catalyst, and solvent as
Transcript of Jurnal Teknologi Full paper -...
70:2 (2014) 65–70 | www.jurnalteknologi.utm.my | eISSN 2180–3722 |
Full paper Jurnal
Teknologi
Preparation and Photocatalytic Activity of Mixed Phase Anatase/rutile TiO2 Nanoparticles for Phenol Degradation Mohamad Azuwa Mohameda,b, Wan Norharyati Wan Salleha,b*, Juhana Jaafara,b, Norhaniza Yusofa,b
aAdvanced Membrane Technology Research Centre, Universiti Teknologi Malaysia, 81310 UTM Johor Bahru, Johor, Malaysia bFaculty of Petroleum and Renewable Energy Enginneering, Universiti Teknologi Malaysia, 81310 UTM Johor Bahru, Johor, Malaysia
*Corresponding author: [email protected]
Article history
Received :1 November 2013 Received in revised form :
1 June 2014
Accepted :30 June 2014
Graphical abstract
Abstract
The evolution of desirable physico-chemical properties in high performance photocatalyst materials involves steps that must be carefully designed, controlled, and optimized. This study investigated the
role of key parameter in the preparation and photocatalytic activity analysis of the mixed phase of
anatase/rutile TiO2 nanoparticles, prepared via sol-gel method containing titanium-n-butoxide Ti(OBu)4
as a precursor material, nitric acid as catalyst, and isopropanol as solvent. The prepared TiO2
nanoparticles were characterized by means of XRD, SEM, and BET analyses, and UV-Vis-NIR
spectroscopy. The results indicated that the calcination temperature play an important role in the physico-chemical properties and photocatalytic activity of the resulting TiO2 nanoparticles. Different
calcination temperatures would result in different composition of anatase and rutile. The photocatalytic
activity of the prepared mixed phase of anatase/rutile TiO2 nanoparticles was measured by photodegradation of 50 ppm phenol in an aqueous solution. The commercial anatase from Sigma-
Aldrich and Degussa P25 were used for comparison purpose. The mixed phase of anatase/rutile TiO2
nanoparticles (consists of 38.3% anatase and 61.7% rutile) that was prepared at 400°C exhibited the highest photocatalytic activity of 84.88% degradation of phenol. The result was comparable with
photocatalytic activity demonstrated by Degussa P25 by 1.54% difference in phenol degradation. The
results also suggested that the mixed phase of anatase/rutile TiO2 nanoparticles is a promising candidate for the phenol degradation process. The high performance of photocatalyst materials may be
obtained by adopting a judicious combination of anatase/rutile and optimized calcination conditions.
Keywords: Mixed phase anatase/rutile; TiO2 nanoparticles; phenol degradation; calcination
temperature; photocatalytic
© 2014 Penerbit UTM Press. All rights reserved.
1.0 INTRODUCTION
The ability to degrade organic and inorganic pollutants comes
from redox environment that is generated from photoactivation,
and this makes the semiconductor TiO2 to be intensively utilized
as a photocatalyst in wastewater treatment [1–3]. The
photoactivation of TiO2 photocatalyst occurs when the
absorption of UV irradiation onto TiO2 particles surface takes
place. The UV irradiation absorption can be equal or higher than
the band gap value of 3.2 eV for anatase or 3.0 eV for rutile [4,
5]. The TiO2 exists in three distinct polymorphs, which are
anatase, rutile (both tetragonal crystal systems), and brookite
(orthorhombic crystal system) [6, 7]. Among these three TiO2,
anatase possesses the best photocatalytic properties, followed by
rutile, and brookite.
The study on the band gap alignment of rutile and anatase
TiO2 has proven that the mixed phase of anatase/rutile TiO2
would have synergistic effects and higher photocatalytic activity
as compared to pure phase of either in anatase or rutile [4].
Degussa P25 and Aeroxide TiO2 P25 are the common
commercial mixed phases of anatase/rutile TiO2 with 80%
anatase and 20% rutile. The reason for the synergistic effects of
the mixed phase of anatase/rutile TiO2 nanoparticles in
photocatalytic properties has still remained elusive. It is
believed that the mixed phase of anatase/rutile TiO2 can
improve the charge carrier separation through electron trapping
in rutile and reduce the electron recombination. As a result, the
formation of radical species for oxidation of substrate molecules
can be maintained [8]. Sol-gel is one of the most prominent methods used to
prepare mixed phase of anatase/rutile TiO2 nanoparticles since it
provides simplicity and low equipment requirements. The
preparation of TiO2 from sol-gel gives some advantages, such as
the production of high purity nanocrystalline through
precipitation, and the flexibility to control the synthesis process
[9]. There are three main chemical reagents required in the
preparation of TiO2 via sol-gel method, which are precursor or
the starting material for Ti source, acid catalyst, and solvent as

66 Wan Norharyati Wan Salleh et al. / Jurnal Teknologi (Sciences & Engineering) 70:2 (2014) 65–70
dispersing media. The most common precursor used in the
preparation of anatase nanocrystalline are titanium-n-butoxide
[9–11], titanium (IV) isopropoxide [12, 13], and tetrabutyl
orthotitanate [14]. The highly crystalline TiO2 nanoparticles can
be prepared via sol-gel, and followed by heat treatment that
ranges from 0 to 600°C [11, 15]. It has been reported that the
high quality of mixed phase of anatase/rutile TiO2 nanoparticles,
which contributes to high photocatalytic activity, can also be
obtained by manipulating the types of reagents and heat
treatment conditions [7, 16, 17].
Therefore, the aim of this research was to prepare a mixed
phase of anatase/rutile TiO2 nanoparticles with high
photocatalytic properties via sol-gel method by manipulating the
calcination temperature. In this study, the titanium-n-butoxide,
Ti(OBu)4 was used as Ti precursor, nitric acid as catalyst, and
isopropanol and distilled water as the dispersing media. The
photocatalytic activity of the prepared TiO2 nanoparticles was
evaluated by using the photodegradation of phenol in aqueous
solution.
2.0 EXPERIMENTAL
2.1 Materials
In this study, titanium-n-butoxide Ti(OBu)4 from Sigma-Aldrich
was used as a titanium precursor. Nitric acid was used as
catalyst. Isopropanol and distilled water were used as the
dispersing media. The commercial TiO2 that consists of Degussa
P25 and pure anatase purchased from Sigma-Aldrich, was used
in the control experiment. All the chemicals used were of
analytical reagent grade and used as received.
2.2 Preparation of Titanium Dioxide (TiO2) Nanoparticles
The titanium precusor (Ti(OBu)4) was added dropwise in
isopropanol solution and stirred until a homogenoues mixture
was obtained. The mixture was then added dropwise into
distilled water and vigorously stirred for several minutes. After
that, the nitric acid was added into the mixture and vigorously
stirred for about 30 min. The prepared mixture was aged in tight
air for several days until the formation of white sol-gel was
observed. The white sol-gel was then dried at 75ºC for 74 h in
vacuum oven until white powder was obtained. The dried
powder was ground to get fine powder and denoted as T75. In
order to study the mixed phase of anatase/rutile TiO2 formation,
the dried sample was subjected to calcination treatment. Four
new samples were prepared after they were calcined at 200, 400,
600, and 800ºC and denoted as T200, T400, T600, and T800,
respectively. Calcination treatment was carried out in furnace at
5°C min-1 heating rate for 2 h. All the samples were preserved in
a dessicator until further use.
2.3 Characterization Methods
X-ray diffraction (XRD) was used to analyze the crystallinity of
the TiO2 samples. Measurements were carried out at 40 kV and
40 mA that employed a CuKα radiation at a wavelength of
0.15418 nm. The diffracted intensity was measured at the scan
range of 2θ = 20–80º with a scan step speed of 1 º/min. The
average sizes of the crystallites of anatase and rutile were
estimated with the Scherrer equation.
𝐃 = 𝐊𝛌
𝛃 𝐜𝐨𝐬 𝛉 (1) (1)
where K is Scherrer constant, K is 1 if the spherical shape is
assumed [16]. β, λ and θ are the full-width-at-half-maximum
(FWHM) in radian [18], radiation wavelength, and the incident
angle of the X-rays, respectively.
The surface morphologies of the catalyst samples were
characterized by electron scanning microscopy (SEM). The
surface areas were calculated by the BET single point method.
The UV-Vis spectra were used to indicate the optical responses
of the prepared TiO2 nanoparticles at different calcination
temperatures. All the optical absorption spectra of the samples
were recorded in a wavelength, ranging between 200 to 600 nm,
using a UV-Vis-NIR spectrophotometer Model UV-3101PC
Shimadzu.
2.4 Photocatalytic Activity Measurements
The photocatalytic activity of the prepared TiO2 nanoparticles
was evaluated via degradation of 50 ppm phenol in aqueous
solution. The photodegradation process was conducted in a self-
designed photocatalytic reactor that consisted of 500 ml glass
beaker, and was irradiated using ultraviolet (UV) lamp (Vilber
Laurmat, 312 nm, 30 watt). The photocatalyst (0.8 g) was added
in the 400 ml phenol solution and sonicated for 15 min. The
mixture was stirred continuously with a magnetic stirrer in the
dark for 30 min to achieve the adsorption/desorption
equilibrium. After that, 1 mL was taken as a blank sample
before irradiation. Then, the mixture was irradiated using UV
lamp. Air diffuser was used to provide sufficient O2 for the
reaction. The suspensions (5 ml) were then collected at 30 min
interval using 0.45 µm syringe filter to eliminate excess
catalysts prior to analysis. The clear liquid from each suspension
was subjected to UV-Vis Spectroscopy to measure the
concentration change of phenol throughout the experiment. The
photocatalytic activity was indicated in percentages for phenol
degradation according to the following equation;
Degradation of phenol = Ao−At
At x 100% (2)
where Ao is the initial concentration and At is concenration at
time t (0, 30, 60, 90, 120, 150, 180, 210, 240, 270, and 300
min). A similar experiment was carried out for the commercial
anatase TiO2 from Sigma-Aldrich and Degussa P25. Meanwhile,
a blank experiment was also carried out with direct photolysis of
phenol, irradiated under UV lamp and without the presence of
photocatalyst.
3.0 RESULTS AND DISCUSSION
3.1 X-ray Diffraction Pattern of the Synthesized TiO2
The XRD technique is often used to identify the existence of
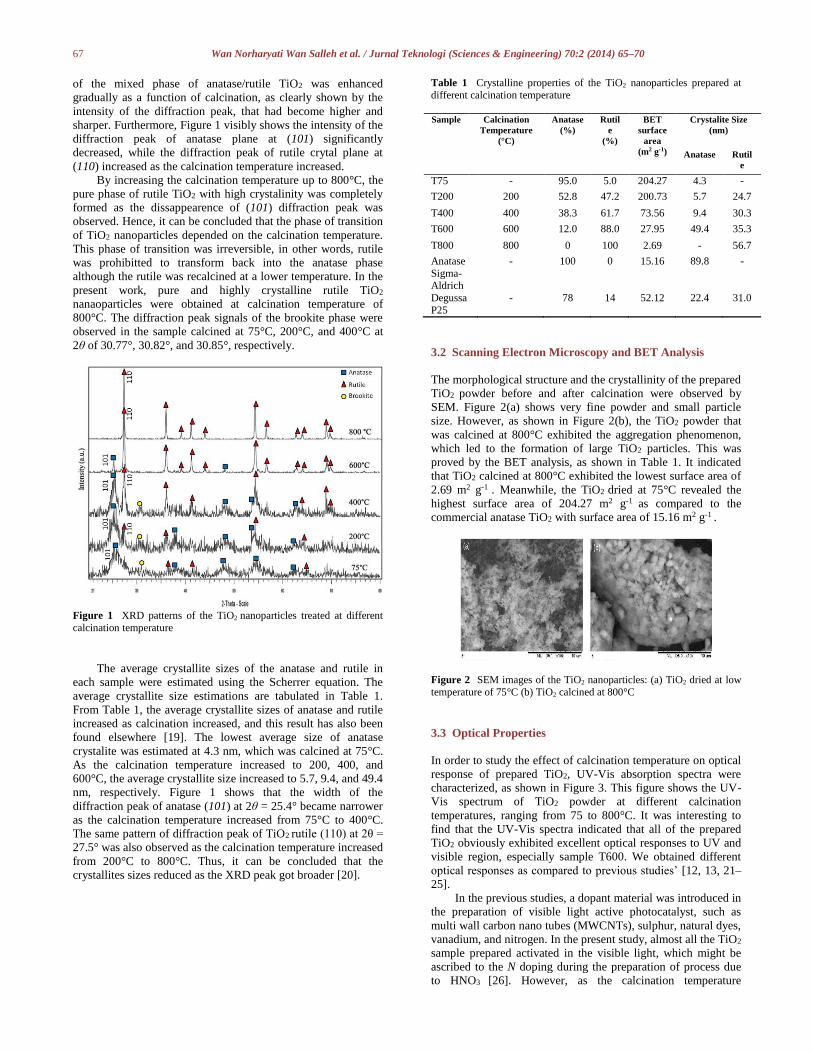
amorphous, anatase, or rutile TiO2 nanoparticles. Figure 1 shows
the XRD pattern of TiO2 prepared at different calcination
temperatures. As presented in Figure 1, the intensity of XRD
pattern of T75 was increased with the increase of the calcination
temperature from 200 to 800°C. Generally, high intensity of the
XRD pattern exhibited high crystallinity. Based on the XRD
pattern, a summary of crystalline properties of the TiO2
nanoparticles prepared at different calcination temperatures is
presented in Table 1.
From Table 1, it can be seen that T75 exhibited a mixed
phase of anatase/rutile TiO2 at the drying stage, as low as 75°C,
with the percentage of anatase and rutile produced 95% and 5%,
respectively. Although the mixed phase of anatase/rutile TiO2
can be formed at 75°C, the crystalinity was low. The crystalinity
67 Wan Norharyati Wan Salleh et al. / Jurnal Teknologi (Sciences & Engineering) 70:2 (2014) 65–70
of the mixed phase of anatase/rutile TiO2 was enhanced
gradually as a function of calcination, as clearly shown by the
intensity of the diffraction peak, that had become higher and
sharper. Furthermore, Figure 1 visibly shows the intensity of the
diffraction peak of anatase plane at (101) significantly
decreased, while the diffraction peak of rutile crytal plane at
(110) increased as the calcination temperature increased.
By increasing the calcination temperature up to 800°C, the
pure phase of rutile TiO2 with high crystalinity was completely
formed as the dissappearence of (101) diffraction peak was
observed. Hence, it can be concluded that the phase of transition
of TiO2 nanoparticles depended on the calcination temperature.
This phase of transition was irreversible, in other words, rutile
was prohibitted to transform back into the anatase phase
although the rutile was recalcined at a lower temperature. In the
present work, pure and highly crystalline rutile TiO2
nanaoparticles were obtained at calcination temperature of
800°C. The diffraction peak signals of the brookite phase were
observed in the sample calcined at 75°C, 200°C, and 400°C at
2θ of 30.77°, 30.82°, and 30.85°, respectively.
Figure 1 XRD patterns of the TiO2 nanoparticles treated at different
calcination temperature
The average crystallite sizes of the anatase and rutile in
each sample were estimated using the Scherrer equation. The
average crystallite size estimations are tabulated in Table 1.
From Table 1, the average crystallite sizes of anatase and rutile
increased as calcination increased, and this result has also been
found elsewhere [19]. The lowest average size of anatase
crystalite was estimated at 4.3 nm, which was calcined at 75°C.
As the calcination temperature increased to 200, 400, and
600°C, the average crystallite size increased to 5.7, 9.4, and 49.4
nm, respectively. Figure 1 shows that the width of the
diffraction peak of anatase (101) at 2θ = 25.4° became narrower
as the calcination temperature increased from 75°C to 400°C.
The same pattern of diffraction peak of TiO2 rutile (110) at 2θ =
27.5° was also observed as the calcination temperature increased
from 200°C to 800°C. Thus, it can be concluded that the
crystallites sizes reduced as the XRD peak got broader [20].
Table 1 Crystalline properties of the TiO2 nanoparticles prepared at
different calcination temperature
Sample Calcination
Temperature
(°C)
Anatase
(%)
Rutil
e
(%)
BET
surface
area
(m2 g-1)
Crystalite Size
(nm)
Anatase Rutil
e
T75 - 95.0 5.0 204.27 4.3 -
T200 200 52.8 47.2 200.73 5.7 24.7
T400 400 38.3 61.7 73.56 9.4 30.3
T600 600 12.0 88.0 27.95 49.4 35.3
T800 800 0 100 2.69 - 56.7
Anatase
Sigma-Aldrich
- 100 0 15.16 89.8 -
Degussa
P25
- 78 14 52.12 22.4 31.0
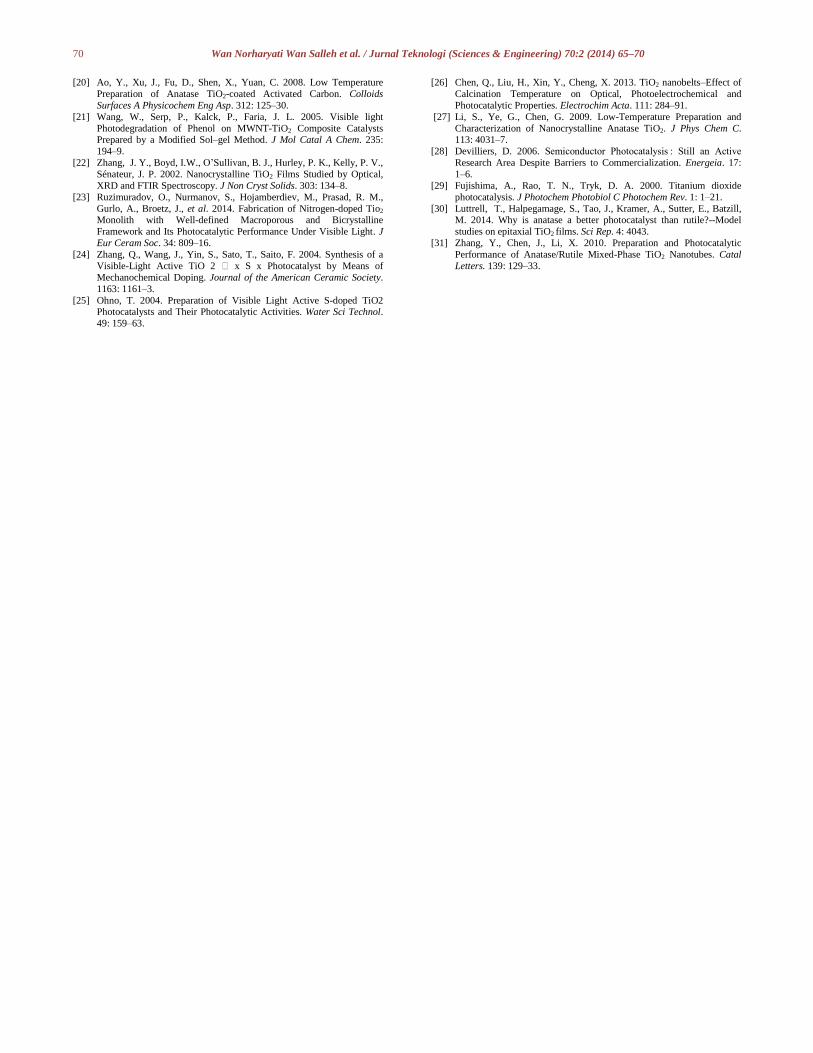
3.2 Scanning Electron Microscopy and BET Analysis
The morphological structure and the crystallinity of the prepared
TiO2 powder before and after calcination were observed by
SEM. Figure 2(a) shows very fine powder and small particle
size. However, as shown in Figure 2(b), the TiO2 powder that
was calcined at 800°C exhibited the aggregation phenomenon,
which led to the formation of large TiO2 particles. This was
proved by the BET analysis, as shown in Table 1. It indicated
that TiO2 calcined at 800°C exhibited the lowest surface area of
2.69 m2 g-1 . Meanwhile, the TiO2 dried at 75°C revealed the
highest surface area of 204.27 m2 g-1 as compared to the
commercial anatase TiO2 with surface area of 15.16 m2 g-1 .
Figure 2 SEM images of the TiO2 nanoparticles: (a) TiO2 dried at low
temperature of 75°C (b) TiO2 calcined at 800°C
3.3 Optical Properties
In order to study the effect of calcination temperature on optical
response of prepared TiO2, UV-Vis absorption spectra were
characterized, as shown in Figure 3. This figure shows the UV-
Vis spectrum of TiO2 powder at different calcination
temperatures, ranging from 75 to 800°C. It was interesting to
find that the UV-Vis spectra indicated that all of the prepared
TiO2 obviously exhibited excellent optical responses to UV and
visible region, especially sample T600. We obtained different
optical responses as compared to previous studies’ [12, 13, 21–
25].
In the previous studies, a dopant material was introduced in
the preparation of visible light active photocatalyst, such as
multi wall carbon nano tubes (MWCNTs), sulphur, natural dyes,
vanadium, and nitrogen. In the present study, almost all the TiO2
sample prepared activated in the visible light, which might be
ascribed to the N doping during the preparation of process due
to HNO3 [26]. However, as the calcination temperature

68 Wan Norharyati Wan Salleh et al. / Jurnal Teknologi (Sciences & Engineering) 70:2 (2014) 65–70
increased, the optical absorption of all the samples decreased,
except T600. The strong absorbance in UV region of all the
TiO2 samples was due to the high tendency of electron
excitation from the valence band to the conduction band.
Sample T600, which consisted of 12% anatase and 88% rutile,
exhibited the highest absorbance in the visible region, followed
by T800, T400, T200, and T75.
From the spectrum, it could be observed that there were
obvious absorbance differences in the UV light region and
visible region between the samples. In the UV region, sample
T600 also exhibited the highest absorbance, followed by T75,
T400, T200, and T800. The highest optical absorption in both
regions for T600 might be attributed to the electron affinity
within the anatase and rutile phases. It has been proved that
electron affinity of anatase is higher than rutile [27]. The rapid
photogenerated conduction electron flows from anatase to rutile,
and thus, limits the electron recombination rate [8].
The sample calcined at 800ºC showed a relatively low
absorbance rate due to the increase in particles size. Previous
studies have suggested that this may be attributed to the
combined effect of particles size and crystallinity [11, 28]. A
lower absorbance rate at the UV range led to low responses to
the UV light. It can be concluded that as the particles are low in
crystallinity and large in particles size, the tendency to absorb
UV light is limited, which is due to the smaller surface in the
limit areas [27]. The increment in calcination temperature led to
this aggregation phenomenon, as shown in Figure 3, as it turned
to be more severe, and roughly corresponded to the result of
UV/Vis spectrum, whereby the UV responses of the samples
decreased as the calcination temperature was increased.
Figure 3 UV-Vis spectrum of the TiO2 nanoparticles prepared at
different calcination temperature
3.4 Photocatalytic Activity Measurements
The photocatalytic activity of the prepared catalyst was
measured by the percentage of photodegradation of phenol in
aqueuos solution. The blank experiment was conducted to study
the stability of phenol in aqueous solution towards UV
irradiation. Figure 4 demonstrates phenol degradation in
aqueous solution using TiO2 nanoparticles as a function of
irradiation time. The concentration of phenol decreased as the
time of UV irradiation increased. Besides, it was found that after
130 min of irradiation by UV, the degradation of phenol in
aqueous solution achieved 50% with samples of Degussa P25
and T400.
The direct photolysis without photocatalyst that was
present in the reactor showed the lowest degradation of phenol
in aqueous solution, which was only 2.3% after it was irradiated
by UV at 312 nm for 180 min. This value of degradation of
phenol remained unchaged as the UV irradiation time reached
up to 300 min, as shown in Figure 4. From the result, it can be
proved that phenol was considered stable under UV irradiation
without the presence of photocatalyst.
Figure 4 The phenol degradation in aqueous solution using TiO2
nanoparticles as a function of irradiation time
The summary of the photocatalytic activity for all the
samples for the degradation of phenol after 300 mins are
tabulated in Table 2. It was revealed that the degradation of
phenol in aqueous solution by using T400 exhibited the highest
photocatalytic activity. It showed that 84.88% of phenol
degradation was achieved. This result is comparable with the
stardard Degussa P25 by 1.54% difference in phenol
degradation. Therefore, it was believed that T400 demontrated
similar propeties of Degussa P25.
The lowest photocatalytic activity in the degradation of
phenol, 38.48%, was obtained from T800. This was due to the
low surface area created for the photodegradation reaction to
take place. This result is in agreement with the UV-Vis
spectroscopy data, whereby low optical response to UV was
observed for the samples calcined at 800°C. A low optical
response to UV leads to insuffient energy to excite electron
from valence band to the conduction band [28]. The excitation
of the electron is crucial since it leads to the formation of
positive holes and has a positive charge [29]. This positive hole
has strong oxidation power to promote the degradation of
phenol molecules in aqueous solution.

69 Wan Norharyati Wan Salleh et al. / Jurnal Teknologi (Sciences & Engineering) 70:2 (2014) 65–70
Table 2 Photocatalytic activity of the TiO2 nanoparticles prepared at
different calcination temperature
Sample Calcination
Temperature
(°C)
Degradation of
phenol (%) after 300
min irradiation time
T75 - 72.88
T200 200 73.88
T400 400 84.88
T600 600 78.88
T800 800 38.48
Anatase Sigma-
Aldrich
- 76.88
Degussa P25 - 86.42
Photolysis (control) - 2.3
In addition, the photocatalytic activity of pure anatase TiO2
(referring to commercial anatase from Sigma-Aldrich) and pure
rutile TiO2 (referring to TiO2-800ºC) can also be observed in
Figure 4. As comparison to these results, the prepared mixed
phase of TiO2 showed higher photocatalytic activity than pure
anatase and rutile TiO2. Similar results could be found
elsewhere [30]. The energy barrier between anatase and rutile
phases facilitates the photogenerated electrons to transfer from
anatase to rutile as the electron affinity of anatase is higher than
rutile [4, 31]. Previous study on the band alignment of rutile and
anatase TiO2 indicated that the band alignment of approximately
0.4 eV drives force for the increased photocatalytic activity of
anatase/rutile composites material over their individual
counterparts [4]. There were significant differences in their
photocatalytic activities, which were observed as the anatase
phase exhibited higher photocatalytic activity than the rutile
phase. Similar results were also obtained by other researcher
[19].
4.0 CONCLUSION
The mixed phase of anatase/rutile TiO2 nanoparticles was
successfully prepared by using titanium-n-butoxide Ti(OBu)4,
nitric acid, and isopropanol as a precursor material, catalyst, and
solvent, respectively. The preparation of the mixed
anatase/rutile TiO2 nanoparticles with controllable heating
treatment had been a very simple approach and was energy
saving. The effects of calcination temperature on the
phsycochemical properties and photocatalytic activity were
studied. The results showed that the calcination temperature
played important roles in the crystallites’ growth and the
crystallites’ phase transition in the preparation of the mixed
phase of anatase/rutile TiO2 nanoparticles. Based on the XRD
pattern, it can be concluded that the increment in calcination
temperature leads to rapid crystallites’ growth and a decrease in
the particles size. Furthermore, the composition of anatase
decreased while rutile increased in the mixed phase of
anatase/rutile TiO2 as the calcination temperatures increased. On
top of that, the BET analysis revealed a decrease in the TiO2
surface area, which was also due to the elevated calcination
temperature. From the UV-Vis spectra, all the TiO2 samples
prepared in the laboratory exhibited excellent optical responses
to UV and visible region. The highest photocatalytic activity
was demonstrated by the mixed phase of anatase/rutile TiO2
nanoparticles prepared at 400ºC. The degradation of
approximately 84% was achieved after 300 min of operation.
This result was comparable with the photocatalytic activity
obtained from the commercial anatase TiO2 (Degussa P-25). The
mixed phase of anatase/rutile TiO2 nanoparticles prepared in
this study can be used as an appropriate photocatalyst material
with effective performance for phenol degradation applications.
Acknowledgement
The authors acknowledge the support from The Ministry of
Higher Education (MOHE) (Research University Grant Scheme
(GUP) (Vot No: 05H08)) for funding this research project.
References
[1] Chun, H., Yizhong, W., Hongxiao, T. 2000. Destruction of Phenol
Aqueous Solution by Photocatalysis or Direct Photolysis.
Chemosphere. 41: 1205–9.
[2] Fan, H., Li, G., Yang, F., Yang, L., Zhang, S. 2011. Photodegradation
of Cellulose under UV Light Catalysed by TiO2. J Chem Technol
Biotechnol. 86: 1107–12.
[3] Manilal, V. B., Haridas, A., Alexander, R., Surender, G. D. 1992.
Photocatalytic Treatment of Toxic Organics in Wastewater: Toxicity of Photodegradation Products. Water Res. 26: 1035–8.
[4] Scanlon, D. O., Dunnill, C. W., Buckeridge, J., Shevlin, S. A, Logsdail,
A. J., Woodley, S. M., et al. 2013. Band Alignment of Rutile and
Anatase TiO2. Nat Mater. 12: 798–801.
[5] Ouzzine, M., Maciá-Agulló, J. A., Lillo-Ródenas, M. A., Quijada, C.,
Linares-Solano, A. 2014. Synthesis of High Surface Area TiO2
Nanoparticles by Mild Acid Treatment with HCl or HI for Photocatalytic Propene Oxidation. Appl Catal B Environ. 154–155:
285–93.
[6] Devilliers, D. 2006. Semiconductor Photocatalysis : Still an Active
Research Area Despite Barriers to Commercialization. Energeia. 17:
1–6.
[7] Wu, Q., Wu, Z., Li, Y., Gao, H., Piao, L., Zhang, T., et al. 2012.
Controllable Synthesis and Photocatalytic Activity of Anatase TiO2
Single Crystals with Exposed {110} Facets. Chinese J Catal. 33: 1743–53.
[8] Ohtani, B., Prieto-Mahaney, O. O., Li, D., Abe, R. 2010. What is
Degussa (Evonik) P25? Crystalline Composition Analysis,
Reconstruction from Isolated Pure Particles and Photocatalytic Activity
Test. J Photochem Photobiol A Chem. 216: 179–82.
[9] You, Y. F., Xu, C. H., Xu, S. S., Cao, S., Wang, J. P., Huang, Y. B., et
al. 2014. Structural Characterization and Optical Property of Tio2
Powders Prepared by the Sol–Gel Method. Ceram Int. 40: 8659–66. [10] Ao, Y., Xu, J., Fu, D., Shen, X., Yuan, C. 2008. Low Temperature
Preparation of Anatase TiO2-coated Activated Carbon. Colloids
Surfaces A Physicochem Eng Asp. 312: 125–30.
[11] Li, S., Ye, G., Chen, G. 2009. Low-Temperature Preparation and
Characterization of Nanocrystalline Anatase TiO2. J Phys Chem C.
113: 4031–7.
[12] Cimieri, I., Poelman, H., Ryckaert, J., Poelman, D. 2013. Novel Sol–gel Preparation of V-TiO2 Films for the Photocatalytic Oxidation of
Ethanol in Air. J Photochem Photobiol A Chem. 263: 1–7.
[13] Ananth, S., Arumanayagam, T., Vivek, P., Murugakoothan, P. 2014.
Direct Synthesis of Natural Dye Mixed Titanium Dioxide Nano
Particles By Sol–gel Method for Dye Sensitized Solar Cell
Applications. Opt - Int J Light Electron Opt. 125: 495–8.
[14] You, Y., Zhang, S., Wan, L., Xu, D. 2012. Preparation of Continuous
TiO2 Fibers by Sol–Gel Method and Its Photocatalytic Degradation on Formaldehyde. Appl Surf Sci. 258: 3469–74.
[15] Liu, X. 2012. Preparation and Characterization of Pure Anatase
Nanocrystals by Sol–gel Method. Powder Technol. 224: 287–90.
[16] Bakardjieva, S., Šubrt, J., Štengl, V., Dianez, M. J., Sayagues, M. J.
2005. Photoactivity of Anatase–rutile TiO2 Nanocrystalline Mixtures
Obtained by Heat Treatment of Homogeneously Precipitated Anatase.
Appl Catal B Environ. 58: 193–202.
[17] Mahshid, S., Askari, M., Sasani, Ghamsari, M., Afshar, N., Lahuti, S. 2009. Mixed-phase TiO2 Nanoparticles Preparation Using Sol–gel
Method. J Alloys Compd. 478: 586–9.
[18] Moharram, A. H., Mansour, S. A., Hussein, M. A., Rashad, M. 2014.
Direct Precipitation and Characterization of ZnO Nanoparticles. J
Nanomater. 2014: 1–5.
[19] Li, Z., Liu, R., Xu, Y. 2013. Larger Effect of Sintering Temperature
Than Particle Size on the Photocatalytic Activity of Anatase TiO2. J Phys Chem C. 117: 24360–7.
70 Wan Norharyati Wan Salleh et al. / Jurnal Teknologi (Sciences & Engineering) 70:2 (2014) 65–70
[20] Ao, Y., Xu, J., Fu, D., Shen, X., Yuan, C. 2008. Low Temperature
Preparation of Anatase TiO2-coated Activated Carbon. Colloids
Surfaces A Physicochem Eng Asp. 312: 125–30.
[21] Wang, W., Serp, P., Kalck, P., Faria, J. L. 2005. Visible light
Photodegradation of Phenol on MWNT-TiO2 Composite Catalysts Prepared by a Modified Sol–gel Method. J Mol Catal A Chem. 235:
194–9.
[22] Zhang, J. Y., Boyd, I.W., O’Sullivan, B. J., Hurley, P. K., Kelly, P. V.,
Sénateur, J. P. 2002. Nanocrystalline TiO2 Films Studied by Optical,
XRD and FTIR Spectroscopy. J Non Cryst Solids. 303: 134–8.
[23] Ruzimuradov, O., Nurmanov, S., Hojamberdiev, M., Prasad, R. M.,
Gurlo, A., Broetz, J., et al. 2014. Fabrication of Nitrogen-doped Tio2 Monolith with Well-defined Macroporous and Bicrystalline
Framework and Its Photocatalytic Performance Under Visible Light. J
Eur Ceram Soc. 34: 809–16.
[24] Zhang, Q., Wang, J., Yin, S., Sato, T., Saito, F. 2004. Synthesis of a
Visible-Light Active TiO 2 ؊ x S x Photocatalyst by Means of
Mechanochemical Doping. Journal of the American Ceramic Society.
1163: 1161–3.
[25] Ohno, T. 2004. Preparation of Visible Light Active S-doped TiO2 Photocatalysts and Their Photocatalytic Activities. Water Sci Technol.
49: 159–63.
[26] Chen, Q., Liu, H., Xin, Y., Cheng, X. 2013. TiO2 nanobelts–Effect of
Calcination Temperature on Optical, Photoelectrochemical and
Photocatalytic Properties. Electrochim Acta. 111: 284–91.
[27] Li, S., Ye, G., Chen, G. 2009. Low-Temperature Preparation and
Characterization of Nanocrystalline Anatase TiO2. J Phys Chem C. 113: 4031–7.
[28] Devilliers, D. 2006. Semiconductor Photocatalysis : Still an Active
Research Area Despite Barriers to Commercialization. Energeia. 17:
1–6.
[29] Fujishima, A., Rao, T. N., Tryk, D. A. 2000. Titanium dioxide
photocatalysis. J Photochem Photobiol C Photochem Rev. 1: 1–21.
[30] Luttrell, T., Halpegamage, S., Tao, J., Kramer, A., Sutter, E., Batzill, M. 2014. Why is anatase a better photocatalyst than rutile?--Model
studies on epitaxial TiO2 films. Sci Rep. 4: 4043.
[31] Zhang, Y., Chen, J., Li, X. 2010. Preparation and Photocatalytic
Performance of Anatase/Rutile Mixed-Phase TiO2 Nanotubes. Catal
Letters. 139: 129–33.