Jungheinrich growingwith passion2016
46
June 2016 Growing with Passion Investor Relations Presentation
-
Upload
company-spotlight -
Category
Investor Relations
-
view
274 -
download
0
Transcript of Jungheinrich growingwith passion2016
June 2016
Growing with Passion Investor Relations Presentation

Content
2
Jungheinrich at a Glance World Material Handling Equipment Market Business Model Current Business Trend 2016 Strategic Issues and Outlook

Jungheinrich at a Glance

Jungheinrich at a Glance
4
Key figures
Independent, family-owned company Leading intralogistics service & solution provider with manufacturing
operations No. 2 in Europe, No. 3 in the world Focus on direct sales Single-brand strategy
Key figures 2015 Consolidated net sales split by region
25%
14%
50% 11%
Western Europe
Germany
New truck business
After-sales service
55% 17%
28%
Net sales Intralogistics segment
in €
million
∆
Incoming orders 2,817 +11.1%
Net sales 2,754 +10.2%
EBIT 213 +10.4%
Net income 138 +9.5%
other countries
Eastern Europe
Short-term hire and used equipment
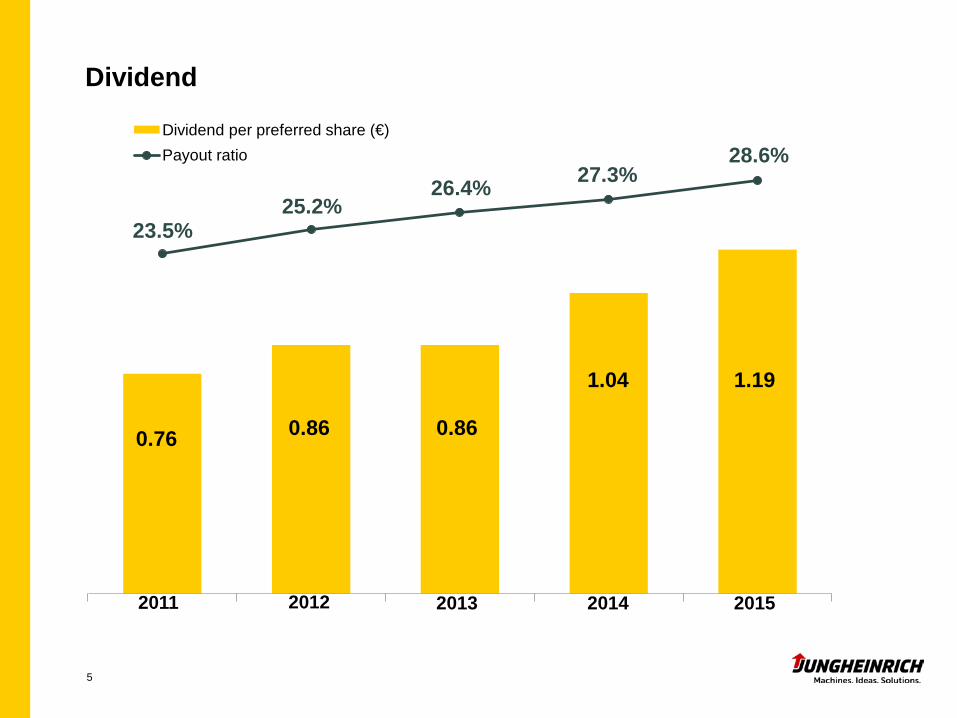
Dividend per preferred share (€) Payout ratio
23.5%
Dividend
0.76
2011
5
25.2%
0.86
2012
26.4%
0.86
2013
27.3%
1.04
2014
28.6%
1.19
2015

World Material Handling Equipment Market

191
277
411
219
444
345
235
414
373
Worldwide
2014 2015
Europe
Asia
North America
7
2007
2015
2014
951
2007
1,094
Source: WITS, SIMHEM.
+9%
+11%
+9%
2007
2015
2014
2007
2015
2014
thereof Eastern-europe -7.2% thereof Eastern-europe -0.4%
1,100
+8%
-7%
+7%
+0.5%
thereof China -12.8% thereof China +10.2%
World Material Handling Equipment Market—Market Volume Incoming orders in thousand units

Europe
Asia
43%
8%
12%
28%
20% 9% Rest of World
Rest of World
8
Europe Asia
34%
5% 22%
38%
21% 7%
2015 = 1,100,000 units
Source: WITS, SIMHEM.
2007 = 951,000 units
World Material Handling Equipment Market Breakdown of Volume by Region
thereof Eastern Europe
Central/South America 5% Australia/Africa 4%
North America
thereof China
thereof Eastern Europe North
America
thereof China
Central/South America 4% Australia/Africa 3%
based on incoming orders in units
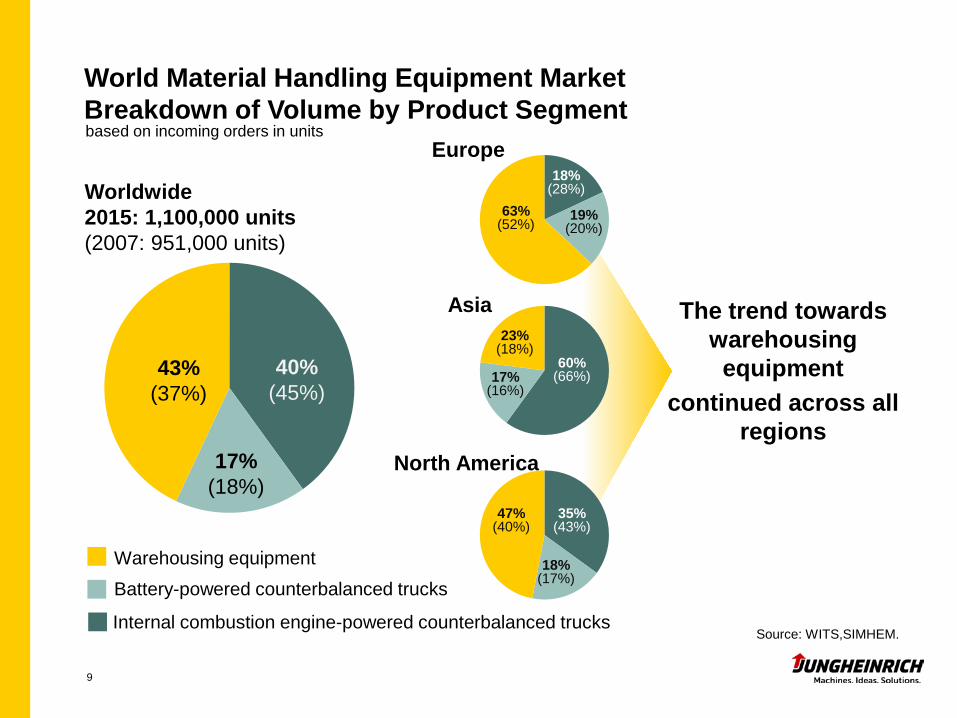
Worldwide 2015: 1,100,000 units (2007: 951,000 units)
40% (45%)
43% (37%)
17% (18%)
18% (28%)
19% (20%)
63% (52%)
60% (66%)
23% (18%)
17% (16%)
Asia
North America
9
Europe
Source: WITS,SIMHEM.
35% (43%)
47% (40%)
18% (17%)
World Material Handling Equipment Market Breakdown of Volume by Product Segment
Battery-powered counterbalanced trucks Warehousing equipment
Internal combustion engine-powered counterbalanced trucks
The trend towards warehousing
equipment continued across all
regions
based on incoming orders in units

18% (28%)
63% (52%) 19%
(20%)
Europe
69% (79%)
18%
13%
China
10
(9%)
(12%)
World Material Handling Equipment Market—Market Structure Comparison Broken Down by Product Segment in 2015 (2007)
Battery-powered counterbalanced trucks
Warehousing equipment
Internal combustion engine-powered counterbalanced trucks
Europe and China: Trend towards warehousing equipment; future growth potential for Jungheinrich
Source: WITS.
based on incoming orders in units

Toyota Kion Jungheinrich Hyster-Yale
World League Ranking
11
Ranking in Europe
Toyota Raymond
BT Industries Cesab
(6,382)
7,600
Hyster Yale Utilev
Linde Still
Fenwick OM Still
Baoli Voltas Jungheinrich
(4,678)
(2,083)
2,754
5,216
2,374
1
(2,498)
1 2 3
Kion Jungheinrich Toyota
2015 (2014) Net sales in million €, including currency effects
1 Fiscal year: April to March, adjusted: January to December. Source: company data.

Business Model

13
Short-term hire
Used equipment
After-sales service
New truck business
Hire periods: generally 1 day to 24 months Targeted degree of capacity utilization 70% to 80% ∅-Inventory 2015 = 44.5 thousand trucks
(+17% yoy)
Marketing of used equipment (leasing, short-term hire and trade-ins) Professional reconditioning of forklifts in the Dresden Used
Equipment Centre 2015: 4,800 reconditioned trucks
Development, production and sale of new forklifts including logistics systems and mail-order business, focus on direct sales
Fina
ncia
l ser
vice
s
■ 6,200 employees in the global after-sales organization, thereof 4,300 after-sales service engineers
The Jungheinrich Business Model

Divisions: Logistics Systems Business and Mail-Order Business
14
Logistics systems
Development of net sales in € million
€381 million
€57 million
New truck business Net sales € 1,539 million
System trucks Racking Project
business
Mail-order business
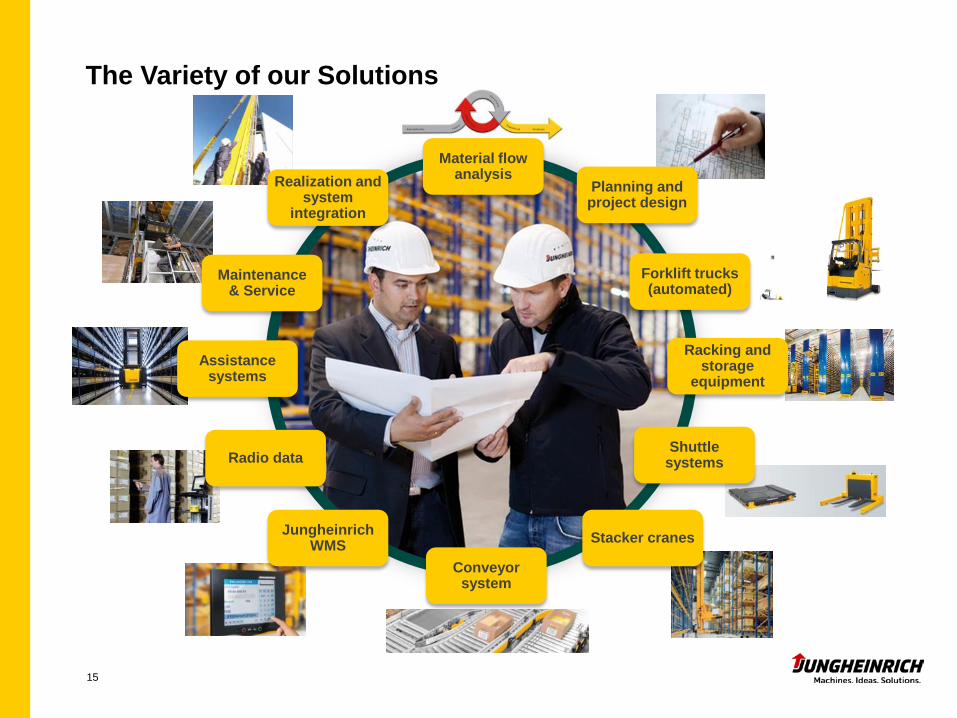
The Variety of our Solutions
Material flow analysis
Forklift trucks (automated)
Racking and storage
equipment
Shuttle systems
Stacker cranes
Conveyor system
Radio data
Assistance systems
Maintenance & Service
Realization and system
integration
Jungheinrich WMS
Planning and project design
15

Deliveries by Industry
16
Retail and wholesale (incl. food distribution)
Logistics
16
45%
13%
12%
8%
1%
4% 17%
based on incoming orders in terms of units
Mechanical, automotive and electrical engineering
Chemical industry
Timber, paper and print industries
Food industry (Production)
Other industry sectors

Promotion and expansion of new truck business and after-sales services Principle: Every financial service agreement to cover full service and maintenance
Permanent customer retention Flexible, customized contracts
Financial Services—Principles and Objectives
Service function for Jungheinrich sales division Substantial financial services profits are stated in sales
division New truck business/after-sales services/used equipment
Matching refinancing (term and interest) Regular creditworthiness checks Quarterly assessment of contractual/residual value risks Transparency and process reliability via Group database
17
Full disclosure on Jungheinrich’s consolidated balance sheet
Business policy
Sales policy
Risk management
Current Business Trend 2016

Highlights of the Material Handling Equipment Market—Q1 2016
19
World material handling equipment market expands by nearly 4%, driven by the European market (up 12%)
Clear signs of stabilization apparent in Russia
The Asian market posted a marginal gain, whereas the North American market experienced a slight downward trend
Warehousing equipment product segment grows 10% globally, buoyed by increases primarily in Europe and Asia

20
Jungheinrich Highlights—Q1 2016
Incoming orders post double-digit growth (in terms of units and value)
‘Logistics Systems’ division contributes just over one-third of the rise in the value of incoming orders
At 24,000 trucks, production bests year-earlier quarter by 8%
All business fields contribute to the net sales growth
EBIT climbs 8% to €46 million
Orders on hand up 20% vs. 12/31/2015; order reach nearly 5 months
Full-year forecast for 2016 unchanged

21
World Material Handling Equipment Market as of Jan. to March 2016—Growth Rates by Region based on incoming orders in units, Q1 2016 compared to Q1 2015
+12%
+13%
+9%
+1%
+4% 282.4
1-3/2015
292.8
1-3/2016
Western Europe
Eastern Europe
Europe
Asia
North America
World
-1%
World market in thousand units
thereof Russia -2%
Source: WITS, SIMHEM 3/2016
thereof China +7%

22
755 666 +13% 27,500 24,500 +12%
24,000 22,200 +8% 620 667
Current Business Trend—Q1 2016
+8%
Q1 2016 Q1 2015
Q1 2016 Q1 2015
Q1 2016 Q1 2015
Q1 2016 Q1 2015
Incoming orders in million € Incoming orders units
Net sales in million € Production units

+2%
EBIT in million €
23
45.8 42.3 +8%
Net income in million €
28.3 27.6 +3%
0.86 0.84 39.4 40.2
EBT in million € Earnings per preferred share in €
+2%
Q1 2016 Q1 2015
Q1 2016 Q1 2015
Q1 2016 Q1 2015
Q1 2016 Q1 2015
Earnings Trend—Q1 2016
24
<1%
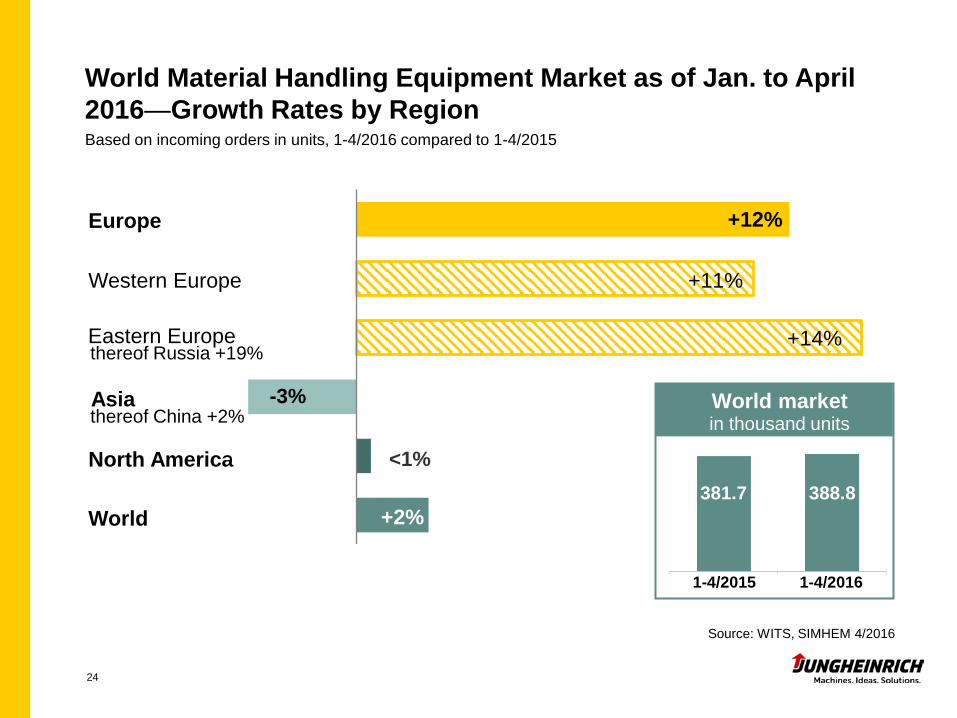
World Material Handling Equipment Market as of Jan. to April 2016—Growth Rates by Region Based on incoming orders in units, 1-4/2016 compared to 1-4/2015
+12%
+11%
+14%
-3%
+2% 381.7
1-4/2015
388.8
1-4/2016
Western Europe
Eastern Europe
Europe
Asia
North America
World
-1 %
thereof Russia +19%
Source: WITS, SIMHEM 4/2016
thereof China +2% World market in thousand units

Incoming orders in million €
25
1,066 894 +19%
Incoming orders in units
37,100 32,300 +15 %
32,700 30,600 +7 % 846 930
Current Business Trend—January to April 2016
Net sales in million € Production in units
+10 %
1-4/2016 1-4/2015
1-4/2016 1-4/2015
1-4/2016 1-4/2015
1-4/2016 1-4/2015

26
Strategic Issues and Outlook

27
Goal 2020: ~€4 bn
net sales
The Jungheinrich Group’s Growth Strategy

28
Source: WITS,SIMHEM.
191
277
411
951
219
444
345
1,094
235
414
373
1,100
Europe
Asia
North America
2007
2015
2014
+0.5%
-7%
+7%
2007
2015
2014
2007
2015
2014
2007
2015
2014
+8%
World
thereof Eastern Europe -7.2%
thereof Eastern Europe -0.4%
thereof China -12.8%
thereof China +10.2%
Incoming orders in thousand units World Material Equipment Market—Expected Development in 2016
Slight increase in world market volume.
Market volume in Western and Eastern Europe is currently expected to display positive development.
We anticipate that the markets in Asia expand marginally, driven by the warehousing equipment and battery-powered counterbalanced truck segments.
For the North American market we expect a stable development.

Dividend policy: Payout ratio of 25% to 30% of net income
Jungheinrich Group—Forecast for 2016
Capital expenditures in tangible assets €90 m - €100 m
Research and development expenditures €60 m - €65 m
29
Incoming orders €3.0 bn - €3.1bn
Net sales €2.9 bn - €3.0 bn
EBIT €220 m - €230 m
EBT €200 m - €215 m
EBIT ROS minimum 7.6%
EBT ROS minimum 6.9%
ROCE 15% - 20%

30
Disclaimer
Since developments cannot be foreseen, the actual business trend may deviate from the expectations presented here based on assumptions and estimates made by Jungheinrich company management. Factors that may lead to such deviations include changes in the economic environment, changes in the political and legal environment and within the material handling equipment sector as well as exchange and interest rate fluctuations. Therefore, no responsibility is taken for forward-looking statements made in this presentation and no ensuing liability is assumed.


Ausblick
32
Appendix

0 50.000 100.000 150.000 200.000 250.000 300.000
Russia
Turkey
Netherlands
Australia
Canada
Poland
Spain
Italy
UK
France
Germany
USA
China
33
Market volume in 2015 Market volume in 2014
-13%1
+8%
+9%
+12%2
+15%
+21%2
+27%2
+8% -3%
+3%
+7%2
+5%
-39%2
European market volume in 2015 still 9% down on pre-crisis level (2007)
Development of the Material Handling Equipment Markets of Importance to Jungheinrich
1 Solely due to the shrinkage of the counterbalanced truck market (in particular ICs), not of the warehousing equipment market. 2 2007 pre-crisis level not achieved yet.
50,000 100,000 150,000 200,000 250,000 300,000 units

6,382
4,678
2,498 2,083 1,882 1,855
1,487 1,326 800 783
Toyota Kion Jungheinrich Hyster-Yale Crown MitsubishiNichiyu
Kalmar Unicarriers Manitou Anhui Heli
34
Toyota Raymond BT Indust.
Cesab
Linde Still
Fenwick OM Still
Baoli Voltas
Mitsubishi Nippon Y. Caterpillar
Rocla
Nissan TCM Atlet
1 2 2
Kalmar Cargotec
2
Hyster Yale Utilev
Crown Hamech
World League Ranking Competitors in 2014 sales in million €
Source: Logistik Journal October 2015, Comany data. 1 Fiscal year April to March adjusted Jan. to Dec. 2014. 2 Fiscal year April to March.

Low-lift trucks ● ●
Stacker trucks ● ●
Battery-powered counterbalanced trucks ● ●
IC engine-powered counterbalanced trucks ●
Reach trucks ● ●
Order pickers ● ● ●
Tow tractors ●
High-rack stackers ●
Stacker cranes ● ●
load handling equipment ●
Small-series and customized trucks ● ●
Control units, batteries and chargers ●
Reconditioning of used equipment ●
35
Germany China Hungaria
Jungheinrich Group production sites

2,120
2007
2,178
2011
36
2,251
2012
2,357
2013
2,535
2014
2,817
2015
Incoming Orders in million €

In € million
2,001
505
1,496
2007
2,116
571
1,545
2011
Consolidated Net Sales Germany Abroad
37
2,270
607
1,663
2,290
613
1,677
2013 2012 2014
2,498
655
1,843
2015
2,754
701
2,053
Change in accounting treatment as of 1/1/2013, figures for 2012 were adjusted to the change in the statement of interest income from financial services (finance lease customer contracts).
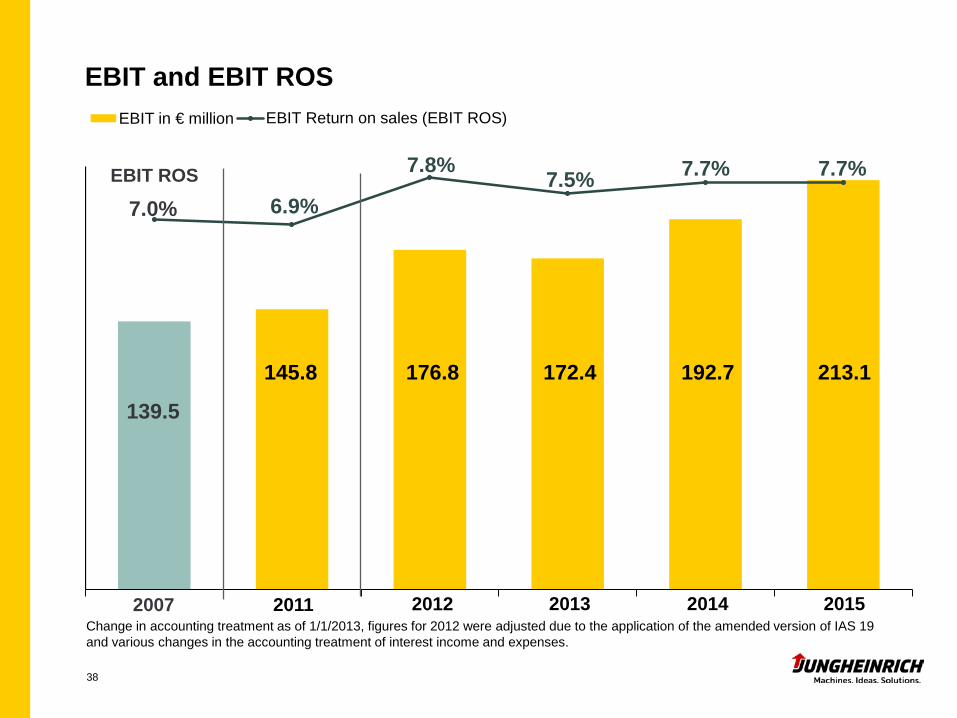
EBIT in € million EBIT Return on sales (EBIT ROS)
139.5
7.0%
2007 2011
EBIT and EBIT ROS
145.8
6.9%
38
2013
176.8
7.8%
172.4
7.5%
2012
EBIT ROS
2014
192.7
7.7%
2015
213.1
7.7%
Change in accounting treatment as of 1/1/2013, figures for 2012 were adjusted due to the application of the amended version of IAS 19 and various changes in the accounting treatment of interest income and expenses.

Capital employed in € million ROCE
ROCE
2007 2011
578
24.1%
556
26.2%
39
21.6%
2013
920
18.7%
2012
818 1,047
18.4%
2014
1,187
17.9%
2015
EBIT-Return on Capital Employed (ROCE) Interest-bearing capital excluding liabilities from financial services and provisions for pensions. Since 2012, interest-bearing capital includes provisions for pensions and provisions for non-current personnel obligations.
Change in accounting treatment as of 1/1/2013, figures for 2012 were adjusted due to the application of the amended version of IAS 19 and various changes in the accounting treatment of interest income and expenses.

2007 2011
40
2012
41 38 44
350 342 378
45
2013
400
50
2014
418
2015
55
434
Research & Development Expenditures in million €
Number of employees (FTE, average)
Change in accounting treatment as of 1/1/2013, figures for 2012 were adjusted due to the application of the amended version of IAS 19 and various changes in the accounting treatment of interest income and expenses.

52
2007
52
2011
41
78
2012
91
2013
84
2014
87
2015
in million € Capital Expenditures

26.7%
2007
39.9%
27.8%
2011
43.0%
Equity Ratio Jungheinrich Group
42
27.3%
42.4%
30.2%
47.1%
2013 2012
29.6%
46.0%
2014
30.6%
47.6%
2015
"Intralogistics" segment
Change in accounting treatment as of 1/1/2013, figures for 2012 were adjusted due to the application of the amended version of IAS 19 and various changes in the accounting treatment of interest income and expenses.

40
2007
-162
2011
-183
2012
Net debt
43
-154
2013
-132
2014
„Cash“
2015
-75
Net Debt excl. liabilities from financial services and accrued liabilities for pensions (in million €)
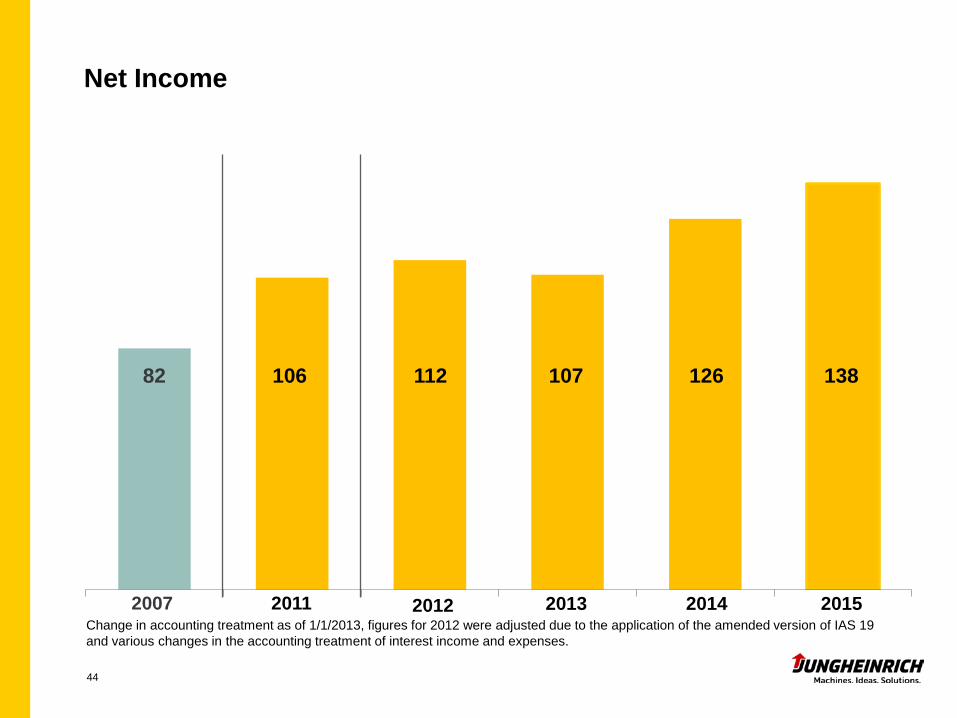
82
2007
106
2011
44
112 107
2013 2012
126
2014
138
2015
Net Income
Change in accounting treatment as of 1/1/2013, figures for 2012 were adjusted due to the application of the amended version of IAS 19 and various changes in the accounting treatment of interest income and expenses.

2007
10,178
4,761
5,417
2011
10,711
4,925
5,786
Employees
45
In FTE
2012
11,261
5,167
6,094
Germany Abroad
2013
11,840
5,356
6,484
2014
12,549
5,638
6,911
2015
13,962
6,078
7,884
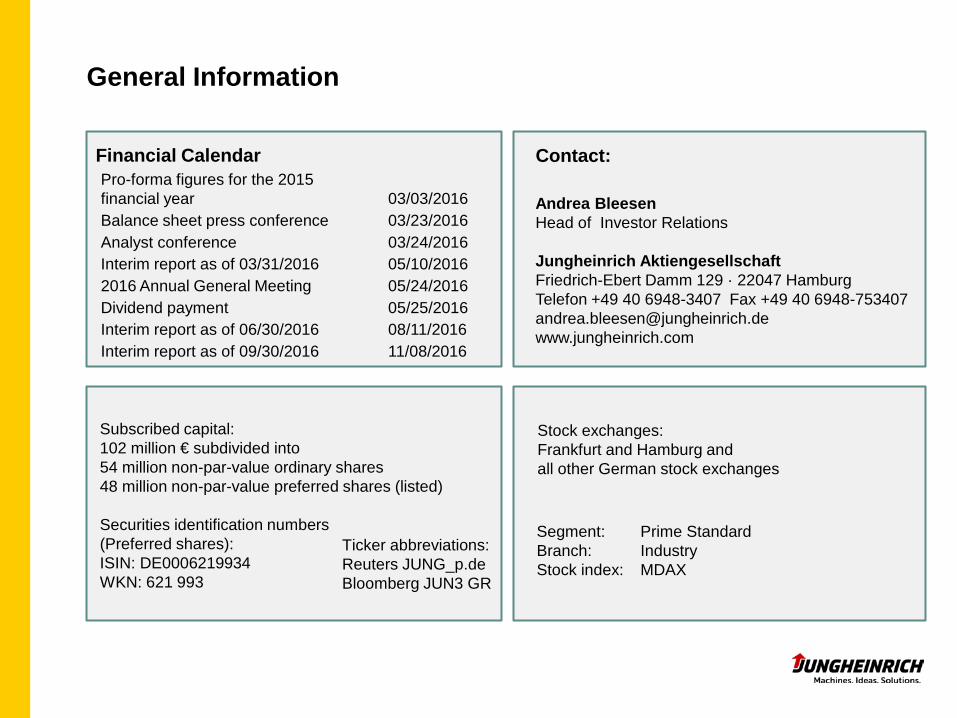
Financial Calendar
Subscribed capital: 102 million € subdivided into 54 million non-par-value ordinary shares 48 million non-par-value preferred shares (listed) Securities identification numbers (Preferred shares): ISIN: DE0006219934 WKN: 621 993
Segment: Prime Standard Branch: Industry Stock index: MDAX
General Information
Contact: Pro-forma figures for the 2015 financial year 03/03/2016 Balance sheet press conference 03/23/2016 Analyst conference 03/24/2016 Interim report as of 03/31/2016 05/10/2016 2016 Annual General Meeting 05/24/2016 Dividend payment 05/25/2016 Interim report as of 06/30/2016 08/11/2016 Interim report as of 09/30/2016 11/08/2016
Stock exchanges: Frankfurt and Hamburg and all other German stock exchanges
Andrea Bleesen Head of Investor Relations Jungheinrich Aktiengesellschaft Friedrich-Ebert Damm 129 · 22047 Hamburg Telefon +49 40 6948-3407 Fax +49 40 6948-753407 [email protected] www.jungheinrich.com
Ticker abbreviations: Reuters JUNG_p.de Bloomberg JUN3 GR