June Vol. 0 Osmotic Behavior ofBacterial Protoplasts ...jb.asm.org/content/114/3/1177.full.pdf ·...
7
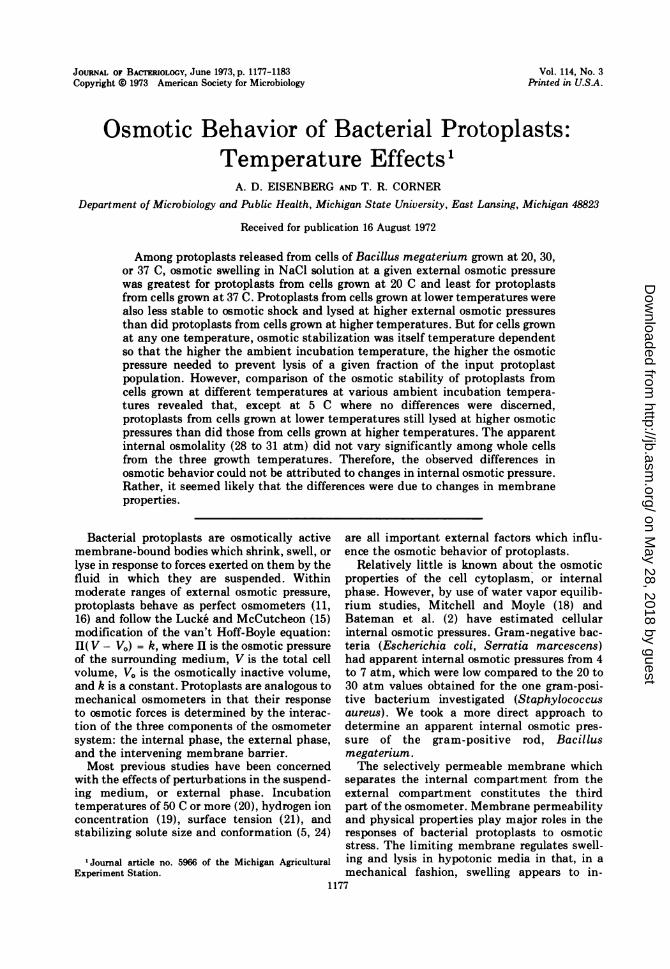
JOURNAL OF BACTERIOLOGY, June 1973, p. 1177-1183 Copyright 0 1973 American Society for Microbiology Vol. 114, No. 3 Printed in U.SA. Osmotic Behavior of Bacterial Protoplasts: Temperature Effects' A. D. EISENBERG AND T. R. CORNER Department of Microbiology and Public Health, Michigan State University, East Lansing, Michigan 48823 Received for publication 16 August 1972 Among protoplasts released from cells of Bacillus megaterium grown at 20, 30, or 37 C, osmotic swelling in NaCl solution at a given external osmotic pressure was greatest for protoplasts from cells grown at 20 C and least for protoplasts from cells grown at 37 C. Protoplasts from cells grown at lower temperatures were also less stable to osmotic shock and lysed at higher external osmotic pressures than did protoplasts from cells grown at higher temperatures. But for cells grown at any one temperature, osmotic stabilization was itself temperature dependent so that the higher the ambient incubation temperature, the higher the osmotic pressure needed to prevent lysis of a given fraction of the input protoplast population. However, comparison of the osmotic stability of protoplasts from cells grown at different temperatures at various ambient incubation tempera- tures revealed that, except at 5 C where no differences were discerned, protoplasts from cells grown at lower temperatures still lysed at higher osmotic pressures than did those from cells grown at higher temperatures. The apparent internal osmolality (28 to 31 atm) did not vary significantly among whole cells from the three growth temperatures. Therefore, the observed differences in osmotic behavior could not be attributed to changes in internal osmotic pressure. Rather, it seemed likely that the differences were due to changes in membrane properties. Bacterial protoplasts are osmotically active membrane-bound bodies which shrink, swell, or lyse in response to forces exerted on them by the fluid in which they are suspended. Within moderate ranges of external osmotic pressure, protoplasts behave as perfect osmometers (11, 16) and follow the Lucke and McCutcheon (15) modification of the van't Hoff-Boyle equation: II( V - V.) = k, where II is the osmotic pressure of the surrounding medium, V is the total cell volume, VO is the osmotically inactive volume, and k is a constant. Protoplasts are analogous to mechanical osmometers in that their response to osmotic forces is determined by the interac- tion of the three components of the osmometer system: the internal phase, the external phase, and the intervening membrane barrier. Most previous studies have been concerned with the effects of perturbations in the suspend- ing medium, or external phase. Incubation temperatures of 50 C or more (20), hydrogen ion concentration (19), surface tension (21), and stabilizing solute size and conformation (5, 24) 1Joumal article no. 5966 of the Michigan Agricultural Experiment Station. are all important external factors which influ- ence the osmotic behavior of protoplasts. Relatively little is known about the osmotic properties of the cell cytoplasm, or internal phase. However, by use of water vapor equilib- rium studies, Mitchell and Moyle (18) and Bateman et al. (2) have estimated cellular internal osmotic pressures. Gram-negative bac- teria (Escherichia coli, Serratia marcescens) had apparent internal osmotic pressures from 4 to 7 atm, which were low compared to the 20 to 30 atm values obtained for the one gram-posi- tive bacterium investigated (Staphylococcus aureus). We took a more direct approach to determine an apparent internal osmotic pres- sure of the gram-positive rod, Bacillus megaterium. The selectively permeable membrane which separates the internal compartment from the external compartment constitutes the third part of the osmometer. Membrane permeability and physical properties play major roles in the responses of bacterial protoplasts to osmotic stress. The limiting membrane regulates swell- ing and lysis in hypotonic media in that, in a mechanical fashion, swelling appears to in- 1177 on May 28, 2018 by guest http://jb.asm.org/ Downloaded from
Transcript of June Vol. 0 Osmotic Behavior ofBacterial Protoplasts ...jb.asm.org/content/114/3/1177.full.pdf ·...
JOURNAL OF BACTERIOLOGY, June 1973, p. 1177-1183Copyright 0 1973 American Society for Microbiology
Vol. 114, No. 3Printed in U.SA.
Osmotic Behavior of Bacterial Protoplasts:Temperature Effects'
A. D. EISENBERG AND T. R. CORNERDepartment of Microbiology and Public Health, Michigan State University, East Lansing, Michigan 48823
Received for publication 16 August 1972
Among protoplasts released from cells of Bacillus megaterium grown at 20, 30,or 37 C, osmotic swelling in NaCl solution at a given external osmotic pressurewas greatest for protoplasts from cells grown at 20 C and least for protoplastsfrom cells grown at 37 C. Protoplasts from cells grown at lower temperatures werealso less stable to osmotic shock and lysed at higher external osmotic pressuresthan did protoplasts from cells grown at higher temperatures. But for cells grownat any one temperature, osmotic stabilization was itself temperature dependentso that the higher the ambient incubation temperature, the higher the osmoticpressure needed to prevent lysis of a given fraction of the input protoplastpopulation. However, comparison of the osmotic stability of protoplasts fromcells grown at different temperatures at various ambient incubation tempera-tures revealed that, except at 5 C where no differences were discerned,protoplasts from cells grown at lower temperatures still lysed at higher osmoticpressures than did those from cells grown at higher temperatures. The apparentinternal osmolality (28 to 31 atm) did not vary significantly among whole cellsfrom the three growth temperatures. Therefore, the observed differences inosmotic behavior could not be attributed to changes in internal osmotic pressure.Rather, it seemed likely that the differences were due to changes in membraneproperties.
Bacterial protoplasts are osmotically activemembrane-bound bodies which shrink, swell, orlyse in response to forces exerted on them by thefluid in which they are suspended. Withinmoderate ranges of external osmotic pressure,protoplasts behave as perfect osmometers (11,16) and follow the Lucke and McCutcheon (15)modification of the van't Hoff-Boyle equation:II( V - V.) = k, where II is the osmotic pressureof the surrounding medium, V is the total cellvolume, VO is the osmotically inactive volume,and k is a constant. Protoplasts are analogous tomechanical osmometers in that their responseto osmotic forces is determined by the interac-tion of the three components of the osmometersystem: the internal phase, the external phase,and the intervening membrane barrier.Most previous studies have been concerned
with the effects of perturbations in the suspend-ing medium, or external phase. Incubationtemperatures of 50 C or more (20), hydrogen ionconcentration (19), surface tension (21), andstabilizing solute size and conformation (5, 24)
1Joumal article no. 5966 of the Michigan AgriculturalExperiment Station.
are all important external factors which influ-ence the osmotic behavior of protoplasts.
Relatively little is known about the osmoticproperties of the cell cytoplasm, or internalphase. However, by use of water vapor equilib-rium studies, Mitchell and Moyle (18) andBateman et al. (2) have estimated cellularinternal osmotic pressures. Gram-negative bac-teria (Escherichia coli, Serratia marcescens)had apparent internal osmotic pressures from 4to 7 atm, which were low compared to the 20 to30 atm values obtained for the one gram-posi-tive bacterium investigated (Staphylococcusaureus). We took a more direct approach todetermine an apparent internal osmotic pres-sure of the gram-positive rod, Bacillusmegaterium.The selectively permeable membrane which
separates the internal compartment from theexternal compartment constitutes the thirdpart of the osmometer. Membrane permeabilityand physical properties play major roles in theresponses of bacterial protoplasts to osmoticstress. The limiting membrane regulates swell-ing and lysis in hypotonic media in that, in amechanical fashion, swelling appears to in-
1177
on May 28, 2018 by guest
http://jb.asm.org/
Dow
nloaded from

EISENBERG AND CORNER
crease the effective membrane "pore" size. Ifthe membrane stretches enough to permit sta-bilizing solute molecules to enter the protoplast,there is a rapid influx of solutes and waterwhich results in rapid stretching of the mem-brane and subsequent lysis of the protoplast (5).The chemical composition of microbial cells,
including their limiting membranes, is knownto be dramatically affected by changes in cul-ture growth temperature. For example, thelipids of B. megaterium contain relatively moresaturated fatty acids when the cells are grown at30 C than when they are grown at 23 C (9).Changes in membrane stability or membranepermeability in other cells grown at elevatedtemperatures have been related to increasedsaturation of fatty acids in these cells (4, 13).
Temperature-induced changes in membranecomposition which affect mechanical strengthor permeability, or both, should alter the os-motic behavior of bacterial protoplasts. Indeed,the osmotic behavior of protoplasts from B.megaterium was found to be altered by changesin growth temperature. Protoplasts isolatedfrom cells grown at higher temperatures weregenerally more resistant to osmotically inducedswelling and lysis than were those isolated fromcells grown at lower temperatures. Since theapparent internal osmotic pressure of the cellswas unaffected by growth temperature, mem-brane changes appeared to be responsible forthe observed alterations in osmotic behavior.
MATERIALS AND METHODSOrganism and growth conditions. Cells of B.
megaterium strain KM were grown in 2% Oxoidpeptone (Flow Laboratories, Rockville, Md.), pH 7.0,with vigorous aeration. Cells were grown at 20, 30, or37 C to the phase of declining growth rate. Underthese conditions, the cells did not form spores.Growth was monitored by means of a Spectronic 20spectrophotometer (Bausch and Lomb) at 700 nm,equipped with 1.1-cm light path cuvettes, with dis-tilled water used as a blank. An optical density of 2.0corresponded to 0.98, 1.00, and 0.95 mg of cells (drywt)/ml for cells grown at 20, 30, and 37 C, respec-tively. Cells were harvested by centrifugation whenthey reached a concentration between 1.1 and 1.4 mgof cells (dry wt)/ml.
Preparation of protoplasts. Cells harvested asdescribed were suspended in 1.016 osmolal (0.771 M)sucrose solution to a concentration of 5.0 mg of cells(dry wt)/ml. N-acetylmuramide glucanohydrolase(EC 3.2.1.17; lysozyme; Sigma Chemical Co., St.Louis) was then added to a final concentration of 200gg/mg of cells (dry wt). Lysozyme was added in buff-ered solution (0.01 M sodium phosphate, pH 7.0)which contained 25 mg of lysozyme/ml. At room tem-perature, protoplast release was completed in 20 min,as judged by the change from cylindrical to spherical
cell shape seen by phase-contrast microscopy. Thesesuspensions are referred to as primary protoplastsuspensions.
Counting procedures. Colony-forming units wereenumerated by the spread plate technique. Chilled1.2% peptone (Difco Labs, Detroit) was used as thediluent. There were 3.7 x 10⁸, 3.2 x 10⁸, and 4.8 x 10⁸colony-forming units per mg of cells (dry wt) for cellsgrown at 20, 30, and 37 C, respectively.
Total cell numbers were counted after fixation in6% (vol/vol) formaldehyde (Fischer Scientific Co.,Fair Lawn, N.J.). Cells were then counted in aPetroff-Hausser counting chamber. A Leitz-Ortholuxphase-contrast microscope was used for all directcounts. A magnification of 970 diameters was used forcounting whole cells. Under these conditions, crosswalls between cell pairs were readily observed. Foreach of four batches of cells, the counting chamberwas filled four times, and at least 200 cells werecounted for each chamber filling. There were 6.2 x10⁸, 5.9 x 10⁸, and 7.0 x 10⁸ cells per mg of cells (drywt) for cells grown at 20, 30, and 37 C, respectively.
Protoplasts were counted in a similar fashion. Afterfixation in 6% (vol/vol) formaldehyde, protoplastswere counted at a magnification of 1,600 diameters.The counting chamber was refilled at least twice for atleast three batches of cells grown at each of the threetemperatures. Over 100 protoplasts were counted perchamber filling except where lysis was nearly com-plete and few protoplasts were available for enumera-tion.
Assessment of osmotic behavior. Osmotic swell-ing and shrinking of protoplasts were measured by amodification of the procedure of Marquis (16). Atroom temperature, 0.5 ml of primary protoplastsuspension was added to 4.5 ml of various NaClsolutions of known osmotic pressures. Unless other-wise stated, after 30 min at room temperature theoptical densities at 650 nm (absorbancy, A,60) of theresultant protoplast suspensions were measured ina Spectronic 20 spectrophotometer. For a givensample of protoplasts, the decrease in A,50 as a func-tion of decreasing osmolality of the suspending me-dium was taken to reflect an increase in protoplastvolume. For study of osmotically induced lysis, thesuspensions were incubated for 30 min at 5, 20, 30, or37 C, and the number of remaining protoplasts wasassessed by direct count.
Determination of apparent internal osmoticpressure. Cells were suspended in 0.01 M sodiumphosphate buffer, pH 7.0, to a concentration of 20 to25 mg of cells (dry wt) per ml of suspension andtreated with 1 mg of lysozyme per ml of suspensionuntil lysis was complete. This crude lysate was thencentrifuged at 30,000 x g for 30 min to remove largeparticulate matter, primarily membrane fragmentsand nucleic acids which adhere to the membrane.After appropriate dilution in 0.01 M sodium phos-phate buffer (pH 7.0), the osmotic pressure of thesupernatant fluid was determined by use of a freezing-point osmometer (Advanced Instruments, Inc., Need-ham Heights, Mass.) which was calibrated to givereadout in milliosmoles per kilogram of solvent. Theresultant osmotic pressure values were corrected for
1178 J. BACTERIOL.
on May 28, 2018 by guest
http://jb.asm.org/
Dow
nloaded from

PROTOPLASTS AND TEMPERATURE
the contributions from spent medium components,lysozyme, solubilized cell wall material, and buffer.
Osmotic pressure and osmolality. Osmotic pres-sure, II, is often expressed by the equation: II =vRTc6, where v is the number of particles (ions)produced by the dissociation of the solute, R isthe universal gas constant, T is the absolute tempera-ture, c is the solute concentration, and 0 is theosmotic coefficient of the solute. The coefficient, 4,corrects for deviations from ideality. Osmolality isequivalent to molality times 0. A solution containing1 osmol/kg has an osmotic pressure of 22.4 atm at 25C. Osmotic pressures of NaCl or sucrose solutionswere calculated from data in a Handbook of Chemis-try and Physics. Osmotic coefficients were those givenby Scatchard, Hamer, and Wood (23).
RESULTSOsmotic swelling and shrinking. Protoplast
volume is inversely proportional to optical den-sity (11, 16). Hence, high value of the recipro-cal of optical density is indicative of largeprotoplast volume. When transferred to hyper-tonic NaCl solutions, protoplasts swelled pro-portionately as the osmotic pressure of theirsuspending medium was lowered (Fig. 1). Rela-tively short incubation periods, up to 90 min, atroom temperature did not markedly alter thecharacter of the swelling response at moderateosmotic pressures. Swelling in solutions of highosmotic pressure, 2.86 to 4.00 osmolal NaCl(0.35 to 0.25 osmolal- 1), may have been en-hanced by increased incubation time. In thisrange, the extent of protoplast swelling ap-peared to be greater after 90 min of incubationthan after only 5 min, but the absolute changesin A660 were small and of questionable signifi-
i-1
0
EE 1.6
1.4
1.2
0.2 0.4 0.6 0.8 1.0I/OSMOLALITY
FIG. 1. Osmotic swelling of protoplasts releasedfrom cells grown at 30 C. The preparations were
incubated in NaCI solutions at room temperature for5 (0), 40 (0), 90 (A), or 240 (V) min.
cance. Beyond this initial region, swelling wasnot much different unless the incubation wasgreatly prolonged. After 240 min, swelling inosmotic concentrations below 2.22 osmolal(above 0.45 osmolal-'), was so extensive thatthe protoplasts lysed. Consequently, in all fur-ther experiments an incubation time of 30 minwas used.The growth temperature of the parental cul-
ture influenced the osmotically induced swell-ing of protoplasts suspended in NaCl solutionsat room temperature (Fig. 2). Swelling profilesover a wide range of osmotic pressures showedthe similar trend of increasing reciprocal opticaldensity (1/A..0) as a function of decreasingosmotic pressure. Protoplasts derived from cellsgrown at 20 or 30 C reached a minimal volume,i.e., minimum 1/A..5o, at an osmotic pressurebetween 3.3 and 4.1 osmolal NaCl (between 71and 92 atm). Protoplasts obtained from cellsgrown at 37 C did not reach a minimal volumein the range of osmotic pressures investigated.Apparently, protoplasts from cells grown at 20C swelled to a much greater extent in NaClsolutions than did protoplasts liberated fromcells grown at the higher temperatures. Swellingof protoplasts from cells grown at 30 or 37 C didnot appear significantly different. Over therange in which the swelling response appearedlinear (2.34 to 1.09 osmolal or 0.427 to 0.917osmolal- 1), the slopes of the least-squareslinear regression lines, in units equivalent tovolume increase per osmotic pressure decrease,
2.0-
1.9-
1.6-
,S
4li'/
I /OSMOLALITY
FIG. 2. Osmotic swelling of protoplasts in NaCIsolutions at room temperature. Protoplasts were re-
leased from cells grown at 20 (0), 30 (0), or 37 C (A).
1.8,
VOL. 114, 1973 1179
on May 28, 2018 by guest
http://jb.asm.org/
Dow
nloaded from
EISENBERG AND CORNER
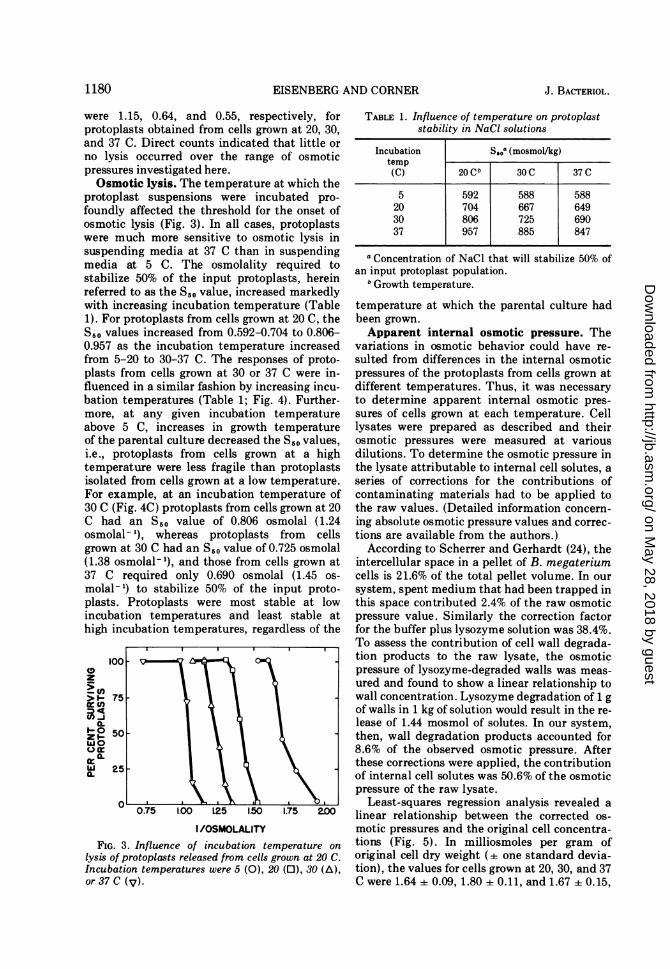
were 1.15, 0.64, and 0.55, respectively, forprotoplasts obtained from cells grown at 20, 30,and 37 C. Direct counts indicated that little orno lysis occurred over the range of osmoticpressures investigated here.Osmotic lysis. The temperature at which the
protoplast suspensions were incubated pro-foundly affected the threshold for the onset ofosmotic lysis (Fig. 3). In all cases, protoplastswere much more sensitive to osmotic lysis insuspending media at 37 C than in suspendingmedia at 5 C. The osmolality required tostabilize 50% of the input protoplasts, hereinreferred to as the S,0 value, increased markedlywith increasing incubation temperature (Table1). For protoplasts from cells grown at 20 C, theS,. values increased from 0.592-0.704 to 0.806-0.957 as the incubation temperature increasedfrom 5-20 to 30-37 C. The responses of proto-plasts from cells grown at 30 or 37 C were in-fluenced in a similar fashion by increasing incu-bation temperatures (Table 1; Fig. 4). Further-more, at any given incubation temperatureabove 5 C, increases in growth temperatureof the parental culture decreased the S50 values,i.e., protoplasts from cells grown at a hightemperature were less fragile than protoplastsisolated from cells grown at a low temperature.For example, at an incubation temperature of30 C (Fig. 4C) protoplasts from cells grown at 20C had an S,0 value of 0.806 osmolal (1.24osmolal- 1), whereas protoplasts from cellsgrown at 30 C had an S50 value of 0.725 osmolal(1.38 osmolal- 1), and those from cells grown at37 C required only 0.690 osmolal (1.45 os-
molal- 1) to stabilize 50% of the input proto-plasts. Protoplasts were most stable at lowincubation temperatures and least stable athigh incubation temperatures, regardless of the
100
0
> 1- 75-
0 50-
0
25
, . .
I /OSMOLALITYFIG. 3. Influence of incubation temperature on
lysis of protoplasts released from cells grown at 20 C.Incubation temperatures were 5 (0), 20 (0), 30 (A),or 37 C (V).
TABLE 1. Influence of temperature on protoplaststability in NaCI solutions
Incubation S50a (mosmol/kg)temp(C) 20GCb 30 C 37 C
5 592 588 58820 704 667 64930 806 725 69037 957 885 847
a Concentration of NaCl that will stabilize 50% ofan input protoplast population.
h Growth temperature.
temperature at which the parental culture hadbeen grown.Apparent internal osmotic pressure. The
variations in osmotic behavior could have re-sulted from differences in the internal osmoticpressures of the protoplasts from cells grown atdifferent temperatures. Thus, it was necessaryto determine apparent internal osmotic pres-sures of cells grown at each temperature. Celllysates were prepared as described and theirosmotic pressures were measured at variousdilutions. To determine the osmotic pressure inthe lysate attributable to internal cell solutes, aseries of corrections for the contributions ofcontaminating materials had to be applied tothe raw values. (Detailed information concern-ing absolute osmotic pressure values and correc-tions are available from the authors.)
According to Scherrer and Gerhardt (24), theintercellular space in a pellet of B. megateriumcells is 21.6% of the total pellet volume. In oursystem, spent medium that had been trapped inthis space contributed 2.4% of the raw osmoticpressure value. Similarly the correction factorfor the buffer plus lysozyme solution was 38.4%.To assess the contribution of cell wall degrada-tion products to the raw lysate, the osmoticpressure of lysozyme-degraded walls was meas-ured and found to show a linear relationship towall concentration. Lysozyme degradation of 1 gof walls in 1 kg of solution would result in the re-lease of 1.44 mosmol of solutes. In our system,then, wall degradation products accounted for8.6% of the observed osmotic pressure. Afterthese corrections were applied, the contributionof internal cell solutes was 50.6% of the osmoticpressure of the raw lysate.
Least-squares regression analysis revealed alinear relationship between the corrected os-motic pressures and the original cell concentra-tions (Fig. 5). In milliosmoles per gram oforiginal cell dry weight (+ one standard devia-tion), the values for cells grown at 20, 30, and 37C were 1.64 i 0.09, 1.80 ± 0.11, and 1.67 + 0.15,
1180 J. BACTERIOL.
on May 28, 2018 by guest
http://jb.asm.org/
Dow
nloaded from

VOL. 114, 1973 PROTOPLASTS AND TEMPERATURE 1181
100 5O 35 o
30-
75-
0L 0
IX25 25
0
,oo0 -J5 10 IS 20_75_ \\\ _ ~~~~~~~~~~mgORIGINAL CELL DRY WEIGHT / ml LYSATE
75
Z \ FIG. 5. Least-square regression lines relating theS 1\ apparent internal osmotic pressure to the relativeo50| , concentration of cytoplasmic solutes in cell lysates.S S Symbols: O, cells grown at 20 C, means of determina-C \ tions on 5 batches of cells; O, cells grown at 30 C,
25i-\ individual values from 5 batches of cells; A, cellsB~~~~grown at 37 C, mean-s of determinations on 4 batchesB
\k ~~~~~~~~~of cells. Bars represent =i1 standard deviation fromO ..the means obtained from determinationLson the cells
0.75 1.00 1.25 1.50 1.75 2.00 grown at 37 C.I/OSMOLALITY
respectively. Student's t test of the data in-,,. . . ~~~~dicated that the observed differences were not
loo ot statistically significant.FWith the assumption that growth tempera-
75\ ture does not markedly influence the water7s) 6 \\content of the cells, the above values can be
50w Symbols:d 0,celclsagow apaet20n,teanslofseemoinaa.0 tin on5rsurs bAtchesintofel;0 ellrowndatd 30dC,25(1)indiidaltvaue frme5gbathesu ocells;aeb , ellst
B gro78.5% water and 21.5% dry material. Salton's2 75 (22) figures indicate that roughly 20% of the dry
1.00 1.25 1.50b .75 2.00 weight is due to cell wall components. Hydratedz O I \ rwalls swell toan extent suchthat 92.1%of the ir-loo I | I dwet weight is due to water (10). A 4.65 g wet0 statweight quantity of cells will contain 1 g of dry
matter, of which 0.2 g is wall material and 0.8 gis protoplast components. Of the 3.65 g of water
z 11cin the wet pellet, 2.33 g is cell wall water andE only 1.32 g is protoplast water. It was assumed
a-.0 that thewater of h ydration associated with thew 2 membrane was negligible. Hence, the internail0.25 or protoplast water is 62.0% of the protoplast25 \ \ wet weight and is equivalent to 1.32 times theD whole cell dry weight. Consequently, the os-
moles of internal cell solutes from 1 kg of cell0.70 1.00 w.251.50 1.75 2.00 dry matter would be contained in 1.32 kg of
0/OSMOLALITY protoplast water. Or, the internal osmoles perkilogram of protoplast water will be 75a7% of the
FIG thatheunc wateofwthydrationr asoiaewithothe.
plast lysis at four incubation temperatures. Growth nteral osmoles provided by ak6logram of celltemperatures were 20(0), 30 (O), or 37 C (A). Incuba- dry material. The above values for cells growntion temperatures of 5, 20, 30, and 37 C are repre- at 20, 30, and 37 C then give, respectively, 1.24,sented in parts A, B, C, and D, respectively. 1.36, and 1.26 osmol/kg of protoplast water,- on M
ay 28, 2018 by guesthttp://jb.asm
.org/D
ownloaded from

EISENBERG AND CORNER
which correspond to internal osmotic pressuresof 27.8, 30.5, and 28.2 atm. These values aresomewhat higher than the range of 0.5 to 1.0osmol/kg (11.2 to 22.4 atm) reported for B.megaterium (16) but are in agreement with 20to 30 atm generally quoted for gram-positivebacteria (18).
DISCUSSIONProtoplasts from B. megaterium cells grown
at a given temperature were less stable toosmotic shock at higher ambient incubationtemperatures than at lower ones (Table 1).Abrams (1) has reported that protoplasts ofStreptococcus faecalis swell in the presence of ametabolizable substrate. At low substrate con-centrations the swelling was reversible; at highconcentrations the protoplasts swelled andlysed. The swelling response was eliminated bydecreasing the concentration of K+ and con-comitantly increasing the Na+ concentration.Because we used sodium salts in the suspendingmedium and because the amount of residualsucrose in any of the test solutions was low, itseems unlikely that metabolic swelling con-tributed significantly to the observed results.
Protoplasts from cells grown at higher tem-peratures were more stable regardless of theincubation temperature (Fig. 4), with the soleexception of 5 C. Thus, growth temperature didinfluence the capacity of cells to respond tochanges in environmental osmotic pressure.Because the apparent internal osmotic pressuredid not vary with growth temperature (Fig. 5),it appears that membrane changes were respon-sible for the observed differences in osmoticbehavior. The fundamental membrane changesthat underlie these behavioral variations areprobably chemical and result in alterations inmembrane permeability or mechanical strength,or both.
It is well known from studies of a largenumber of bacterial species that the composi-tion of lipids is indeed altered by variations inthe growth temperature (6, 8, 9, 13, 25). Ingeneral, higher growth temperatures result ingreater saturation of phospholipid fatty acids(4, 6, 13) which tends to decrease membranepermeability (7). For example, from lipid stud-ies with E. coli, Haest et al. (13) concluded thatwhen the growth temperature is elevated, bac-teria compensate for the thermodynamic in-crease in permeability by reducing the degree ofunsaturation of the phospholipid side chains.Such lipid changes may also increase the
mechanical strength of the membrane. Accord-ing to Chang and Matson (4), Arrhenius plots ofyeast cell thermostability revealed that transi-
tion points, indicative of phase changes, oc-curred at lower temperatures when the cellswere grown at 26 C than when they were grownat 40 C. The yeasts grown at the higher temper-ature had more saturated fatty acids whichwould allow closer packing of membrane lipidresidues. Consequently, they proposed that theeffective bonding in the membrane was in-creased, resulting in a structure that was morestable to thermal stress.
Possible contributions of membrane proteinsto the control of diffusive permeability havelargely been ignored. Apparently no study re-porting correlations between lipid changes andpermeability changes has also included an ex-amination of possible changes in membraneproteins. In fact, most of the evidence comesfrom work with liposomes formed solely of lipidmaterial extracted from the cells. However,membrane stretching during osmotic swellingdoes influence the behavior of protoplaststhrough the development of membrane tension(16) and by increasing the effective porosity ofthe membrane (5). Reagents such as formalde-hyde that normally cross-link proteins pro-foundly influence protoplast swelling, as doesurea, a protein denaturant which effects arelaxation of membrane structure. Therefore,Corner and Marquis (5) suggested that proteinnetwork was the major structural component ofthe protoplast membrane. Ultrastructural evi-dence for this view was reported by Grula et al.(12), who found that extraction of all the lipidsfrom the protoplast membrane left intact aprotein meshwork which retained the typical"unit-membrane" appearance. A recently pro-posed model for biological membranes in gen-eral embodies the principle of an underlyingprotein network backbone (26).
It may also be that lipid changes per se arenot the sole governing factor in temperature-induced permeability changes. For example,the lipids in the membrane might function notonly as part of the permeability barrier but alsoas plasticizers of the protein network. Plasticiz-ers are small molecules commonly added tosynthetic polymers to improve various proper-ties such as flow or drawing. The action of bothurea and glycerol in effecting membrane relaxa-tion has been likened to polymer plasticization(5), as have the actions of many small moleculeson collagen (17). Presumptive evidence thatlipids do behave as plasticizers can be obtainedfrom the work of Blais and Geil (3). Theyexamined, in the electron microscope, the abil-ity of the erythrocyte membrane to deformunder direct stretching. Normal membranescould be deformed into long fibers, whereas
1182 J. BACTERIOL.
on May 28, 2018 by guest
http://jb.asm.org/
Dow
nloaded from

PROTOPLASTS AND TEMPERATURE
lipid-depleted membranes lost this ability anddeformed by tearing rather than by drawinginto fibers. If lipids were to function as plasti-cizers, changes in the lipids would certainlyalter the response of the membrane to stretch-ing and, ultimately, would alter permeability.The prevailing view, then, is that lipids
control the permeability of cells and, therefore,temperature-induced changes in the lipid com-ponents are responsible for the differences inpermeability manifested by cells grown at dif-ferent temperatures. The results reported hereare consistent with this idea because the higherthe growth temperature, the more saturated thefatty acid residues in cells of B. megaterium (9).However, it should be pointed out that the roleof lipids may be less direct than presentlythought and that protein changes may make animportant contribution to the observed permea-bility changes. Resolution of these questionsawaits detailed chemical analyses of both pro-tein and lipid changes in membranes from cellsgrown at different temperatures.
ACKNOWLEDGMENTS
Support for this research was provided by grant no.GB-31663 from the National Science Foundation and byPublic Health Service training grant no. GM-01911 from theNational Institute of General Medical Sciences.We thank Jerol Hatinger for her technical assistance and
R. N. Costilow and R. E. Marquis for helpful commentsconcerning the manuscript. We thank R. Scherrer for the giftof cell walls and for helpful suggestions during the course ofthe work.
LITERATURE CITED
1. Abrams, A. 1959. Reversible metabolic swelling of bacte-rial protoplasts. J. Biol. Chem. 234:383-388.
2. Bateman, J. B., C. L. Stevens, W. B. Mercer, and E. L.Carstensen. 1962. Relative humidity and the killing ofbactera: the variation of cellular water content withextemal relative humidity or osmolality. J. Gen. Mi-crobiol. 29:207-219.
3. Blais, J. J. B. P., and P. H. Geil. 1969. Deformationbehavior of the erythrocyte ghost. Biopolymers8:275-287.
4. Chang, S. B., and R. S. Matson. 1972. Membranestability (thermal) and nature of fatty acids in yeastcells. Biochem. Biophys. Res. Commun. 46:1529-1535.
5. Corner, T. R., and R. E. Marquis. 1969. Why do bacterialprotoplasts burst in hypotonic solutions? Biochim.Biophys. Acta 183:544-558.
6. Cullen, J., M. C. Phillips, and G. G. Shipley. 1971. Theeffects of temperature on the composition and physicalproperties of lipids of Pseudomonas fluorescens. Bio-chem. J. 125:733-742.
7. DeGier, J., J. G. Mandersloot, and L. L. M. Van Deenen.1968. Lipid composition and permeability of liposomes.Biochim. Biophys. Acta 150:666-675.
8. DeSiervo, A. J. 1969. Alterations in the phospholipidcomposition of Escherichia coli B during growth atdifferent temperatures. J. Bacteriol. 100:1342-1349.
9. Fulco, A. J., R. Levy, and K. Block. 1964. The biosynthe-sis of Al'- and A'-monosaturated (sic) fatty acids bybacteria. J. Biol. Chem. 239:998-1003.
10. Gerhardt, P., and J. A. Judge. 1964. Porosity of isolatedcell walls of Saccharomyces cerevisiae and Bacillusmegaterium. J. Bacteriol. 87:945-951.
11. Gilby, A. R., and A. V. Few. 1959. Osmotic properties ofprotoplasts of Micrococcus lysodeikticus. J. Gen. Mi-crobiol. 20:321-327.
12. Grula, E. A., T. F. Butler, R. D. King, and G. L. Smith.1967. Bacterial cell membranes. II. Possible structureof the basal membrane continuum of Micrococcuslysodeikticus. Can. J. Microbiol. 13:1499-1507.
13. Haest, C. W. M., J. DeGier, J. A. F. Op den Kamp, P.Bartels, and L. L. M. Van Deenen. 1972. Changes inpermeability of Staphylococcus aureus and derivedliposomes with varying lipid composition. Biochim.Biophys. Acta 255:720-733.
14. Haest, C. W. M., J. DeGier, and L. L. M. Van Deenen.1969. Changes in the chemical and the barrier proper-ties of the membrane lipids of E. coli by variation of thetemperature of growth. Chem. Phys. Lipids 3:413-417.
15. Lucke, B., and M. McCutcheon. 1932. The living cell asan osmotic system and its permeability to water.Physiol. Rev. 12:68-139.
16. Marquis, R. E. 1967. Osmotic sensitivity of bacterialprotoplasts and the response of their limiting mem-brane to stretching. Arch. Biochem. Biophys.118:323-331.
17. Milch, R. A. 1966. Polymer-diluent and certain othereffects of solvent environment on the thermal shrinkage(contraction) and tensile strength properties of nativecalfskins. Biorheology 3:97-106.
18. Mitchell, P., and J. Moyle. 1956. Osmotic function andstructure in bacteria. Symp. Soc. Gen. Microbiol.6:150-180.
19. Op den Kamp, J. A. F., W. Van Iterson, and L. L. M. VanDeenen. 1967. Studies on the phospholipids and mor-phology of protoplasts of Bacillus megaterium. Bio-chim. Biophys. Acta 135:862-884.
20. Ray, P. H., and T. D. Brock. 1971. Thermal lysis ofbacterial membranes and its prevention by poly-amines. J. Gen. Microbiol. 66:133-135.
21. Salton, M. R. J. 1957. The action of lytic agents on thesurface structures of the bacterial cell. Proc. 2nd Int.Congr. Surface Activity 4:245-253.
22. Salton, M. R. J. 1964. The bacterial cell wall. ElsevierPublishing Co., Amsterdam.
23. Scatchard, G., W. J. Hamer, and S. E. Wood. 1938.Isotonic solutions. I. The chemical potential of water inaqueous solutions of sodium chloride, potassium chlo-ride, sulfuric acid, sucrose, urea and glycerol at 25 C. J.Amer. Chem. Soc. 60:3061-3070.
24. Scherrer, R., and P. Gerhardt. 1971. Molecular sieving byBacillus megaterium cell wall and protoplast. J. Bac-teriol. 107:718-735.
25. Tadayon, R. A., and K. K. Carroll. 1971. Effect of growthconditions on the fatty acid composition of Listeriamonocytogenes and comparison with the fatty acids ofErysipelothrix and Corynebacterium. Lipids6:820-825.
26. Vanderkooi, G., and D. E. Green. 1970. Biological mem-brane structure. I. The protein crystal model formembranes. Proc. Nat. Acad. Sci. U.S.A. 66:615-621.
1183VOL. 114, 1973
on May 28, 2018 by guest
http://jb.asm.org/
Dow
nloaded from