June 2017 - Community Oncology Alliance · 3 | Global Oncology Trends 2017. Report by the...
47
June 2017 Global Oncology Trends 2017 Advances, Complexity and Cost $
Transcript of June 2017 - Community Oncology Alliance · 3 | Global Oncology Trends 2017. Report by the...

June 2017
Global Oncology Trends 2017Advances, Complexity and Cost
$

Introduction Over the past decade, there has been a paradigm shift in the treatment of cancer, driven by advances in personalized medicine and immuno-oncology. From the period of 2011 through 2016, 68 novel therapies have launched globally for the treatment of cancer. These developments have led to improved outcomes for patients, especially for metastatic disease, and have led to an increased number of patients receiving treatment. For physicians and payers, the influx of novel therapies and increasing use of diagnostic testing adds to the already complex treatment algorithms of many tumor types. The pipeline for oncology remains robust, with over 600 molecules in late stage development. The focus on oncology will remain high over the next decade driven by the ongoing research and development and remaining unmet need.
In this report, we share our perspective on some of the trends observed in 2016, including impact on cancer outcomes, the redefinition of many cancers, availability and costs of oncology therapeutics and complexity in cancer treatments.
The study was produced independently by the QuintilesIMS as a public service, without industry or government funding. The contributions to this report of Paul Cariola, Jeffrey Hodge, Terry Murdoch, Rajalakshmi Nair, Alana Simorellis, Durgesh Soni, Dan Winkelman and others at QuintilesIMS are gratefully acknowledged.
Murray AitkenExecutive DirectorQuintilesIMS Institute
QuintilesIMS Institute100 IMS Drive, Parsippany, NJ 07054, [email protected] www.quintilesimsinstitute.org
©2017 QuintilesIMS and its affiliates. All reproduction rights, quotations, broadcasting, publications reserved. No part of this publication may be reproduced or transmitted in any form or by any means, electronic or mechanical, including photocopy, recording, or any information storage and retrieval system, without express written consent of QuintilesIMS and the QuintilesIMS Institute.
Global Oncology Trends 2017. Report by the QuintilesIMS Institute
Find out more
If you wish to receive future reports from the QuintilesIMS Institute or join our mailing list, please click here

Global Oncology Trends 2017. Report by the QuintilesIMS Institute
Contents 01 Executive summary 03 Advances in cancer treatment 1 1 Redefinition of cancer 18 Complexity in cancer care 24 Availability of cancer treatments 30 Cost of cancer treatments
39 Notes on sources40 Appendix 41 Authors 42 About the Institute

1 | Global Oncology Trends 2017. Report by the QuintilesIMS Institute
Executive summaryCancer continues to be one of the leading causes of morbidity and mortality worldwide. According to the WHO,
cancer was the second leading cause of death in 2015, responsible for 8.8 million deaths globally. While the global
burden of cancer continues to be high, therapeutic innovation based on improved understanding of disease biology
and translational research has contributed to the changing paradigm of cancer treatment over the past two decades.
Advances in cancer treatment
The launch of multiple novel agents, coupled with increasing awareness and focus on cancer prevention, and
emphasis on early diagnosis, have contributed to improved outcomes and a reduction in mortality rates for many of
the major cancers over the past decade. Since 2011, 68 new drugs have been approved for 22 indications, including
immuno-oncology agents that have considerably changed the treatment paradigm in many of the cancers (see
Chart 3). In particular, the immuno-oncology PD-1 and PD-L1 inhibitors have witnessed a rapid uptake based on their
remarkable clinical profile and approval for multiple cancers (see Chart 4). In an indication like melanoma, which until
recently had very high unmet need and few treatment options, availability of newer treatment options has nearly
tripled the number of patients receiving treatment and has nearly doubled the survival in metastatic melanoma (see
Chart 5). In non-small cell lung cancer (NSCLC), novel agents have provided improved outcomes compare to previous
treatments which were less effective and more toxic.
Redefinition of cancer
Cancer treatment has seen increased focus on personalized medicine, leading to patient segmentation based
on biomarker status. Major cancer types (lung, breast, colorectal [CRC], melanoma) have become increasingly
segmented, with each segment now being recognized as having specific treatment options and outcomes (see
Chart 8). In many cases, cancer is no longer a single tumor type diagnosis but is defined by a combination of factors,
including histology and biomarker status. Identification of newer biomarker niches, such as microsatellite instability
(MSI) status in CRC, and BRAF (a gene that encodes B-raf) and PD-L1 (programed cell death protein ligand 1) status in
NSCLC, are likely to fragment the patient populations within these cancers further.
Oncology continues to be an area of active interest with a robust pipeline of which 87% is a targeted therapy; several
of the targeted therapies in development have an associated biomarker (see Chart 10). Targeted agents inhibit the
growth and spread of cancer by interfering with molecular targets involved in cancer progression and may or may
not be associated with a specific biomarker. Due to specific targeting of the molecular pathways, they are less toxic
compared to traditional chemotherapy options. Along with personalized medicine with targeted agents, approval
of novel immunotherapy agents, which provide substantial clinical benefit, have raised the hope of significantly
improving cancer survival across a large number of tumor types (see Chart 12).
The concept of personalized medicine is now an integral part of clinical practice in oncology, and more clinical trials
are stratifying patient populations with predictive biomarkers; this has led to improved clinical outcomes by stratifying
patients for their response to treatment. The trend of personalized medicine in oncology has had a positive impact on
the drug development process leading to a decline in the duration of late-stage trials and a need for fewer enrolled
patients (see Chart 13).

2 | Global Oncology Trends 2017. Report by the QuintilesIMS Institute
Complexity in cancer care
Newer treatment options, biomarker-based patient segmentation and availability of biomarker-based treatment
approaches have added to the treatment complexity over the years (see Chart 14). Novel oncology treatments are
reaching physicians faster than ever, for example, the median time from patent filing to FDA approval has dropped
from 10.25 years in 2013 to 9.8 years in 2016, primarily through “pulling forward” late stage drugs and approving
them sooner (see Chart 15). In many cases, multiple agents with similar mechanism of action have been approved in
quick succession, presenting a complex situation for clinicians in the wake of limited clinical data to provide direct
comparison between the newer drugs. Use of predictive biomarkers and other diagnostic testing has increased over
the past five years and adds to treatment complexity, although not all patients receive recommended screenings
(see Chart 17).
Availability of cancer treatments
From 2011-2015, 42 new cancer medicines were launched globally, but the availability of newly launched agents
differs substantially by geography, with the highest number of novel agents being available in the United States and
Germany (see Chart 19). Reimbursement for new cancer medicines also varies by geography, and reimbursement
ranges from 100% to 61% across the countries under study (see Chart 20). Spending on new medicines for oncology
and supportive oncology care has increased since 2011 and those therapies launched within the past five years now
account for more than 20% of global oncology spending in 2016 (see Chart 21).
Cost of cancer treatments
Global costs of oncology therapeutics and supportive care drugs increased from $91Bn in 2012 to $113Bn in 2016, with
the United States accounting for 46% of the total global oncology costs (see Charts 24 and 25). The increase in cost in
the United States is primarily driven by the availability of novel agents. Longer duration of therapy with novel agents,
use of combination therapies with high cost novel agents and the possibility of patients receiving multiple lines of
therapies are factors likely to contribute to further increase in costs. Uptake of newer agents and increasing use of
older branded drugs are the contributing factors for increase in costs in other regions.
Future oncology cost growth is expected to be in the range of 6% to 9%, annually, through 2021, when global
oncology costs will exceed $147Bn even as patent expiries and biosimilar competition contribute to lower costs
(see Chart 31).
ExECutIvE SuMMARy

3 | Global Oncology Trends 2017. Report by the QuintilesIMS Institute
Advances in cancer treatment
• Cancer mortality rates have steadily declined across major developed countries over the past decade.
• the largest decline in mortality over the past decade has been among those tumor types with the greatest number of new treatment mechanisms in areas such as breast, lung, and colorectal cancers.
• Since 2011, the cancer treatment landscape has been transformed by new medicines which target 22 different types of cancers.
• Novel agents have not only increased the number of patients under treatment but have also provided better opportunities versus traditional therapies. For example, the rapid uptake of immuno-oncology drugs reflect their remarkable clinical profile and expansion of indications.
• In the case of advanced melanoma, several novel therapy classes, including PD-1 inhibitors, BRAF inhibitors, MEK inhibitors and anti-CtLA4 have launched in the last 5 years and resulted in tripling the number of treated patients.
• For NSCLC, the availability of novel agents, such as the anti-PD-1 agents nivolumab and pembrolizumab, have led to a greater number of treated patients. In addition, treatments for NSCLC have greater duration of response per line of therapy in 2015 when compared to response rates from 2011 due to these and other recently approved therapies.

ADvANCES IN CANCER tREAtMENt
4 | Global Oncology Trends 2017. Report by the QuintilesIMS Institute
Mortality rates have declined steadily over the past decade
Chart notes:
Based on ASMR from WHO Cancer Database for the period from 2004 to 2013. ASR = Age Standardized Rate. Sources also include: Naroda SA, Iqbala J, Miller AB. Why have breast cancer mortality rates declined. Journal of Cancer Policy. 2015. 5:8-17. American Cancer Society. Cancer Facts and Figures: Death Rate Down 25% Since 1991. Updated 2017 Jan. Available from: https://www.cancer.org/latest-news/cancer-facts-and-figures-death-rate-down-25-since-1991.html
• The past decade has witnessed a steady decline in the cancer mortality rate across EU5, the United States and Japan.
• Among the countries evaluated, the decline was highest in France, followed by the United States and Japan.
• The difference in rate of decline is a reflection of a combination of all aspects including more effective treatments, improved access to diagnostic tests as well as access to treatment.
• The decline in mortality is also a result of favorable trends in the most common cancers, including lung, breast, colorectal and prostate.
• In particular, there has been a drop in prostate cancers as guidelines have been updated to no longer recommend routine screening of PSA testing, which was leading to high numbers of over-diagnosis.
• Although the incidence of breast cancer has risen, treatments are more effective, and overall there has been a reduction in mortality for breast cancer in developed countries.
Source: WHO Cancer Database, Mar 2017
125
120
115
110
105
100
95
90
85
2004 2005 2006 2007 2008 2009 2010 2011 2012 2013
Mor
talit
y R
ate
per
100
,00
0
CAGR (2004- 2013)
UK
Germany
Italy France
Spain US
Japan
-1.2%
-1.2%
-1.4% -1.8%
-1.4% -1.7%
-1.6%
Chart 1: Changes in Mortality Rates Over Time (ASR, 2004–2013)

ADvANCES IN CANCER tREAtMENt
5 | Global Oncology Trends 2017. Report by the QuintilesIMS Institute
the greatest improvements in incidence and mortality is in prostate, breast, colorectal and lung cancers since 2004
Chart notes:
US FDA drug approvals from 2004 to 2013 considered for analysis. Each drug was considered once for the specified indication.
Multi-targeted TKIs (such as sunitinib, sorafenib, pazopanib, etc.) have been considered as a single class.
• Incidence of prostate cancer, CRC and lung cancer has declined over time, along with an improvement in mortality rate. This is likely attributable to higher screening and preventive measures instituted for these cancers.
• Improved mortality rates are a result of an increase in screening and early diagnosis as well as the approval of new drugs with diverse mechanisms of action.
• Within the United States, lung cancer and prostate cancer have shown the maximum decline in mortality rate.
• Liver cancer had the least improvement around incidence and mortality. The increase in incidence may be correlated with co-infection of hepatitis B and C virus infection.
• The increase in incidence of thyroid cancer appears to be the result of increased rates of detection rather than an increase in the number of new cases.
Source: QuintilesIMS, ARK R&D Intelligence, Feb 2017; WHO Cancer Database, Mar 2017; QuintilesIMS Institute, Mar 2017
8%
6%
4%
2%
0%
-2%
-4%
-6%
-8%
-3.5% -2.5% -1.5% -0.5%
Bubble size = No. of New Drugs Addressing Unique MOA in 2004 to 2013
0.5% 1.5% 2.5% 3.5%
Incr
ease
in In
cide
nce
(AS
R)
Change in Survival (ASR)
Breast Cancer
CRC
Liver Lung Pancreatic
Prostate Cancer
Kidney Cancer
Thyroid Cancer
1
1
Melanoma
23
34
35
5
Chart 2: Change in Incidence and Mortality (2004–2013)
6 | Global Oncology Trends 2017. Report by the QuintilesIMS Institute
ADvANCES IN CANCER tREAtMENt
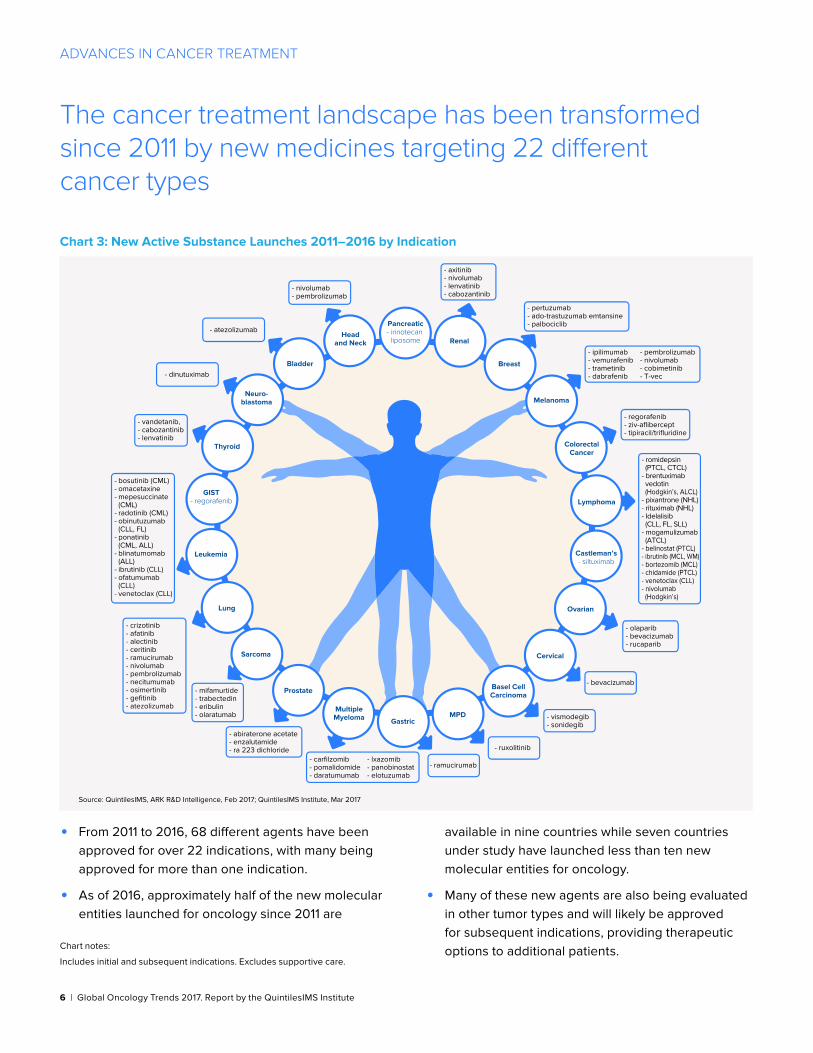
the cancer treatment landscape has been transformed since 2011 by new medicines targeting 22 different cancer types
Chart notes:
Includes initial and subsequent indications. Excludes supportive care.
• From 2011 to 2016, 68 different agents have been approved for over 22 indications, with many being approved for more than one indication.
• As of 2016, approximately half of the new molecular entities launched for oncology since 2011 are
available in nine countries while seven countries under study have launched less than ten new molecular entities for oncology.
• Many of these new agents are also being evaluated in other tumor types and will likely be approved for subsequent indications, providing therapeutic options to additional patients.
Source: QuintilesIMS, ARK R&D Intelligence, Feb 2017; QuintilesIMS Institute, Mar 2017
- vandetanib,- cabozantinib- lenvatinib
Pancreatic- irinotecan
liposome Renal
Breast
ColorectalCancer
Melanoma
Ovarian
Lymphoma
Castleman’s- siltuximab
Cervical
Basel CellCarcinoma
MPDGastric
MultipleMyeloma
Prostate
Sarcoma
Lung
Leukemia
GIST- regorafenib
Thyroid
Neuro-blastoma
Bladder
Headand Neck
- nivolumab- pembrolizumab
- dinutuximab
- atezolizumab
- vismodegib- sonidegib
- bevacizumab
- ruxolitinib
- ramucirumab
- olaparib- bevacizumab- rucaparib
- regorafenib- ziv-aflibercept- tipiracil/trifluridine
- romidepsin (PTCL, CTCL)- brentuximab vedotin (Hodgkin’s, ALCL)- pixantrone (NHL)- rituximab (NHL)- Idelalisib (CLL, FL, SLL)- mogamulizumab (ATCL)- belinostat (PTCL)- ibrutinib (MCL, WM)- bortezomib (MCL)- chidamide (PTCL)- venetoclax (CLL)- nivolumab (Hodgkin’s)
- pertuzumab- ado-trastuzumab emtansine- palbociclib
- ipilimumab- vemurafenib- trametinib- dabrafenib
- pembrolizumab- nivolumab- cobimetinib- T-vec
- axitinib- nivolumab- lenvatinib- cabozantinib
- bosutinib (CML)- omacetaxine- mepesuccinate (CML)- radotinib (CML)- obinutuzumab (CLL, FL)- ponatinib (CML, ALL)- blinatumomab (ALL)- ibrutinib (CLL)- ofatumumab (CLL)- venetoclax (CLL)
- crizotinib- afatinib- alectinib- ceritinib- ramucirumab- nivolumab- pembrolizumab- necitumumab- osimertinib- gefitinib- atezolizumab
- mifamurtide- trabectedin- eribulin- olaratumab
- abiraterone acetate- enzalutamide- ra 223 dichloride
- carfilzomib- pomalidomide- daratumumab
- lxazomib- panobinostat- elotuzumab
Chart 3: New Active Substance Launches 2011–2016 by Indication
Source: QuintilesIMS, ARK R&D Intelligence, Feb 2017; QuintilesIMS Institute, Mar 2017
- vandetanib,- cabozantinib- lenvatinib
Pancreatic- irinotecan
liposome Renal
Breast
ColorectalCancer
Melanoma
Ovarian
Lymphoma
Castleman’s- siltuximab
Cervical
Basel CellCarcinoma
MPDGastric
MultipleMyeloma
Prostate
Sarcoma
Lung
Leukemia
GIST- regorafenib
Thyroid
Neuro-blastoma
Bladder
Headand Neck
- nivolumab- pembrolizumab
- dinutuximab
- atezolizumab
- vismodegib- sonidegib
- bevacizumab
- ruxolitinib
- ramucirumab
- olaparib- bevacizumab- rucaparib
- regorafenib- ziv-aflibercept- tipiracil/trifluridine
- romidepsin (PTCL, CTCL)- brentuximab vedotin (Hodgkin’s, ALCL)- pixantrone (NHL)- rituximab (NHL)- Idelalisib (CLL, FL, SLL)- mogamulizumab (ATCL)- belinostat (PTCL)- ibrutinib (MCL, WM)- bortezomib (MCL)- chidamide (PTCL)- venetoclax (CLL)- nivolumab (Hodgkin’s)
- pertuzumab- ado-trastuzumab emtansine- palbociclib
- ipilimumab- vemurafenib- trametinib- dabrafenib
- pembrolizumab- nivolumab- cobimetinib- T-vec
- axitinib- nivolumab- lenvatinib- cabozantinib
- bosutinib (CML)- omacetaxine- mepesuccinate (CML)- radotinib (CML)- obinutuzumab (CLL, FL)- ponatinib (CML, ALL)- blinatumomab (ALL)- ibrutinib (CLL)- ofatumumab (CLL)- venetoclax (CLL)
- crizotinib- afatinib- alectinib- ceritinib- ramucirumab- nivolumab- pembrolizumab- necitumumab- osimertinib- gefitinib- atezolizumab
- mifamurtide- trabectedin- eribulin- olaratumab
- abiraterone acetate- enzalutamide- ra 223 dichloride
- carfilzomib- pomalidomide- daratumumab
- lxazomib- panobinostat- elotuzumab

7 | Global Oncology Trends 2017. Report by the QuintilesIMS Institute
ADvANCES IN CANCER tREAtMENt
Rapid uptake of immuno-oncology drugs reflect their remarkable clinical profile and expansion of indications
Chart notes:
PD-1 is an abbreviation for the programmed cell death protein 1; BRAF is a gene that makes a protein called B-Raf; NSCLC refers to non-small cell lung cancer. All indications are for metastatic disease and second line or lower treatment sequence unless otherwise indicated. Months represent three month rolling average. Additional sources: Dolan DE, Gupta S. PD-1 pathway inhibitors: changing the landscape of cancer immunotherapy. Value for March 2017 is projected. 2014 Jul;21(3):231-7. American Cancer Society. Accessed May 2017. Available at https://www.cancer.org/treatment/treatments-and-side-effects/treatment-types/immunotherapy/immune-checkpoint-inhibitors.html
• PD-1 inhibitors represent a paradigm shift in the treatment of cancer. The immune system has the ability to find and destroy tumor cells, however, some tumors elude this response by disrupting T-cell checkpoints signaling pathways involving PD-1 and its ligands. Treatment with PD-1 agents in tumors that over-express PD-1 stimulate a patient’s immune system against the cancer. These agents are associated with durable response in multiple cancer types.
• The first of many highly anticipated immuno-oncology therapies was launched at the end of 2014 for the treatment of melanoma (pembrolizumab in September and nivolumab in December).
• Over 135 clinical trials for additional indications across 30 tumor types exist between the two currently approved PD-1 inhibitors.
• The promising PD-L1 inhibitor, atezolizumab, was approved in May 2016 for bladder cancer and in October 2016 for non-small cell lung cancer. It is in trials for breast and renal cell cancer.
• Avelumab was approved in March 2017 for metastatic Merkel cell carcinoma, a rare and highly aggressive type of skin cancer. It has also been granted priority review by the FDA in Feb 2017.
• PD-L1 inhibitor durvalumab is also in late-phase development and has an FDA Breakthrough Therapy designation for PD-L1+ bladder cancer.
Source: U.S. FDA, QuintilesIMS, National Sales Perspectives, Feb 2017; QuintilesIMS Institute, Apr 2017
1,400
1,200
1,000
800
600
400
200
0
Nov 2014
Dec 2014
Jan 2
015
Feb 2015
Mar 2
015
Apr 2015
May 2
015
Jun 2
015
Jul 2
015
Aug 2015
Sep 2015
Oct 2015
Nov 2015
Dec 2015
Jan 2
016
Feb 2016
Mar 2
016
Apr 2016
May 2
016
Jun 2
016
Jul 2
016
Aug 2016
Sep 2016
Oct 2016
Feb 2017
Nov 2016
Dec 2016
Jan 2
017
Mar 2
017
Exte
nded
Uni
ts T
hous
ands
pembrolizumab approvals nivolumab approvals
atezolizumab approvals avelumab approval
Squamous NSCLC
Renal Cell Carcinoma
BRAF V600 Wild-Type Melanoma
Melanoma
NSCLC PD-L1+
Melanoma (first line)
Non-Squamous NSCLC
BRAF V600 Wild-Type Melanoma
(combination with ipilimimab)
Bladder Cancer
Melanoma across BRAF Status
(combination with ipilimimab)
Hodgkin Lymphoma
Head and Neck Squamous
Cell Carcinoma
Bladder Cancer
Head and Neck Squamous Cell Carcinoma
NSCLC (first line)
Hodgkin Lymphoma
Merkel Cell
Carcinoma
Chart 4: Immuno-Oncology PD-1 and PD-L1 Inhibitor Uptake in the United States

8 | Global Oncology Trends 2017. Report by the QuintilesIMS Institute
ADvANCES IN CANCER tREAtMENt
the number of treated melanoma patients has nearly tripled with the launch of novel agents
Chart notes:
Line of therapy not considered for the break-up of added patients or reduction in patient numbers for the specific classes.
CTLA-4: Cytotoxic T-lymphocyte-Associated protein 4; PD-1: Programmed cell death protein 1; BRAF is a gene that makes a protein called B-Raf ; MEK is mitogen-activated protein kinase kinase; CtlA4 if cytotoxic T-lymphocyte-associated protein 4; Ipi = ipilimumab
• Several novel therapies such as PD-1 inhibitors, BRAF inhibitors, MEK inhibitors and anti-CTLA4 agents for advanced melanoma have been launched in last 5 years.
• With the launch of these agents, the number of patients undergoing treatment has nearly tripled.
• The increase in number of patients is not limited to first line, but across all lines, implying longer survival and multiple treatment options for this aggressive tumor type.
• However, there is limited clarity on the optimal sequencing of the agents in many cases, and choice of treatment is currently guided by goals of treatment (rapid response vs. durable disease control), presence of mutations and burden of toxicities associated with each option.
Source: QuintilesIMS, Real World Insights Oncology US EMR Data, Dec 2016; QuintilesIMS Institute, Mar 2017
25,000
20,000
15,000
10,000
5,000
0
2011 Anti-CTLA4Monotherapy
Other PD-1Monotherapy
BRAF Inhibitor/MEK Inhibitor
PD-1 / IpiCombo
2016
Num
ber
of M
elan
oma
Pat
ient
s in
Tre
atm
ent
8,900
808 1,651
11,100
1,995
2,664
22,200
7,700
17,000
1,200
3,600
1,600
First Line Second Line Third Line Added Patients Reduction in Number of Patients
Chart 5: Increase in Number of Treated Patients for Melanoma

9 | Global Oncology Trends 2017. Report by the QuintilesIMS Institute
ADvANCES IN CANCER tREAtMENt
Availability of novel agents for NSCLC has increased the number of treated patients
Chart notes:
Line of therapy not considered for the break-up of added patients or reduction in patient numbers for the specific classes.
EGFR : Epidermal growth factor receptor : ALK inhibitor: Anaplastic lymphoma kinase; TKI: Tyrosine kinase inhibitor; PD-1: Programmed cell death protein 1.
• The approval of anti-PD-1 agents nivolumab and pembrolizumab for NSCLC has brought about a change in the treatment paradigm.
• The number of patients receiving single-agent chemotherapy appears to have decreased considerably while the number of patients receiving EGFR-TKI based therapy has also reduced.
• There appears to be an increase in the number of patients receiving anti-PD-1 therapy driven by the approval of these agents across lines of therapy and proven clinical benefit.
• Movement of patients from monotherapies to PD-1 highlight better options for later line (>1 line) patients, as monotherapies have historically been the mainstay for these patients.
Source: QuintilesIMS, Real World Insights Oncology US EMR Data, Dec 2016; QuintilesIMS Institute, Mar 2017
160,000
140,000
120,000
100,000
80,000
60,000
40,000
20,000
0
2013 Single AgentChemos
EGFR TKIRegimen
BevacizumabRegimen
PlatnumRegimens
ALKInhibitor
PD-1Mono
Therapy
Ramucirumab- Based
Therapies
2016
Num
ber
of N
SC
LC P
atie
nts
in T
reat
men
t
Added PatientsTotal Patients Reduction in Number of Patients
158,800
11,676 9,950 3,696
842 1,168 1,450
27,433
164,371
Chart 6: Increase in Number of Treated Patients for NSCLC

10 | Global Oncology Trends 2017. Report by the QuintilesIMS Institute
ADvANCES IN CANCER tREAtMENt
there is an increase in the duration of response to therapy in NSCLC due to the approval of novel agents in 2015
Chart notes:
Maintenance therapy following first-line treatment was considered as a part of first-line and not evaluated separately.
Dec 2012 was considered as the data cut-off period for 2011 cohort to ensure parity in terms of duration for analysis.
Patients on bevacizumab-based 1L therapy for >100 days who went on to receive bevacizumab monotherapy and patients receiving pemetrexed or erlotinib monotherapy following platinum-based 1L were considered as having received maintenance therapy.
• The availability of novel agents has improved clinical outcomes for patients with metastatic NSCLC, both in terms of duration of therapy as well as progression to next line of therapy.
• Longer duration of response to therapy in patients in the 2015 cohort is in part due to the approval of PD-1 agents for NSCLC in the United States: nivolumab and pembrolizumab.
• Patient outcomes for metastatic NSCLC is likely to improve further with the additional approval of pembrolizumab for first line treatment and the approval of atezolizumab for 2nd line treatment of NSCLC in Oct 2016.
• Additionally, other PD-L1 agents, durvalumab and avelumab, are in late-phase development for NSCLC and may provide further treatment options for these patients.
Source: QuintilesIMS, Real World Insights Oncology US EMR Data, Dec 2016; QuintilesIMS Institute, Mar 2017
100%
90%
80%
70%
60%
50%
40%
30%
20%
10%
0%
2011
111
2131
4151
6171
8191
101111
121131
141151
161171
181191
201211
221231
241251
261271
281291
301311
321331
341351
361
Per
cent
age
of P
atie
nts
Median Duration of Therapy (Days)
2015
1st Line
2nd Line
2nd Line
3rd Line
3rd Line
4th Line
4th Line
Chart 7: Progression to Next Line of Therapy in NSCLC

11 | Global Oncology Trends 2017. Report by the QuintilesIMS Institute
Redefinition of cancer
• Cancer has been progressively redefined over the past 20 years. A key factor has been use of predictive biomarkers that have allowed sub-populations within cancer types to be identified. Overall, this trend has led to an increase in the number of personalized medicines that can specifically target unique cancer populations.
• trials using biomarkers to predict patient response are gaining increasing significance in the clinical trial landscape and nearly 11% of the currently ongoing late-phase trials are utilizing biomarker based segmentation.
• the pipeline of oncology drugs in clinical development has expanded by 45% over the past ten years; 87% of the late stage pipeline are targeted therapies which include small molecule protein kinase inhibitors and biologic monoclonal antibodies.
• the global R&D pipeline for oncology remains robust with 631 late phase therapies, an increase from the number of oncology molecules from May 2016.
• Among next generation immuno-oncology mechanisms of action in development, the PD1/PDL-1 inhibitors have seen the greatest expansion across many of the existing tumor types.
• trial duration and average enrollment has declined in the last 20 years highlighting a shift in trial design and smaller patient populations largely as result of patient segmentation via predictive biomarkers.

12 | Global Oncology Trends 2017. Report by the QuintilesIMS Institute
REDEFINItION OF CANCER
Cancer has been progressively redefined over the past 20 years
Chart notes:
The availability of new treatment options based on US FDA drug approvals for selected tumor types was considered for segmentation; pie graphs that total 100% indicate the biomarker was not yet available in that year.
BRAF status in NSCLC included based on US FDA BTD status granted to dabrafenib/trametinib combination.
BRCA status in prostate cancer included based on FDA BTD status granted to olaparib.
• Almost all major tumor types have witnessed extensive segmentation over the past 2 decades based on different criteria including biomarkers, age, and histology.
• Currently, immunotherapies are redesigning the landscape based on predictive biomarkers, such as PD-L1 status in NSCLC and MSI status in colorectal cancer.
Source: FDA.gov and Drugs@FDA, Mar 2017; QuintilesIMS, ARK R&D Intelligence, Feb 2017; QuintilesIMS Institute, Mar 2017
1996 2006 2016
Non Segmented Lung Cancer EGFR ALK Squamous ROS BRAF PD-1+
NSCLC
Breast Cancer
Colorectal Cancer
Non Segmented CRC KRAS-WT KRAS-MUT BRAF MSI-H Other
Melanoma
Non Segmented Melanoma Melanoma BRAF-Mu Melanoma BRAF-WT NRAS
Prostate
Unsegmented Prostate Cancer BRCA*
HR +ve HR-ve HR +ve, Premenopausal HR -ve, Premenopausal HR-, Premenopausal HR-, Postmenopausal TNBC, Premenopausal TNBC, Postmenopausal HER2- HR+, Premenopausal HER2- HR+, Postmenopausal HER2+ HR-, Premenopausal HER2+ HR-, Postmenopausal HER2+HR+, Premenopausal HER+ HR+, Postmenopausal
Chart 8: Percent of Biomarker-Based Segmentation in Selected Tumors

13 | Global Oncology Trends 2017. Report by the QuintilesIMS Institute
REDEFINItION OF CANCER
trials using biomarkers to predict patient response made up on average 15% of clinical trials since 2011
Chart notes:
Industry sponsored, phase II and phase III trials initiated after 1997 were considered for analysis. Includes only oncology trials initiated between 1997 and 2016, supportive care trials not considered.
• Predictive biomarkers support informed risk/benefit assessments and treatment decisions for individual patients.
• Despite the challenges in identification, development and incorporation into clinical practice, well-defined and validated predictive biomarkers form the basis for personalized care in oncology.
• With increasing segmentation in many of the tumors, clinical trials are increasingly using biomarker-based patient stratification during the drug development process to find the niche populations most likely to benefit from a particular drug.
• Ten percent of the currently ongoing late-phase trials are utilizing biomarker based segmentation, highlighting the focus on niche and smaller segments and indicating a more targeted approach and movement towards personalized medicine in oncology.
• By 2010, nearly 20% of trials were using biomarkers to predict patient response, but this value has since declined.
• By identifying patients most likely to respond to therapy, predictive biomarker-based drug development has reduced the timeline for clinical drug development program for these agents.
Source: Trialtrove, Pharma intelligence, Apr 2017; QuintilesIMS Institute, Apr 2017
3000
2500
2000
1500
1000
500
0
1997 2016201520142013201220112010200920082007200620052004200320022001200019991998
Num
ber
of T
rial
s
Biomarker-Based TrialsNon-Biomarker-Based Trials
Chart 9: Number of Biomarker-Informed Late-Phase Trials (1997–2016)

14 | Global Oncology Trends 2017. Report by the QuintilesIMS Institute
REDEFINItION OF CANCER
the pipeline of oncology drugs in clinical development has expanded by 45% over the past ten years
Chart notes:
Includes oncology products in active research at the end of December each year. Products are included if they are a new molecule, combination, or delivery system which is being investigated separately from any prior research or regulatory filings. Products are included based on the most advanced research stage for any indication in any geography and include phases II to registration. Additional indications for marketed products or indications less advanced than the lead research indication are not included.
• Oncology research and development activity remains concentrated on targeted therapies, which made up 90% of the late phase pipeline in 2016.
• Targeted therapies include small molecule protein
kinase inhibitors, biologic monoclonal antibodies,
and a range of new mechanisms that can identify
or block the cell processes that cause cancer cells
to multiply.
• Particular focus is being placed on targeted therapies that use genetic marker tests to indicate a greater likelihood of tumor response, or amplify the patient’s own immune response to target the cancer.
• The late phase oncology pipeline includes 278 biologic therapies, including 15 gene therapies, 133 new monoclonal antibodies (mAbs), and 14 biosimilars of existing mAbs.
• The late phase pipeline also includes 82 potential vaccines for a wide variety of tumor types.
• Immunotherapies are one of the fastest growing areas within oncology R&D, and will undoubtedly make up a larger portion of the pipeline in 2021.
Source: QuintilesIMS, ARK R&D Intelligence, Dec 2016; QuintilesIMS Institute, Mar 2016
Targeted Small Molecules CytotoxicsTargeted Biologics Hormonals Radiotherapies
0
100
200
300
400
500
600
700
2007 20082006 2009 2010 2011 2012 2013 2014 2015 2016
2006(392)
2016(631)
1 % 1%
4% 2%
15% 8%
21% 43%
59% 47%
Chart 10: Late Phase Oncology Pipeline Molecules, 2006–2016

15 | Global Oncology Trends 2017. Report by the QuintilesIMS Institute
REDEFINItION OF CANCER
the global R&D pipeline for oncology remains robust with 631 unique molecules in late-phase development
Chart notes:
Active late stage pipeline defined as molecules that have reached Phase II or above but are not yet marketed. Molecule and company counts are unique. Where more than one company is actively involved in development of a single molecule, both collaborating companies are reflected in the count, however the molecule is counted once.
• The late stage oncology pipeline is robust, with 631 unique molecules in development. This is an increase from the number of oncology molecules from May 2016 (586).
• The number of companies with late phase oncology molecules has risen slightly since May 2016, from 511 to 544.
• The length of Phase III trials for new oncology medicines has declined over past five years (see Chart 13). This leads to new oncology medicines entering the market at a faster pace than historically and being superseded by newer treatments within a few years.
• The number of new molecules and the increasing number of combination regimens has spurred the pace of development within oncology. In addition, the use of predictive biomarkers to stratify patients by their potential to respond to personalized treatments also has a positive impact on the pipeline.
Source: QuintilesIMS ARK R&D Intelligence, QuintilesIMS Institute, Dec 2016
Pre-Reg/ RegisteredPhase IIIPhase II
39
139
453
391
191
79
544
Phase II
Phase III
Pre-Reg/Registered
Late PhaseActive Pipeline
Molecules in the Late Phase Pipeline: 631 Companies with a Late Phase Pipeline: 544
Chart 11: Global Late Phase Oncology Pipeline in 2016

16 | Global Oncology Trends 2017. Report by the QuintilesIMS Institute
REDEFINItION OF CANCER
PD1/PDL-1 inhibitors have seen the greatest development across many of the existing tumor types
Chart notes:
MoA: Mechanism of Action. List of immuno-oncology MoAs is not exhaustive. MoAs in phase I trials for advanced solid tumors have not been included here. Only the highest phase of development in the tumor type has been considered for each MoA. Industry-sponsored trials registered with clinicaltrials.gov were considered for analysis. H&N = head and neck; RCC = renal cell carcinoma; STS = soft tissue sarcoma; ALL = acute lymphoblastic leukemia; AML = acute myeloid leukemia; CLL = chronic lymphocytic leukemia; HL = Hodgkin lymphoma; MDS = Myelodysplastic syndrome; MM = multiple myeloma; NHL = non-Hodgkin’s lymphoma.
• Immuno-oncology agents have drastically altered the treatment landscape of several tumor types where approved.
• While anti-PD-1 and PD-L1 agents have already been approved in multiple tumor types, agents with newer immuno-oncology MoAs are currently in early development across various tumor types, being evaluated both as monotherapy and in combination with already approved immuno-oncology agents.
• Most agents are in development for solid tumors but development of hematologic malignancies is increasing.
Source: Clinicaltrials.gov, Feb 2017; QuintilesIMS Institute, Mar 2017
Hematologic Malignancies
4-1BB Agonist
Anti-CSF-1R
Anti-KIR
Anti-LAG-3 mAb
Anti-M-CSF mAb
Anti-PD1
Anti-PD-L1
Anti-TIM3 mAb
CAR-T Cell Therapy
IDO-1 Inhibitor
Solid Tumors
Phase I Phase II Phase III Marketed
Bladder
Brain
Breas
t Can
cer
Cervica
l CRC
Endometrial
Esophag
eal
Gastri
c H&N
HCC
Melanoma
Merkel C
ell
Mesoth
elioma
NSCLC
Ovaria
n
Pancre
atic
Prosta
te C
ance
rRCC
STS
Thyroid
ALL
AML CLL
HL
MDS MM
NHL
Chart 12: Next Generation Immuno-Oncology MoAs in Development

17 | Global Oncology Trends 2017. Report by the QuintilesIMS Institute
REDEFINItION OF CANCER
trial duration and average enrollment have declined highlighting shifts in trial design and target indication size
Chart notes:
Based on analysis of trial duration and enrollment numbers in phase III trials registered in clinicaltrials.gov.
Start date: Estimated date on which the clinical trial was open for recruitment of participants, or the actual date on which the first participant was enrolled. Completion date: date the final participant was examined or received an intervention for purposes of final collection of data for the primary and secondary outcome measures and adverse events.
• Over the last 20 years, the average number of patients enrolled in phase III trials has declined from a high of 671 in 1998 to 188 patients in 2016, with a corresponding decline in trial duration from 2000 days in 1997 to 1070 days in 2016.
• This could be a result of increasing focus on niche and smaller patient segments within tumor types requiring lower enrollment to demonstrate clinical benefit. In addition, improved trial design technologies are being employed to hasten the clinical development program for cancer drugs.
Source: Clinicaltrials.gov, Feb 2017; QuintilesIMS Institute, Mar 2017
Average Trial Duration Average Enrollment
1997 1998 20032002200120001999 2004 2005 2006 2007 2009 2010 20112008 2012 2013 2014 2015 2016
Ave
rage
Tri
al D
urat
ion
(Day
s)
2,500
2,000
1,500
1,000
500
0
Ave
rage
Enr
ollm
ent
800
700
600
500
400
300
200
100
0
Chart 13: Trial Duration and Patient Enrollment in Phase III Trials (1997–2016)

18 | Global Oncology Trends 2017. Report by the QuintilesIMS Institute
Complexity in cancer care
• Over the last 20 years, treatment options have increased, both in terms of diverse mechanisms of actions, as well as number of drugs for each mechanism of action class, and this has led to increased treatment complexity.
• Another contributing factor is that the time to launch oncology medicines has accelerated which has allowed more novel therapies to enter the market, adding to the burden of treatment decisions. In 2016, the median time from patent filing to approval for oncology drugs was 9.8 years, down from 10.25 years in 2013.
• Not only has time to launch declined, but agents with similar mechanisms of action and incremental efficacy gains have reached the market within a few months or years of each other, which further complicate treatment choice.
• Deciding when to test for biomarkers, how to interpret results, and what therapy to chose based on the results adds more complexity in treatment decision making for different tumor types.
• using an example from NSCLC, in 2006 physicians had access to essentially one patient-stratifying biomarker test and a handful of therapies. By 2016, there are four predictive biomarker tests and numerous treatment options that radiate outwards from these tests across multiple lines of therapy.

COMPLExIty IN CANCER CARE
19 | Global Oncology Trends 2017. Report by the QuintilesIMS Institute
Over the last 20 years, therapy options for multiple tumor types have increased adding to treatment complexity
Chart notes:
Based on US FDA oncology drug approvals. First approval in the indication has been considered for the analysis.
CLL: Chronic lymphocytic leukemia; HER2: Human Epidermal growth factor Receptor 2; CDK: Cyclin-Dependent Kinase; EGFR: Epidermal Growth Factor Receptor; ALK: Anaplastic Lymphoma Kinase.
Alemtuzumab, included in the count for anti-CD agents for CLL, is no longer available commercially but may be obtained for clinical use.
Others include Xofigo (prostate cancer), Afinitor (breast cancer), and Portrazza (lung cancer).
• Treatment options have increased over the last 20 years, both in terms of diverse mechanisms of actions as well as the number of drugs for each MoA class.
• The pace of development has been exceptionally fast in the last decade due to a combination of factors including an increasing focus on targeted drug development based on biomarker segmentation as well as favorable regulatory policies such as the introduction of Breakthrough Therapy Designations.
• Currently, multiple agents with similar MoA are available, presenting a complex situation for clinicians in the wake of limited clinical data directly comparing newer treatments with established ones.
Source: Drugs@FDA, Feb 2017; QuintilesIMS, ARK R&D Intelligence, Feb 2017; QuintilesIMS Institute, Mar 2017
Breast Cancer
Lung Cancer
Prostate Cancer
Melanoma
CLL
HER2
1996 2006 2016
CDK EGFR Anti-CD
ChemotherapyALK Immunotherapy BRAF Other Small Molecules
Hormonals Others
3
2
2
1
4
6
1
1
6
4
2
1
7
1
7
2
2
2
4
9
4
3
1
8
2
9 1
1
1
1
7
3
1
4 3
4
4 3
Chart 14: Number of Treatment Options over Time for Selected Tumors (1996–2016)

20 | Global Oncology Trends 2017. Report by the QuintilesIMS Institute
COMPLExIty IN CANCER CARE
In 2016, the median time from patent filing to approval was 9.8 years, down from 10.25 years in 2013
Chart notes:
First patent filing for the molecule, and specific indication FDA approval are used in the analysis, and some products are included multiple times for the separate approvals they received. CDER used a number of regulatory methods to expedite the development and approval of novel drugs in 2015 and 2016. These involved: Fast Track, Breakthrough, Priority Review, and Accelerated Approval.
• The median time from patent filing to FDA approval for oncology medicines has dropped from 10.25 years in 2013 to 9.8 years in 2016, primarily through “pulling forward” late stage drugs and approving them sooner.
• The last three years have seen three medicines approved within 4 years of original patent filing, including dabrafenib for melanoma with the patent filed in May 2009 and approved by the FDA in May of 2013.
• This has been facilitated by a favorable regulatory environment, including pathways such as FDA Breakthrough Therapy Designation, introduced in 2012, as well as other expedited development and review methods adopted by the FDA, such as accelerated approval, priority review and fast track designation.
• Nearly 70% of the drugs approved in 2015 were designated in one or more expedited categories.
Chart 15: Time from Patent Filing to Approval in the United States
Source: QuintilesIMS, ARK R&D Intelligence, Feb 2017, ARK Patent Intelligence, Mar 2017; Drugs@FDA, Feb 2017; QuintilesIMS Institute, Mar 2017
Average of Quartile 1
0 121110987654321 1716151413 18 19 20 21 23 24 2522 26 27 28 29 30
App
rova
l Yea
r
Year
2016
2015
2014
2013
Median Product/IndicationsAverage of Quartile 4

21 | Global Oncology Trends 2017. Report by the QuintilesIMS Institute
COMPLExIty IN CANCER CARE
treatment complexity will increase as time between launches is reduced and novel agents offer incremental efficacy gains
Chart notes:
Based on US FDA prescribing information.
* Pembrolizumab approval for second line NSCLC is for PD-L1 positive patients.
EGFR: Epidermal Growth Factor Receptor; PD-L1: Programmed Death Ligand – 1; PFS: Progression-Free Survival; OS: Overall Survival.
• In the recent past, several agents have been launched for NSCLC and melanoma.
• Approval of these agents has improved survival compared to previously available agents, but has also increased complexity in treatment decision making.
• These new agents have been launched within a short span of time, and have similar efficacy, as can be seen within the PD-1 and PD-L1 agents.
• Within the span of two years, two PD-1 agents and one PDL-1 agent have been launched for NSCLC.
• Among the approved PD-1/PDL-1 agents, pembrolizumab showed the highest OS benefit of
17.3 months in PD-L1 positive NSCLC patients compared with nivolumab which showed 12.2 months without the PD-L1 stratification.
• Also from a comparator perspective, all three immuno-oncology agents (PD-1 and PD-L1) had docetaxel as the comparator arm in their pivotal trials, which showed homogenous outcome from 8.2 months to 9.6 months.
• All these factors add to the complexity in decision making for physicians.
• Complexity is expected to increase further with the reducing gap between subsequent launches and limited incremental benefits.
Chart 16: Increasing Treatment Complexity Due to New Launches
MoA (Endpoint)Launched Segment
Novel Agent
ComparatorResults (Months)
Year of LaunchNovel Agent Comparator
EGFR (PFS)First Line EGFR-Mut
NSCLC
Erlotinib Chemotherapy 10.4 5.2 2004
Afatinib Pemetrexed/cisplatin
11.1 6.9 2013
Gefitinib Carboplatin/paclitaxel
10.9 7.4 2015
PD1/PD-L1 (OS) Second Line NSCLC
Nivolumab Docetaxel 12.2 9.4 2015
Pembrolizumab Docetaxel 17.3 8.2 2015
Atezolizumab Docetaxel 13.8 9.6 2016
BRAF-MEK (OS)First Line BRAF-Mut Melanoma
Dabrafenib/trametinib
Dabrafenib 25 18.7 2014
vemurafenib/cobimetinib
vemurafenib 22.3 17.4 2015
Source: Drugs@FDA, Mar 2017

22 | Global Oncology Trends 2017. Report by the QuintilesIMS Institute
COMPLExIty IN CANCER CARE
Biomarker selection adds another level of complexity in treatment decision making for different tumor types
Chart notes:
Number of patients covered in the survey: Lung = 19,793; Breast = 12,534; Melanoma = 2,885; Colorectal = 11,224; CLL = 8,056. PD-L1 = programmed cell death receptor and its ligand; KRAS = gene coding K-Ras protein; FISH = Fluorescence in situ hybridization includes testing for estrogen receptor and HER2 protein; ROS-1 = a tyrosine kinase inhibitor encoded by ROS1; NRAS = gene coding N-Ras protein; ALK = gene coding ALK receptor tyrosine kinase; EGFR = gene coding epidermal growth factor receptor protein; IHC = immunohistochemistry test includes testing for estrogen receptor and HER2; 17p = a deleterious mutation found in some leukemias; BRAF = gene coding B-Raf; PR and ER are progesterone and estrogen receptors, respectively. Additional sources include: Molecular testing guideline for selection of lung cancer patients for EGFR and ALK tyrosine kinase inhibitors. J Mol Diagn. 2013 Jul;15(4):415-53. Metastatic non-small-cell lung cancer: ESMO Clinical Practice Guidelines for diagnosis, treatment and follow-up. Ann Oncol. 2016 Sep;27(suppl 5):v1-v27.
• Survey results from a pool of approximately 425 oncologists show the highest rates of non-testing in PD-L1 and KRAS testing for lung cancer, at 55% and 52%, respectively. However, PD-L1 has not yet been incorporated into guidelines and KRAS testing recommendations are mixed without additional testing of EGFR.
• Guidelines recommend diagnostic testing of NSCLC patients with predictive biomarkers, in particular, EGFR and ALK. However, survey results show that approximately 13% and 18% of patients in the survey did not receive an EGFR biomarker test or ALK test, respectively.
• While the rate of testing patients for KRAS, EGFR and ALK have increased since 2014, the rate of positive tests has not increased substantially, indicating that oncologists may be overtesting in certain patient groups.
• Survey results show that for melanoma, where systems therapeutics are the gold standard treatment for patients with BRAF mutations, only 1.4% of patients do not receive BRAF testing.
• Overall, breast cancer had the lowest rate of non-testing, with the exception of the FISH test for determining HER2 status of the tumor. Although the FISH test is more accurate than the IHC, it is less widely available for routine screening.
Chart 17: Patients Who Did Not Receive Diagnostic Testing by Oncology Area and Type, 2016
Source: Source: QuintilesIMS BrandImpact, 2016; QuintilesIMS Institute, Apr 2017
PD-L1
KRAS
FISH
ROS-1
NRAS
ALK
EGFR
IHC
KRAS
17p
BRAF
ER
PR
0% 10% 20% 30% 40% 50% 60%
BreastLung Melanoma Colorectal CLL

23 | Global Oncology Trends 2017. Report by the QuintilesIMS Institute
COMPLExIty IN CANCER CARE
Physicians currently have to endure intense complexity while making treatment decisions for metastatic NSCLC
Chart notes:
Pembrolizumab is approved as second line therapy for PD-L1 positive patients progressing after platinum-based chemotherapy; patients with EGFR or ALK genomic tumor aberrations should have progressed on FDA-approved therapy for these aberrations prior to receiving pembrolizumab.
• Treatment decisions for metastatic NSCLC have gained increasing complexity over the last decade with the availability of multiple treatment options.
• The majority of these treatments are biomarker driven and have led to increased rate of biomarker testing.
• Diagnostics represent a challenge to providers. Given the number of diagnostics tests needed, it is difficult to get sufficient tissue from the tumor for all the tests.
• The large number of treatment options available for a specific patient type and limited long-term data and/or comparative trials between agents with similar mechanisms, makes treatment decisions challenging.
• Choosing later line agents is similarly challenging.
2006
First Line Second Line
Squamous cell carcinoma Chemotherapy Chemotherapy
GefitinibChemotherapy
Non-squamous cell carcinoma Biomarker testing
EGFR+ve Erlotinib
EGFR+ve Bevacizumab based therapies Chemotherapy
2006 263 Chemotherapy Erlotinib
2016
First Line Second Line Third Line Fourth Line
Squamous cell carcinomaChemotherapy Afatinib
Chemotherapy ChemotherapyPortrazza Nivolumab
EGFR790M testing
Positive
Osimertinib Chemo
Chemotherapy
Chemo Atezolizumab
Gefitinib Nivolumab
Non-squamous cell carcinoma
Biomarker testing EGFR+ve Erlotinib Negative
Chemo
Pembrolizumab*Erlotinib
Pembrolizumab*
Biomarker testing ALK+ve Crizotinib
Alectinib Chemotherapy
Chemotherapy
Ceritinib Atezolizumab
Chemotherapy Nivolumab
Crizotinib Alectinib
Chemo Ceritinib
Pembrolizumab* Pembrolizumab*
Biomarker testing PD-L1+ Pembrolizumab
Nivolumab
Chemotherapy Chemotherapy
Atezolizumab
Biomarker testing
EGFR-ve/ ALK-ve/PD1-ve
Bevacizumab-based therapies
Ramucirumab-based therapies
Chemotherapy Erlotinib
nab paclitxel Chemotherapy
Indicates segments requiring biomarker testingIndicates segments requiring histological testingSource: Drugs@FDA, Mar 2017; NCCN Guidelines, nccn.org, Mar 2017
Chart 18: Treatment Landscape for a Newly Diagnosed Metastatic NSCLC Patient
Histological Testing
Histological Testing
24 | Global Oncology Trends 2017. Report by the QuintilesIMS Institute
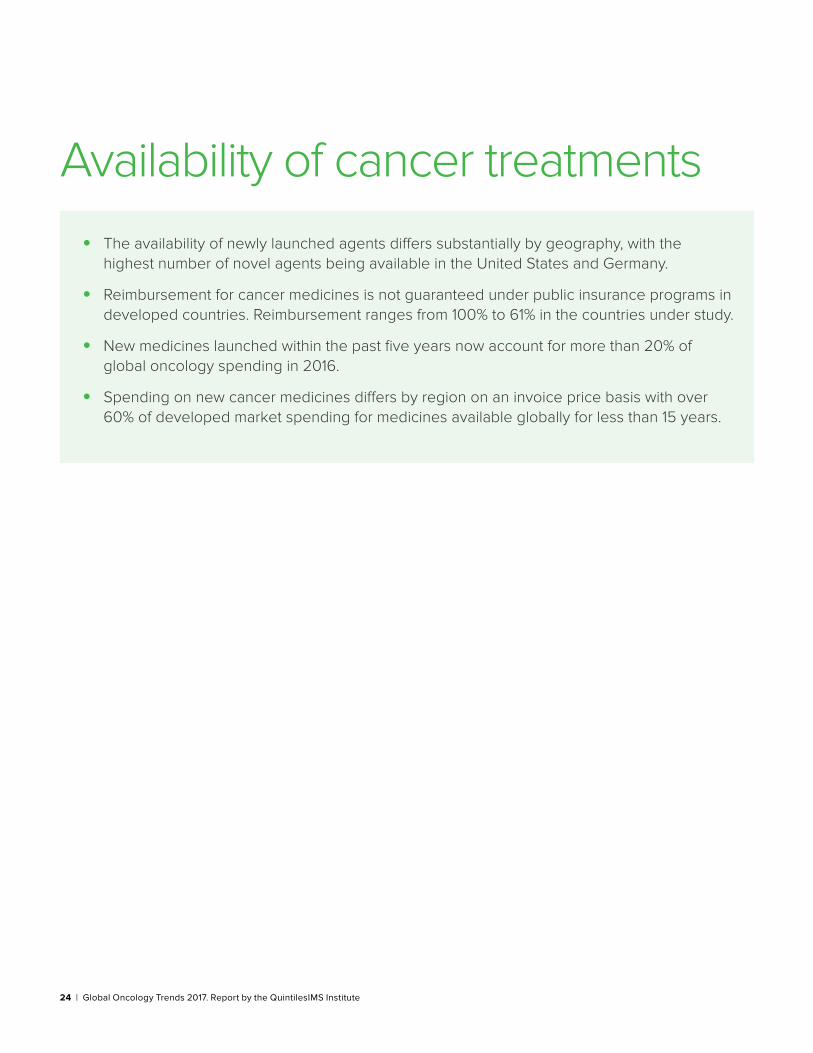
Availability of cancer treatments• the availability of newly launched agents differs substantially by geography, with the
highest number of novel agents being available in the united States and Germany.
• Reimbursement for cancer medicines is not guaranteed under public insurance programs in developed countries. Reimbursement ranges from 100% to 61% in the countries under study.
• New medicines launched within the past five years now account for more than 20% of global oncology spending in 2016.
• Spending on new cancer medicines differs by region on an invoice price basis with over 60% of developed market spending for medicines available globally for less than 15 years.

25 | Global Oncology Trends 2017. Report by the QuintilesIMS Institute
AvAILABILIty OF CANCER tREAtMENtS
Availability of newly launched agents differ by geography, with the greatest availability in the united States and Europe
Chart notes:
Includes innovative medicines, often referred to as New Active Substances or New Chemical Entities, first launched globally between 2011 and 2015. Availability is based on sales in audited markets, regardless of reimbursement rates. Supportive care medicines are not included.
• A total of 42 new cancer medicines were launched from 2011-2015 in the selected countries with nine additional launches in 2016.
• The highest number of agents are available in the United States and Germany, with 37 and 35 drugs respectively, and the number declines significantly in other developed countries of the world.
• Of the 42 new cancer medicines, more than half were launched across eight countries indicating that access for novel oncology therapies is a continuing problem even in developed countries.
• The situation is more sparce in pharmerging countries; although Poland has access to 18 new medicines, only four of the new cancer medicines launched initially in 2011-2015 are available each in China, Indonesia and India in 2016.
Chart 19: Availability in 2016 of drugs launched initially in 2011–2015
Source: QuintilesIMS, MIDAS, Q4 2016
Global US
German
y UK
SwedenIta
ly
Canad
a
France
Japan
Australi
aSpain
Poland
S. Kore
a
Mexico
Russia
Brazil
Philipines
Turkey
IndiaChina
Indonesia
Karak
hstan
S. Afri
ca
Vietnam
Available Not Available
42 37 35 33 33
26 25 25 22 20 19 18 17 17 16
10 10 7
4 4 4 4 3 1
5 7 9 9
16 17 17 20 22 23 24 25 25 26
32 32 35
38 38 38 38 39 41

26 | Global Oncology Trends 2017. Report by the QuintilesIMS Institute
AvAILABILIty OF CANCER tREAtMENtS
Not all cancer drugs are reimbursed under public insurance programs, even when commercially available
Chart notes:
Reimbursement status in 2016 determined by review of drugs launched in each country for 2011 through 2015. Does not include supportive medicines. Drugs for which reimbursement data was not available or reimbursement application was withdrawn or discontinued are considered ‘Not Reimbursed’. In the US, if a medicine appears on payer preferred drug lists, the medicine was considered “reimbursed”, however, the payer may have requirements that must be met to qualify for reimbursement. In Germany, all approved medicines are reimbursed pending review by AMNOG. AMNOG review influences the level of negotiated discounts and rebates that a manufacturer must provide but does not influence access or usage of medicines in Germany.
• Access to new cancer drugs is not universal even in developed countries, where national health systems’ priorities may result in declining to reimburse some products.
• Reimbursement ranged from 100% to 61% across the countries under study.
• Countries employing a formal cost-effectiveness methodology based upon cost per quality life year gained are less likely to reimburse new cancer medicines than countries using other assessment approaches.
• The categorization of not-reimbursed does not mean that there is no patient access to these medicines. There may be non-standard means for obtaining access to new medicines through special funds and submission of applications for approval outside of the standard guidelines.
Chart 20: Reimbursement status in 2016 of cancer medicines launched in 2011–2015
Source: National Institute for Health and Care Excellence (NICE) (England), Scottish Medicines Consortium (SMC) (Scotland), The Dental and Pharmaceutical BenetsAgency (TLV) (Sweden), Canadian Agency for Drugs and Technologies in Health (Canada), Pharmaceutical Benets Scheme (PBS) (Australia), Federal Joint Committee(Germany), National Comprehensive Cancer Network Guidelines (U.S.); QuintilesIMS Institute, Apr 2017
Germany US Spain France Canada Australia Italy Scotland UK Sweden
% o
f App
rove
d C
ance
r M
edic
ines
Reimbursed Not Reimbursed Under Review
100% 100% 100% 96% 88% 85% 85%
73% 67% 61%
4% 12% 15% 15%
27%
15% 39%
18%

27 | Global Oncology Trends 2017. Report by the QuintilesIMS Institute
AvAILABILIty OF CANCER tREAtMENtS
Chart notes:
Analysis includes therapeutic and supportive care in oncology, including anti-emetics, erythropoietins, hematopoietic growth factors, select interferons, bisphophonates, and cancer detox medicines.
• New medicines launched in the last five years now account for more than 20% of global oncology spending.
• These gains have been driven particularly by the newest generation of immuno-oncology drugs.
• The most significant shift in spending has been from medicines launched between 2007 and 2011 which are now 6-10 years old and have a smaller portion of spending in 2016.
• As newer treatments extend survival and active treatment timeframes, baseline elements of treatment regimens continue to be used for longer periods, driving increases in share of spending for older medicines.
• Some countries are slower to adopt new treatments and as a result, older treatments continue to gain share of spending long after launch.
Chart 21: Global Oncology and Supportive Care Spending by New Active Substance First Global Launch Vintage
Source: QuintilesIMS, MIDAS, Dec 2016
2007 2008 2009 2010 2011 2012 2013 2014 2015 2016
100%
90%
80%
70%
60%
50%
40%
30%
20%
10%
0%
0-5 Years 6-10 Years 11-15 Years 16-20 Years 20 Years Non-Nas
New cancer medicines have significantly increased their share of total medicine spending over the past five years

28 | Global Oncology Trends 2017. Report by the QuintilesIMS Institute
AvAILABILIty OF CANCER tREAtMENtS
Chart notes:
Analysis includes therapeutic and supportive care in oncology, including anti-emetics, erythropoietins, hematopoietic growth factors, select interferons, bisphophonates, and cancer detox medicines.
• Developed markets have significantly greater usage of new oncology medicines than other regions.
• Over 60% of developed market spending is consistently on medicines available globally for 15 years or less.
• In pharmerging markets, much of the expanded access to healthcare over the past decade has translated into increased use of older chemotherapy agents.
• As these markets are slower to adopt new treatments than developed markets, and often have more limited levels of reimbursement for costs, the usage of newer drugs is typically lower.
Chart 22: Oncology and Supportive Care Spending by New Active Substance First Global Launch Vintage and Region
Source: QuintilesIMS, MIDAS, Dec 2016
2006 2011
Developed
2016
100%
90%
80%
70%
60%
50%
40%
30%
20%
10%
0%
2006 2011
Pharmerging
2016
100%
90%
80%
70%
60%
50%
40%
30%
20%
10%
0%
0-5 Years 6-10 Years 11-15 Years 16-20 Years 20 Years Non-Nas
the mix of spending on cancer medicines by global launch differs by region on an invoice price basis

AvAILABILIty OF CANCER tREAtMENtS
Chart notes:
Standard Units represent a vial for treatment with an immuno-oncology drug (nivolumab, ipilimumab, pembrolizumab). Each drug has been time-aligned to it’s country launch, and per capita usage has been calculated and summed. Patients taking more than one of these treatments could result in overstated rates of usage and these analyses do not reflect a patient-level anlaysis.
• The recent launches of immuno-oncology medicines have seen significant uptake across countries. While the United States has received attention for adopting new medicines earlier, France and Germany have had greater per capita usage of these immuno-oncology medicines during their first year on the market.
• Markets such as Canada, Spain, Japan and the United Kingdom have had lower per capita usage of immuno-oncology medicines but increasing over time.
• Variations in per capita usage of these medicines may be driven by differences in the prevalence of NSCLC and melanoma, which these treatments are indicated for.
• Variations in usage across countries are often related to differing levels of reimbursement, however, all of the immuno-oncology drugs are reimbursed in all of the countries shown.
• The extent to which restrictions are placed on the use of these medicines in a country may be limiting their use.
• The uptake of new medicines in developed markets is far in excess of the rate of uptake in most pharmerging markets, where there is less access and infrastructure for cancer treatment.
Chart 23: Immuno-Oncology Standard Units per 1 million of population since launch
Source: QuintilesIMS, MIDAS, Dec 2016; EIU Dec 2016
Japan Spain UKCanada France Germany
USItaly
0 1 2 3 4 5 6 7 8 9 10 11 12 13 14 15 16 17 18 19 20 21 22 23 24 25 26 27 28 29
0.70
0.60
0.50
0.40
0.30
0.20
0.10
0.00
Month Since Launch
Developed markets have had significantly different uptake of immuno-oncology medicines since they became available

30 | Global Oncology Trends 2017. Report by the QuintilesIMS Institute
Cost of cancer treatments• total global costs of oncology therapeutics and supportive care drugs increased to $113Bn
in 2016 up from $107Bn in 2015. total growth has been driven by oncology therapeutics which reached $89.6Bn in 2016.
• In 2016, the united States accounted for 46% of total global oncology costs, up from 39% in 2012. Part of this growth is due to the increased uptake of novel agents, which are disproportionally launched there compared to the rest of the world.
• the cost of oncology medicines manufactured in the u.S. has increased in the past five years by 88% to $44.1Bn, primarily driven by the availability and favorable reimbursement of new medicines.
• Outside the united States, oncology costs were $50.1Bn in 2016 and cost growth was due to both uptake of new therapies and greater widespread use of older medicines.
• Oncology growth is expected to be 6%–9% per year through 2021, when global costs are expected to exceed $147Bn.

31 | Global Oncology Trends 2017. Report by the QuintilesIMS Institute
COSt OF CANCER tREAtMENtS
total global costs of oncology and supportive care therapies increased to $113 billion in 2016 at a rate of 11.6%
• The cost of oncology medicines increased at a compound annual growth rate (CAGR) of 11.0% since 2011, while the cost of supportive care treatments increased at CAGR of 2.0% in 2016.
• In 2016, the cost of oncology treatments increased 14.9% to $89.6Bn.
• Costs of supportive care therapies increased 0.4% to $23.4Bn in 2016.
• The total global cost of cancer medicines rose at a CAGR of 8.7% in the past five years, which is considerably higher than the 4.9% growth recorded between 2006 and 2011.
Chart 24: Global Oncology and Supportive Care Costs US$Bn
Source: QuintilesIMS, MIDAS Q4 2016, QuintilesIMS Institute, Mar 2017
Oncology
Oncology Growth
Supportive Care
Supportive Care Growth Oncology + Supportive Care Growth
2012 2013 2014 2015 2016
$91Bn$96Bn
$104Bn $107Bn$113Bn120
100
80
60
40
20
0
20%
15%
10%
5%
0%
-5%
Cos
t US
$B
n
Gro
wth
Chart notes:
Spending in US Dollars with variable exchange rates. Growth in US Dollars with constant exchange rates. Oncology medicines were defined as L1 antineoplastics, L2 cytostatic hormone therapies, V3C radio pharmaceuticals, denosumab, lenalidomide, pomalidomide, and aldesleukin. Supportive care includes anti-emetics, erythropoietins, hematopoietic growth factors, select interferons, bisphophonates, and cancer detox medicines.

COSt OF CANCER tREAtMENtS
32 | Global Oncology Trends 2017. Report by the QuintilesIMS Institute
the united States accounted for the greatest global oncology costs at $52.1Bn in 2016
Chart notes:
Includes supportive care. Costs in US$ with variable exchange rates. Growth in US Dollars with constant exchange rates.
• Total global oncology and supportive care costs reached $113Bn in 2016.
• In 2016, the United States accounts for 46% of total global oncology costs, up from 39% in 2012.
• The CAGR for the United States from 2012-2016 was 10.3%
• Part of this growth is due to the increased uptake of novel agents, which are disproportionally launched in the United States compared to the rest of the world.
• The EU5 accounted for 21% of total oncology costs in 2016 while Japan accounted for 9%.
Chart 25: Global Oncology Costs and Growth US$Bn, 2012–2016
Source: QuintilesIMS, MIDAS, Q4 2016, QuintilesIMS Institute, Mar 2017
2012 2013 2014 2015 2016
$91Bn$96Bn
$104Bn $107Bn$113Bn120
90
60
30
0
US EU5 Japan Pharmerging Rest of World

33 | Global Oncology Trends 2017. Report by the QuintilesIMS Institute
Growth rates in key countries and regions have converged since 2012 to a range of 8–11% in 2016
Chart notes:
Includes supportive care. Growth in US Dollars with constant exchange rates.
• The growth rate in the United States increased from 1.0% in 2012 to 11.0% in 2016, at constant exchange rate. The growth rate in the EU5 also saw a substantial gain reaching 10.8% in 2016.
• In contrast, the growth rate in pharmerging markets shifted from 13.7% in 2012 to 8.4% in 2016.
• The increase in global costs for oncology and supportive care medicines is related to an increase in the number of approved therapies and corresponding higher costs of novel agents. Targeted therapies also contribute to increasing oncology costs. This is particularly true in the United States, where 37 new oncology medicines were launched from 2011–2015.
Chart 26: Growth Rates for Global Oncology and Supportive Care Costs
Source: QuintilesIMS, MIDAS, Q4 2016; QuintilesIMS Institute, Mar 2017
US EU5 Japan Pharmerging Rest of World
2012
11.0%10.8%10.1%8.6%8.4%
2013 2014 2015 2016
16%
14%
12%
10%
8%
6%
4%
2%
0%
COSt OF CANCER tREAtMENtS

34 | Global Oncology Trends 2017. Report by the QuintilesIMS Institute
Cost of uS oncology medicines has increased in the past five years by 88%, primarily driven by new medicines
Chart notes:
Oncology excluding supportive care. LOE = Loss of Exclusivity.
• The total cost of oncology medicines rose by $20.7Bn to $44.1Bn in the United States between 2011 and 2016.
• Two-thirds of the growth in the United States oncology costs in the last five years can be attributed to the uptake of innovative medicines launched since 2011.
• The costs for older protected brands increased due to both wider usage and increasing prices on an invoice basis.
• The loss of patent exclusivity for some older brands contributed to $4.8Bn in lower brand costs.
• The $2.6Bn increase in generic costs equates to 13% of oncology cost growth between 2011 and 2016.
• Price concessions from manufacturers in the form of discounts and rebates are known to offset one to two percentage points of the 4-7% average invoice price growth in oncology in the United States.
Chart 27: US Oncology Market Growth
Source: QuintilesIMS, MIDAS Q4 2016; QuintilesIMS Institute, Mar 2017
50
45
40
35
30
25
20
15
10
5
0
2011 NewTherapiessince 2011
BrandedVolume
BrandedPrice
LOE Generics 2016
Cos
ts a
nd G
row
th C
onst
US
$B
n
23.4
13.6
3.4
5.8 -4.8 2.6
44.1
COSt OF CANCER tREAtMENtS

35 | Global Oncology Trends 2017. Report by the QuintilesIMS Institute
Pricing concessions by manufacturers are reducing manufacturer-realized net price growth
Chart notes:
Invoice values are QuintilesIMS reported values from wholesaler transactions measured at trade/invoice prices and exclude off-invoice discounts and rebates that reduce net revenue received by manufacturers. Net values denote company recognized revenue after discounts, rebates and other price concessions. Results are based on a comparative analysis of company reported net sales and QuintilesIMS audited sales and prices at product level for branded products. Growth rates are calculated over same cohort of products in the prior year.
• In the United States, net price growth on existing branded oncology drugs is estimated to have averaged 3.6% in 2016 as opposed to 4.8% invoice price growth.
• Generally, higher invoice prices were accompanied by price concessions in the market and net prices grew more slowly than invoice prices.
• Price concessions (including mandatory and negotiated rebates, discounts, and patient cost offsets) reflect the ability of insurers to negotiate lower prices.
• Cancer medicines are subject to different types of off-invoice discounts, rebates and price concessions than non-cancer drugs, based on how the medicines are reimbursed or administered to patients.
• An increasing number of cancer medicines are oral formulations, provided to patients via pharmacies or mail-order and often reimbursed through pharmacy benefit claims, and reimbursed through specialty pharmacy benefits.
• Insurers are often less able to negotiate lower rates on specific medicines which are infused due to the way medical claims are reimbursed for the service including the drug rather than the drug alone.
Chart 28: Invoice and Net Price Growth of Protected Oncology Brands – U.S.
Source: QuintilesIMS, National Sales Perspectives, QuintilesIMS Institute, Mar 2017
7%
6%
5%
4%
3%
2%
1%
0%
Estimated Net Price Growth %
2011 2012 2013 2014 2015 2016
Brands Invoice Price Growth %
3.5%
4.1%
2.8%
5.2% 4.7%
3.6%
4.8%
5.4%
4.8%
6.2% 6.4%
4.8%
COSt OF CANCER tREAtMENtS

36 | Global Oncology Trends 2017. Report by the QuintilesIMS Institute
Growing use of coupons helps offset patient out-of-pocket costs
Chart notes:
Sample is limited to oral oncology products (capsules and tablets) available through retail and specialty pharmacies. Coupon penetration is calculated as the percent of commercial claims for which an identified coupon is used as either a primary or secondary payer. Average offset is a simple average across brands where a coupon is the secondary payer. QuintilesIMS believes that patient savings programs may be more prevalent than is reflected in the data due to specialty pharmacy sample coverage.
• Some type of coupon or patient cost offset was used in over 25% of retail prescriptions for cancer drugs filled by patients with commercial insurance, up from 5% in 2011.
• The increased use of coupons reflects efforts by manufacturers to reduce patient out-of-pocket costs.
• The average cost offset has exceeded over $500 per prescription over the past five years.
Chart 29: Coupon Penetration and Average Offset of Patient Savings Programs in Oral Oncology Drugs
Source: QuintilesIMS, Formulary Impact Analyzer, Mar 2017
40%
30%
20%
10%
0%
$1,000
$750
$500
$250
£0
Coupon Penetration
2013 2014 2015 2016
Average O�set
Cou
pon
Pen
etra
tion
(% T
Rxs
)
Ave
rage
O�
set (
US
$)
COSt OF CANCER tREAtMENtS
37 | Global Oncology Trends 2017. Report by the QuintilesIMS Institute
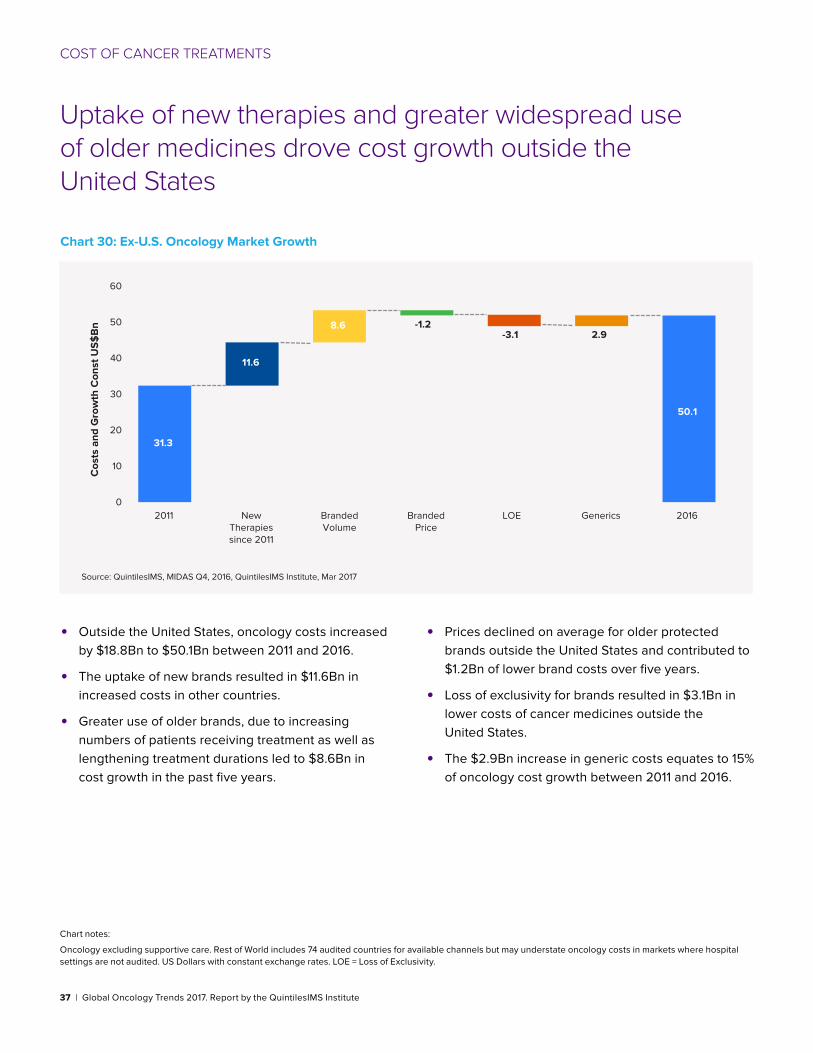
uptake of new therapies and greater widespread use of older medicines drove cost growth outside the united States
Chart notes:
Oncology excluding supportive care. Rest of World includes 74 audited countries for available channels but may understate oncology costs in markets where hospital settings are not audited. US Dollars with constant exchange rates. LOE = Loss of Exclusivity.
• Outside the United States, oncology costs increased by $18.8Bn to $50.1Bn between 2011 and 2016.
• The uptake of new brands resulted in $11.6Bn in increased costs in other countries.
• Greater use of older brands, due to increasing numbers of patients receiving treatment as well as lengthening treatment durations led to $8.6Bn in cost growth in the past five years.
• Prices declined on average for older protected brands outside the United States and contributed to $1.2Bn of lower brand costs over five years.
• Loss of exclusivity for brands resulted in $3.1Bn in lower costs of cancer medicines outside the United States.
• The $2.9Bn increase in generic costs equates to 15% of oncology cost growth between 2011 and 2016.
Chart 30: Ex-U.S. Oncology Market Growth
Source: QuintilesIMS, MIDAS Q4, 2016, QuintilesIMS Institute, Mar 2017
60
50
40
30
20
10
02011 New
Therapiessince 2011
BrandedVolume
BrandedPrice
LOE Generics 2016
Cos
ts a
nd G
row
th C
onst
US
$B
n
31.3
11.6
8.6 -1.2-3.1 2.9
50.1
COSt OF CANCER tREAtMENtS

38 | Global Oncology Trends 2017. Report by the QuintilesIMS Institute
Oncology growth is expected to be 6%–9% per year through 2021, when global costs are expected to exceed $147Bn
Chart notes:
Includes supportive care. Costs in US$ with variable exchange rates. Growth in US Dollars with constant exchange rates.
• Higher costs will be driven by the wider use of new products, especially immunotherapies, in developed markets such as the United States and EU5.
• Newer therapies with survival benefits will also bring longer therapy durations and contribute to increase in cost.
• Patients unable to take current cancer therapies may be able to take advantage of new options and lines of therapy.
• The use of newer treatments will be offset by lower usage of existing treatments, some of which are already off patent and available as generic medicines.
• Patent expiries and biosimilar competition will contribute to lower costs but will be offset by increased prevalence, diagnosis rates and treatment rates.
• Since 2013, growth in the EU5 has rebounded driven by new medicines and this continued wave of innovation is expected to lift growth to 2021.
• Pharmerging markets are not expected to grow as much in oncology as developed markets due to slower forecast economic growth.
Chart 31: Global Oncology Costs and Growth, US$Bn, 2011–2021
Source: QuintilesIMS, MIDAS, Q4 2016, QuintilesIMS Institute, Mar 2017
US EU5 Japan Pharmerging Rest of World
2011
7.9%CAGR 2011-2016: 6 - 9%Projected CAGR 2016-2021:
2016 2021
$90Bn
$113Bn
$147-177Bn
180
150
120
90
60
30
0
COSt OF CANCER tREAtMENtS

39 | Global Oncology Trends 2017. Report by the QuintilesIMS Institute
Notes on sources This report is based on the QuintilesIMS services detailed in the panel below.
MIDAS™ is a unique platform for assessing worldwide healthcare markets. It integrates QuintilesIMS’ national
audits into a globally consistent view of the pharmaceutical market, tracking virtually every product in hundreds of
therapeutic classes and provides estimated product volumes, trends and market share through retail and non-retail
channels.
National Sales Perspectives (NSP)™ measures spending within the US pharmaceutical market by pharmacies, clinics,
hospitals and other healthcare providers. NSP reports 100% coverage of the retail and non-retail channels for national
pharmaceutical sales at actual transaction prices. The prices do not reflect off-invoice price concessions that reduce
the net amount received by manufacturers.
QuintilesIMS BrandImpact™ oncology data is based on a proprietary mobile research model and longitudinal network
of more than 400 i-enabled oncologists and is the only source of continuously-captured physician treatment decisions
for the biopharmaceutical industry. The real-time data generated by its information panel of oncologists enables
BrandImpact to provide unique insight into physician behavior and the influences on that behavior. The combination
of its network-generated syndicated data with its custom research and analytics expertise enables BrandImpact to
deliver more informed and actionable solutions to its customers’ critical business issues.
ARK R&D Intelligence™ Intelligence is a drug pipeline database containing up-to-date R&D information on over 39,000
drugs in development worldwide. The database captures the full process of R&D, covering activity from discovery
stage through preclinical and clinical development, to approval and launch. The information in Ark R&D Intelligence is
manually curated by a team of scientifically trained analysts to ensure quality and relevance.
ARK Patent Intelligence™ is a database of biopharmaceutical patents or equivalents in over 130 countries and
including over 3000 molecules. Research covers approved patent extensions in 51 countries, and covers all types of
patents including product, process, method of use, and others.
Formulary Impact Analyzer (FIA) provides insight into what impact popular utilization-control measures enforced by
managed care organizations have had on prescription volumes including the dynamics that affect patient behavior
in filling and/or refilling prescriptions. Formulary measures include tiered co-pay benefit designs, prior authorization
restrictions, and often result in non-preferred prescriptions being rejected or switched at the pharmacy. FIA offers
visibility to claims rejected for other reasons such as contraindications as well as those attempted to be refilled too
soon. FIA sources include national and regional chains, independent pharmacies and a switch house providing a
comprehensive view of retailers and across geographies.
QuintilesIMS (QI) Oncology EMR database database is multi-sourced and includes small, medium and large oncology
practices. The database captures more than 950,000 anonymous cancer patients across the US Key information
includes cancer/histology/metastases/staging, drug name/date of service/dosage, diagnostic testing/lab tests
performed & results, co-morbidities/performance status, and patient demographics. The Oncology EMR database is
linkable to other QI anonymous patient databases, including: medical claims, prescription claims and PharMetrics Plus.

40 | Global Oncology Trends 2017. Report by the QuintilesIMS Institute
Appendix New Active Substances Launch and Indication Approvals 2011–2016
Molecules
Basal cell1. vismodegib2. sonidegib
Bladder cancer1. atezolizumab
Breast1. pertuzumab,2. ado-trastuzumab 3. emtansine4. palbociclib
Castleman’s Disease1. siltuximab
Cervical1. bevacizumab
Colorectal1. regorafenib2. ziv-aflibercept3. trifluridine/tipiracil
Gastric1. ramucirumab
GIST1. regorafenib
Head and neck cancer1. nivolumab2. pembrolizumab
Leukemia1. bosutinib (CML)2. omacetaxine mepesuccinate (CML)3. radotinib (CML)4. obinutuzumab (CLL)5. ponatinib (CML,ALL)6. blinatumomab (ALL)7. ibrutinib (CLL8. ofatumumab (CLL)9. venetoclax (CLL)
Lung1. crizotinib2. afatinib3. alectinib4. ceritinib5. ramucirumab6. nivolumab7. pembrolizumab8. necitumumab9. osimertinib10. gefitinib11. atezolizumab
Lymphoma1. romidepsin (PtCL, CtCL)2. brentuximab vedotin (Hodgkin’s ALCL)3. pixantrone (NHL)4. rituximab (NHL)5. idelalisib (CLL, FL, SLL)6. chidamide (PtCL)7. mogamulizumab (AtCL)8. belinostat (PtCL)9. ibrutinib (MCL, WM)10. bortezomib (MCL)11. nivolumab (HL)12. obinutuzumab (FL)
Melanoma1. ipilimumab2. vemurafenib3. trametinib4. dabrafenib5. pembrolizumab6. nivolumab7. talimogene laherparepvec8. cobimetinib
Multiple Myeloma1. carfilzomib2. pomalidomide3. daratumumab4. ixazomib5. panobinostat6. elotuzumab
Myelofibrosis1. ruxolitinib
Neuroblastoma1. dinutuximab
Ovarian1. olaparib2. bevacizumab3. rucaparib
Pancreatic1. irinotecan liposome
Polycythemia vera1. ruxolitinib
Prostate cancer1. abiraterone acetate2. enzalutamide3. radium 223 dichloride
Renal1. axitinib2. nivolumab3. lenvatinib4. cabozantinib
Sarcoma1. mifamurtide (osteo-)2. trabectedin (lipo- or leiomyo-)3. olaratumab4. eribulin
Thyroid1. vandetanib2. cabozantinib3. lenvatinib mesylate

41 | Global Oncology Trends 2017. Report by the QuintilesIMS Institute
Authors Murray Aitken Executive Director, IMS Institute for Healthcare Informatics
Murray Aitken is a Senior Vice President at QuintilesIMS and the executive director of the QuintilesIMS Institute (formerly the IMS Institute for Healthcare Informatics). Murray is a renowned healthcare expert on addressing the challenges facing the global healthcare industry and prospects for improving patient outcomes, managing costs and maximizing access through better use of healthcare data and information. Established in 2011, The QuintilesIMS Institute provides global policy setters and decision makers with objective, transformational insights into healthcare dynamics derived from granular analysis of information.
Michael Kleinrock Research Director, IMS Institute for Healthcare Informatics
Michael serves as Research Director for the QuintilesIMS Institute, setting the research agenda for the Institute, leading the development of reports and projects focused on the current and future role of biopharmaceuticals in healthcare in the US and globally. He joined IMS Health in 1999 and has held roles in consulting, service and marketing and assumed his current role in 2011. Michael holds a B.A. in History and Political Science from the University of Essex, Colchester, U.K. and an M.A. in Journalism and Radio Production from Goldsmiths College, University of London, U.K.
Saurabh Kumar Engagement Manager, Oncology Global Deliver Center
Saurabh leads the Oncology team at QuintilesIMS Global Delivery Center and has been involved with development of white papers and delivery of projects focused on oncology. He has 13 years experience in oncology. He Joined QuintilesIMS in 2013 and has led offerings based teams and consulting based teams within the Delivery Center. He holds an MD in Oncology and has done his MBA in strategy and consulting from Lancaster University, UK.

42 | Global Oncology Trends 2017. Report by the QuintilesIMS Institute
About the QuintilesIMS Institute The QuintilesIMS Institute leverages collaborative relationships in the public and private sectors to strengthen the vital role of information in advancing healthcare globally. Its mission is to provide key policy setters and decision-makers in the global health sector with unique and transformational insights into healthcare dynamics derived from granular analysis of information.
Fulfilling an essential need within healthcare, the Institute delivers objective, relevant insights and research that accelerate understanding and innovation critical to sound decision-making and improved patient care. With access to QuintilesIMS’s extensive global data assets and analytics, the Institute works in tandem with a broad set of healthcare stakeholders, including government agencies, academic institutions, the life sciences industry and payers, to drive a research agenda dedicated to addressing today’s healthcare challenges.
By collaborating on research of common interest, it builds on a long-standing and extensive tradition of using QuintilesIMS information and expertise to support the advancement of evidence-based healthcare around the world.

43 | Global Oncology Trends 2017. Report by the QuintilesIMS Institute
ABOut tHE QuINtILESIMS INStItutE
Research Agenda Guiding Principles
The effective use of information by healthcare stakeholders globally to improve health outcomes, reduce costs and increase access to available treatments.
Optimizing the performance of medical care through better understanding of disease causes, treatment consequences and measures to improve quality and cost of healthcare delivered to patients.
Understanding the future global role for biopharmaceuticals, the dynamics that shape the market and implications for manufacturers, public and private payers, providers, patients, pharmacists and distributors.
Researching the role of innovation in health system products, processes and delivery systems, and the business and policy systems that drive innovation.
Informing and advancing the healthcare agendas in developing nations through information and analysis.
The advancement of healthcare globally is a vital, continuous process.
Timely, high-quality and relevant information is critical to sound healthcare decision-making.
Insights gained from information and analysis should be made widely available to healthcare stakeholders.
Effective use of information is often complex, requiring unique knowledge and expertise.
The ongoing innovation and reform in all aspects of healthcare require a dynamic approach to understanding the entire healthcare system.
Personal health information is confidential and patient privacy must be protected.
The private sector has a valuable role to play in collaborating with the public sector related to the use of healthcare data.
The research agenda for the Institute centers on five areas considered vital to the advancement of healthcare globally:
The Institute operates from a set of Guiding Principles:

QuintilesIMS Institute100 IMS Drive, Parsippany, NJ 07054, [email protected] www.quintilesimsinstitute.org
©2017 QuintilesIMS and its affiliates. All rights reserved. Trademarks are registered in the United States and in various other countries. 15.0088-1-06.17_QI