JUNE 2016 SUSTAINABILITY - Amazon Web...
20
SUSTAINABILITY JUNE 2016 2015 Measuring VTA’s Environmental Progress SUSTAINABILITY REPORT
Transcript of JUNE 2016 SUSTAINABILITY - Amazon Web...
i
SUSTAINABILITY
JUNE 2016
2015
Measuring VTA’sEnvironmental Progress
SUSTAINABILITY REPORT
This document was prepared with the support and guidance
of VTA’s Sustainability Program Team:
Kevin Balak, Real Estate & Joint Development
Hassan Basma, Engineering & Transportation Infrastructure Development
Ann Calnan, Environmental Programs & Resources Management
Tracy Casimiro, Environmental Health & Safety
Marc DeLong, Engineering & Transportation Infrastructure Development
Casey Emoto, Project Development
Inez Evans, Operations Administration
Tom Fitzwater, VTA’s BART Silicon Valley Program
Lyndsey Fujii, Environmental Health & Safety
Robert Furber, Environmental Programs & Resources Management
Ron Golem, Real Estate & Joint Development
Lani Ho, Environmental Programs & Resources Management
Karly Hutchinson, Environmental Health & Safety
Christina Jaworski, Environmental Programs & Resources Management
Kevin Kelley, Purchasing
Kathleen Podrasky, Community Engagement
Baljit Pannu, Human Resources
John Ristow, Planning & Project Development
Kris Sabherwal, Rail Engineering
Heidi Samuels, Operations Maintenance
Rajwinder Sehdev, Engineering & Transportation Infrastructure Development
Jesse Soto, Facilities Maintenance
Robert Victor, Technology
Kendall Whitson, Facilities Maintenance
For more information, contact:
Environmental Programs and Resources Management
3331 N. First Street, B-2
San Jose, CA 95134
(408) 321-5789
vta.org/sustainability
TABLE OF CONTENTS
Executive Summary 1
Background 2
About VTA . . . . . . . . . . . . . . . . . . . . . . . . . . . . . . . . 2
VTA’s Sustainability Program . . . . . . . . . . . . . . . . . . . . . . . . 2
Report Purpose and Scope 3
Purpose . . . . . . . . . . . . . . . . . . . . . . . . . . . . . . . . . 3
Scope . . . . . . . . . . . . . . . . . . . . . . . . . . . . . . . . . . 3
Environmental Performance 5
Fuel . . . . . . . . . . . . . . . . . . . . . . . . . . . . . . . . . . . 5
Electricity, Renewable Energy, and Natural Gas . . . . . . . . . . . . . . . . 5
Water . . . . . . . . . . . . . . . . . . . . . . . . . . . . . . . . . . 7
Waste and Recycling . . . . . . . . . . . . . . . . . . . . . . . . . . . 7
Accomplishments 9
Accomplishment Area 1: Responding to Drought Emergency . . . . . . . . . 9
Accomplishment Area 2: Reducing Vehicle Emissions. . . . . . . . . . . . 10
Accomplishment Area 3: Retrofitting Existing Facilities . . . . . . . . . . . 10
Accomplishment Area 4: Promoting Technology over Paper . . . . . . . . . . 11
Accomplishment Area 5: Incorporating Sustainability Principles in Project Design . 12
Accomplishment Area 6: Reducing Waste . . . . . . . . . . . . . . . . 12
Accomplishment Area 7: Improving Environmental Awareness . . . . . . . . 12
Accomplishment Area 8: Environmental Management System . . . . . . . . 13
Past Accomplishments . . . . . . . . . . . . . . . . . . . . . . . . . 14
Future Projects 15
1
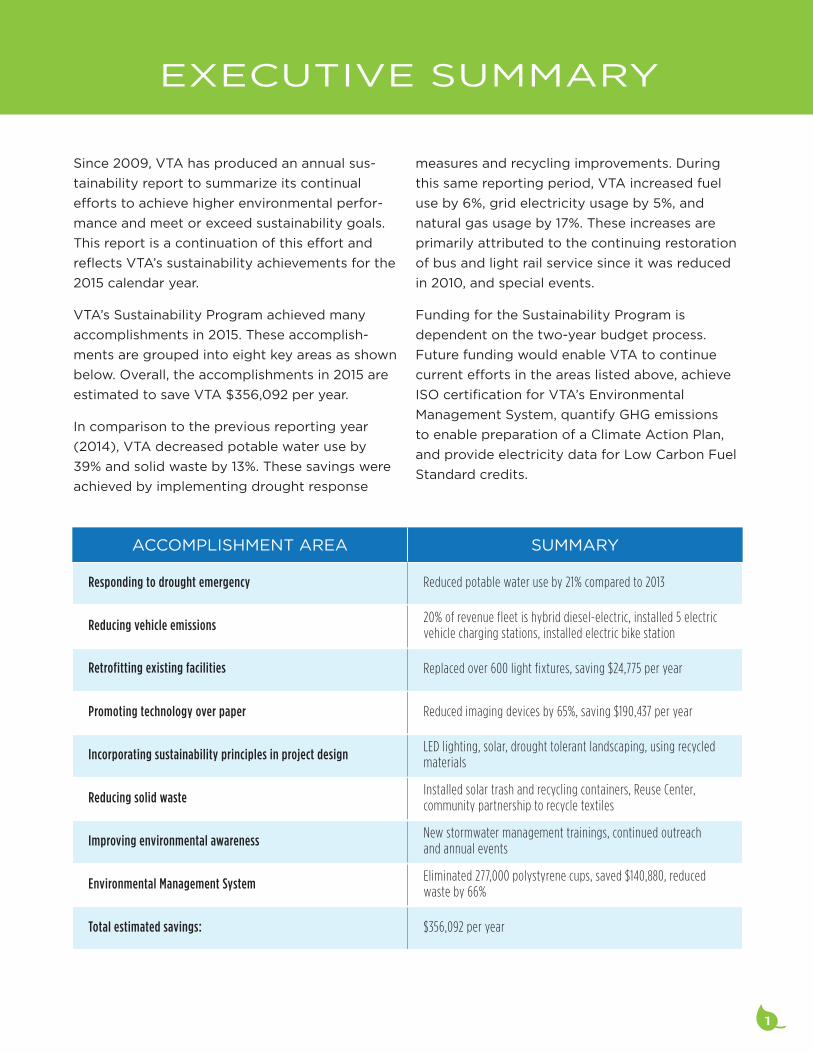
Since 2009, VTA has produced an annual sus-
tainability report to summarize its continual
efforts to achieve higher environmental perfor-
mance and meet or exceed sustainability goals.
This report is a continuation of this effort and
reflects VTA’s sustainability achievements for the
2015 calendar year.
VTA’s Sustainability Program achieved many
accomplishments in 2015. These accomplish-
ments are grouped into eight key areas as shown
below. Overall, the accomplishments in 2015 are
estimated to save VTA $356,092 per year.
In comparison to the previous reporting year
(2014), VTA decreased potable water use by
39% and solid waste by 13%. These savings were
achieved by implementing drought response
measures and recycling improvements. During
this same reporting period, VTA increased fuel
use by 6%, grid electricity usage by 5%, and
natural gas usage by 17%. These increases are
primarily attributed to the continuing restoration
of bus and light rail service since it was reduced
in 2010, and special events.
Funding for the Sustainability Program is
dependent on the two-year budget process.
Future funding would enable VTA to continue
current efforts in the areas listed above, achieve
ISO certification for VTA’s Environmental
Management System, quantify GHG emissions
to enable preparation of a Climate Action Plan,
and provide electricity data for Low Carbon Fuel
Standard credits.
EXECUTIVE SUMMARY
ACCOMPLISHMENT AREA SUMMARY
Responding to drought emergency Reduced potable water use by 21% compared to 2013
Reducing vehicle emissions20% of revenue fleet is hybrid diesel-electric, installed 5 electric vehicle charging stations, installed electric bike station
Retrofitting existing facilities Replaced over 600 light fixtures, saving $24,775 per year
Promoting technology over paper Reduced imaging devices by 65%, saving $190,437 per year
Incorporating sustainability principles in project designLED lighting, solar, drought tolerant landscaping, using recycled materials
Reducing solid wasteInstalled solar trash and recycling containers, Reuse Center, community partnership to recycle textiles
Improving environmental awarenessNew stormwater management trainings, continued outreach and annual events
Environmental Management SystemEliminated 277,000 polystyrene cups, saved $140,880, reduced waste by 66%
Total estimated savings: $356,092 per year
2
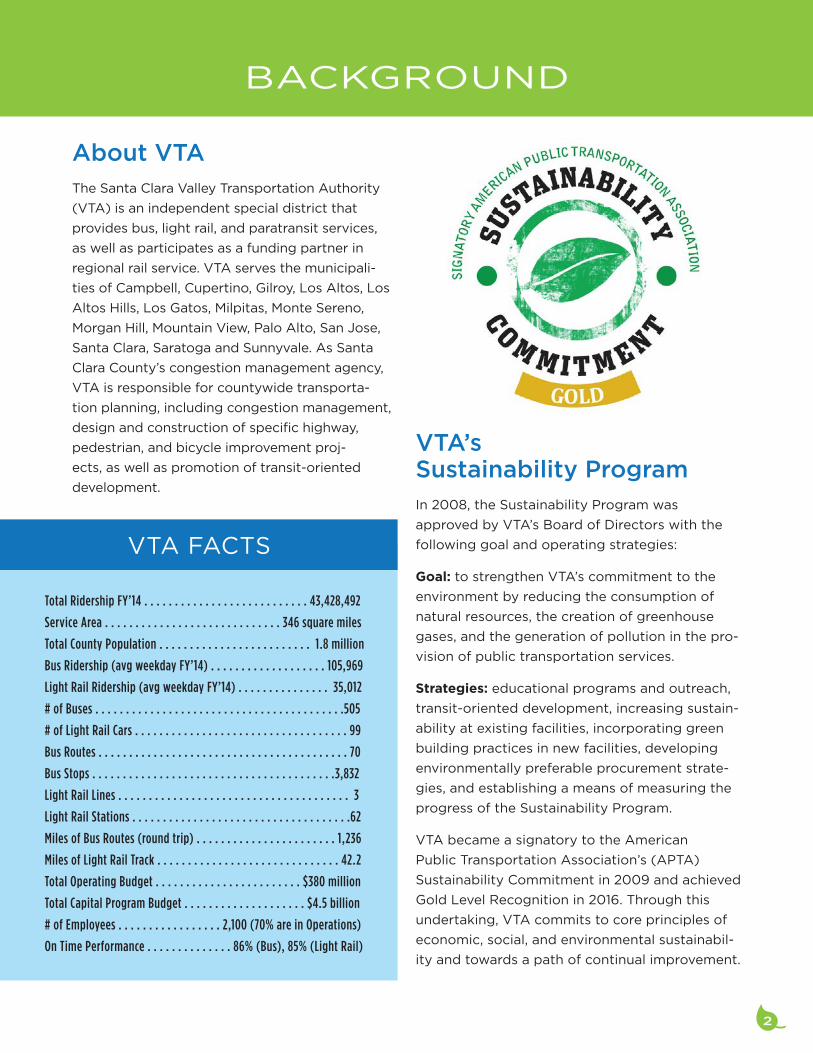
Total Ridership FY’14 . . . . . . . . . . . . . . . . . . . . . . . . . . . 43,428,492
Service Area . . . . . . . . . . . . . . . . . . . . . . . . . . . . . 346 square miles
Total County Population . . . . . . . . . . . . . . . . . . . . . . . . . 1.8 million
Bus Ridership (avg weekday FY’14) . . . . . . . . . . . . . . . . . . . 105,969
Light Rail Ridership (avg weekday FY’14) . . . . . . . . . . . . . . . 35,012
# of Buses . . . . . . . . . . . . . . . . . . . . . . . . . . . . . . . . . . . . . . . . .505
# of Light Rail Cars . . . . . . . . . . . . . . . . . . . . . . . . . . . . . . . . . . . 99
Bus Routes . . . . . . . . . . . . . . . . . . . . . . . . . . . . . . . . . . . . . . . . . 70
Bus Stops . . . . . . . . . . . . . . . . . . . . . . . . . . . . . . . . . . . . . . . .3,832
Light Rail Lines . . . . . . . . . . . . . . . . . . . . . . . . . . . . . . . . . . . . . . 3
Light Rail Stations . . . . . . . . . . . . . . . . . . . . . . . . . . . . . . . . . . . .62
Miles of Bus Routes (round trip) . . . . . . . . . . . . . . . . . . . . . . . 1,236
Miles of Light Rail Track . . . . . . . . . . . . . . . . . . . . . . . . . . . . . . 42.2
Total Operating Budget . . . . . . . . . . . . . . . . . . . . . . . . $380 million
Total Capital Program Budget . . . . . . . . . . . . . . . . . . . . $4.5 billion
# of Employees . . . . . . . . . . . . . . . . . 2,100 (70% are in Operations)
On Time Performance . . . . . . . . . . . . . . 86% (Bus), 85% (Light Rail)
About VTAThe Santa Clara Valley Transportation Authority
(VTA) is an independent special district that
provides bus, light rail, and paratransit services,
as well as participates as a funding partner in
regional rail service. VTA serves the municipali-
ties of Campbell, Cupertino, Gilroy, Los Altos, Los
Altos Hills, Los Gatos, Milpitas, Monte Sereno,
Morgan Hill, Mountain View, Palo Alto, San Jose,
Santa Clara, Saratoga and Sunnyvale. As Santa
Clara County’s congestion management agency,
VTA is responsible for countywide transporta-
tion planning, including congestion management,
design and construction of specific highway,
pedestrian, and bicycle improvement proj-
ects, as well as promotion of transit-oriented
development.
BACKGROUND
VTA’s Sustainability ProgramIn 2008, the Sustainability Program was
approved by VTA’s Board of Directors with the
following goal and operating strategies:
Goal: to strengthen VTA’s commitment to the
environment by reducing the consumption of
natural resources, the creation of greenhouse
gases, and the generation of pollution in the pro-
vision of public transportation services.
Strategies: educational programs and outreach,
transit-oriented development, increasing sustain-
ability at existing facilities, incorporating green
building practices in new facilities, developing
environmentally preferable procurement strate-
gies, and establishing a means of measuring the
progress of the Sustainability Program.
VTA became a signatory to the American
Public Transportation Association’s (APTA)
Sustainability Commitment in 2009 and achieved
Gold Level Recognition in 2016. Through this
undertaking, VTA commits to core principles of
economic, social, and environmental sustainabil-
ity and towards a path of continual improvement.
VTA FACTS
3
PurposeThe purpose of this report is to measure current
and future Sustainability Program initiatives.
Annual reporting was adopted as part of VTA’s
Sustainability Program in February 2008. The
applicable strategy states: “Establish bench-
marks to measure the progress and performance
of VTA’s Sustainability Program and report back
to the VTA Board of Directors on an annual basis.
Among other actions, this report will involve
reassessing VTA’s fuel, electrical, and water
usage on a regular basis.”
ScopeThis report measures VTA’s environmental per-
formance in providing bus, light rail, and para-
transit services. Therefore, the scope of this
report extends to transit centers, stations, traction
power facilities, and operating divisions. VTA has
five main operating divisions. These divisions are
grouped as follows:
• Cerone, Chaboya, and North Divisions are
dedicated to the maintenance, cleaning, and
fueling of VTA’s bus fleet.
• Guadalupe Division is responsible for all light
rail operations and maintenance functions,
including major vehicle overhaul, historic trol-
ley maintenance, and light rail operator and
maintenance training.
• River Oaks Division includes the Offices
of the General Manager, Board, General
Counsel, Public Affairs, Planning and
Program Development, Engineering and
Transportation Infrastructure Development,
Finance and Budget, Operations, Business
Services, and System Safety and Security.
VTA also participates as a funding partner in
regional rail service including Caltrain, Capital
Corridor, and the Altamont Corridor Express.
These services are not included in the scope of
this report.
REPORT PURPOSE AND SCOPE
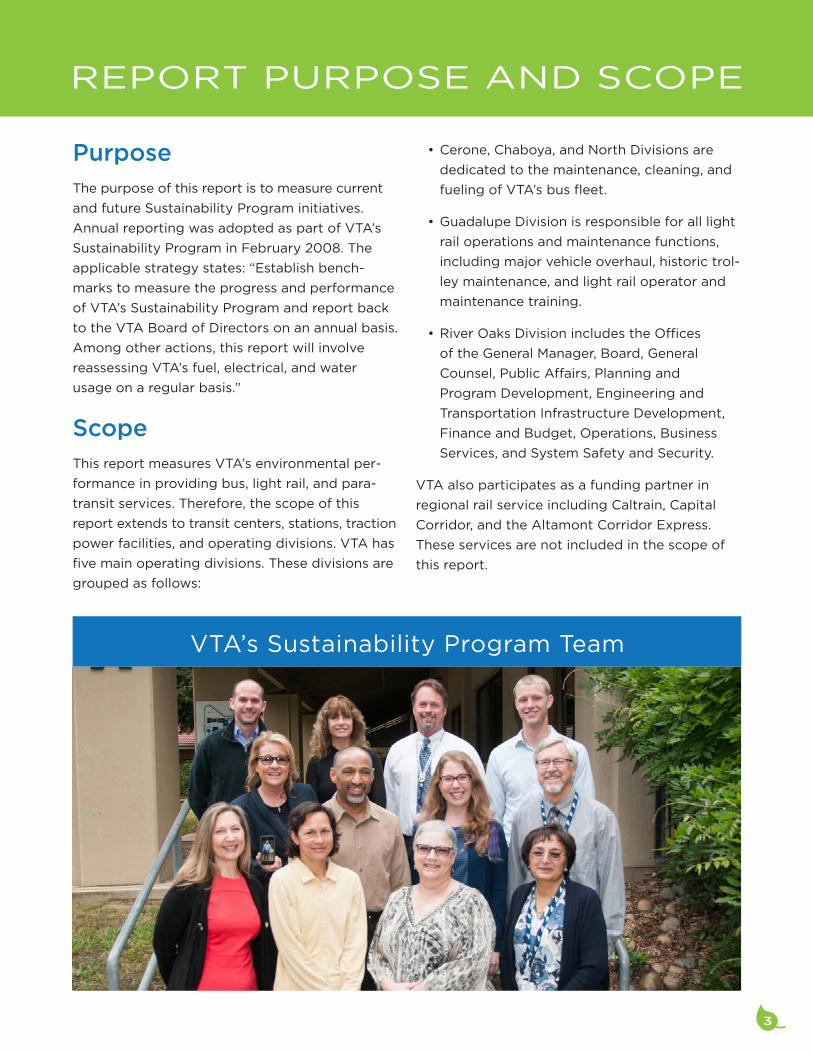
VTA’s Sustainability Program Team
0
500
1,000
1,500
2,000
2,500
3,000WasteRecycling
201520142008
4,000,000
4,200,000
4,400,000
4,600,000
4,800,000
201520142011
RevenueNon-RevenueParatransit
3,800,000
3,600,000
3,400,000
Gallo
ns o
f Fue
l
120,000
140,000
160,000
180,000
200,000
201520142008
100,000
80,000
0
GuadalupeRiver OaksNorthChaboya
60,000
40,000
20,000
2,000,000
2,500,000
3,000,000
3,500,000
4,000,000
201420132012
1,500,000
1,000,000
0
kWh
2015
Cerone NorthChaboya
500,000
2,000,000
2,500,000
3,000,000
3,500,000
4,000,000
CeroneNorthChaboya
1,500,000
1,000,000
0
kWh
River Oaks
Solar Grid
500,000
25,000,000
30,000,000
35,000,000
40,000,000
45,000,000
201520142008
Grid (Excl. TP)Traction PowerSolar
20,000,000
15,000,000
0
kWh
10,000,000
5,000,000
RecycledPotable
20132008
Drought Allocation
40,000,000
50,000,000
60,000,000
70,000,000
30,000,000
20,000,000
0
Gallo
ns
10,000,000
20152014
20132008
Cerone River OaksNorthChaboya Guadalupe
20152014
10,000,000
12,000,000
14,000,000
8,000,000
6,000,000
0
Gallo
ns
4,000,000
2,000,000
20132012
CeroneNorthChaboya
1,000,000
1,200,000
1,400,000
1,600,000
1,800,000
800,000
600,000
0
kWh
400,000
200,000
Ther
ms
Tons
5
Analyzing VTA’s environmental performance
requires large amounts of data from a variety of
sources. Since 2014, VTA has used a utility man-
agement system to keep track of this data and
monitor costs. The system helps identify poten-
tial issues and opportunities for improvement.
Implementation of this system has been instru-
mental in preparing the 2015 report.
This report measures VTA’s environmental per-
formance in providing bus, light rail, and para-
transit services by comparing usage and costs
from the previous reporting year (2014) to the
current reporting year (2015). Fuel, electricity,
natural gas, water, and solid waste are evaluated.
Where historical data is available, the report also
compares usage to the baseline year which is
2008, unless noted otherwise.
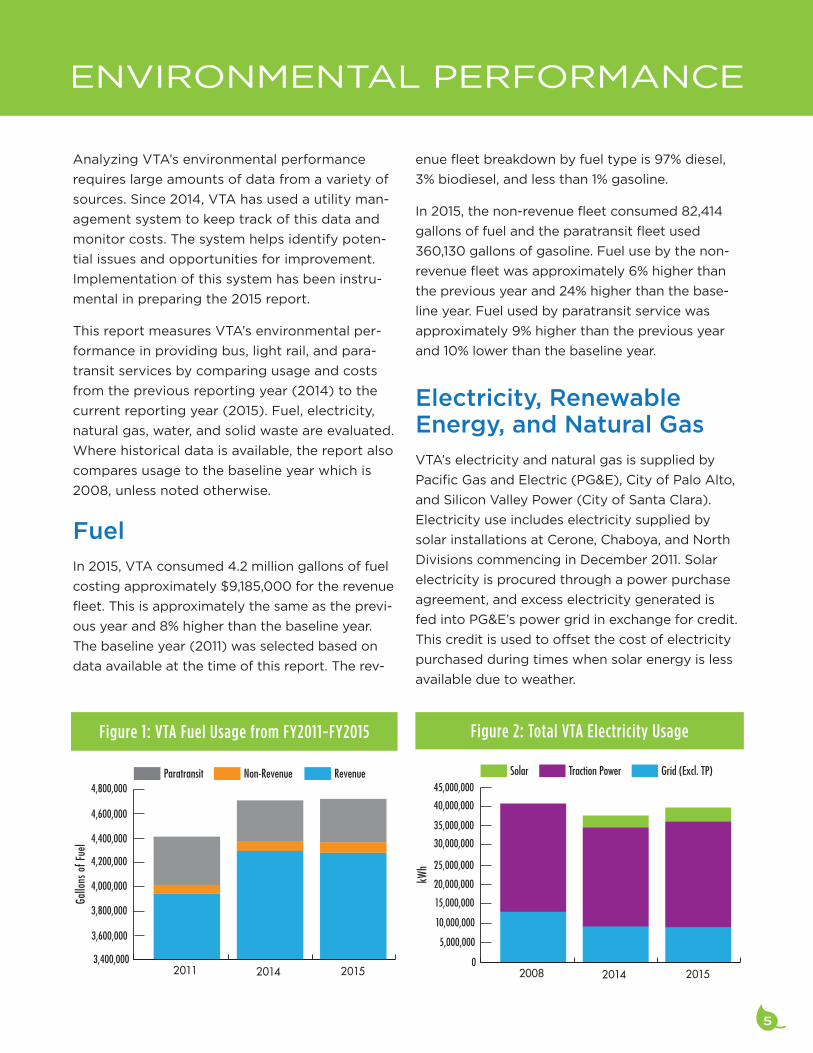
FuelIn 2015, VTA consumed 4.2 million gallons of fuel
costing approximately $9,185,000 for the revenue
fleet. This is approximately the same as the previ-
ous year and 8% higher than the baseline year.
The baseline year (2011) was selected based on
data available at the time of this report. The rev-
ENVIRONMENTAL PERFORMANCE
Figure 1: VTA Fuel Usage from FY2011-FY2015
0
500
1,000
1,500
2,000
2,500
3,000WasteRecycling
201520142008
4,000,000
4,200,000
4,400,000
4,600,000
4,800,000
201520142011
RevenueNon-RevenueParatransit
3,800,000
3,600,000
3,400,000
Gallo
ns o
f Fue
l
120,000
140,000
160,000
180,000
200,000
201520142008
100,000
80,000
0
GuadalupeRiver OaksNorthChaboya
60,000
40,000
20,000
2,000,000
2,500,000
3,000,000
3,500,000
4,000,000
201420132012
1,500,000
1,000,000
0
kWh
2015
Cerone NorthChaboya
500,000
2,000,000
2,500,000
3,000,000
3,500,000
4,000,000
CeroneNorthChaboya
1,500,000
1,000,000
0
kWh
River Oaks
Solar Grid
500,000
25,000,000
30,000,000
35,000,000
40,000,000
45,000,000
201520142008
Grid (Excl. TP)Traction PowerSolar
20,000,000
15,000,000
0
kWh
10,000,000
5,000,000
RecycledPotable
20132008
Drought Allocation
40,000,000
50,000,000
60,000,000
70,000,000
30,000,000
20,000,000
0
Gallo
ns
10,000,000
20152014
20132008
Cerone River OaksNorthChaboya Guadalupe
20152014
10,000,000
12,000,000
14,000,000
8,000,000
6,000,000
0
Gallo
ns
4,000,000
2,000,000
20132012
CeroneNorthChaboya
1,000,000
1,200,000
1,400,000
1,600,000
1,800,000
800,000
600,000
0
kWh
400,000
200,000
Ther
ms
Tons
enue fleet breakdown by fuel type is 97% diesel,
3% biodiesel, and less than 1% gasoline.
In 2015, the non-revenue fleet consumed 82,414
gallons of fuel and the paratransit fleet used
360,130 gallons of gasoline. Fuel use by the non-
revenue fleet was approximately 6% higher than
the previous year and 24% higher than the base-
line year. Fuel used by paratransit service was
approximately 9% higher than the previous year
and 10% lower than the baseline year.
Electricity, Renewable Energy, and Natural GasVTA’s electricity and natural gas is supplied by
Pacific Gas and Electric (PG&E), City of Palo Alto,
and Silicon Valley Power (City of Santa Clara).
Electricity use includes electricity supplied by
solar installations at Cerone, Chaboya, and North
Divisions commencing in December 2011. Solar
electricity is procured through a power purchase
agreement, and excess electricity generated is
fed into PG&E’s power grid in exchange for credit.
This credit is used to offset the cost of electricity
purchased during times when solar energy is less
available due to weather.
Figure 2: Total VTA Electricity Usage
6
In 2015, total VTA electricity use was 39.8 million
kilowatt hours (kWh), enough to power 3,640
homes for one year. This is approximately 5%
higher than the previous year, but 3% lower than
the 2008 baseline year. The increase in usage
over last year is due to additional traction power
usage as a result of more frequent service and
special events at Levi’s Stadium. In 2015, VTA
spent $6.4 million on electricity, which is approx-
imately 10% higher than the previous year.
Grid electricity use in 2015 was 36.5 mil-
lion kWh, 5% higher than the previous
year, but 11% lower than 2008.
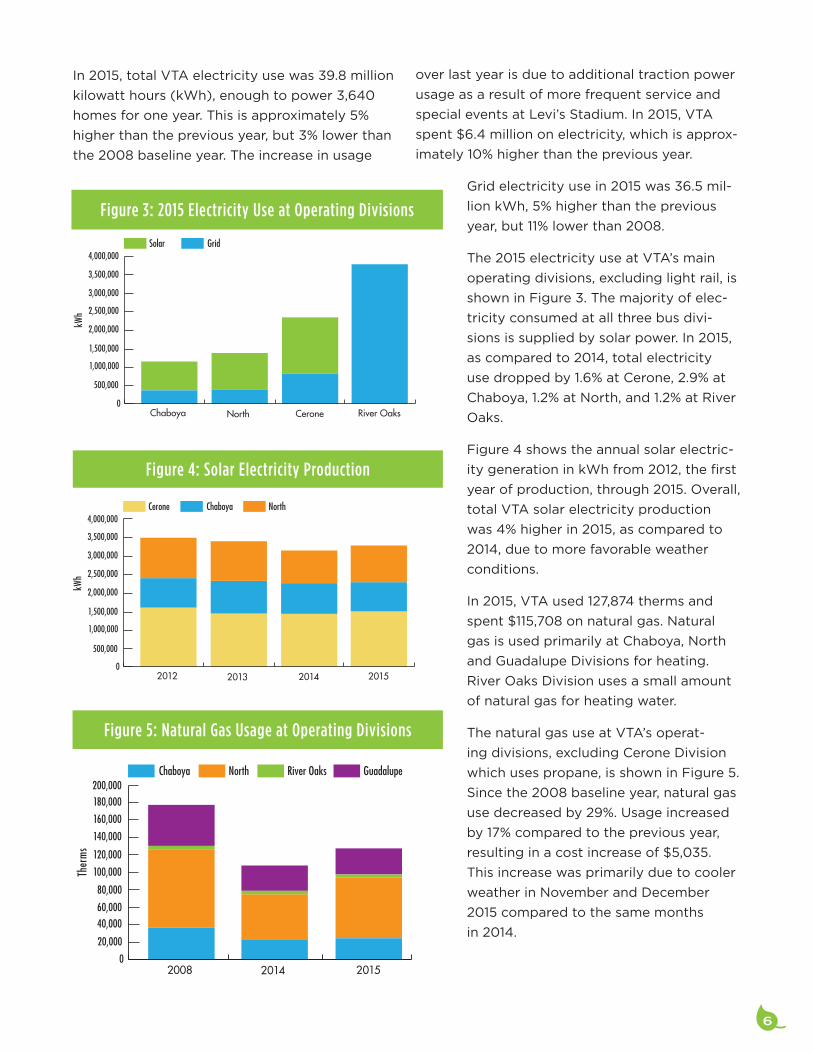
The 2015 electricity use at VTA’s main
operating divisions, excluding light rail, is
shown in Figure 3. The majority of elec-
tricity consumed at all three bus divi-
sions is supplied by solar power. In 2015,
as compared to 2014, total electricity
use dropped by 1.6% at Cerone, 2.9% at
Chaboya, 1.2% at North, and 1.2% at River
Oaks.
Figure 4 shows the annual solar electric-
ity generation in kWh from 2012, the first
year of production, through 2015. Overall,
total VTA solar electricity production
was 4% higher in 2015, as compared to
2014, due to more favorable weather
conditions.
In 2015, VTA used 127,874 therms and
spent $115,708 on natural gas. Natural
gas is used primarily at Chaboya, North
and Guadalupe Divisions for heating.
River Oaks Division uses a small amount
of natural gas for heating water.
The natural gas use at VTA’s operat-
ing divisions, excluding Cerone Division
which uses propane, is shown in Figure 5.
Since the 2008 baseline year, natural gas
use decreased by 29%. Usage increased
by 17% compared to the previous year,
resulting in a cost increase of $5,035.
This increase was primarily due to cooler
weather in November and December
2015 compared to the same months
in 2014.
0
500
1,000
1,500
2,000
2,500
3,000WasteRecycling
201520142008
4,000,000
4,200,000
4,400,000
4,600,000
4,800,000
201520142011
RevenueNon-RevenueParatransit
3,800,000
3,600,000
3,400,000
Gallo
ns o
f Fue
l
120,000
140,000
160,000
180,000
200,000
201520142008
100,000
80,000
0
GuadalupeRiver OaksNorthChaboya
60,000
40,000
20,000
2,000,000
2,500,000
3,000,000
3,500,000
4,000,000
201420132012
1,500,000
1,000,000
0
kWh
2015
Cerone NorthChaboya
500,000
2,000,000
2,500,000
3,000,000
3,500,000
4,000,000
CeroneNorthChaboya
1,500,000
1,000,000
0
kWh
River Oaks
Solar Grid
500,000
25,000,000
30,000,000
35,000,000
40,000,000
45,000,000
201520142008
Grid (Excl. TP)Traction PowerSolar
20,000,000
15,000,000
0
kWh
10,000,000
5,000,000
RecycledPotable
20132008
Drought Allocation
40,000,000
50,000,000
60,000,000
70,000,000
30,000,000
20,000,000
0
Gallo
ns
10,000,000
20152014
20132008
Cerone River OaksNorthChaboya Guadalupe
20152014
10,000,000
12,000,000
14,000,000
8,000,000
6,000,000
0
Gallo
ns
4,000,000
2,000,000
20132012
CeroneNorthChaboya
1,000,000
1,200,000
1,400,000
1,600,000
1,800,000
800,000
600,000
0
kWh
400,000
200,000
Ther
ms
Tons
Figure 4: Solar Electricity Production
0
500
1,000
1,500
2,000
2,500
3,000WasteRecycling
201520142008
4,000,000
4,200,000
4,400,000
4,600,000
4,800,000
201520142011
RevenueNon-RevenueParatransit
3,800,000
3,600,000
3,400,000
Gallo
ns o
f Fue
l
120,000
140,000
160,000
180,000
200,000
201520142008
100,000
80,000
0
GuadalupeRiver OaksNorthChaboya
60,000
40,000
20,000
2,000,000
2,500,000
3,000,000
3,500,000
4,000,000
201420132012
1,500,000
1,000,000
0
kWh
2015
Cerone NorthChaboya
500,000
2,000,000
2,500,000
3,000,000
3,500,000
4,000,000
CeroneNorthChaboya
1,500,000
1,000,000
0
kWh
River Oaks
Solar Grid
500,000
25,000,000
30,000,000
35,000,000
40,000,000
45,000,000
201520142008
Grid (Excl. TP)Traction PowerSolar
20,000,000
15,000,000
0
kWh
10,000,000
5,000,000
RecycledPotable
20132008
Drought Allocation
40,000,000
50,000,000
60,000,000
70,000,000
30,000,000
20,000,000
0
Gallo
ns
10,000,000
20152014
20132008
Cerone River OaksNorthChaboya Guadalupe
20152014
10,000,000
12,000,000
14,000,000
8,000,000
6,000,000
0
Gallo
ns
4,000,000
2,000,000
20132012
CeroneNorthChaboya
1,000,000
1,200,000
1,400,000
1,600,000
1,800,000
800,000
600,000
0
kWh
400,000
200,000
Ther
ms
Tons
Figure 3: 2015 Electricity Use at Operating Divisions
Figure 5: Natural Gas Usage at Operating Divisions
0
500
1,000
1,500
2,000
2,500
3,000WasteRecycling
201520142008
4,000,000
4,200,000
4,400,000
4,600,000
4,800,000
201520142011
RevenueNon-RevenueParatransit
3,800,000
3,600,000
3,400,000
Gallo
ns o
f Fue
l
120,000
140,000
160,000
180,000
200,000
201520142008
100,000
80,000
0
GuadalupeRiver OaksNorthChaboya
60,000
40,000
20,000
2,000,000
2,500,000
3,000,000
3,500,000
4,000,000
201420132012
1,500,000
1,000,000
0
kWh
2015
Cerone NorthChaboya
500,000
2,000,000
2,500,000
3,000,000
3,500,000
4,000,000
CeroneNorthChaboya
1,500,000
1,000,000
0
kWh
River Oaks
Solar Grid
500,000
25,000,000
30,000,000
35,000,000
40,000,000
45,000,000
201520142008
Grid (Excl. TP)Traction PowerSolar
20,000,000
15,000,000
0
kWh
10,000,000
5,000,000
RecycledPotable
20132008
Drought Allocation
40,000,000
50,000,000
60,000,000
70,000,000
30,000,000
20,000,000
0
Gallo
ns
10,000,000
20152014
20132008
Cerone River OaksNorthChaboya Guadalupe
20152014
10,000,000
12,000,000
14,000,000
8,000,000
6,000,000
0
Gallo
ns
4,000,000
2,000,000
20132012
CeroneNorthChaboya
1,000,000
1,200,000
1,400,000
1,600,000
1,800,000
800,000
600,000
0
kWh
400,000
200,000
Ther
ms
Tons
7
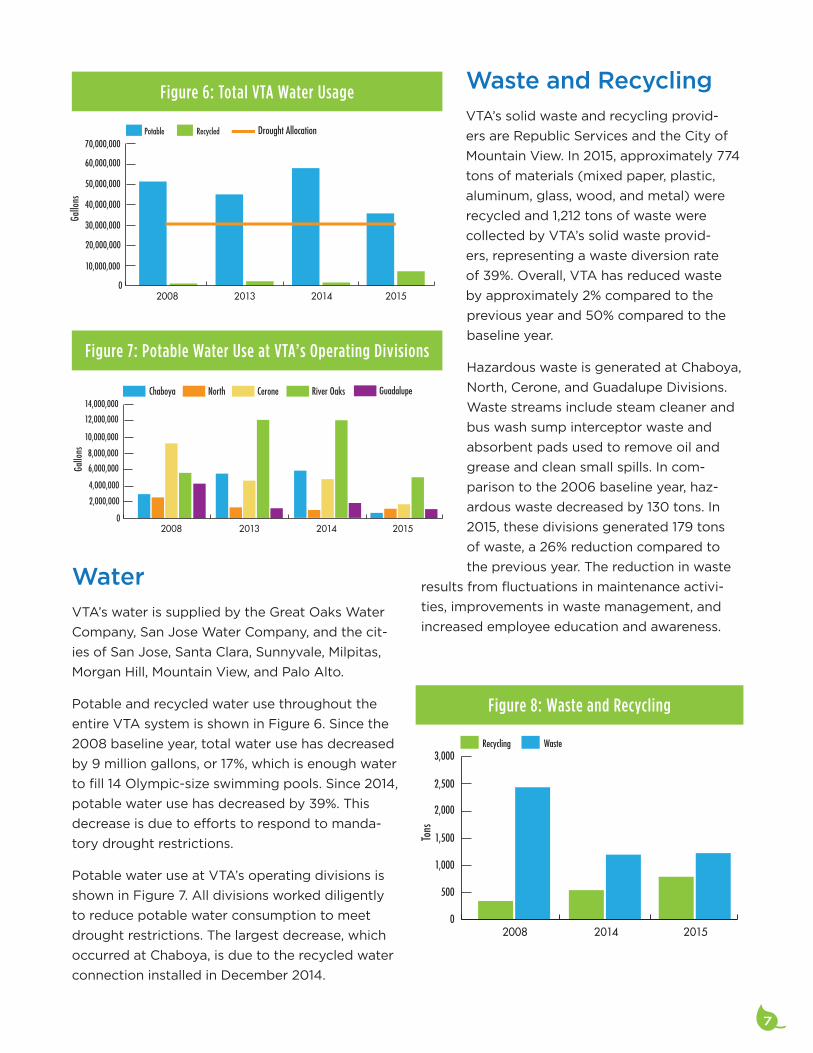
Waste and RecyclingVTA’s solid waste and recycling provid-
ers are Republic Services and the City of
Mountain View. In 2015, approximately 774
tons of materials (mixed paper, plastic,
aluminum, glass, wood, and metal) were
recycled and 1,212 tons of waste were
collected by VTA’s solid waste provid-
ers, representing a waste diversion rate
of 39%. Overall, VTA has reduced waste
by approximately 2% compared to the
previous year and 50% compared to the
baseline year.
Hazardous waste is generated at Chaboya,
North, Cerone, and Guadalupe Divisions.
Waste streams include steam cleaner and
bus wash sump interceptor waste and
absorbent pads used to remove oil and
grease and clean small spills. In com-
parison to the 2006 baseline year, haz-
ardous waste decreased by 130 tons. In
2015, these divisions generated 179 tons
of waste, a 26% reduction compared to
the previous year. The reduction in waste
results from fluctuations in maintenance activi-
ties, improvements in waste management, and
increased employee education and awareness.
WaterVTA’s water is supplied by the Great Oaks Water
Company, San Jose Water Company, and the cit-
ies of San Jose, Santa Clara, Sunnyvale, Milpitas,
Morgan Hill, Mountain View, and Palo Alto.
Potable and recycled water use throughout the
entire VTA system is shown in Figure 6. Since the
2008 baseline year, total water use has decreased
by 9 million gallons, or 17%, which is enough water
to fill 14 Olympic-size swimming pools. Since 2014,
potable water use has decreased by 39%. This
decrease is due to efforts to respond to manda-
tory drought restrictions.
Potable water use at VTA’s operating divisions is
shown in Figure 7. All divisions worked diligently
to reduce potable water consumption to meet
drought restrictions. The largest decrease, which
occurred at Chaboya, is due to the recycled water
connection installed in December 2014.
0
500
1,000
1,500
2,000
2,500
3,000WasteRecycling
201520142008
4,000,000
4,200,000
4,400,000
4,600,000
4,800,000
201520142011
RevenueNon-RevenueParatransit
3,800,000
3,600,000
3,400,000
Gallo
ns o
f Fue
l
120,000
140,000
160,000
180,000
200,000
201520142008
100,000
80,000
0
GuadalupeRiver OaksNorthChaboya
60,000
40,000
20,000
2,000,000
2,500,000
3,000,000
3,500,000
4,000,000
201420132012
1,500,000
1,000,000
0
kWh
2015
Cerone NorthChaboya
500,000
2,000,000
2,500,000
3,000,000
3,500,000
4,000,000
CeroneNorthChaboya
1,500,000
1,000,000
0
kWh
River Oaks
Solar Grid
500,000
25,000,000
30,000,000
35,000,000
40,000,000
45,000,000
201520142008
Grid (Excl. TP)Traction PowerSolar
20,000,000
15,000,000
0
kWh
10,000,000
5,000,000
RecycledPotable
20132008
Drought Allocation
40,000,000
50,000,000
60,000,000
70,000,000
30,000,000
20,000,000
0
Gallo
ns
10,000,000
20152014
20132008
Cerone River OaksNorthChaboya Guadalupe
20152014
10,000,000
12,000,000
14,000,000
8,000,000
6,000,000
0
Gallo
ns
4,000,000
2,000,000
20132012
CeroneNorthChaboya
1,000,000
1,200,000
1,400,000
1,600,000
1,800,000
800,000
600,000
0
kWh
400,000
200,000
Ther
ms
Tons
Figure 6: Total VTA Water Usage
Figure 7: Potable Water Use at VTA’s Operating Divisions
0
500
1,000
1,500
2,000
2,500
3,000WasteRecycling
201520142008
4,000,000
4,200,000
4,400,000
4,600,000
4,800,000
201520142011
RevenueNon-RevenueParatransit
3,800,000
3,600,000
3,400,000
Gallo
ns o
f Fue
l
120,000
140,000
160,000
180,000
200,000
201520142008
100,000
80,000
0
GuadalupeRiver OaksNorthChaboya
60,000
40,000
20,000
2,000,000
2,500,000
3,000,000
3,500,000
4,000,000
201420132012
1,500,000
1,000,000
0
kWh
2015
Cerone NorthChaboya
500,000
2,000,000
2,500,000
3,000,000
3,500,000
4,000,000
CeroneNorthChaboya
1,500,000
1,000,000
0
kWh
River Oaks
Solar Grid
500,000
25,000,000
30,000,000
35,000,000
40,000,000
45,000,000
201520142008
Grid (Excl. TP)Traction PowerSolar
20,000,000
15,000,000
0
kWh
10,000,000
5,000,000
RecycledPotable
20132008
Drought Allocation
40,000,000
50,000,000
60,000,000
70,000,000
30,000,000
20,000,000
0
Gallo
ns
10,000,000
20152014
20132008
Cerone River OaksNorthChaboya Guadalupe
20152014
10,000,000
12,000,000
14,000,000
8,000,000
6,000,000
0
Gallo
ns
4,000,000
2,000,000
20132012
CeroneNorthChaboya
1,000,000
1,200,000
1,400,000
1,600,000
1,800,000
800,000
600,000
0
kWh
400,000
200,000
Ther
ms
Tons
Figure 8: Waste and Recycling
0
500
1,000
1,500
2,000
2,500
3,000WasteRecycling
201520142008
4,000,000
4,200,000
4,400,000
4,600,000
4,800,000
201520142011
RevenueNon-RevenueParatransit
3,800,000
3,600,000
3,400,000
Gallo
ns o
f Fue
l
120,000
140,000
160,000
180,000
200,000
201520142008
100,000
80,000
0
GuadalupeRiver OaksNorthChaboya
60,000
40,000
20,000
2,000,000
2,500,000
3,000,000
3,500,000
4,000,000
201420132012
1,500,000
1,000,000
0
kWh
2015
Cerone NorthChaboya
500,000
2,000,000
2,500,000
3,000,000
3,500,000
4,000,000
CeroneNorthChaboya
1,500,000
1,000,000
0
kWh
River Oaks
Solar Grid
500,000
25,000,000
30,000,000
35,000,000
40,000,000
45,000,000
201520142008
Grid (Excl. TP)Traction PowerSolar
20,000,000
15,000,000
0
kWh
10,000,000
5,000,000
RecycledPotable
20132008
Drought Allocation
40,000,000
50,000,000
60,000,000
70,000,000
30,000,000
20,000,000
0
Gallo
ns
10,000,000
20152014
20132008
Cerone River OaksNorthChaboya Guadalupe
20152014
10,000,000
12,000,000
14,000,000
8,000,000
6,000,000
0
Gallo
ns
4,000,000
2,000,000
20132012
CeroneNorthChaboya
1,000,000
1,200,000
1,400,000
1,600,000
1,800,000
800,000
600,000
0
kWh
400,000
200,000
Ther
ms
Tons
9
VTA’s Sustainability Program achieved many
accomplishments in 2015. Each accomplishment
is a validation of VTA’s commitment to increasing
environmental performance and efficiency. Eight
key accomplishment areas for 2015 are sum-
marized in this section. A summary table of past
accomplishments is also provided.
Sustainability initiatives are identified by VTA’s
Sustainability Team and funded through the
Sustainability Program. The Team is comprised
of employee representatives from across the
agency. Since 2007, the Team has met monthly
to identify initiatives and report on progress. In
addition, approximately five employees allocate a
portion of their time to support the Program.
Accomplishment Area 1:
Responding to Drought Emergency
California is currently in its fifth year of severe
drought. On April 1, 2015, Governor Brown called
for mandatory water reductions averaging 25%
ACCOMPLISHMENTS
throughout the state. In response to local water
conditions, the Santa Clara Valley Water District
set a water use reduction target of 30% relative
to water use in 2013 and placed a restriction on
irrigating outdoor landscapes and lawns with
potable water to two days per week.
In response to water reduction requirements,
VTA formed a Water Working Group to develop
and implement water conservation strategies.
As a result, VTA reduced potable water use by
21% compared to 2013 by taking the following
actions:
• Bus washing was reduced from two times per
week to one time per week, if needed.
• Irrigation use was cut back by 10 to 20%
(or completely shut off in some locations)
and schedules were adjusted to meet local
restrictions.
• Monthly reporting was conducted to identify
high and abnormal use. Leaks were identified
and repaired at several light rail stations and
park-and-ride lots.
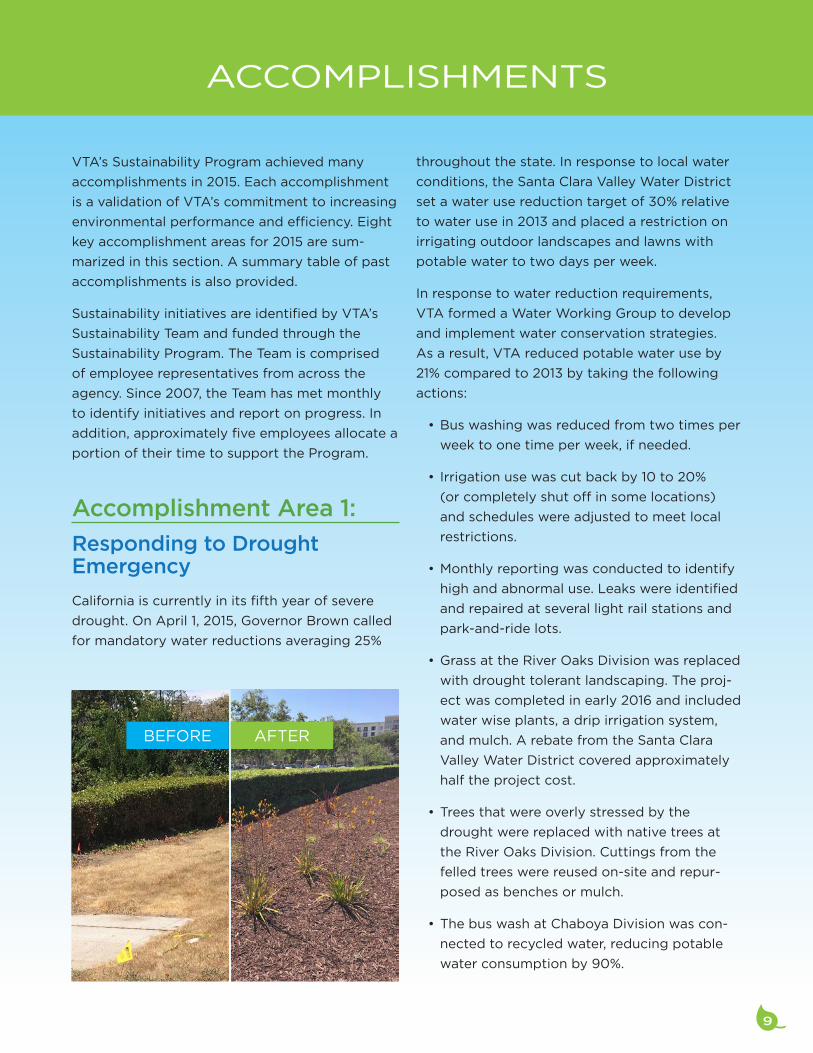
• Grass at the River Oaks Division was replaced
with drought tolerant landscaping. The proj-
ect was completed in early 2016 and included
water wise plants, a drip irrigation system,
and mulch. A rebate from the Santa Clara
Valley Water District covered approximately
half the project cost.
• Trees that were overly stressed by the
drought were replaced with native trees at
the River Oaks Division. Cuttings from the
felled trees were reused on-site and repur-
posed as benches or mulch.
• The bus wash at Chaboya Division was con-
nected to recycled water, reducing potable
water consumption by 90%.
BEFORE AFTER
10
Accomplishment Area 2:
Reducing Vehicle Emissions
Greenhouse gas (GHG) emissions are emit-
ted, in part, through the burning of fossil fuel.
Approximately 79% of VTA’s GHG emissions dur-
ing 2015 were related to the operation of the rev-
enue fleet. VTA seeks to reduce GHG emissions
that contribute to climate change by greening
the agency’s fleet, adding electric vehicle charg-
ing stations, and promoting bicycling.
Accomplishments for this reporting year include:
• In 2015, diesel-electric hybrids made up
20% of VTA’s revenue fleet. Currently, VTA
is applying for funding to purchase electric
buses as part of a pilot program. When a
revenue or non-revenue vehicle exceeds its
useful lifespan, VTA replaces it with a fuel
efficient vehicle according to the agency’s
Sustainable Fleet Policy.
• Five electric vehicle charging stations were
installed at the Eastridge Transit Center.
Funding for the charging stations was pro-
vided by a grant from the Bay Area Air
Quality Management District.
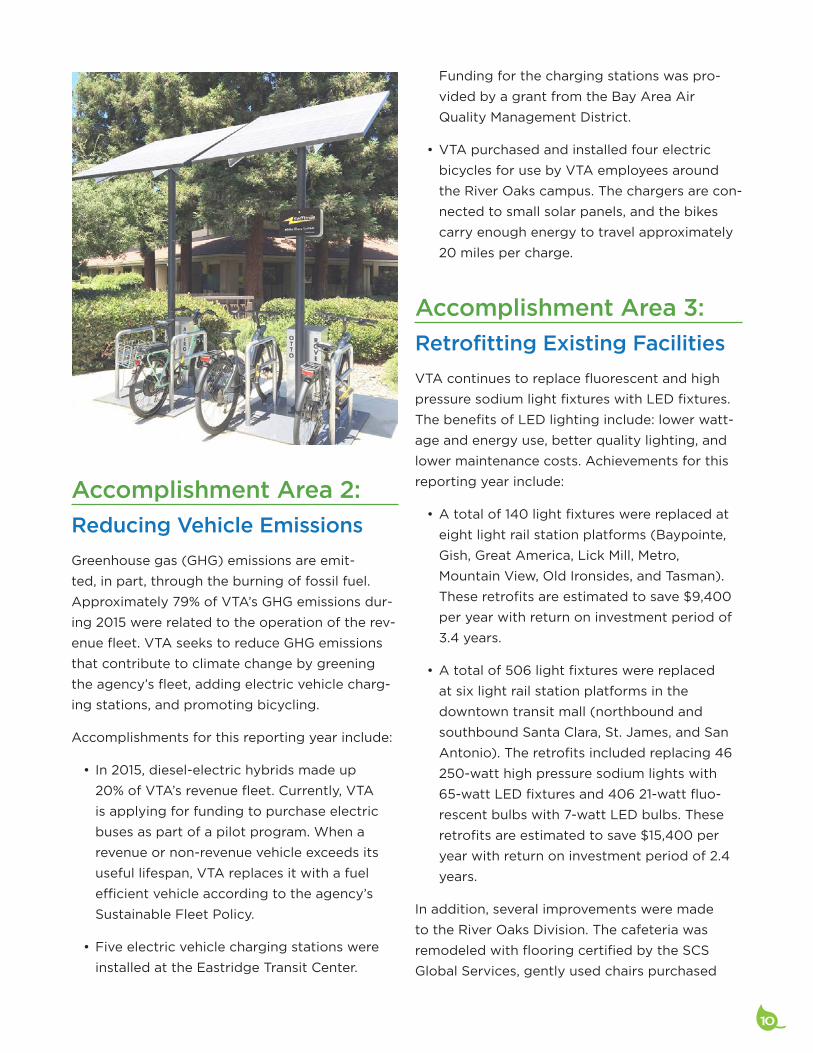
• VTA purchased and installed four electric
bicycles for use by VTA employees around
the River Oaks campus. The chargers are con-
nected to small solar panels, and the bikes
carry enough energy to travel approximately
20 miles per charge.
Accomplishment Area 3:
Retrofitting Existing Facilities
VTA continues to replace fluorescent and high
pressure sodium light fixtures with LED fixtures.
The benefits of LED lighting include: lower watt-
age and energy use, better quality lighting, and
lower maintenance costs. Achievements for this
reporting year include:
• A total of 140 light fixtures were replaced at
eight light rail station platforms (Baypointe,
Gish, Great America, Lick Mill, Metro,
Mountain View, Old Ironsides, and Tasman).
These retrofits are estimated to save $9,400
per year with return on investment period of
3.4 years.
• A total of 506 light fixtures were replaced
at six light rail station platforms in the
downtown transit mall (northbound and
southbound Santa Clara, St. James, and San
Antonio). The retrofits included replacing 46
250-watt high pressure sodium lights with
65-watt LED fixtures and 406 21-watt fluo-
rescent bulbs with 7-watt LED bulbs. These
retrofits are estimated to save $15,400 per
year with return on investment period of 2.4
years.
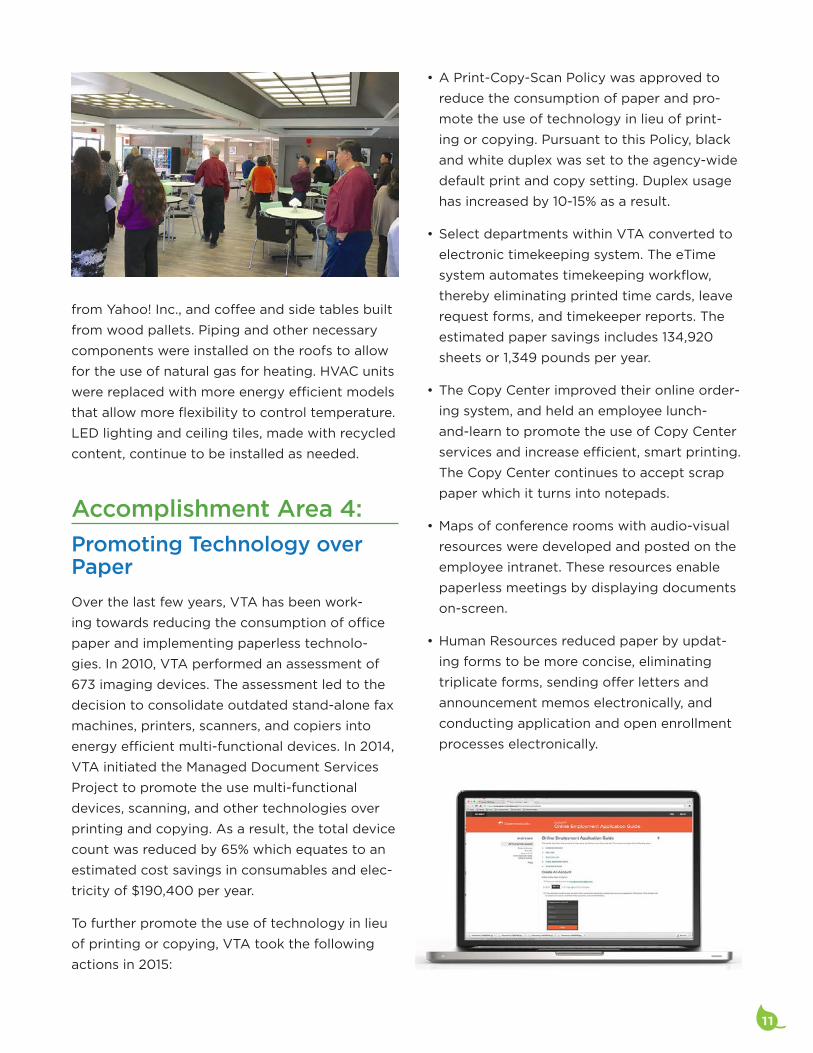
In addition, several improvements were made
to the River Oaks Division. The cafeteria was
remodeled with flooring certified by the SCS
Global Services, gently used chairs purchased
11
from Yahoo! Inc., and coffee and side tables built
from wood pallets. Piping and other necessary
components were installed on the roofs to allow
for the use of natural gas for heating. HVAC units
were replaced with more energy efficient models
that allow more flexibility to control temperature.
LED lighting and ceiling tiles, made with recycled
content, continue to be installed as needed.
Accomplishment Area 4:
Promoting Technology over Paper
Over the last few years, VTA has been work-
ing towards reducing the consumption of office
paper and implementing paperless technolo-
gies. In 2010, VTA performed an assessment of
673 imaging devices. The assessment led to the
decision to consolidate outdated stand-alone fax
machines, printers, scanners, and copiers into
energy efficient multi-functional devices. In 2014,
VTA initiated the Managed Document Services
Project to promote the use multi-functional
devices, scanning, and other technologies over
printing and copying. As a result, the total device
count was reduced by 65% which equates to an
estimated cost savings in consumables and elec-
tricity of $190,400 per year.
To further promote the use of technology in lieu
of printing or copying, VTA took the following
actions in 2015:
• A Print-Copy-Scan Policy was approved to
reduce the consumption of paper and pro-
mote the use of technology in lieu of print-
ing or copying. Pursuant to this Policy, black
and white duplex was set to the agency-wide
default print and copy setting. Duplex usage
has increased by 10-15% as a result.
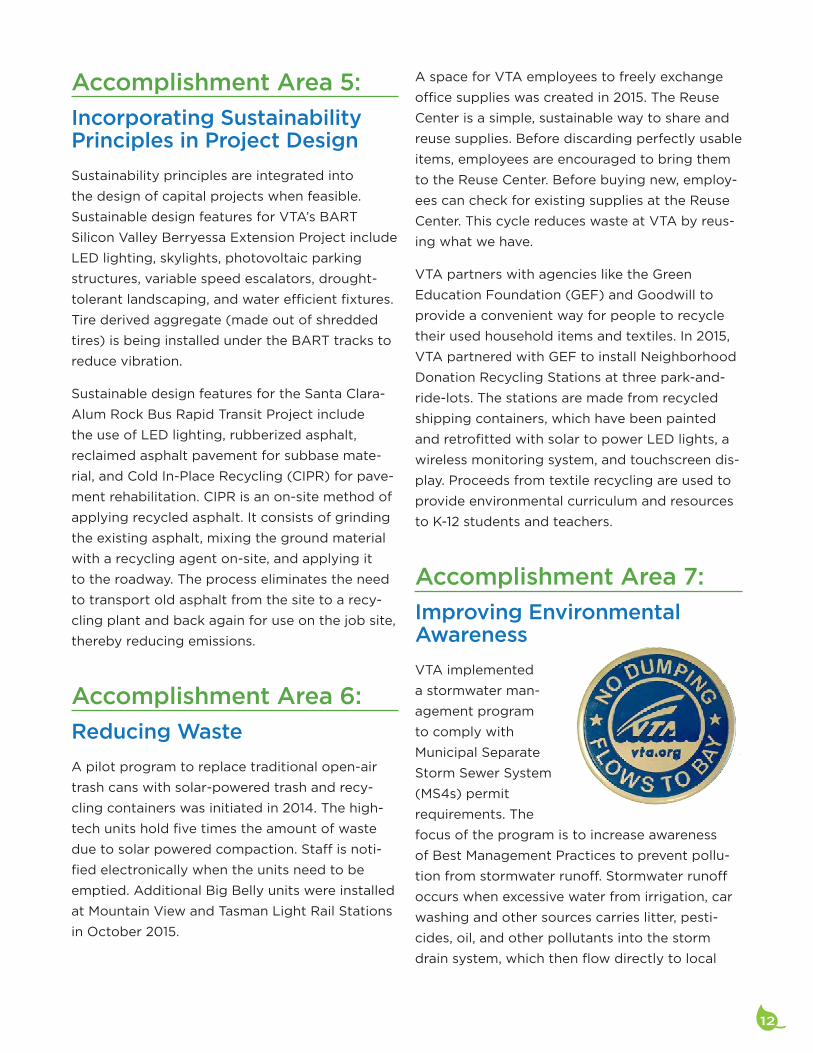
• Select departments within VTA converted to
electronic timekeeping system. The eTime
system automates timekeeping workflow,
thereby eliminating printed time cards, leave
request forms, and timekeeper reports. The
estimated paper savings includes 134,920
sheets or 1,349 pounds per year.
• The Copy Center improved their online order-
ing system, and held an employee lunch-
and-learn to promote the use of Copy Center
services and increase efficient, smart printing.
The Copy Center continues to accept scrap
paper which it turns into notepads.
• Maps of conference rooms with audio-visual
resources were developed and posted on the
employee intranet. These resources enable
paperless meetings by displaying documents
on-screen.
• Human Resources reduced paper by updat-
ing forms to be more concise, eliminating
triplicate forms, sending offer letters and
announcement memos electronically, and
conducting application and open enrollment
processes electronically.
12
Accomplishment Area 5:
Incorporating Sustainability Principles in Project Design
Sustainability principles are integrated into
the design of capital projects when feasible.
Sustainable design features for VTA’s BART
Silicon Valley Berryessa Extension Project include
LED lighting, skylights, photovoltaic parking
structures, variable speed escalators, drought-
tolerant landscaping, and water efficient fixtures.
Tire derived aggregate (made out of shredded
tires) is being installed under the BART tracks to
reduce vibration.
Sustainable design features for the Santa Clara-
Alum Rock Bus Rapid Transit Project include
the use of LED lighting, rubberized asphalt,
reclaimed asphalt pavement for subbase mate-
rial, and Cold In-Place Recycling (CIPR) for pave-
ment rehabilitation. CIPR is an on-site method of
applying recycled asphalt. It consists of grinding
the existing asphalt, mixing the ground material
with a recycling agent on-site, and applying it
to the roadway. The process eliminates the need
to transport old asphalt from the site to a recy-
cling plant and back again for use on the job site,
thereby reducing emissions.
Accomplishment Area 6:
Reducing Waste
A pilot program to replace traditional open-air
trash cans with solar-powered trash and recy-
cling containers was initiated in 2014. The high-
tech units hold five times the amount of waste
due to solar powered compaction. Staff is noti-
fied electronically when the units need to be
emptied. Additional Big Belly units were installed
at Mountain View and Tasman Light Rail Stations
in October 2015.
A space for VTA employees to freely exchange
office supplies was created in 2015. The Reuse
Center is a simple, sustainable way to share and
reuse supplies. Before discarding perfectly usable
items, employees are encouraged to bring them
to the Reuse Center. Before buying new, employ-
ees can check for existing supplies at the Reuse
Center. This cycle reduces waste at VTA by reus-
ing what we have.
VTA partners with agencies like the Green
Education Foundation (GEF) and Goodwill to
provide a convenient way for people to recycle
their used household items and textiles. In 2015,
VTA partnered with GEF to install Neighborhood
Donation Recycling Stations at three park-and-
ride-lots. The stations are made from recycled
shipping containers, which have been painted
and retrofitted with solar to power LED lights, a
wireless monitoring system, and touchscreen dis-
play. Proceeds from textile recycling are used to
provide environmental curriculum and resources
to K-12 students and teachers.
Accomplishment Area 7:
Improving Environmental Awareness
VTA implemented
a stormwater man-
agement program
to comply with
Municipal Separate
Storm Sewer System
(MS4s) permit
requirements. The
focus of the program is to increase awareness
of Best Management Practices to prevent pollu-
tion from stormwater runoff. Stormwater runoff
occurs when excessive water from irrigation, car
washing and other sources carries litter, pesti-
cides, oil, and other pollutants into the storm
drain system, which then flow directly to local
13
waterways. Employee trainings were conducted
agency wide. Other outreach efforts included
posters, surveys, and posting on VTA’s website.
Drain inlets on VTA property were identified,
mapped, and labeled with permanent medallions.
In addition, VTA continued its efforts to share
knowledge and build awareness of environmental
issues. Ongoing outreach efforts include presen-
tations at New Employee Orientations, distribu-
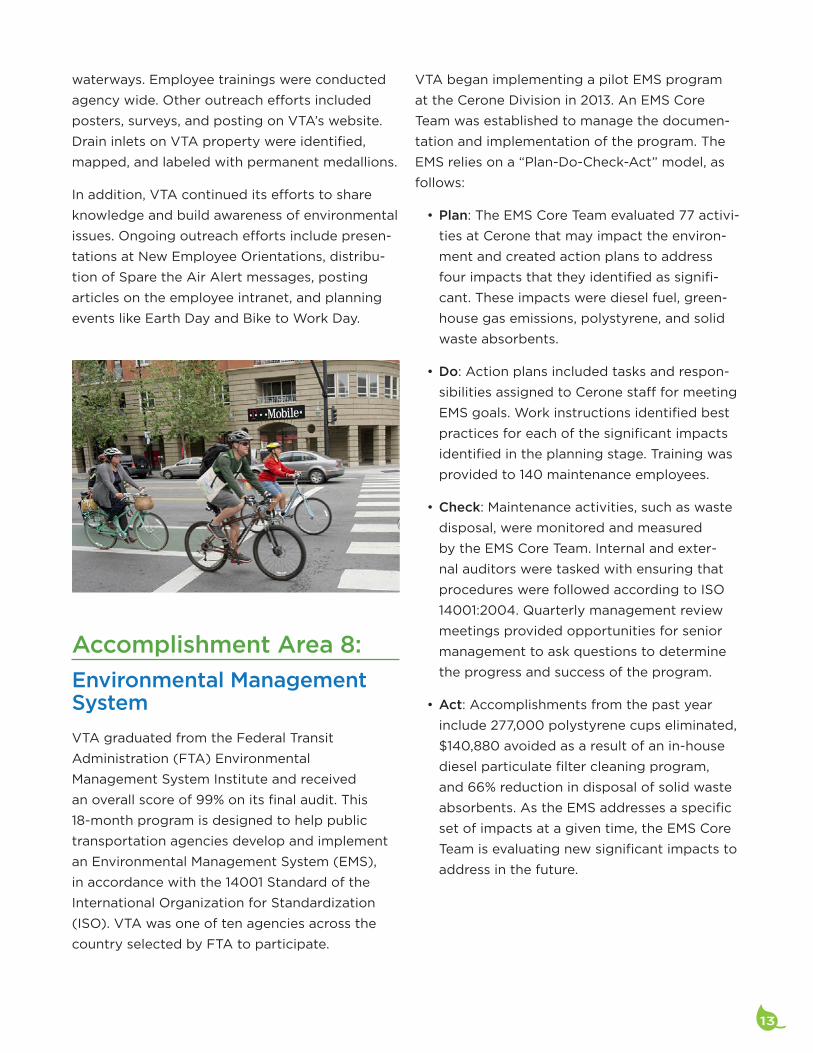
tion of Spare the Air Alert messages, posting
articles on the employee intranet, and planning
events like Earth Day and Bike to Work Day.
Accomplishment Area 8:
Environmental Management System
VTA graduated from the Federal Transit
Administration (FTA) Environmental
Management System Institute and received
an overall score of 99% on its final audit. This
18-month program is designed to help public
transportation agencies develop and implement
an Environmental Management System (EMS),
in accordance with the 14001 Standard of the
International Organization for Standardization
(ISO). VTA was one of ten agencies across the
country selected by FTA to participate.
VTA began implementing a pilot EMS program
at the Cerone Division in 2013. An EMS Core
Team was established to manage the documen-
tation and implementation of the program. The
EMS relies on a “Plan-Do-Check-Act” model, as
follows:
• Plan: The EMS Core Team evaluated 77 activi-
ties at Cerone that may impact the environ-
ment and created action plans to address
four impacts that they identified as signifi-
cant. These impacts were diesel fuel, green-
house gas emissions, polystyrene, and solid
waste absorbents.
• Do: Action plans included tasks and respon-
sibilities assigned to Cerone staff for meeting
EMS goals. Work instructions identified best
practices for each of the significant impacts
identified in the planning stage. Training was
provided to 140 maintenance employees.
• Check: Maintenance activities, such as waste
disposal, were monitored and measured
by the EMS Core Team. Internal and exter-
nal auditors were tasked with ensuring that
procedures were followed according to ISO
14001:2004. Quarterly management review
meetings provided opportunities for senior
management to ask questions to determine
the progress and success of the program.
• Act: Accomplishments from the past year
include 277,000 polystyrene cups eliminated,
$140,880 avoided as a result of an in-house
diesel particulate filter cleaning program,
and 66% reduction in disposal of solid waste
absorbents. As the EMS addresses a specific
set of impacts at a given time, the EMS Core
Team is evaluating new significant impacts to
address in the future.
14
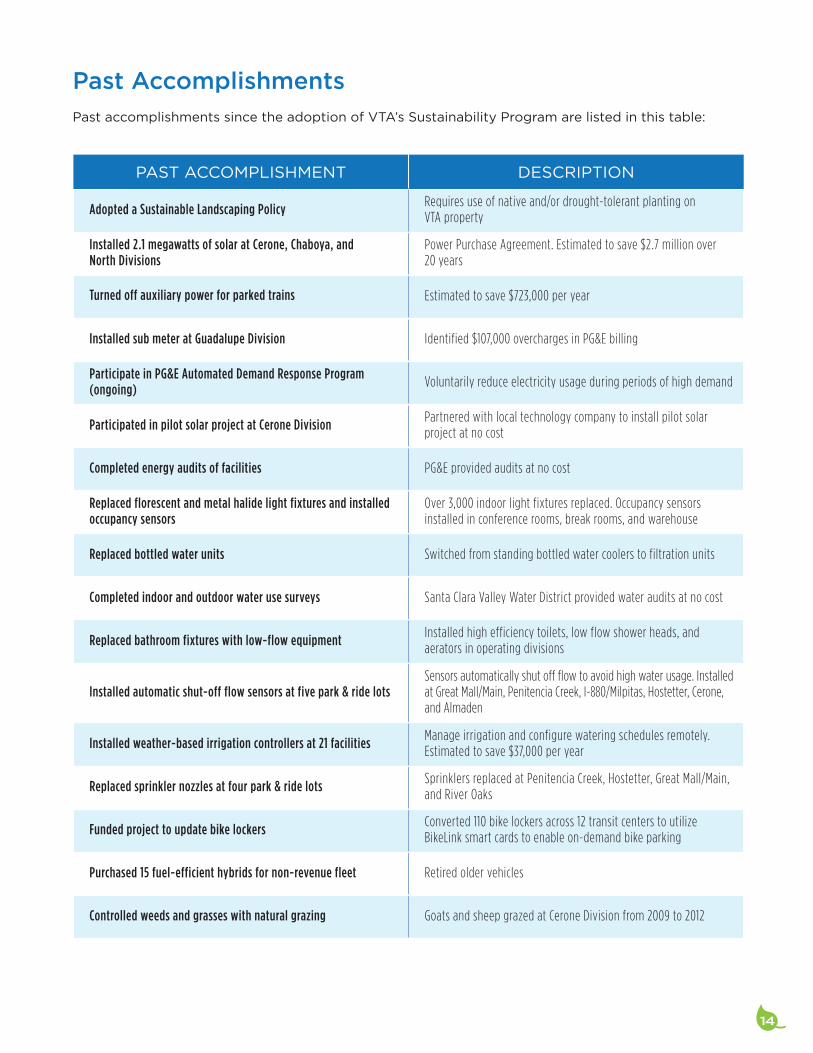
Past AccomplishmentsPast accomplishments since the adoption of VTA’s Sustainability Program are listed in this table:
PAST ACCOMPLISHMENT DESCRIPTION
Adopted a Sustainable Landscaping PolicyRequires use of native and/or drought-tolerant planting on VTA property
Installed 2.1 megawatts of solar at Cerone, Chaboya, and North Divisions
Power Purchase Agreement. Estimated to save $2.7 million over 20 years
Turned off auxiliary power for parked trains Estimated to save $723,000 per year
Installed sub meter at Guadalupe Division Identified $107,000 overcharges in PG&E billing
Participate in PG&E Automated Demand Response Program (ongoing)
Voluntarily reduce electricity usage during periods of high demand
Participated in pilot solar project at Cerone DivisionPartnered with local technology company to install pilot solar project at no cost
Completed energy audits of facilities PG&E provided audits at no cost
Replaced florescent and metal halide light fixtures and installed occupancy sensors
Over 3,000 indoor light fixtures replaced. Occupancy sensors installed in conference rooms, break rooms, and warehouse
Replaced bottled water units Switched from standing bottled water coolers to filtration units
Completed indoor and outdoor water use surveys Santa Clara Valley Water District provided water audits at no cost
Replaced bathroom fixtures with low-flow equipmentInstalled high efficiency toilets, low flow shower heads, and aerators in operating divisions
Installed automatic shut-off flow sensors at five park & ride lotsSensors automatically shut off flow to avoid high water usage. Installed at Great Mall/Main, Penitencia Creek, I-880/Milpitas, Hostetter, Cerone, and Almaden
Installed weather-based irrigation controllers at 21 facilitiesManage irrigation and configure watering schedules remotely. Estimated to save $37,000 per year
Replaced sprinkler nozzles at four park & ride lotsSprinklers replaced at Penitencia Creek, Hostetter, Great Mall/Main, and River Oaks
Funded project to update bike lockersConverted 110 bike lockers across 12 transit centers to utilize BikeLink smart cards to enable on-demand bike parking
Purchased 15 fuel-efficient hybrids for non-revenue fleet Retired older vehicles
Controlled weeds and grasses with natural grazing Goats and sheep grazed at Cerone Division from 2009 to 2012
15
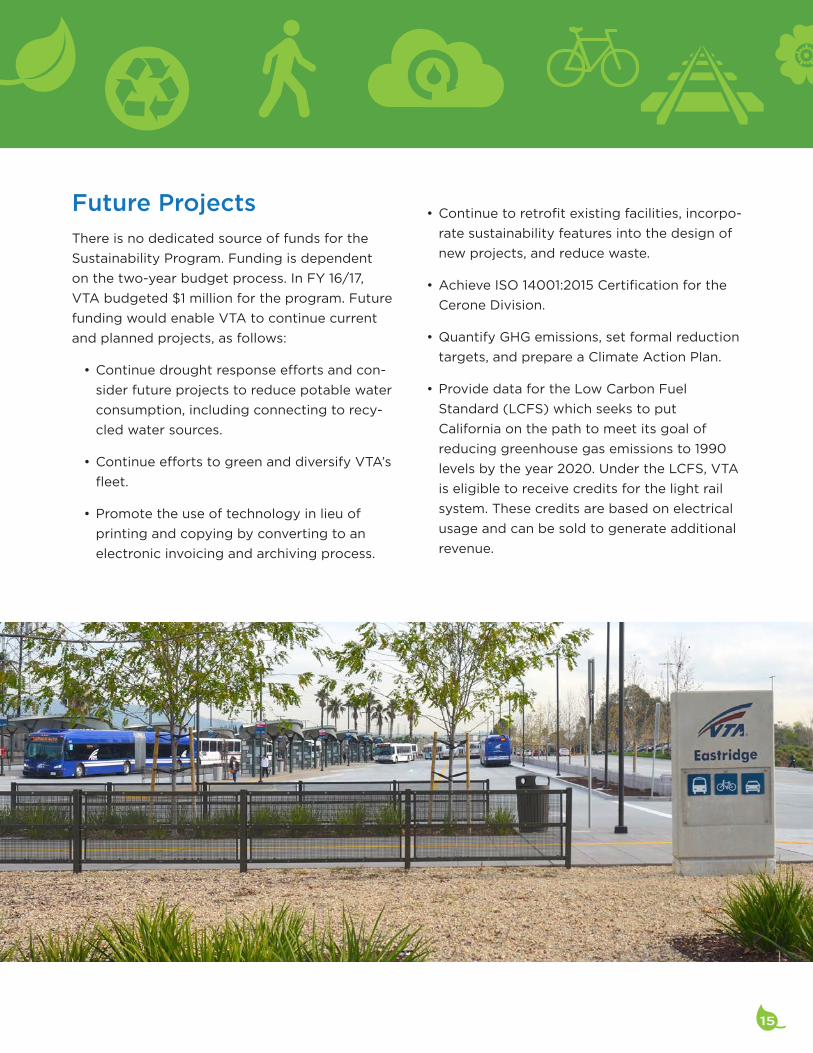
Future ProjectsThere is no dedicated source of funds for the
Sustainability Program. Funding is dependent
on the two-year budget process. In FY 16/17,
VTA budgeted $1 million for the program. Future
funding would enable VTA to continue current
and planned projects, as follows:
• Continue drought response efforts and con-
sider future projects to reduce potable water
consumption, including connecting to recy-
cled water sources.
• Continue efforts to green and diversify VTA’s
fleet.
• Promote the use of technology in lieu of
printing and copying by converting to an
electronic invoicing and archiving process.
• Continue to retrofit existing facilities, incorpo-
rate sustainability features into the design of
new projects, and reduce waste.
• Achieve ISO 14001:2015 Certification for the
Cerone Division.
• Quantify GHG emissions, set formal reduction
targets, and prepare a Climate Action Plan.
• Provide data for the Low Carbon Fuel
Standard (LCFS) which seeks to put
California on the path to meet its goal of
reducing greenhouse gas emissions to 1990
levels by the year 2020. Under the LCFS, VTA
is eligible to receive credits for the light rail
system. These credits are based on electrical
usage and can be sold to generate additional
revenue.
161605-0683
Santa Clara Valley Transportation Authority
3331 North First Street
San Jose, CA 95134-1927
vta.org/sustainability
(408) 321-7575 • TTY (408) 321-2330