June 2015 - Welcome to GOV.UK 1: Introduction This report focuses on employment in the Creative...
27
Creative Industries: Focus on Employment June 2015 30/06/2015
Transcript of June 2015 - Welcome to GOV.UK 1: Introduction This report focuses on employment in the Creative...

Creative Industries: Focus on Employment
June 2015
30/06/2015

These estimates are Official Statistics and have been produced to the standards set out in the Code of Practice for Official Statistics
Department for Culture, Media & Sport Creative Industries
3
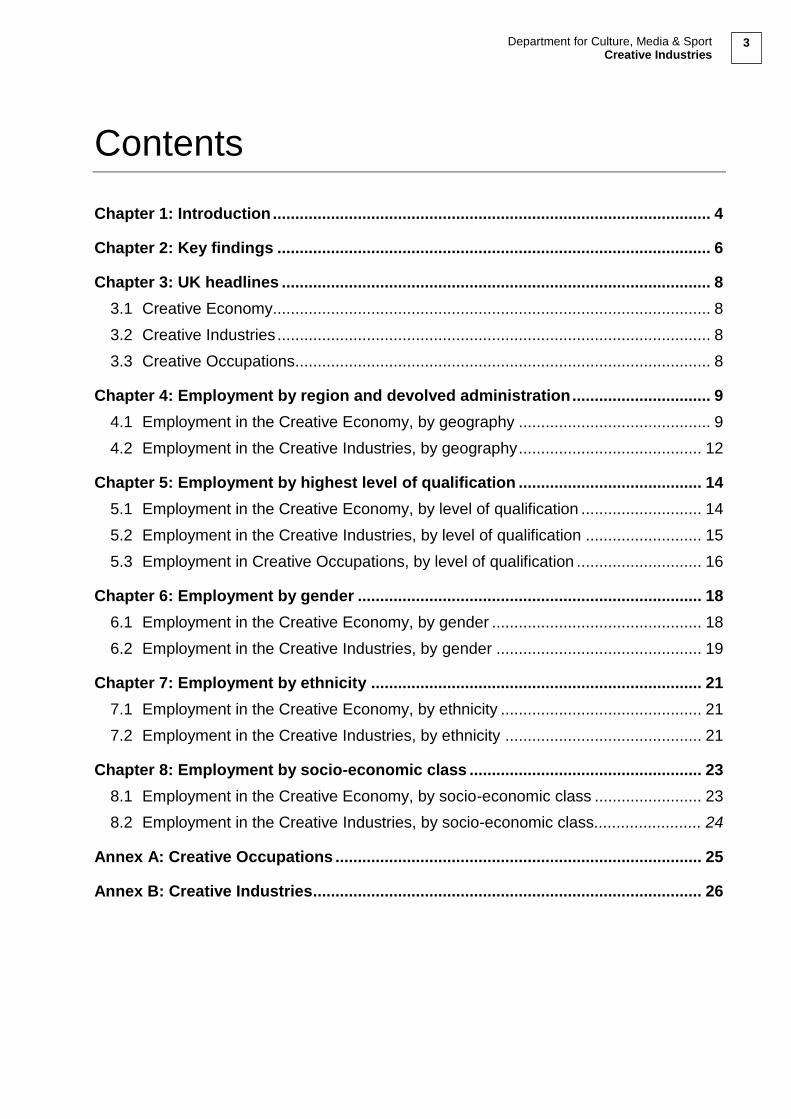
Contents
Chapter 1: Introduction .................................................................................................. 4
Chapter 2: Key findings ................................................................................................. 6
Chapter 3: UK headlines ................................................................................................ 8
3.1 Creative Economy.................................................................................................. 8
3.2 Creative Industries ................................................................................................. 8
3.3 Creative Occupations ............................................................................................. 8
Chapter 4: Employment by region and devolved administration ............................... 9
4.1 Employment in the Creative Economy, by geography ........................................... 9
4.2 Employment in the Creative Industries, by geography ......................................... 12
Chapter 5: Employment by highest level of qualification ......................................... 14
5.1 Employment in the Creative Economy, by level of qualification ........................... 14
5.2 Employment in the Creative Industries, by level of qualification .......................... 15
5.3 Employment in Creative Occupations, by level of qualification ............................ 16
Chapter 6: Employment by gender ............................................................................. 18
6.1 Employment in the Creative Economy, by gender ............................................... 18
6.2 Employment in the Creative Industries, by gender .............................................. 19
Chapter 7: Employment by ethnicity .......................................................................... 21
7.1 Employment in the Creative Economy, by ethnicity ............................................. 21
7.2 Employment in the Creative Industries, by ethnicity ............................................ 21
Chapter 8: Employment by socio-economic class .................................................... 23
8.1 Employment in the Creative Economy, by socio-economic class ........................ 23
8.2 Employment in the Creative Industries, by socio-economic class ........................ 24
Annex A: Creative Occupations .................................................................................. 25
Annex B: Creative Industries ....................................................................................... 26
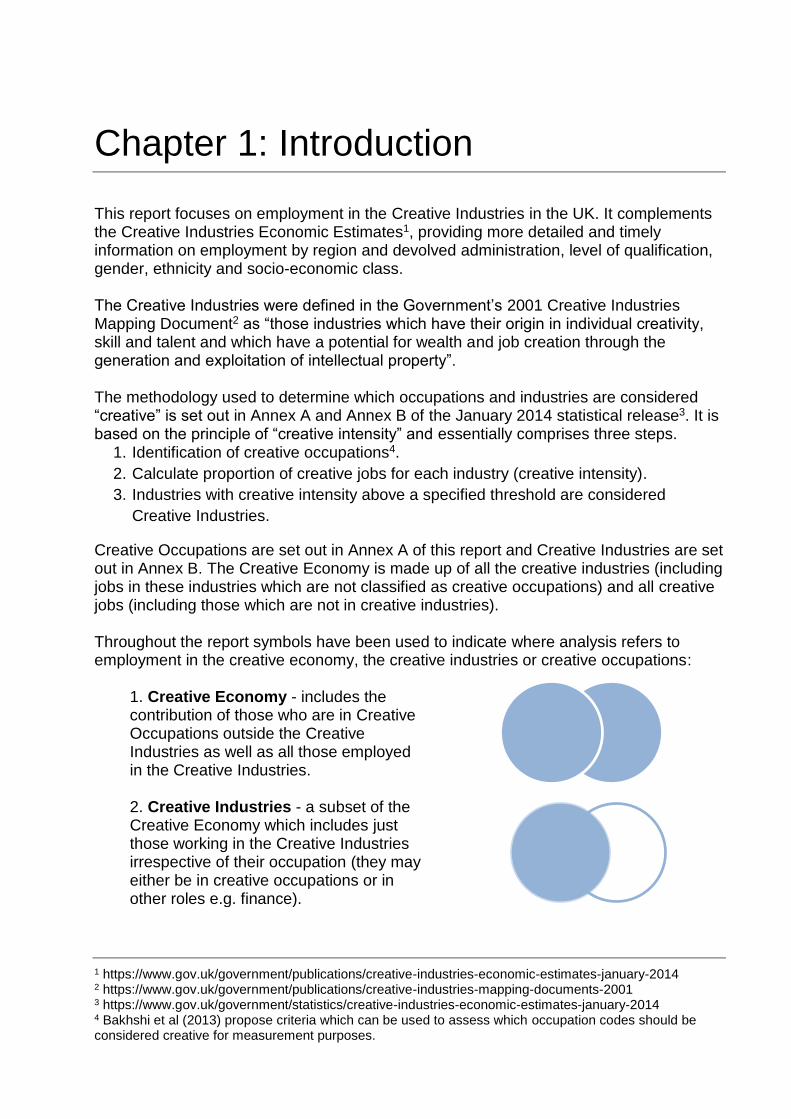
Chapter 1: Introduction
This report focuses on employment in the Creative Industries in the UK. It complements the Creative Industries Economic Estimates1, providing more detailed and timely information on employment by region and devolved administration, level of qualification, gender, ethnicity and socio-economic class. The Creative Industries were defined in the Government’s 2001 Creative Industries Mapping Document2 as “those industries which have their origin in individual creativity, skill and talent and which have a potential for wealth and job creation through the generation and exploitation of intellectual property”. The methodology used to determine which occupations and industries are considered “creative” is set out in Annex A and Annex B of the January 2014 statistical release3. It is based on the principle of “creative intensity” and essentially comprises three steps.
1. Identification of creative occupations4.
2. Calculate proportion of creative jobs for each industry (creative intensity).
3. Industries with creative intensity above a specified threshold are considered
Creative Industries.
Creative Occupations are set out in Annex A of this report and Creative Industries are set out in Annex B. The Creative Economy is made up of all the creative industries (including jobs in these industries which are not classified as creative occupations) and all creative jobs (including those which are not in creative industries). Throughout the report symbols have been used to indicate where analysis refers to employment in the creative economy, the creative industries or creative occupations:
1. Creative Economy - includes the contribution of those who are in Creative Occupations outside the Creative Industries as well as all those employed in the Creative Industries.
2. Creative Industries - a subset of the Creative Economy which includes just those working in the Creative Industries irrespective of their occupation (they may either be in creative occupations or in other roles e.g. finance).
1 https://www.gov.uk/government/publications/creative-industries-economic-estimates-january-2014 2 https://www.gov.uk/government/publications/creative-industries-mapping-documents-2001 3 https://www.gov.uk/government/statistics/creative-industries-economic-estimates-january-2014 4 Bakhshi et al (2013) propose criteria which can be used to assess which occupation codes should be considered creative for measurement purposes.
Department for Culture, Media & Sport Creative Industries
5
3. Creative Occupations - a subset of the Creative Economy which includes all those working in creative occupations, irrespective of the industry that they work in.
Estimates are based on the Annual Population Survey published by the Office for National Statistics (ONS)5. It uses the latest occupational classification (SOC 2010) and the latest industrial classification (SIC 2007). Data in this publication refer to employment from 2011 and 2014, as the updated occupational coding standard (SOC 2010) was introduced in 2011. To provide more detailed breakdowns within the creative industries, the creative sectors have been broken down into nine groups. As far as possible, grouping of industries (SIC 2007) and occupations (SOC 2010) have been selected to contain related industries or occupations and provide consistency between grouped industries and occupations. Full details of the groupings are provided in Annexes A (occupations) and B (industries). The latest data are for 2014. Estimates for 2011 to 2013 have been revised to reflect changes the APS which has been reweighted following the 2011 Census. The impact of these revisions is generally small, the number of jobs in the Creative Economy and Creative Industries increased by 0.3 per cent in the latest estimates. Changes for 2011 are larger but still less than 1 per cent, see table 1. Table 1: Revisions to estimates as a result of reweighting APS
2011 2012 2013
Creative Economy 0.6% 0.3% 0.3%
Creative Industries 0.7% 0.4% 0.3%
There is more variation within Creative Industries Groups and other breakdowns, but in all cases these are reasonably small. However, all comparisons of 2014 results with historic data should be based on the new data published as part of this release.
5 http://www.nomisweb.co.uk/articles/676.aspx
Chapter 2: Key findings
The Creative Economy, the Creative Industries and Creative Occupations, have been defined in the introduction.
Summary
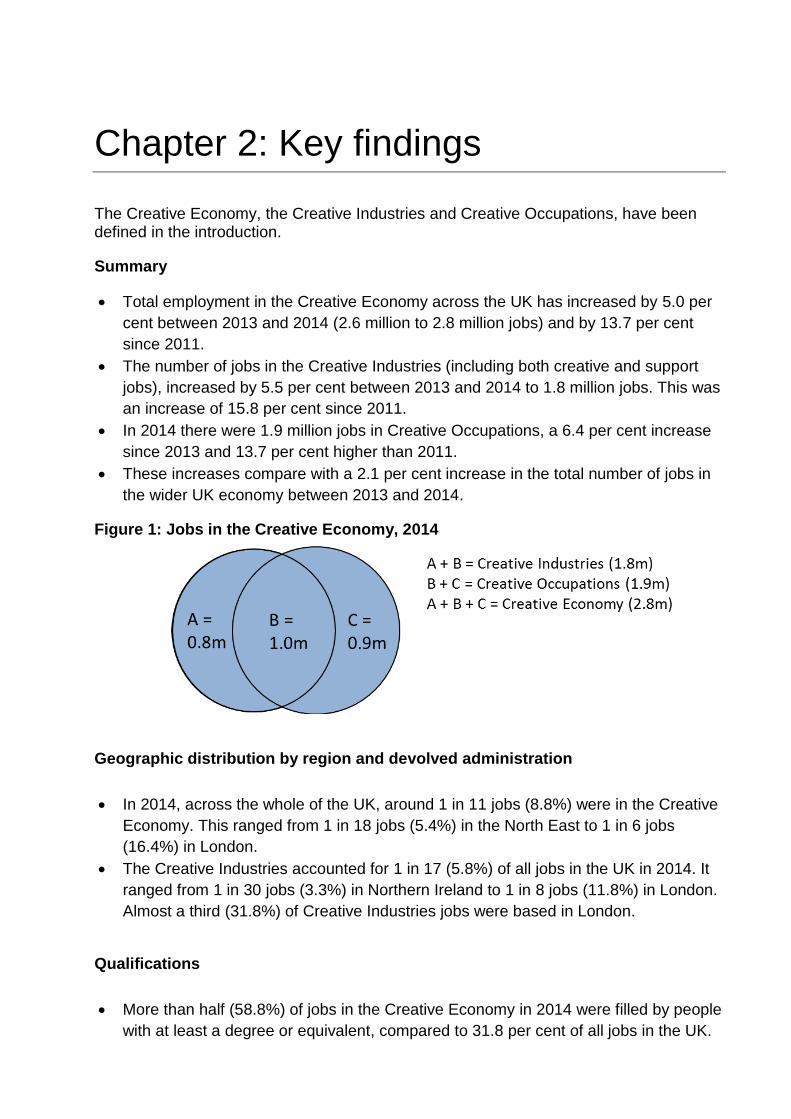
Total employment in the Creative Economy across the UK has increased by 5.0 per
cent between 2013 and 2014 (2.6 million to 2.8 million jobs) and by 13.7 per cent
since 2011.
The number of jobs in the Creative Industries (including both creative and support
jobs), increased by 5.5 per cent between 2013 and 2014 to 1.8 million jobs. This was
an increase of 15.8 per cent since 2011.
In 2014 there were 1.9 million jobs in Creative Occupations, a 6.4 per cent increase
since 2013 and 13.7 per cent higher than 2011.
These increases compare with a 2.1 per cent increase in the total number of jobs in
the wider UK economy between 2013 and 2014.
Figure 1: Jobs in the Creative Economy, 2014
Geographic distribution by region and devolved administration
In 2014, across the whole of the UK, around 1 in 11 jobs (8.8%) were in the Creative
Economy. This ranged from 1 in 18 jobs (5.4%) in the North East to 1 in 6 jobs
(16.4%) in London.
The Creative Industries accounted for 1 in 17 (5.8%) of all jobs in the UK in 2014. It
ranged from 1 in 30 jobs (3.3%) in Northern Ireland to 1 in 8 jobs (11.8%) in London.
Almost a third (31.8%) of Creative Industries jobs were based in London.
Qualifications
More than half (58.8%) of jobs in the Creative Economy in 2014 were filled by people
with at least a degree or equivalent, compared to 31.8 per cent of all jobs in the UK.
Department for Culture, Media & Sport Creative Industries
7
One in every six jobs in the UK held by graduates in 2014 was in the Creative
Economy.
Between 2013 and 2014, there was an increase of 110,000 (7.3%) in the number of
jobs in the Creative Economy held by individuals with at least a degree or equivalent.
Across all industries in 2014, 62.2% of jobs in Creative Occupations were filled by
someone who had at least a degree or equivalent.
Gender
The Creative Economy and Creative Industries employ a lower proportion of women
than the wider UK economy. In 2014:
o 36.1 per cent of jobs in the Creative Economy were filled by women.
o 36.7 percent of jobs in the Creative Industries were filled by women.
o 47.2 per cent of jobs in the UK as a whole were filled by women.
Ethnicity
Of all jobs in the Creative Economy in 2014, 11.0 per cent were filled by BAME
workers, a similar level to the UK economy.
Between 2013 and 2014, there was a 12.5 per cent increase in the number of BAME
group jobs in the Creative Economy. The increase for the White group was 4.0 per
cent.
In Creative Industries in 2014, 11.0 per cent of jobs were filled by BAME workers.
The number of BAME workers in the Creative Industries increase by 8.0 per cent
between 2013 and 2014 (34.3% since 2011), compared with a 5.1 per cent (14.7%
since 2011) increase for White workers in the Creative Industries.
Socio-Economic Class
In 2014, 91.9 per cent of jobs in the Creative Economy were done by people in more
advantaged socio-economic groups (NS-SEC 1-4), compared to 66.0 per cent of
jobs in the wider UK economy.
More advantaged groups made up 92.1 per cent of jobs in the Creative Industries.
Chapter 3: UK headlines
This chapter presents UK employment estimates at for the Creative Economy at a headline level and provides context for the more detailed analysis which follows.
3.1 Creative Economy
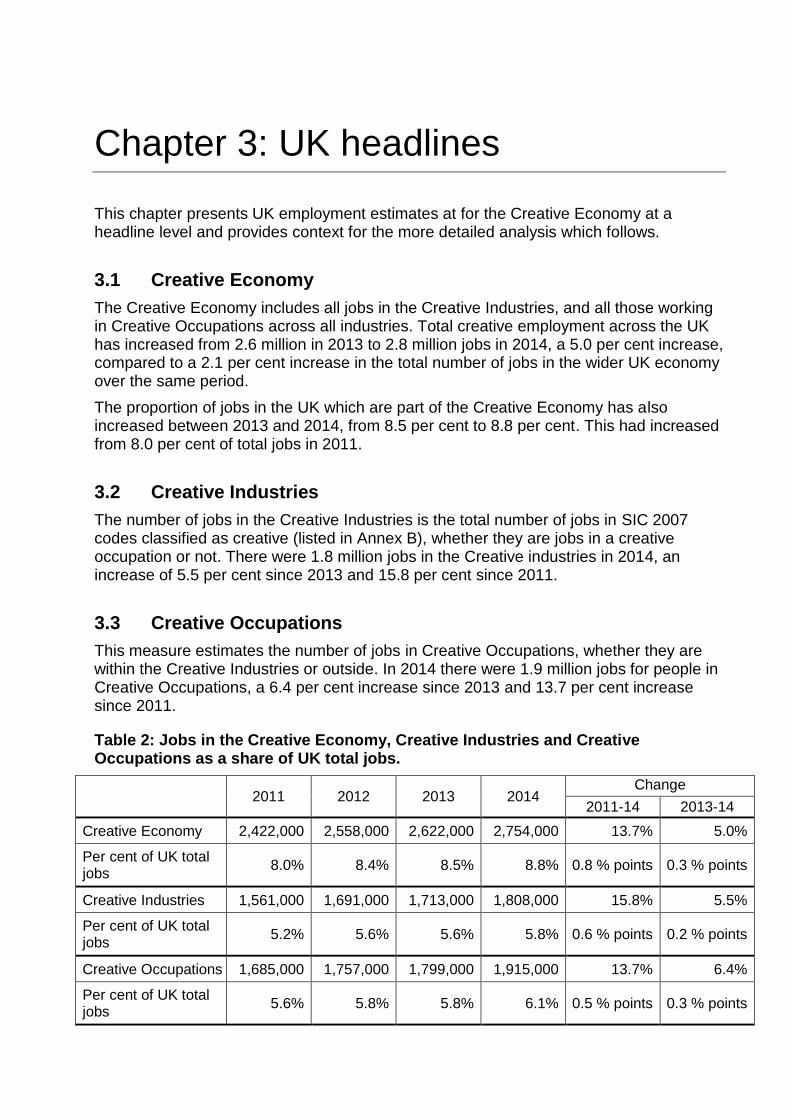
The Creative Economy includes all jobs in the Creative Industries, and all those working in Creative Occupations across all industries. Total creative employment across the UK has increased from 2.6 million in 2013 to 2.8 million jobs in 2014, a 5.0 per cent increase, compared to a 2.1 per cent increase in the total number of jobs in the wider UK economy over the same period.
The proportion of jobs in the UK which are part of the Creative Economy has also increased between 2013 and 2014, from 8.5 per cent to 8.8 per cent. This had increased from 8.0 per cent of total jobs in 2011.
3.2 Creative Industries
The number of jobs in the Creative Industries is the total number of jobs in SIC 2007 codes classified as creative (listed in Annex B), whether they are jobs in a creative occupation or not. There were 1.8 million jobs in the Creative industries in 2014, an increase of 5.5 per cent since 2013 and 15.8 per cent since 2011.
3.3 Creative Occupations
This measure estimates the number of jobs in Creative Occupations, whether they are within the Creative Industries or outside. In 2014 there were 1.9 million jobs for people in Creative Occupations, a 6.4 per cent increase since 2013 and 13.7 per cent increase since 2011.
Table 2: Jobs in the Creative Economy, Creative Industries and Creative Occupations as a share of UK total jobs.
2011 2012 2013 2014 Change
2011-14 2013-14
Creative Economy 2,422,000 2,558,000 2,622,000 2,754,000 13.7% 5.0%
Per cent of UK total jobs
8.0% 8.4% 8.5% 8.8% 0.8 % points 0.3 % points
Creative Industries 1,561,000 1,691,000 1,713,000 1,808,000 15.8% 5.5%
Per cent of UK total jobs
5.2% 5.6% 5.6% 5.8% 0.6 % points 0.2 % points
Creative Occupations 1,685,000 1,757,000 1,799,000 1,915,000 13.7% 6.4%
Per cent of UK total jobs
5.6% 5.8% 5.8% 6.1% 0.5 % points 0.3 % points
Department for Culture, Media & Sport Creative Industries
9
Chapter 4: Employment by region and devolved administration
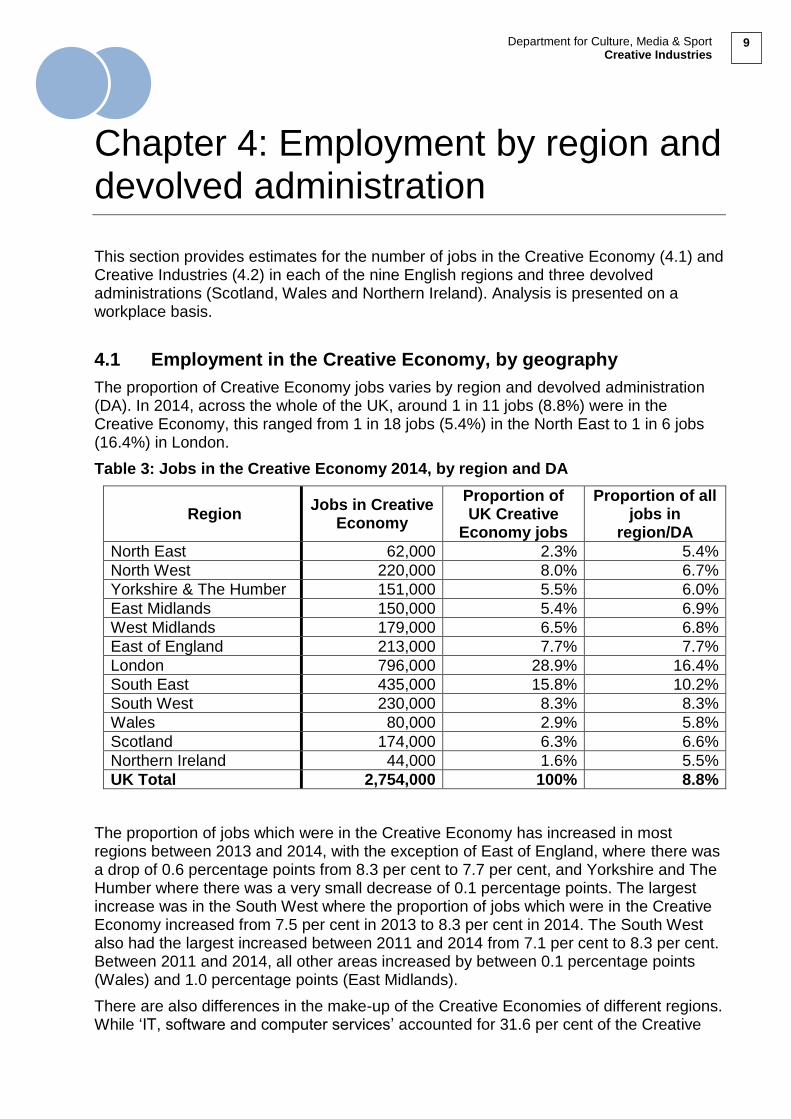
This section provides estimates for the number of jobs in the Creative Economy (4.1) and Creative Industries (4.2) in each of the nine English regions and three devolved administrations (Scotland, Wales and Northern Ireland). Analysis is presented on a workplace basis.
4.1 Employment in the Creative Economy, by geography
The proportion of Creative Economy jobs varies by region and devolved administration (DA). In 2014, across the whole of the UK, around 1 in 11 jobs (8.8%) were in the Creative Economy, this ranged from 1 in 18 jobs (5.4%) in the North East to 1 in 6 jobs (16.4%) in London.
Table 3: Jobs in the Creative Economy 2014, by region and DA
Region Jobs in Creative
Economy
Proportion of UK Creative
Economy jobs
Proportion of all jobs in
region/DA
North East 62,000 2.3% 5.4%
North West 220,000 8.0% 6.7%
Yorkshire & The Humber 151,000 5.5% 6.0%
East Midlands 150,000 5.4% 6.9%
West Midlands 179,000 6.5% 6.8%
East of England 213,000 7.7% 7.7%
London 796,000 28.9% 16.4%
South East 435,000 15.8% 10.2%
South West 230,000 8.3% 8.3%
Wales 80,000 2.9% 5.8%
Scotland 174,000 6.3% 6.6%
Northern Ireland 44,000 1.6% 5.5%
UK Total 2,754,000 100% 8.8%
The proportion of jobs which were in the Creative Economy has increased in most regions between 2013 and 2014, with the exception of East of England, where there was a drop of 0.6 percentage points from 8.3 per cent to 7.7 per cent, and Yorkshire and The Humber where there was a very small decrease of 0.1 percentage points. The largest increase was in the South West where the proportion of jobs which were in the Creative Economy increased from 7.5 per cent in 2013 to 8.3 per cent in 2014. The South West also had the largest increased between 2011 and 2014 from 7.1 per cent to 8.3 per cent. Between 2011 and 2014, all other areas increased by between 0.1 percentage points (Wales) and 1.0 percentage points (East Midlands).
There are also differences in the make-up of the Creative Economies of different regions. While ‘IT, software and computer services’ accounted for 31.6 per cent of the Creative
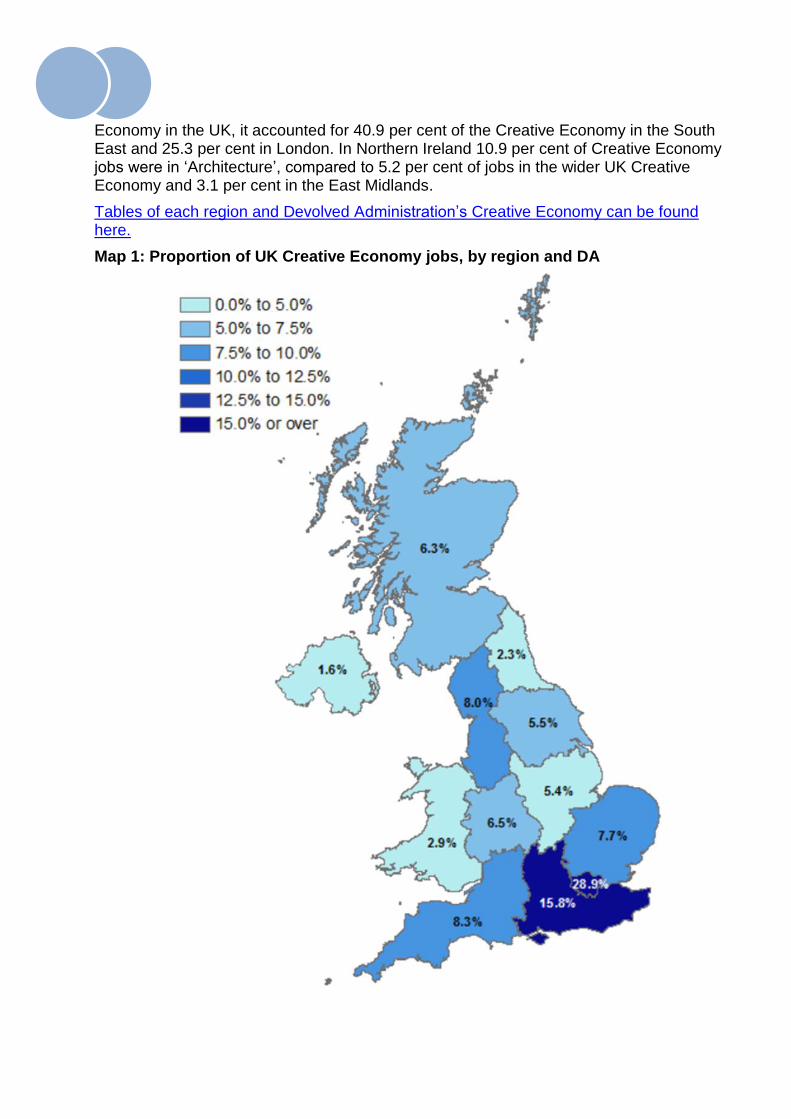
Economy in the UK, it accounted for 40.9 per cent of the Creative Economy in the South East and 25.3 per cent in London. In Northern Ireland 10.9 per cent of Creative Economy jobs were in ‘Architecture’, compared to 5.2 per cent of jobs in the wider UK Creative Economy and 3.1 per cent in the East Midlands.
Tables of each region and Devolved Administration’s Creative Economy can be found here.
Map 1: Proportion of UK Creative Economy jobs, by region and DA

Department for Culture, Media & Sport Creative Industries
11
Figure 2: proportion of jobs in the Creative Economy, by region and year
4.5%
6.0%
5.7%
5.9%
5.9%
7.1%
15.5%
9.8%
7.1%
5.7%
6.4%
5.3%
8.0%
5.4%
6.7%
6.0%
6.9%
6.8%
7.7%
16.4%
10.2%
8.3%
5.8%
6.6%
5.5%
8.8%
0.0% 2.0% 4.0% 6.0% 8.0% 10.0% 12.0% 14.0% 16.0% 18.0%
North East
North West
Yorkshire and the Humber
East Midlands
West Midlands
East of England
London
South East
South West
Wales
Scotland
Northern Ireland
UK
2011 2012 2013 2014
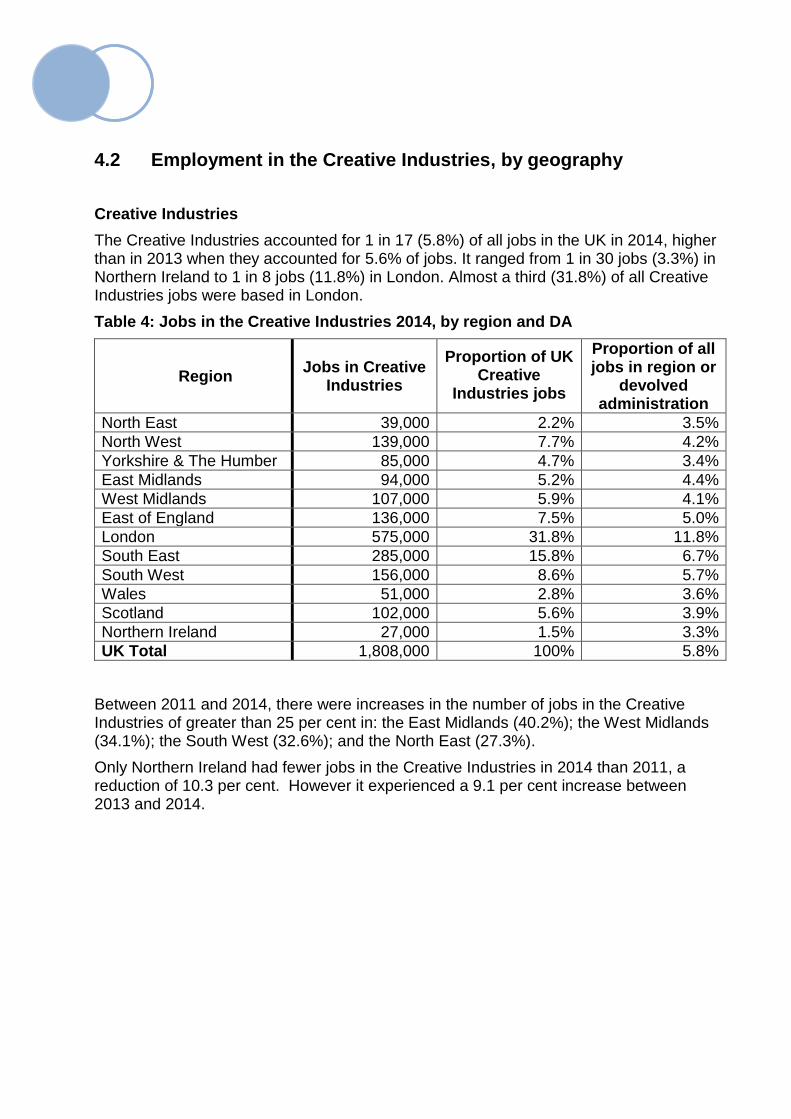
4.2 Employment in the Creative Industries, by geography
Creative Industries
The Creative Industries accounted for 1 in 17 (5.8%) of all jobs in the UK in 2014, higher than in 2013 when they accounted for 5.6% of jobs. It ranged from 1 in 30 jobs (3.3%) in Northern Ireland to 1 in 8 jobs (11.8%) in London. Almost a third (31.8%) of all Creative Industries jobs were based in London.
Table 4: Jobs in the Creative Industries 2014, by region and DA
Region Jobs in Creative
Industries
Proportion of UK Creative
Industries jobs
Proportion of all jobs in region or
devolved administration
North East 39,000 2.2% 3.5%
North West 139,000 7.7% 4.2%
Yorkshire & The Humber 85,000 4.7% 3.4%
East Midlands 94,000 5.2% 4.4%
West Midlands 107,000 5.9% 4.1%
East of England 136,000 7.5% 5.0%
London 575,000 31.8% 11.8%
South East 285,000 15.8% 6.7%
South West 156,000 8.6% 5.7%
Wales 51,000 2.8% 3.6%
Scotland 102,000 5.6% 3.9%
Northern Ireland 27,000 1.5% 3.3%
UK Total 1,808,000 100% 5.8%
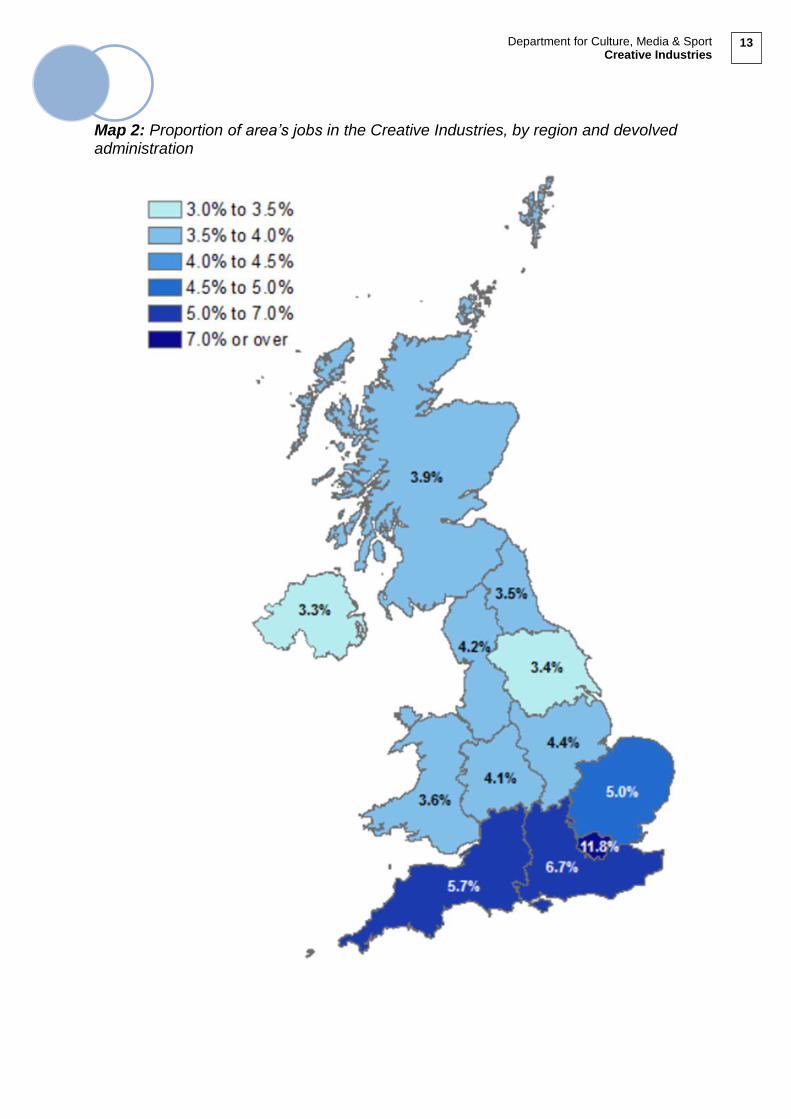
Between 2011 and 2014, there were increases in the number of jobs in the Creative Industries of greater than 25 per cent in: the East Midlands (40.2%); the West Midlands (34.1%); the South West (32.6%); and the North East (27.3%).
Only Northern Ireland had fewer jobs in the Creative Industries in 2014 than 2011, a reduction of 10.3 per cent. However it experienced a 9.1 per cent increase between 2013 and 2014.
Department for Culture, Media & Sport Creative Industries
13
Map 2: Proportion of area’s jobs in the Creative Industries, by region and devolved administration
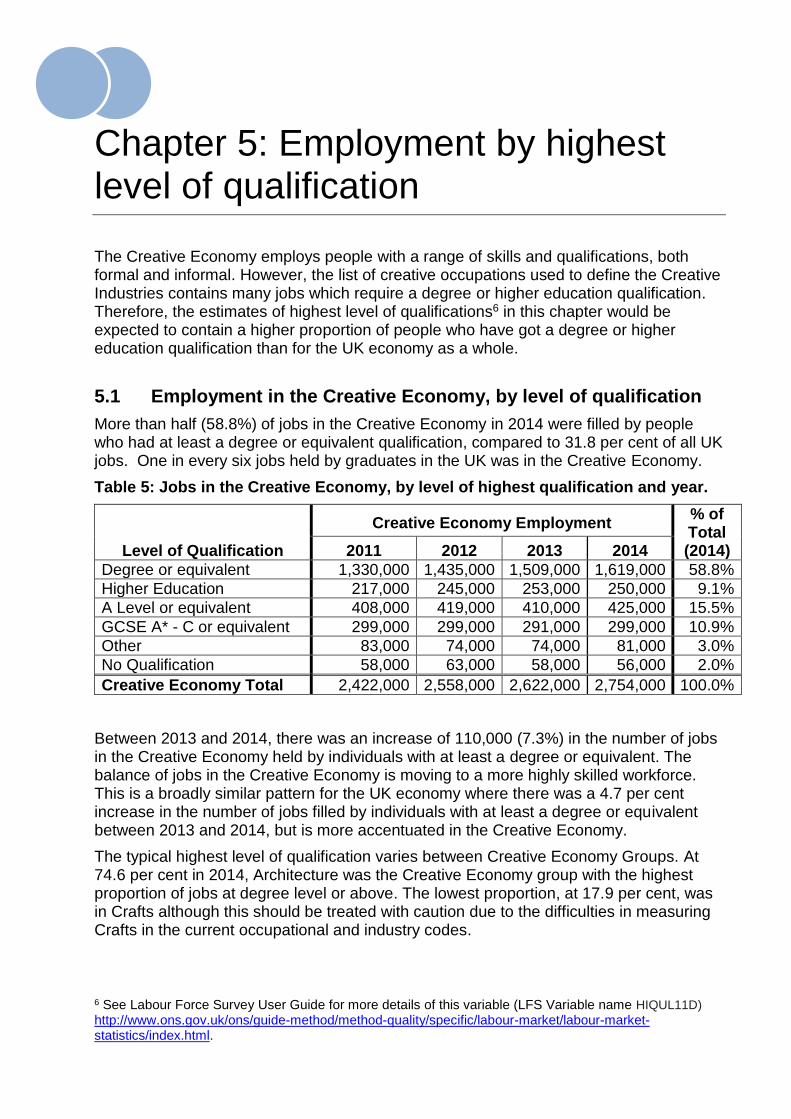
Chapter 5: Employment by highest level of qualification
The Creative Economy employs people with a range of skills and qualifications, both formal and informal. However, the list of creative occupations used to define the Creative Industries contains many jobs which require a degree or higher education qualification. Therefore, the estimates of highest level of qualifications6 in this chapter would be expected to contain a higher proportion of people who have got a degree or higher education qualification than for the UK economy as a whole.
5.1 Employment in the Creative Economy, by level of qualification
More than half (58.8%) of jobs in the Creative Economy in 2014 were filled by people who had at least a degree or equivalent qualification, compared to 31.8 per cent of all UK jobs. One in every six jobs held by graduates in the UK was in the Creative Economy.
Table 5: Jobs in the Creative Economy, by level of highest qualification and year.
Level of Qualification
Creative Economy Employment % of Total (2014) 2011 2012 2013 2014
Degree or equivalent 1,330,000 1,435,000 1,509,000 1,619,000 58.8%
Higher Education 217,000 245,000 253,000 250,000 9.1%
A Level or equivalent 408,000 419,000 410,000 425,000 15.5%
GCSE A* - C or equivalent 299,000 299,000 291,000 299,000 10.9%
Other 83,000 74,000 74,000 81,000 3.0%
No Qualification 58,000 63,000 58,000 56,000 2.0%
Creative Economy Total 2,422,000 2,558,000 2,622,000 2,754,000 100.0%
Between 2013 and 2014, there was an increase of 110,000 (7.3%) in the number of jobs in the Creative Economy held by individuals with at least a degree or equivalent. The balance of jobs in the Creative Economy is moving to a more highly skilled workforce. This is a broadly similar pattern for the UK economy where there was a 4.7 per cent increase in the number of jobs filled by individuals with at least a degree or equivalent between 2013 and 2014, but is more accentuated in the Creative Economy.
The typical highest level of qualification varies between Creative Economy Groups. At 74.6 per cent in 2014, Architecture was the Creative Economy group with the highest proportion of jobs at degree level or above. The lowest proportion, at 17.9 per cent, was in Crafts although this should be treated with caution due to the difficulties in measuring Crafts in the current occupational and industry codes.
6 See Labour Force Survey User Guide for more details of this variable (LFS Variable name HIQUL11D)
http://www.ons.gov.uk/ons/guide-method/method-quality/specific/labour-market/labour-market-statistics/index.html.
Department for Culture, Media & Sport Creative Industries
15
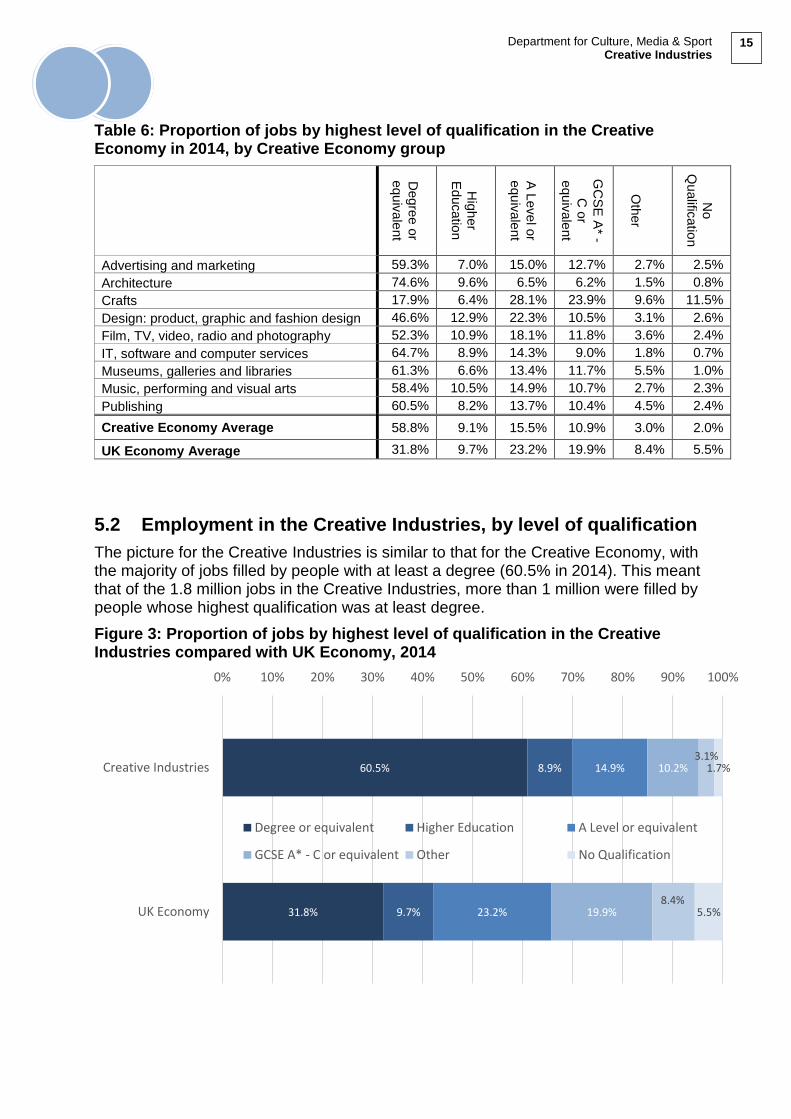
Table 6: Proportion of jobs by highest level of qualification in the Creative Economy in 2014, by Creative Economy group
Degre
e o
r
equ
ivale
nt
Hig
her
Educatio
n
A L
eve
l or
equ
ivale
nt
GC
SE
A* -
C o
r equ
ivale
nt
Oth
er
No
Qualific
atio
n
Advertising and marketing 59.3% 7.0% 15.0% 12.7% 2.7% 2.5%
Architecture 74.6% 9.6% 6.5% 6.2% 1.5% 0.8%
Crafts 17.9% 6.4% 28.1% 23.9% 9.6% 11.5%
Design: product, graphic and fashion design 46.6% 12.9% 22.3% 10.5% 3.1% 2.6%
Film, TV, video, radio and photography 52.3% 10.9% 18.1% 11.8% 3.6% 2.4%
IT, software and computer services 64.7% 8.9% 14.3% 9.0% 1.8% 0.7%
Museums, galleries and libraries 61.3% 6.6% 13.4% 11.7% 5.5% 1.0%
Music, performing and visual arts 58.4% 10.5% 14.9% 10.7% 2.7% 2.3%
Publishing 60.5% 8.2% 13.7% 10.4% 4.5% 2.4%
Creative Economy Average 58.8% 9.1% 15.5% 10.9% 3.0% 2.0%
UK Economy Average 31.8% 9.7% 23.2% 19.9% 8.4% 5.5%
5.2 Employment in the Creative Industries, by level of qualification
The picture for the Creative Industries is similar to that for the Creative Economy, with the majority of jobs filled by people with at least a degree (60.5% in 2014). This meant that of the 1.8 million jobs in the Creative Industries, more than 1 million were filled by people whose highest qualification was at least degree.
Figure 3: Proportion of jobs by highest level of qualification in the Creative Industries compared with UK Economy, 2014
60.5%
31.8%
8.9%
9.7%
14.9%
23.2%
10.2%
19.9%
3.1%
8.4%
1.7%
5.5%
0% 10% 20% 30% 40% 50% 60% 70% 80% 90% 100%
Creative Industries
UK Economy
Degree or equivalent Higher Education A Level or equivalent
GCSE A* - C or equivalent Other No Qualification
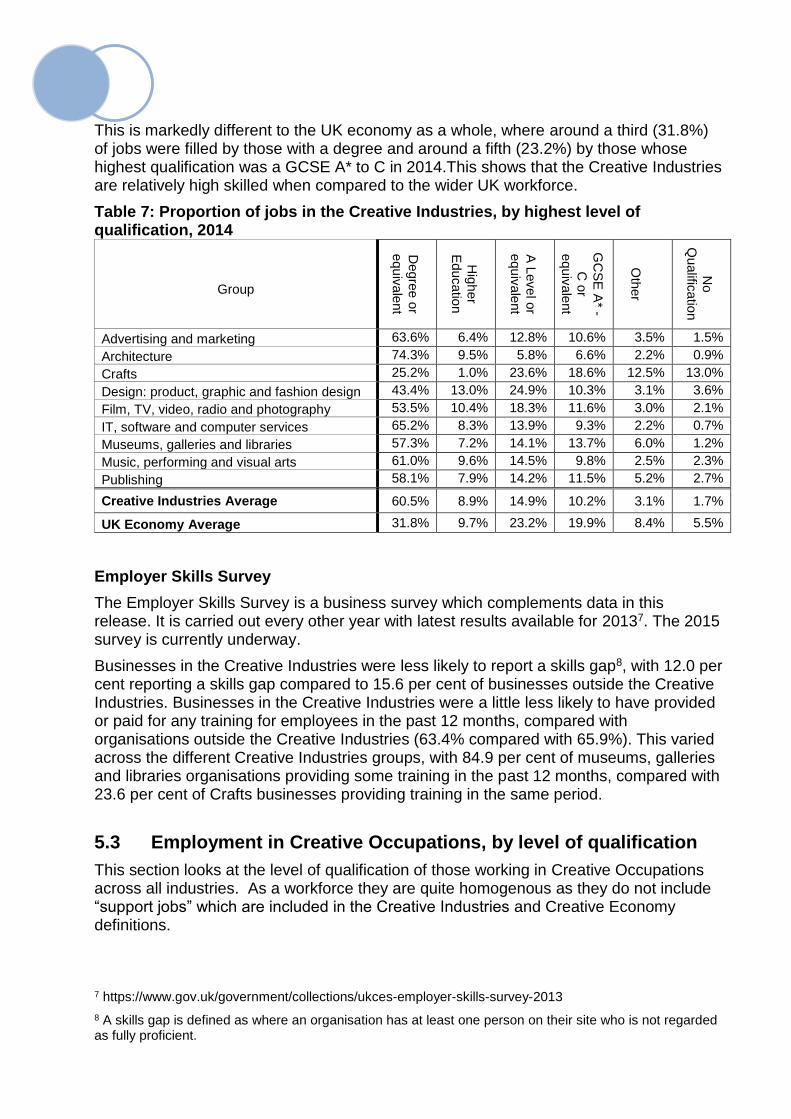
This is markedly different to the UK economy as a whole, where around a third (31.8%) of jobs were filled by those with a degree and around a fifth (23.2%) by those whose highest qualification was a GCSE A* to C in 2014.This shows that the Creative Industries are relatively high skilled when compared to the wider UK workforce.
Table 7: Proportion of jobs in the Creative Industries, by highest level of qualification, 2014
Group
Degre
e o
r
equ
ivale
nt
Hig
her
Educatio
n
A L
eve
l or
equ
ivale
nt
GC
SE
A* -
C o
r equ
ivale
nt
Oth
er
No
Qualific
atio
n
Advertising and marketing 63.6% 6.4% 12.8% 10.6% 3.5% 1.5%
Architecture 74.3% 9.5% 5.8% 6.6% 2.2% 0.9%
Crafts 25.2% 1.0% 23.6% 18.6% 12.5% 13.0%
Design: product, graphic and fashion design 43.4% 13.0% 24.9% 10.3% 3.1% 3.6%
Film, TV, video, radio and photography 53.5% 10.4% 18.3% 11.6% 3.0% 2.1%
IT, software and computer services 65.2% 8.3% 13.9% 9.3% 2.2% 0.7%
Museums, galleries and libraries 57.3% 7.2% 14.1% 13.7% 6.0% 1.2%
Music, performing and visual arts 61.0% 9.6% 14.5% 9.8% 2.5% 2.3%
Publishing 58.1% 7.9% 14.2% 11.5% 5.2% 2.7%
Creative Industries Average 60.5% 8.9% 14.9% 10.2% 3.1% 1.7%
UK Economy Average 31.8% 9.7% 23.2% 19.9% 8.4% 5.5%
Employer Skills Survey
The Employer Skills Survey is a business survey which complements data in this release. It is carried out every other year with latest results available for 20137. The 2015 survey is currently underway.
Businesses in the Creative Industries were less likely to report a skills gap8, with 12.0 per cent reporting a skills gap compared to 15.6 per cent of businesses outside the Creative Industries. Businesses in the Creative Industries were a little less likely to have provided or paid for any training for employees in the past 12 months, compared with organisations outside the Creative Industries (63.4% compared with 65.9%). This varied across the different Creative Industries groups, with 84.9 per cent of museums, galleries and libraries organisations providing some training in the past 12 months, compared with 23.6 per cent of Crafts businesses providing training in the same period.
5.3 Employment in Creative Occupations, by level of qualification
This section looks at the level of qualification of those working in Creative Occupations across all industries. As a workforce they are quite homogenous as they do not include “support jobs” which are included in the Creative Industries and Creative Economy definitions.
7 https://www.gov.uk/government/collections/ukces-employer-skills-survey-2013
8 A skills gap is defined as where an organisation has at least one person on their site who is not regarded as fully proficient.
Department for Culture, Media & Sport Creative Industries
17
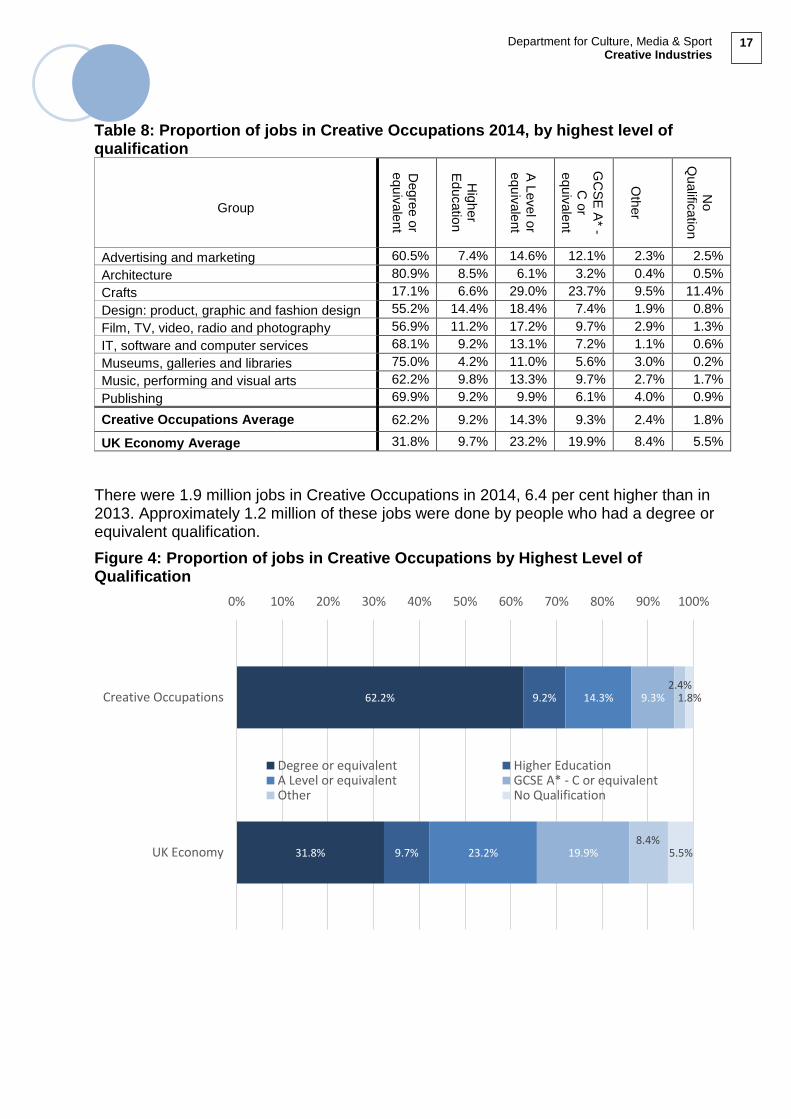
Table 8: Proportion of jobs in Creative Occupations 2014, by highest level of qualification
Group
Degre
e o
r
equ
ivale
nt
Hig
her
Educatio
n
A L
eve
l or
equ
ivale
nt
GC
SE
A* -
C o
r equ
ivale
nt
Oth
er
No
Qualific
atio
n
Advertising and marketing 60.5% 7.4% 14.6% 12.1% 2.3% 2.5%
Architecture 80.9% 8.5% 6.1% 3.2% 0.4% 0.5%
Crafts 17.1% 6.6% 29.0% 23.7% 9.5% 11.4%
Design: product, graphic and fashion design 55.2% 14.4% 18.4% 7.4% 1.9% 0.8%
Film, TV, video, radio and photography 56.9% 11.2% 17.2% 9.7% 2.9% 1.3%
IT, software and computer services 68.1% 9.2% 13.1% 7.2% 1.1% 0.6%
Museums, galleries and libraries 75.0% 4.2% 11.0% 5.6% 3.0% 0.2%
Music, performing and visual arts 62.2% 9.8% 13.3% 9.7% 2.7% 1.7%
Publishing 69.9% 9.2% 9.9% 6.1% 4.0% 0.9%
Creative Occupations Average 62.2% 9.2% 14.3% 9.3% 2.4% 1.8%
UK Economy Average 31.8% 9.7% 23.2% 19.9% 8.4% 5.5%
There were 1.9 million jobs in Creative Occupations in 2014, 6.4 per cent higher than in 2013. Approximately 1.2 million of these jobs were done by people who had a degree or equivalent qualification.
Figure 4: Proportion of jobs in Creative Occupations by Highest Level of Qualification
62.2%
31.8%
9.2%
9.7%
14.3%
23.2%
9.3%
19.9%
2.4%
8.4%
1.8%
5.5%
0% 10% 20% 30% 40% 50% 60% 70% 80% 90% 100%
Creative Occupations
UK Economy
Degree or equivalent Higher EducationA Level or equivalent GCSE A* - C or equivalentOther No Qualification
Chapter 6: Employment by gender
In 2014, women held 47.2 per cent of all jobs in the UK workforce. This was the same as 2013 and similar to 2011, when the proportion of jobs filled by women was 46.9 per cent.
6.1 Employment in the Creative Economy, by gender
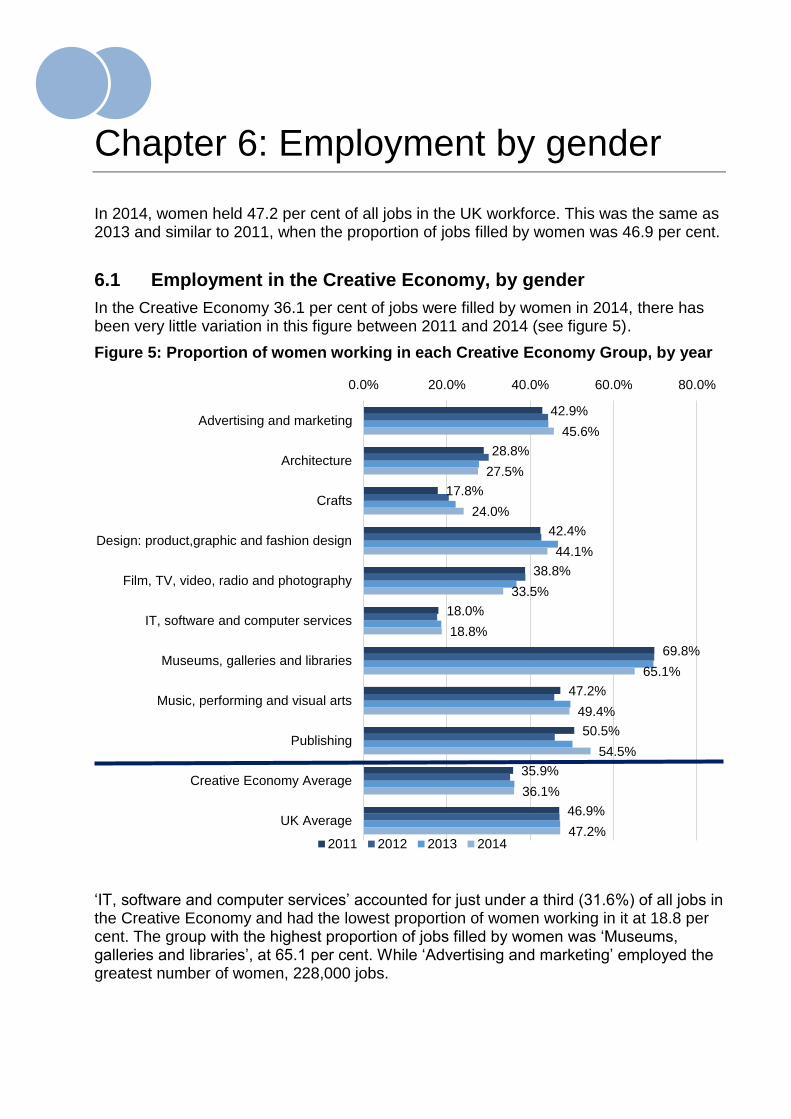
In the Creative Economy 36.1 per cent of jobs were filled by women in 2014, there has been very little variation in this figure between 2011 and 2014 (see figure 5).
Figure 5: Proportion of women working in each Creative Economy Group, by year
‘IT, software and computer services’ accounted for just under a third (31.6%) of all jobs in the Creative Economy and had the lowest proportion of women working in it at 18.8 per cent. The group with the highest proportion of jobs filled by women was ‘Museums, galleries and libraries’, at 65.1 per cent. While ‘Advertising and marketing’ employed the greatest number of women, 228,000 jobs.
42.9%
28.8%
17.8%
42.4%
38.8%
18.0%
69.8%
47.2%
50.5%
35.9%
46.9%
45.6%
27.5%
24.0%
44.1%
33.5%
18.8%
65.1%
49.4%
54.5%
36.1%
47.2%
0.0% 20.0% 40.0% 60.0% 80.0%
Advertising and marketing
Architecture
Crafts
Design: product,graphic and fashion design
Film, TV, video, radio and photography
IT, software and computer services
Museums, galleries and libraries
Music, performing and visual arts
Publishing
Creative Economy Average
UK Average
2011 2012 2013 2014
Department for Culture, Media & Sport Creative Industries
19
6.2 Employment in the Creative Industries, by gender
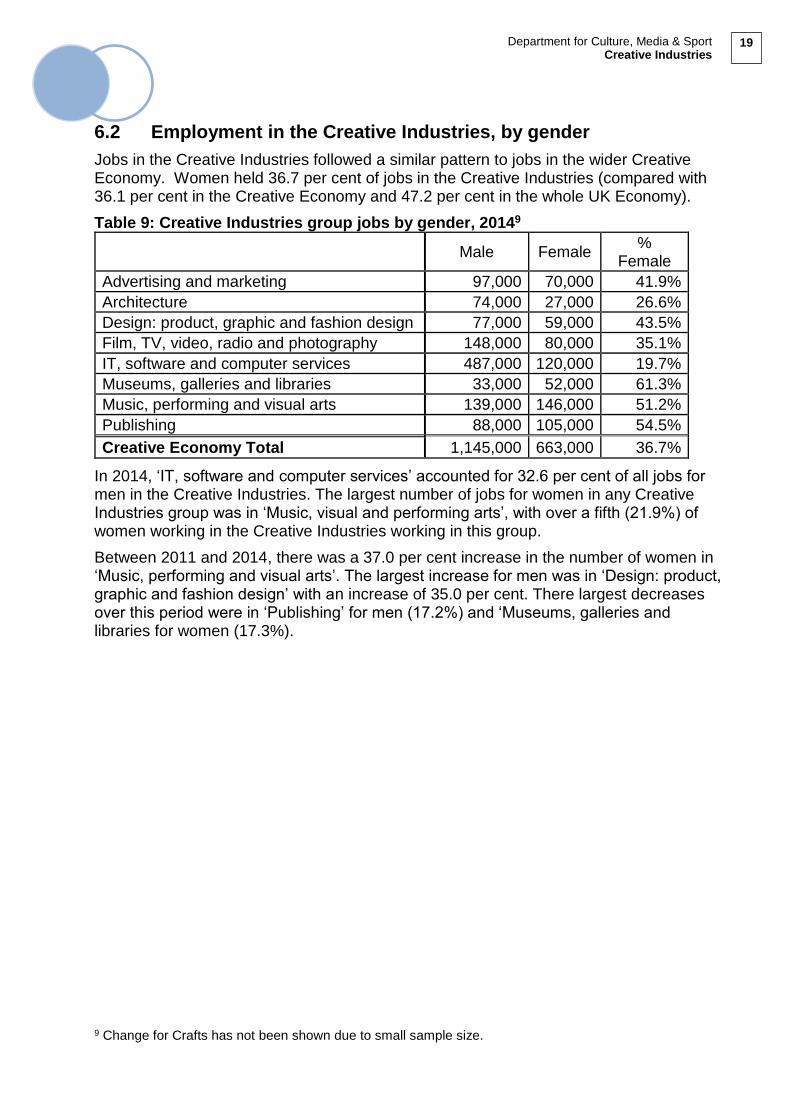
Jobs in the Creative Industries followed a similar pattern to jobs in the wider Creative Economy. Women held 36.7 per cent of jobs in the Creative Industries (compared with 36.1 per cent in the Creative Economy and 47.2 per cent in the whole UK Economy).
Table 9: Creative Industries group jobs by gender, 20149
Male Female %
Female
Advertising and marketing 97,000 70,000 41.9%
Architecture 74,000 27,000 26.6%
Design: product, graphic and fashion design 77,000 59,000 43.5%
Film, TV, video, radio and photography 148,000 80,000 35.1%
IT, software and computer services 487,000 120,000 19.7%
Museums, galleries and libraries 33,000 52,000 61.3%
Music, performing and visual arts 139,000 146,000 51.2%
Publishing 88,000 105,000 54.5%
Creative Economy Total 1,145,000 663,000 36.7%
In 2014, ‘IT, software and computer services’ accounted for 32.6 per cent of all jobs for men in the Creative Industries. The largest number of jobs for women in any Creative Industries group was in ‘Music, visual and performing arts’, with over a fifth (21.9%) of women working in the Creative Industries working in this group.
Between 2011 and 2014, there was a 37.0 per cent increase in the number of women in ‘Music, performing and visual arts’. The largest increase for men was in ‘Design: product, graphic and fashion design’ with an increase of 35.0 per cent. There largest decreases over this period were in ‘Publishing’ for men (17.2%) and ‘Museums, galleries and libraries for women (17.3%).
9 Change for Crafts has not been shown due to small sample size.

Figure 6: Proportion of jobs in each Creative Industries Group between 2011 and 2014, by gender10
10 Change for Crafts has not been shown due to small sample size.
45.5%
29.3%
44.1%
39.7%
19.8%
68.8%
49.8%
49.6%
38.2%
46.9%
41.9%
26.6%
43.5%
35.1%
19.7%
61.3%
51.2%
54.5%
36.7%
47.2%
0.0% 10.0% 20.0% 30.0% 40.0% 50.0% 60.0% 70.0% 80.0%
Advertising and marketing
Architecture
Crafts
Design: product,graphic and fashion design
Film, TV, video, radio and photography
IT, software and computer services
Museums, galleries and libraries
Music, performing and visual arts
Publishing
Creative Industries Average
UK Average
Department for Culture, Media & Sport Creative Industries
21
Chapter 7: Employment by ethnicity
In the UK, across all industries, 11.0 per cent of jobs were filled by people from Black, Asian and Minority Ethnic (BAME) groups in 2014. This is an increase from 10.4 per cent in 2013 and 10.1 per cent in 2011.
7.1 Employment in the Creative Economy, by ethnicity
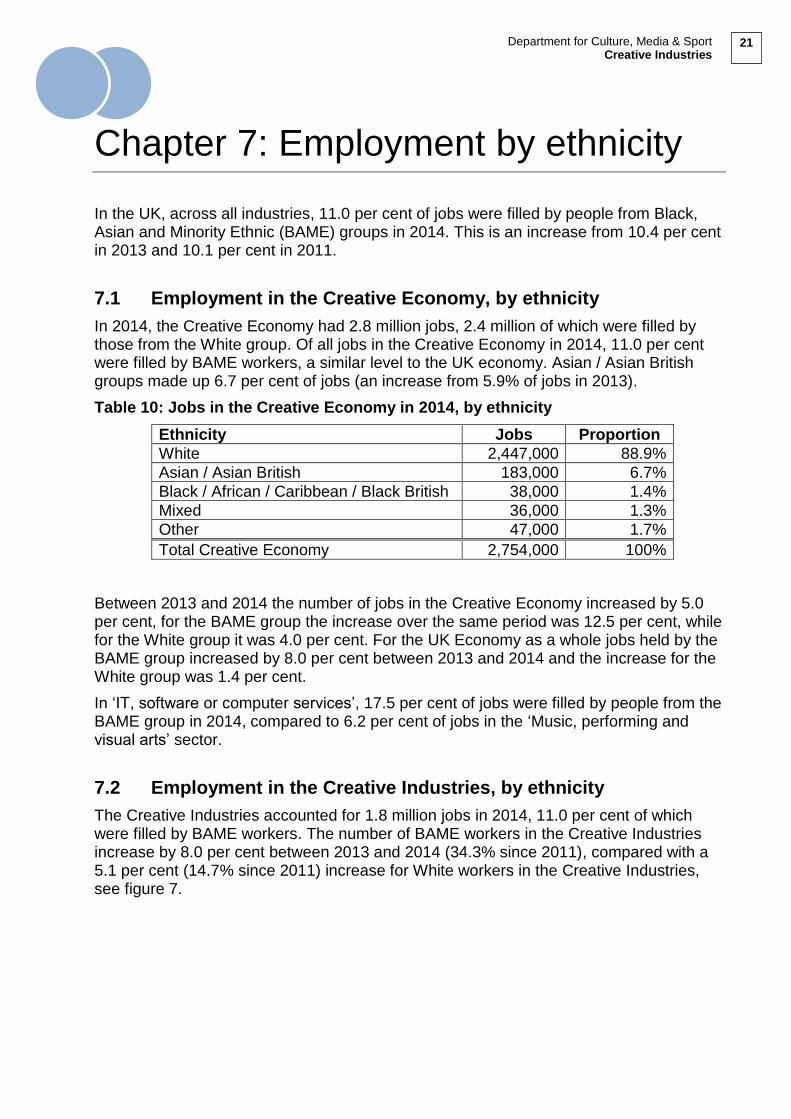
In 2014, the Creative Economy had 2.8 million jobs, 2.4 million of which were filled by those from the White group. Of all jobs in the Creative Economy in 2014, 11.0 per cent were filled by BAME workers, a similar level to the UK economy. Asian / Asian British groups made up 6.7 per cent of jobs (an increase from 5.9% of jobs in 2013).
Table 10: Jobs in the Creative Economy in 2014, by ethnicity
Ethnicity Jobs Proportion
White 2,447,000 88.9%
Asian / Asian British 183,000 6.7%
Black / African / Caribbean / Black British 38,000 1.4%
Mixed 36,000 1.3%
Other 47,000 1.7%
Total Creative Economy 2,754,000 100%
Between 2013 and 2014 the number of jobs in the Creative Economy increased by 5.0 per cent, for the BAME group the increase over the same period was 12.5 per cent, while for the White group it was 4.0 per cent. For the UK Economy as a whole jobs held by the BAME group increased by 8.0 per cent between 2013 and 2014 and the increase for the White group was 1.4 per cent.
In ‘IT, software or computer services’, 17.5 per cent of jobs were filled by people from the BAME group in 2014, compared to 6.2 per cent of jobs in the ‘Music, performing and visual arts’ sector.
7.2 Employment in the Creative Industries, by ethnicity
The Creative Industries accounted for 1.8 million jobs in 2014, 11.0 per cent of which were filled by BAME workers. The number of BAME workers in the Creative Industries increase by 8.0 per cent between 2013 and 2014 (34.3% since 2011), compared with a 5.1 per cent (14.7% since 2011) increase for White workers in the Creative Industries, see figure 7.
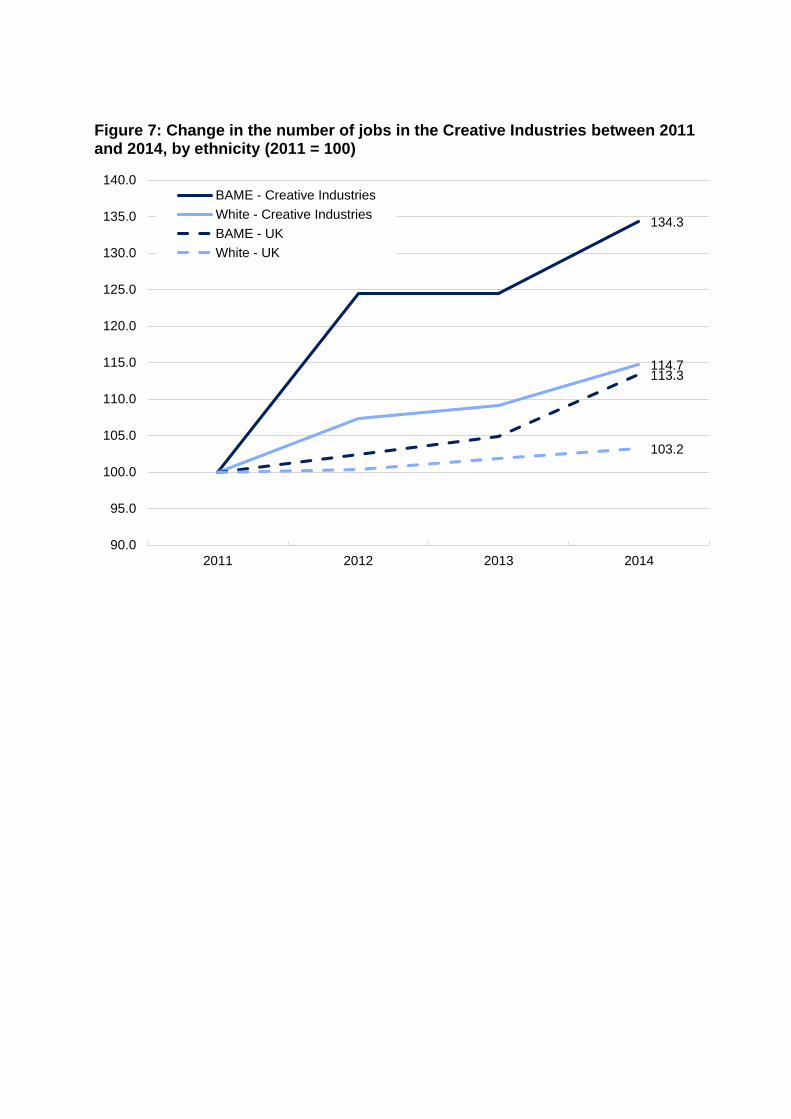
Figure 7: Change in the number of jobs in the Creative Industries between 2011 and 2014, by ethnicity (2011 = 100)
134.3
114.7113.3
103.2
90.0
95.0
100.0
105.0
110.0
115.0
120.0
125.0
130.0
135.0
140.0
2011 2012 2013 2014
BAME - Creative Industries
White - Creative Industries
BAME - UK
White - UK
Department for Culture, Media & Sport Creative Industries
23
Chapter 8: Employment by socio-economic class
This report uses the National Statistics Socio-economic Classification (NS-SEC)11 to analyse socio-economic class. NS-SEC was constructed to measure the employment relations and conditions of occupations, which are central to showing the structure of socio-economic positions in modern societies.
The NS-SEC is an occupationally based classification. Occupations which form the Creative Industries are generally higher skilled, therefore the Creative Industries and Creative Economy include a higher proportion of jobs held by people in more advantaged groups than the UK average.
The term ‘more advantaged groups’ refers to NS-SEC 1-4, with ‘less-advantaged groups’ referring to NS-SEC 5-8. In the UK as a whole, two thirds (66.0%) of jobs were done by people from more advantaged groups, and one third (34.0%) by those in less advantaged groups.
8.1 Employment in the Creative Economy, by socio-economic class
Of the 2.8m jobs in the Creative Economy, 2.5m (91.9%) were done by people from the more advantaged group, with 0.22m (8.1%) done by those from less advantaged groups.
Between 2011 and 2014 the number of jobs which were done by those in the more advantaged group increased by 14.7 per cent, while the number of jobs done by those in less advantaged groups increased by just 3.4 per cent. The respective increases for those groups in the wider UK economy were 5.2 per cent for the more advantaged group and 2.5 per cent for the less advantaged group.
In 2014, 57.1 per cent of jobs in the Crafts industry, or Crafts jobs outside the crafts industry, were done by those in the less advantaged group, compared to 1.3 per cent of jobs in Architecture occupations or the Architecture industry, see Table 11.
11 http://www.ons.gov.uk/ons/guide-method/classifications/current-standard-classifications/soc2010/soc2010-volume-3-ns-sec--rebased-on-soc2010--user-manual/index.html.
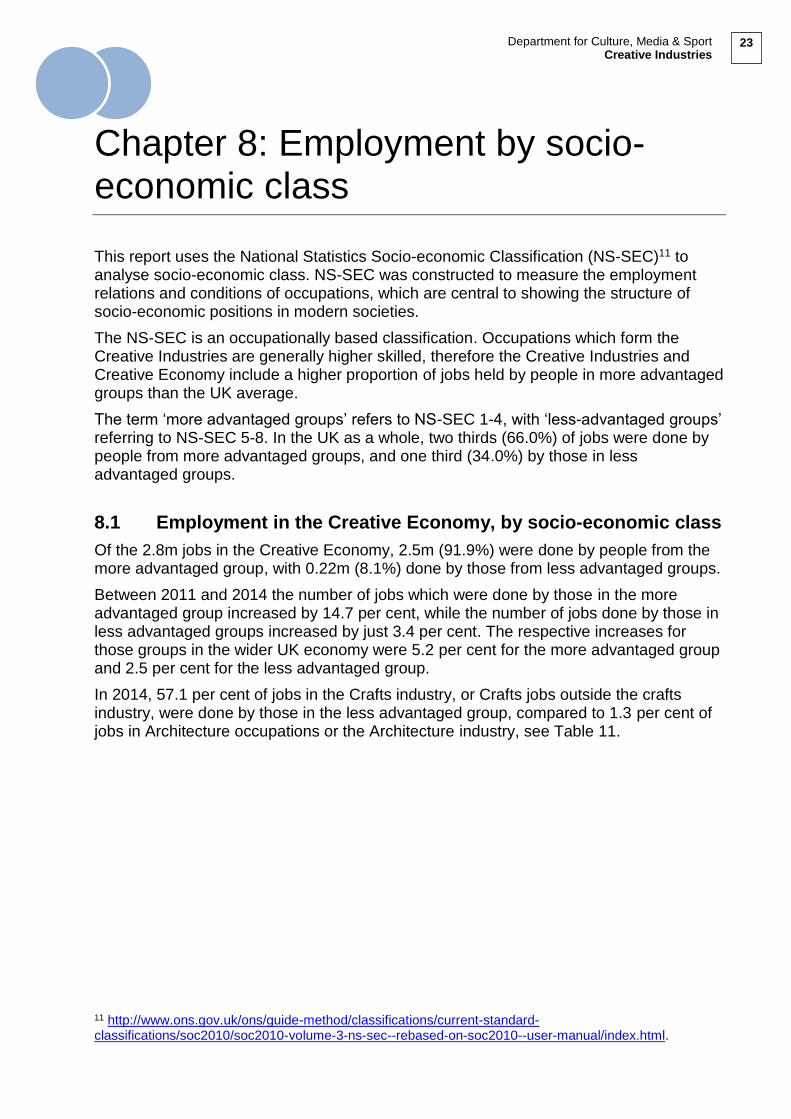
Table 11: Jobs in the Creative Economy in 2014, by group and socio-economic class
The proportion of jobs within the Creative Economy which are being done by people from the more advantaged group has grown slowly from 91.1 per cent in 2011 to 91.9 per cent in 2013. This is consistent with the finding that the workforce is becoming more skilled, as classification of socio-economic class is linked to occupation.
8.2 Employment in the Creative Industries, by socio-economic class
The socio-economic class of people doing jobs in the Creative Industries in 2014 was similar to the Creative Economy, 92.1 per cent of jobs in the Creative Industries were done by those in the more advantaged group. Like the creative economy there is a trend towards greater numbers in the more advantaged group with this figure growing from 91.1 per cent in 2011.
Between 2013 and 2014, the number of jobs in the Creative Industries done by those in the more advantaged group increased by 6.1 per cent (17.0% since 2011), higher than the 2.0 per cent increase in jobs for this group in the wider UK economy. For the less advantaged group, the number of jobs in the Creative Industries stayed approximately the same between 2013 and 2014 (0.1% decrease), in the wider UK economy there was a 2.2 per cent increase for this group.
Table 12: Jobs in the Creative Industries in 2014, by socio-economic class
2011 2012 2013 2014
More Advantaged 1,423,000 1,551,000 1,570,000 1,665,000
Less Advantaged 139,000 140,000 143,000 143,000
Within the Creative Industries, ’Music, performing and visual arts’ was the largest employer of those within the less advantaged group, with 30,000 jobs in 2014. While ‘Museums, galleries and libraries’ had the highest proportion of jobs filled from the less advantaged group, 27.2 per cent of jobs, compared with an average of 7.9 per cent across all Creative Industries.
More Advantaged
Less Advantaged
% less advantaged
Advertising and marketing 475,000 25,000 5.0%
Architecture 141,000 - 1.3%
Crafts 41,000 54,000 57.1%
Design: product, graphic and fashion design 189,000 14,000 7.1%
Film, TV, video, radio and photography 233,000 31,000 11.9%
IT, software and computer services 856,000 15,000 1.8%
Museums, galleries and libraries 82,000 24,000 22.3%
Music, performing and visual arts 310,000 37,000 10.7%
Publishing 204,000 21,000 9.3%
Creative Economy 2,530,000 223,000 8.1%
Department for Culture, Media & Sport Creative Industries
25
Annex A: Creative Occupations
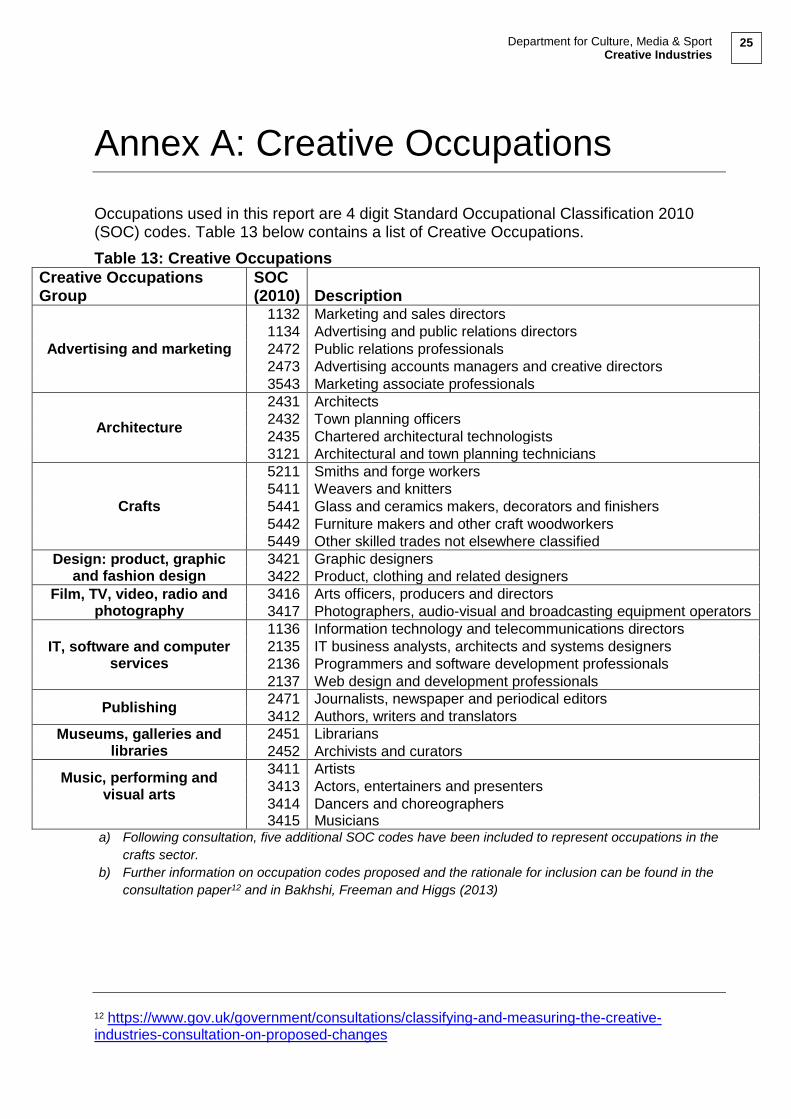
Occupations used in this report are 4 digit Standard Occupational Classification 2010 (SOC) codes. Table 13 below contains a list of Creative Occupations.
Table 13: Creative Occupations
Creative Occupations Group
SOC (2010) Description
Advertising and marketing
1132 Marketing and sales directors
1134 Advertising and public relations directors
2472 Public relations professionals
2473 Advertising accounts managers and creative directors
3543 Marketing associate professionals
Architecture
2431 Architects
2432 Town planning officers
2435 Chartered architectural technologists
3121 Architectural and town planning technicians
Crafts
5211 Smiths and forge workers
5411 Weavers and knitters
5441 Glass and ceramics makers, decorators and finishers
5442 Furniture makers and other craft woodworkers
5449 Other skilled trades not elsewhere classified
Design: product, graphic and fashion design
3421 Graphic designers
3422 Product, clothing and related designers
Film, TV, video, radio and photography
3416 Arts officers, producers and directors
3417 Photographers, audio-visual and broadcasting equipment operators
IT, software and computer services
1136 Information technology and telecommunications directors
2135 IT business analysts, architects and systems designers
2136 Programmers and software development professionals
2137 Web design and development professionals
Publishing 2471 Journalists, newspaper and periodical editors
3412 Authors, writers and translators
Museums, galleries and libraries
2451 Librarians
2452 Archivists and curators
Music, performing and visual arts
3411 Artists
3413 Actors, entertainers and presenters
3414 Dancers and choreographers 3415 Musicians
a) Following consultation, five additional SOC codes have been included to represent occupations in the
crafts sector.
b) Further information on occupation codes proposed and the rationale for inclusion can be found in the
consultation paper12 and in Bakhshi, Freeman and Higgs (2013)
12 https://www.gov.uk/government/consultations/classifying-and-measuring-the-creative-industries-consultation-on-proposed-changes
Annex B: Creative Industries
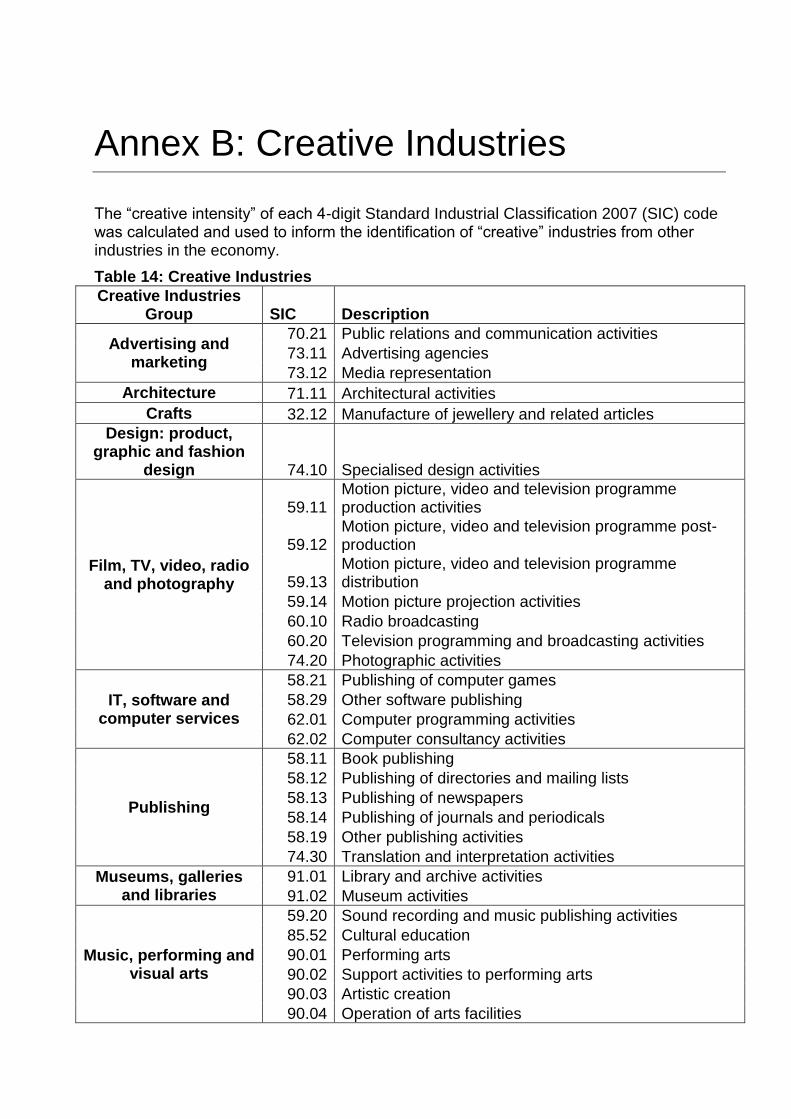
The “creative intensity” of each 4-digit Standard Industrial Classification 2007 (SIC) code was calculated and used to inform the identification of “creative” industries from other industries in the economy.
Table 14: Creative Industries
Creative Industries Group SIC Description
Advertising and marketing
70.21 Public relations and communication activities
73.11 Advertising agencies
73.12 Media representation
Architecture 71.11 Architectural activities
Crafts 32.12 Manufacture of jewellery and related articles
Design: product, graphic and fashion
design 74.10 Specialised design activities
Film, TV, video, radio and photography
59.11 Motion picture, video and television programme production activities
59.12 Motion picture, video and television programme post-production
59.13 Motion picture, video and television programme distribution
59.14 Motion picture projection activities
60.10 Radio broadcasting
60.20 Television programming and broadcasting activities
74.20 Photographic activities
IT, software and computer services
58.21 Publishing of computer games
58.29 Other software publishing
62.01 Computer programming activities
62.02 Computer consultancy activities
Publishing
58.11 Book publishing
58.12 Publishing of directories and mailing lists
58.13 Publishing of newspapers
58.14 Publishing of journals and periodicals
58.19 Other publishing activities
74.30 Translation and interpretation activities
Museums, galleries and libraries
91.01 Library and archive activities
91.02 Museum activities
Music, performing and visual arts
59.20 Sound recording and music publishing activities
85.52 Cultural education
90.01 Performing arts
90.02 Support activities to performing arts
90.03 Artistic creation
90.04 Operation of arts facilities

Department for Culture, Media & Sport Creative Industries
27
The “creative intensity”, calculated on 2011 and 2012 data, of each SIC code included in these estimates is shown in Table 15 below.
Table 15: Creative Intensities
SIC Description
Creative Intensity
(%)
90.03 Artistic creation 91.5
74.30 Translation and interpretation activities 82.2
90.01 Performing arts 78.8
74.20 Photographic activities 77.8
60.10 Radio broadcasting 62.7
74.10 Specialised design activities 62.1
71.11 Architectural activities 61.5
70.21 Public relations and communication activities 59.3
58.14 Publishing of journals and periodicals 58.3
90.02 Support activities to performing arts 56.8
59.1 Motion picture, video and television programme activities 56.4
32.12 Manufacture of jewellery and related articles 56.2
62.01 Computer programming activities 55.8
59.20 Sound recording and music publishing activities 54.1
60.20 Television programming and broadcasting activities 53.5
73.11 Advertising agencies 50.5
58.11 Book publishing 49.9
58.13 Publishing of newspapers 48.8
73.12 Media representation 48.3
58.21 Publishing of computer games 43.1
58.29 Other software publishing 40.8
90.04 Operation of arts facilities 38.4
58.19 Other publishing activities 37.8
85.52 Cultural education 34.6
62.02 Computer consultancy activities 32.8
58.12 Publishing of directories and mailing lists 31.0
91.01 Library and archive activities 23.8
91.02 Museum activities 22.5
Notes: a) Creative intensity for SIC 59.1 is calculated at 3-digit level in order to capture the whole industry as
data at the 4-digit level are no statistically robust (due to low levels of employment of the 4-digit
codes).
b) SIC codes 91.01 and 91.02 have been included after consultation, despite having creative intensities
below the 30 per cent threshold. One reason they may have a lower creative intensity is due to large
numbers employed in facilities maintenance in Museums, galleries and libraries.
c) SIC code 32.12 Manufacture of jewellery and related articles has been included after consultation to
represent the Crafts industry, although due to limitations in the underlying SIC codes (which are
agreed internationally) this clearly does not fully capture the crafts sector.
d) Industry codes proposed and the rationale for inclusion can be found in the consultation
https://www.gov.uk/government/consultations/classifying-and-measuring-the-creative-industries-consultation-
on-proposed-changes