June 2015 - Stephens Inc. First American Financial Corp. FNFV FNFV Group TREE LendingTree, Inc. EGOV...
87
© 2015 Stephens Inc. 111 Center Street Little Rock, AR 72201 501-377-2000 800-643-9691 stephens.com Member NYSE, SIPC June 2015 Monthly Statistical Review Equity Research Team................................................................................................................................................................................... 2 Coverage Changes ........................................................................................................................................................................................ 7 Rating Changes............................................................................................................................................................................................. 8 Estimate Changes ......................................................................................................................................................................................... 9 Consumer Food and Agribusiness ......................................................... 15 Healthy Living ..................................................................... 16 Restaurants ........................................................................ 17 Retail/Broadlines ................................................................. 18 Retail/Hardlines .................................................................. 19 Retail/Softlines ................................................................... 20 Energy Exploration and Production ................................................... 21 Master Limited Partnerships .................................................. 23 Oilfield Services .................................................................. 24 Financial Services Banks-Southeast ................................................................. 25 Banks-Southwest ................................................................ 26 Real Estate Services ............................................................ 27 Specialty Finance ................................................................ 28 Healthcare Diagnostics and Life Science Tools ......................................... 29 Healthcare Services ............................................................ 30 Medical Devices .................................................................. 31 Industrials Building Materials and Construction Services.............................. 32 Industrial Products and Services .............................................. 33 Transportation/Airfreight and Logistics/Maritime......................... 34 Transportation/Railroad and Transportation Suppliers ................. 35 Transportation/Truckload and Less-Than Truckload..................... 36 Technology Business Services .................................................................. 38 Communications Technology ................................................... 39 Infrastructure Software and Security ........................................ 40 Media................................................................................... 41 Power & Industrial Technology ................................................. 42 Semiconductors ..................................................................... 43 Software as a Service ............................................................. 44 Telecommunications Services .................................................. 45 Coverage List .............................................................................................................................................................................................. 46 Coverage List by Market Capitalization........................................................................................................................................................ 48 Institutional Sales ...................................................................................................................................................................................... 85 Branch Offices ............................................................................................................................................................................................ 86 Refer to pages 62-83 for MLP and REIT Company-Specific Risks Refer to Appendix on page 84 for Important Disclosures and Analyst Certification
Transcript of June 2015 - Stephens Inc. First American Financial Corp. FNFV FNFV Group TREE LendingTree, Inc. EGOV...

© 2015 Stephens Inc. 111 Center Street Little Rock, AR 72201 501-377-2000 800-643-9691 stephens.com Member NYSE, SIPC
June 2015
Monthly Statistical Review
Equity Research Team ................................................................................................................................................................................... 2 Coverage Changes ........................................................................................................................................................................................ 7 Rating Changes ............................................................................................................................................................................................. 8 Estimate Changes ......................................................................................................................................................................................... 9
Consumer Food and Agribusiness ......................................................... 15 Healthy Living ..................................................................... 16 Restaurants ........................................................................ 17 Retail/Broadlines ................................................................. 18 Retail/Hardlines .................................................................. 19 Retail/Softlines ................................................................... 20
Energy Exploration and Production ................................................... 21 Master Limited Partnerships .................................................. 23 Oilfield Services .................................................................. 24
Financial Services Banks-Southeast ................................................................. 25 Banks-Southwest ................................................................ 26 Real Estate Services ............................................................ 27 Specialty Finance ................................................................ 28
Healthcare Diagnostics and Life Science Tools ......................................... 29 Healthcare Services ............................................................ 30 Medical Devices .................................................................. 31
Industrials Building Materials and Construction Services .............................. 32 Industrial Products and Services .............................................. 33 Transportation/Airfreight and Logistics/Maritime ......................... 34 Transportation/Railroad and Transportation Suppliers ................. 35 Transportation/Truckload and Less-Than Truckload ..................... 36 Technology Business Services .................................................................. 38 Communications Technology ................................................... 39 Infrastructure Software and Security ........................................ 40 Media ................................................................................... 41 Power & Industrial Technology ................................................. 42 Semiconductors ..................................................................... 43 Software as a Service ............................................................. 44 Telecommunications Services .................................................. 45
Coverage List .............................................................................................................................................................................................. 46 Coverage List by Market Capitalization ........................................................................................................................................................ 48 Institutional Sales ...................................................................................................................................................................................... 85 Branch Offices ............................................................................................................................................................................................ 86
Refer to pages 62-83 for MLP and REIT Company-Specific Risks
Refer to Appendix on page 84 for Important Disclosures and Analyst Certification
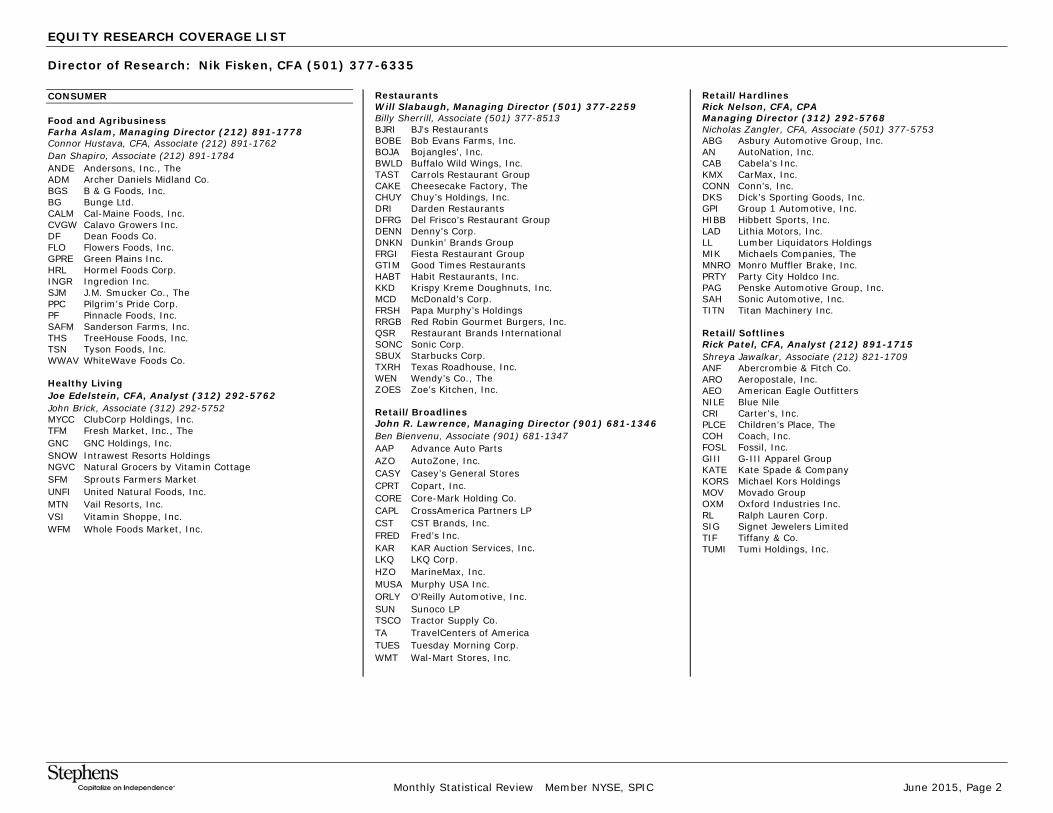
EQUITY RESEARCH COVERAGE LIST
Director of Research: Nik Fisken, CFA (501) 377-6335
Monthly Statistical Review Member NYSE, SPIC June 2015, Page 2
CONSUMER Food and Agribusiness Farha Aslam, Managing Director (212) 891-1778 Connor Hustava, CFA, Associate (212) 891-1762 Dan Shapiro, Associate (212) 891-1784 ANDE Andersons, Inc., The ADM Archer Daniels Midland Co. BGS B & G Foods, Inc. BG Bunge Ltd. CALM Cal-Maine Foods, Inc. CVGW Calavo Growers Inc. DF Dean Foods Co. FLO Flowers Foods, Inc. GPRE Green Plains Inc. HRL Hormel Foods Corp. INGR Ingredion Inc. SJM J.M. Smucker Co., The PPC Pilgrim's Pride Corp. PF Pinnacle Foods, Inc. SAFM Sanderson Farms, Inc. THS TreeHouse Foods, Inc. TSN Tyson Foods, Inc. WWAV WhiteWave Foods Co. Healthy Living Joe Edelstein, CFA, Analyst (312) 292-5762 John Brick, Associate (312) 292-5752 MYCC ClubCorp Holdings, Inc. TFM Fresh Market, Inc., The GNC GNC Holdings, Inc. SNOW Intrawest Resorts Holdings NGVC Natural Grocers by Vitamin Cottage SFM Sprouts Farmers Market UNFI United Natural Foods, Inc. MTN Vail Resorts, Inc. VSI Vitamin Shoppe, Inc. WFM Whole Foods Market, Inc.
Restaurants Will Slabaugh, Managing Director (501) 377-2259 Billy Sherrill, Associate (501) 377-8513 BJRI BJ’s Restaurants BOBE Bob Evans Farms, Inc. BOJA Bojangles’, Inc. BWLD Buffalo Wild Wings, Inc. TAST Carrols Restaurant Group CAKE Cheesecake Factory, The CHUY Chuy’s Holdings, Inc. DRI Darden Restaurants DFRG Del Frisco’s Restaurant Group DENN Denny's Corp. DNKN Dunkin’ Brands Group FRGI Fiesta Restaurant Group GTIM Good Times Restaurants HABT Habit Restaurants, Inc. KKD Krispy Kreme Doughnuts, Inc. MCD McDonald’s Corp. FRSH Papa Murphy’s Holdings RRGB Red Robin Gourmet Burgers, Inc. QSR Restaurant Brands International SONC Sonic Corp. SBUX Starbucks Corp. TXRH Texas Roadhouse, Inc. WEN Wendy’s Co., The ZOES Zoe’s Kitchen, Inc. Retail/Broadlines John R. Lawrence, Managing Director (901) 681-1346 Ben Bienvenu, Associate (901) 681-1347 AAP Advance Auto Parts AZO AutoZone, Inc. CASY Casey’s General Stores CPRT Copart, Inc. CORE Core-Mark Holding Co. CAPL CrossAmerica Partners LP CST CST Brands, Inc. FRED Fred’s Inc. KAR KAR Auction Services, Inc. LKQ LKQ Corp. HZO MarineMax, Inc. MUSA Murphy USA Inc. ORLY O’Reilly Automotive, Inc. SUN Sunoco LP TSCO Tractor Supply Co. TA TravelCenters of America TUES Tuesday Morning Corp. WMT Wal-Mart Stores, Inc.
Retail/Hardlines Rick Nelson, CFA, CPA Managing Director (312) 292-5768 Nicholas Zangler, CFA, Associate (501) 377-5753 ABG Asbury Automotive Group, Inc. AN AutoNation, Inc. CAB Cabela’s Inc. KMX CarMax, Inc. CONN Conn’s, Inc. DKS Dick’s Sporting Goods, Inc. GPI Group 1 Automotive, Inc. HIBB Hibbett Sports, Inc. LAD Lithia Motors, Inc. LL Lumber Liquidators Holdings MIK Michaels Companies, The MNRO Monro Muffler Brake, Inc. PRTY Party City Holdco Inc. PAG Penske Automotive Group, Inc. SAH Sonic Automotive, Inc. TITN Titan Machinery Inc. Retail/Softlines Rick Patel, CFA, Analyst (212) 891-1715 Shreya Jawalkar, Associate (212) 821-1709 ANF Abercrombie & Fitch Co. ARO Aeropostale, Inc. AEO American Eagle Outfitters NILE Blue Nile CRI Carter’s, Inc. PLCE Children’s Place, The COH Coach, Inc. FOSL Fossil, Inc. GIII G-III Apparel Group KATE Kate Spade & Company KORS Michael Kors Holdings MOV Movado Group OXM Oxford Industries Inc. RL Ralph Lauren Corp. SIG Signet Jewelers Limited TIF Tiffany & Co. TUMI Tumi Holdings, Inc.

EQUITY RESEARCH COVERAGE LIST
Director of Research: Nik Fisken, CFA (501) 377-6335
Monthly Statistical Review Member NYSE, SPIC June 2015, Page 3
ENERGY Exploration and Production Will Green, Analyst (817) 900-5712 Matt Beeby, Associate (817) 900-5711 Joshua Stevens, Associate (817) 900-5713 AXAS Abraxas Petroleum Corp. AREX Approach Resources Inc. CPE Callon Petroleum Co. CRZO Carrizo Oil & Gas, Inc. CXO Concho Resources Inc. EPE EP Energy Corp. XCO EXCO Resources, Inc. GPOR Gulfport Energy Corp. HK Halcon Resources LPI Laredo Petroleum, Inc. OAS Oasis Petroleum Inc. PE Parsley Energy, Inc. PQ PetroQuest Energy, Inc. PXD Pioneer Natural Resources Co. RRC Range Resources Corp. ROSE Rosetta Resources, Inc. RSPP RSP Permian, Inc. SWN Southwestern Energy Co. WLL Whiting Petroleum Corp. Exploration and Production Ben Wyatt, Analyst (817) 900-5714 Matt Beeby, Associate (817) 900-5711 Joshua Stevens, Associate (817) 900-5713 AR Antero Resources Corp. ESTE Earthstone Energy, Inc. GDP Goodrich Petroleum Corp. MHR Magnum Hunter Resources MTDR Matador Resources Co. MRD Memorial Resource Development PDCE PDC Energy, Inc. QEP QEP Resources, Inc. REXX Rex Energy Corp. RICE Rice Energy Inc. SN Sanchez Energy Corp. SD SandRidge Energy, Inc. SYRG Synergy Resources Corp. WPT World Point Terminals Master Limited Partnerships Matt Schmid, Analyst (817) 900-5716 ATLS Atlas Energy ARP Atlas Resource Partners BKEP Blueknight Energy Partners JPEP JP Energy Partners MWE MarkWest Energy Partners MMLP Martin Midstream Partners NSLP New Source Energy Partners PAA Plains All American Pipeline PAGP Plains GP Holdings WPT World Point Terminals
Oilfield Services Matthew Marietta, Analyst (713) 993-4211 Brooks Braden, Associate (713) 993-4204 Christopher Denison, Associate (713) 993-4214 ATW Atwood Oceanics, Inc. BHI Baker Hughes Inc. BAS Basic Energy Services, Inc. CJES C&J Energy Services, Inc. FTK Flotek Industries, Inc. HAL Halliburton Co. HLX Helix Energy Solutions Group HP Helmerich & Payne HOS Hornbeck Offshore Services KEG Key Energy Services, Inc. NBR Nabors Industries NE Noble Corp. PKD Parker Drilling Co. PTEN Patterson-UTI Energy PES Pioneer Energy Services RES RPC, Inc. SLB Schlumberger Ltd. SSE Seventy Seven Energy Inc. SPN Superior Energy Services, Inc. WFT Weatherford International FINANCIAL SERVICES Banks-Southeast Tyler Stafford, Analyst (501) 377-8362 Gordon McGuire, Associate (501) 377-3717 Matthew Sealy, Associate (501) 377-3721 Russell Warden, Associate (501) 377-8095 Wes Zwiegers, Associate (501) 377-2284 FRC First Republic Bank PACW PacWest Bancorp STBZ State Bank Financial Corp. SIVB SVB Financial Group SNV Synovus Financial Corp. UMPQ Umpqua Holdings Corp.
Banks-Southwest Matt Olney, CFA, Managing Director (501) 377-2101 Gordon McGuire, Associate (501) 377-3717 Matthew Sealy, Associate (501) 377-3721 Russell Warden, Associate (501) 377-8095 Wes Zwiegers, Associate (501) 377-2284 BXS BancorpSouth, Inc. OZRK Bank of the Ozarks, Inc. BOKF BOK Financial Corp. CBSH Commerce Bancshares, Inc. CFR Cullen/Frost Bankers, Inc. FFIN First Financial Bankshares, Inc. FHN First Horizon National Corp. HBHC Hancock Holding Co. HTH Hilltop Holdings Inc. HOMB Home BancShares, Inc. IBKC IBERIABANK Corp. IBTX Independent Bank Group LTXB LegacyTexas Financial Group, Inc. MSL MidSouth Bancorp, Inc. NBHC National Bank Holdings Corp. PNFP Pinnacle Financial Partners, Inc. PB Prosperity Bancshares, Inc. RF Regions Financial Corp. RNST Renasant Corp. SFNC Simmons First National Corp. OKSB Southwest Bancorp, Inc. TCBI Texas Capital Bancshares, Inc. TSC TriState Capital Holdings, Inc. UMBF UMB Financial Corp. UCBI United Community Banks, Inc. VBTX Veritex Holdings, Inc. Real Estate Services John Campbell, Analyst (501) 377-6362 Hayden Blair, Associate (501) 377-8215 RATE Bankrate, Inc. CLGX CoreLogic ELLI Ellie Mae, Inc. FNF Fidelity National Financial, Inc. FAF First American Financial Corp. FNFV FNFV Group TREE LendingTree, Inc. EGOV NIC Inc. QNST QuinStreet, Inc. STC Stewart Information Services Z Zillow, Inc.

EQUITY RESEARCH COVERAGE LIST
Director of Research: Nik Fisken, CFA (501) 377-6335
Monthly Statistical Review Member NYSE, SPIC June 2015, Page 4
Specialty Finance J.R. Bizzell, Analyst (501) 377-8237 Eric Jaschke, Associate (415)548-6912 AAN Aaron’s, Inc. CRMT America’s Car-Mart, Inc. CPSS Consumer Portfolio Services RM Regional Management RCII Rent-A-Center SC Santander Consumer USA LEAF Springleaf Holdings, Inc. WRLD World Acceptance Corp. HEALTHCARE Diagnostics and Life Science Tools Drew Jones, Analyst (501) 377-2369 Garrett Phelps, Associate (501) 377-8221 ABAX Abaxis, Inc. TECH Bio-Techne Corp. CERS Cerus Corp. EXAS EXACT Sciences Corp. GHDX Genomic Health, Inc. LMNX Luminex Corp. MYGN Myriad Genetics, Inc. NEOG Neogen Corp. NEO Neogenomics Inc. OSUR OraSure Technologies, Inc. PACB Pacific Biosciences of California RGEN Repligen Corp. TEAR TearLab Corp. TRIB Trinity Biotech plc WOOF VCA, Inc. VCYT Veracyte, Inc.
Healthcare Services Dana Hambly, CFA, Analyst (615) 279-4329 ACHC Acadia Healthcare Co. ADPT Adeptus Health Inc. ADUS Addus HomeCare Corp. AIRM Air Methods Corp. AMSG AMSURG Corporation BIOS BioScrip, Inc. BKD Brookdale Senior Living CSU Capital Senior Living Corp. ENSG Ensign Group, The GEN Genesis Healthcare, Inc. HGR Hanger Inc. IPCM IPC The Hospitalist Co. MD MEDNAX, Inc. SCAI Surgical Care Affiliates TMH Team Health Holdings, Inc. USPH U.S. Physical Therapy Medical Devices Chris Cooley, CFA, Managing Director, (501) 377-2516 Blevin Brown, Associate (501) 377-8506 ABMD Abiomed, Inc. ALGN Align Technology, Inc. AVGR Avinger, Inc. COO Cooper Companies, The DXCM DexCom, Inc. ELGX Endologix, Inc. PODD Insulet Corp. LDRH LDR Holding Corp. NXTM NxStage Medical, Inc. RTIX RTI Surgical, Inc. SIRO Sirona Dental Systems, Inc. STAA STAAR Surgical Co. STE STERIS Corp. SURG Synergetics USA, Inc. TFX Teleflex Inc.
INDUSTRIALS Building Materials and Construction Services Trey Grooms, Managing Director (501) 377-2318 Blake Hirschman, Associate (501) 377-8046 Drew Lipke, Associate (501) 377-2108 BECN Beacon Roofing Supply, Inc. BLDR Builders FirstSource, Inc. CBPX Continental Building Products EXP Eagle Materials Inc. GLDD Great Lakes Dredge & Dock MLM Martin Marietta Materials DOOR Masonite International Corp. NCS NCI Building Systems ORN Orion Marine Group, Inc. PGEM Ply Gem Holdings, Inc. PII Polaris Industries Inc. STCK Stock Building Supply Holdings SUM Summit Materials LLC TREX Trex Company, Inc. USCR U.S. Concrete, Inc. SLCA U.S. Silica Holdings, Inc. USG USG Corp. VMC Vulcan Materials Company Industrial Products and Services Matt Duncan, CFA, Managing Director (501) 377-3723 Will Steinwart, Associate (501) 377-8303 AIMC Altra Holdings, Inc. AIT Applied Industrial Technologies, Inc. DXPE DXP Enterprises, Inc. FRM Furmanite Corp. KAMN Kaman Corp. MTZ MasTec, Inc. MTRX Matrix Service Co. MG Mistras Group, Inc. MRC MRC Global Inc. MSM MSC Industrial Direct Co. DNOW NOW, Inc. POOL Pool Corp. PWR Quanta Services, Inc. RYI Ryerson Holding Corp. TISI Team, Inc. GWW W.W. Grainger, Inc. WSO Watsco, Inc. WCC WESCO International, Inc.

EQUITY RESEARCH COVERAGE LIST
Director of Research: Nik Fisken, CFA (501) 377-6335
Monthly Statistical Review Member NYSE, SPIC June 2015, Page 5
Transportation/Airfreight and Logistics/Maritime Jack Atkins, Analyst (501) 377-2298 Andrew Hall, Associate (501) 377-2562 ATSG Air Transport Service Group AAWW Atlas Air Worldwide Holdings CHRW C.H. Robinson Worldwide, Inc. ECHO Echo Global Logistics EXPD Expeditors International FDX FedEx Corp. FWRD Forward Air Corp. KEX Kirby Corp. LSTR Landstar System, Inc. MATX Matson Inc. QLTY Quality Distribution, Inc. UPS United Parcel Service, Inc. UTIW UTi Worldwide Inc. INT World Fuel Services XPO XPO Logistics Transportation/Railroad and Transportation Suppliers Justin Long, Analyst (501) 377-2036 Brian Colley, Associate (501) 377-8231 ARII American Railcar Industries CSX CSX Corp. DAN Dana Holding Corp. RAIL FreightCar America, Inc. GMT GATX Corp. GWR Genesee & Wyoming Inc. GBX Greenbrier Companies HUBG Hub Group, Inc. KSU Kansas City Southern NSC Norfolk Southern Corp. R Ryder System, Inc. SRI Stoneridge Inc. TRN Trinity Industries UNP Union Pacific Corp. WBC WABCO Holdings Inc. WAB Wabtec Corp.
Transportation/Truckload and Less-Than Truckload Brad Delco, Managing Director (501) 377-8057 Scott Schoenhaus, Associate (501) 377-2532 ARCB ArcBest Corp. CGI Celadon Group, Inc. CNW Con-way Inc. CVTI Covenant Transportation Group HTLD Heartland Express JBHT J.B. Hunt Transport Services, Inc. KNX Knight Transportation, Inc. MRTN Marten Transport, Ltd. ODFL Old Dominion Freight Line, Inc. RUSHA Rush Enterprises, Inc. SAIA Saia, Inc. SWFT Swift Transportation Co. USAK USA Truck, Inc. WNC Wabash National Corp. WERN Werner Enterprises, Inc. YRCW YRC Worldwide Inc. TECHNOLOGY Business Services Brett Huff, CFA, Managing Director (501) 377-8068 James Rutherford, Associate (501) 377-2303 ACIW ACI Worldwide, Inc. ACXM Acxiom Corp. ADS Alliance Data Systems EPAY Bottomline Technologies CSGP CoStar Group, Inc. DNB D&B EFX Equifax Inc. EXPGY Experian plc FICO FICO FIS Fidelity National Information Services, Inc. FISV Fiserv, Inc. GPN Global Payments Inc. HPY Heartland Payment Systems, Inc. JKHY Jack Henry & Associates MCHX Marchex, Inc. FUEL Rocket Fuel Inc. RUBI Rubicon Project, Inc. TSS Total System Services, Inc.
Communications Technology Tim Quillin, CFA, Managing Director (501) 377-8078 Aaron Fogle, Associate (501) 377-8065 ADTN ADTRAN, Inc. ARRS ARRIS Group, Inc. CAMP CalAmp Corp. CALX Calix Inc. COMM CommScope Holding Company SATS EchoStar Corp. FLIR FLIR Systems, Inc. HLIT Harmonic Inc. ROVI Rovi Corp. RPXC RPX Corp. RKUS Ruckus Wireless, Inc. SWIR Sierra Wireless, Inc. TIVO TiVo Inc. UBNT Ubiquiti Networks, Inc. VSAT ViaSat, Inc. Infrastructure Software and Security Jonathan Ruykhaver, CFA, Managing Dir. (615) 279-4331 Nathan Leiphardt, Associate (615) 279-4376 HIVE Aerohive Networks, Inc. CUDA Barracuda Networks, Inc. CHKP Check Point Software Tech. CTXS Citrix Systems, Inc. FEYE FireEye, Inc. FTNT Fortinet, Inc. IMPV Imperva, Inc. BLOX Infoblox Inc. LOGM LogMeIn, Inc. NTCT NetScout Systems, Inc. PANW Palo Alto Networks, Inc. PFPT Proofpoint, Inc. QLYS Qualys, Inc. RHT Red Hat, Inc. SWI SolarWinds, Inc. SPLK Splunk, Inc. SYMC Symantec Corp. VRNS Varonis Systems, Inc. Media Kyle Evans, Managing Director (501) 377-6376 Tommy Moll, Associate (501) 377-6306 TTGT TechTarget, Inc. TRUE TrueCar, Inc.

EQUITY RESEARCH COVERAGE LIST
Director of Research: Nik Fisken, CFA (501) 377-6335
Monthly Statistical Review Member NYSE, SPIC June 2015, Page 6
Power & Industrial Technology Ben Hearnsberger, Analyst (512) 542-3272 Brandon Wright, Associate (512) 542-3273 DDD 3D Systems Corp. ENS Enersys Inc. ESE ESCO Technologies XONE ExOne Company, The FARO FARO Technologies, Inc. ITRI Itron, Inc. MTLS Materialise NV NATI National Instruments Corp. PRLB Proto Labs, Inc. RAVN Raven Industries SSYS Stratasys Ltd. VJET Voxeljet AG Semiconductors Harsh Kumar, Managing Director (901) 681-1344 Richard Sewell, Associate (901) 681-1345 ADI Analog Devices, Inc. ATML Atmel Corp. BELFB Bel Fuse Inc. CREE Cree, Inc. DIOD Diodes Inc. IDTI Integrated Device Technology ISIL Intersil Corp. KN Knowles Corp. MTSI M/A-COM Technology Solutions MCHP Microchip Technology MSCC Microsemi Corp. OVTI OmniVision Technologies QRVO Qorvo, Inc. SMTC Semtech Corp. SLAB Silicon Laboratories, Inc. SWKS Skyworks Solutions, Inc.
Software as a Service Alex Zukin, Analyst (415) 548-6907 Scott Wilson, Associate (415) 548-6906 ADBE Adobe Systems Inc. CALD CallidusCloud CSOD Cornerstone OnDemand, Inc. DWRE Demandware, Inc. GWRE Guidewire Software, Inc. MKTO Marketo, Inc. N NetSuite Inc. RALY Rally Software Development CRM Salesforce.com SQI SciQuest, Inc. NOW ServiceNow, Inc. TYL Tyler Technologies, Inc. ULTI Ultimate Software WDAY Workday, Inc.
Telecommunications Services Barry McCarver, Managing Director (501) 377-8131 Brian Hawthorne, Associate (501) 377-6372 ATNI Atlantic Tele-Network, Inc. CBB Cincinnati Bell Inc. CCOI Cogent Communications Group CSAL Communications Sales & Leasing CNSL Consolidated Communications Holdings COR CoreSite Realty Corp. CONE CyrusOne, Inc. EQIX Equinix, Inc. HCOM Hawaiian Telcom Holdco LVLT Level 3 Communications, Inc. MITL Mitel Networks Corp. PGI Premiere Global Services, Inc. QTS QTS Realty Trust RAX Rackspace Hosting, Inc. SHOR ShoreTel, Inc. WIN Windstream Corp. ZAYO Zayo Group Holdings
Monthly Statistical Review Member NYSE, SPIC June 2015, Page 7
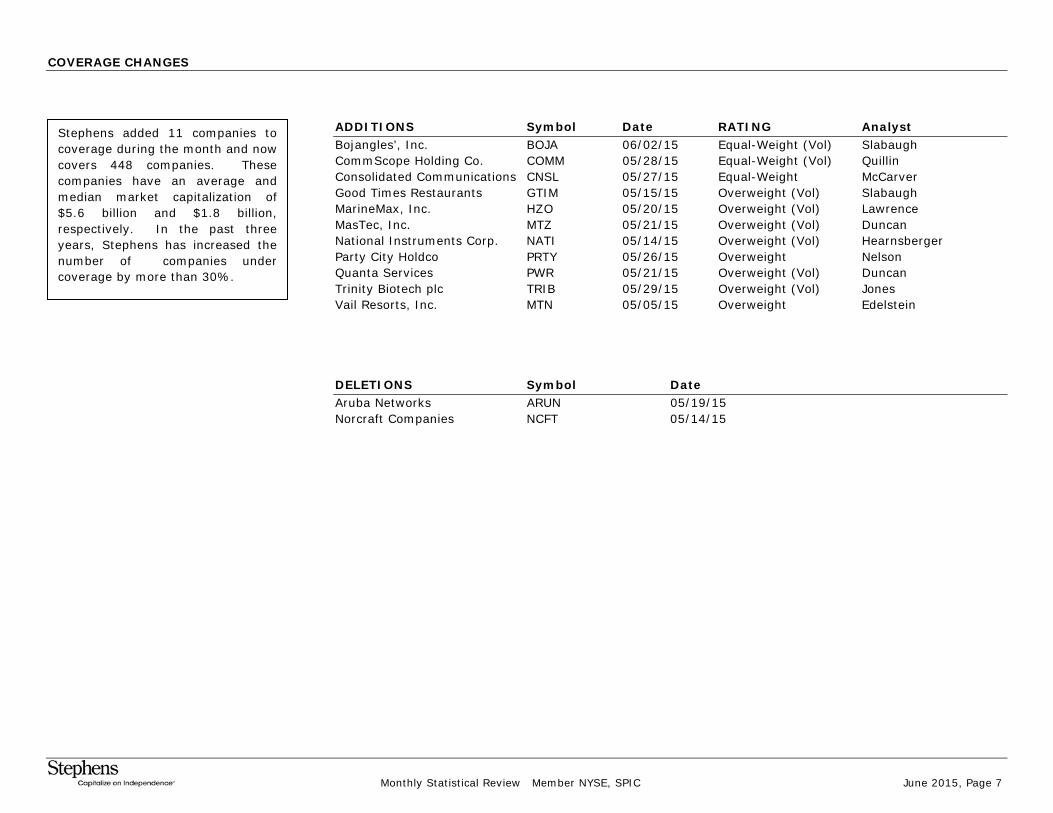
COVERAGE CHANGES
ADDITIONS Symbol Date RATING Analyst Bojangles’, Inc. BOJA 06/02/15 Equal-Weight (Vol) Slabaugh CommScope Holding Co. COMM 05/28/15 Equal-Weight (Vol) Quillin Consolidated Communications CNSL 05/27/15 Equal-Weight McCarver Good Times Restaurants GTIM 05/15/15 Overweight (Vol) Slabaugh MarineMax, Inc. HZO 05/20/15 Overweight (Vol) Lawrence MasTec, Inc. MTZ 05/21/15 Overweight (Vol) Duncan National Instruments Corp. NATI 05/14/15 Overweight (Vol) Hearnsberger Party City Holdco PRTY 05/26/15 Overweight Nelson Quanta Services PWR 05/21/15 Overweight (Vol) Duncan Trinity Biotech plc TRIB 05/29/15 Overweight (Vol) Jones Vail Resorts, Inc. MTN 05/05/15 Overweight Edelstein DELETIONS Symbol Date Aruba Networks ARUN 05/19/15 Norcraft Companies NCFT 05/14/15
Stephens added 11 companies to coverage during the month and now covers 448 companies. These companies have an average and median market capitalization of $5.6 billion and $1.8 billion, respectively. In the past three years, Stephens has increased the number of companies under coverage by more than 30%.

Monthly Statistical Review Member NYSE, SPIC June 2015, Page 8
RATING CHANGES Rating _________ UPGRADES Symbol To From Date Analyst Amtel Corp. ATML Overweight (Vol) Equal-Weight (Vol) 05/14/15 Kumar BJ’s Restaurants BJRI Overweight Equal-Weight 05/26/15 Slabaugh Cal-Maine Foods CALM Overweight (Vol) Equal-Weight (Vol) 05/18/15 Aslam EXCO Resources XCO Equal-Weight Underweight 05/04/15 Green Key Energy Services KEG Equal-Weight Underweight 05/14/15 Marietta MRC Global MRC Overweight (Vol) Equal-Weight (Vol) 05/04/15 Duncan Sanderson Farms SAFM Overweight Equal-Weight 05/05/15 Aslam Seventy Seven Energy SSE Overweight Equal-Weight 05/14/15 Marietta Sprouts Farmers Market SFM Overweight (Vol) Equal-Weight (Vol) 05/11/15 Edelstein Teleflex TFX Overweight Equal-Weight 05/22/15 Cooley Tumi Holdings TUMI Overweight (Vol) Equal-Weight (Vol) 05/26/15 Patel United Natural Foods UNFI Overweight (Vol) Equal-Weight (Vol) 05/11/15 Edelstein Rating _________ DOWNGRADES Symbol To From Date Analyst EnerSys ENS Equal-Weight Overweight 05/29/15 Hearnsberger Helmerich & Payne HP Equal-Weight Overweight 05/14/15 Marietta Michael Kors Holdings KORS Equal-Weight (Vol) Overweight (Vol) 05/28/15 Patel
Monthly Statistical Review Member NYSE, SPIC June 2015, Page 9
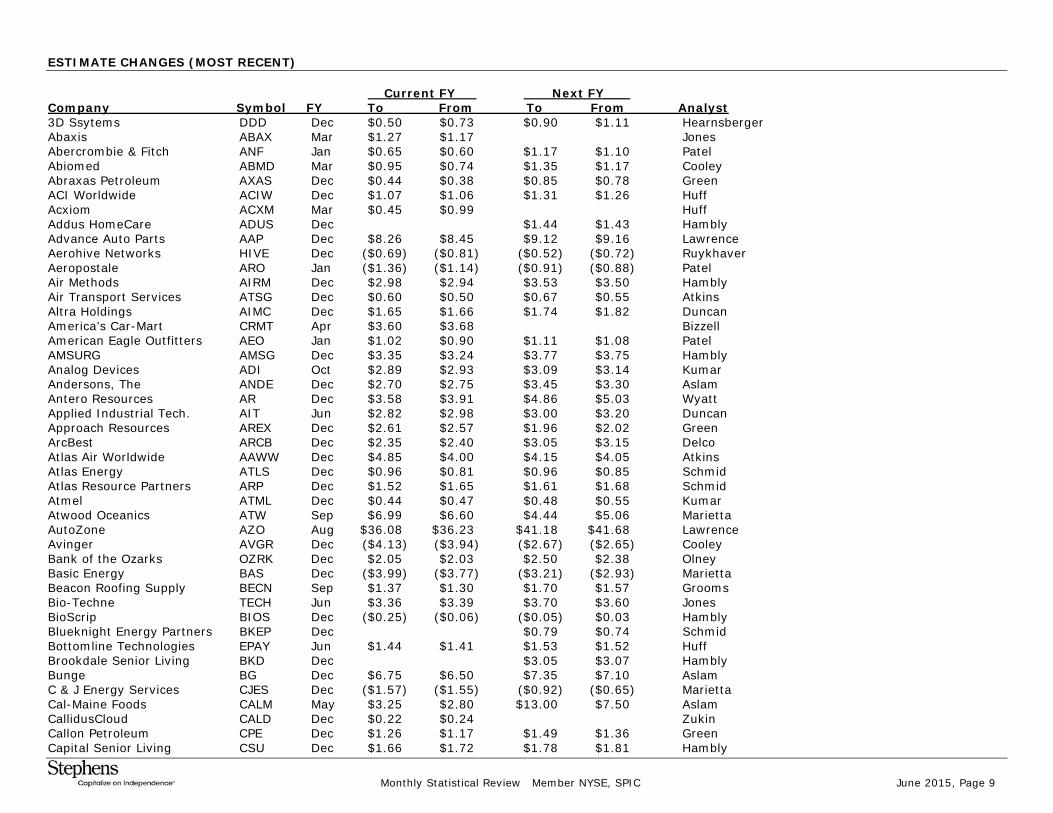
ESTIMATE CHANGES (MOST RECENT) Current FY Next FY___ Company Symbol FY To From To From Analyst 3D Ssytems DDD Dec $0.50 $0.73 $0.90 $1.11 Hearnsberger Abaxis ABAX Mar $1.27 $1.17 Jones Abercrombie & Fitch ANF Jan $0.65 $0.60 $1.17 $1.10 Patel Abiomed ABMD Mar $0.95 $0.74 $1.35 $1.17 Cooley Abraxas Petroleum AXAS Dec $0.44 $0.38 $0.85 $0.78 Green ACI Worldwide ACIW Dec $1.07 $1.06 $1.31 $1.26 Huff Acxiom ACXM Mar $0.45 $0.99 Huff Addus HomeCare ADUS Dec $1.44 $1.43 Hambly Advance Auto Parts AAP Dec $8.26 $8.45 $9.12 $9.16 Lawrence Aerohive Networks HIVE Dec ($0.69) ($0.81) ($0.52) ($0.72) Ruykhaver Aeropostale ARO Jan ($1.36) ($1.14) ($0.91) ($0.88) Patel Air Methods AIRM Dec $2.98 $2.94 $3.53 $3.50 Hambly Air Transport Services ATSG Dec $0.60 $0.50 $0.67 $0.55 Atkins Altra Holdings AIMC Dec $1.65 $1.66 $1.74 $1.82 Duncan America’s Car-Mart CRMT Apr $3.60 $3.68 Bizzell American Eagle Outfitters AEO Jan $1.02 $0.90 $1.11 $1.08 Patel AMSURG AMSG Dec $3.35 $3.24 $3.77 $3.75 Hambly Analog Devices ADI Oct $2.89 $2.93 $3.09 $3.14 Kumar Andersons, The ANDE Dec $2.70 $2.75 $3.45 $3.30 Aslam Antero Resources AR Dec $3.58 $3.91 $4.86 $5.03 Wyatt Applied Industrial Tech. AIT Jun $2.82 $2.98 $3.00 $3.20 Duncan Approach Resources AREX Dec $2.61 $2.57 $1.96 $2.02 Green ArcBest ARCB Dec $2.35 $2.40 $3.05 $3.15 Delco Atlas Air Worldwide AAWW Dec $4.85 $4.00 $4.15 $4.05 Atkins Atlas Energy ATLS Dec $0.96 $0.81 $0.96 $0.85 Schmid Atlas Resource Partners ARP Dec $1.52 $1.65 $1.61 $1.68 Schmid Atmel ATML Dec $0.44 $0.47 $0.48 $0.55 Kumar Atwood Oceanics ATW Sep $6.99 $6.60 $4.44 $5.06 Marietta AutoZone AZO Aug $36.08 $36.23 $41.18 $41.68 Lawrence Avinger AVGR Dec ($4.13) ($3.94) ($2.67) ($2.65) Cooley Bank of the Ozarks OZRK Dec $2.05 $2.03 $2.50 $2.38 Olney Basic Energy BAS Dec ($3.99) ($3.77) ($3.21) ($2.93) Marietta Beacon Roofing Supply BECN Sep $1.37 $1.30 $1.70 $1.57 Grooms Bio-Techne TECH Jun $3.36 $3.39 $3.70 $3.60 Jones BioScrip BIOS Dec ($0.25) ($0.06) ($0.05) $0.03 Hambly Blueknight Energy Partners BKEP Dec $0.79 $0.74 Schmid Bottomline Technologies EPAY Jun $1.44 $1.41 $1.53 $1.52 Huff Brookdale Senior Living BKD Dec $3.05 $3.07 Hambly Bunge BG Dec $6.75 $6.50 $7.35 $7.10 Aslam C & J Energy Services CJES Dec ($1.57) ($1.55) ($0.92) ($0.65) Marietta Cal-Maine Foods CALM May $3.25 $2.80 $13.00 $7.50 Aslam CallidusCloud CALD Dec $0.22 $0.24 Zukin Callon Petroleum CPE Dec $1.26 $1.17 $1.49 $1.36 Green Capital Senior Living CSU Dec $1.66 $1.72 $1.78 $1.81 Hambly

Monthly Statistical Review Member NYSE, SPIC June 2015, Page 10
ESTIMATE CHANGES (MOST RECENT) Current FY Next FY___ Company Symbol FY To From To From Analyst Carrizo Oil & Gas CRZO Dec $6.87 $6.91 $8.51 $8.63 Green Carrols Restaurant Group TAST Dec ($0.33) ($0.26) $0.02 ($0.08) Slabaugh Cerus CERS Dec ($0.52) ($0.59) ($0.53) ($0.57) Jones Children’s Place PLCE Jan $3.45 $3.30 $3.87 $3.72 Patel Chuy’s CHUY Dec $0.77 $0.75 Slabaugh Cincinnati Bell CBB Dec $0.04 ($0.07) $0.11 $0.01 McCarver ClubCorp MYCC Dec $0.57 $0.61 $0.71 $0.75 Edelstein Cogent Communications CCOI Dec $0.24 $0.30 $0.67 $0.63 McCarver Con-way CNW Dec $2.50 $2.75 $3.05 $3.30 Delco Concho Resources CXO Dec $11.47 $11.49 $13.21 $13.42 Green Conn’s CONN Jan $1.96 $1.86 $2.47 $2.32 Nelson Continental Building Products CBPX Dec $0.97 $1.01 $1.40 $1.48 Grooms Copart CPRT Jul $1.61 $1.74 $1.77 $1.89 Lawrence Core-Mark Holding CORE Dec $2.34 $2.31 $2.45 $2.42 Lawrence Corelogic CLGX Dec $1.81 $1.78 $2.12 $2.08 Campbell Cornerstone OnDemand CSOD Dec ($0.22) ($0.26) Zukin CoStar Group CSGP Dec $4.75 $4.35 Huff CrossAmerica Partners CAPL Dec $2.55 $2.67 $2.91 $2.67 Lawrence CST Brands CST Dec $1.76 $2.03 $2.01 $2.20 Lawrence CyrusOne CONE Dec ($0.03) $0.09 $0.09 $0.08 McCarver D & B DNB Dec $7.63 $7.43 $8.54 $8.49 Huff Dean Foods DF Dec $0.90 $0.76 Aslam Demandware DWRE Dec $0.17 ($0.04) Zukin Denny’s DENN Dec $0.44 $0.41 $0.48 $0.44 Slabaugh Dick’s Sporting Goods DKS Jan $3.18 $3.16 $3.50 $3.47 Nelson Diodes DIOD Dec $1.50 $1.60 Kumar DXP Enterprises DXPE Dec $2.50 $2.92 $3.10 $3.40 Duncan Eagle Materials EXP Mar $4.55 $5.10 Grooms Earthstone Energy ESTE Mar $2.03 $2.38 $3.90 $4.17 Wyatt Echo Global Logistics ECHO Dec $0.93 $0.95 $1.38 $1.20 Atkins EchoStar SATS Dec $1.83 $1.90 $1.98 $1.90 Quillin Ellie Mae ELLI Dec $1.16 $1.02 $1.48 $1.35 Campbell Enersys ENS Mar $4.55 $4.65 $5.15 $5.25 Hearnsberger Ensign Group ENSG Dec $2.41 $2.44 $2.74 $2.66 Hambly EP Energy EPE Dec $4.79 $4.60 $4.09 $3.71 Green EXACT Sciences EXAS Dec ($1.67) ($1.56) ($1.32) ($1.00) Jones EXCO Resources XCO Dec $0.40 $0.35 Green Expeditors International EXPD Dec $2.22 $2.10 $2.43 $2.30 Atkins Fidelity National Financial FNF Dec $2.30 $2.26 Campbell Fidelity National Info. Services FIS Dec $3.27 $3.28 $3.69 $3.74 Huff FireEye FEYE Dec ($1.80) ($1.85) ($1.20) ($1.28) Ruykhaver First American Financial FAF Dec $2.39 $2.42 $2.69 $2.73 Campbell First Republic Bank FRC Dec $3.11 $2.97 $3.78 $3.63 Stafford Fiserv FISV Dec $3.79 $3.78 $4.22 $4.08 Huff

Monthly Statistical Review Member NYSE, SPIC June 2015, Page 11
ESTIMATE CHANGES (MOST RECENT) Current FY Next FY___ Company Symbol FY To From To From Analyst Flotek Industries FTK Dec ($0.27) $0.01 $0.09 $0.54 Marietta FNFV Group FNFV Dec $0.10 $0.21 $0.20 $0.41 Campbell Fossil FOSL Dec $5.85 $6.35 $6.53 $6.78 Patel FreightCar America RAIL Dec $1.80 $2.40 $2.35 $2.55 Long Fresh Market TFM Jan $2.05 $2.15 Edelstein Furmanite FRM Dec $0.56 $0.52 Duncan Genesee & Wyoming GWR Dec $4.40 $4.50 $5.15 $5.30 Long Genomic Health GHDX Dec ($0.74) ($0.57) $0.07 $0.09 Jones G-III Apparel Group GIII Jan $2.73 $2.62 $3.05 $3.00 Patel GNC Holdings GNC Dec $3.06 $3.15 $3.25 $3.46 Edelstein Goodrich Petroleum GDP Dec $0.81 $0.82 $0.35 $0.51 Wyatt Great Lakes Dredge & Dock GLDD Dec $0.20 $0.24 $0.30 $0.29 Grooms Guidewire Software GWRE Jul $0.61 $0.60 Zukin Gulfport Energy GPOR Dec $3.00 $3.57 $4.49 $5.15 Green Habit Restaurants HABT Dec $0.23 $0.17 $0.28 $0.24 Slabaugh Halcon Resources HK Dec $0.48 $0.55 $0.21 $0.38 Green Halliburton HAL Dec $1.54 $1.07 $1.81 $1.45 Marietta Hawaiian Telcom Holdco HCOM Dec $0.70 $0.92 $0.84 $1.10 McCarver Heartland Payment Systems HPY Dec $2.83 $2.82 $3.16 $3.07 Huff Helmerich & Payne HP Sep $2.95 $3.05 $0.62 $1.38 Marietta Hibbett Sports HIBB Jan $3.00 $3.03 Nelson Hilltop Holdings HTH Dec $1.61 $1.65 $1.86 $1.83 Olney Hormel Foods HRL Oct $2.88 $2.80 Aslam Hornbeck Offshore Services HOS Dec $0.65 $1.04 $0.53 $1.28 Marietta Imperva IMPV Dec ($0.70) ($0.85) ($0.45) ($0.52) Ruykhaver Infoblox BLOX Jul $0.35 $0.29 $0.41 $0.39 Ruykhaver Ingredion INGR Dec $5.60 $5.40 $6.10 $6.00 Aslam Insulet PODD Dec ($0.39) $0.07 $0.02 $0.09 Cooley Integrated Device Tech. IDTI Mar $1.13 $1.00 Kumar Intrawest Resorts Holdings SNOW Jun ($0.20) ($0.21) $0.16 $0.02 Edelstein Jack Henry JKHY Jun $2.62 $2.68 $2.75 $2.97 Huff JP Energy Partners JPEP Dec $1.25 $1.14 $1.47 $1.50 Schmid Kate Spade KATE Dec $0.80 $0.90 Patel Kirby KEX Dec $4.30 $4.65 $4.35 $4.60 Atkins Kaman KAMN Dec $2.46 $2.50 $2.78 $2.80 Duncan Key Energy KEG Dec ($0.71) ($0.62) ($0.47) ($0.42) Marietta Laredo Petroleum LPI Dec $2.17 $1.46 $1.38 $1.35 Green LDR Holding LDRH Dec ($0.70) ($0.57) ($0.22) ($0.17) Cooley LendingTree TREE Dec $2.19 $2.00 $2.90 $2.70 Campbell LKQ LKQ Dec $1.40 $1.37 $1.59 $1.57 Lawrence Luminex LMNX Dec $0.58 $0.50 $0.68 $0.65 Jones Magnum Hunter Resources MHR Dec ($0.14) ($0.06) ($0.08) $0.47 Wyatt Marchex MCHX Dec $0.16 $0.17 Campbell MarkWest Energy Partners MWE Dec $3.67 $3.71 $4.20 $4.66 Schmid
Monthly Statistical Review Member NYSE, SPIC June 2015, Page 12
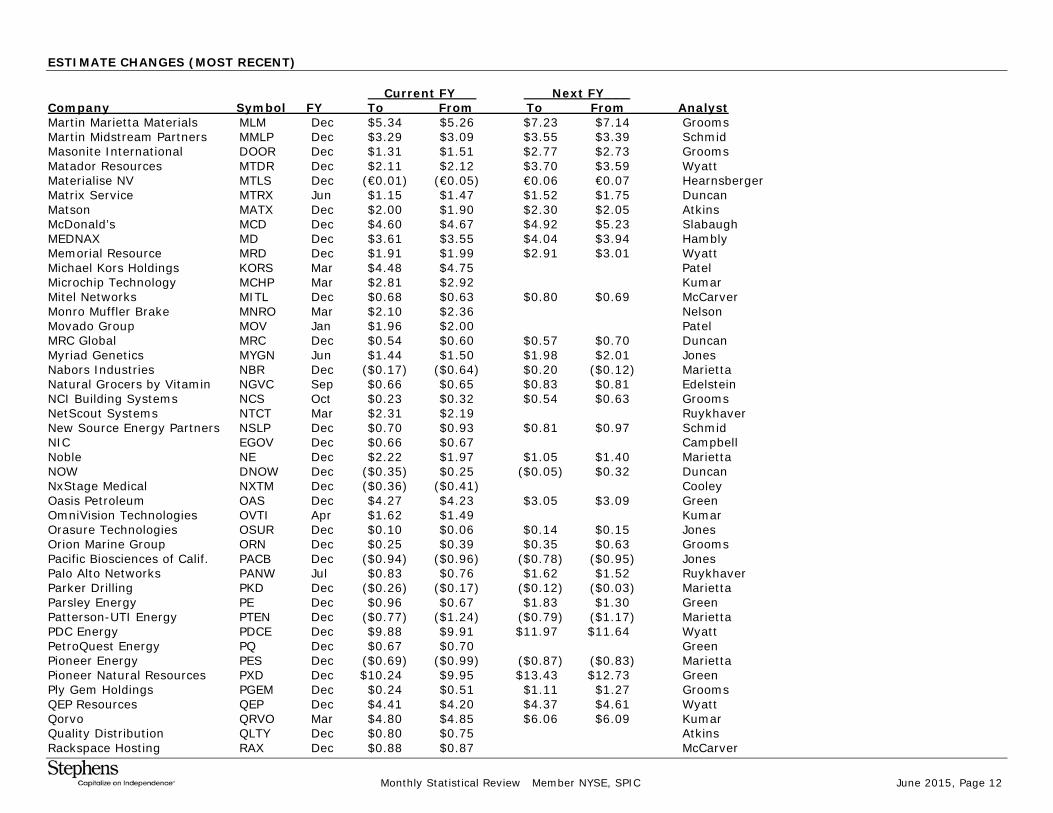
ESTIMATE CHANGES (MOST RECENT) Current FY Next FY___ Company Symbol FY To From To From Analyst Martin Marietta Materials MLM Dec $5.34 $5.26 $7.23 $7.14 Grooms Martin Midstream Partners MMLP Dec $3.29 $3.09 $3.55 $3.39 Schmid Masonite International DOOR Dec $1.31 $1.51 $2.77 $2.73 Grooms Matador Resources MTDR Dec $2.11 $2.12 $3.70 $3.59 Wyatt Materialise NV MTLS Dec (€0.01) (€0.05) €0.06 €0.07 Hearnsberger Matrix Service MTRX Jun $1.15 $1.47 $1.52 $1.75 Duncan Matson MATX Dec $2.00 $1.90 $2.30 $2.05 Atkins McDonald’s MCD Dec $4.60 $4.67 $4.92 $5.23 Slabaugh MEDNAX MD Dec $3.61 $3.55 $4.04 $3.94 Hambly Memorial Resource MRD Dec $1.91 $1.99 $2.91 $3.01 Wyatt Michael Kors Holdings KORS Mar $4.48 $4.75 Patel Microchip Technology MCHP Mar $2.81 $2.92 Kumar Mitel Networks MITL Dec $0.68 $0.63 $0.80 $0.69 McCarver Monro Muffler Brake MNRO Mar $2.10 $2.36 Nelson Movado Group MOV Jan $1.96 $2.00 Patel MRC Global MRC Dec $0.54 $0.60 $0.57 $0.70 Duncan Myriad Genetics MYGN Jun $1.44 $1.50 $1.98 $2.01 Jones Nabors Industries NBR Dec ($0.17) ($0.64) $0.20 ($0.12) Marietta Natural Grocers by Vitamin NGVC Sep $0.66 $0.65 $0.83 $0.81 Edelstein NCI Building Systems NCS Oct $0.23 $0.32 $0.54 $0.63 Grooms NetScout Systems NTCT Mar $2.31 $2.19 Ruykhaver New Source Energy Partners NSLP Dec $0.70 $0.93 $0.81 $0.97 Schmid NIC EGOV Dec $0.66 $0.67 Campbell Noble NE Dec $2.22 $1.97 $1.05 $1.40 Marietta NOW DNOW Dec ($0.35) $0.25 ($0.05) $0.32 Duncan NxStage Medical NXTM Dec ($0.36) ($0.41) Cooley Oasis Petroleum OAS Dec $4.27 $4.23 $3.05 $3.09 Green OmniVision Technologies OVTI Apr $1.62 $1.49 Kumar Orasure Technologies OSUR Dec $0.10 $0.06 $0.14 $0.15 Jones Orion Marine Group ORN Dec $0.25 $0.39 $0.35 $0.63 Grooms Pacific Biosciences of Calif. PACB Dec ($0.94) ($0.96) ($0.78) ($0.95) Jones Palo Alto Networks PANW Jul $0.83 $0.76 $1.62 $1.52 Ruykhaver Parker Drilling PKD Dec ($0.26) ($0.17) ($0.12) ($0.03) Marietta Parsley Energy PE Dec $0.96 $0.67 $1.83 $1.30 Green Patterson-UTI Energy PTEN Dec ($0.77) ($1.24) ($0.79) ($1.17) Marietta PDC Energy PDCE Dec $9.88 $9.91 $11.97 $11.64 Wyatt PetroQuest Energy PQ Dec $0.67 $0.70 Green Pioneer Energy PES Dec ($0.69) ($0.99) ($0.87) ($0.83) Marietta Pioneer Natural Resources PXD Dec $10.24 $9.95 $13.43 $12.73 Green Ply Gem Holdings PGEM Dec $0.24 $0.51 $1.11 $1.27 Grooms QEP Resources QEP Dec $4.41 $4.20 $4.37 $4.61 Wyatt Qorvo QRVO Mar $4.80 $4.85 $6.06 $6.09 Kumar Quality Distribution QLTY Dec $0.80 $0.75 Atkins Rackspace Hosting RAX Dec $0.88 $0.87 McCarver

Monthly Statistical Review Member NYSE, SPIC June 2015, Page 13
ESTIMATE CHANGES (MOST RECENT) Current FY Next FY___ Company Symbol FY To From To From Analyst Ralph Lauren RL Mar $7.00 $7.25 Patel Range Resources RRC Dec $4.62 $5.05 $5.49 $5.72 Green Raven Industries RAVN Jan $0.72 $0.75 $0.83 $0.85 Hearnsberger Red Robin Gourmet Burgers RRGB Dec $3.30 $3.12 $3.95 $3.63 Slabaugh Repligen RGEN Dec $0.32 $0.27 Jones Rex Energy REXX Dec $0.74 $0.98 $1.22 $1.06 Wyatt Rice Energy RICE Dec $2.09 $1.85 $2.90 $2.56 Wyatt Rocket Fuel FUEL Dec ($0.97) ($0.96) Huff Rosetta Resources ROSE Dec $3.73 $3.98 $3.73 $3.82 Green Rovi Corp. ROVI Dec $1.56 $1.61 $2.05 $2.13 Quillin RPC RES Dec ($0.01) $0.19 Marietta RSP Permian RSPP Dec $2.44 $2.50 $3.11 $2.84 Green Ruckus Wireless RKUS Dec $0.41 $0.48 $0.47 $0.62 Quillin Ryerson Holding RYI Dec $0.14 $0.40 $1.30 $1.28 Duncan Salesforce.com CRM Jan $0.71 $0.67 $0.97 $0.81 Zukin Sanchez Energy SN Dec $3.25 $3.23 $4.18 $4.67 Wyatt SandRidge Energy SD Dec $0.55 $0.47 $0.41 $0.49 Wyatt Schlumberger SLB Dec $3.34 $3.32 $3.51 $3.29 Marietta Semtech SMTC Jan $1.26 $1.62 Kumar Seventy Seven Energy SSE Dec ($3.55) ($3.74) ($2.30) ($2.68) Marietta Sierra Wireless SWIR Dec $1.30 $1.45 Quillin Signet Jewelers SIG Jan $6.60 $6.55 $7.38 $7.30 Patel Sirona Dental Systems SIRO Sep $4.24 $4.32 Cooley Skyworks Solutions SWKS Sep $5.08 $4.82 $5.61 $5.35 Kumar Southwest Bancorp OKSB Dec $0.91 $0.88 $1.07 $0.96 Olney Splunk SPLK Jan $0.13 $0.12 $0.30 $0.28 Ruykhaver Springleaf Holdings LEAF Dec $2.14 $2.35 $2.38 $2.66 Bizzell Sprouts Farmers Market SFM Dec $0.84 $0.87 $1.05 $1.08 Edelstein State Bank Financial STBZ Dec $1.11 $1.04 $1.27 $1.22 Stafford STERIS STE Mar $3.25 $3.14 Cooley Summit Materials SUM Dec $0.68 $0.83 $1.04 $1.06 Grooms Sunoco LP SUN Dec $3.45 $4.61 $4.30 $5.11 Lawrence Superior Energy SPN Dec ($0.92) ($0.52) ($0.02) $0.17 Marietta Surgical Care Affiliates SCAI Dec $2.10 $2.35 $2.32 $2.65 Hambly Symantec SYMC Mar $1.87 $1.86 Ruykhaver Team Health Holdings TMH Dec $2.68 $2.36 $3.01 $2.70 Hambly TearLab TEAR Dec ($0.89) ($0.77) ($0.77) ($0.76) Jones TechTarget TTGT Dec $0.33 $0.41 $0.43 $0.58 Evans Teleflex TFX Dec $6.18 $6.14 $7.09 $7.30 Cooley Texas Roadhouse TXRH Dec $1.46 $1.44 $1.75 $1.73 Slabaugh Tiffany TIF Jan $4.32 $4.24 Patel Titan Machinery TITN Jan $0.14 $0.07 Nelson TiVo TIVO Jan $0.42 $0.41 Quillin TravelCenters of America TA Dec $1.34 $1.21 $1.88 $1.53 Lawrence

Monthly Statistical Review Member NYSE, SPIC June 2015, Page 14
ESTIMATE CHANGES (MOST RECENT) Current FY Next FY___ Company Symbol FY To From To From Analyst TreeHouse Foods THS Dec $3.40 $3.90 $3.70 $4.45 Aslam Trex Co. TREX Dec $1.71 $1.70 $2.21 $2.20 Grooms TrueCar TRUE Dec $0.15 $0.16 Evans Tuesday Morning TUES Jun $0.68 $0.74 Lawrence Tumi Holdings TUMI Dec $0.92 $1.00 $1.03 $1.13 Patel Tyson Foods TSN Sep $3.55 $3.45 $3.90 $3.75 Aslam U.S. Concrete USCR Dec $2.88 $2.79 $2.69 $2.76 Grooms U.S. Physical Therapy USPH Dec $1.91 $1.87 Hambly Ubiquiti Networks UBNT Jun $1.93 $2.00 $2.00 $2.20 Quillin United Natural Foods UNFI Jul $2.92 $2.99 $3.30 $3.40 Edelstein USA Truck USAK Dec $1.00 $0.95 Delco Veracyte VCYT Dec ($1.17) ($1.25) ($0.98) ($0.83) Jones Veritex Holdings VBTX Dec $0.78 $0.72 Olney Veronis Systems VRNS Dec ($0.71) ($0.54) ($0.32) ($0.21) Ruykhaver ViaSat VSAT Mar $1.54 $1.67 $1.37 $1.56 Quillin Vitamin Shoppe VSI Dec $2.06 $2.40 $2.38 $2.79 Edelstein Voxeljet VJET Dec (€0.25) (€0.42) (€0.20) (€0.26) Hearnsberger Vulcan Materials VMC Dec $2.15 $2.09 $3.11 $3.14 Grooms Wal-Mart WMT Jan $4.74 $4.86 $5.03 $5.18 Lawrence Weatherford International WFT Dec ($0.16) ($0.11) $0.25 $0.07 Marietta Wendy’s WEN Dec $0.31 $0.34 $0.33 $0.37 Slabaugh Whitewave Foods WWAV Dec $1.13 $1.10 $1.30 $1.27 Aslam Whiting Petroleum WLL Dec $4.41 $5.04 $7.04 $7.32 Green Whole Foods Market WFM Sep $1.75 $1.77 $1.91 $1.96 Edelstein Windstream WIN Dec $0.51 $0.47 $0.46 $0.78 McCarver Workday WDAY Jan ($0.15) ($0.12) ($0.01) $0.27 Zukin World Fuel Services INT Dec $3.35 $3.55 $3.70 $3.85 Atkins World Point Terminals WPT Dec $1.60 $1.44 $1.60 $1.46 Schmid XPO Logistics XPO Dec ($0.34) ($0.44) ($0.11) $0.02 Atkins Zayo Group Holdings ZAYO Jun ($0.33) ($0.20) $0.24 $0.35 McCarver Zillow Z Dec ($0.19) ($0.12) $1.91 $2.20 Campbell
Monthly Statistical Review Member NYSE, SPIC June 2015, Page 15
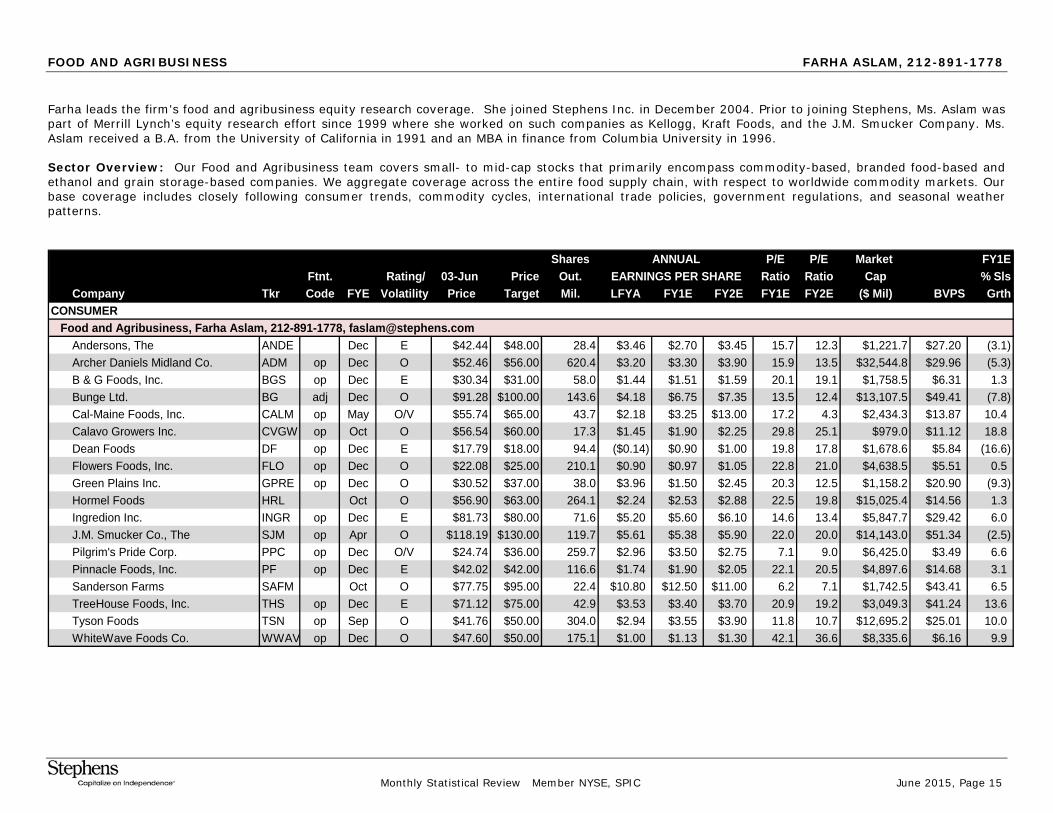
FOOD AND AGRIBUSINESS FARHA ASLAM, 212-891-1778
Farha leads the firm's food and agribusiness equity research coverage. She joined Stephens Inc. in December 2004. Prior to joining Stephens, Ms. Aslam was part of Merrill Lynch’s equity research effort since 1999 where she worked on such companies as Kellogg, Kraft Foods, and the J.M. Smucker Company. Ms. Aslam received a B.A. from the University of California in 1991 and an MBA in finance from Columbia University in 1996. Sector Overview: Our Food and Agribusiness team covers small- to mid-cap stocks that primarily encompass commodity-based, branded food-based and ethanol and grain storage-based companies. We aggregate coverage across the entire food supply chain, with respect to worldwide commodity markets. Our base coverage includes closely following consumer trends, commodity cycles, international trade policies, government regulations, and seasonal weather patterns.
Shares ANNUAL P/E P/E Market FY1E
Ftnt. Rating/ 03-Jun Price Out. EARNINGS PER SHARE Ratio Ratio Cap % SlsCompany Tkr Code FYE Volatility Price Target Mil. LFYA FY1E FY2E FY1E FY2E ($ Mil) BVPS Grth
CONSUMER Food and Agribusiness, Farha Aslam, 212-891-1778, [email protected]
Andersons, The ANDE Dec E $42.44 $48.00 28.4 $3.46 $2.70 $3.45 15.7 12.3 $1,221.7 $27.20 (3.1)Archer Daniels Midland Co. ADM op Dec O $52.46 $56.00 620.4 $3.20 $3.30 $3.90 15.9 13.5 $32,544.8 $29.96 (5.3)B & G Foods, Inc. BGS op Dec E $30.34 $31.00 58.0 $1.44 $1.51 $1.59 20.1 19.1 $1,758.5 $6.31 1.3Bunge Ltd. BG adj Dec O $91.28 $100.00 143.6 $4.18 $6.75 $7.35 13.5 12.4 $13,107.5 $49.41 (7.8)Cal-Maine Foods, Inc. CALM op May O/V $55.74 $65.00 43.7 $2.18 $3.25 $13.00 17.2 4.3 $2,434.3 $13.87 10.4Calavo Growers Inc. CVGW op Oct O $56.54 $60.00 17.3 $1.45 $1.90 $2.25 29.8 25.1 $979.0 $11.12 18.8Dean Foods DF op Dec E $17.79 $18.00 94.4 ($0.14) $0.90 $1.00 19.8 17.8 $1,678.6 $5.84 (16.6)Flowers Foods, Inc. FLO op Dec O $22.08 $25.00 210.1 $0.90 $0.97 $1.05 22.8 21.0 $4,638.5 $5.51 0.5Green Plains Inc. GPRE op Dec O $30.52 $37.00 38.0 $3.96 $1.50 $2.45 20.3 12.5 $1,158.2 $20.90 (9.3)Hormel Foods HRL Oct O $56.90 $63.00 264.1 $2.24 $2.53 $2.88 22.5 19.8 $15,025.4 $14.56 1.3Ingredion Inc. INGR op Dec E $81.73 $80.00 71.6 $5.20 $5.60 $6.10 14.6 13.4 $5,847.7 $29.42 6.0J.M. Smucker Co., The SJM op Apr O $118.19 $130.00 119.7 $5.61 $5.38 $5.90 22.0 20.0 $14,143.0 $51.34 (2.5)Pilgrim's Pride Corp. PPC op Dec O/V $24.74 $36.00 259.7 $2.96 $3.50 $2.75 7.1 9.0 $6,425.0 $3.49 6.6Pinnacle Foods, Inc. PF op Dec E $42.02 $42.00 116.6 $1.74 $1.90 $2.05 22.1 20.5 $4,897.6 $14.68 3.1Sanderson Farms SAFM Oct O $77.75 $95.00 22.4 $10.80 $12.50 $11.00 6.2 7.1 $1,742.5 $43.41 6.5TreeHouse Foods, Inc. THS op Dec E $71.12 $75.00 42.9 $3.53 $3.40 $3.70 20.9 19.2 $3,049.3 $41.24 13.6Tyson Foods TSN op Sep O $41.76 $50.00 304.0 $2.94 $3.55 $3.90 11.8 10.7 $12,695.2 $25.01 10.0WhiteWave Foods Co. WWAV op Dec O $47.60 $50.00 175.1 $1.00 $1.13 $1.30 42.1 36.6 $8,335.6 $6.16 9.9

Monthly Statistical Review Member NYSE, SPIC June 2015, Page 16
HEALTHY LIVING JOE EDELSTEIN, CFA 312-292-5762
Joe is a research analyst covering the healthy living sector. He joined Stephens in May 2011 as a member of the hardline retail team. Prior to joining Stephens, Joe served as a summer equity analyst at Invesco Ltd. and earlier held equity research roles at BMO Capital Markets and Raymond James Financial. Joe graduated with a BSBA, cum laude, from the University of Arkansas, and he holds an MBA from Goizueta Business School at Emory University. He earned the Chartered Financial Analyst designation in 2010. Sector Overview: Our research focus is on growth companies that benefit from consumer trends toward Healthy Living. We provide in-depth research coverage beyond what is typically provided by Wall Street. We seek companies that reinforce the value proposition and create sustainable competitive positioning through cost advantages or their ability to manage scarce resources. For Healthy Living retailers, we seek companies with competitive advantage related to the major elements that drive consumer choice.
Shares ANNUAL P/E P/E Market FY1E
Ftnt. Rating/ 03-Jun Price Out. EARNINGS PER SHARE Ratio Ratio Cap % SlsCompany Tkr Code FYE Volatility Price Target Mil. LFYA FY1E FY2E FY1E FY2E ($ Mil) BVPS Grth
CONSUMER Healthy Living, Joe Edelstein, CFA, 312-292-5762, [email protected]
ClubCorp Holdings, Inc. MYCC Dec O/V $23.04 $27.00 64.6 $0.21 $0.57 $0.71 40.4 32.5 $1,488.7 $3.26 18.8Fresh Market, The TFM op Jan O/V $32.69 $49.00 48.6 $1.61 $1.81 $2.05 18.1 15.9 $1,588.8 $7.17 9.7GNC Holdings, Inc. GNC op Dec E $45.09 $46.00 86.6 $2.87 $3.06 $3.25 14.7 13.9 $3,904.8 $8.46 1.9Intrawest Resorts Holdings SNOW Jun O/V $12.73 $16.00 45.2 ($4.37) ($0.20) $0.16 NM 79.6 $575.4 $5.15 9.3Natural Grocers by Vitamin Cottage NGVC op Sep E/V $24.87 $33.00 22.5 $0.60 $0.66 $0.83 37.7 30.0 $559.4 $4.56 21.7Sprouts Farmers Market SFM op Dec O/V $29.20 $35.00 153.3 $0.72 $0.84 $1.05 34.8 27.8 $4,476.4 $4.84 20.9United Natural Foods, Inc. UNFI op Jul O/V $66.66 $78.00 50.1 $2.52 $2.92 $3.30 22.8 20.2 $3,338.0 $26.08 21.6Vail Resorts, Inc. MTN Jul O $105.52 $121.00 36.4 $0.77 $3.09 $3.14 34.1 33.6 $3,835.3 $23.37 12.0Vitamin Shoppe, Inc. VSI op Dec O $40.21 $49.00 29.7 $2.19 $2.06 $2.38 19.5 16.9 $1,196.0 $18.82 6.6Whole Foods Market, Inc. WFM op Sep E/V $41.05 $51.00 360.8 $1.57 $1.75 $1.91 23.5 21.5 $14,707.4 $10.90 9.5

Monthly Statistical Review Member NYSE, SPIC June 2015, Page 17
RESTAURANTS WILL SLABAUGH, 501-377-2259
Will is a research analyst leading the restaurant industry. Previously, Will was a research associate in the IT services and digital marketing industries and an analyst in the Corporate Finance department, where he focused on various industries including consumer, information technology and telecommunications services. Will joined Stephens in 2007. He graduated with honors and holds a B.S. in international business from the Sam M. Walton College of Business at the University of Arkansas.
Sector Overview: The restaurant industry is broad and fragmented due to the diversity of offerings and level of service. While we seek to take a holistic view of the industry, the majority of our coverage is focused on companies in the casual dining segment, though we also follow the quick-service (QSR) segment, family dining segment and quick/fast casual. We believe that key industry trends to watch in the coming quarters and years will include operating cost containment amid unstable commodity prices, consumer sentiment and discretionary spend, a scarcity of strong concept growth, as well as broader macroeconomic indicators.
Shares ANNUAL P/E P/E Market FY1E
Ftnt. Rating/ 03-Jun Price Out. EARNINGS PER SHARE Ratio Ratio Cap % SlsCompany Tkr Code FYE Volatility Price Target Mil. LFYA FY1E FY2E FY1E FY2E ($ Mil) BVPS Grth
CONSUMER Restaurants, Will Slabaugh, 501-377-2259, [email protected]
BJ's Restaurants BJRI adj Dec O $46.85 $58.00 26.2 $1.03 $1.38 $1.63 33.9 28.7 $1,228.7 $13.63 11.0Bob Evans Farms BOBE adj Apr U $46.59 $40.00 23.6 $1.41 $1.42 $1.55 32.8 30.1 $1,101.6 $15.78 1.5Bojangles', Inc. BOJA adj Dec E/V $25.58 $26.00 35.9 NA $0.66 $0.76 38.8 33.7 $918.4 NM 12.8Buffalo Wild Wings, Inc. BWLD adj Dec O/V $152.29 $210.00 18.9 $5.15 $5.85 $6.89 26.0 22.1 $2,892.7 $30.30 18.4Carrols Restaurant Group TAST adj Dec O $10.07 $12.00 35.5 ($1.21) ($0.33) $0.02 NM NM $357.5 $2.80 19.2Cheesecake Factory, The CAKE adj Dec E $52.43 $55.00 48.6 $1.96 $2.22 $2.52 23.6 20.8 $2,556.6 $11.16 6.6Chuy's Holdings, Inc. CHUY adj Dec O $26.64 $34.00 16.4 $0.69 $0.77 $0.88 34.6 30.3 $438.7 $7.19 16.3Darden Restaurants DRI adj May E $65.32 $68.00 124.1 $2.40 $2.52 $2.90 25.9 22.5 $8,216.7 $18.04 (16.3)Del Frisco's Restaurant Group DFRG adj Dec O $18.77 $25.00 23.6 $0.82 $0.97 $1.13 19.4 16.6 $443.0 $9.26 17.2Denny's Corp. DENN adj Dec E/V $10.65 $12.00 84.4 $0.38 $0.44 $0.48 24.2 22.2 $898.5 $0.02 2.6Dunkin' Brands Group DNKN adj Dec E $52.43 $52.00 96.7 $1.74 $1.91 $2.23 27.5 23.5 $5,045.7 ($0.95) 6.3Fiesta Restaurant Group FRGI adj Dec O/V $47.19 $80.00 26.8 $1.38 $1.60 $1.90 29.5 24.8 $1,265.8 $7.57 14.4Good Times Restaurants GTIM adj Sep O/V $9.09 $11.50 12.3 ($0.12) $0.02 $0.19 NM 47.8 $111.3 $1.69 57.7Habit Restaurants, Inc. HABT adj Dec E/V $35.08 $34.00 13.1 $0.19 $0.23 $0.28 NM NM $482.9 $1.60 28.0Krispy Kreme Doughnuts KKD adj Jan O/V $17.31 $23.00 64.8 $0.72 $0.82 $0.96 21.1 18.0 $1,122.7 $4.03 15.1McDonald's Corp. MCD Dec O $96.52 $115.00 959.1 $4.83 $4.60 $4.92 21.0 19.6 $92,515.9 $13.35 (11.7)Papa Murphy's Holdings FRSH adj Dec O $17.35 $20.00 16.9 $0.44 $0.53 $0.61 32.7 28.4 $294.0 $5.39 19.8Red Robin Gourmet Burgers RRGB adj Dec O $84.35 $100.00 14.1 $2.66 $3.30 $3.95 25.6 21.4 $1,191.4 $26.92 12.2Restaurant Brands International QSR adj Dec E $38.75 $40.00 202.1 ($0.83) $0.98 $1.15 39.5 33.7 $7,839.3 NA 1.0Sonic Corp. SONC Aug O $30.08 $40.00 53.5 $0.84 $1.07 $1.23 28.1 24.5 $1,564.2 $1.15 9.8Starbucks Corp. SBUX Sep E $52.12 $52.00 1,499.6 $1.34 $1.57 $1.90 33.2 27.4 $78,159.2 $3.85 17.6Texas Roadhouse TXRH adj Dec O $35.65 $42.00 70.0 $1.23 $1.46 $1.75 24.4 20.4 $2,495.4 $8.73 13.9Wendy's Co., The WEN adj Dec O $11.47 $13.00 363.2 $0.34 $0.31 $0.33 37.0 34.8 $4,165.5 $4.70 (15.0)Zoe's Kitchen, Inc. ZOES adj Dec E/V $32.52 $32.00 19.3 $0.03 $0.06 $0.18 NM NM $628.1 $6.35 27.5

Monthly Statistical Review Member NYSE, SPIC June 2015, Page 18
RETAIL/BROADLINE JOHN R. LAWRENCE, 901-821-7435
John R. Lawrence is a managing director and research analyst following the broadline retail industry. Prior to joining the firm in April 2012, John was a managing director and analyst at Morgan Keegan and Company, Inc. following consumer stocks since 1997. He also worked for Principal Financial Securities in Dallas, Texas following the consumer/distribution industries for four years. John has been ranked twice by the StarMine/Financial Times as the top stock picker within the special retail category and ranked in the Wall Street Journal Best on the Street Analyst Survey. He earned an Executive MBA from the Owen School of Management at Vanderbilt and holds a BBA from the University of Memphis.
Sector Overview: Our research focuses on small-, mid- and large-cap growth retail operators. The primary industries for which we provide analysis are aftermarket automotive, convenience stores, discount retailers and high-growth specialty retailers. We look for retailers that have solid fundamentals, operate in strong markets, offer differentiated services and have experienced management teams that can execute business strategies.
Shares ANNUAL P/E P/E Market FY1EFtnt. Rating/ 03-Jun Price Out. EARNINGS PER SHARE Ratio Ratio Cap % Sls
Company Tkr Code FYE Volatility Price Target Mil. LFYA FY1E FY2E FY1E FY2E ($ Mil) BVPS GrthCONSUMER Retail/Broadline, John R. Lawrence, 901-821-7435, [email protected]
Advance Auto Parts AAP adj Dec E/V $156.53 $137.00 73.2 $7.79 $8.26 $9.12 19.0 17.2 $11,454.6 $27.41 1.3AutoZone Inc. AZO Aug O/V $681.79 $803.00 31.7 $31.57 $36.08 $41.18 18.9 16.6 $21,628.4 ($46.04) 7.6Casey's General Stores CASY adj Apr O $88.27 $103.00 38.9 $3.49 $4.37 $4.24 20.2 20.8 $3,429.4 $21.60 (0.8)Copart, Inc. CPRT adj Jul O/V $34.55 $43.00 126.5 $1.53 $1.61 $1.77 21.5 19.5 $4,371.3 $8.98 (1.7)Core-Mark Holding Co. CORE adj Dec O/V $55.07 $70.00 23.1 $2.26 $2.34 $2.45 23.5 22.5 $1,271.7 $19.84 5.9CrossAmerica Partners LP CAPL cf Dec O/V $34.28 $43.00 17.0 $1.77 $2.55 $2.91 13.4 11.8 $583.7 $8.30 50.0CST Brands Inc. CST adj Dec O/V $39.92 $46.00 76.9 $2.49 $1.76 $2.01 22.7 19.9 $3,068.5 $9.65 (13.5)Fred's Inc. FRED adj Jan O/V $18.14 $21.00 37.2 ($0.17) $0.54 $0.75 33.6 24.2 $674.0 $11.24 12.7KAR Auction Services KAR op Dec O $38.18 $42.00 141.8 $1.64 $1.67 $1.84 22.9 20.8 $5,412.5 $10.97 6.4LKQ Corp. LKQ op Dec O/V $29.24 $34.00 304.1 $1.27 $1.40 $1.59 20.9 18.4 $8,894.5 $9.14 7.3MarineMax, Inc. HZO op Sep O/V $25.08 $29.00 25.5 $0.40 $0.82 $1.37 30.6 18.3 $639.4 $9.91 20.7Murphy USA Inc. MUSA adj Dec O/V $59.25 $79.00 45.5 $4.97 $3.49 $3.93 17.0 15.1 $2,681.8 $18.36 (22.0)O'Reilly Automotive, Inc. ORLY Dec O/V $224.22 $264.00 101.8 $7.34 $8.64 $9.96 26.0 22.5 $22,644.0 $21.15 7.9Sunoco LP SUN cf Dec O $46.70 $65.00 24.1 $3.21 $3.45 $4.30 13.5 10.9 $1,125.4 $47.40 103.7Tractor Supply Co. TSCO Dec O/V $90.25 $107.00 136.5 $2.66 $3.07 $3.57 29.4 25.3 $12,312.5 $9.49 10.0TravelCenters of America TA adj Dec O/V $15.79 $19.00 38.4 $1.62 $1.34 $1.88 11.8 8.4 $605.5 $13.53 (9.6)Tuesday Morning Corp. TUES adj Jun E/V $13.62 $23.00 44.1 $0.01 $0.31 $0.68 43.9 20.0 $600.1 $5.11 5.5Wal-Mart Stores,Inc. WMT pf Jan O $74.89 $90.00 3,225.5 $5.07 $4.74 $5.03 15.8 14.9 $241,557.9 $23.74 0.8
Please see the detailed risk section for each MLP at the end of this report. Investors should also review the risk factors identified by the companies as disclosed in the documents filed by each company with the SEC which can be viewed by clicking the following company names: CrossAmerica Partners LP, Sunoco LP

Monthly Statistical Review Member NYSE, SPIC June 2015, Page 19
RETAIL/HARDLINES RICK NELSON, CPA, CFA, 312-292-5768
Rick is a managing director leading the retail/hardlines practice. Before joining Stephens in 1998, he was a managing director at Nesbitt Burns Securities, Inc. and Duff & Phelps Capital Markets, Inc. Rick has been a Wall Street Journal All-Star Analyst for stock selection in specialty retailing and recognized in the Institutional Investor research poll. He holds a B.S. and M.B.A. from Miami University (Ohio). Rick is a CPA and CFA charter holder and is licensed as a supervisory analyst.
Sector Overview: Our research focus is on small- and mid-cap growth retailers. We provide in-depth research coverage beyond what is typically provided by Wall Street, and we have special expertise in the specialty retailing, sporting goods and automotive retailing segments. We seek retailers with competitive advantage as to the major elements that drive store choice, including: merchandise assortment and presentation, location, store format, shopping environment, customer service and day-to-day execution. Retailers must provide a good value proposition for consumers. We look for strong management with a well-defined business strategy and the ability to execute those plans.
Shares ANNUAL P/E P/E Market FY1E
Ftnt. Rating/ 03-Jun Price Out. EARNINGS PER SHARE Ratio Ratio Cap % SlsCompany Tkr Code FYE Volatility Price Target Mil. LFYA FY1E FY2E FY1E FY2E ($ Mil) BVPS Grth
CONSUMER Retail/Hardlines, Rick Nelson, CPA, CFA, 312-292-5768, [email protected]
Asbury Automotive Group, Inc. ABG op Dec O $87.46 $94.00 27.7 $4.36 $5.57 $5.86 15.7 14.9 $2,383.1 $15.60 9.2AutoNation, Inc. AN op Dec E $63.89 $68.00 114.0 $3.49 $4.01 $4.20 15.9 15.2 $7,285.1 $18.29 7.8Cabela's Inc. CAB op Dec O $51.99 $66.00 71.6 $2.88 $3.17 $3.66 16.4 14.2 $3,721.6 $25.60 12.9CarMax, Inc. KMX Feb E $72.81 $76.00 210.0 $2.73 $3.02 $3.43 24.1 21.2 $15,234.0 $14.24 11.0Conn's, Inc. CONN op Jan E $38.54 $40.00 36.4 $1.69 $1.96 $2.47 19.7 15.6 $1,403.2 $18.43 10.7Dick's Sporting Goods, Inc. DKS op Jan E $54.00 $59.00 118.9 $2.87 $3.18 $3.50 17.0 15.4 $5,051.9 $15.51 8.5Group 1 Automotive, Inc. GPI op Dec E $87.38 $97.00 24.3 $5.87 $6.62 $6.96 13.2 12.6 $2,039.2 $39.59 4.6Hibbett Sports, Inc. HIBB Jan O $47.03 $63.00 24.9 $2.87 $3.00 $3.47 15.7 13.6 $1,170.9 $13.92 6.3Lithia Motors, Inc. LAD op Dec O $110.27 $110.00 23.7 $5.11 $6.30 $6.85 17.5 16.1 $2,622.0 $26.97 42.7Lumber Liquidators LL Dec O $21.58 $35.00 27.1 $2.31 $0.48 $1.74 45.0 12.4 $584.4 $12.01 2.9Michaels Companies MIK Jan O $28.25 $33.00 209.0 $1.46 $1.69 $1.94 16.7 14.6 $5,854.3 ($15.90) 3.8Monro Muffler Brake MNRO Mar O $61.35 $70.00 31.6 $1.67 $1.88 $2.10 32.6 29.2 $1,952.7 $14.52 8.4Party City Holdco Inc. PRTY op Dec O $21.55 $25.00 119.3 NM $0.84 $1.06 25.7 20.3 $2,569.9 $5.06 2.6Penske Automotive Group, Inc. PAG op Dec O $52.56 $58.00 90.2 $3.27 $3.68 $3.86 14.3 13.6 $4,743.2 $18.21 9.7Sonic Automotive, Inc. SAH op Dec E $24.12 $24.00 38.9 $1.90 $1.90 $2.02 12.7 11.9 $936.9 $13.09 3.9Titan Machinery TITN Jan E/V $15.49 $11.00 21.4 ($0.09) $0.14 $0.19 NM 81.5 $331.4 $17.10 (17.9)

Monthly Statistical Review Member NYSE, SPIC June 2015, Page 20
RETAIL/SOFTLINES RICK PATEL, CFA, 212-891-1715
Rick is a research analyst and leads the firm’s research coverage of the retail/softlines industry. Prior to joining Stephens in March 2013, Rick spent 5 years at Bank of America Merrill Lynch equity research, where he led the firm’s coverage of small and mid-cap retailers in the jewelry/luxury, p\off-price, and children’s apparel industries. From 2000-2007, he was at Lehman Brothers equity research as an associate on the major pharmaceutical team for 4 years, and as a senior analyst for the life science tools & diagnostics industry for 3 years. Rick received an M.B.A. from the NYU-Stern School of Business and is a CFA charter holder. He also holds a B.S. in finance, B.S. in biology and B.A. in economics from Rutgers University.
Sector Overview: Our research focus is on small- and mid-cap retailers in the jewelry and accessories areas. Our research approach entails thorough quantitative and financial analysis at the macroeconomic and company-specific levels. We aim to differentiate our research by having very detailed financial models for each company. We are drawn to retailers that have growth opportunities and competitive advantages through strong merchandising, marketing and operations. We also look for strong management with a well-defined business strategy and ability to execute on growth initiatives.
Shares ANNUAL P/E P/E Market FY1E
Ftnt. Rating/ 03-Jun Price Out. EARNINGS PER SHARE Ratio Ratio Cap % SlsCompany Tkr Code FYE Volatility Price Target Mil. LFYA FY1E FY2E FY1E FY2E ($ Mil) BVPS Grth
CONSUMER Retail/Softlines, Rick Patel, CFA, 212-891-1715, [email protected]
Abercrombie & Fitch Co. ANF adj Jan U/V $22.18 $16.00 69.6 $1.54 $0.65 $1.17 34.1 19.0 $1,542.6 $18.80 (7.2)Aeropostale, Inc. ARO adj Jan E/V $1.95 $3.00 79.5 ($1.42) ($1.36) ($0.91) NM NM $155.1 $1.18 (9.2)American Eagle Outfitters AEO adj Jan O/V $16.47 $19.00 195.1 $0.63 $1.02 $1.11 16.1 14.8 $3,218.6 $5.86 6.7Blue Nile NILE adj Dec O/V $28.66 $34.00 11.9 $0.80 $0.88 $0.98 32.6 29.2 $340.1 $1.16 6.1Carter's, Inc. CRI adj Dec O/V $104.09 $110.00 52.5 $3.93 $4.48 $5.20 23.2 20.0 $5,468.8 $15.31 5.5Coach, Inc. COH adj Jun E/V $35.87 $40.00 275.8 $3.10 $1.90 $2.02 18.9 17.8 $9,910.4 $9.21 (13.5)Fossil, Inc. FOSL adj Dec E/V $71.97 $90.00 49.7 $7.10 $5.85 $6.53 12.3 11.0 $3,512.9 $19.26 (2.6)G-III Apparel Group GIII adj Jan O/V $67.15 $65.00 45.0 $2.12 $2.73 $3.05 24.6 22.0 $3,020.4 $16.93 13.2Kate Spade & Co. KATE adj Dec E/V $26.23 $33.00 127.7 $0.25 $0.53 $0.80 49.5 32.8 $3,348.4 $1.57 12.3Michael Kors Holdings KORS adj Mar E/V $48.58 $52.00 200.8 $4.28 $4.48 $4.69 10.8 10.4 $9,699.3 $11.22 8.9Movado Group MOV adj Jan E/V $28.01 $30.00 17.1 $2.02 $1.96 $2.36 14.3 11.9 $483.6 $26.25 1.7Oxford Industries OXM adj Jan O/V $77.72 $90.00 16.5 $2.97 $3.53 $3.95 22.0 19.7 $1,288.2 $17.05 (2.6)Ralph Lauren Corp. RL adj Mar E/V $136.86 $155.00 61.4 $7.88 $7.00 $8.10 19.6 16.9 $8,265.2 $44.56 (0.3)Signet Jewelers Limited SIG adj Jan O/V $131.96 $145.00 80.3 $5.63 $6.60 $7.38 20.0 17.9 $10,593.1 $36.06 11.1The Children's Place PLCE adj Jan E/V $67.17 $65.00 20.8 $3.05 $3.45 $3.87 19.5 17.4 $1,384.7 $27.51 (1.1)Tiffany & Co. TIF adj Jan E/V $93.92 $95.00 129.3 $3.73 $4.32 $4.89 21.7 19.2 $12,130.6 $21.92 2.8Tumi Holdings, Inc. TUMI adj Dec O/V $19.75 $23.00 67.9 $0.85 $0.92 $1.03 21.5 19.2 $1,340.4 $6.36 6.0

Monthly Statistical Review Member NYSE, SPIC June 2015, Page 21
EXPLORATION AND PRODUCTION WILL GREEN, 817-900-5712
Will is a research analyst covering the exploration and production sector. Will joined Stephens Inc. in May 2007 as a research associate in the industrials group with a focus on the building materials & construction services sector and was promoted to analyst in July 2010. He holds a B.A. in computer science and a B.A. in psychology from the University of Arkansas. Sector Overview: We focus on the Energy Exploration & Production sector which explores, produces, and sells oil and natural gas. The companies we follow focus on discovering, acquiring, and developing conventional and unconventional oil and natural gas reserves, domestically. We believe E&P’s will perform well as development drilling in new focus areas contributes to production growth in a modestly bullish commodity price environment.
Shares ANNUAL P/E P/E Market FY1EFtnt. Rating/ 03-Jun Price Out. EARNINGS PER SHARE Ratio Ratio Cap % Sls
Company Tkr Code FYE Volatility Price Target Mil. LFYA FY1E FY2E FY1E FY2E ($ Mil) BVPS GrthENERGY Exploration and Production, Will Green, 817-900-5712, [email protected]
Abraxas Petroleum Corp. AXAS op/cf Dec O/V $3.07 $4.00 107.1 $0.81 $0.44 $0.85 7.0 3.6 $326.0 $1.95 (43.9)Approach Resources Inc. AREX op/cf Dec U $6.87 $4.00 40.6 $4.27 $2.61 $1.96 2.6 3.5 $278.6 $18.95 (30.6)Callon Petroleum Co. CPE op/cf Dec O/V $7.99 $13.00 65.9 $2.02 $1.29 $1.49 6.2 5.4 $526.3 $7.85 10.7Carrizo Oil & Gas, Inc. CRZO op/cf Dec O/V $50.45 $62.00 51.7 $10.70 $6.87 $8.51 7.3 5.9 $2,595.7 $25.65 (16.5)Concho Resources Inc. CXO op/cf Dec O $119.59 $160.00 119.6 $15.60 $11.47 $13.21 10.4 9.1 $14,352.4 $50.35 (17.2)EP Energy Corp. EPE op/cf Dec E $13.08 $15.00 248.9 $5.02 $4.79 $4.09 2.7 3.2 $3,244.2 $17.63 1.3EXCO Resources XCO op/cf Dec E $1.64 $1.50 279.6 $1.15 $0.40 $0.56 4.1 2.9 $448.9 $0.71 (44.4)Gulfport Energy Corp. GPOR op/cf Dec E $44.41 $54.00 96.7 $4.56 $3.00 $4.49 14.8 9.9 $4,292.5 $26.95 (9.8)Halcon Resources HK op/cf Dec E $1.30 $1.50 563.4 $1.28 $0.48 $0.21 2.7 6.2 $741.9 $2.73 (12.6)Laredo Petroleum, Inc. LPI op/cf Dec E/V $14.13 $12.50 212.3 $2.83 $2.17 $1.38 6.5 10.2 $3,022.1 $10.84 (18.0)Oasis Petroleum Inc. OAS op/cf Dec O/V $16.68 $20.00 139.2 $7.91 $4.27 $3.05 3.9 5.5 $2,321.9 $16.70 (24.4)Parsley Energy, Inc. PE op/cf Dec O $18.03 $25.00 140.3 $1.46 $0.96 $1.83 18.8 9.9 $1,961.0 $7.87 (17.0)PetroQuest Energy, Inc. PQ op/cf Dec O/V $1.84 $4.00 65.9 $1.91 $0.67 $0.74 2.7 2.5 $121.2 $0.27 (46.7)Pioneer Natural Resources Co. PXD op/cf Dec O $150.92 $185.00 149.0 $16.44 $10.24 $13.43 14.7 11.2 $22,532.2 $57.05 (29.7)Range Resources Corp. RRC op/cf Dec O $55.58 $80.00 169.1 $6.33 $4.62 $5.49 12.0 10.1 $9,397.0 $20.66 (9.0)Rosetta Resources, Inc. ROSE op/cf Dec E $23.73 $23.00 75.7 $10.30 $3.73 $3.73 6.4 6.4 $1,777.3 $18.17 (48.8)RSP Permian, Inc. RSPP op/cf Dec O/V $28.18 $34.00 84.0 $1.93 $2.44 $3.11 11.5 9.1 $2,367.5 $17.45 9.7Southwestern Energy Co. SWN op/cf Dec E $24.95 $25.00 442.9 $6.44 $4.21 $4.99 5.9 5.0 $9,594.6 $13.87 (18.3)Whiting Petroleum Corp. WLL op/cf Dec O $33.37 $45.00 204.6 $15.74 $4.41 $7.04 7.6 4.7 $6,811.7 $33.55 (37.5)

Monthly Statistical Review Member NYSE, SPIC June 2015, Page 22
EXPLORATION AND PRODUCTION BEN WYATT, 817-900-5714
Ben is a research analyst covering the exploration and production and master limited partnership sectors. Ben joined Stephens in August 2010 as a research associate to assist in developing the exploration & production practice. In May 2012, Ben was promoted to research analyst in order to develop the MLP practice for Stephens. He received his B.S.B.A. in finance from the University of Arkansas and his M.B.A. from Texas Christian University. Sector Overview: We focus on the Energy Exploration & Production sector which explores, produces, and sells oil and natural gas. The companies we follow focus on discovering, acquiring, and developing conventional and unconventional oil and natural gas reserves, domestically. We believe E&P’s will perform well as development drilling in new focus areas contributes to production growth in a modestly bullish commodity price environment.
Shares ANNUAL P/E P/E Market FY1E
Ftnt. Rating/ 03-Jun Price Out. EARNINGS PER SHARE Ratio Ratio Cap % SlsCompany Tkr Code FYE Volatility Price Target Mil. LFYA FY1E FY2E FY1E FY2E ($ Mil) BVPS Grth
ENERGY Exploration and Production, Ben Wyatt, 817-900-5714, [email protected]
Antero Resources Corp. AR op/cf Dec O $39.25 $50.00 277.0 $3.74 $3.58 $4.86 11.0 8.1 $10,872.4 $20.39 5.2Earthstone Energy, Inc. ESTE op/cf Mar O $21.97 $33.00 13.8 $2.97 $2.03 $3.90 10.8 5.6 $304.0 $15.17 1.8Goodrich Petroleum Corp. GDP op/cf Dec U $2.62 $2.00 57.2 $2.17 $0.81 $0.35 3.2 7.5 $149.8 ($0.40) (16.4)Magnum Hunter Resoures MHR Dec U $1.75 $1.50 208.3 $0.27 ($0.14) ($0.08) NM NM $364.5 $0.06 (53.3)Matador Resources Co. MTDR op/cf Dec O/V $27.80 $33.00 86.3 $3.63 $2.11 $3.70 13.2 7.5 $2,370.8 $12.01 (26.3)Memorial Resource Development MRD op/cf Dec O $19.40 $27.00 190.9 $1.51 $1.91 $2.91 10.2 6.7 $3,701.1 $2.35 22.7PDC Energy, Inc. PDCE op/cf Dec O/V $57.66 $61.00 40.1 $6.82 $9.88 $11.97 5.8 4.8 $2,309.3 $34.01 45.5QEP Resources, Inc. QEP op/cf Dec E $18.77 $22.00 176.7 $8.21 $4.41 $4.37 4.3 4.3 $3,315.9 $22.75 (43.4)Rex Energy Corp. REXX op/cf Dec E $5.21 $5.00 55.3 $2.60 $0.74 $1.22 7.0 4.3 $288.0 $6.31 (42.3)Rice Energy Inc. RICE op/cf Dec O/V $22.44 $28.00 138.4 $1.44 $2.09 $2.90 10.7 7.7 $3,058.7 $11.17 43.4Sanchez Energy Corp. SN op/cf Dec O/V $10.56 $16.00 73.6 $7.86 $3.25 $4.18 3.2 2.5 $645.0 $8.29 (29.7)SandRidge Energy, Inc. SD op/cf Dec O/V $1.23 $2.00 484.0 $1.33 $0.55 $0.41 2.2 3.0 $595.3 $1.30 (42.8)Synergy Resources Corp. SYRG op/cf Aug O $11.68 $14.00 105.1 $0.97 $1.09 $1.44 10.7 8.1 $1,215.5 $5.45 26.3

Monthly Statistical Review Member NYSE, SPIC June 2015, Page 23
MASTER LIMITED PARTNERSHIPS MATT SCHMID, 817-900-5716
Matt is a research analyst covering master limited partnerships and business development companies. Matt joined Stephens in May 2011 as a research associate covering consumer finance and moved to the exploration and production sector in May 2012. He received a B.B.A. in finance and the business honors program from the University of Texas at Austin in 2004 as well as an M.B.A. from the University of Texas at Austin in 2011.
Sector Overview: We focus on the MLP sector which encompasses midstream, exploration & production, propane, coal, general partners and non-traditional MLPs. We believe energy MLPs will continue to perform well as the demand for infrastructure build-out continues in existing and emerging plays while other MLPs will continue to offer investors above average total return potential.
Shares ANNUAL P/E P/E Market FY1E
Ftnt. Rating/ 03-Jun Price Out. EARNINGS PER SHARE Ratio Ratio Cap % SlsCompany Tkr Code FYE Volatility Price Target Mil. LFYA FY1E FY2E FY1E FY2E ($ Mil) BVPS Grth
ENERGY Master Limited Partnerships, Matt Schmid, 817-900-5716, [email protected]
Atlas Energy ATLS op/cf Dec E $6.25 $8.50 51.9 $2.23 $0.96 $0.96 6.5 6.5 $162.6 $6.50 (46.4)Atlas Resource Partners ARP op/cf Dec O $7.32 $12.00 79.3 $2.39 $1.52 $1.61 1.6 4.5 $685.9 $8.68 3.3Blueknight Energy Partners BKEP op/cf Dec O $7.60 $9.50 32.9 $0.87 $0.75 $0.79 10.1 9.6 $250.2 ($2.58) 2.8JP Energy Partners JPEP op/cf Dec O $14.83 $16.00 18.2 $0.46 $1.25 $1.47 11.9 10.1 $269.9 $16.50 101.0MarkWest Energy Partners MWE op/cf Dec O $62.43 $81.00 186.8 $3.95 $3.67 $4.20 17.0 14.9 $11,658.9 $25.37 7.5Martin Midstream Partners MMLP cf Dec E $34.64 $38.00 35.5 $2.91 $3.29 $3.55 10.5 9.8 $1,228.2 $13.73 32.5New Source Energy Partners NSLP op/cf Dec E $5.04 $5.50 16.6 $2.41 $0.70 $0.81 7.2 6.2 $83.4 $12.00 NMPlains All American Pipeline PAA op/cf Dec O $47.00 $64.00 368.9 $2.88 $2.50 $2.84 18.8 16.5 $18,670.4 $21.86 5.4Plains GP Holdings, L.P. PAGP cf Dec O $28.12 $34.00 136.1 $0.75 $0.92 $1.08 30.6 26.0 $6,293.0 $8.01 31.0World Point Terminals WPT cf Dec O $17.44 $22.00 18.4 $1.48 $1.60 $1.60 10.9 10.9 $320.5 $5.10 11.6
Please see the detailed risk section for each MLP at the end of this report. Investors should also review the risk factors identified by the companies as disclosed in the documents filed by each company with the SEC which can be viewed by clicking on each company below. Atlas Energy Atlas Resource Partners Blueknight Energy Partners JP Energy Partners
MarkWest Energy Partners Martin Midstream Partners New Source Energy Partners Plains All American Pipeline
Plains GP Holdings World Point Terminals
Monthly Statistical Review Member NYSE, SPIC June 2015, Page 24
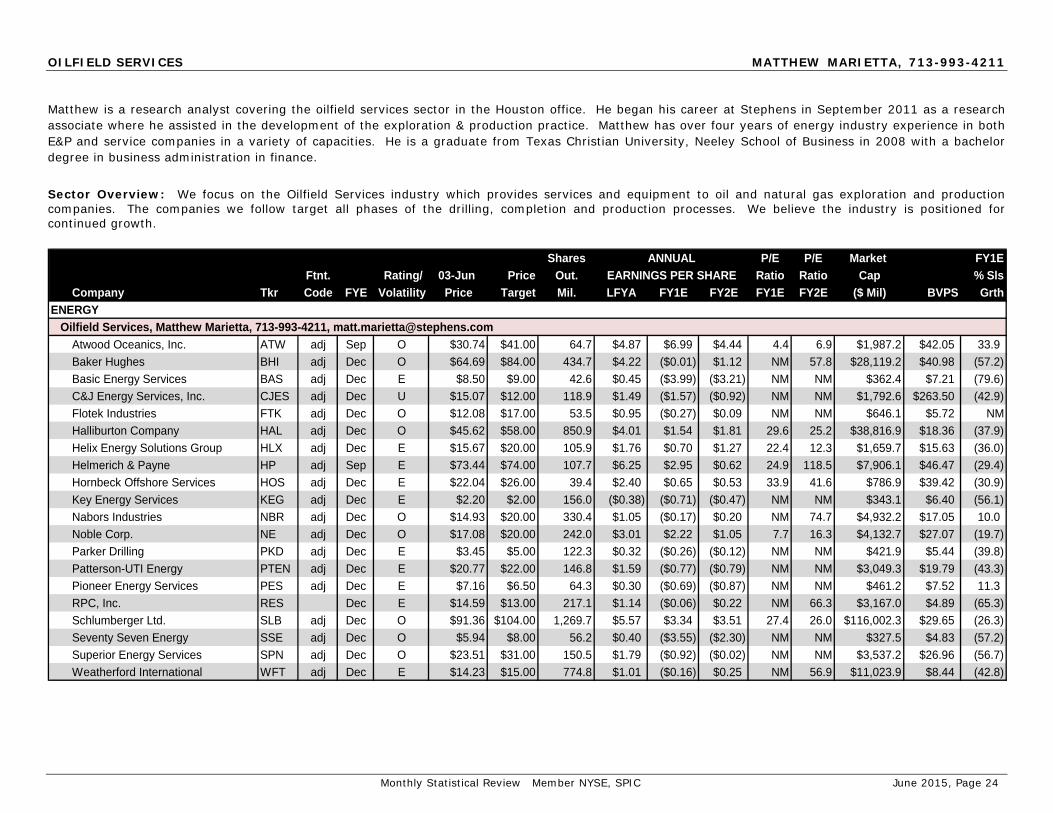
OILFIELD SERVICES MATTHEW MARIETTA, 713-993-4211
Matthew is a research analyst covering the oilfield services sector in the Houston office. He began his career at Stephens in September 2011 as a research associate where he assisted in the development of the exploration & production practice. Matthew has over four years of energy industry experience in both E&P and service companies in a variety of capacities. He is a graduate from Texas Christian University, Neeley School of Business in 2008 with a bachelor degree in business administration in finance.
Sector Overview: We focus on the Oilfield Services industry which provides services and equipment to oil and natural gas exploration and production companies. The companies we follow target all phases of the drilling, completion and production processes. We believe the industry is positioned for continued growth.
Shares ANNUAL P/E P/E Market FY1EFtnt. Rating/ 03-Jun Price Out. EARNINGS PER SHARE Ratio Ratio Cap % Sls
Company Tkr Code FYE Volatility Price Target Mil. LFYA FY1E FY2E FY1E FY2E ($ Mil) BVPS GrthENERGY Oilfield Services, Matthew Marietta, 713-993-4211, [email protected]
Atwood Oceanics, Inc. ATW adj Sep O $30.74 $41.00 64.7 $4.87 $6.99 $4.44 4.4 6.9 $1,987.2 $42.05 33.9Baker Hughes BHI adj Dec O $64.69 $84.00 434.7 $4.22 ($0.01) $1.12 NM 57.8 $28,119.2 $40.98 (57.2)Basic Energy Services BAS adj Dec E $8.50 $9.00 42.6 $0.45 ($3.99) ($3.21) NM NM $362.4 $7.21 (79.6)C&J Energy Services, Inc. CJES adj Dec U $15.07 $12.00 118.9 $1.49 ($1.57) ($0.92) NM NM $1,792.6 $263.50 (42.9)Flotek Industries FTK adj Dec O $12.08 $17.00 53.5 $0.95 ($0.27) $0.09 NM NM $646.1 $5.72 NMHalliburton Company HAL adj Dec O $45.62 $58.00 850.9 $4.01 $1.54 $1.81 29.6 25.2 $38,816.9 $18.36 (37.9)Helix Energy Solutions Group HLX adj Dec E $15.67 $20.00 105.9 $1.76 $0.70 $1.27 22.4 12.3 $1,659.7 $15.63 (36.0)Helmerich & Payne HP adj Sep E $73.44 $74.00 107.7 $6.25 $2.95 $0.62 24.9 118.5 $7,906.1 $46.47 (29.4)Hornbeck Offshore Services HOS adj Dec E $22.04 $26.00 39.4 $2.40 $0.65 $0.53 33.9 41.6 $786.9 $39.42 (30.9)Key Energy Services KEG adj Dec E $2.20 $2.00 156.0 ($0.38) ($0.71) ($0.47) NM NM $343.1 $6.40 (56.1)Nabors Industries NBR adj Dec O $14.93 $20.00 330.4 $1.05 ($0.17) $0.20 NM 74.7 $4,932.2 $17.05 10.0Noble Corp. NE adj Dec O $17.08 $20.00 242.0 $3.01 $2.22 $1.05 7.7 16.3 $4,132.7 $27.07 (19.7)Parker Drilling PKD adj Dec E $3.45 $5.00 122.3 $0.32 ($0.26) ($0.12) NM NM $421.9 $5.44 (39.8)Patterson-UTI Energy PTEN adj Dec E $20.77 $22.00 146.8 $1.59 ($0.77) ($0.79) NM NM $3,049.3 $19.79 (43.3)Pioneer Energy Services PES adj Dec E $7.16 $6.50 64.3 $0.30 ($0.69) ($0.87) NM NM $461.2 $7.52 11.3RPC, Inc. RES Dec E $14.59 $13.00 217.1 $1.14 ($0.06) $0.22 NM 66.3 $3,167.0 $4.89 (65.3)Schlumberger Ltd. SLB adj Dec O $91.36 $104.00 1,269.7 $5.57 $3.34 $3.51 27.4 26.0 $116,002.3 $29.65 (26.3)Seventy Seven Energy SSE adj Dec O $5.94 $8.00 56.2 $0.40 ($3.55) ($2.30) NM NM $327.5 $4.83 (57.2)Superior Energy Services SPN adj Dec O $23.51 $31.00 150.5 $1.79 ($0.92) ($0.02) NM NM $3,537.2 $26.96 (56.7)Weatherford International WFT adj Dec E $14.23 $15.00 774.8 $1.01 ($0.16) $0.25 NM 56.9 $11,023.9 $8.44 (42.8)
Monthly Statistical Review Member NYSE, SPIC June 2015, Page 25
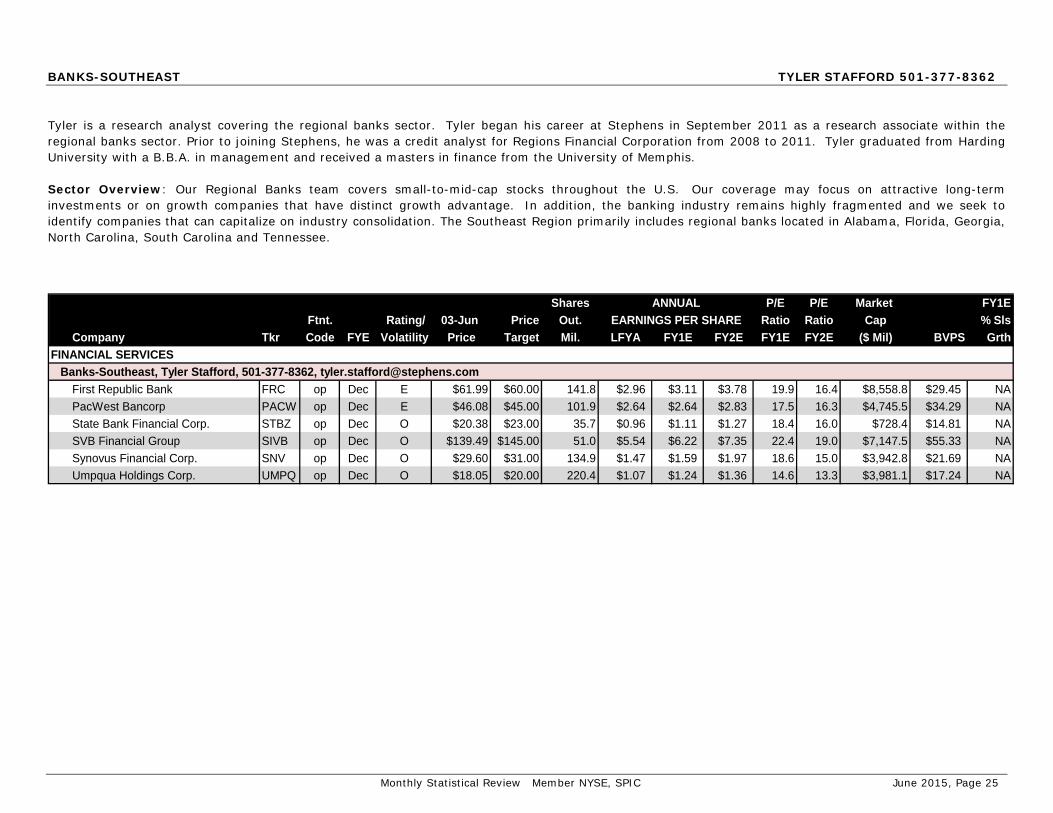
BANKS-SOUTHEAST TYLER STAFFORD 501-377-8362
Tyler is a research analyst covering the regional banks sector. Tyler began his career at Stephens in September 2011 as a research associate within the regional banks sector. Prior to joining Stephens, he was a credit analyst for Regions Financial Corporation from 2008 to 2011. Tyler graduated from Harding University with a B.B.A. in management and received a masters in finance from the University of Memphis. Sector Overview: Our Regional Banks team covers small-to-mid-cap stocks throughout the U.S. Our coverage may focus on attractive long-term investments or on growth companies that have distinct growth advantage. In addition, the banking industry remains highly fragmented and we seek to identify companies that can capitalize on industry consolidation. The Southeast Region primarily includes regional banks located in Alabama, Florida, Georgia, North Carolina, South Carolina and Tennessee.
Shares ANNUAL P/E P/E Market FY1EFtnt. Rating/ 03-Jun Price Out. EARNINGS PER SHARE Ratio Ratio Cap % Sls
Company Tkr Code FYE Volatility Price Target Mil. LFYA FY1E FY2E FY1E FY2E ($ Mil) BVPS GrthFINANCIAL SERVICES Banks-Southeast, Tyler Stafford, 501-377-8362, [email protected]
First Republic Bank FRC op Dec E $61.99 $60.00 141.8 $2.96 $3.11 $3.78 19.9 16.4 $8,558.8 $29.45 NAPacWest Bancorp PACW op Dec E $46.08 $45.00 101.9 $2.64 $2.64 $2.83 17.5 16.3 $4,745.5 $34.29 NAState Bank Financial Corp. STBZ op Dec O $20.38 $23.00 35.7 $0.96 $1.11 $1.27 18.4 16.0 $728.4 $14.81 NASVB Financial Group SIVB op Dec O $139.49 $145.00 51.0 $5.54 $6.22 $7.35 22.4 19.0 $7,147.5 $55.33 NASynovus Financial Corp. SNV op Dec O $29.60 $31.00 134.9 $1.47 $1.59 $1.97 18.6 15.0 $3,942.8 $21.69 NAUmpqua Holdings Corp. UMPQ op Dec O $18.05 $20.00 220.4 $1.07 $1.24 $1.36 14.6 13.3 $3,981.1 $17.24 NA

Monthly Statistical Review Member NYSE, SPIC June 2015, Page 26
BANKS-SOUTHWEST MATT OLNEY, CFA, 501-377-2101 Matt is a managing director leading the regional banks practice. He joined Stephens in 2004 as an associate analyst covering the regional banks sector. In 2007, he became a research analyst covering small cap banks and thrifts in the Southeast. Prior to joining Stephens Inc., Matt resided in Houston, TX, where he worked in various roles for Wells Fargo, UBS and Enron. He holds a B.B.A. with a focus in finance and management information systems from the University of Oklahoma. Matt earned his Chartered Financial Analyst designation in 2007. Sector Overview: Our Regional Banks team covers small-to-mid-cap stocks throughout the U.S. Our coverage may focus on attractive long-term investments or on growth companies that have distinct growth advantage. In addition, the banking industry remains highly fragmented and we seek to identify companies that can capitalize on industry consolidation. The Southwest Region primarily includes regional banks located in Texas, Oklahoma, Arkansas, Louisiana, Mississippi and Missouri.
Shares ANNUAL P/E P/E Market FY1EFtnt. Rating/ 03-Jun Price Out. EARNINGS PER SHARE Ratio Ratio Cap % Sls
Company Tkr Code FYE Volatility Price Target Mil. LFYA FY1E FY2E FY1E FY2E ($ Mil) BVPS GrthFINANCIAL SERVICES Banks-Southwest, Matt Olney, CFA, 501-377-2101, [email protected]
BancorpSouth, Inc. BXS op Dec E $24.85 $26.00 96.5 $1.25 $1.45 $1.69 17.1 14.7 $2,399.2 $16.69 NABank of the Ozarks, Inc. OZRK op Dec O $45.45 $50.00 86.8 $1.55 $2.05 $2.50 22.2 18.2 $3,943.9 $13.59 NABOK Financial BOKF op Dec E $66.19 $65.00 69.0 $4.11 $4.34 $4.67 15.3 15.3 $4,561.9 $44.62 NACommerce Bancshares, Inc. CBSH op Dec E $45.24 $41.00 96.6 $2.54 $2.67 $2.92 16.9 16.9 $4,368.0 $22.66 NACullen/Frost Bankers, Inc. CFR op Dec E $75.42 $70.00 63.2 $4.33 $4.55 $4.73 16.6 16.6 $4,764.9 $42.40 NAFirst Financial Bankshares FFIN op Dec E $31.44 $28.00 64.1 $1.44 $1.57 $1.69 20.0 20.0 $2,016.7 $11.01 NAFirst Horizon National Corp. FHN Dec O $15.01 $16.00 233.9 $0.71 $0.30 $1.05 50.0 50.0 $3,504.8 $9.03 NAHancock Holding Co. HBHC op Dec E $30.50 $32.00 81.4 $2.32 $2.09 $2.31 14.6 14.6 $2,375.7 $31.14 NAHilltop Holdings Inc. HTH op Dec O $22.28 $24.00 100.3 $1.19 $1.61 $1.86 13.8 13.8 $2,234.4 $16.63 NAHome BancShares, Inc. HOMB op Dec O $34.83 $36.00 67.6 $1.77 $1.99 $2.16 17.5 16.1 $2,353.7 $15.03 NAIBERIABANK Corp. IBKC op Dec O $65.57 $74.00 38.2 $3.73 $4.50 $4.95 14.6 13.2 $2,503.6 $56.77 NAIndependent Bank Group IBTX op Dec O $42.29 $45.00 17.1 $2.23 $2.57 $3.00 16.5 14.1 $724.0 $30.77 NALegacyTexas Financial Group LTXB op Dec O $27.48 $30.00 40.0 $0.99 $1.65 $1.85 16.7 14.9 $1,308.2 $14.10 NAMidSouth Bancorp, Inc. MSL op Dec O $14.08 $17.00 11.4 $1.39 $0.79 $1.35 17.8 10.4 $159.9 $14.78 NANational Bank Holdings Corp. NBHC op Dec E $19.70 $20.00 36.5 $0.28 $0.22 $0.98 89.5 20.1 $710.1 $20.73 NAPinnacle Financial Partners PNFP op Dec E $51.69 $48.00 35.8 $2.01 $2.60 $3.00 19.9 17.2 $1,854.4 $22.98 NAProsperity Bancshares, Inc. PB op Dec E $55.40 $55.00 70.0 $4.30 $4.17 $4.18 13.3 13.3 $3,880.4 $47.15 NARegions Financial Corp. RF op Dec O $10.30 $11.00 1,342.8 $0.79 $0.81 $0.88 12.7 11.7 $13,805.7 $12.05 NARenasant Corp. RNST op Dec O $30.55 $34.00 31.6 $1.88 $2.12 $2.43 14.4 12.6 $966.2 $22.88 NASimmons First National Corp. SFNC op Dec O $43.98 $49.00 29.8 $2.30 $3.08 $3.36 14.3 13.1 $1,312.8 $27.38 NASouthwest Bancorp, Inc. OKSB op Dec O $18.16 $20.00 19.0 $0.88 $0.91 $1.07 20.0 17.0 $345.6 $14.26 NATexas Capital Bancshares TCBI op Dec E $56.43 $57.00 45.8 $2.88 $3.00 $3.55 18.8 15.9 $2,582.9 $29.17 NATriState Capital Holdings TSC op Dec O $11.97 $15.00 28.0 $0.55 $0.78 $1.07 15.3 11.2 $335.3 $10.88 NAUMB Financial UMBF op Dec E $54.71 $48.00 45.8 $2.94 $2.61 $3.20 21.0 17.1 $2,694.0 $36.76 NAUnited Community Banks, Inc. UCBI op Dec E $19.35 $21.00 50.2 $1.10 $1.27 $1.48 15.2 13.1 $972.3 $12.66 NAVeritex Holdings, Inc. VBTX op Dec O $14.49 $18.00 9.5 $0.71 $0.78 $1.04 18.6 13.9 $137.4 $11.86 NA
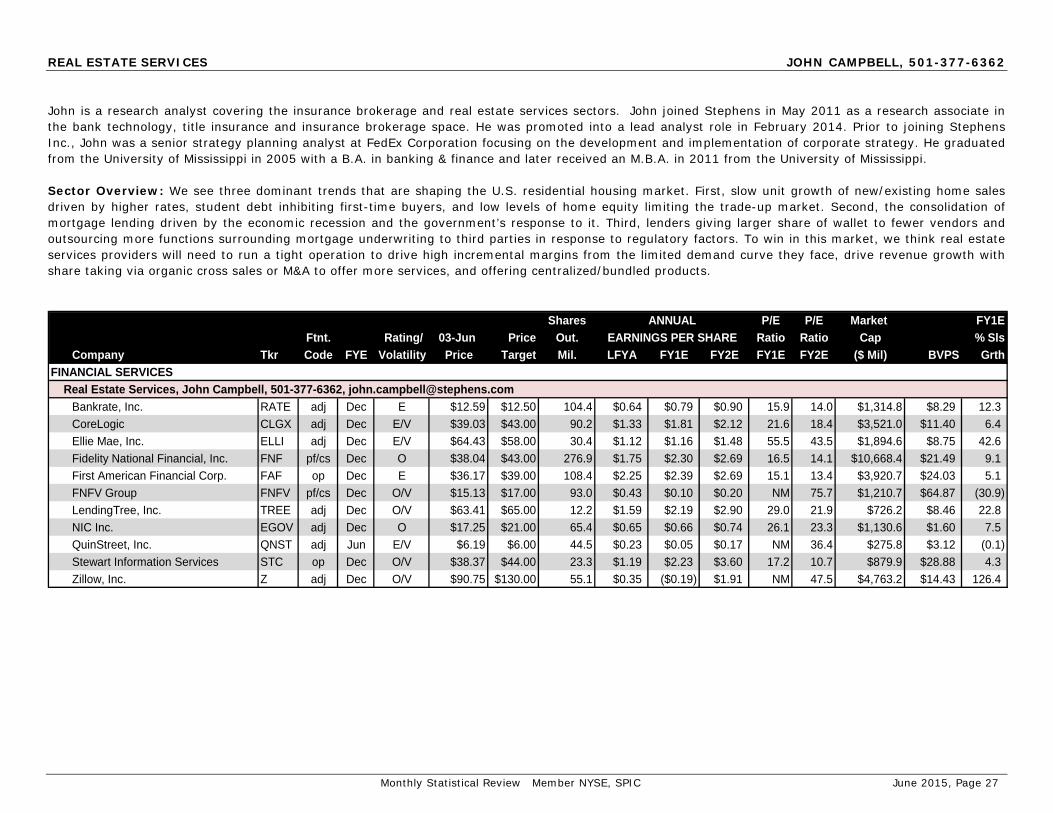
Monthly Statistical Review Member NYSE, SPIC June 2015, Page 27
REAL ESTATE SERVICES JOHN CAMPBELL, 501-377-6362
John is a research analyst covering the insurance brokerage and real estate services sectors. John joined Stephens in May 2011 as a research associate in the bank technology, title insurance and insurance brokerage space. He was promoted into a lead analyst role in February 2014. Prior to joining Stephens Inc., John was a senior strategy planning analyst at FedEx Corporation focusing on the development and implementation of corporate strategy. He graduated from the University of Mississippi in 2005 with a B.A. in banking & finance and later received an M.B.A. in 2011 from the University of Mississippi. Sector Overview: We see three dominant trends that are shaping the U.S. residential housing market. First, slow unit growth of new/existing home sales driven by higher rates, student debt inhibiting first-time buyers, and low levels of home equity limiting the trade-up market. Second, the consolidation of mortgage lending driven by the economic recession and the government’s response to it. Third, lenders giving larger share of wallet to fewer vendors and outsourcing more functions surrounding mortgage underwriting to third parties in response to regulatory factors. To win in this market, we think real estate services providers will need to run a tight operation to drive high incremental margins from the limited demand curve they face, drive revenue growth with share taking via organic cross sales or M&A to offer more services, and offering centralized/bundled products.
Shares ANNUAL P/E P/E Market FY1EFtnt. Rating/ 03-Jun Price Out. EARNINGS PER SHARE Ratio Ratio Cap % Sls
Company Tkr Code FYE Volatility Price Target Mil. LFYA FY1E FY2E FY1E FY2E ($ Mil) BVPS GrthFINANCIAL SERVICES Real Estate Services, John Campbell, 501-377-6362, [email protected]
Bankrate, Inc. RATE adj Dec E $12.59 $12.50 104.4 $0.64 $0.79 $0.90 15.9 14.0 $1,314.8 $8.29 12.3CoreLogic CLGX adj Dec E/V $39.03 $43.00 90.2 $1.33 $1.81 $2.12 21.6 18.4 $3,521.0 $11.40 6.4Ellie Mae, Inc. ELLI adj Dec E/V $64.43 $58.00 30.4 $1.12 $1.16 $1.48 55.5 43.5 $1,894.6 $8.75 42.6Fidelity National Financial, Inc. FNF pf/cs Dec O $38.04 $43.00 276.9 $1.75 $2.30 $2.69 16.5 14.1 $10,668.4 $21.49 9.1First American Financial Corp. FAF op Dec E $36.17 $39.00 108.4 $2.25 $2.39 $2.69 15.1 13.4 $3,920.7 $24.03 5.1FNFV Group FNFV pf/cs Dec O/V $15.13 $17.00 93.0 $0.43 $0.10 $0.20 NM 75.7 $1,210.7 $64.87 (30.9)LendingTree, Inc. TREE adj Dec O/V $63.41 $65.00 12.2 $1.59 $2.19 $2.90 29.0 21.9 $726.2 $8.46 22.8NIC Inc. EGOV adj Dec O $17.25 $21.00 65.4 $0.65 $0.66 $0.74 26.1 23.3 $1,130.6 $1.60 7.5QuinStreet, Inc. QNST adj Jun E/V $6.19 $6.00 44.5 $0.23 $0.05 $0.17 NM 36.4 $275.8 $3.12 (0.1)Stewart Information Services STC op Dec O/V $38.37 $44.00 23.3 $1.19 $2.23 $3.60 17.2 10.7 $879.9 $28.88 4.3Zillow, Inc. Z adj Dec O/V $90.75 $130.00 55.1 $0.35 ($0.19) $1.91 NM 47.5 $4,763.2 $14.43 126.4

Monthly Statistical Review Member NYSE, SPIC June 2015, Page 28
SPECIALTY FINANCE J.R. BIZZELL, 501-377-8237
J.R. is a research analyst covering the specialty finance industry. He began his career at Stephens in 2011 as a research associate where he assisted in the development of the restaurant practice. J.R. obtained his B.S. in biology from Rhodes College in Memphis, TN.
Sector Overview: Specialty Finance companies are generally non-bank institutions that provide credit and other financial services to a target niche.
Shares ANNUAL P/E P/E Market FY1E
Ftnt. Rating/ 03-Jun Price Out. EARNINGS PER SHARE Ratio Ratio Cap % SlsCompany Tkr Code FYE Volatility Price Target Mil. LFYA FY1E FY2E FY1E FY2E ($ Mil) BVPS Grth
FINANCIAL SERVICES Specialty Finance, J.R. Bizzell, 501-377-8237, [email protected]
Aaron's, Inc. AAN op Dec O $34.92 $42.00 72.5 $1.69 $2.14 $2.54 16.3 13.7 $2,534.3 $17.58 17.9America's Car-Mart, Inc. CRMT Apr E $54.25 $55.00 8.6 $3.26 $3.60 $3.96 15.1 13.7 $462.7 $26.38 10.8Consumer Portfolio Services CPSS adj Dec O/V $6.26 $9.00 25.6 $0.92 $1.10 $1.21 5.7 5.2 $163.4 $5.35 22.9Regional Management RM adj/cs Dec E $18.00 $16.00 12.9 $1.15 $1.63 $2.00 11.0 9.0 $231.7 $13.99 8.0Rent-A-Center RCII adj Dec E $32.22 $35.00 53.0 $1.98 $2.16 $2.51 14.9 12.8 $1,708.6 $26.51 5.4Santander Consumer USA SC Dec O $24.82 $30.00 349.7 $2.37 $2.75 $3.00 9.0 8.3 $8,686.7 $11.01 11.5Springleaf Holdings, Inc. LEAF Dec O $46.55 $62.00 134.5 $2.07 $2.14 $2.38 21.8 19.6 $6,260.1 $17.64 6.5World Acceptance Corp. WRLD adj Mar E $77.10 $90.00 9.5 $10.88 $11.74 NE 6.6 NM $655.4 $32.90 (3.5)

Monthly Statistical Review Member NYSE, SPIC June 2015, Page 29
DIAGNOSTICS AND LIFE SCIENCE TOOLS DREW JONES, 501-377-2369
Drew is a research analyst leading the diagnostics and life science tools sector. Drew joined Stephens in November 2007 as an associate in the medical technology sector and was promoted to analyst in August 2010. Prior to Stephens, he spent two years at Morgan Keegan covering homeland security technology. Drew holds a B.A. From the University of the South and an MBA from the Owen Graduate School of Management at Vanderbilt University. Sector Overview: The Diagnostics and Life Science Tools industry consists of companies that design, manufacture, and distribute diagnostic products to the medical, veterinary, and food/animal safety markets. Our focus is on emerging diagnostic technologies in fields of molecular diagnostics, immunodiagnostics, and clinical chemistry. It is our belief that diagnostics will play an increasingly important role in healthcare looking forward with increased focus on catching diseases early in the disease state to reduce costs. Additionally, we believe the personalized medicine movement is only in its infant stages, and in the future, we feel therapeutic decisions will be custom tailored to the individual to best fit the individual patient’s genetic makeup. We look to cover companies that support these emerging trends, which we believe have the potential to revolutionize the way medicine is practiced. Additionally, we look for companies with strong fundamentals including solid management, large market opportunities, strong intellectual property positions, and innovative/value adding products.
Shares ANNUAL P/E P/E Market FY1EFtnt. Rating/ 03-Jun Price Out. EARNINGS PER SHARE Ratio Ratio Cap % Sls
Company Tkr Code FYE Volatility Price Target Mil. LFYA FY1E FY2E FY1E FY2E ($ Mil) BVPS GrthHEALTHCARE Diagnostics and Life Science Tools, Drew Jones, 501-377-2369, [email protected]
Abaxis, Inc. ABAX pf Mar E/V $53.12 $54.00 22.5 $0.93 $1.27 $1.42 41.8 37.4 $1,204.3 $9.25 12.4Bio-Techne Corp. TECH pf Jun O/V $100.18 $108.00 37.2 $3.39 $3.36 $3.70 29.8 27.1 $3,722.0 $22.07 26.5Cerus Corp. CERS pf Dec O/V $5.24 $9.00 95.4 ($0.52) ($0.52) ($0.53) NM NM $499.7 $1.16 (1.4)EXACT Sciences Corp. EXAS pf Dec E/V $27.45 $23.00 88.9 ($1.25) ($1.67) ($1.32) NM NM $2,440.7 $3.26 NMGenomic Health, Inc. GHDX pf Dec E/V $26.98 $29.00 32.2 ($0.78) ($0.74) $0.07 NM NM $870.5 $4.87 6.1Luminex Corp. LMNX pf Dec E/V $17.25 $20.00 43.1 $0.61 $0.58 $0.68 29.7 25.4 $744.1 $7.65 3.9Myriad Genetics, Inc. MYGN pf Jun O/V $34.57 $42.00 73.0 $2.42 $1.44 $1.98 24.0 17.5 $2,400.9 $9.71 (7.4)Neogen Corp. NEOG pf May E/V $47.28 $45.00 37.0 $0.75 $0.87 $1.00 54.3 47.3 $1,751.3 $8.84 10.9Neogenomics Inc. NEO Dec O/V $5.52 $7.00 60.3 $0.03 ($0.01) $0.10 NM 55.2 $333.2 $1.00 18.3OraSure Technologies, Inc. OSUR pf Dec E/V $6.05 $6.00 57.1 ($0.12) $0.10 $0.14 60.5 43.2 $341.3 $2.83 8.4Pacific Biosciences of California PACB pf Dec E/V $5.89 $7.00 74.6 ($0.94) ($0.94) ($0.78) NM NM $439.2 $0.74 29.0Repligen Corp. RGEN pf Dec O/V $40.11 $38.00 32.9 $0.18 $0.32 $0.50 NM 80.2 $1,317.7 $3.42 25.8TearLab Corp. TEAR pf Dec O/V $2.45 $5.00 33.7 ($0.74) ($0.89) ($0.77) NM NM $82.5 $0.73 24.9Trinity Biotech plc TRIB Dec O/V $17.86 $22.00 22.9 $0.72 $0.62 $0.68 28.8 26.3 $397.4 $8.58 1.3VCA, Inc. WOOF pf Dec E $51.92 $52.00 82.9 $1.90 $2.19 $2.51 23.7 20.7 $4,265.9 $14.28 8.9Veracyte, Inc. VCYT Dec O/V $11.13 $14.00 27.5 ($1.36) ($1.17) ($0.98) NM NM $305.7 $1.84 27.2
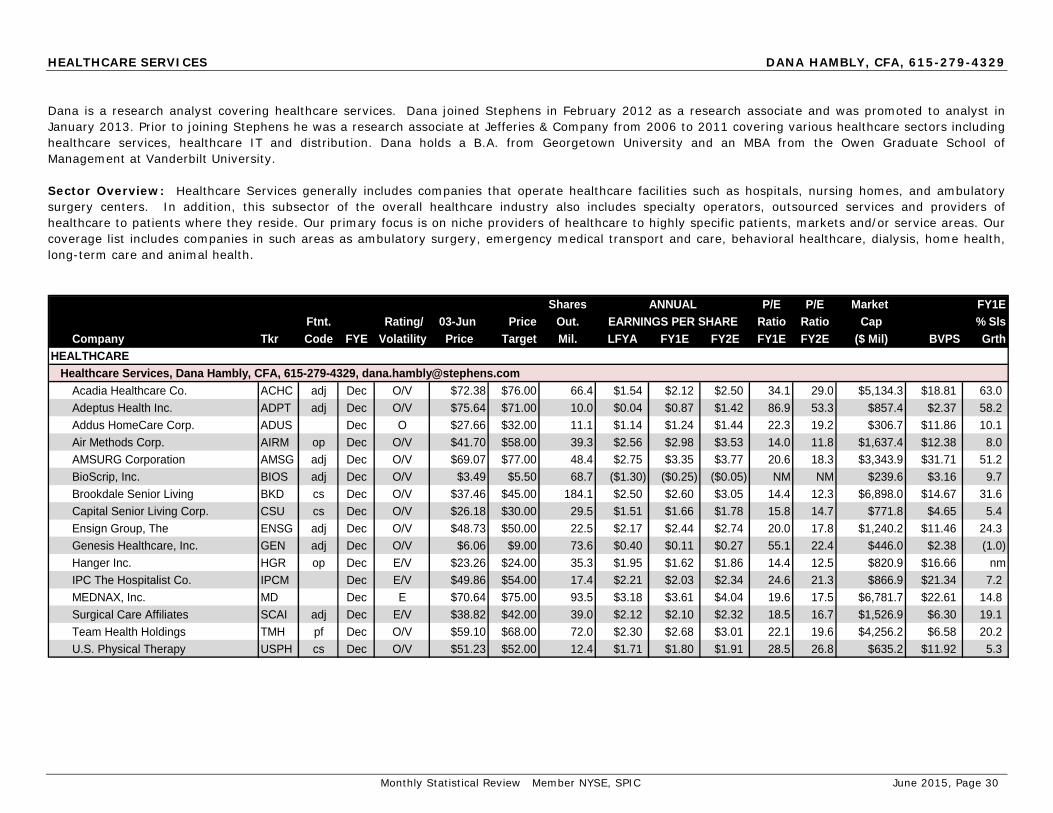
Monthly Statistical Review Member NYSE, SPIC June 2015, Page 30
HEALTHCARE SERVICES DANA HAMBLY, CFA, 615-279-4329 Dana is a research analyst covering healthcare services. Dana joined Stephens in February 2012 as a research associate and was promoted to analyst in January 2013. Prior to joining Stephens he was a research associate at Jefferies & Company from 2006 to 2011 covering various healthcare sectors including healthcare services, healthcare IT and distribution. Dana holds a B.A. from Georgetown University and an MBA from the Owen Graduate School of Management at Vanderbilt University. Sector Overview: Healthcare Services generally includes companies that operate healthcare facilities such as hospitals, nursing homes, and ambulatory surgery centers. In addition, this subsector of the overall healthcare industry also includes specialty operators, outsourced services and providers of healthcare to patients where they reside. Our primary focus is on niche providers of healthcare to highly specific patients, markets and/or service areas. Our coverage list includes companies in such areas as ambulatory surgery, emergency medical transport and care, behavioral healthcare, dialysis, home health, long-term care and animal health.
Shares ANNUAL P/E P/E Market FY1EFtnt. Rating/ 03-Jun Price Out. EARNINGS PER SHARE Ratio Ratio Cap % Sls
Company Tkr Code FYE Volatility Price Target Mil. LFYA FY1E FY2E FY1E FY2E ($ Mil) BVPS GrthHEALTHCARE Healthcare Services, Dana Hambly, CFA, 615-279-4329, [email protected]
Acadia Healthcare Co. ACHC adj Dec O/V $72.38 $76.00 66.4 $1.54 $2.12 $2.50 34.1 29.0 $5,134.3 $18.81 63.0Adeptus Health Inc. ADPT adj Dec O/V $75.64 $71.00 10.0 $0.04 $0.87 $1.42 86.9 53.3 $857.4 $2.37 58.2Addus HomeCare Corp. ADUS Dec O $27.66 $32.00 11.1 $1.14 $1.24 $1.44 22.3 19.2 $306.7 $11.86 10.1Air Methods Corp. AIRM op Dec O/V $41.70 $58.00 39.3 $2.56 $2.98 $3.53 14.0 11.8 $1,637.4 $12.38 8.0AMSURG Corporation AMSG adj Dec O/V $69.07 $77.00 48.4 $2.75 $3.35 $3.77 20.6 18.3 $3,343.9 $31.71 51.2BioScrip, Inc. BIOS adj Dec O/V $3.49 $5.50 68.7 ($1.30) ($0.25) ($0.05) NM NM $239.6 $3.16 9.7Brookdale Senior Living BKD cs Dec O/V $37.46 $45.00 184.1 $2.50 $2.60 $3.05 14.4 12.3 $6,898.0 $14.67 31.6Capital Senior Living Corp. CSU cs Dec O/V $26.18 $30.00 29.5 $1.51 $1.66 $1.78 15.8 14.7 $771.8 $4.65 5.4Ensign Group, The ENSG adj Dec O/V $48.73 $50.00 22.5 $2.17 $2.44 $2.74 20.0 17.8 $1,240.2 $11.46 24.3Genesis Healthcare, Inc. GEN adj Dec O/V $6.06 $9.00 73.6 $0.40 $0.11 $0.27 55.1 22.4 $446.0 $2.38 (1.0)Hanger Inc. HGR op Dec E/V $23.26 $24.00 35.3 $1.95 $1.62 $1.86 14.4 12.5 $820.9 $16.66 nmIPC The Hospitalist Co. IPCM Dec E/V $49.86 $54.00 17.4 $2.21 $2.03 $2.34 24.6 21.3 $866.9 $21.34 7.2MEDNAX, Inc. MD Dec E $70.64 $75.00 93.5 $3.18 $3.61 $4.04 19.6 17.5 $6,781.7 $22.61 14.8Surgical Care Affiliates SCAI adj Dec E/V $38.82 $42.00 39.0 $2.12 $2.10 $2.32 18.5 16.7 $1,526.9 $6.30 19.1Team Health Holdings TMH pf Dec O/V $59.10 $68.00 72.0 $2.30 $2.68 $3.01 22.1 19.6 $4,256.2 $6.58 20.2U.S. Physical Therapy USPH cs Dec O/V $51.23 $52.00 12.4 $1.71 $1.80 $1.91 28.5 26.8 $635.2 $11.92 5.3

Monthly Statistical Review Member NYSE, SPIC June 2015, Page 31
MEDICAL DEVICES CHRIS COOLEY, CFA, 501-377-2516 Chris is a managing director leading the medical devices and hospital supply sector. Chris joined Stephens in July 2010 and has over 20 years of equity research experience. He was ranked #3 for stock selection by the Wall Street Journal All-Star Analyst Survey as well as StarMine/ Financial Times in 2011 and was ranked #1 for stock selection by both the Wall Street Journal All-Star Analyst Survey and by StarMine /Financial Times for his work in the sector during 2009. Additionally, Chris has received votes in the Institutional Investor All-Star annual survey for his work in the sector. Prior to joining Stephens, Chris began his professional career with Dean Witter and also worked for Cargill, Inc., Morgan Keegan, SunTrust Equitable Securities and FTN Equity Capital Markets. Chris received a masters in business administration, with concentrations in finance and operations management from the University of Tennessee and a bachelor of science degree in economics from the University of Arkansas. Sector Overview: The Medical Devices industry consists of companies that design, manufacture, and distribute various devices used in the diagnosis and treatment of a wide variety of medical conditions. The primary market driver remains demographic trends - the U.S. Census Bureau projects that roughly 40% of the U.S. population will be 45 years of age or older by 2008. These demographic trends coupled with Americans’ higher expectations relating to lifestyle/quality of life issues and demands for access to the latest medical technologies will drive growth for the industry. The Medical Devices team is focused on companies with technologies that are well positioned to benefit from these ongoing trends. We look for companies within our areas of focus that we believe have significant market opportunities, innovative and value adding products, quality management teams, and solid fundamentals.
Shares ANNUAL P/E P/E Market FY1EFtnt. Rating/ 03-Jun Price Out. EARNINGS PER SHARE Ratio Ratio Cap % Sls
Company Tkr Code FYE Volatility Price Target Mil. LFYA FY1E FY2E FY1E FY2E ($ Mil) BVPS GrthHEALTHCARE Medical Devices, Chris Cooley, CFA, 501-377-2516, [email protected]
Abiomed, Inc. ABMD adj Mar O/V $62.05 $87.00 41.1 $3.10 $0.95 $1.35 65.3 46.0 $2,589.8 $4.76 25.8Align Technology ALGN pf Dec O/V $63.40 $70.00 80.7 $1.78 $1.66 $2.13 38.2 29.8 $5,119.6 $9.39 11.6Avinger, Inc. AVGR Dec O/V $12.02 $18.00 12.2 ($8.41) ($4.13) ($2.67) NM NM $147.1 NA 8.9DexCom, Inc. DXCM pf Dec O/V $72.48 $72.00 79.3 ($0.32) ($0.04) $0.31 NM NM $5,747.4 $1.88 39.5Endologix, Inc. ELGX pf Dec O/V $16.85 $19.00 67.4 ($0.38) ($0.52) ($0.32) NM NM $1,136.0 $1.85 7.9Insulet Corp. PODD pf Dec E/V $29.34 $24.00 56.8 ($0.19) ($0.39) $0.02 NM NM $1,665.1 $1.49 2.7LDR Holding Corp. LDRH Dec O/V $42.85 $45.00 26.6 ($0.43) ($0.70) ($0.22) NM NM $1,139.0 $4.07 13.9NxStage Medical, Inc. NXTM Dec O $16.03 $22.00 63.2 ($0.39) ($0.36) ($0.21) NM NM $1,013.7 $3.00 8.4RTI Surgical, Inc. RTIX adj Dec E/V $6.63 $6.50 57.1 $0.00 $0.22 $0.25 30.1 26.5 $380.3 $2.95 8.7Sirona Dental Systems SIRO pf Sep O/V $98.66 $101.00 58.0 $3.68 $3.96 $4.24 24.9 23.3 $5,481.1 $22.96 (2.6)STAAR Surgical Co. STAA pf Dec O/V $9.54 $12.00 38.8 $0.02 $0.02 $0.04 NM NM $370.6 $0.97 0.1STERIS Corp. STE pf Mar O $66.77 $79.00 59.7 $2.99 $3.25 $3.55 20.5 18.8 $3,987.8 $17.96 5.9Synergetics USA, Inc. SURG Jul O/V $4.62 $7.00 25.6 $0.12 $0.19 $0.31 24.3 14.9 $118.1 $2.56 1.2Teleflex Inc. TFX adj Dec O $129.09 $147.00 41.5 $5.73 $6.18 $7.09 20.9 18.2 $5,361.0 $42.76 (1.1)The Cooper Companies COO pf Oct E $184.84 $176.00 48.3 $7.29 $7.48 $8.92 24.7 20.7 $8,925.7 $53.38 9.9

Monthly Statistical Review Member NYSE, SPIC June 2015, Page 32
BUILDING MATERIALS AND CONSTRUCTION SERVICES TREY GROOMS, 501-377-2318
Trey is a managing director leading the building materials and construction services sector. Trey joined Stephens Inc. in July 2001 as an analyst in the Corporate Finance department focusing on several industries including home building and land development, life sciences, food, and consumer products. He then became an associate in Equity Research in April 2003, covering the information technology and services industry and was promoted to analyst in January 2006. Trey holds a B.B.A. in finance from the University of Arkansas at Little Rock.
Sector Overview: Our group is focused on identifying companies with exposure to the residential replacement and new construction markets, as well as infrastructure and other public works construction markets. We seek to identify companies that possess strong growth opportunities, leading market positions, unique value-added services, and proprietary products. The areas of focus include construction materials, installation & distribution, specialty products, and construction services.
Shares ANNUAL P/E P/E Market FY1E
Ftnt. Rating/ 03-Jun Price Out. EARNINGS PER SHARE Ratio Ratio Cap % SlsCompany Tkr Code FYE Volatility Price Target Mil. LFYA FY1E FY2E FY1E FY2E ($ Mil) BVPS Grth
INDUSTRIALS Building Materials and Construction Services, Trey Grooms, 501-377-2318, [email protected]
Beacon Roofing Supply, Inc. BECN op/cs Sep O/V $32.04 $0.50 49.6 $1.08 $1.37 $1.70 23.4 18.8 $1,590.0 $16.54 8.6Builders FirstSource, Inc. BLDR op Dec O/V $12.67 $14.00 98.2 $0.15 $0.32 $0.51 39.6 24.8 $1,257.6 $0.35 8.1Continental Building Products CBPX op Dec E/V $22.62 $23.00 44.1 $0.55 $0.97 $1.40 23.3 16.2 $977.3 $6.99 7.5Eagle Materials EXP op Mar O/V $83.20 $95.00 50.3 $3.41 $4.55 $5.25 18.3 15.8 $4,179.4 $20.11 13.1Great Lakes Dredge & Dock GLDD op Dec E/V $5.85 $6.00 60.4 $0.34 $0.20 $0.30 29.3 19.5 $353.3 $4.25 12.1Martin Marietta Materials MLM op Dec O $147.86 $172.00 67.3 $3.72 $5.34 $7.23 27.7 20.5 $9,977.7 $64.51 29.1Masonite International DOOR op Dec E $69.24 $74.00 30.1 ($0.65) $1.31 $2.77 52.9 25.0 $2,090.1 $21.45 6.0NCI Building Systems NCS op Oct O/V $15.07 $18.00 73.8 $0.16 $0.23 $0.54 65.5 27.9 $1,111.8 $3.37 13.9Orion Marine Group ORN Dec O/V $8.18 $10.00 28.0 $0.25 $0.25 $0.35 32.7 23.4 $228.7 $8.60 7.0Ply Gem Holdings, Inc. PGEM op Dec O/V $11.55 $15.00 67.9 ($0.26) $0.24 $1.11 48.1 10.4 $784.6 ($1.42) 26.8Polaris Industries, Inc. PII op Dec E $146.84 $150.00 66.5 $6.65 $7.39 $8.60 19.9 17.1 $9,758.8 $13.20 10.7Stock Building Supply Holdings STCK op Dec O/V $20.50 $25.00 26.2 $0.50 $0.79 $1.20 25.9 17.1 $536.6 $5.48 9.2Summit Materials LLC SUM op Dec O $25.76 $31.00 26.6 $0.48 $0.68 $1.04 37.9 24.8 $684.8 NA 21.5Trex Company TREX op Dec E/V $51.98 $55.00 32.1 $1.27 $1.71 $2.21 30.4 23.5 $1,667.5 $4.10 16.1U.S. Concrete, Inc. USCR op Dec O $37.26 $46.00 14.3 $2.19 $2.88 $2.69 12.9 13.8 $543.4 $7.26 36.3U.S. Silica Holdings, Inc. SLCA op Dec E/V $31.98 $28.00 53.4 $2.44 $0.87 $1.13 36.8 28.3 $1,707.5 $7.46 (24.8)USG Corp. USG op Dec E/V $28.99 $28.00 145.4 $1.15 $1.76 $1.58 16.5 18.3 $4,214.6 $2.77 6.7Vulcan Materials Company VMC op Dec O $89.14 $97.00 132.6 $0.92 $2.15 $3.11 41.5 28.7 $11,825.3 $31.37 11.9

Monthly Statistical Review Member NYSE, SPIC June 2015, Page 33
INDUSTRIAL PRODUCTS AND SERVICES MATT DUNCAN, CFA, 501-377-3723
Matt is a managing director leading the industrial products and services practice. Matt joined Stephens in January 2000 and has been an analyst since May 2004. He previously covered the cardiology devices segment of the medical devices industry and was a member of the medical devices research team for over five years. He graduated magna cum laude with a B.S.B.A. in finance from the University of Arkansas in May 2000 where he served as President of the Finance Club and was selected as an Outstanding Finance Student. Sector Overview: Our Industrial Products and Services research team focuses primarily on two industry sub-segments: 1) industrial distribution firms and 2) engineering and construction (E&C)/ industrial service firms. The industrial distribution industry is large and highly fragmented, with over 100,000 participants in North America. We look for distribution companies that have leading market positions in their product verticals, a meaningful amount of operating leverage and/or differentiated service platforms. Within the E&C and industrial service industry, we focus on small- to mid-cap companies with an emphasis on those that serve energy end markets (oil & gas and power generation).
Shares ANNUAL P/E P/E Market FY1E
Ftnt. Rating/ 03-Jun Price Out. EARNINGS PER SHARE Ratio Ratio Cap % SlsCompany Tkr Code FYE Volatility Price Target Mil. LFYA FY1E FY2E FY1E FY2E ($ Mil) BVPS Grth
INDUSTRIALS Industrial Products and Services, Matt Duncan, CFA, 501-377-3723, [email protected]
Altra Holdings, Inc. AIMC op Dec E/V $28.10 $28.00 26.4 $1.83 $1.65 $1.74 17.0 16.1 $742.0 $9.82 (6.2)Applied Industrial Technologies AIT pf Jun E $42.77 $44.00 41.1 $2.67 $2.82 $3.00 15.2 14.3 $1,717.6 $18.99 11.8DXP Enterprises DXPE Dec O/V $42.35 $54.00 14.2 $3.67 $2.50 $3.10 16.9 13.7 $602.8 $16.79 (10.7)Furmanite Corp. FRM pf Dec E/V $8.39 $10.00 37.9 $0.34 $0.40 $0.56 21.0 15.0 $316.9 $3.78 3.1Kaman Corp. KAMN pf Dec E $42.97 $44.00 27.2 $2.31 $2.46 $2.78 17.5 15.5 $1,170.0 $19.08 5.0MasTec, Inc. MTZ pf Dec O/V $19.11 $23.00 81.9 $1.57 $1.45 $2.04 13.2 9.4 $1,564.6 $12.61 (4.1)Matrix Service Co. MTRX pf Jun O/V $18.08 $22.00 26.7 $1.51 $1.15 $1.52 15.7 11.9 $483.1 $10.84 7.1Mistras Group, Inc. MG pf May O/V $19.25 $24.00 28.6 $0.70 $0.63 $0.96 30.6 20.1 $552.5 $8.79 15.5MRC Golbal Inc. MRC pf Dec O/V $15.57 $22.00 102.1 $1.64 $0.54 $0.57 28.8 27.3 $1,603.7 $13.46 (41.1)MSC Industrial Direct Co. MSM pf Aug E $71.54 $76.00 48.6 $3.93 $3.75 $4.10 19.1 17.4 $3,462.5 $20.27 5.4NOW, Inc. DNOW pf Dec E/V $23.39 $24.00 107.2 $1.07 ($0.35) ($0.05) NM NM $2,506.9 $18.36 (25.3)Pool Corp. POOL pf Dec O $68.23 $81.00 43.7 $2.44 $2.84 $3.25 24.0 21.0 $2,969.9 $5.54 7.6Quanta Services, Inc. PWR pf Dec O/V $30.07 $36.00 204.5 $1.99 $2.04 $2.38 14.7 12.6 $6,149.3 $21.02 6.6Ryerson Holding Corp. RYI pf Dec E/V $9.08 $8.00 32.0 $1.54 $0.14 $1.30 64.9 7.0 $290.9 ($4.29) (3.0)Team, Inc. TISI pf May O/V $40.77 $48.00 21.7 $1.48 $2.00 $2.20 20.4 18.5 $847.6 $16.16 12.1W.W. Grainger, Inc. GWW pf Dec O $242.91 $275.00 67.2 $12.26 $12.55 $14.26 19.4 17.0 $16,255.8 $47.97 2.0Watsco, Inc. WSO Dec O $128.49 $145.00 30.1 $4.32 $5.16 $5.94 24.9 21.6 $3,882.2 $21.36 6.6WESCO International, Inc. WCC pf Dec O/V $74.19 $82.00 44.2 $5.18 $5.02 $5.50 14.8 13.5 $3,280.5 $43.35 (0.5)

Monthly Statistical Review Member NYSE, SPIC June 2015, Page 34
TRANSPORTATION/AIRFREIGHT AND LOGISTICS/MARITIME JACK ATKINS, 501-377-2298
Jack is a research analyst covering the airfreight and logistics/maritime sectors. He joined Stephens in August 2007 as a research associate in the Industrials group, with a primary focus on industrial distribution and service companies. He was promoted to analyst on the transportation research team in August 2011. Jack holds a B.A. in history from Auburn University and an M.A. with a concentration in history from Virginia Tech.
Sector Overview: Logistics is the function by which the owner of goods outsources various elements of the supply chain to a third party. The global supply chain services and solutions industry consists of air and ocean freight forwarding, contract logistics, domestic ground transportation, customs clearances, distribution, inbound logistics, warehousing and supply chain management. Among the factors impacting the industry are the outsourcing of supply chain activities, increased global trade and sourcing, increased demand for time-definite delivery of goods, and the need for advanced information technology systems.
Shares ANNUAL P/E P/E Market FY1E
Ftnt. Rating/ 03-Jun Price Out. EARNINGS PER SHARE Ratio Ratio Cap % SlsCompany Tkr Code FYE Volatility Price Target Mil. LFYA FY1E FY2E FY1E FY2E ($ Mil) BVPS Grth
INDUSTRIALS Transportation/Airfreight and Logistics/Maritime, Jack Atkins, 501-377-2298, [email protected]
Air Transport Services Group ATSG Dec E $10.54 $10.00 65.0 $0.55 $0.60 $0.67 17.6 15.7 $687.6 $5.36 3.4Atlas Air Worldwide Holdings AAWW op Dec E/V $55.65 $49.00 25.0 $3.72 $4.85 $4.15 11.5 13.4 $1,391.5 $57.86 (0.5)C.H. Robinson Worldwide, Inc. CHRW op Dec O $64.62 $78.00 147.9 $3.05 $3.25 $3.55 19.9 18.2 $9,424.0 $7.23 5.5Echo Global Logistics ECHO op Dec O $32.87 $40.00 28.9 $0.81 $0.93 $1.38 35.3 23.8 $949.1 $7.99 40.2Expeditors International EXPD Dec O $48.32 $58.00 191.1 $1.92 $2.22 $2.43 21.8 19.9 $9,242.4 $9.75 7.0FedEx Corp. FDX adj May O $179.92 $200.00 283.8 $6.75 $8.90 $10.85 20.2 16.6 $51,053.6 $56.43 4.5Forward Air FWRD Dec O $54.42 $60.00 30.3 $1.96 $2.41 $2.85 22.6 19.1 $1,685.5 $9.27 22.7Kirby Corp. KEX op Dec E $77.67 $77.00 55.7 $4.93 $4.30 $4.35 18.1 17.9 $4,333.2 $39.64 (7.0)Landstar System, Inc. LSTR Dec E $67.80 $68.00 44.4 $3.08 $3.32 $3.70 20.4 18.3 $3,011.1 $10.68 5.6Matson Inc. MATX op Dec O $43.29 $51.00 43.5 $1.68 $2.00 $2.30 21.6 18.8 $1,881.1 $8.87 12.3Quality Distribution QLTY op Dec E $15.71 $16.00 28.1 $0.76 $0.80 $0.85 19.6 18.5 $441.3 ($0.96) (2.5)United Parcel Service UPS adj Dec E $100.60 $110.00 702.3 $4.75 $5.25 $5.85 19.2 17.2 $70,572.5 $2.37 1.6UTi Worldwide UTIW op Jan O/V $10.32 $13.00 105.6 ($0.73) ($0.22) ($0.09) NM NM $1,093.9 $4.63 1.7XPO Logistics Inc. XPO op Dec E/V $49.49 $53.00 79.7 ($0.83) ($0.34) ($0.11) NM NM $3,947.1 $20.54 45.3World Fuel Services INT op Dec O $49.90 $65.00 72.2 $3.02 $3.35 $3.70 14.9 13.5 $3,602.1 $25.74 (22.7)
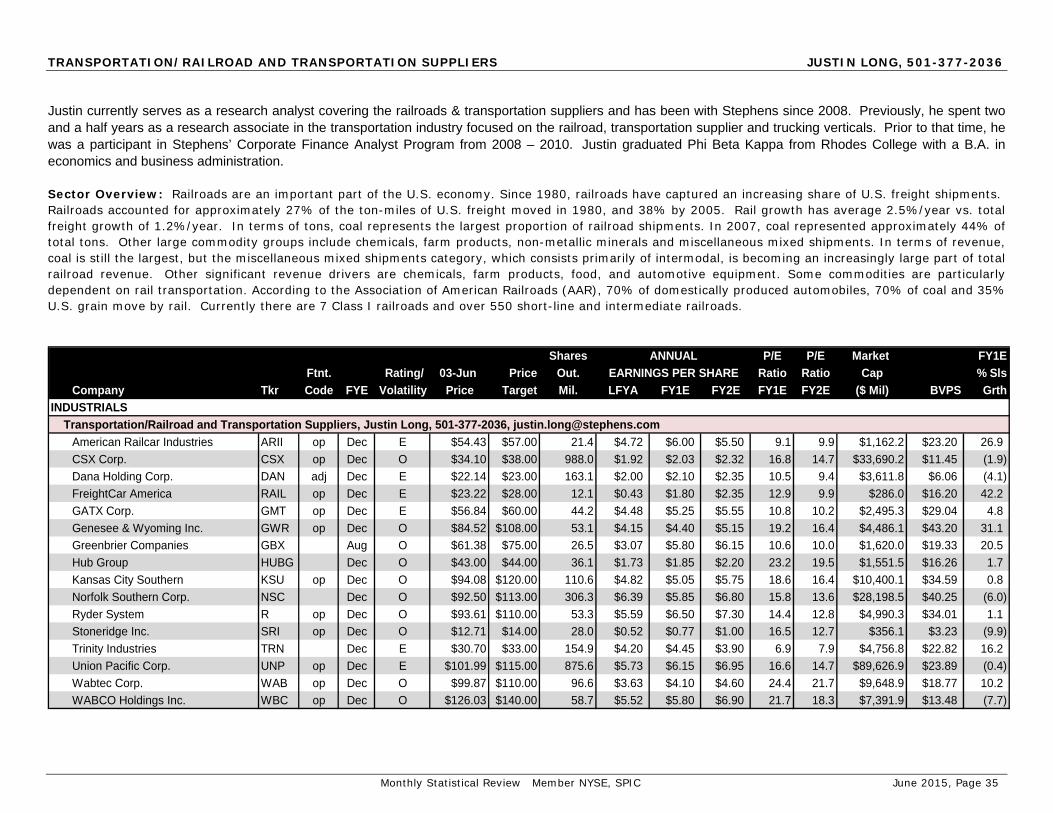
Monthly Statistical Review Member NYSE, SPIC June 2015, Page 35
TRANSPORTATION/RAILROAD AND TRANSPORTATION SUPPLIERS JUSTIN LONG, 501-377-2036
Justin currently serves as a research analyst covering the railroads & transportation suppliers and has been with Stephens since 2008. Previously, he spent two and a half years as a research associate in the transportation industry focused on the railroad, transportation supplier and trucking verticals. Prior to that time, he was a participant in Stephens’ Corporate Finance Analyst Program from 2008 – 2010. Justin graduated Phi Beta Kappa from Rhodes College with a B.A. in economics and business administration. Sector Overview: Railroads are an important part of the U.S. economy. Since 1980, railroads have captured an increasing share of U.S. freight shipments. Railroads accounted for approximately 27% of the ton-miles of U.S. freight moved in 1980, and 38% by 2005. Rail growth has average 2.5%/year vs. total freight growth of 1.2%/year. In terms of tons, coal represents the largest proportion of railroad shipments. In 2007, coal represented approximately 44% of total tons. Other large commodity groups include chemicals, farm products, non-metallic minerals and miscellaneous mixed shipments. In terms of revenue, coal is still the largest, but the miscellaneous mixed shipments category, which consists primarily of intermodal, is becoming an increasingly large part of total railroad revenue. Other significant revenue drivers are chemicals, farm products, food, and automotive equipment. Some commodities are particularly dependent on rail transportation. According to the Association of American Railroads (AAR), 70% of domestically produced automobiles, 70% of coal and 35% U.S. grain move by rail. Currently there are 7 Class I railroads and over 550 short-line and intermediate railroads.
Shares ANNUAL P/E P/E Market FY1EFtnt. Rating/ 03-Jun Price Out. EARNINGS PER SHARE Ratio Ratio Cap % Sls
Company Tkr Code FYE Volatility Price Target Mil. LFYA FY1E FY2E FY1E FY2E ($ Mil) BVPS GrthINDUSTRIALS Transportation/Railroad and Transportation Suppliers, Justin Long, 501-377-2036, [email protected]
American Railcar Industries ARII op Dec E $54.43 $57.00 21.4 $4.72 $6.00 $5.50 9.1 9.9 $1,162.2 $23.20 26.9CSX Corp. CSX op Dec O $34.10 $38.00 988.0 $1.92 $2.03 $2.32 16.8 14.7 $33,690.2 $11.45 (1.9)Dana Holding Corp. DAN adj Dec E $22.14 $23.00 163.1 $2.00 $2.10 $2.35 10.5 9.4 $3,611.8 $6.06 (4.1)FreightCar America RAIL op Dec E $23.22 $28.00 12.1 $0.43 $1.80 $2.35 12.9 9.9 $286.0 $16.20 42.2GATX Corp. GMT op Dec E $56.84 $60.00 44.2 $4.48 $5.25 $5.55 10.8 10.2 $2,495.3 $29.04 4.8Genesee & Wyoming Inc. GWR op Dec O $84.52 $108.00 53.1 $4.15 $4.40 $5.15 19.2 16.4 $4,486.1 $43.20 31.1Greenbrier Companies GBX Aug O $61.38 $75.00 26.5 $3.07 $5.80 $6.15 10.6 10.0 $1,620.0 $19.33 20.5Hub Group HUBG Dec O $43.00 $44.00 36.1 $1.73 $1.85 $2.20 23.2 19.5 $1,551.5 $16.26 1.7Kansas City Southern KSU op Dec O $94.08 $120.00 110.6 $4.82 $5.05 $5.75 18.6 16.4 $10,400.1 $34.59 0.8Norfolk Southern Corp. NSC Dec O $92.50 $113.00 306.3 $6.39 $5.85 $6.80 15.8 13.6 $28,198.5 $40.25 (6.0)Ryder System R op Dec O $93.61 $110.00 53.3 $5.59 $6.50 $7.30 14.4 12.8 $4,990.3 $34.01 1.1Stoneridge Inc. SRI op Dec O $12.71 $14.00 28.0 $0.52 $0.77 $1.00 16.5 12.7 $356.1 $3.23 (9.9)Trinity Industries TRN Dec E $30.70 $33.00 154.9 $4.20 $4.45 $3.90 6.9 7.9 $4,756.8 $22.82 16.2Union Pacific Corp. UNP op Dec E $101.99 $115.00 875.6 $5.73 $6.15 $6.95 16.6 14.7 $89,626.9 $23.89 (0.4)Wabtec Corp. WAB op Dec O $99.87 $110.00 96.6 $3.63 $4.10 $4.60 24.4 21.7 $9,648.9 $18.77 10.2WABCO Holdings Inc. WBC op Dec O $126.03 $140.00 58.7 $5.52 $5.80 $6.90 21.7 18.3 $7,391.9 $13.48 (7.7)

Monthly Statistical Review Member NYSE, SPIC June 2015, Page 36
TRANSPORTATION/TRUCKLOAD AND LESS-THAN-TRUCKLOAD BRAD DELCO, 501-377-8057
Brad is a research analyst covering the truckload and less-than-truckload sectors. Brad joined the transportation research team in August 2009 after serving four years in the Corporate Finance department at Stephens. At that time he served as an associate covering the truckload and less-than-truckload sector before being promoted to research analyst in November 2010 covering the rail and transport supplier universe. He transitioned back to covering the truckload and less-than-truckload in January 2013. Brad holds a B.S. in business, magna cum laude, from Wake Forest University. Sector Overview: Truckload industry (TL) by Department of Transportation (DOT) definition is characterized by shipments of 10,000 pounds or more and is approximately $65 billion in size. Concentration within the industry is very fragmented with approximately 50,000 carriers, and labor tends to be predominately non-union. TL carriers transport trailer-load shipments bound for a single destination, and routes tend to be irregular with few terminals (used mainly for maintenance). There are several sub-categories including dry-van, flatbed, temperature-controlled, tanker, regional and expedited. Operations vary depending on length of haul, which falls into three service categories: long-haul (over 1,000 miles), medium-haul (600-1,000 miles) and short-haul (less than 600 miles). Rates (a proxy for pricing) have not kept pace with inflation (CPI) over the last 15 years. Profitability is defined in terms of operating ratios (one minus operating margin) and tends to vary from 82% to 99%. Growth is usually a function of shipper-driven consolidation and conversion of private fleets. Sector Overview: Less-Than-Truckload (LTL) industry provides transportation of partial-load shipments that go to one or more destinations or full trailer-load shipments going to multiple destinations. The LTL is a $39 billion industry and is comprised of two distinct segments, national LTL and regional LTL. The national LTL participants operate a "hub-and-spoke" network with an average length of haul of 1,200 to 1,400 miles. Growth is dependent on accelerated economic activity and competitor failures. The estimated size of the national LTL segment is $12 billion. The regional LTL segment is characterized by numerous carriers, typically non-union, that operate a modified hub-and-spoke network, with an average length of haul of 200 to 600 miles for most freight. Growth in this segment is dependent on consolidation within the marketplace, the shift toward more regionalized freight patterns by shippers, and general economic growth. The regional LTL segment is highly fragmented, with the top 20 participants accounting for roughly 50% of the estimated $27 billion market.

Monthly Statistical Review Member NYSE, SPIC June 2015, Page 37
TRANSPORTATION/TRUCKLOAD AND LESS-THAN-TRUCKLOAD BRAD DELCO, 501-377-8057
Shares ANNUAL P/E P/E Market FY1EFtnt. Rating/ 03-Jun Price Out. EARNINGS PER SHARE Ratio Ratio Cap % Sls
Company Tkr Code FYE Volatility Price Target Mil. LFYA FY1E FY2E FY1E FY2E ($ Mil) BVPS GrthINDUSTRIALS Transportation/Truckload and Less-Than-Truckload, Brad Delco, 501-377-8057, [email protected]
ArcBest Corp. ARCB op Dec O $34.80 $45.00 26.0 $1.80 $2.35 $3.05 14.8 11.4 $905.0 $21.46 5.7Celadon Group, Inc. CGI op Jun O $23.08 $32.00 24.3 $0.96 $1.50 $1.80 15.4 12.8 $631.0 $11.25 16.7Con-way Inc. CNW op Dec E $41.37 $47.00 57.6 $2.32 $2.50 $3.05 16.5 13.6 $2,384.2 $20.69 1.7Covenant Transportation Group CVTI op Dec O $30.29 $39.00 16.3 $1.38 $1.95 $2.20 15.5 13.8 $481.8 $9.35 2.2Heartland Express, Inc. HTLD Dec O $21.34 $29.00 87.8 $0.96 $1.05 $1.20 20.3 17.8 $1,873.5 $5.61 (9.8)J.B. Hunt Transport Services, Inc. JBHT op Dec O $85.52 $100.00 116.5 $3.16 $3.60 $4.25 23.8 20.1 $9,967.9 $10.33 2.8Knight Transportation, Inc. KNX op Dec O $29.09 $39.00 82.3 $1.25 $1.50 $1.75 19.4 16.6 $2,393.4 $8.64 14.5Marten Transport, Ltd. MRTN op Dec O $23.40 $28.00 33.5 $0.89 $1.12 $1.35 20.9 17.3 $785.5 $11.90 0.0Old Dominion Freight Line ODFL op Dec O $68.11 $86.00 85.9 $3.10 $3.60 $4.20 18.9 16.2 $5,841.5 $17.35 9.3Rush Enterprises, Inc. RUSHA Dec E $28.27 $33.00 30.2 $2.03 $1.90 $2.40 14.9 11.8 $852.9 $19.16 7.8Saia, Inc. SAIA op Dec O $41.57 $50.00 25.1 $2.00 $2.50 $3.10 16.6 13.4 $1,043.0 $15.12 (0.8)Swift Transportation Co. SWFT op Dec O $24.14 $35.00 91.5 $1.37 $1.70 $1.90 14.2 12.7 $2,206.0 $3.62 1.2USA Truck, Inc. USAK Dec E $23.84 $25.00 10.6 $0.73 $1.00 $1.25 23.8 19.1 $253.9 $10.00 (3.8)Wabash National Corp. WNC op Dec E $13.67 $13.00 67.9 $0.89 $1.20 $1.25 11.4 10.9 $933.7 $5.66 7.0Werner Enterprises, Inc. WERN Dec E $28.04 $33.00 72.1 $1.35 $1.60 $1.75 17.5 16.0 $2,015.5 $11.86 (1.1)YRC Worldwide Inc. YRCW op Dec U/V $13.96 NE 47.8 ($7.38) ($3.25) ($2.64) NM NM $457.2 ($3.96) 6.6

Monthly Statistical Review Member NYSE, SPIC June 2015, Page 38
BUSINESS SERVICES BRETT HUFF, CFA, 501-377-8068
Brett is a managing director leading the business services team. He joined Stephens Inc. in April 2005 as research associate covering title, insurance broker and financial services technology companies. Prior to joining Stephens, he was an associate analyst at Southwest Securities focused on the specialty retail industry. He also previously worked at OpenAir, Inc., a private software company in Boston which was subsequently purchased by NetSuite, Inc., where he held Director of Product Management and Director of Marketing positions. Prior to that, he worked at Deloitte Consulting as a management consultant. Brett obtained his A.B. in social studies from Harvard University and received an M.B.A., focusing on finance and strategy, from the Kellogg School of Management at Northwestern University.
Sector Overview: Our business services practice has two parts: data/IT companies and payment processing/bank technology. For the data/IT market, the first major use case is helping marketers target advertising more effectively. We think the companies that will win in this market are those that have superior data assets (given we think channel expertise over time is less of a competitive advantage) and strong advertiser relationships/customers (as advertisers are ultimately the funders of the entire ad ecosystem). The second major use case is helping banks and corporates make better underwriting decisions. We think the winning companies here will be those with superior data assets, with an international opportunity, and with the proven ability to innovate and cross sell. For payment processing/bank technology, we see two primary markets: selling services to banks and selling services to merchants. For the bank focused companies, we think the winning companies will have established the role of trusted IT advisor to the bank, will leverage that status to cross sell additional products/take share of wallet from point solutions to help offset price compression, and will have developed or bought higher-growth/higher-margin payment assets to drive incremental margin. For the merchant focused market, we think the winning companies will have a method to differentiate their services from standard merchant acquiring offerings. In some cases it could be achieving a trusted advisor status with the merchant and in others it could be offering a acquiring integrated into a value added software/services bundle.
Shares ANNUAL P/E P/E Market FY1EFtnt. Rating/ 03-Jun Price Out. EARNINGS PER SHARE Ratio Ratio Cap % Sls
Company Tkr Code FYE Volatility Price Target Mil. LFYA FY1E FY2E FY1E FY2E ($ Mil) BVPS GrthTECHNOLOGY Business Services, Brett Huff, CFA, 501-377-8068, [email protected]
ACI Worldwide, Inc. ACIW pf/cs Dec O $24.79 $26.00 116.8 $1.03 $1.07 $1.31 23.2 18.9 $2,894.2 $4.95 2.0Acxiom Corp. ACXM cs Mar O/V $17.54 $24.00 77.3 $0.78 $0.45 $0.79 39.0 22.2 $1,371.2 $8.95 (18.8)Alliance Data Systems ADS adj/cs Dec O/V $299.00 $350.00 62.8 $12.60 $14.95 $17.48 20.0 17.1 $18,552.7 $30.43 22.8Bottomline Technologies EPAY pf/cs Jun O/V $27.41 $31.00 39.9 $1.29 $1.44 $1.53 19.0 17.9 $1,121.8 $9.65 10.3CoStar Group, Inc. CSGP pf Dec O $207.69 $230.00 32.4 $3.30 $2.07 $4.75 NM 43.7 $6,731.2 $46.75 21.0D&B DNB adj Dec E $129.53 $125.00 36.0 $7.49 $7.63 $8.54 17.0 15.2 $4,667.6 ($33.52) 4.8Equifax Inc. EFX cs Dec O $98.78 $105.00 119.0 $3.89 $4.36 $5.07 22.7 19.5 $11,755.4 $18.05 7.4Experian plc EXPGY adj Mar O/V $18.90 $20.00 986.6 $0.92 $0.96 $0.98 19.7 19.3 $18,638.3 NA 2.5FICO FICO cs Sep E $88.74 $73.00 31.4 $3.71 $4.03 $4.71 22.0 18.8 $2,755.6 $12.71 5.6Fidelity National Information Svcs. FIS op/cs Dec O $62.52 $71.00 283.3 $3.10 $3.27 $3.69 19.1 16.9 $17,722.2 $22.46 1.9Fiserv, Inc. FISV adj Dec E $81.38 $77.00 236.8 $3.37 $3.79 $4.22 21.5 19.3 $19,269.9 $13.54 4.7Global Payments Inc. GPN op/cs May E $106.67 $103.00 66.5 $4.12 $4.77 $5.55 22.4 19.2 $7,089.1 $12.42 7.8Heartland Payment Systems HPY pf Dec E $53.90 $53.00 36.6 $1.34 $2.83 $3.16 19.0 17.1 $1,972.7 $6.90 18.0Marchex, Inc. MCHX csh Dec O/V $5.14 $6.00 37.1 $0.27 $0.17 $0.18 30.2 28.6 $190.6 $3.83 (19.4)Rocket Fuel Inc. FUEL pf Dec E/V $8.43 $9.00 42.2 ($0.65) ($0.97) ($0.73) NM NM $355.6 $7.45 21.4Rubicon Project, Inc. RUBI pf Dec O/V $17.06 $27.00 37.9 $0.15 $0.24 $0.45 71.1 37.9 $726.1 $3.46 63.1Jack Henry & Associates, Inc. JKHY Jun E $65.74 $67.00 81.8 $2.32 $2.62 $2.75 25.1 23.9 $5,376.0 $12.38 5.8Total System Services TSS op Dec O $41.59 $45.00 184.3 $1.96 $2.25 $2.46 18.5 16.9 $7,665.5 $9.27 9.1

Monthly Statistical Review Member NYSE, SPIC June 2015, Page 39
COMMUNICATIONS TECHNOLOGY TIM QUILLIN, CFA, 501-377-8078
Tim is a managing director leading the communications technology. Previous research has included intellectual property, cyber security, defense technology, communications software, e-commerce fulfillment and transportation. Tim came to Stephens in 1997 from Salomon Brothers in New York. He also served four years as a Commissioned Officer/Explosive Ordnance Disposal Technician in the U.S. Army. He holds a B.S.B.A. from the University of Arizona and an M.B.A. from the University of Iowa. Sector Overview: Our Communications Technology research focuses primarily on providers of hardware, software and services that support mobility ecosystems, network infrastructure and optimization, media distribution, machine-to-machine (M2M) solutions and sensing applications.
Shares ANNUAL P/E P/E Market FY1EFtnt. Rating/ 03-Jun Price Out. EARNINGS PER SHARE Ratio Ratio Cap % Sls
Company Tkr Code FYE Volatility Price Target Mil. LFYA FY1E FY2E FY1E FY2E ($ Mil) BVPS GrthTECHNOLOGY Communications Technology, Tim Quillin, CFA, 501-377-8078, [email protected]
ARRIS Group, Inc. ARRS pf Dec O/V $33.84 $43.00 149.0 $2.76 $2.60 $2.87 13.0 11.8 $4,933.7 $11.65 (0.6)ADTRAN, Inc. ADTN pf Dec E/V $16.89 $17.00 53.3 $0.95 $0.55 $0.78 30.7 21.7 $900.6 $10.18 (4.4)CalAmp Corp. CAMP pf Feb O/V $19.57 $25.00 36.6 $0.96 $1.15 $1.30 17.0 15.1 $708.9 $4.18 12.3Calix Inc. CALX pf Dec O/V $8.10 $11.00 51.7 $0.29 $0.03 $0.16 NM 50.6 $419.6 $5.10 2.5CommScope Holding Co. COMM pf Dec E/V $32.18 $36.00 193.1 $2.23 $1.90 $2.10 16.9 15.3 $6,095.5 $7.07 (6.8)EchoStar Corp. SATS Dec O $51.02 $59.00 44.5 $1.78 $1.83 $1.98 27.9 25.8 $2,256.3 $38.64 (3.2)FLIR Systems, Inc. FLIR pf Dec O $31.02 $41.00 140.1 $1.49 $1.65 $1.80 18.8 17.2 $4,346.7 $11.34 2.6Harmonic Inc. HLIT pf Dec E/V $7.12 $7.00 88.5 $0.16 $0.26 $0.30 27.4 23.7 $630.4 $4.19 (2.1)Rovi Corp. ROVI pf Dec E/V $17.43 $18.00 89.2 $1.74 $1.56 $2.05 11.2 8.5 $1,541.1 $12.03 (2.3)RPX Corp. RPXC pf Dec O/V $16.00 $18.00 54.3 $0.97 $0.95 $1.00 16.8 16.0 $868.4 $9.34 12.9Ruckus Wireless, Inc. RKUS pf Dec O/V $11.09 $12.00 97.8 $0.44 $0.41 $0.47 27.0 23.6 $960.0 $3.05 13.3Sierra Wireless, Inc. SWIR pf Dec E/V $30.43 $34.00 32.6 $0.63 $1.00 $1.30 30.4 23.4 $977.8 $10.81 15.8TiVo Inc. TIVO Jan E/V $10.77 $13.00 110.5 $0.28 $0.34 $0.42 31.7 25.6 $1,047.9 $3.22 3.7Ubiquiti Networks, Inc. UBNT pf Jun E/V $31.32 $32.00 89.4 $2.00 $1.93 $2.00 16.2 15.7 $2,756.2 $4.95 4.1ViaSat, Inc. VSAT pf Mar E/V $64.48 $70.00 48.6 $1.58 $1.54 $1.37 41.9 47.1 $3,076.1 $218.00 5.1

Monthly Statistical Review Member NYSE, SPIC June 2015, Page 40
INFRASTRUCTURE SOFTWARE AND SECURITY JONATHAN RUYKHAVER, CFA, 615-279-4331
Jonathan B. Ruykhaver, CFA, is a managing director covering infrastructure software and security. Prior to joining Stephens in March 2012, Jonathan covered the infrastructure software sector at Morgan Keegan, ThinkEquity LLC and Raymond James. He holds the Chartered Financial Analyst designation and has over 12 years of experience as a sell-side analyst in the technology sector. Jonathan is a graduate of Tufts University and he participated in a masters of applied economics program at the University of Michigan Sector Overview: Infrastructure Software and Security represents technologies which secure, connect and optimize the performance of core IT systems, applications and business processes.
Shares ANNUAL P/E P/E Market FY1EFtnt. Rating/ 03-Jun Price Out. EARNINGS PER SHARE Ratio Ratio Cap % Sls
Company Tkr Code FYE Volatility Price Target Mil. LFYA FY1E FY2E FY1E FY2E ($ Mil) BVPS GrthTECHNOLOGY Infrastructure Software and Security, Jonathan Ruykhaver, CFA, 615-279-4331, [email protected]
Aerohive Networks, Inc. HIVE pf Dec E/V $7.26 $6.00 46.6 ($0.56) ($0.69) ($0.52) NM NM $338.7 $0.99 10.1Barracuda Networks, Inc. CUDA pf Feb O/V $40.77 $48.00 52.9 $0.28 $0.39 $0.50 NM 81.5 $2,157.3 ($0.74) 18.1Check Point Software Tech. CHKP pf Dec O $83.70 $95.00 183.8 $3.72 $3.96 $4.42 21.1 18.9 $15,137.6 $19.69 8.0Citrix Systems CTXS pf Dec E/V $66.27 $68.00 160.3 $3.30 $3.57 $3.92 18.6 16.9 $10,622.3 $13.12 3.2FireEye, Inc. FEYE pf Dec E/V $47.69 $45.00 156.2 ($1.97) ($1.80) ($1.20) NM NM $7,455.4 $8.18 46.8Fortinet, Inc. FTNT pf Dec O/V $40.08 $42.00 168.9 $0.48 $0.51 $0.64 78.6 62.6 $6,796.1 $4.06 21.7Imperva, Inc. IMPV pf Dec O/V $61.00 $59.00 27.1 ($0.74) ($0.70) ($0.45) NM NM $1,866.4 $3.62 24.8Infoblox Inc. BLOX pf Jul O/V $26.19 $30.00 56.7 $0.34 $0.35 $0.41 74.8 63.9 $1,503.0 $4.34 19.5LogMeIn, Inc. LOGM pf Dec O/V $64.47 $65.00 24.7 $1.18 $1.40 $1.60 46.1 40.3 $1,587.5 $7.35 18.6NetScout Systems, Inc. NTCT pf Mar E/V $39.98 $40.00 41.5 $2.03 $2.31 $2.62 17.3 15.3 $1,629.7 $10.49 13.9Palo Alto Networks, Inc. PANW pf Jul O/V $169.19 $180.00 82.3 $0.40 $0.83 $1.62 NM NM $14,154.4 $6.27 50.1Proofpoint, Inc. PFPT pf Dec O/V $60.60 $66.00 39.0 ($0.40) ($0.38) ($0.02) NM NM $2,388.9 $1.23 28.4Qualys, Inc. QLYS pf Dec E/V $41.33 $45.00 34.0 $0.46 $0.53 $0.70 78.0 59.0 $1,403.4 $4.79 24.1Red Hat, Inc. RHT pf Feb O/V $77.83 $85.00 186.3 $1.60 $1.81 $2.13 43.0 36.5 $14,267.7 $6.92 12.3SolarWinds, Inc. SWI pf Dec E/V $49.12 $55.00 76.4 $1.83 $1.98 $2.35 24.8 20.9 $3,752.2 $7.76 21.2Splunk, Inc. SPLK pf Jan O/V $66.78 $80.00 124.6 $0.09 $0.13 $0.30 NM NM $8,368.4 $6.54 35.7Symantec Corp. SYMC pf Mar E $24.32 $24.00 693.0 $1.88 $1.87 $1.95 13.0 12.5 $16,555.3 $8.56 (4.0)Varonis Systems, Inc. VRNS pf Dec O/V $20.88 $28.00 24.8 ($0.60) ($0.71) ($0.32) NM NM $518.8 $3.85 23.4

Monthly Statistical Review Member NYSE, SPIC June 2015, Page 41
MEDIA KYLE EVANS, 501-377-6376
Kyle is a managing director leading the Media practice in equity research at Stephens, where he has worked for over 15 years. He joined the research department in 1999 as an associate in the Internet Media and Ad Technology groups, and eventually became lead analyst over the Internet and Business Services groups. In 2009, Kyle took an operational position as VP of Digital at Stephens Media, a holding company with 13 dailies and over 60 weeklies, magazines and specialty publications. Prior to joining Stephens, Kyle worked at the Medical College of Virginia in the Neuropsychology department. He graduated with a B.A. in Psychology from Denison University and an M.A. in Psychology from the University of Richmond. Sector Overview: Our practice encompasses all media channels, including digital, print, TV, radio, and outdoor. We have a strong interest in hybrid and transitioning business models, and recommendations are informed by our analysis of industry trends, including consumer use patterns, shifting ad spend, consolidation, defensibility of markets, and disruptive new products and services.
Shares ANNUAL P/E P/E Market FY1EFtnt. Rating/ 03-Jun Price Out. EARNINGS PER SHARE Ratio Ratio Cap % Sls
Company Tkr Code FYE Volatility Price Target Mil. LFYA FY1E FY2E FY1E FY2E ($ Mil) BVPS GrthTECHNOLOGY Media, Kyle Evans, 501-377-6376, [email protected]
TechTarget, Inc. TTGT adj Dec O/V $9.19 $15.00 33.1 $0.28 $0.33 $0.43 27.8 21.4 $304.1 $4.81 10.4TrueCar, Inc. TRUE adj Dec O/V $13.94 $23.00 98.1 ($0.05) $0.15 $0.49 92.9 28.4 $1,142.3 $3.12 37.6
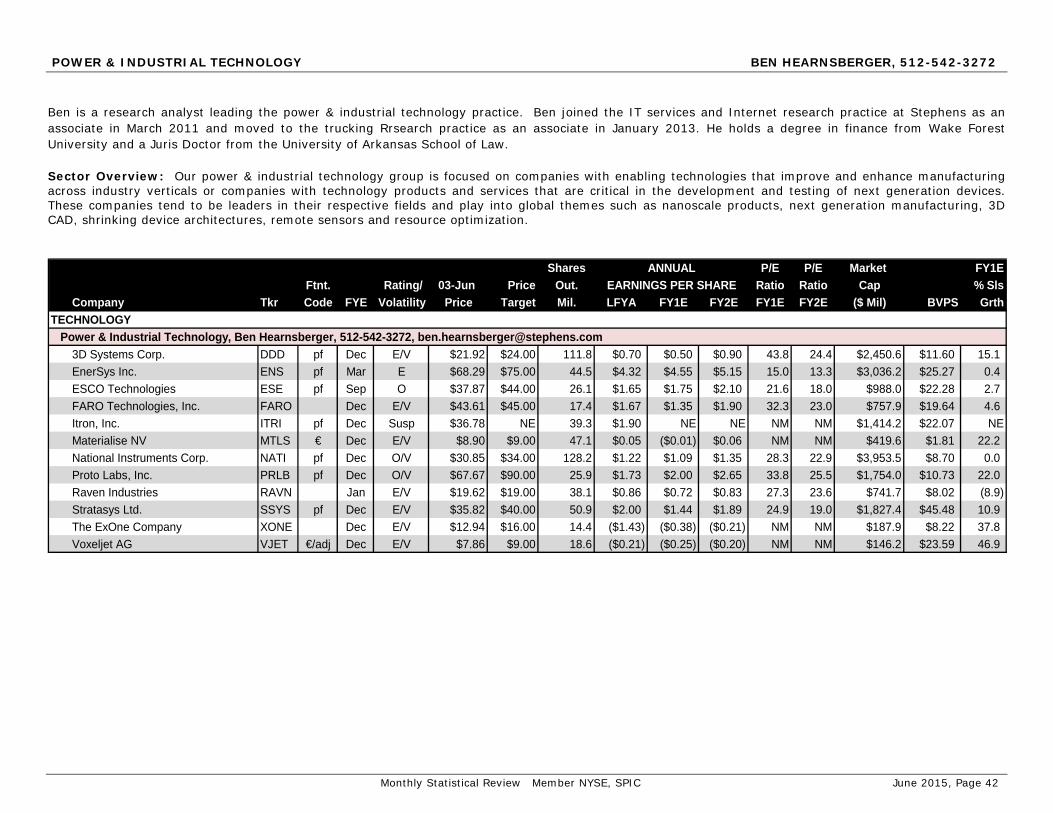
Monthly Statistical Review Member NYSE, SPIC June 2015, Page 42
POWER & INDUSTRIAL TECHNOLOGY BEN HEARNSBERGER, 512-542-3272
Ben is a research analyst leading the power & industrial technology practice. Ben joined the IT services and Internet research practice at Stephens as an associate in March 2011 and moved to the trucking Rrsearch practice as an associate in January 2013. He holds a degree in finance from Wake Forest University and a Juris Doctor from the University of Arkansas School of Law. Sector Overview: Our power & industrial technology group is focused on companies with enabling technologies that improve and enhance manufacturing across industry verticals or companies with technology products and services that are critical in the development and testing of next generation devices. These companies tend to be leaders in their respective fields and play into global themes such as nanoscale products, next generation manufacturing, 3D CAD, shrinking device architectures, remote sensors and resource optimization.
Shares ANNUAL P/E P/E Market FY1E
Ftnt. Rating/ 03-Jun Price Out. EARNINGS PER SHARE Ratio Ratio Cap % SlsCompany Tkr Code FYE Volatility Price Target Mil. LFYA FY1E FY2E FY1E FY2E ($ Mil) BVPS Grth
TECHNOLOGY Power & Industrial Technology, Ben Hearnsberger, 512-542-3272, [email protected]
3D Systems Corp. DDD pf Dec E/V $21.92 $24.00 111.8 $0.70 $0.50 $0.90 43.8 24.4 $2,450.6 $11.60 15.1EnerSys Inc. ENS pf Mar E $68.29 $75.00 44.5 $4.32 $4.55 $5.15 15.0 13.3 $3,036.2 $25.27 0.4ESCO Technologies ESE pf Sep O $37.87 $44.00 26.1 $1.65 $1.75 $2.10 21.6 18.0 $988.0 $22.28 2.7FARO Technologies, Inc. FARO Dec E/V $43.61 $45.00 17.4 $1.67 $1.35 $1.90 32.3 23.0 $757.9 $19.64 4.6Itron, Inc. ITRI pf Dec Susp $36.78 NE 39.3 $1.90 NE NE NM NM $1,414.2 $22.07 NEMaterialise NV MTLS € Dec E/V $8.90 $9.00 47.1 $0.05 ($0.01) $0.06 NM NM $419.6 $1.81 22.2National Instruments Corp. NATI pf Dec O/V $30.85 $34.00 128.2 $1.22 $1.09 $1.35 28.3 22.9 $3,953.5 $8.70 0.0Proto Labs, Inc. PRLB pf Dec O/V $67.67 $90.00 25.9 $1.73 $2.00 $2.65 33.8 25.5 $1,754.0 $10.73 22.0Raven Industries RAVN Jan E/V $19.62 $19.00 38.1 $0.86 $0.72 $0.83 27.3 23.6 $741.7 $8.02 (8.9)Stratasys Ltd. SSYS pf Dec E/V $35.82 $40.00 50.9 $2.00 $1.44 $1.89 24.9 19.0 $1,827.4 $45.48 10.9The ExOne Company XONE Dec E/V $12.94 $16.00 14.4 ($1.43) ($0.38) ($0.21) NM NM $187.9 $8.22 37.8Voxeljet AG VJET €/adj Dec E/V $7.86 $9.00 18.6 ($0.21) ($0.25) ($0.20) NM NM $146.2 $23.59 46.9
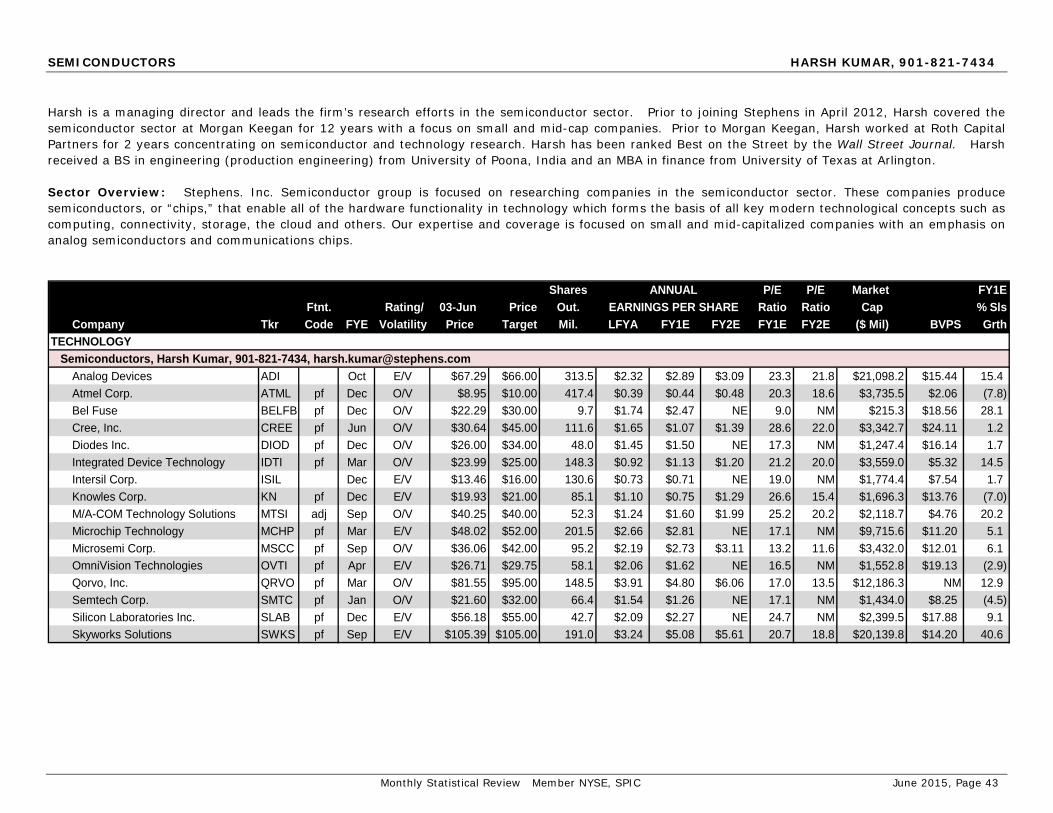
Monthly Statistical Review Member NYSE, SPIC June 2015, Page 43
SEMICONDUCTORS HARSH KUMAR, 901-821-7434
Harsh is a managing director and leads the firm’s research efforts in the semiconductor sector. Prior to joining Stephens in April 2012, Harsh covered the semiconductor sector at Morgan Keegan for 12 years with a focus on small and mid-cap companies. Prior to Morgan Keegan, Harsh worked at Roth Capital Partners for 2 years concentrating on semiconductor and technology research. Harsh has been ranked Best on the Street by the Wall Street Journal. Harsh received a BS in engineering (production engineering) from University of Poona, India and an MBA in finance from University of Texas at Arlington. Sector Overview: Stephens. Inc. Semiconductor group is focused on researching companies in the semiconductor sector. These companies produce semiconductors, or “chips,” that enable all of the hardware functionality in technology which forms the basis of all key modern technological concepts such as computing, connectivity, storage, the cloud and others. Our expertise and coverage is focused on small and mid-capitalized companies with an emphasis on analog semiconductors and communications chips.
Shares ANNUAL P/E P/E Market FY1EFtnt. Rating/ 03-Jun Price Out. EARNINGS PER SHARE Ratio Ratio Cap % Sls
Company Tkr Code FYE Volatility Price Target Mil. LFYA FY1E FY2E FY1E FY2E ($ Mil) BVPS GrthTECHNOLOGY Semiconductors, Harsh Kumar, 901-821-7434, [email protected]
Analog Devices ADI Oct E/V $67.29 $66.00 313.5 $2.32 $2.89 $3.09 23.3 21.8 $21,098.2 $15.44 15.4Atmel Corp. ATML pf Dec O/V $8.95 $10.00 417.4 $0.39 $0.44 $0.48 20.3 18.6 $3,735.5 $2.06 (7.8)Bel Fuse BELFB pf Dec O/V $22.29 $30.00 9.7 $1.74 $2.47 NE 9.0 NM $215.3 $18.56 28.1Cree, Inc. CREE pf Jun O/V $30.64 $45.00 111.6 $1.65 $1.07 $1.39 28.6 22.0 $3,342.7 $24.11 1.2Diodes Inc. DIOD pf Dec O/V $26.00 $34.00 48.0 $1.45 $1.50 NE 17.3 NM $1,247.4 $16.14 1.7Integrated Device Technology IDTI pf Mar O/V $23.99 $25.00 148.3 $0.92 $1.13 $1.20 21.2 20.0 $3,559.0 $5.32 14.5Intersil Corp. ISIL Dec E/V $13.46 $16.00 130.6 $0.73 $0.71 NE 19.0 NM $1,774.4 $7.54 1.7Knowles Corp. KN pf Dec E/V $19.93 $21.00 85.1 $1.10 $0.75 $1.29 26.6 15.4 $1,696.3 $13.76 (7.0)M/A-COM Technology Solutions MTSI adj Sep O/V $40.25 $40.00 52.3 $1.24 $1.60 $1.99 25.2 20.2 $2,118.7 $4.76 20.2Microchip Technology MCHP pf Mar E/V $48.02 $52.00 201.5 $2.66 $2.81 NE 17.1 NM $9,715.6 $11.20 5.1Microsemi Corp. MSCC pf Sep O/V $36.06 $42.00 95.2 $2.19 $2.73 $3.11 13.2 11.6 $3,432.0 $12.01 6.1OmniVision Technologies OVTI pf Apr E/V $26.71 $29.75 58.1 $2.06 $1.62 NE 16.5 NM $1,552.8 $19.13 (2.9)Qorvo, Inc. QRVO pf Mar O/V $81.55 $95.00 148.5 $3.91 $4.80 $6.06 17.0 13.5 $12,186.3 NM 12.9Semtech Corp. SMTC pf Jan O/V $21.60 $32.00 66.4 $1.54 $1.26 NE 17.1 NM $1,434.0 $8.25 (4.5)Silicon Laboratories Inc. SLAB pf Dec E/V $56.18 $55.00 42.7 $2.09 $2.27 NE 24.7 NM $2,399.5 $17.88 9.1Skyworks Solutions SWKS pf Sep E/V $105.39 $105.00 191.0 $3.24 $5.08 $5.61 20.7 18.8 $20,139.8 $14.20 40.6

Monthly Statistical Review Member NYSE, SPIC June 2015, Page 44
SOFTWARE AS A SERVICE ALEX ZUKIN, 415-548-6907
Alex is a research analyst covering the enterprise software as a service segment in the San Francisco office. He previously was a research associate covering infrastructure software. Prior to joining Stephens in 2012, Alex was a Vice President and research associate covering the infrastructure software sector for Morgan Keegan and ThinkEquity. Alex holds both a B.S. in business administration and a B.A in economics from the University of California, Berkeley. Sector Overview: Enterprise Software as a Service represents companies that deliver enterprise applications that have greater agility, flexibility and lower total cost of ownership while delivering greater organizational value than legacy premise based systems.
Shares ANNUAL P/E P/E Market FY1E
Ftnt. Rating/ 03-Jun Price Out. EARNINGS PER SHARE Ratio Ratio Cap % SlsCompany Tkr Code FYE Volatility Price Target Mil. LFYA FY1E FY2E FY1E FY2E ($ Mil) BVPS Grth
TECHNOLOGY Software as a Service, Alex Zukin, 415-548-6907, [email protected]
Adobe Systems ADBE pf Nov O/V $80.13 $100.00 500.3 $1.30 $2.11 $3.18 38.0 25.2 $40,086.6 $13.18 17.6CallidusCloud CALD pf Dec O/V $15.00 $20.00 55.3 $0.14 $0.22 $0.35 68.2 42.9 $829.1 $2.29 21.6Cornerstone OnDemand, Inc. CSOD pf Dec E/V $32.89 $40.00 53.9 ($0.32) ($0.29) ($0.22) NM NM $1,774.0 $0.42 29.2Demandware, Inc. DWRE pf Dec O/V $62.77 $75.00 36.6 $0.12 $0.17 $0.35 NM NM $2,349.2 $7.92 43.8Guidewire Software, Inc. GWRE pf Jul O/V $52.98 $65.00 70.2 $0.63 $0.53 $0.61 NM 86.9 $3,737.6 $9.39 7.1Marketo, Inc. MKTO pf Dec O/V $30.08 $40.00 42.1 ($0.67) ($0.83) ($0.49) NM NM $1,270.6 $2.73 39.2NetSuite Inc. N pf Dec O/V $93.31 $108.00 77.3 $0.32 $0.23 $0.25 NM NM $7,239.6 $3.04 33.0Rally Software Development RALY pf Jan E/V $19.44 $19.50 25.6 ($1.08) ($0.84) ($0.65) NM NM $498.6 $2.11 19.2Salesforce.com CRM pf Jan O/V $73.47 $95.00 655.6 $0.53 $0.71 $0.97 NM 75.7 $48,163.7 $6.11 21.8ServiceNow, Inc. NOW pf Dec O/V $76.61 $90.00 150.5 ($0.08) $0.15 $0.48 NM NM $11,764.6 $3.02 44.9SciQuest, Inc. SQI pf Dec E/V $15.25 $17.50 27.6 $0.30 $0.31 $0.36 49.2 42.4 $420.7 $6.57 4.6Tyler Technologies TYL pf Dec O $122.01 $150.00 33.7 $2.09 $2.50 $3.07 48.8 39.7 $4,108.4 $10.07 16.5Ultimate Software ULTI pf Dec O/V $165.53 $205.00 29.7 $2.11 $2.46 $3.12 67.3 53.1 $4,730.8 $9.53 22.1Workday, Inc. WDAY pf Jan E/V $80.65 $100.00 107.0 ($0.34) ($0.15) ($0.01) NM NM $8,625.7 $5.99 44.7
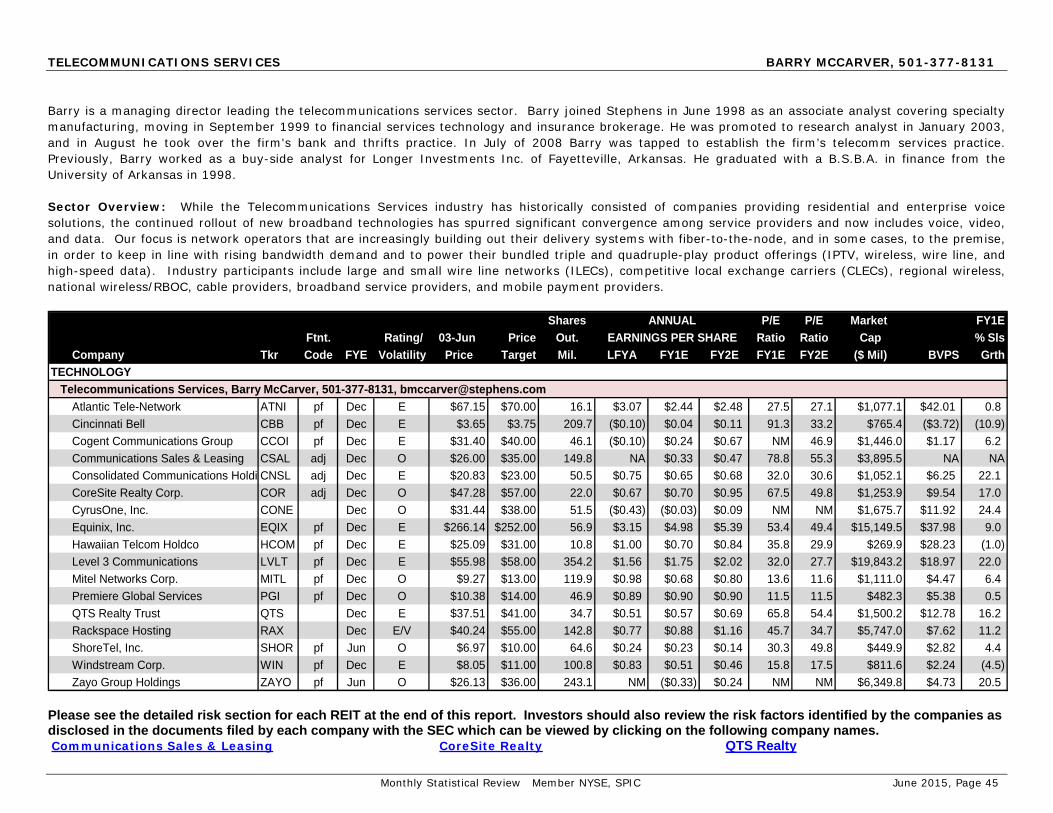
Monthly Statistical Review Member NYSE, SPIC June 2015, Page 45
TELECOMMUNICATIONS SERVICES BARRY MCCARVER, 501-377-8131
Barry is a managing director leading the telecommunications services sector. Barry joined Stephens in June 1998 as an associate analyst covering specialty manufacturing, moving in September 1999 to financial services technology and insurance brokerage. He was promoted to research analyst in January 2003, and in August he took over the firm's bank and thrifts practice. In July of 2008 Barry was tapped to establish the firm’s telecomm services practice. Previously, Barry worked as a buy-side analyst for Longer Investments Inc. of Fayetteville, Arkansas. He graduated with a B.S.B.A. in finance from the University of Arkansas in 1998. Sector Overview: While the Telecommunications Services industry has historically consisted of companies providing residential and enterprise voice solutions, the continued rollout of new broadband technologies has spurred significant convergence among service providers and now includes voice, video, and data. Our focus is network operators that are increasingly building out their delivery systems with fiber-to-the-node, and in some cases, to the premise, in order to keep in line with rising bandwidth demand and to power their bundled triple and quadruple-play product offerings (IPTV, wireless, wire line, and high-speed data). Industry participants include large and small wire line networks (ILECs), competitive local exchange carriers (CLECs), regional wireless, national wireless/RBOC, cable providers, broadband service providers, and mobile payment providers.
Shares ANNUAL P/E P/E Market FY1E
Ftnt. Rating/ 03-Jun Price Out. EARNINGS PER SHARE Ratio Ratio Cap % SlsCompany Tkr Code FYE Volatility Price Target Mil. LFYA FY1E FY2E FY1E FY2E ($ Mil) BVPS Grth
TECHNOLOGY Telecommunications Services, Barry McCarver, 501-377-8131, [email protected]
Atlantic Tele-Network ATNI pf Dec E $67.15 $70.00 16.1 $3.07 $2.44 $2.48 27.5 27.1 $1,077.1 $42.01 0.8Cincinnati Bell CBB pf Dec E $3.65 $3.75 209.7 ($0.10) $0.04 $0.11 91.3 33.2 $765.4 ($3.72) (10.9)Cogent Communications Group CCOI pf Dec E $31.40 $40.00 46.1 ($0.10) $0.24 $0.67 NM 46.9 $1,446.0 $1.17 6.2Communications Sales & Leasing CSAL adj Dec O $26.00 $35.00 149.8 NA $0.33 $0.47 78.8 55.3 $3,895.5 NA NAConsolidated Communications Holdi CNSL adj Dec E $20.83 $23.00 50.5 $0.75 $0.65 $0.68 32.0 30.6 $1,052.1 $6.25 22.1CoreSite Realty Corp. COR adj Dec O $47.28 $57.00 22.0 $0.67 $0.70 $0.95 67.5 49.8 $1,253.9 $9.54 17.0CyrusOne, Inc. CONE Dec O $31.44 $38.00 51.5 ($0.43) ($0.03) $0.09 NM NM $1,675.7 $11.92 24.4Equinix, Inc. EQIX pf Dec E $266.14 $252.00 56.9 $3.15 $4.98 $5.39 53.4 49.4 $15,149.5 $37.98 9.0Hawaiian Telcom Holdco HCOM pf Dec E $25.09 $31.00 10.8 $1.00 $0.70 $0.84 35.8 29.9 $269.9 $28.23 (1.0)Level 3 Communications LVLT pf Dec E $55.98 $58.00 354.2 $1.56 $1.75 $2.02 32.0 27.7 $19,843.2 $18.97 22.0Mitel Networks Corp. MITL pf Dec O $9.27 $13.00 119.9 $0.98 $0.68 $0.80 13.6 11.6 $1,111.0 $4.47 6.4Premiere Global Services PGI pf Dec O $10.38 $14.00 46.9 $0.89 $0.90 $0.90 11.5 11.5 $482.3 $5.38 0.5QTS Realty Trust QTS Dec E $37.51 $41.00 34.7 $0.51 $0.57 $0.69 65.8 54.4 $1,500.2 $12.78 16.2Rackspace Hosting RAX Dec E/V $40.24 $55.00 142.8 $0.77 $0.88 $1.16 45.7 34.7 $5,747.0 $7.62 11.2ShoreTel, Inc. SHOR pf Jun O $6.97 $10.00 64.6 $0.24 $0.23 $0.14 30.3 49.8 $449.9 $2.82 4.4Windstream Corp. WIN pf Dec E $8.05 $11.00 100.8 $0.83 $0.51 $0.46 15.8 17.5 $811.6 $2.24 (4.5)Zayo Group Holdings ZAYO pf Jun O $26.13 $36.00 243.1 NM ($0.33) $0.24 NM NM $6,349.8 $4.73 20.5
Please see the detailed risk section for each REIT at the end of this report. Investors should also review the risk factors identified by the companies as disclosed in the documents filed by each company with the SEC which can be viewed by clicking on the following company names. Communications Sales & Leasing CoreSite Realty QTS Realty

COVERAGE LIST
Monthly Statistical Review Member NYSE, SPIC June 2015, Page 46
DDD 3D Systems Corp. AAN Aaron’s, Inc. ABAX Abaxis, Inc. ANF Abercrombie & Fitch Co. ABMD Abiomed, Inc. AXAS Abraxas Petroleum Corp. ACHC Acadia Healthcare Co. ACIW ACI Worldwide, Inc. ACXM Acxiom Corp. ADUS Addus HomeCare Corp. ADPT Adeptus Health Inc. ADBE Adobe Systems Inc. ADTN ADTRAN, Inc. AAP Advance Auto Parts HIVE Aerohive Networks, Inc. ARO Aeropostale, Inc. AIRM Air Methods Corp. ATSG Air Transport Services Group ALGN Align Technology ADS Alliance Data Systems AIMC Altra Holdings, Inc. CRMT America’s Car-Mart, Inc. AEO American Eagle Outfitters ARII American Railcar Industries AMSG AMSURG Corp. ADI Analog Devices, Inc. ANDE Andersons, Inc., The AR Antero Resources Corp. AIT Applied Industrial Tech. AREX Approach Resources Inc. ARCB ArcBest Corp. ADM Archer Daniels Midland Co. ARRS ARRIS Group, Inc. ABG Asbury Automotive Group ATNI Atlantic Tele-Network, Inc. AAWW Atlas Air Worldwide Holdings ATLS Atlas Energy ARP Atlas Resource Partners ATML Atmel Corp. ATW Atwood Oceanics, Inc. AN AutoNation, Inc. AZO AutoZone Inc. AVGR Avinger, Inc. BGS B & G Foods, Inc. BHI Baker Hughes Inc. BXS BancorpSouth, Inc. OZRK Bank of the Ozarks, Inc. RATE Bankrate, Inc. CUDA Barracuda Networks, Inc. BAS Basic Energy Services, Inc. BECN Beacon Roofing Supply, Inc. BELFB Bel Fuse Inc. TECH Bio-Techne Corp. BIOS BioScrip, Inc. BJRI BJ’s Restaurants NILE Blue Nile BKEP Blueknight Energy Partners BOBE Bob Evans Farms, Inc. BOJA Bojangles’, Inc. BOKF BOK Financial Corp.
EPAY Bottomline Technologies BKD Brookdale Senior Living BWLD Buffalo Wild Wings, Inc. BLDR Builders FirstSource, Inc. BG Bunge Ltd. CJES C & J Energy Services, Inc. CHRW C.H. Robinson Worldwide CAB Cabela’s Inc. CALM Cal-Maine Foods, Inc. CAMP CalAmp Corp. CVGW Calavo Growers Inc. CALX Calix Inc. CALD CallidusCloud CPE Callon Petroleum Co. CSU Capital Senior Living KMX CarMax, Inc. CRZO Carrizo Oil & Gas, Inc. TAST Carrols Restaurant Group CRI Carter’s, Inc. CASY Casey’s General Stores CGI Celadon Group, Inc. CERS Cerus Corp. CHKP Check Point Software Tech. CAKE Cheesecake Factory, The PLCE Children’s Place, The CHUY Chuy’s Holdings, Inc. CBB Cincinnati Bell Inc. CTXS Citrix Systems, Inc. MYCC ClubCorp Holdings, Inc. COH Coach, Inc. CCOI Cogent Communications Group CBSH Commerce Bancshares, Inc. COMM Commscope Holding Company CSAL Communications Sales & Leasing CNW Con-way, Inc. CXO Concho Resources Inc. CONN Conn's, Inc. CNSL Consolidated Comms. Holdings CPSS Consumer Portfolio Services CBPX Continental Building Products COO Cooper Companies (The) CPRT Copart, Inc. CORE Core-Mark Holding Co. CLGX CoreLogic COR CoreSite Realty Corp. CSOD Cornerstone OnDemand, Inc. CSGP CoStar Group, Inc. CVTI Covenant Transportation Group CREE Cree, Inc. CAPL CrossAmerica Partners LP CST CST Brands Inc. CSX CSX Corp. CFR Cullen/Frost Bankers, Inc. CONE CyrusOne, Inc. DNB D&B DAN Dana Holding Corp. DRI Darden Restaurants DF Dean Foods Co. DFRG Del Frisco’s Restaurant Group DWRE Demandware, Inc.
DENN Denny's Corp. DXCM DexCom, Inc. DKS Dick’s Sporting Goods, Inc. DIOD Diodes Inc. DNKN Dunkin’ Brands Group DXPE DXP Enterprises, Inc. EXP Eagle Materials Inc. ESTE Earthstone Energy, Inc. ECHO Echo Global Logistics SATS EchoStar Corp. ELLI Ellie Mae, Inc. ELGX Endologix, Inc. ENS EnerSys Inc. ENSG Ensign Group, The EPE EP Energy Corp. EFX Equifax Inc. EQIX Equinix, Inc. ESE ESCO Technologies EXAS EXACT Sciences Corp. XCO EXCO Resources, Inc. XONE ExOne Company, The EXPD Expeditors International EXPGY Experian plc FARO FARO Technologies, Inc. FDX FedEx Corp. FICO FICO FNF Fidelity National Financial FIS Fidelity National Info. Services FRGI Fiesta Restaurant Group FEYE FireEye, Inc. FAF First American Financial Corp. FFIN First Financial Bankshares, Inc. FHN First Horizon National Corp. FRC First Republic Bank FISV Fiserv, Inc. FLIR FLIR Systems, Inc. FTK Flotek Industries, Inc. FLO Flowers Foods, Inc. FNFV FNFV Group FTNT Fortinet, Inc. FWRD Forward Air Corp. FOSL Fossil, Inc. FRED Fred’s Inc. RAIL FreightCar America, Inc. TFM Fresh Market, The FRM Furmanite Corp. GIII G-III Apparel Group GMT GATX Corp. GWR Genesee & Wyoming Inc. GEN Genesis Healthcare, Inc. GHDX Genomic Health, Inc. GPN Global Payments Inc. GNC GNC Holdings, Inc. GTIM Good Times Restaurants GDP Goodrich Petroleum Corp. GLDD Great Lakes Dredge & Dock GPRE Green Plains Inc. GBX Greenbrier Companies GPI Group 1 Automotive, Inc. GWRE Guidewire Software, Inc.
GPOR Gulfport Energy Corp. HABT Habit Restaurants, Inc. HK Halcon Resources HAL Halliburton Co. HBHC Hancock Holding Co. HGR Hanger Inc. HLIT Harmonic Inc. HCOM Hawaiian Telcom Holdco HTLD Heartland Express HPY Heartland Payment Systems, Inc. HLX Helix Energy Solutions Group HP Helmerich & Payne HIBB Hibbett Sports, Inc. HTH Hilltop Holdings Inc. HOMB Home BancShares, Inc. HRL Hormel Foods Corp. HOS Hornbeck Offshore Services HUBG Hub Group, Inc. IBKC IBERIABANK Corp. IMPV Imperva, Inc. IBTX Independent Bank Group BLOX Infoblox Inc. INGR Ingredion Inc. PODD Insulet Corp. IDTI Integrated Device Technology ISIL Intersil Corp. SNOW Intrawest Resorts Holdings IPCM IPC The Hospitalist Co. ITRI Itron, Inc. JBHT J.B. Hunt Transport Svcs., Inc. SJM J.M. Smucker Co., The JPEP JP Energy Partners JKHY Jack Henry & Associates KAMN Kaman Corp. KSU Kansas City Southern KAR KAR Auction Services, Inc. KATE Kate Spade & Co. KEG Key Energy Services, Inc. KEX Kirby Corp. KNX Knight Transportation KN Knowles Corp. KKD Krispy Kreme Doughnuts, Inc. LSTR Landstar System, Inc. LPI Laredo Petroleum, Inc. LDRH LDR Holding Corp. LTXB LegacyTexas Financial Group, Inc. TREE LendingTree, Inc. LVLT Level 3 Communications, Inc. LAD Lithia Motors, Inc. LKQ LKQ Corp. LOGM LogMeIn, Inc. LL Lumber Liquidators Holdings LMNX Luminex Corp. MTSI M/A-COM Technology Solutions MHR Magnum Hunter Resources MCHX Marchex, Inc. HZO MarineMax, Inc. MKTO Marketo, Inc. MWE MarkWest Energy Partners MRTN Marten Transport, Ltd.

COVERAGE LIST
Monthly Statistical Review Member NYSE, SPIC June 2015, Page 47
MLM Martin Marietta Materials MMLP Martin Midstream Partners DOOR Masonite International Corp. MTZ MasTec, Inc. MTDR Matador Resources Co. MTLS Materialise NV MTRX Matrix Service Company MATX Matson Inc. MCD McDonald’s Corp. MD MEDNAX, Inc. MRD Memorial Resource Development KORS Michael Kors Holdings MIK Michaels Companies, The MCHP Microchip Technology MSCC Microsemi Corp. MSL MidSouth Bancorp, Inc. MG Mistras Group, Inc. MITL Mitel Networks Corp. MNRO Monro Muffler Brake, Inc. MOV Movado Group MRC MRC Global Inc. MSM MSC Industrial Direct Co. MUSA Murphy USA Inc. MYGN Myriad Genetics, Inc. NBR Nabors Industries NBHC National Bank Holdings Corp. NATI National Instruments Corp. NGVC Natural Grocers by Vitamin NCS NCI Building Systems NEOG Neogen Corp. NEO Neogenomics Inc. NTCT NetScout Systems, Inc. N NetSuite Inc. NSLP New Source Energy Partners EGOV NIC Inc. NE Noble Corp. NSC Norfolk Southern Corp. DNOW NOW, Inc. NXTM NxStage Medical, Inc. ORLY O’Reilly Automotive, Inc. OAS Oasis Petroleum Inc. ODFL Old Dominion Freight Line OVTI OmniVision Technologies OSUR OraSure Technologies, Inc. ORN Orion Marine Group, Inc. OXM Oxford Industries Inc. PACB Pacific Biosciences of California PACW PacWest Bancorp PANW Palo Alto Networks, Inc. FRSH Papa Murphy’s Holdings PKD Parker Drilling Co. PE Parsley Energy, Inc. PRTY Party City Holdco Inc. PTEN Patterson-UTI Energy PDCE PDC Energy, Inc.
PAG Penske Automotive Group, Inc. PQ PetroQuest Energy, Inc. PPC Pilgrim's Pride Corp. PNFP Pinnacle Financial Partners PF Pinnacle Foods, Inc. PES Pioneer Energy Services PXD Pioneer Natural Resources Co. PAA Plains All American Pipeline PAGP Plains Group Holdings PGEM Ply Gem Holdings, Inc. PII Polaris Industries Inc. POOL Pool Corp. PGI Premiere Global Services, Inc. PFPT Proofpoint, Inc. PB Prosperity Bancshares PRLB Proto Labs, Inc. QEP QEP Resources, Inc. QRVO Qorvo, Inc. QTS QTS Realty Trust QLTY Quality Distribution, Inc. QLYS Qualys, Inc. PWR Quanta Services, Inc. QNST QuinStreet, Inc. RAX Rackspace Hosting, Inc. RALY Rally Software Development RL Ralph Lauren Corp. RRC Range Resources Corp. RAVN Raven Industries RHT Red Hat, Inc. RRGB Red Robin Gourmet Burgers RM Regional Management RF Regions Financial Corp. RNST Renasant Corp. RCII Rent-A-Center RGEN Repligen Corp. QSR Restaurant Brands International REXX Rex Energy Corp. RICE Rice Energy Inc. FUEL Rocket Fuel Inc. ROSE Rosetta Resources, Inc. ROVI Rovi Corp. RES RPC, Inc. RPXC RPX Corp. RSPP RSP Permian, Inc. RTIX RTI Surgical, Inc. RUBI Rubicon Project, Inc. RKUS Ruckus Wireless, Inc. RUSHA Rush Enterprises, Inc. R Ryder System, Inc. RYI Ryerson Holding Corp. SAIA Saia, Inc. CRM Salesforce.com SN Sanchez Energy Corp. SAFM Sanderson Farms, Inc. SD SandRidge Energy, Inc.
SC Santander Consumer USA SLB Schlumberger Ltd. SQI SciQuest, Inc. SMTC Semtech Corp. NOW ServiceNow, Inc. SSE Seventy Seven Energy Inc. SHOR ShoreTel, Inc. SWIR Sierra Wireless, Inc. SIG Signet Jewelers Limited SLAB Silicon Laboratories, Inc. SFNC Simmons First National Corp. SIRO Sirona Dental Systems, Inc. SWKS Skyworks Solutions, Inc. SWI SolarWinds, Inc. SAH Sonic Automotive, Inc. SONC Sonic Corp. OKSB Southwest Bancorp, Inc. SWN Southwestern Energy Co. SPLK Splunk, Inc. LEAF Springleaf Holdings, Inc. SFM Sprouts Farmers Market STAA STAAR Surgical Co. SBUX Starbucks Corp. STBZ State Bank Financial Corp. STE STERIS Corp. STC Stewart Information Services STCK Stock Building Supply Holdings SRI Stoneridge Inc. SSYS Stratasys Ltd. SUM Summit Materials LLC SUN Sunoco LP SPN Superior Energy Services SCAI Surgical Care Affiliates SIVB SVB Financial Group SWFT Swift Transportation SYMC Symantec Corp. SURG Synergetics USA, Inc. SYRG Synergy Resources Corp. SNV Synovus Financial Corp. TISI Team, Inc. TMH Team Health Holdings, Inc. TEAR TearLab Corp. TTGT TechTarget, Inc. TFX Teleflex Inc. TCBI Texas Capital Bancshares, Inc. TXRH Texas Roadhouse, Inc. TIF Tiffany & Co. TITN Titan Machinery Inc. TIVO TiVo Inc. TSS Total System Services, Inc. TSCO Tractor Supply Co. TA TravelCenters of America THS TreeHouse Foods, Inc. TREX Trex Company, Inc. TRIB Trinity Biotech Plc
TRN Trinity Industries TSC TriState Capital Holdings, Inc. TRUE TrueCar, Inc. TUES Tuesday Morning Corp. TUMI Tumi Holdings, Inc. TYL Tyler Technologies, Inc. TSN Tyson Foods UBNT Ubiquiti Networks, Inc. ULTI Ultimate Software UMBF UMB Financial Corp. UMPQ Umpqua Holdings UNP Union Pacific Corp. UCBI United Community Banks, Inc. UNFI United Natural Foods, Inc. UPS United Parcel Service, Inc. USCR U.S. Concrete, Inc. USPH U.S. Physical Therapy SLCA U.S. Silica Holdings, Inc. USAK USA Truck, Inc. USG USG Corp. UTIW UTi Worldwide Inc. MTN Vail Resorts, Inc. VRNS Varonis Systems, Inc. WOOF VCA, Inc. VCYT Veracyte, Inc. VBTX Veritex Holdings, Inc. VSAT ViaSat, Inc. VSI Vitamin Shoppe, Inc. VJET Voxeljet AG VMC Vulcan Materials Company GWW W.W. Grainger, Inc. WNC Wabash National Corp. WBC WABCO Holdings Inc. WAB Wabtec Corp. WMT Wal-Mart Stores, Inc. WSO Watsco, Inc. WFT Weatherford International WEN Wendy’s Co. WERN Werner Enterprises WCC WESCO International, Inc. WWAV WhiteWave Foods Co. WLL Whiting Petroleum WFM Whole Foods Market, Inc. WIN Windstream Corp. WDAY Workday, Inc. WRLD World Acceptance Corp. INT World Fuel Services WPT World Point Terminals XPO XPO Logistics Inc. YRCW YRC Worldwide Inc. ZAYO Zayo Group Holdings Z Zillow, Inc. ZOES Zoe’s Kitchen, Inc.

COVERAGE LIST BY MARKET CAPITALIZATION
Monthly Statistical Review Member NYSE, SPIC June 2015, Page 48
# Cos. Market Cap. Average Market Cap $5.6 Billion 107 > $5 Billion Median Market Cap. $1.8 Billion 116 $2 Billion-$5 Billion
160 $500 Million $2 Billion 75 Under $500 Million 458 Under Coverage
Shares ANNUAL P/E P/E Market FY1EFtnt. Rating/ 03-Jun Price Out. EARNINGS PER SHARE Ratio Ratio Cap % Sls
Company Tkr Code FYE Volatility Price Target Mil. LFYA FY1E FY2E FY1E FY2E ($ Mil) BVPS GrthMARKET CAP > $5 BILLIONWal-Mart Stores,Inc. WMT pf Jan O $74.89 $90.00 3,225.5 $5.07 $4.74 $5.03 15.8 14.9 $241,557.9 $23.74 0.8Schlumberger Ltd. SLB adj Dec O $91.36 $104.00 1,269.7 $5.57 $3.34 $3.51 27.4 26.0 $116,002.3 $29.65 (26.3)McDonald's Corp. MCD Dec O $96.52 $115.00 959.1 $4.83 $4.60 $4.92 21.0 19.6 $92,515.9 $13.35 (11.7)Union Pacific Corp. UNP op Dec E $101.99 $115.00 875.6 $5.73 $6.15 $6.95 16.6 14.7 $89,626.9 $23.89 (0.4)Starbucks Corp. SBUX Sep E $52.12 $52.00 1,499.6 $1.34 $1.57 $1.90 33.2 27.4 $78,159.2 $3.85 17.6United Parcel Service UPS adj Dec E $100.60 $110.00 702.3 $4.75 $5.25 $5.85 19.2 17.2 $70,572.5 $2.37 1.6FedEx Corp. FDX adj May O $179.92 $200.00 283.8 $6.75 $8.90 $10.85 20.2 16.6 $51,053.6 $56.43 4.5Salesforce.com CRM pf Jan O/V $73.47 $95.00 655.6 $0.53 $0.71 $0.97 NM 75.7 $48,163.7 $6.11 21.8Adobe Systems ADBE pf Nov O/V $80.13 $100.00 500.3 $1.30 $2.11 $3.18 38.0 25.2 $40,086.6 $13.18 17.6Halliburton Company HAL adj Dec O $45.62 $58.00 850.9 $4.01 $1.54 $1.81 29.6 25.2 $38,816.9 $18.36 (37.9)CSX Corp. CSX op Dec O $34.10 $38.00 988.0 $1.92 $2.03 $2.32 16.8 14.7 $33,690.2 $11.45 (1.9)Archer Daniels Midland Co. ADM op Dec O $52.46 $56.00 620.4 $3.20 $3.30 $3.90 15.9 13.5 $32,544.8 $29.96 (5.3)Norfolk Southern Corp. NSC Dec O $92.50 $113.00 306.3 $6.39 $5.85 $6.80 15.8 13.6 $28,198.5 $40.25 (6.0)Baker Hughes BHI adj Dec O $64.69 $84.00 434.7 $4.22 ($0.01) $1.12 NM 57.8 $28,119.2 $40.98 (57.2)O'Reilly Automotive, Inc. ORLY Dec O/V $224.22 $264.00 101.8 $7.34 $8.64 $9.96 26.0 22.5 $22,644.0 $21.15 7.9Pioneer Natural Resources Co. PXD op/cf Dec O $150.92 $185.00 149.0 $16.44 $10.24 $13.43 14.7 11.2 $22,532.2 $57.05 (29.7)AutoZone Inc. AZO Aug O/V $681.79 $803.00 31.7 $31.57 $36.08 $41.18 18.9 16.6 $21,628.4 ($46.04) 7.6Analog Devices ADI Oct E/V $67.29 $66.00 313.5 $2.32 $2.89 $3.09 23.3 21.8 $21,098.2 $15.44 15.4Skyworks Solutions SWKS pf Sep E/V $105.39 $105.00 191.0 $3.24 $5.08 $5.61 20.7 18.8 $20,139.8 $14.20 40.6Level 3 Communications LVLT pf Dec E $55.98 $58.00 354.2 $1.56 $1.75 $2.02 32.0 27.7 $19,843.2 $18.97 22.0Fiserv, Inc. FISV adj Dec E $81.38 $77.00 236.8 $3.37 $3.79 $4.22 21.5 19.3 $19,269.9 $13.54 4.7Plains All American Pipeline PAA op/cf Dec O $47.00 $64.00 368.9 $2.88 $2.50 $2.84 18.8 16.5 $18,670.4 $21.86 5.4Experian plc EXPGY adj Mar O/V $18.90 $20.00 986.6 $0.92 $0.96 $0.98 19.7 19.3 $18,638.3 NA 2.5Alliance Data Systems ADS adj/cs Dec O/V $299.00 $350.00 62.8 $12.60 $14.95 $17.48 20.0 17.1 $18,552.7 $30.43 22.8Fidelity National Information Svcs. FIS op/cs Dec O $62.52 $71.00 283.3 $3.10 $3.27 $3.69 19.1 16.9 $17,722.2 $22.46 1.9Symantec Corp. SYMC pf Mar E $24.32 $24.00 693.0 $1.88 $1.87 $1.95 13.0 12.5 $16,555.3 $8.56 (4.0)W.W. Grainger, Inc. GWW pf Dec O $242.91 $275.00 67.2 $12.26 $12.55 $14.26 19.4 17.0 $16,255.8 $47.97 2.0CarMax, Inc. KMX Feb E $72.81 $76.00 210.0 $2.73 $3.02 $3.43 24.1 21.2 $15,234.0 $14.24 11.0Equinix, Inc. EQIX pf Dec E $266.14 $252.00 56.9 $3.15 $4.98 $5.39 53.4 49.4 $15,149.5 $37.98 9.0Check Point Software Tech. CHKP pf Dec O $83.70 $95.00 183.8 $3.72 $3.96 $4.42 21.1 18.9 $15,137.6 $19.69 8.0Hormel Foods HRL Oct O $56.90 $63.00 264.1 $2.24 $2.53 $2.88 22.5 19.8 $15,025.4 $14.56 1.3Whole Foods Market, Inc. WFM op Sep E/V $41.05 $51.00 360.8 $1.57 $1.75 $1.91 23.5 21.5 $14,707.4 $10.90 9.5

COVERAGE LIST BY MARKET CAPITALIZATION
Monthly Statistical Review Member NYSE, SPIC June 2015, Page 49
Shares ANNUAL P/E P/E Market FY1EFtnt. Rating/ 03-Jun Price Out. EARNINGS PER SHARE Ratio Ratio Cap % Sls
Company Tkr Code FYE Volatility Price Target Mil. LFYA FY1E FY2E FY1E FY2E ($ Mil) BVPS GrthMARKET CAP > $5 BILLIONConcho Resources Inc. CXO op/cf Dec O $119.59 $160.00 119.6 $15.60 $11.47 $13.21 10.4 9.1 $14,352.4 $50.35 (17.2)Red Hat, Inc. RHT pf Feb O/V $77.83 $85.00 186.3 $1.60 $1.81 $2.13 43.0 36.5 $14,267.7 $6.92 12.3Palo Alto Networks, Inc. PANW pf Jul O/V $169.19 $180.00 82.3 $0.40 $0.83 $1.62 NM NM $14,154.4 $6.27 50.1J.M. Smucker Co., The SJM op Apr O $118.19 $130.00 119.7 $5.61 $5.38 $5.90 22.0 20.0 $14,143.0 $51.34 (2.5)Regions Financial Corp. RF op Dec O $10.30 $11.00 1,342.8 $0.79 $0.81 $0.88 12.7 11.7 $13,805.7 $12.05 NABunge Ltd. BG adj Dec O $91.28 $100.00 143.6 $4.18 $6.75 $7.35 13.5 12.4 $13,107.5 $49.41 (7.8)Tyson Foods TSN op Sep O $41.76 $50.00 304.0 $2.94 $3.55 $3.90 11.8 10.7 $12,695.2 $25.01 10.0Tractor Supply Co. TSCO Dec O/V $90.25 $107.00 136.5 $2.66 $3.07 $3.57 29.4 25.3 $12,312.5 $9.49 10.0Qorvo, Inc. QRVO pf Mar O/V $81.55 $95.00 148.5 $3.91 $4.80 $6.06 17.0 13.5 $12,186.3 NM 12.9Tiffany & Co. TIF adj Jan E/V $93.92 $95.00 129.3 $3.73 $4.32 $4.89 21.7 19.2 $12,130.6 $21.92 2.8Vulcan Materials Company VMC op Dec O $89.14 $97.00 132.6 $0.92 $2.15 $3.11 41.5 28.7 $11,825.3 $31.37 11.9ServiceNow, Inc. NOW pf Dec O/V $76.61 $90.00 150.5 ($0.08) $0.15 $0.48 NM NM $11,764.6 $3.02 44.9Equifax Inc. EFX cs Dec O $98.78 $105.00 119.0 $3.89 $4.36 $5.07 22.7 19.5 $11,755.4 $18.05 7.4MarkWest Energy Partners MWE op/cf Dec O $62.43 $81.00 186.8 $3.95 $3.67 $4.20 17.0 14.9 $11,658.9 $25.37 7.5Advance Auto Parts AAP adj Dec E/V $156.53 $137.00 73.2 $7.79 $8.26 $9.12 19.0 17.2 $11,454.6 $27.41 1.3Weatherford International WFT adj Dec E $14.23 $15.00 774.8 $1.01 ($0.16) $0.25 NM 56.9 $11,023.9 $8.44 (42.8)Antero Resources Corp. AR op/cf Dec O $39.25 $50.00 277.0 $3.74 $3.58 $4.86 11.0 8.1 $10,872.4 $20.39 5.2Fidelity National Financial, Inc. FNF pf/cs Dec O $38.04 $43.00 276.9 $1.75 $2.30 $2.69 16.5 14.1 $10,668.4 $21.49 9.1Citrix Systems CTXS pf Dec E/V $66.27 $68.00 160.3 $3.30 $3.57 $3.92 18.6 16.9 $10,622.3 $13.12 3.2Signet Jewelers Limited SIG adj Jan O/V $131.96 $145.00 80.3 $5.63 $6.60 $7.38 20.0 17.9 $10,593.1 $36.06 11.1Kansas City Southern KSU op Dec O $94.08 $120.00 110.6 $4.82 $5.05 $5.75 18.6 16.4 $10,400.1 $34.59 0.8Martin Marietta Materials MLM op Dec O $147.86 $172.00 67.3 $3.72 $5.34 $7.23 27.7 20.5 $9,977.7 $64.51 29.1J.B. Hunt Transport Services, Inc. JBHT op Dec O $85.52 $100.00 116.5 $3.16 $3.60 $4.25 23.8 20.1 $9,967.9 $10.33 2.8Coach, Inc. COH adj Jun E/V $35.87 $40.00 275.8 $3.10 $1.90 $2.02 18.9 17.8 $9,910.4 $9.21 (13.5)Polaris Industries, Inc. PII op Dec E $146.84 $150.00 66.5 $6.65 $7.39 $8.60 19.9 17.1 $9,758.8 $13.20 10.7Microchip Technology MCHP pf Mar E/V $48.02 $52.00 201.5 $2.66 $2.81 NE 17.1 NM $9,715.6 $11.20 5.1Michael Kors Holdings KORS adj Mar E/V $48.58 $52.00 200.8 $4.28 $4.48 $4.69 10.8 10.4 $9,699.3 $11.22 8.9Wabtec Corp. WAB op Dec O $99.87 $110.00 96.6 $3.63 $4.10 $4.60 24.4 21.7 $9,648.9 $18.77 10.2Southwestern Energy Co. SWN op/cf Dec E $24.95 $25.00 442.9 $6.44 $4.21 $4.99 5.9 5.0 $9,594.6 $13.87 (18.3)C.H. Robinson Worldwide, Inc. CHRW op Dec O $64.62 $78.00 147.9 $3.05 $3.25 $3.55 19.9 18.2 $9,424.0 $7.23 5.5Range Resources Corp. RRC op/cf Dec O $55.58 $80.00 169.1 $6.33 $4.62 $5.49 12.0 10.1 $9,397.0 $20.66 (9.0)Expeditors International EXPD Dec O $48.32 $58.00 191.1 $1.92 $2.22 $2.43 21.8 19.9 $9,242.4 $9.75 7.0The Cooper Companies COO pf Oct E $184.84 $176.00 48.3 $7.29 $7.48 $8.92 24.7 20.7 $8,925.7 $53.38 9.9LKQ Corp. LKQ op Dec O/V $29.24 $34.00 304.1 $1.27 $1.40 $1.59 20.9 18.4 $8,894.5 $9.14 7.3Santander Consumer USA SC Dec O $24.82 $30.00 349.7 $2.37 $2.75 $3.00 9.0 8.3 $8,686.7 $11.01 11.5

COVERAGE LIST BY MARKET CAPITALIZATION
Monthly Statistical Review Member NYSE, SPIC June 2015, Page 50
Shares ANNUAL P/E P/E Market FY1EFtnt. Rating/ 03-Jun Price Out. EARNINGS PER SHARE Ratio Ratio Cap % Sls
Company Tkr Code FYE Volatility Price Target Mil. LFYA FY1E FY2E FY1E FY2E ($ Mil) BVPS GrthMARKET CAP > $5 BILLIONWorkday, Inc. WDAY pf Jan E/V $80.65 $100.00 107.0 ($0.34) ($0.15) ($0.01) NM NM $8,625.7 $5.99 44.7First Republic Bank FRC op Dec E $61.99 $60.00 141.8 $2.96 $3.11 $3.78 19.9 16.4 $8,558.8 $29.45 NASplunk, Inc. SPLK pf Jan O/V $66.78 $80.00 124.6 $0.09 $0.13 $0.30 NM NM $8,368.4 $6.54 35.7WhiteWave Foods Co. WWAV op Dec O $47.60 $50.00 175.1 $1.00 $1.13 $1.30 42.1 36.6 $8,335.6 $6.16 9.9Ralph Lauren Corp. RL adj Mar E/V $136.86 $155.00 61.4 $7.88 $7.00 $8.10 19.6 16.9 $8,265.2 $44.56 (0.3)Darden Restaurants DRI adj May E $65.32 $68.00 124.1 $2.40 $2.52 $2.90 25.9 22.5 $8,216.7 $18.04 (16.3)Helmerich & Payne HP adj Sep E $73.44 $74.00 107.7 $6.25 $2.95 $0.62 24.9 118.5 $7,906.1 $46.47 (29.4)Restaurant Brands International QSR adj Dec E $38.75 $40.00 202.1 ($0.83) $0.98 $1.15 39.5 33.7 $7,839.3 NA 1.0Total System Services TSS op Dec O $41.59 $45.00 184.3 $1.96 $2.25 $2.46 18.5 16.9 $7,665.5 $9.27 9.1FireEye, Inc. FEYE pf Dec E/V $47.69 $45.00 156.2 ($1.97) ($1.80) ($1.20) NM NM $7,455.4 $8.18 46.8WABCO Holdings Inc. WBC op Dec O $126.03 $140.00 58.7 $5.52 $5.80 $6.90 21.7 18.3 $7,391.9 $13.48 (7.7)AutoNation, Inc. AN op Dec E $63.89 $68.00 114.0 $3.49 $4.01 $4.20 15.9 15.2 $7,285.1 $18.29 7.8NetSuite Inc. N pf Dec O/V $93.31 $108.00 77.3 $0.32 $0.23 $0.25 NM NM $7,239.6 $3.04 33.0SVB Financial Group SIVB op Dec O $139.49 $145.00 51.0 $5.54 $6.22 $7.35 22.4 19.0 $7,147.5 $55.33 NAGlobal Payments Inc. GPN op/cs May E $106.67 $103.00 66.5 $4.12 $4.77 $5.55 22.4 19.2 $7,089.1 $12.42 7.8Brookdale Senior Living BKD cs Dec O/V $37.46 $45.00 184.1 $2.50 $2.60 $3.05 14.4 12.3 $6,898.0 $14.67 31.6Whiting Petroleum Corp. WLL op/cf Dec O $33.37 $45.00 204.6 $15.74 $4.41 $7.04 7.6 4.7 $6,811.7 $33.55 (37.5)Fortinet, Inc. FTNT pf Dec O/V $40.08 $42.00 168.9 $0.48 $0.51 $0.64 78.6 62.6 $6,796.1 $4.06 21.7MEDNAX, Inc. MD Dec E $70.64 $75.00 93.5 $3.18 $3.61 $4.04 19.6 17.5 $6,781.7 $22.61 14.8CoStar Group, Inc. CSGP pf Dec O $207.69 $230.00 32.4 $3.30 $2.07 $4.75 NM 43.7 $6,731.2 $46.75 21.0Pilgrim's Pride Corp. PPC op Dec O/V $24.74 $36.00 259.7 $2.96 $3.50 $2.75 7.1 9.0 $6,425.0 $3.49 6.6Zayo Group Holdings ZAYO pf Jun O $26.13 $36.00 243.1 NM ($0.33) $0.24 NM NM $6,349.8 $4.73 20.5Plains GP Holdings, L.P. PAGP cf Dec O $28.12 $34.00 136.1 $0.75 $0.92 $1.08 30.6 26.0 $6,293.0 $8.01 31.0Springleaf Holdings, Inc. LEAF Dec O $46.55 $62.00 134.5 $2.07 $2.14 $2.38 21.8 19.6 $6,260.1 $17.64 6.5Quanta Services, Inc. PWR pf Dec O/V $30.07 $36.00 204.5 $1.99 $2.04 $2.38 14.7 12.6 $6,149.3 $21.02 6.6CommScope Holding Co. COMM pf Dec E/V $32.18 $36.00 193.1 $2.23 $1.90 $2.10 16.9 15.3 $6,095.5 $7.07 (6.8)Michaels Companies MIK Jan O $28.25 $33.00 209.0 $1.46 $1.69 $1.94 16.7 14.6 $5,854.3 ($15.90) 3.8Ingredion Inc. INGR op Dec E $81.73 $80.00 71.6 $5.20 $5.60 $6.10 14.6 13.4 $5,847.7 $29.42 6.0Old Dominion Freight Line ODFL op Dec O $68.11 $86.00 85.9 $3.10 $3.60 $4.20 18.9 16.2 $5,841.5 $17.35 9.3DexCom, Inc. DXCM pf Dec O/V $72.48 $72.00 79.3 ($0.32) ($0.04) $0.31 NM NM $5,747.4 $1.88 39.5Rackspace Hosting RAX Dec E/V $40.24 $55.00 142.8 $0.77 $0.88 $1.16 45.7 34.7 $5,747.0 $7.62 11.2Sirona Dental Systems SIRO pf Sep O/V $98.66 $101.00 58.0 $3.68 $3.96 $4.24 24.9 23.3 $5,481.1 $22.96 (2.6)Carter's, Inc. CRI adj Dec O/V $104.09 $110.00 52.5 $3.93 $4.48 $5.20 23.2 20.0 $5,468.8 $15.31 5.5KAR Auction Services KAR op Dec O $38.18 $42.00 141.8 $1.64 $1.67 $1.84 22.9 20.8 $5,412.5 $10.97 6.4Jack Henry & Associates, Inc. JKHY Jun E $65.74 $67.00 81.8 $2.32 $2.62 $2.75 25.1 23.9 $5,376.0 $12.38 5.8
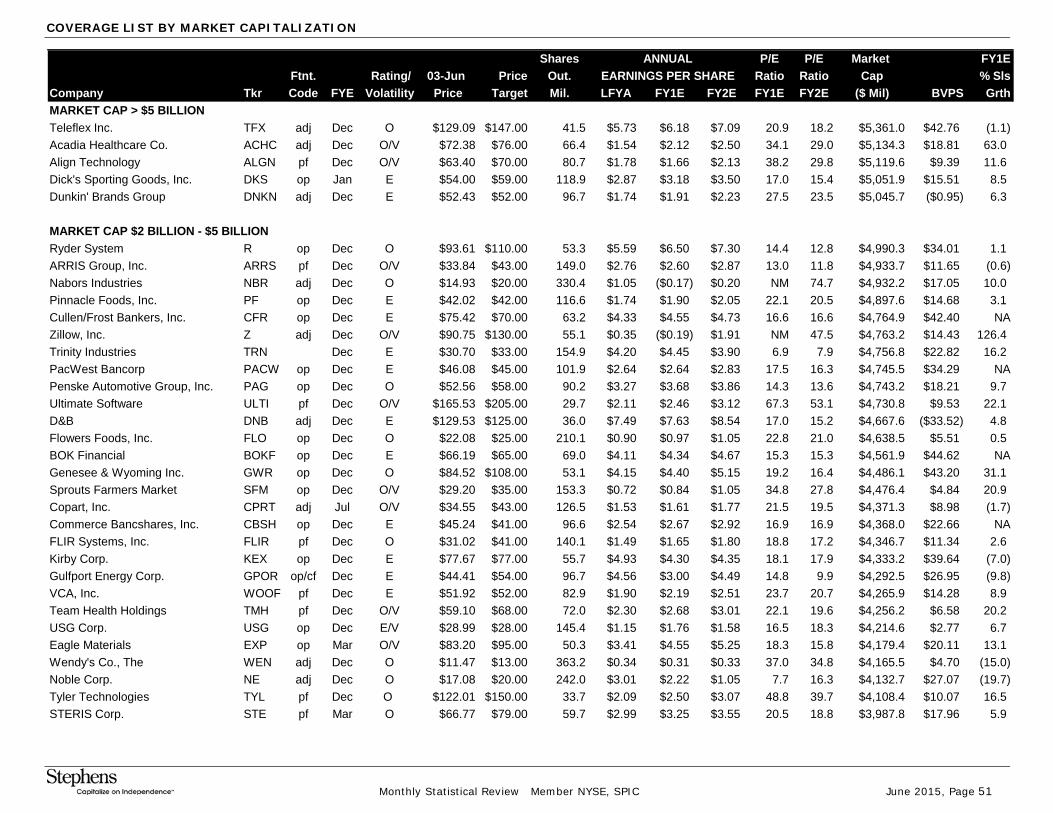
COVERAGE LIST BY MARKET CAPITALIZATION
Monthly Statistical Review Member NYSE, SPIC June 2015, Page 51
Shares ANNUAL P/E P/E Market FY1EFtnt. Rating/ 03-Jun Price Out. EARNINGS PER SHARE Ratio Ratio Cap % Sls
Company Tkr Code FYE Volatility Price Target Mil. LFYA FY1E FY2E FY1E FY2E ($ Mil) BVPS GrthMARKET CAP > $5 BILLIONTeleflex Inc. TFX adj Dec O $129.09 $147.00 41.5 $5.73 $6.18 $7.09 20.9 18.2 $5,361.0 $42.76 (1.1)Acadia Healthcare Co. ACHC adj Dec O/V $72.38 $76.00 66.4 $1.54 $2.12 $2.50 34.1 29.0 $5,134.3 $18.81 63.0Align Technology ALGN pf Dec O/V $63.40 $70.00 80.7 $1.78 $1.66 $2.13 38.2 29.8 $5,119.6 $9.39 11.6Dick's Sporting Goods, Inc. DKS op Jan E $54.00 $59.00 118.9 $2.87 $3.18 $3.50 17.0 15.4 $5,051.9 $15.51 8.5Dunkin' Brands Group DNKN adj Dec E $52.43 $52.00 96.7 $1.74 $1.91 $2.23 27.5 23.5 $5,045.7 ($0.95) 6.3
MARKET CAP $2 BILLION - $5 BILLIONRyder System R op Dec O $93.61 $110.00 53.3 $5.59 $6.50 $7.30 14.4 12.8 $4,990.3 $34.01 1.1ARRIS Group, Inc. ARRS pf Dec O/V $33.84 $43.00 149.0 $2.76 $2.60 $2.87 13.0 11.8 $4,933.7 $11.65 (0.6)Nabors Industries NBR adj Dec O $14.93 $20.00 330.4 $1.05 ($0.17) $0.20 NM 74.7 $4,932.2 $17.05 10.0Pinnacle Foods, Inc. PF op Dec E $42.02 $42.00 116.6 $1.74 $1.90 $2.05 22.1 20.5 $4,897.6 $14.68 3.1Cullen/Frost Bankers, Inc. CFR op Dec E $75.42 $70.00 63.2 $4.33 $4.55 $4.73 16.6 16.6 $4,764.9 $42.40 NAZillow, Inc. Z adj Dec O/V $90.75 $130.00 55.1 $0.35 ($0.19) $1.91 NM 47.5 $4,763.2 $14.43 126.4Trinity Industries TRN Dec E $30.70 $33.00 154.9 $4.20 $4.45 $3.90 6.9 7.9 $4,756.8 $22.82 16.2PacWest Bancorp PACW op Dec E $46.08 $45.00 101.9 $2.64 $2.64 $2.83 17.5 16.3 $4,745.5 $34.29 NAPenske Automotive Group, Inc. PAG op Dec O $52.56 $58.00 90.2 $3.27 $3.68 $3.86 14.3 13.6 $4,743.2 $18.21 9.7Ultimate Software ULTI pf Dec O/V $165.53 $205.00 29.7 $2.11 $2.46 $3.12 67.3 53.1 $4,730.8 $9.53 22.1D&B DNB adj Dec E $129.53 $125.00 36.0 $7.49 $7.63 $8.54 17.0 15.2 $4,667.6 ($33.52) 4.8Flowers Foods, Inc. FLO op Dec O $22.08 $25.00 210.1 $0.90 $0.97 $1.05 22.8 21.0 $4,638.5 $5.51 0.5BOK Financial BOKF op Dec E $66.19 $65.00 69.0 $4.11 $4.34 $4.67 15.3 15.3 $4,561.9 $44.62 NAGenesee & Wyoming Inc. GWR op Dec O $84.52 $108.00 53.1 $4.15 $4.40 $5.15 19.2 16.4 $4,486.1 $43.20 31.1Sprouts Farmers Market SFM op Dec O/V $29.20 $35.00 153.3 $0.72 $0.84 $1.05 34.8 27.8 $4,476.4 $4.84 20.9Copart, Inc. CPRT adj Jul O/V $34.55 $43.00 126.5 $1.53 $1.61 $1.77 21.5 19.5 $4,371.3 $8.98 (1.7)Commerce Bancshares, Inc. CBSH op Dec E $45.24 $41.00 96.6 $2.54 $2.67 $2.92 16.9 16.9 $4,368.0 $22.66 NAFLIR Systems, Inc. FLIR pf Dec O $31.02 $41.00 140.1 $1.49 $1.65 $1.80 18.8 17.2 $4,346.7 $11.34 2.6Kirby Corp. KEX op Dec E $77.67 $77.00 55.7 $4.93 $4.30 $4.35 18.1 17.9 $4,333.2 $39.64 (7.0)Gulfport Energy Corp. GPOR op/cf Dec E $44.41 $54.00 96.7 $4.56 $3.00 $4.49 14.8 9.9 $4,292.5 $26.95 (9.8)VCA, Inc. WOOF pf Dec E $51.92 $52.00 82.9 $1.90 $2.19 $2.51 23.7 20.7 $4,265.9 $14.28 8.9Team Health Holdings TMH pf Dec O/V $59.10 $68.00 72.0 $2.30 $2.68 $3.01 22.1 19.6 $4,256.2 $6.58 20.2USG Corp. USG op Dec E/V $28.99 $28.00 145.4 $1.15 $1.76 $1.58 16.5 18.3 $4,214.6 $2.77 6.7Eagle Materials EXP op Mar O/V $83.20 $95.00 50.3 $3.41 $4.55 $5.25 18.3 15.8 $4,179.4 $20.11 13.1Wendy's Co., The WEN adj Dec O $11.47 $13.00 363.2 $0.34 $0.31 $0.33 37.0 34.8 $4,165.5 $4.70 (15.0)Noble Corp. NE adj Dec O $17.08 $20.00 242.0 $3.01 $2.22 $1.05 7.7 16.3 $4,132.7 $27.07 (19.7)Tyler Technologies TYL pf Dec O $122.01 $150.00 33.7 $2.09 $2.50 $3.07 48.8 39.7 $4,108.4 $10.07 16.5STERIS Corp. STE pf Mar O $66.77 $79.00 59.7 $2.99 $3.25 $3.55 20.5 18.8 $3,987.8 $17.96 5.9

COVERAGE LIST BY MARKET CAPITALIZATION
Monthly Statistical Review Member NYSE, SPIC June 2015, Page 52
Shares ANNUAL P/E P/E Market FY1EFtnt. Rating/ 03-Jun Price Out. EARNINGS PER SHARE Ratio Ratio Cap % Sls
Company Tkr Code FYE Volatility Price Target Mil. LFYA FY1E FY2E FY1E FY2E ($ Mil) BVPS GrthMARKET CAP $2 BILLION - $5 BILLIONUmpqua Holdings Corp. UMPQ op Dec O $18.05 $20.00 220.4 $1.07 $1.24 $1.36 14.6 13.3 $3,981.1 $17.24 NANational Instruments Corp. NATI pf Dec O/V $30.85 $34.00 128.2 $1.22 $1.09 $1.35 28.3 22.9 $3,953.5 $8.70 0.0XPO Logistics Inc. XPO op Dec E/V $49.49 $53.00 79.7 ($0.83) ($0.34) ($0.11) NM NM $3,947.1 $20.54 45.3Bank of the Ozarks, Inc. OZRK op Dec O $45.45 $50.00 86.8 $1.55 $2.05 $2.50 22.2 18.2 $3,943.9 $13.59 NASynovus Financial Corp. SNV op Dec O $29.60 $31.00 134.9 $1.47 $1.59 $1.97 18.6 15.0 $3,942.8 $21.69 NAFirst American Financial Corp. FAF op Dec E $36.17 $39.00 108.4 $2.25 $2.39 $2.69 15.1 13.4 $3,920.7 $24.03 5.1GNC Holdings, Inc. GNC op Dec E $45.09 $46.00 86.6 $2.87 $3.06 $3.25 14.7 13.9 $3,904.8 $8.46 1.9Communications Sales & Leasing CSAL adj Dec O $26.00 $35.00 149.8 NA $0.33 $0.47 78.8 55.3 $3,895.5 NA NAWatsco, Inc. WSO Dec O $128.49 $145.00 30.1 $4.32 $5.16 $5.94 24.9 21.6 $3,882.2 $21.36 6.6Prosperity Bancshares, Inc. PB op Dec E $55.40 $55.00 70.0 $4.30 $4.17 $4.18 13.3 13.3 $3,880.4 $47.15 NAVail Resorts, Inc. MTN Jul O $105.52 $121.00 36.4 $0.77 $3.09 $3.14 34.1 33.6 $3,835.3 $23.37 12.0SolarWinds, Inc. SWI pf Dec E/V $49.12 $55.00 76.4 $1.83 $1.98 $2.35 24.8 20.9 $3,752.2 $7.76 21.2Guidewire Software, Inc. GWRE pf Jul O/V $52.98 $65.00 70.2 $0.63 $0.53 $0.61 NM 86.9 $3,737.6 $9.39 7.1Atmel Corp. ATML pf Dec O/V $8.95 $10.00 417.4 $0.39 $0.44 $0.48 20.3 18.6 $3,735.5 $2.06 (7.8)Bio-Techne Corp. TECH pf Jun O/V $100.18 $108.00 37.2 $3.39 $3.36 $3.70 29.8 27.1 $3,722.0 $22.07 26.5Cabela's Inc. CAB op Dec O $51.99 $66.00 71.6 $2.88 $3.17 $3.66 16.4 14.2 $3,721.6 $25.60 12.9Memorial Resource Development MRD op/cf Dec O $19.40 $27.00 190.9 $1.51 $1.91 $2.91 10.2 6.7 $3,701.1 $2.35 22.7Dana Holding Corp. DAN adj Dec E $22.14 $23.00 163.1 $2.00 $2.10 $2.35 10.5 9.4 $3,611.8 $6.06 (4.1)World Fuel Services INT op Dec O $49.90 $65.00 72.2 $3.02 $3.35 $3.70 14.9 13.5 $3,602.1 $25.74 (22.7)Integrated Device Technology IDTI pf Mar O/V $23.99 $25.00 148.3 $0.92 $1.13 $1.20 21.2 20.0 $3,559.0 $5.32 14.5Superior Energy Services SPN adj Dec O $23.51 $31.00 150.5 $1.79 ($0.92) ($0.02) NM NM $3,537.2 $26.96 (56.7)CoreLogic CLGX adj Dec E/V $39.03 $43.00 90.2 $1.33 $1.81 $2.12 21.6 18.4 $3,521.0 $11.40 6.4Fossil, Inc. FOSL adj Dec E/V $71.97 $90.00 49.7 $7.10 $5.85 $6.53 12.3 11.0 $3,512.9 $19.26 (2.6)First Horizon National Corp. FHN Dec O $15.01 $16.00 233.9 $0.71 $0.30 $1.05 50.0 50.0 $3,504.8 $9.03 NAMSC Industrial Direct Co. MSM pf Aug E $71.54 $76.00 48.6 $3.93 $3.75 $4.10 19.1 17.4 $3,462.5 $20.27 5.4Microsemi Corp. MSCC pf Sep O/V $36.06 $42.00 95.2 $2.19 $2.73 $3.11 13.2 11.6 $3,432.0 $12.01 6.1Casey's General Stores CASY adj Apr O $88.27 $103.00 38.9 $3.49 $4.37 $4.24 20.2 20.8 $3,429.4 $21.60 (0.8)Kate Spade & Co. KATE adj Dec E/V $26.23 $33.00 127.7 $0.25 $0.53 $0.80 49.5 32.8 $3,348.4 $1.57 12.3AMSURG Corporation AMSG adj Dec O/V $69.07 $77.00 48.4 $2.75 $3.35 $3.77 20.6 18.3 $3,343.9 $31.71 51.2Cree, Inc. CREE pf Jun O/V $30.64 $45.00 111.6 $1.65 $1.07 $1.39 28.6 22.0 $3,342.7 $24.11 1.2United Natural Foods, Inc. UNFI op Jul O/V $66.66 $78.00 50.1 $2.52 $2.92 $3.30 22.8 20.2 $3,338.0 $26.08 21.6QEP Resources, Inc. QEP op/cf Dec E $18.77 $22.00 176.7 $8.21 $4.41 $4.37 4.3 4.3 $3,315.9 $22.75 (43.4)WESCO International, Inc. WCC pf Dec O/V $74.19 $82.00 44.2 $5.18 $5.02 $5.50 14.8 13.5 $3,280.5 $43.35 (0.5)EP Energy Corp. EPE op/cf Dec E $13.08 $15.00 248.9 $5.02 $4.79 $4.09 2.7 3.2 $3,244.2 $17.63 1.3American Eagle Outfitters AEO adj Jan O/V $16.47 $19.00 195.1 $0.63 $1.02 $1.11 16.1 14.8 $3,218.6 $5.86 6.7
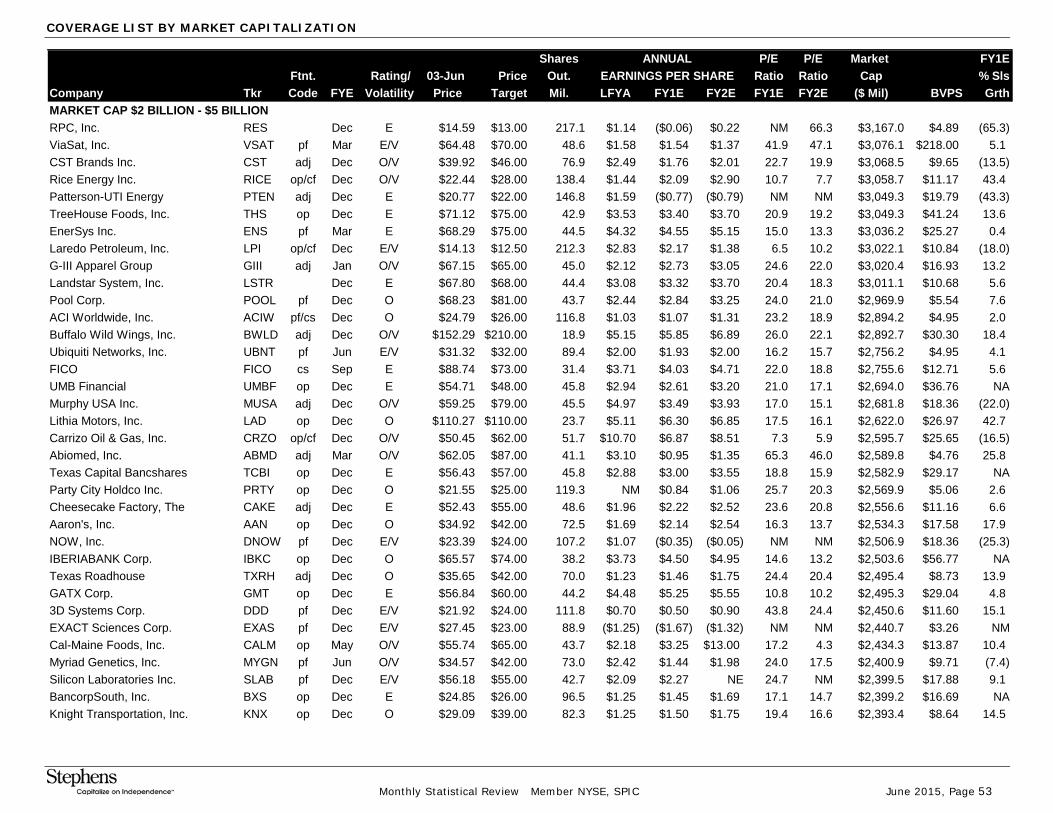
COVERAGE LIST BY MARKET CAPITALIZATION
Monthly Statistical Review Member NYSE, SPIC June 2015, Page 53
Shares ANNUAL P/E P/E Market FY1EFtnt. Rating/ 03-Jun Price Out. EARNINGS PER SHARE Ratio Ratio Cap % Sls
Company Tkr Code FYE Volatility Price Target Mil. LFYA FY1E FY2E FY1E FY2E ($ Mil) BVPS GrthMARKET CAP $2 BILLION - $5 BILLIONRPC, Inc. RES Dec E $14.59 $13.00 217.1 $1.14 ($0.06) $0.22 NM 66.3 $3,167.0 $4.89 (65.3)ViaSat, Inc. VSAT pf Mar E/V $64.48 $70.00 48.6 $1.58 $1.54 $1.37 41.9 47.1 $3,076.1 $218.00 5.1CST Brands Inc. CST adj Dec O/V $39.92 $46.00 76.9 $2.49 $1.76 $2.01 22.7 19.9 $3,068.5 $9.65 (13.5)Rice Energy Inc. RICE op/cf Dec O/V $22.44 $28.00 138.4 $1.44 $2.09 $2.90 10.7 7.7 $3,058.7 $11.17 43.4Patterson-UTI Energy PTEN adj Dec E $20.77 $22.00 146.8 $1.59 ($0.77) ($0.79) NM NM $3,049.3 $19.79 (43.3)TreeHouse Foods, Inc. THS op Dec E $71.12 $75.00 42.9 $3.53 $3.40 $3.70 20.9 19.2 $3,049.3 $41.24 13.6EnerSys Inc. ENS pf Mar E $68.29 $75.00 44.5 $4.32 $4.55 $5.15 15.0 13.3 $3,036.2 $25.27 0.4Laredo Petroleum, Inc. LPI op/cf Dec E/V $14.13 $12.50 212.3 $2.83 $2.17 $1.38 6.5 10.2 $3,022.1 $10.84 (18.0)G-III Apparel Group GIII adj Jan O/V $67.15 $65.00 45.0 $2.12 $2.73 $3.05 24.6 22.0 $3,020.4 $16.93 13.2Landstar System, Inc. LSTR Dec E $67.80 $68.00 44.4 $3.08 $3.32 $3.70 20.4 18.3 $3,011.1 $10.68 5.6Pool Corp. POOL pf Dec O $68.23 $81.00 43.7 $2.44 $2.84 $3.25 24.0 21.0 $2,969.9 $5.54 7.6ACI Worldwide, Inc. ACIW pf/cs Dec O $24.79 $26.00 116.8 $1.03 $1.07 $1.31 23.2 18.9 $2,894.2 $4.95 2.0Buffalo Wild Wings, Inc. BWLD adj Dec O/V $152.29 $210.00 18.9 $5.15 $5.85 $6.89 26.0 22.1 $2,892.7 $30.30 18.4Ubiquiti Networks, Inc. UBNT pf Jun E/V $31.32 $32.00 89.4 $2.00 $1.93 $2.00 16.2 15.7 $2,756.2 $4.95 4.1FICO FICO cs Sep E $88.74 $73.00 31.4 $3.71 $4.03 $4.71 22.0 18.8 $2,755.6 $12.71 5.6UMB Financial UMBF op Dec E $54.71 $48.00 45.8 $2.94 $2.61 $3.20 21.0 17.1 $2,694.0 $36.76 NAMurphy USA Inc. MUSA adj Dec O/V $59.25 $79.00 45.5 $4.97 $3.49 $3.93 17.0 15.1 $2,681.8 $18.36 (22.0)Lithia Motors, Inc. LAD op Dec O $110.27 $110.00 23.7 $5.11 $6.30 $6.85 17.5 16.1 $2,622.0 $26.97 42.7Carrizo Oil & Gas, Inc. CRZO op/cf Dec O/V $50.45 $62.00 51.7 $10.70 $6.87 $8.51 7.3 5.9 $2,595.7 $25.65 (16.5)Abiomed, Inc. ABMD adj Mar O/V $62.05 $87.00 41.1 $3.10 $0.95 $1.35 65.3 46.0 $2,589.8 $4.76 25.8Texas Capital Bancshares TCBI op Dec E $56.43 $57.00 45.8 $2.88 $3.00 $3.55 18.8 15.9 $2,582.9 $29.17 NAParty City Holdco Inc. PRTY op Dec O $21.55 $25.00 119.3 NM $0.84 $1.06 25.7 20.3 $2,569.9 $5.06 2.6Cheesecake Factory, The CAKE adj Dec E $52.43 $55.00 48.6 $1.96 $2.22 $2.52 23.6 20.8 $2,556.6 $11.16 6.6Aaron's, Inc. AAN op Dec O $34.92 $42.00 72.5 $1.69 $2.14 $2.54 16.3 13.7 $2,534.3 $17.58 17.9NOW, Inc. DNOW pf Dec E/V $23.39 $24.00 107.2 $1.07 ($0.35) ($0.05) NM NM $2,506.9 $18.36 (25.3)IBERIABANK Corp. IBKC op Dec O $65.57 $74.00 38.2 $3.73 $4.50 $4.95 14.6 13.2 $2,503.6 $56.77 NATexas Roadhouse TXRH adj Dec O $35.65 $42.00 70.0 $1.23 $1.46 $1.75 24.4 20.4 $2,495.4 $8.73 13.9GATX Corp. GMT op Dec E $56.84 $60.00 44.2 $4.48 $5.25 $5.55 10.8 10.2 $2,495.3 $29.04 4.83D Systems Corp. DDD pf Dec E/V $21.92 $24.00 111.8 $0.70 $0.50 $0.90 43.8 24.4 $2,450.6 $11.60 15.1EXACT Sciences Corp. EXAS pf Dec E/V $27.45 $23.00 88.9 ($1.25) ($1.67) ($1.32) NM NM $2,440.7 $3.26 NMCal-Maine Foods, Inc. CALM op May O/V $55.74 $65.00 43.7 $2.18 $3.25 $13.00 17.2 4.3 $2,434.3 $13.87 10.4Myriad Genetics, Inc. MYGN pf Jun O/V $34.57 $42.00 73.0 $2.42 $1.44 $1.98 24.0 17.5 $2,400.9 $9.71 (7.4)Silicon Laboratories Inc. SLAB pf Dec E/V $56.18 $55.00 42.7 $2.09 $2.27 NE 24.7 NM $2,399.5 $17.88 9.1BancorpSouth, Inc. BXS op Dec E $24.85 $26.00 96.5 $1.25 $1.45 $1.69 17.1 14.7 $2,399.2 $16.69 NAKnight Transportation, Inc. KNX op Dec O $29.09 $39.00 82.3 $1.25 $1.50 $1.75 19.4 16.6 $2,393.4 $8.64 14.5
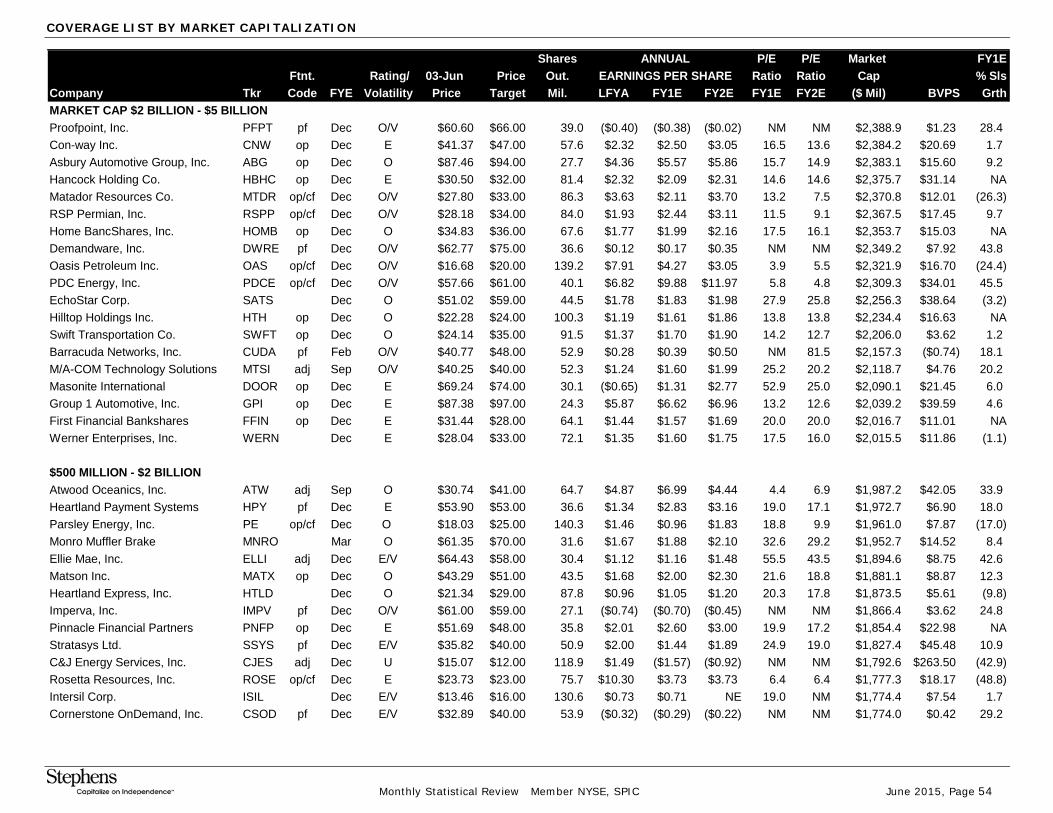
COVERAGE LIST BY MARKET CAPITALIZATION
Monthly Statistical Review Member NYSE, SPIC June 2015, Page 54
Shares ANNUAL P/E P/E Market FY1EFtnt. Rating/ 03-Jun Price Out. EARNINGS PER SHARE Ratio Ratio Cap % Sls
Company Tkr Code FYE Volatility Price Target Mil. LFYA FY1E FY2E FY1E FY2E ($ Mil) BVPS GrthMARKET CAP $2 BILLION - $5 BILLIONProofpoint, Inc. PFPT pf Dec O/V $60.60 $66.00 39.0 ($0.40) ($0.38) ($0.02) NM NM $2,388.9 $1.23 28.4Con-way Inc. CNW op Dec E $41.37 $47.00 57.6 $2.32 $2.50 $3.05 16.5 13.6 $2,384.2 $20.69 1.7Asbury Automotive Group, Inc. ABG op Dec O $87.46 $94.00 27.7 $4.36 $5.57 $5.86 15.7 14.9 $2,383.1 $15.60 9.2Hancock Holding Co. HBHC op Dec E $30.50 $32.00 81.4 $2.32 $2.09 $2.31 14.6 14.6 $2,375.7 $31.14 NAMatador Resources Co. MTDR op/cf Dec O/V $27.80 $33.00 86.3 $3.63 $2.11 $3.70 13.2 7.5 $2,370.8 $12.01 (26.3)RSP Permian, Inc. RSPP op/cf Dec O/V $28.18 $34.00 84.0 $1.93 $2.44 $3.11 11.5 9.1 $2,367.5 $17.45 9.7Home BancShares, Inc. HOMB op Dec O $34.83 $36.00 67.6 $1.77 $1.99 $2.16 17.5 16.1 $2,353.7 $15.03 NADemandware, Inc. DWRE pf Dec O/V $62.77 $75.00 36.6 $0.12 $0.17 $0.35 NM NM $2,349.2 $7.92 43.8Oasis Petroleum Inc. OAS op/cf Dec O/V $16.68 $20.00 139.2 $7.91 $4.27 $3.05 3.9 5.5 $2,321.9 $16.70 (24.4)PDC Energy, Inc. PDCE op/cf Dec O/V $57.66 $61.00 40.1 $6.82 $9.88 $11.97 5.8 4.8 $2,309.3 $34.01 45.5EchoStar Corp. SATS Dec O $51.02 $59.00 44.5 $1.78 $1.83 $1.98 27.9 25.8 $2,256.3 $38.64 (3.2)Hilltop Holdings Inc. HTH op Dec O $22.28 $24.00 100.3 $1.19 $1.61 $1.86 13.8 13.8 $2,234.4 $16.63 NASwift Transportation Co. SWFT op Dec O $24.14 $35.00 91.5 $1.37 $1.70 $1.90 14.2 12.7 $2,206.0 $3.62 1.2Barracuda Networks, Inc. CUDA pf Feb O/V $40.77 $48.00 52.9 $0.28 $0.39 $0.50 NM 81.5 $2,157.3 ($0.74) 18.1M/A-COM Technology Solutions MTSI adj Sep O/V $40.25 $40.00 52.3 $1.24 $1.60 $1.99 25.2 20.2 $2,118.7 $4.76 20.2Masonite International DOOR op Dec E $69.24 $74.00 30.1 ($0.65) $1.31 $2.77 52.9 25.0 $2,090.1 $21.45 6.0Group 1 Automotive, Inc. GPI op Dec E $87.38 $97.00 24.3 $5.87 $6.62 $6.96 13.2 12.6 $2,039.2 $39.59 4.6First Financial Bankshares FFIN op Dec E $31.44 $28.00 64.1 $1.44 $1.57 $1.69 20.0 20.0 $2,016.7 $11.01 NAWerner Enterprises, Inc. WERN Dec E $28.04 $33.00 72.1 $1.35 $1.60 $1.75 17.5 16.0 $2,015.5 $11.86 (1.1)
$500 MILLION - $2 BILLIONAtwood Oceanics, Inc. ATW adj Sep O $30.74 $41.00 64.7 $4.87 $6.99 $4.44 4.4 6.9 $1,987.2 $42.05 33.9Heartland Payment Systems HPY pf Dec E $53.90 $53.00 36.6 $1.34 $2.83 $3.16 19.0 17.1 $1,972.7 $6.90 18.0Parsley Energy, Inc. PE op/cf Dec O $18.03 $25.00 140.3 $1.46 $0.96 $1.83 18.8 9.9 $1,961.0 $7.87 (17.0)Monro Muffler Brake MNRO Mar O $61.35 $70.00 31.6 $1.67 $1.88 $2.10 32.6 29.2 $1,952.7 $14.52 8.4Ellie Mae, Inc. ELLI adj Dec E/V $64.43 $58.00 30.4 $1.12 $1.16 $1.48 55.5 43.5 $1,894.6 $8.75 42.6Matson Inc. MATX op Dec O $43.29 $51.00 43.5 $1.68 $2.00 $2.30 21.6 18.8 $1,881.1 $8.87 12.3Heartland Express, Inc. HTLD Dec O $21.34 $29.00 87.8 $0.96 $1.05 $1.20 20.3 17.8 $1,873.5 $5.61 (9.8)Imperva, Inc. IMPV pf Dec O/V $61.00 $59.00 27.1 ($0.74) ($0.70) ($0.45) NM NM $1,866.4 $3.62 24.8Pinnacle Financial Partners PNFP op Dec E $51.69 $48.00 35.8 $2.01 $2.60 $3.00 19.9 17.2 $1,854.4 $22.98 NAStratasys Ltd. SSYS pf Dec E/V $35.82 $40.00 50.9 $2.00 $1.44 $1.89 24.9 19.0 $1,827.4 $45.48 10.9C&J Energy Services, Inc. CJES adj Dec U $15.07 $12.00 118.9 $1.49 ($1.57) ($0.92) NM NM $1,792.6 $263.50 (42.9)Rosetta Resources, Inc. ROSE op/cf Dec E $23.73 $23.00 75.7 $10.30 $3.73 $3.73 6.4 6.4 $1,777.3 $18.17 (48.8)Intersil Corp. ISIL Dec E/V $13.46 $16.00 130.6 $0.73 $0.71 NE 19.0 NM $1,774.4 $7.54 1.7Cornerstone OnDemand, Inc. CSOD pf Dec E/V $32.89 $40.00 53.9 ($0.32) ($0.29) ($0.22) NM NM $1,774.0 $0.42 29.2

COVERAGE LIST BY MARKET CAPITALIZATION
Monthly Statistical Review Member NYSE, SPIC June 2015, Page 55
Shares ANNUAL P/E P/E Market FY1EFtnt. Rating/ 03-Jun Price Out. EARNINGS PER SHARE Ratio Ratio Cap % Sls
Company Tkr Code FYE Volatility Price Target Mil. LFYA FY1E FY2E FY1E FY2E ($ Mil) BVPS Grth$500 MILLION - $2 BILLIONB & G Foods, Inc. BGS op Dec E $30.34 $31.00 58.0 $1.44 $1.51 $1.59 20.1 19.1 $1,758.5 $6.31 1.3Proto Labs, Inc. PRLB pf Dec O/V $67.67 $90.00 25.9 $1.73 $2.00 $2.65 33.8 25.5 $1,754.0 $10.73 22.0Neogen Corp. NEOG pf May E/V $47.28 $45.00 37.0 $0.75 $0.87 $1.00 54.3 47.3 $1,751.3 $8.84 10.9Sanderson Farms SAFM Oct O $77.75 $95.00 22.4 $10.80 $12.50 $11.00 6.2 7.1 $1,742.5 $43.41 6.5Applied Industrial Technologies AIT pf Jun E $42.77 $44.00 41.1 $2.67 $2.82 $3.00 15.2 14.3 $1,717.6 $18.99 11.8Rent-A-Center RCII adj Dec E $32.22 $35.00 53.0 $1.98 $2.16 $2.51 14.9 12.8 $1,708.6 $26.51 5.4U.S. Silica Holdings, Inc. SLCA op Dec E/V $31.98 $28.00 53.4 $2.44 $0.87 $1.13 36.8 28.3 $1,707.5 $7.46 (24.8)Knowles Corp. KN pf Dec E/V $19.93 $21.00 85.1 $1.10 $0.75 $1.29 26.6 15.4 $1,696.3 $13.76 (7.0)Forward Air FWRD Dec O $54.42 $60.00 30.3 $1.96 $2.41 $2.85 22.6 19.1 $1,685.5 $9.27 22.7Dean Foods DF op Dec E $17.79 $18.00 94.4 ($0.14) $0.90 $1.00 19.8 17.8 $1,678.6 $5.84 (16.6)CyrusOne, Inc. CONE Dec O $31.44 $38.00 51.5 ($0.43) ($0.03) $0.09 NM NM $1,675.7 $11.92 24.4Trex Company TREX op Dec E/V $51.98 $55.00 32.1 $1.27 $1.71 $2.21 30.4 23.5 $1,667.5 $4.10 16.1Insulet Corp. PODD pf Dec E/V $29.34 $24.00 56.8 ($0.19) ($0.39) $0.02 NM NM $1,665.1 $1.49 2.7Helix Energy Solutions Group HLX adj Dec E $15.67 $20.00 105.9 $1.76 $0.70 $1.27 22.4 12.3 $1,659.7 $15.63 (36.0)Air Methods Corp. AIRM op Dec O/V $41.70 $58.00 39.3 $2.56 $2.98 $3.53 14.0 11.8 $1,637.4 $12.38 8.0NetScout Systems, Inc. NTCT pf Mar E/V $39.98 $40.00 41.5 $2.03 $2.31 $2.62 17.3 15.3 $1,629.7 $10.49 13.9Greenbrier Companies GBX Aug O $61.38 $75.00 26.5 $3.07 $5.80 $6.15 10.6 10.0 $1,620.0 $19.33 20.5MRC Golbal Inc. MRC pf Dec O/V $15.57 $22.00 102.1 $1.64 $0.54 $0.57 28.8 27.3 $1,603.7 $13.46 (41.1)Beacon Roofing Supply, Inc. BECN op/cs Sep O/V $32.04 $0.50 49.6 $1.08 $1.37 $1.70 23.4 18.8 $1,590.0 $16.54 8.6Fresh Market, The TFM op Jan O/V $32.69 $49.00 48.6 $1.61 $1.81 $2.05 18.1 15.9 $1,588.8 $7.17 9.7LogMeIn, Inc. LOGM pf Dec O/V $64.47 $65.00 24.7 $1.18 $1.40 $1.60 46.1 40.3 $1,587.5 $7.35 18.6MasTec, Inc. MTZ pf Dec O/V $19.11 $23.00 81.9 $1.57 $1.45 $2.04 13.2 9.4 $1,564.6 $12.61 (4.1)Sonic Corp. SONC Aug O $30.08 $40.00 53.5 $0.84 $1.07 $1.23 28.1 24.5 $1,564.2 $1.15 9.8OmniVision Technologies OVTI pf Apr E/V $26.71 $29.75 58.1 $2.06 $1.62 NE 16.5 NM $1,552.8 $19.13 (2.9)Hub Group HUBG Dec O $43.00 $44.00 36.1 $1.73 $1.85 $2.20 23.2 19.5 $1,551.5 $16.26 1.7Abercrombie & Fitch Co. ANF adj Jan U/V $22.18 $16.00 69.6 $1.54 $0.65 $1.17 34.1 19.0 $1,542.6 $18.80 (7.2)Rovi Corp. ROVI pf Dec E/V $17.43 $18.00 89.2 $1.74 $1.56 $2.05 11.2 8.5 $1,541.1 $12.03 (2.3)Surgical Care Affiliates SCAI adj Dec E/V $38.82 $42.00 39.0 $2.12 $2.10 $2.32 18.5 16.7 $1,526.9 $6.30 19.1Infoblox Inc. BLOX pf Jul O/V $26.19 $30.00 56.7 $0.34 $0.35 $0.41 74.8 63.9 $1,503.0 $4.34 19.5QTS Realty Trust QTS Dec E $37.51 $41.00 34.7 $0.51 $0.57 $0.69 65.8 54.4 $1,500.2 $12.78 16.2ClubCorp Holdings, Inc. MYCC Dec O/V $23.04 $27.00 64.6 $0.21 $0.57 $0.71 40.4 32.5 $1,488.7 $3.26 18.8Cogent Communications Group CCOI pf Dec E $31.40 $40.00 46.1 ($0.10) $0.24 $0.67 NM 46.9 $1,446.0 $1.17 6.2Semtech Corp. SMTC pf Jan O/V $21.60 $32.00 66.4 $1.54 $1.26 NE 17.1 NM $1,434.0 $8.25 (4.5)Itron, Inc. ITRI pf Dec Susp $36.78 NE 39.3 $1.90 NE NE NM NM $1,414.2 $22.07 NEQualys, Inc. QLYS pf Dec E/V $41.33 $45.00 34.0 $0.46 $0.53 $0.70 78.0 59.0 $1,403.4 $4.79 24.1

COVERAGE LIST BY MARKET CAPITALIZATION
Monthly Statistical Review Member NYSE, SPIC June 2015, Page 56
Shares ANNUAL P/E P/E Market FY1EFtnt. Rating/ 03-Jun Price Out. EARNINGS PER SHARE Ratio Ratio Cap % Sls
Company Tkr Code FYE Volatility Price Target Mil. LFYA FY1E FY2E FY1E FY2E ($ Mil) BVPS Grth$500 MILLION - $2 BILLIONConn's, Inc. CONN op Jan E $38.54 $40.00 36.4 $1.69 $1.96 $2.47 19.7 15.6 $1,403.2 $18.43 10.7Atlas Air Worldwide Holdings AAWW op Dec E/V $55.65 $49.00 25.0 $3.72 $4.85 $4.15 11.5 13.4 $1,391.5 $57.86 (0.5)The Children's Place PLCE adj Jan E/V $67.17 $65.00 20.8 $3.05 $3.45 $3.87 19.5 17.4 $1,384.7 $27.51 (1.1)Acxiom Corp. ACXM cs Mar O/V $17.54 $24.00 77.3 $0.78 $0.45 $0.79 39.0 22.2 $1,371.2 $8.95 (18.8)Tumi Holdings, Inc. TUMI adj Dec O/V $19.75 $23.00 67.9 $0.85 $0.92 $1.03 21.5 19.2 $1,340.4 $6.36 6.0Repligen Corp. RGEN pf Dec O/V $40.11 $38.00 32.9 $0.18 $0.32 $0.50 NM 80.2 $1,317.7 $3.42 25.8Bankrate, Inc. RATE adj Dec E $12.59 $12.50 104.4 $0.64 $0.79 $0.90 15.9 14.0 $1,314.8 $8.29 12.3Simmons First National Corp. SFNC op Dec O $43.98 $49.00 29.8 $2.30 $3.08 $3.36 14.3 13.1 $1,312.8 $27.38 NALegacyTexas Financial Group LTXB op Dec O $27.48 $30.00 40.0 $0.99 $1.65 $1.85 16.7 14.9 $1,308.2 $14.10 NAOxford Industries OXM adj Jan O/V $77.72 $90.00 16.5 $2.97 $3.53 $3.95 22.0 19.7 $1,288.2 $17.05 (2.6)Core-Mark Holding Co. CORE adj Dec O/V $55.07 $70.00 23.1 $2.26 $2.34 $2.45 23.5 22.5 $1,271.7 $19.84 5.9Marketo, Inc. MKTO pf Dec O/V $30.08 $40.00 42.1 ($0.67) ($0.83) ($0.49) NM NM $1,270.6 $2.73 39.2Fiesta Restaurant Group FRGI adj Dec O/V $47.19 $80.00 26.8 $1.38 $1.60 $1.90 29.5 24.8 $1,265.8 $7.57 14.4Builders FirstSource, Inc. BLDR op Dec O/V $12.67 $14.00 98.2 $0.15 $0.32 $0.51 39.6 24.8 $1,257.6 $0.35 8.1CoreSite Realty Corp. COR adj Dec O $47.28 $57.00 22.0 $0.67 $0.70 $0.95 67.5 49.8 $1,253.9 $9.54 17.0Diodes Inc. DIOD pf Dec O/V $26.00 $34.00 48.0 $1.45 $1.50 NE 17.3 NM $1,247.4 $16.14 1.7Ensign Group, The ENSG adj Dec O/V $48.73 $50.00 22.5 $2.17 $2.44 $2.74 20.0 17.8 $1,240.2 $11.46 24.3BJ's Restaurants BJRI adj Dec O $46.85 $58.00 26.2 $1.03 $1.38 $1.63 33.9 28.7 $1,228.7 $13.63 11.0Martin Midstream Partners MMLP cf Dec E $34.64 $38.00 35.5 $2.91 $3.29 $3.55 10.5 9.8 $1,228.2 $13.73 32.5Andersons, The ANDE Dec E $42.44 $48.00 28.4 $3.46 $2.70 $3.45 15.7 12.3 $1,221.7 $27.20 (3.1)Synergy Resources Corp. SYRG op/cf Aug O $11.68 $14.00 105.1 $0.97 $1.09 $1.44 10.7 8.1 $1,215.5 $5.45 26.3FNFV Group FNFV pf/cs Dec O/V $15.13 $17.00 93.0 $0.43 $0.10 $0.20 NM 75.7 $1,210.7 $64.87 (30.9)Abaxis, Inc. ABAX pf Mar E/V $53.12 $54.00 22.5 $0.93 $1.27 $1.42 41.8 37.4 $1,204.3 $9.25 12.4Vitamin Shoppe, Inc. VSI op Dec O $40.21 $49.00 29.7 $2.19 $2.06 $2.38 19.5 16.9 $1,196.0 $18.82 6.6Red Robin Gourmet Burgers RRGB adj Dec O $84.35 $100.00 14.1 $2.66 $3.30 $3.95 25.6 21.4 $1,191.4 $26.92 12.2Hibbett Sports, Inc. HIBB Jan O $47.03 $63.00 24.9 $2.87 $3.00 $3.47 15.7 13.6 $1,170.9 $13.92 6.3Kaman Corp. KAMN pf Dec E $42.97 $44.00 27.2 $2.31 $2.46 $2.78 17.5 15.5 $1,170.0 $19.08 5.0American Railcar Industries ARII op Dec E $54.43 $57.00 21.4 $4.72 $6.00 $5.50 9.1 9.9 $1,162.2 $23.20 26.9Green Plains Inc. GPRE op Dec O $30.52 $37.00 38.0 $3.96 $1.50 $2.45 20.3 12.5 $1,158.2 $20.90 (9.3)TrueCar, Inc. TRUE adj Dec O/V $13.94 $23.00 98.1 ($0.05) $0.15 $0.49 92.9 28.4 $1,142.3 $3.12 37.6LDR Holding Corp. LDRH Dec O/V $42.85 $45.00 26.6 ($0.43) ($0.70) ($0.22) NM NM $1,139.0 $4.07 13.9Endologix, Inc. ELGX pf Dec O/V $16.85 $19.00 67.4 ($0.38) ($0.52) ($0.32) NM NM $1,136.0 $1.85 7.9NIC Inc. EGOV adj Dec O $17.25 $21.00 65.4 $0.65 $0.66 $0.74 26.1 23.3 $1,130.6 $1.60 7.5Sunoco LP SUN cf Dec O $46.70 $65.00 24.1 $3.21 $3.45 $4.30 13.5 10.9 $1,125.4 $47.40 103.7Krispy Kreme Doughnuts KKD adj Jan O/V $17.31 $23.00 64.8 $0.72 $0.82 $0.96 21.1 18.0 $1,122.7 $4.03 15.1

COVERAGE LIST BY MARKET CAPITALIZATION
Monthly Statistical Review Member NYSE, SPIC June 2015, Page 57
Shares ANNUAL P/E P/E Market FY1EFtnt. Rating/ 03-Jun Price Out. EARNINGS PER SHARE Ratio Ratio Cap % Sls
Company Tkr Code FYE Volatility Price Target Mil. LFYA FY1E FY2E FY1E FY2E ($ Mil) BVPS Grth$500 MILLION - $2 BILLIONBottomline Technologies EPAY pf/cs Jun O/V $27.41 $31.00 39.9 $1.29 $1.44 $1.53 19.0 17.9 $1,121.8 $9.65 10.3NCI Building Systems NCS op Oct O/V $15.07 $18.00 73.8 $0.16 $0.23 $0.54 65.5 27.9 $1,111.8 $3.37 13.9Mitel Networks Corp. MITL pf Dec O $9.27 $13.00 119.9 $0.98 $0.68 $0.80 13.6 11.6 $1,111.0 $4.47 6.4Bob Evans Farms BOBE adj Apr U $46.59 $40.00 23.6 $1.41 $1.42 $1.55 32.8 30.1 $1,101.6 $15.78 1.5UTi Worldwide UTIW op Jan O/V $10.32 $13.00 105.6 ($0.73) ($0.22) ($0.09) NM NM $1,093.9 $4.63 1.7Atlantic Tele-Network ATNI pf Dec E $67.15 $70.00 16.1 $3.07 $2.44 $2.48 27.5 27.1 $1,077.1 $42.01 0.8Consolidated Communications Holdi CNSL adj Dec E $20.83 $23.00 50.5 $0.75 $0.65 $0.68 32.0 30.6 $1,052.1 $6.25 22.1TiVo Inc. TIVO Jan E/V $10.77 $13.00 110.5 $0.28 $0.34 $0.42 31.7 25.6 $1,047.9 $3.22 3.7Saia, Inc. SAIA op Dec O $41.57 $50.00 25.1 $2.00 $2.50 $3.10 16.6 13.4 $1,043.0 $15.12 (0.8)NxStage Medical, Inc. NXTM Dec O $16.03 $22.00 63.2 ($0.39) ($0.36) ($0.21) NM NM $1,013.7 $3.00 8.4ESCO Technologies ESE pf Sep O $37.87 $44.00 26.1 $1.65 $1.75 $2.10 21.6 18.0 $988.0 $22.28 2.7Calavo Growers Inc. CVGW op Oct O $56.54 $60.00 17.3 $1.45 $1.90 $2.25 29.8 25.1 $979.0 $11.12 18.8Sierra Wireless, Inc. SWIR pf Dec E/V $30.43 $34.00 32.6 $0.63 $1.00 $1.30 30.4 23.4 $977.8 $10.81 15.8Continental Building Products CBPX op Dec E/V $22.62 $23.00 44.1 $0.55 $0.97 $1.40 23.3 16.2 $977.3 $6.99 7.5United Community Banks, Inc. UCBI op Dec E $19.35 $21.00 50.2 $1.10 $1.27 $1.48 15.2 13.1 $972.3 $12.66 NARenasant Corp. RNST op Dec O $30.55 $34.00 31.6 $1.88 $2.12 $2.43 14.4 12.6 $966.2 $22.88 NARuckus Wireless, Inc. RKUS pf Dec O/V $11.09 $12.00 97.8 $0.44 $0.41 $0.47 27.0 23.6 $960.0 $3.05 13.3Echo Global Logistics ECHO op Dec O $32.87 $40.00 28.9 $0.81 $0.93 $1.38 35.3 23.8 $949.1 $7.99 40.2Sonic Automotive, Inc. SAH op Dec E $24.12 $24.00 38.9 $1.90 $1.90 $2.02 12.7 11.9 $936.9 $13.09 3.9Wabash National Corp. WNC op Dec E $13.67 $13.00 67.9 $0.89 $1.20 $1.25 11.4 10.9 $933.7 $5.66 7.0Bojangles', Inc. BOJA adj Dec E/V $25.58 $26.00 35.9 NA $0.66 $0.76 38.8 33.7 $918.4 NM 12.8ArcBest Corp. ARCB op Dec O $34.80 $45.00 26.0 $1.80 $2.35 $3.05 14.8 11.4 $905.0 $21.46 5.7ADTRAN, Inc. ADTN pf Dec E/V $16.89 $17.00 53.3 $0.95 $0.55 $0.78 30.7 21.7 $900.6 $10.18 (4.4)Denny's Corp. DENN adj Dec E/V $10.65 $12.00 84.4 $0.38 $0.44 $0.48 24.2 22.2 $898.5 $0.02 2.6Stewart Information Services STC op Dec O/V $38.37 $44.00 23.3 $1.19 $2.23 $3.60 17.2 10.7 $879.9 $28.88 4.3Genomic Health, Inc. GHDX pf Dec E/V $26.98 $29.00 32.2 ($0.78) ($0.74) $0.07 NM NM $870.5 $4.87 6.1RPX Corp. RPXC pf Dec O/V $16.00 $18.00 54.3 $0.97 $0.95 $1.00 16.8 16.0 $868.4 $9.34 12.9IPC The Hospitalist Co. IPCM Dec E/V $49.86 $54.00 17.4 $2.21 $2.03 $2.34 24.6 21.3 $866.9 $21.34 7.2Adeptus Health Inc. ADPT adj Dec O/V $75.64 $71.00 10.0 $0.04 $0.87 $1.42 86.9 53.3 $857.4 $2.37 58.2Rush Enterprises, Inc. RUSHA Dec E $28.27 $33.00 30.2 $2.03 $1.90 $2.40 14.9 11.8 $852.9 $19.16 7.8Team, Inc. TISI pf May O/V $40.77 $48.00 21.7 $1.48 $2.00 $2.20 20.4 18.5 $847.6 $16.16 12.1CallidusCloud CALD pf Dec O/V $15.00 $20.00 55.3 $0.14 $0.22 $0.35 68.2 42.9 $829.1 $2.29 21.6Hanger Inc. HGR op Dec E/V $23.26 $24.00 35.3 $1.95 $1.62 $1.86 14.4 12.5 $820.9 $16.66 nmWindstream Corp. WIN pf Dec E $8.05 $11.00 100.8 $0.83 $0.51 $0.46 15.8 17.5 $811.6 $2.24 (4.5)Hornbeck Offshore Services HOS adj Dec E $22.04 $26.00 39.4 $2.40 $0.65 $0.53 33.9 41.6 $786.9 $39.42 (30.9)

COVERAGE LIST BY MARKET CAPITALIZATION
Monthly Statistical Review Member NYSE, SPIC June 2015, Page 58
Shares ANNUAL P/E P/E Market FY1EFtnt. Rating/ 03-Jun Price Out. EARNINGS PER SHARE Ratio Ratio Cap % Sls
Company Tkr Code FYE Volatility Price Target Mil. LFYA FY1E FY2E FY1E FY2E ($ Mil) BVPS Grth$500 MILLION - $2 BILLIONMarten Transport, Ltd. MRTN op Dec O $23.40 $28.00 33.5 $0.89 $1.12 $1.35 20.9 17.3 $785.5 $11.90 0.0Ply Gem Holdings, Inc. PGEM op Dec O/V $11.55 $15.00 67.9 ($0.26) $0.24 $1.11 48.1 10.4 $784.6 ($1.42) 26.8Capital Senior Living Corp. CSU cs Dec O/V $26.18 $30.00 29.5 $1.51 $1.66 $1.78 15.8 14.7 $771.8 $4.65 5.4Cincinnati Bell CBB pf Dec E $3.65 $3.75 209.7 ($0.10) $0.04 $0.11 91.3 33.2 $765.4 ($3.72) (10.9)FARO Technologies, Inc. FARO Dec E/V $43.61 $45.00 17.4 $1.67 $1.35 $1.90 32.3 23.0 $757.9 $19.64 4.6Luminex Corp. LMNX pf Dec E/V $17.25 $20.00 43.1 $0.61 $0.58 $0.68 29.7 25.4 $744.1 $7.65 3.9Altra Holdings, Inc. AIMC op Dec E/V $28.10 $28.00 26.4 $1.83 $1.65 $1.74 17.0 16.1 $742.0 $9.82 (6.2)Halcon Resources HK op/cf Dec E $1.30 $1.50 563.4 $1.28 $0.48 $0.21 2.7 6.2 $741.9 $2.73 (12.6)Raven Industries RAVN Jan E/V $19.62 $19.00 38.1 $0.86 $0.72 $0.83 27.3 23.6 $741.7 $8.02 (8.9)State Bank Financial Corp. STBZ op Dec O $20.38 $23.00 35.7 $0.96 $1.11 $1.27 18.4 16.0 $728.4 $14.81 NALendingTree, Inc. TREE adj Dec O/V $63.41 $65.00 12.2 $1.59 $2.19 $2.90 29.0 21.9 $726.2 $8.46 22.8Rubicon Project, Inc. RUBI pf Dec O/V $17.06 $27.00 37.9 $0.15 $0.24 $0.45 71.1 37.9 $726.1 $3.46 63.1Independent Bank Group IBTX op Dec O $42.29 $45.00 17.1 $2.23 $2.57 $3.00 16.5 14.1 $724.0 $30.77 NANational Bank Holdings Corp. NBHC op Dec E $19.70 $20.00 36.5 $0.28 $0.22 $0.98 89.5 20.1 $710.1 $20.73 NACalAmp Corp. CAMP pf Feb O/V $19.57 $25.00 36.6 $0.96 $1.15 $1.30 17.0 15.1 $708.9 $4.18 12.3Air Transport Services Group ATSG Dec E $10.54 $10.00 65.0 $0.55 $0.60 $0.67 17.6 15.7 $687.6 $5.36 3.4Atlas Resource Partners ARP op/cf Dec O $7.32 $12.00 79.3 $2.39 $1.52 $1.61 1.6 4.5 $685.9 $8.68 3.3Summit Materials LLC SUM op Dec O $25.76 $31.00 26.6 $0.48 $0.68 $1.04 37.9 24.8 $684.8 NA 21.5Fred's Inc. FRED adj Jan O/V $18.14 $21.00 37.2 ($0.17) $0.54 $0.75 33.6 24.2 $674.0 $11.24 12.7World Acceptance Corp. WRLD adj Mar E $77.10 $90.00 9.5 $10.88 $11.74 NE 6.6 NM $655.4 $32.90 (3.5)Flotek Industries FTK adj Dec O $12.08 $17.00 53.5 $0.95 ($0.27) $0.09 NM NM $646.1 $5.72 NMSanchez Energy Corp. SN op/cf Dec O/V $10.56 $16.00 73.6 $7.86 $3.25 $4.18 3.2 2.5 $645.0 $8.29 (29.7)MarineMax, Inc. HZO op Sep O/V $25.08 $29.00 25.5 $0.40 $0.82 $1.37 30.6 18.3 $639.4 $9.91 20.7U.S. Physical Therapy USPH cs Dec O/V $51.23 $52.00 12.4 $1.71 $1.80 $1.91 28.5 26.8 $635.2 $11.92 5.3Celadon Group, Inc. CGI op Jun O $23.08 $32.00 24.3 $0.96 $1.50 $1.80 15.4 12.8 $631.0 $11.25 16.7Harmonic Inc. HLIT pf Dec E/V $7.12 $7.00 88.5 $0.16 $0.26 $0.30 27.4 23.7 $630.4 $4.19 (2.1)Zoe's Kitchen, Inc. ZOES adj Dec E/V $32.52 $32.00 19.3 $0.03 $0.06 $0.18 NM NM $628.1 $6.35 27.5TravelCenters of America TA adj Dec O/V $15.79 $19.00 38.4 $1.62 $1.34 $1.88 11.8 8.4 $605.5 $13.53 (9.6)DXP Enterprises DXPE Dec O/V $42.35 $54.00 14.2 $3.67 $2.50 $3.10 16.9 13.7 $602.8 $16.79 (10.7)Tuesday Morning Corp. TUES adj Jun E/V $13.62 $23.00 44.1 $0.01 $0.31 $0.68 43.9 20.0 $600.1 $5.11 5.5SandRidge Energy, Inc. SD op/cf Dec O/V $1.23 $2.00 484.0 $1.33 $0.55 $0.41 2.2 3.0 $595.3 $1.30 (42.8)Lumber Liquidators LL Dec O $21.58 $35.00 27.1 $2.31 $0.48 $1.74 45.0 12.4 $584.4 $12.01 2.9CrossAmerica Partners LP CAPL cf Dec O/V $34.28 $43.00 17.0 $1.77 $2.55 $2.91 13.4 11.8 $583.7 $8.30 50.0Intrawest Resorts Holdings SNOW Jun O/V $12.73 $16.00 45.2 ($4.37) ($0.20) $0.16 NM 79.6 $575.4 $5.15 9.3Natural Grocers by Vitamin Cottage NGVC op Sep E/V $24.87 $33.00 22.5 $0.60 $0.66 $0.83 37.7 30.0 $559.4 $4.56 21.7

COVERAGE LIST BY MARKET CAPITALIZATION
Monthly Statistical Review Member NYSE, SPIC June 2015, Page 59
Shares ANNUAL P/E P/E Market FY1EFtnt. Rating/ 03-Jun Price Out. EARNINGS PER SHARE Ratio Ratio Cap % Sls
Company Tkr Code FYE Volatility Price Target Mil. LFYA FY1E FY2E FY1E FY2E ($ Mil) BVPS Grth$500 MILLION - $2 BILLIONMistras Group, Inc. MG pf May O/V $19.25 $24.00 28.6 $0.70 $0.63 $0.96 30.6 20.1 $552.5 $8.79 15.5U.S. Concrete, Inc. USCR op Dec O $37.26 $46.00 14.3 $2.19 $2.88 $2.69 12.9 13.8 $543.4 $7.26 36.3Stock Building Supply Holdings STCK op Dec O/V $20.50 $25.00 26.2 $0.50 $0.79 $1.20 25.9 17.1 $536.6 $5.48 9.2Callon Petroleum Co. CPE op/cf Dec O/V $7.99 $13.00 65.9 $2.02 $1.29 $1.49 6.2 5.4 $526.3 $7.85 10.7Varonis Systems, Inc. VRNS pf Dec O/V $20.88 $28.00 24.8 ($0.60) ($0.71) ($0.32) NM NM $518.8 $3.85 23.4
MARKET CAP < $500 MILLIONCerus Corp. CERS pf Dec O/V $5.24 $9.00 95.4 ($0.52) ($0.52) ($0.53) NM NM $499.7 $1.16 (1.4)Rally Software Development RALY pf Jan E/V $19.44 $19.50 25.6 ($1.08) ($0.84) ($0.65) NM NM $498.6 $2.11 19.2Movado Group MOV adj Jan E/V $28.01 $30.00 17.1 $2.02 $1.96 $2.36 14.3 11.9 $483.6 $26.25 1.7Matrix Service Co. MTRX pf Jun O/V $18.08 $22.00 26.7 $1.51 $1.15 $1.52 15.7 11.9 $483.1 $10.84 7.1Habit Restaurants, Inc. HABT adj Dec E/V $35.08 $34.00 13.1 $0.19 $0.23 $0.28 NM NM $482.9 $1.60 28.0Premiere Global Services PGI pf Dec O $10.38 $14.00 46.9 $0.89 $0.90 $0.90 11.5 11.5 $482.3 $5.38 0.5Covenant Transportation Group CVTI op Dec O $30.29 $39.00 16.3 $1.38 $1.95 $2.20 15.5 13.8 $481.8 $9.35 2.2America's Car-Mart, Inc. CRMT Apr E $54.25 $55.00 8.6 $3.26 $3.60 $3.96 15.1 13.7 $462.7 $26.38 10.8Pioneer Energy Services PES adj Dec E $7.16 $6.50 64.3 $0.30 ($0.69) ($0.87) NM NM $461.2 $7.52 11.3YRC Worldwide Inc. YRCW op Dec U/V $13.96 NE 47.8 ($7.38) ($3.25) ($2.64) NM NM $457.2 ($3.96) 6.6ShoreTel, Inc. SHOR pf Jun O $6.97 $10.00 64.6 $0.24 $0.23 $0.14 30.3 49.8 $449.9 $2.82 4.4EXCO Resources XCO op/cf Dec E $1.64 $1.50 279.6 $1.15 $0.40 $0.56 4.1 2.9 $448.9 $0.71 (44.4)Genesis Healthcare, Inc. GEN adj Dec O/V $6.06 $9.00 73.6 $0.40 $0.11 $0.27 55.1 22.4 $446.0 $2.38 (1.0)Del Frisco's Restaurant Group DFRG adj Dec O $18.77 $25.00 23.6 $0.82 $0.97 $1.13 19.4 16.6 $443.0 $9.26 17.2Quality Distribution QLTY op Dec E $15.71 $16.00 28.1 $0.76 $0.80 $0.85 19.6 18.5 $441.3 ($0.96) (2.5)Pacific Biosciences of California PACB pf Dec E/V $5.89 $7.00 74.6 ($0.94) ($0.94) ($0.78) NM NM $439.2 $0.74 29.0Chuy's Holdings, Inc. CHUY adj Dec O $26.64 $34.00 16.4 $0.69 $0.77 $0.88 34.6 30.3 $438.7 $7.19 16.3Parker Drilling PKD adj Dec E $3.45 $5.00 122.3 $0.32 ($0.26) ($0.12) NM NM $421.9 $5.44 (39.8)SciQuest, Inc. SQI pf Dec E/V $15.25 $17.50 27.6 $0.30 $0.31 $0.36 49.2 42.4 $420.7 $6.57 4.6Calix Inc. CALX pf Dec O/V $8.10 $11.00 51.7 $0.29 $0.03 $0.16 NM 50.6 $419.6 $5.10 2.5Materialise NV MTLS € Dec E/V $8.90 $9.00 47.1 $0.05 ($0.01) $0.06 NM NM $419.6 $1.81 22.2Trinity Biotech plc TRIB Dec O/V $17.86 $22.00 22.9 $0.72 $0.62 $0.68 28.8 26.3 $397.4 $8.58 1.3RTI Surgical, Inc. RTIX adj Dec E/V $6.63 $6.50 57.1 $0.00 $0.22 $0.25 30.1 26.5 $380.3 $2.95 8.7STAAR Surgical Co. STAA pf Dec O/V $9.54 $12.00 38.8 $0.02 $0.02 $0.04 NM NM $370.6 $0.97 0.1Magnum Hunter Resoures MHR Dec U $1.75 $1.50 208.3 $0.27 ($0.14) ($0.08) NM NM $364.5 $0.06 (53.3)Basic Energy Services BAS adj Dec E $8.50 $9.00 42.6 $0.45 ($3.99) ($3.21) NM NM $362.4 $7.21 (79.6)Carrols Restaurant Group TAST adj Dec O $10.07 $12.00 35.5 ($1.21) ($0.33) $0.02 NM NM $357.5 $2.80 19.2Stoneridge Inc. SRI op Dec O $12.71 $14.00 28.0 $0.52 $0.77 $1.00 16.5 12.7 $356.1 $3.23 (9.9)
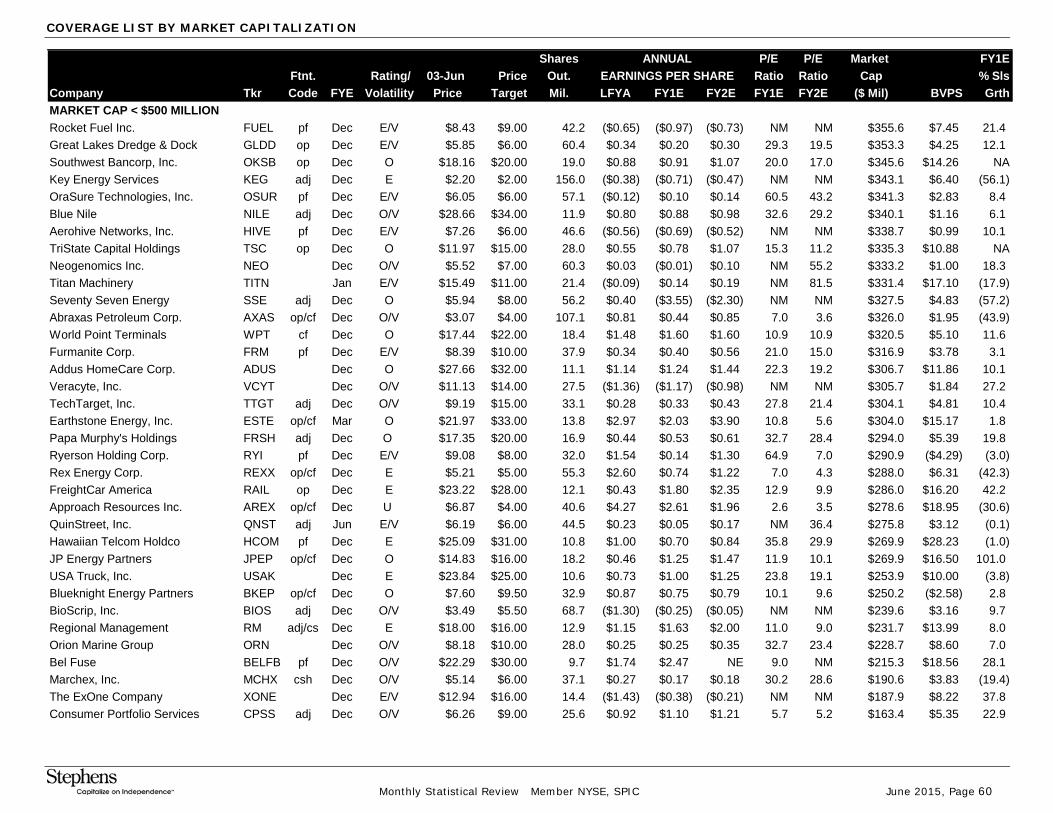
COVERAGE LIST BY MARKET CAPITALIZATION
Monthly Statistical Review Member NYSE, SPIC June 2015, Page 60
Shares ANNUAL P/E P/E Market FY1EFtnt. Rating/ 03-Jun Price Out. EARNINGS PER SHARE Ratio Ratio Cap % Sls
Company Tkr Code FYE Volatility Price Target Mil. LFYA FY1E FY2E FY1E FY2E ($ Mil) BVPS GrthMARKET CAP < $500 MILLIONRocket Fuel Inc. FUEL pf Dec E/V $8.43 $9.00 42.2 ($0.65) ($0.97) ($0.73) NM NM $355.6 $7.45 21.4Great Lakes Dredge & Dock GLDD op Dec E/V $5.85 $6.00 60.4 $0.34 $0.20 $0.30 29.3 19.5 $353.3 $4.25 12.1Southwest Bancorp, Inc. OKSB op Dec O $18.16 $20.00 19.0 $0.88 $0.91 $1.07 20.0 17.0 $345.6 $14.26 NAKey Energy Services KEG adj Dec E $2.20 $2.00 156.0 ($0.38) ($0.71) ($0.47) NM NM $343.1 $6.40 (56.1)OraSure Technologies, Inc. OSUR pf Dec E/V $6.05 $6.00 57.1 ($0.12) $0.10 $0.14 60.5 43.2 $341.3 $2.83 8.4Blue Nile NILE adj Dec O/V $28.66 $34.00 11.9 $0.80 $0.88 $0.98 32.6 29.2 $340.1 $1.16 6.1Aerohive Networks, Inc. HIVE pf Dec E/V $7.26 $6.00 46.6 ($0.56) ($0.69) ($0.52) NM NM $338.7 $0.99 10.1TriState Capital Holdings TSC op Dec O $11.97 $15.00 28.0 $0.55 $0.78 $1.07 15.3 11.2 $335.3 $10.88 NANeogenomics Inc. NEO Dec O/V $5.52 $7.00 60.3 $0.03 ($0.01) $0.10 NM 55.2 $333.2 $1.00 18.3Titan Machinery TITN Jan E/V $15.49 $11.00 21.4 ($0.09) $0.14 $0.19 NM 81.5 $331.4 $17.10 (17.9)Seventy Seven Energy SSE adj Dec O $5.94 $8.00 56.2 $0.40 ($3.55) ($2.30) NM NM $327.5 $4.83 (57.2)Abraxas Petroleum Corp. AXAS op/cf Dec O/V $3.07 $4.00 107.1 $0.81 $0.44 $0.85 7.0 3.6 $326.0 $1.95 (43.9)World Point Terminals WPT cf Dec O $17.44 $22.00 18.4 $1.48 $1.60 $1.60 10.9 10.9 $320.5 $5.10 11.6Furmanite Corp. FRM pf Dec E/V $8.39 $10.00 37.9 $0.34 $0.40 $0.56 21.0 15.0 $316.9 $3.78 3.1Addus HomeCare Corp. ADUS Dec O $27.66 $32.00 11.1 $1.14 $1.24 $1.44 22.3 19.2 $306.7 $11.86 10.1Veracyte, Inc. VCYT Dec O/V $11.13 $14.00 27.5 ($1.36) ($1.17) ($0.98) NM NM $305.7 $1.84 27.2TechTarget, Inc. TTGT adj Dec O/V $9.19 $15.00 33.1 $0.28 $0.33 $0.43 27.8 21.4 $304.1 $4.81 10.4Earthstone Energy, Inc. ESTE op/cf Mar O $21.97 $33.00 13.8 $2.97 $2.03 $3.90 10.8 5.6 $304.0 $15.17 1.8Papa Murphy's Holdings FRSH adj Dec O $17.35 $20.00 16.9 $0.44 $0.53 $0.61 32.7 28.4 $294.0 $5.39 19.8Ryerson Holding Corp. RYI pf Dec E/V $9.08 $8.00 32.0 $1.54 $0.14 $1.30 64.9 7.0 $290.9 ($4.29) (3.0)Rex Energy Corp. REXX op/cf Dec E $5.21 $5.00 55.3 $2.60 $0.74 $1.22 7.0 4.3 $288.0 $6.31 (42.3)FreightCar America RAIL op Dec E $23.22 $28.00 12.1 $0.43 $1.80 $2.35 12.9 9.9 $286.0 $16.20 42.2Approach Resources Inc. AREX op/cf Dec U $6.87 $4.00 40.6 $4.27 $2.61 $1.96 2.6 3.5 $278.6 $18.95 (30.6)QuinStreet, Inc. QNST adj Jun E/V $6.19 $6.00 44.5 $0.23 $0.05 $0.17 NM 36.4 $275.8 $3.12 (0.1)Hawaiian Telcom Holdco HCOM pf Dec E $25.09 $31.00 10.8 $1.00 $0.70 $0.84 35.8 29.9 $269.9 $28.23 (1.0)JP Energy Partners JPEP op/cf Dec O $14.83 $16.00 18.2 $0.46 $1.25 $1.47 11.9 10.1 $269.9 $16.50 101.0USA Truck, Inc. USAK Dec E $23.84 $25.00 10.6 $0.73 $1.00 $1.25 23.8 19.1 $253.9 $10.00 (3.8)Blueknight Energy Partners BKEP op/cf Dec O $7.60 $9.50 32.9 $0.87 $0.75 $0.79 10.1 9.6 $250.2 ($2.58) 2.8BioScrip, Inc. BIOS adj Dec O/V $3.49 $5.50 68.7 ($1.30) ($0.25) ($0.05) NM NM $239.6 $3.16 9.7Regional Management RM adj/cs Dec E $18.00 $16.00 12.9 $1.15 $1.63 $2.00 11.0 9.0 $231.7 $13.99 8.0Orion Marine Group ORN Dec O/V $8.18 $10.00 28.0 $0.25 $0.25 $0.35 32.7 23.4 $228.7 $8.60 7.0Bel Fuse BELFB pf Dec O/V $22.29 $30.00 9.7 $1.74 $2.47 NE 9.0 NM $215.3 $18.56 28.1Marchex, Inc. MCHX csh Dec O/V $5.14 $6.00 37.1 $0.27 $0.17 $0.18 30.2 28.6 $190.6 $3.83 (19.4)The ExOne Company XONE Dec E/V $12.94 $16.00 14.4 ($1.43) ($0.38) ($0.21) NM NM $187.9 $8.22 37.8Consumer Portfolio Services CPSS adj Dec O/V $6.26 $9.00 25.6 $0.92 $1.10 $1.21 5.7 5.2 $163.4 $5.35 22.9

COVERAGE LIST BY MARKET CAPITALIZATION
Monthly Statistical Review Member NYSE, SPIC June 2015, Page 61
Shares ANNUAL P/E P/E Market FY1EFtnt. Rating/ 03-Jun Price Out. EARNINGS PER SHARE Ratio Ratio Cap % Sls
Company Tkr Code FYE Volatility Price Target Mil. LFYA FY1E FY2E FY1E FY2E ($ Mil) BVPS GrthMARKET CAP < $500 MILLIONAtlas Energy ATLS op/cf Dec E $6.25 $8.50 51.9 $2.23 $0.96 $0.96 6.5 6.5 $162.6 $6.50 (46.4)MidSouth Bancorp, Inc. MSL op Dec O $14.08 $17.00 11.4 $1.39 $0.79 $1.35 17.8 10.4 $159.9 $14.78 NAAeropostale, Inc. ARO adj Jan E/V $1.95 $3.00 79.5 ($1.42) ($1.36) ($0.91) NM NM $155.1 $1.18 (9.2)Goodrich Petroleum Corp. GDP op/cf Dec U $2.62 $2.00 57.2 $2.17 $0.81 $0.35 3.2 7.5 $149.8 ($0.40) (16.4)Avinger, Inc. AVGR Dec O/V $12.02 $18.00 12.2 ($8.41) ($4.13) ($2.67) NM NM $147.1 NA 8.9Voxeljet AG VJET €/adj Dec E/V $7.86 $9.00 18.6 ($0.21) ($0.25) ($0.20) NM NM $146.2 $23.59 46.9Veritex Holdings, Inc. VBTX op Dec O $14.49 $18.00 9.5 $0.71 $0.78 $1.04 18.6 13.9 $137.4 $11.86 NAPetroQuest Energy, Inc. PQ op/cf Dec O/V $1.84 $4.00 65.9 $1.91 $0.67 $0.74 2.7 2.5 $121.2 $0.27 (46.7)Synergetics USA, Inc. SURG Jul O/V $4.62 $7.00 25.6 $0.12 $0.19 $0.31 24.3 14.9 $118.1 $2.56 1.2Good Times Restaurants GTIM adj Sep O/V $9.09 $11.50 12.3 ($0.12) $0.02 $0.19 NM 47.8 $111.3 $1.69 57.7New Source Energy Partners NSLP op/cf Dec E $5.04 $5.50 16.6 $2.41 $0.70 $0.81 7.2 6.2 $83.4 $12.00 NMTearLab Corp. TEAR pf Dec O/V $2.45 $5.00 33.7 ($0.74) ($0.89) ($0.77) NM NM $82.5 $0.73 24.9

MLP & REIT COMPANY RISKS
Monthly Statistical Review Member NYSE, SPIC June 2015, Page 62
ARP Company Risks If commodity prices decline significantly, ARP’s cash flow from operations will decline. Competition in the natural gas and oil industry is intense, which may hinder ARP’s ability to acquire natural gas and oil properties and companies, and to obtain capital, contract for drilling equipment and secure trained personnel. Shortages of drilling rigs, equipment and crews, or the costs required to obtain the foregoing in a highly competitive environment, could impair ARP’s operations and results. Many of ARP’s leases are in areas that have been partially depleted or drained by offset wells. ARP’s operations require substantial capital expenditures to increase asset base. If ARP is unable to obtain needed capital or financing on satisfactory terms, its asset base will decline, which could cause revenues to decline and affect ARP’s ability to pay distributions. ARP’s cash distribution policy limits the ability to grow. Significant physical effects of climatic change have the potential to damage ARP’s facilities, disrupt production activities and cause ARP to incur significant costs in preparing for or responding to those effects. ARP depends on certain key customers for sales of its natural gas, crude oil and natural gas liquids. To the extent these customers reduce the volumes of natural gas, crude oil and natural gas liquids they purchase from ARP, or cease to purchase natural gas, crude oil and natural gas liquids from ARP, revenues and cash available for distribution could decline. An increase in the differential between the NYMEX or other benchmark prices of oil and natural gas and the wellhead price that ARP receives for production could significantly reduce cash available for distribution and adversely affect ARP’s financial condition. Some of ARP’s undeveloped leasehold acreage is subject to leases that may expire in the near future. Drilling for and producing natural gas are high-risk activities with many uncertainties. Unless ARP replaces its oil and natural gas reserves, its reserves and production will decline, which would reduce ARP’s cash flow from operations and income. A decrease in natural gas prices could subject ARP’s oil and gas properties to a non-cash impairment loss under U.S. generally accepted accounting principles. Hedging transactions may limit ARP’s potential gains or cause it to lose money. Due to the accounting treatment of derivative contracts, increases in prices for natural gas, crude oil and NGLs could result in non-cash balance sheet reductions and non-cash losses in ARP’s statement of operations. Regulations promulgated by the Commodities Futures Trading Commission could have an adverse effect on ARP’s ability to use derivative instruments to reduce the effect of commodity price, interest rate and other risks associated with its business. The scope and costs of the risks involved in making acquisitions may prove greater than estimated at the time of the acquisition. ARP may be unsuccessful in integrating the operations from any future acquisitions with its operations and in realizing all of the anticipated benefits of these acquisitions. Properties that ARP acquired in the separation from Atlas Energy or afterward may not produce as projected and ARP may be unable to determine reserve potential, identify liabilities associated with the properties or obtain protection from sellers against such liabilities. ARP’s 2012 acquisitions may prove to be worth less than it paid, or provide less than anticipated proved reserves, because of uncertainties in evaluating recoverable reserves, well performance, and potential liabilities as well as uncertainties in forecasting oil and natural gas prices and future development, production and marketing costs. ARP may not identify all risks associated with the acquisition of oil and natural gas properties, or existing wells, and any indemnifications ARP receives from sellers may be insufficient to protect them from such risks, which may result in unexpected liabilities and costs to ARP. Ownership of ARP oil and gas production depends on good title to its property.

MLP & REIT COMPANY RISKS
Monthly Statistical Review Member NYSE, SPIC June 2015, Page 63
ARP’s drilling and production operations require adequate sources of water to facilitate the fracturing process and the disposal of that water. If ARP is unable to dispose of the water they use or remove from the strata at a reasonable cost and within applicable environmental rules, ARP’s ability to produce gas commercially and in commercial quantities could be impaired. Impact fees and severance taxes could materially increase ARP’s liabilities. Because ARP handles natural gas and oil, they may incur significant costs and liabilities in the future resulting from a failure to comply with new or existing environmental regulations or an accidental release of substances into the environment. ARP is subject to comprehensive federal, state, local and other laws and regulations that could increase the cost and alter the manner or feasibility of them doing business. ARP may not be able to continue to raise funds through its investment partnerships at desired levels, which may in turn restrict our ability to maintain drilling activity at recent levels. Changes in tax laws may impair ARP’s ability to obtain capital funds through investment partnerships. Fee-based revenues may decline if ARP is unsuccessful in sponsoring new investment partnerships. ARP’s revenues may decrease if investors in its investment partnerships do not receive a minimum return. ARP or one of its subsidiaries may be exposed to financial and other liabilities as the managing general partner in investment partnerships. Covenants in ARP’s credit facility restrict business in many ways. Economic conditions and instability in the financial markets could negatively impact ARP’s business which, in turn, could impact the cash it has to make distributions to unitholders. ARP’s historical financial information may not be representative of the results they would have achieved as a stand-alone public company and may not be a reliable indicator of future results. Estimates of the reserves are based on many assumptions that may prove to be inaccurate. Any material inaccuracies in these reserve estimates or underlying assumptions will materially affect the quantities and present value of ARP’s reserves.

MLP & REIT COMPANY RISKS
Monthly Statistical Review Member NYSE, SPIC June 2015, Page 64
ATLS Company Risks If commodity prices decline significantly, ATLS’ cash flow from operations will decline. ATLS may not have sufficient cash to pay distributions. ATLS may issue an unlimited number of limited partner interests without the consent of its unitholders, which will dilute existing limited partners’ ownership interest in ATLS and may increase the risk that they will not have sufficient available cash to make distributions. ATLS’ ability to meet future financial needs may be adversely affected by its cash distribution policy. Covenants in ATLS’ credit facility restricts its business in many ways. Economic conditions and instability in the financial markets could negatively impact ATLS and its subsidiaries’ businesses which, in turn, could impact the cash ATLS has to make distributions to unitholders. Hedging transactions may limit ATLS’s potential gains or cause them to lose money. Due to the accounting treatment of derivative contracts, increases in prices for natural gas, crude oil and NGLs could result in non-cash balance sheet reductions and non-cash losses in ATLS’ statement of operations. Regulations promulgated by the Commodities Futures Trading Commission could have an adverse effect on ATLS’ subsidiaries’ ability to use derivative instruments to reduce the effect of commodity price, interest rate and other risks associated with their business. The scope and costs of the risks involved in ATLS’ subsidiaries making acquisitions may prove greater than estimated at the time of the acquisition. ATLS’ subsidiaries may be unsuccessful in integrating the operations from any future acquisitions with their operations and in realizing all of the anticipated benefits of these acquisitions. If ATLS fails to maintain an effective system of internal controls, they may not be able to accurately report the financial results or prevent fraud. As a result, current and potential unitholders could lose confidence in ATLS’ financial reporting, which would harm its business and the trading price of its units. Certain provisions of ATLS’ limited partnership agreement and Delaware law could deter acquisition proposals and make it difficult for a third party to acquire control of them. This could have a negative effect on the price of ATLS’ common units. ARP and APL may issue additional units, which may increase the risk of not having sufficient available cash to make distributions at prior per unit distribution levels. Reduced incentive distributions from ARP or APL will disproportionately affect the amount of cash distributions to which ATLS is entitled. ATLS, as the parent of ARP’s and APL’s general partner, may limit or modify the incentive distributions ATLS is entitled to receive from ARP and APL in order to facilitate the growth strategy of ARP and APL. ATLS’ general partner’s board of directors can give this consent without a vote of its unitholders. ARP’s and APL’s common unitholders have the right to remove their general partner with the approval of the holders of 66 2/3% of all units, which would cause ATLS to lose its general partner interest and incentive distribution rights in ARP and APL and the ability to manage them. If ARP’s or APL’s general partner is not fully reimbursed or indemnified for obligations and liabilities it incurs in managing the business and affairs of ARP or APL, their value, and therefore the value of ATLS’ common units, could decline. If in the future ATLS ceases to manage and control ARP or APL through the ownership of its general partner interests, they may be deemed to be an investment company. Climate change legislation or regulations restricting emissions of greenhouse gases (“GHGs”) could result in increased operating costs and reduced demand for ARP or APL’s services.
MLP AND REIT COMPANY RISKS
Monthly Statistical Review Member NYSE, SPIC June 2015, Page 65
BKEP Company Risks BKEP may not have sufficient cash from operations following the establishment of cash reserves and payment of fees and expenses, including cost reimbursements to the General Partner, to enable them to make cash distributions to holders of their units at the current distribution rate. BKEP’s cash available for distributions to unitholders could be negatively impacted if they are unable to extend existing storage contracts or enter into new storage contracts at the Cushing terminal. BKEP depends on certain key customers for a portion of its revenues and are exposed to credit risks of these customers. The loss of or material nonpayment or nonperformance by any of these key customers could adversely affect cash flow and results of operations. BKEP is exposed to the credit risks of its third-party customers in the ordinary course of gathering activities. Any material nonpayment or nonperformance by third-party customers could reduce BKEPs ability to make distributions to its unitholders. The amount of cash BKEP has available for distribution to holders of its units depends primarily on BKEP’s cash flow and not solely on earnings reflected in its financial statements. Consequently, even if BKEP is profitable and is otherwise able to pay distributions, they may not be able to make cash distributions to holders of units. BKEP’s debt levels under the credit agreement may limit their ability to make distributions and flexibility in obtaining additional financing and in pursuing other business opportunities. BKEP may not be able to raise sufficient capital to grow their business. If BKEP borrows funds to make any permitted quarterly distributions, the ability to pursue acquisitions and other business opportunities may be limited and BKEP’s operations may be materially and adversely affected. BKEP is indirectly exposed to commodity price volatility. BKEP’s revenues from third-party customers are generated under contracts that must be renegotiated periodically and that allow the customer to reduce or suspend performance in some circumstances, which could cause revenues from those contracts to decline and reduce the ability to make distributions to BKEP’s unitholders. Certain of BKEP’s asphalt services contracts have short terms, and certain leases relating to the asphalt operations may be terminated upon short notice. BKEP is not fully insured against all risks incident to its business and could incur substantial liabilities as a result. A significant decrease in demand for crude oil and/or finished asphalt products in the areas served by BKEP storage facilities and pipelines could reduce the ability to make distributions to BKEP’s unitholders. A material decrease in the production of crude oil from the oil fields served by BKEP pipelines could materially reduce the ability to make distributions to BKEP’s unitholders. A material decrease in the production of liquid asphalt cement could materially reduce BKEP’s ability to make distributions to unitholders. BKEP faces intense competition in gathering, transportation, terminalling and storage activities. Competition from other providers of crude oil gathering, transportation, terminalling and storage services that are able to supply BKEP’s customers with those services at a lower price could reduce BKEP’s ability to make distributions to its unitholders. Some of BKEP’s pipeline systems are dependent upon interconnections with other crude oil pipelines to reach end markets. If BKEP is unable to make acquisitions on economically acceptable terms, BKEP’s future growth may be limited.

MLP AND REIT COMPANY RISKS
Monthly Statistical Review Member NYSE, SPIC June 2015, Page 66
If BKEP acquires assets that are distinct and separate from existing terminalling, storage, gathering and transportation operations, it could subject them to additional business and operating risks. Expanding BKEP’s business by constructing new assets subjects them to risks that projects may not be completed on schedule and that the costs associated with projects may exceed their expectations, which could cause the cash available for distribution to BKEP’s unitholders to be less than anticipated. BKEP may incur significant costs and liabilities as a result of pipeline integrity management program testing and any necessary pipeline repair, or preventative or remedial measures, which could have a material adverse effect on BKEP’s results of operations. BKEP may be subject to significant costs related to environmental investigations and/or remediation activities at its asphalt facilities. BKEP’s operations are subject to environmental and worker safety laws and regulations that may expose them to significant costs and liabilities. Failure to comply with these laws and regulations could adversely affect the ability to make distributions to BKEP’s unitholders. Adoption of legislation and regulatory measures targeting greenhouse gas (GHG) emissions could affect BKEP’s operations, expose them to significant costs and liabilities, and reduce demand for the products they transport. BKEP’s business involves many hazards and operational risks, including adverse weather conditions, which could cause them to incur substantial liabilities. BKEP does not own all of the land on which BKEP’s pipelines and facilities are located, which could disrupt their operations. BKEP could experience increased severity or frequency of accidents and other claims. Changes in trucking regulations may increase BKEP’s costs and negatively impact the results of operations. Terrorist or cyber-attacks and threats, escalation of military activity in response to these attacks or acts of war could have a material adverse effect on BKEP’s business, financial condition or results of operations. Vitol and Charlesbank control BKEP’s General Partner, which has sole responsibility for conducting BKEP business and managing their operations. BKEP’s General Partner has conflicts of interest with them and limited fiduciary duties, which may permit it to favor its own interests to the detriment of BKEP’s unitholders. BKEP’s partnership agreement limits their General Partner’s fiduciary duties to holders of BKEP’s units and restricts the remedies available to holders of their units for actions taken by BKEP’s General Partner that might otherwise constitute breaches of fiduciary duty. Vitol and Charlesbank may compete with BKEP, which could adversely affect BKEP’s existing business and limit their ability to acquire additional assets or businesses. Cost reimbursements due to BKEP’s General Partner and its affiliates for services provided, which are determined by BKEP’s General Partner, may be substantial and will reduce their cash available for distribution to unitholders.

MLP AND REIT COMPANY RISKS
Monthly Statistical Review Member NYSE, SPIC June 2015, Page 67
COR Company Risks
Any of the following risks could materially and adversely affect our business, results of operations or financial condition. The risks and uncertainties described below are those that we currently believe may materially affect our company. Additional risks and uncertainties of which we are unaware or that we currently deem immaterial also may become important factors that affect our company.
Global economic conditions could adversely affect our liquidity and financial condition.
General economic conditions and the cost and availability of capital may be adversely affected in some or all of the markets in which we own properties and conduct our operations. Turbulence in the U.S., European and other international financial markets and economies may adversely affect our ability, and the ability of our tenants, to replace or renew maturing liabilities on a timely basis, access the capital markets to meet liquidity and capital expenditure requirements and may result in adverse effects on our, and our tenants', financial condition and results of operations.
In addition, our access to funds under our revolving credit facility and other lines of credit we may enter into depend on the ability of the lenders that are parties to such facilities to meet their funding commitments to us. We cannot assure you that long-term disruptions in the global economy and the return of tighter credit conditions among, and potential failures or nationalizations of, third party financial institutions as a result of such disruptions will not have an adverse effect on our lenders. If our lenders are not able to meet their funding commitments to us, our business, results of operation, cash flows and financial condition could be adversely affected.
If we do not have sufficient cash flow to continue operating our business and are unable to borrow additional funds, access our existing lines of credit or raise equity or debt capital, we may need to find alternative ways to increase our liquidity. Such alternatives may include, without limitation, curtailing development activity, disposing of one or more of our properties possibly on disadvantageous terms or entering into or renewing leases on less favorable terms than we otherwise would.

MLP AND REIT COMPANY RISKS
Monthly Statistical Review Member NYSE, SPIC June 2015, Page 68
CAPL Company Risks
We may not have sufficient cash from operations to enable us to pay the minimum quarterly distribution following establishment of cash reserves and payment of fees and expenses.
We may not have sufficient cash each quarter to pay the minimum quarterly distribution of at least $0.4375 per unit, or $1.75 per unit per year. The minimum quarterly distribution is an amount that must be paid to holders of our common units, including any arrearages, before any distributions may be made to holders of our subordinated units, to the extent that any distributions are made.
The amount of cash we can distribute on our units principally depends upon the amount of cash we generate from our operations, which will fluctuate from quarter to quarter based on, among other things: Demand for motor fuel products in the markets we serve, including seasonal fluctuations, and the margin per gallon we earn selling and distributing motor fuel; The industries in which we operate are subject to seasonal trends, which may cause our operating costs to fluctuate, affecting our earnings; Severe storms could adversely affect our business by damaging our suppliers’ operations or lowering our sales volumes; Competition from other companies that sell motor fuel products or operate convenience stores in our targeted market areas; The inability to identify and acquire suitable sites or to negotiate acceptable leases for such sites; The potential inability to obtain adequate financing to fund our expansion; The level of our operating costs, including payments to CST; Prevailing economic conditions Regulatory actions affecting the supply of or demand for motor fuel, our operations, our existing contracts or our operating costs; and Volatility of prices for motor fuel. In addition, the actual amount of cash we will have available for distribution will depend on other factors such as: The level of capital expenditures we make; The restrictions contained in our credit agreements; Our debt service requirements; The cost of acquisitions; Fluctuations in our working capital needs; Our ability to borrow under our credit agreements to make distributions to our unitholders; and
The amount, if any, of cash reserves established by our General Partner in its discretion. We do not have a legal obligation to pay quarterly distributions at our minimum quarterly distribution rate or at any other rate. There is no guarantee that we will distribute quarterly cash distributions to our unitholders in any quarter. See “Item 5. Market for Registrant’s Common Equity, Related Stockholder Matters and Issuer Purchases of Equity Securities—Cash Distribution Policy”.
The amount of cash we have available for distribution to unitholders depends primarily on our cash flow rather than on our profitability, which may prevent us from making cash distributions, even during periods when we record net income.
The amount of cash we have available for distribution depends primarily on our cash flow, and not solely on profitability, which will be affected by non-cash items. As a result, we may make cash distributions during periods when we record losses for financial accounting purposes and may not make cash distributions during periods when we record net income for financial accounting purposes.

MLP AND REIT COMPANY RISKS
Monthly Statistical Review Member NYSE, SPIC June 2015, Page 69
CSAL Company Risks The Spin-Off and the related transactions pose a number of risks, including: We may be unable to achieve some or all of the benefits that we expect to achieve from the Spin-Off; If the Spin-Off were to fail to qualify as a tax-free transaction for U.S. federal income tax purposes, Windstream, Windstream Holdings’ shareholders and we could be subject to significant tax liabilities and, in certain circumstances, we could be required to indemnify Windstream for material taxes pursuant to indemnification obligations under the Tax Matters Agreement that we will enter into with Windstream; Our agreements with Windstream may not reflect terms that would have resulted from negotiations with unaffiliated third parties; The historical and pro forma financial information included in this information statement may not be a reliable indicator of future results; The Spin-Off could give rise to disputes or other unfavorable effects, which could materially and adversely affect our business, financial position or results of operation; If we do not qualify as a REIT, or fail to remain qualified as a REIT, we will be subject to U.S. federal income tax as a regular corporation and could face a substantial tax liability, which would reduce the amount of cash available for distribution to our shareholders; Complying with the REIT requirements may cause us to forego otherwise attractive acquisition opportunities or liquidate otherwise attractive investments; We will be dependent on Windstream Holdings to make payments to us under the Master Lease, and an event that materially and adversely affects Windstream’s business, financial position or results of operations could materially and adversely affect our business, financial position or results of operation; Our level of indebtedness could materially and adversely affect our financial position, including reducing funds available for other business purposes and reducing operational flexibility, and we may have future capital needs and may not be able to obtain additional financing on acceptable terms; Covenants in our debt agreements may limit our operational flexibility, and a covenant breach or default could materially and adversely affect our business, financial position or results of operations; and Our business is subject to government regulations and changes in current or future laws or regulations could restrict our ability to operate our business in the manner currently contemplated. These and other risks related to the Spin-Off and our business are discussed in greater detail under the heading “Risk Factors” in this information statement. You should read and consider all of these risks carefully.
MLP AND REIT COMPANY RISKS
Monthly Statistical Review Member NYSE, SPIC June 2015, Page 70
JPEP Company Risks In order to pay the minimum quarterly distribution of $0.3250 per unit per quarter, or $1.30 per unit on an annualized basis, we require available cash of approximately $12.0 million per quarter, or $48.0 million per year. We may not have sufficient available cash from operating surplus each quarter to enable us to pay the minimum quarterly distribution. The amount of cash we can distribute on our units principally depends upon the amount of cash we generate from our operations, which will fluctuate from quarter to quarter based on, among other things: · the price of, and the demand for, crude oil, refined products and NGLs in the markets we serve; · the volumes of crude oil that we gather, transport and store, the throughput volumes at our refined products terminals and our NGL sales volumes; · the fees we receive for the crude oil, refined products and NGL volumes we handle; · pressures from our competitors, some of which may have significantly greater resources than us; · the cost of propane that we buy for resale, including due to disruptions in its supply, and whether we are able to pass along cost increases to our customers; · competitive pressures from other energy sources such as natural gas, which could reduce existing demand for propane; · the risk of contract cancellation, non-renewal or failure to perform by our customers, and our inability to replace such contracts and/or customers; · leaks or releases of hydrocarbons into the environment that result in significant costs and liabilities; · the level of our operating, maintenance and general and administrative expenses; and · regulatory action affecting our existing contracts, our operating costs or our operating flexibility. In addition, the actual amount of cash we will have available for distribution will depend on other factors, some of which are beyond our control, including: · the level of capital expenditures we make; · our cost of acquisitions, if any; · our debt service requirements and other liabilities; · expenses that our general partner incurs on our behalf and are reimbursed by us, which expenses are not subject to any caps or other limits pursuant to our partnership agreement; · fluctuations in our working capital needs; · our ability to borrow funds and access the capital markets; · restrictions contained in our revolving credit facility and other debt agreements; · the amount of cash reserves established by our general partner; and · other business risks affecting our cash levels

MLP AND REIT COMPANY RISKS
Monthly Statistical Review Member NYSE, SPIC June 2015, Page 71
MMLP Company Risks MMLP may not have sufficient cash after the establishment of cash reserves and payment of its general partner's expenses to enable MMLP to pay the minimum quarterly distribution each quarter. Restrictions in MMLP’s credit facility may prevent them from making distributions to unitholders. If MMLP does not have sufficient capital resources for acquisitions or opportunities for expansion, growth will be limited. MMLP may not be able to obtain funding on acceptable terms or at all because of the deterioration of the credit and capital markets. This may hinder or prevent MMLP from meeting their future capital needs. MMLP is exposed to counterparty risk in its credit facility and related interest rate protection agreements. The impacts of climate-related initiatives at the international, federal and state levels remain uncertain at this time. MMLP’s recent and future acquisitions may not be successful, may substantially increase MMLP’s indebtedness and contingent liabilities and may create integration difficulties. Adverse weather conditions, including droughts, hurricanes, tropical storms and other severe weather, could reduce MMLP’s results of operations and ability to make distributions to unitholders. If MMLP incurs material liabilities that are not fully covered by insurance, such as liabilities resulting from accidents on rivers or at sea, spills, fires or explosions, the results of operations and ability to make distributions to unitholders could be adversely affected. The price volatility of petroleum products and by-products could reduce MMlp’s liquidity and results of operations and ability to make distributions to unitholders. Increasing energy prices could adversely affect MMLP’s results of operations. Increased competition from alternative natural gas transportation and storage options and alternative fuel sources could have a significant financial impact on MMLP. Demand for MMLP’s terminalling and storage services is substantially dependent on the level of offshore oil and gas exploration, development and production activity. MMLP’s NGL and sulfur-based fertilizer products are subject to seasonal demand and could cause revenues to vary. The highly competitive nature of MMLP’s industry could adversely affect results of operations and ability to make distributions to unitholders. MMLP’s business is subject to compliance with environmental laws and regulations that may expose them to significant costs and liabilities and adversely affect MMLP’s results of operations and ability to make distributions to unitholders. The loss or insufficient attention of key personnel could negatively impact MMLP’s results of operations and ability to make distributions to unitholders. MMLP’s loss of significant commercial relationships with Martin Resource Management could adversely impact the results of operations and ability to make distributions to unitholders. MMLP’s business would be adversely affected if operations at MMLP’s transportation, terminalling and storage and distribution facilities experienced significant interruptions. MMLP’s business would also be adversely affected if the operations of its customers and suppliers experienced significant interruptions. Political, regulatory and economic factors may significantly affect MMLP’s operations, the manner in which they conduct business and slow the rate of growth.

MLP AND REIT COMPANY RISKS
Monthly Statistical Review Member NYSE, SPIC June 2015, Page 72
MMLP’s marine transportation business would be adversely affected if they do not satisfy the requirements of the Jones Act or if the Jones Act were modified or eliminated. MMLP’s marine transportation business would be adversely affected if the U.S. Government purchases or requisitions any of MMLP’s vessels under the Merchant Marine Act. Regulations affecting the domestic tank vessel industry may limit MMLP’s ability to do business, increase costs and adversely impact results of operations and ability to make distributions to unitholders. MMLP’s interest rate swap activities may have a material adverse effect on MMLP’s earnings, profitability, liquidity, cash flows and financial condition. The industry in which MMLP operats is highly competitive, and increased competitive pressure could adversely affect business and operating results.

MLP AND REIT COMPANY RISKS
Monthly Statistical Review Member NYSE, SPIC June 2015, Page 73
MWE Company Risks MWE’s substantial debt and other financial obligations could impair MWE’s financial condition, results of operations and cash flow, and MWE’s ability to fulfill its debt obligations. Global economic conditions may have adverse impacts on MWE’s business and financial condition. MWE may not have sufficient cash after the establishment of cash reserves and payment of its expenses to enable MWE to pay distributions at the current level. MWE’s profitability and cash flows are affected by the volatility of NGL product and natural gas prices. Relative changes in NGL product and natural gas prices may adversely impact MWE’s results due to frac spread, natural gas and NGL exposure. MWE’s commodity derivative activities may reduce its earnings, profitability and cash flows. MWE conducts risk management activities but may not accurately predict future commodity price fluctuations and, therefore, expose MWE to financial risks and reduce the opportunity to benefit from price increases. The enactment of the Dodd-Frank Act and promulgation of regulations thereunder could have an adverse impact on MWE’s ability to manage risks associated with our business. A significant decrease in natural gas production in MWE areas of operation would reduce the ability to make distributions to MWE’s unitholders. MWE depends on third parties for the natural gas and refinery off-gas they process, and the NGLs fractionated at MWE facilities, and a reduction in these quantities could reduce revenues and cash flow. Growing MWE’s business by constructing new pipelines and processing and treating facilities subjects MWE to construction risks and risks that natural gas or NGL supplies may not be available upon completion of the facilities. The fees charged to third parties under MWE’s gathering, processing, transmission, transportation, fractionation and storage agreements may not escalate sufficiently to cover increases in costs, or the agreements may not be renewed or may be suspended in some circumstances. MWE is exposed to the credit risks of key customers and derivative counterparties, and any material nonpayment or nonperformance by MWE’s key customers or derivative counterparties could reduce the ability to make distributions to MWE unitholders. MWE may not be able to retain existing customers, or acquire new customers, which would reduce revenues and limit MWE’s future profitability. Transportation on certain MWE pipelines may be subject to federal or state rate and service regulation, and the imposition and/or cost of compliance with such regulation could adversely affect the operations and cash flows available for distribution to MWE’s unitholders. Some of MWE’s natural gas, NGL and crude oil transportation operations are subject to FERC's rate-making policies that could have an adverse impact on the ability to establish rates that would allow MWE to recover the full cost of operating it’s pipelines including a reasonable return. If MWE is unable to obtain new rights-of-way or other property rights, or the cost of renewing existing rights-of-way or property rights increases, then they may be unable to fully execute growth strategy, which may adversely affect MWE’s operations and cash flows available for distribution to unitholders. MWE is indemnified for liabilities arising from an ongoing remediation of property on which certain of MWE’s facilities are located and the results of operation and the ability to make distributions to MWE’s unitholders could be adversely affected if an indemnifying party fails to perform its indemnification obligations. MWE’s business is subject to laws and regulations with respect to environmental, occupational safety and health, nuisance, zoning, land use and other regulatory matters, and the violation of, or the cost of compliance with, such laws and regulations could adversely affect MWE’s operations and cash flows available for distribution to unitholders.

MLP AND REIT COMPANY RISKS
Monthly Statistical Review Member NYSE, SPIC June 2015, Page 74
NSLP Company Risks NSLP may not have sufficient cash to pay the minimum quarterly distribution on its common units following the establishment of cash reserves and payment of fees and expenses, including payments to the general partner and its affiliates. NSLP relies on New Source Energy and New Dominion, NSLP’s contract operator, to execute its drilling program. If either New Source Energy or New Dominion fails to perform or inadequately performs, NSLP’s operations will be adversely affected and the costs could increase or reserves may not be developed, reducing NSLP’s future levels of production and cash flow from operations, which could affect NSLP’s ability to make cash distributions to unitholders. A decline in oil, natural gas and NGL prices may adversely affect NSLP’s business, financial condition or results of operations and ability to meet the capital expenditure obligations and financial commitments. Unless NSLP replaces the oil and natural gas reserves produced, NSLP’s revenues and production will decline, which would adversely affect the cash flow from operations and ability to make distributions to NSLP’s unitholders. NSLP does not currently operate any of its drilling locations, and therefore, will not be able to control the timing of exploration or development efforts, associated costs, or the rate of production of assets. The Golden Lane Participation Agreement contains terms that may be disadvantageous to NSLP. If NSLP’s contract operator fails to perform its obligations under its agreements with NSLP, becomes subject to bankruptcy proceedings or otherwise proves to be an undesirable operator, NSLP’s business could be adversely affected. Properties that NSLP acquires may not produce oil or natural gas as projected, and may be unable to determine reserve potential, identify liabilities associated with the properties or obtain protection from sellers against them, which could cause NSLP to incur losses. All of NSLP’s producing properties and interests are currently located in the Hunton Formation in east-central Oklahoma, making them vulnerable to risks associated with operating in one primary geographic area. NSLP is subject to significant risks associated with the drilling and completion of wells in which they participate. NSLP’s reliance on specialized processes creates uncertainties that could adversely affect the results of operations and financial condition. NSLP depends on its key management personnel, and the loss of any of these individuals could adversely affect business. NSLP relies on our relationships with affiliates to access infrastructure that is critical to the development of NSLP’s assets. Adequate infrastructure may not be available at an economic rate. Access to saltwater disposal infrastructure may not be sufficient to handle all saltwater produced, and more stringent environmental regulations may impact the New Source Group’s ability to handle saltwater. NSLP’s ability to sell its production and/or receive market prices for its production may be adversely affected by lack of transportation, capacity constraints and interruptions. NSLP’s identified drilling locations are scheduled to be developed over several years, making them susceptible to uncertainties that could materially alter the occurrence or timing of their drilling. NSLP’s estimated proved reserves are based on many assumptions that may turn out to be inaccurate. Any significant inaccuracies in these reserve estimates or underlying assumptions will materially affect the quantities and present value of its reserves. A substantial portion of NSLP’s estimated proved reserves is undeveloped and may not ultimately be developed or become commercially productive, which could have a material adverse effect on NSLP’s future oil and natural gas reserves and production and, therefore, future cash flow and income. The present value of future net revenues from NSLP’s proved reserves will not necessarily be the same as the current market value of its estimated oil and natural gas reserves.

MLP AND REIT COMPANY RISKS
Monthly Statistical Review Member NYSE, SPIC June 2015, Page 75
NSLP’s development and acquisition projects require substantial capital expenditures. NSLP may be unable to obtain needed capital or financing on satisfactory terms, which could lead to a decline in NSLP’s oil and natural gas reserves. Increased costs of capital could adversely affect its business. If oil, natural gas and NGL prices decrease, NSLP may be required to take write-downs of the carrying values of its oil and natural gas properties. NSLP’s insurance policies might be inadequate to cover its liabilities. Competition in the oil and natural gas industry is intense, and many of NSLP’s competitors have greater resources than they do. NSLP’s commodity derivative arrangements may be ineffective in managing commodity price risk and could result in financial losses or could reduce NSLP’s income, which may adversely impact its ability to pay distributions to unitholders. The enactment of derivatives legislation and regulation could have an adverse effect on NSLP’s ability to use derivative instruments to reduce the negative effect of commodity price, interest rate and other risks associated with NSLP’s business. NSLP’s production of oil and natural gas is sold to a limited number of customers and the credit default of one of these customers could have a temporary adverse effect on NSLP. Increases in interest rates could adversely impact NSLP’s unit price and ability to issue additional equity and incur debt. Changes in the legal and regulatory environment governing the oil and natural gas industry, particularly changes in the current Oklahoma forced pooling system, could have a material adverse effect on NSLP’s business. Certain federal income tax deductions currently available with respect to oil and natural gas exploration and development may be eliminated as a result of future legislation. The New Source Group’s operations are subject to worker health and safety as well as environmental laws and regulations which may expose the New Source Group and NSLP to significant costs and liabilities. Climate change laws and regulations restricting emissions of GHGs could result in increased operating costs and reduced demand for the oil and natural gas that the New Source Group produces for NSLP, while the physical effects of climate change could disrupt the production and result in significant costs in preparing for or responding to those effects.
MLP AND REIT COMPANY RISKS
Monthly Statistical Review Member NYSE, SPIC June 2015, Page 76
PAA Company Risks PAA may not be able to fully implement or capitalize upon planned growth projects. PAA’s results of operations are influenced by the overall forward market for crude oil, and certain market structures or the absence of pricing volatility may adversely impact PAA’s results. A natural disaster, catastrophe, terrorist attack or other event, including attacks on PAA’s electronic and computer systems, could interrupt operations and/or result in severe personal injury, property damage and environmental damage, which could have a material adverse effect on PAA’s financial position, results of operations and cash flows. If PAA does not make acquisitions or if they make acquisitions that fail to perform as anticipated, future growth may be limited. PAA’s acquisition strategy involves risks that may adversely affect its business. PAA’s growth strategy requires access to new capital. Tightened capital markets or other factors that increase PAA’s cost of capital could impair its ability to grow. Loss of PAA’s investment grade credit rating or the ability to receive open credit could negatively affect its ability to purchase crude oil, natural gas and NGL supplies or to capitalize on market opportunities. PAA is exposed to the credit risk of its customers in the ordinary course of business activities. PAA’s risk policies cannot eliminate all risks. In addition, any non-compliance with PAA’s risk policies could result in significant financial losses. PAA’s operations are also subject to laws and regulations relating to protection of the environment and wildlife, operational safety, climate change and related matters that may expose PAA to significant costs and liabilities. PAA’s profitability depends on the volume of crude oil, refined product, natural gas and NGL shipped, processed, purchased, stored, fractionated and/or gathered at or through the use of PAA’s facilities, which can be negatively impacted by a variety of factors outside of PAA’s control. Fluctuations in demand, which can be caused by a variety of factors outside of PAA’s control, can negatively affect operating results. PAA’s assets are subject to federal, state and provincial regulation. Rate regulation or a successful challenge to the rates charged on PAA’s U.S. and Canadian pipeline systems may reduce the amount of cash PAA generates. Some of PAA’s operations cross the U.S./Canada border and are subject to cross-border regulation. PAA sales of oil, natural gas, NGL and other energy commodities, and related transportation and hedging activities, expose them to potential regulatory risks. The adoption and implementation of new statutory and regulatory requirements for derivative transactions could have an adverse impact on PAA’s ability to hedge risks associated with its business and increase the working capital requirements to conduct these activities. Legislation and regulatory initiatives relating to hydraulic fracturing could reduce domestic production of crude oil and natural gas. PAA may not be able to compete effectively in the transportation, facilities and supply and logistics activities, and PAA’s business is subject to the risk of a capacity overbuild of midstream energy infrastructure in the areas where PAA operates. PAA may in the future encounter increased costs related to, and lack of availability of, insurance. The terms of PAA’s indebtedness may limit its ability to borrow additional funds or capitalize on business opportunities. In addition, PAA’s future debt level may limit its future financial and operating flexibility. Increases in interest rates could adversely affect PAA’s business and the trading price of its units. Changes in currency exchange rates could adversely affect PAA’s operating results.

MLP AND REIT COMPANY RISKS
Monthly Statistical Review Member NYSE, SPIC June 2015, Page 77
An impairment of goodwill or intangibles could reduce PAA’s earnings. PAA’s natural gas storage facilities may not be able to deliver as anticipated, which could prevent PAA from meeting the contractual obligations and cause PAA to incur significant costs. Marine transportation of crude oil has inherent operating risks. Maritime claimants could arrest the vessels carrying PAA’s cargos. PAA is dependent on use of third-party assets for certain of its operations. Non-utilization of certain assets, such as PAA’s leased rail cars, could significantly reduce its profitability due fixed costs incurred to obtain the right to use such assets.
MLP AND REIT COMPANY RISKS
Monthly Statistical Review Member NYSE, SPIC June 2015, Page 78
PAGP Company Risks Our cash flow will be entirely dependent upon the ability of PAA to make cash distributions to AAP, and the ability of AAP to make cash distributions to us. The IDRs AAP is entitled to receive may be limited or modified without the consent of our shareholders, which may reduce cash distributions to you. Any modification to the IDRs may be based on assumptions that may not be realized, which may reduce cash distributions to you. A reduction in PAA's distributions will disproportionately affect the amount of cash distributions to which AAP is currently entitled. PAA may issue additional limited partner interests or other equity securities, which may increase the risk that PAA will not have sufficient available cash to maintain or increase its cash distribution level. If distributions on our Class A shares are not paid with respect to any fiscal quarter, including those at the anticipated initial distribution rate, our Class A shareholders will not be entitled to receive that quarter's payments in the future. Our cash distribution policy and PAA's cash distribution policy limit our ability to grow. Our rate of growth may be reduced to the extent we purchase equity interests from PAA, which will reduce the relative percentage of the cash we receive from the IDRs. Restrictions in AAP's credit facility could limit its ability to make distributions to us, thereby limiting our ability to make distributions to our Class A shareholders. Substantially all of AAP's assets, including the IDRs and its indirect 2% general partner interest in PAA, are pledged under AAP's credit facility. Our shareholders will not elect or have the power to remove our general partner and until certain conditions are met will not vote on our general partner's directors. Upon completion of this offering, the Existing Owners will own a sufficient number of shares to allow them to prevent the removal of our general partner. You will experience immediate and substantial dilution of $ per Class A share in the net tangible book value of your Class A shares. Our general partner may cause us to issue additional Class A shares or other equity securities, including equity securities that are senior to our Class A shares, or cause AAP to issue additional securities, in each case without your approval, which may adversely affect you. The ownership of our general partner may be transferred to a third party who could replace our current management team without shareholder consent. If PAA's unitholders remove PAA GP, AAP may be required to sell or exchange its indirect general partner interest and its IDRs and we would lose the ability to manage and control PAA. You may not have limited liability if a court finds that shareholder action constitutes control of our business. If in the future we cease to manage and control PAA, we may be deemed to be an investment company under the Investment Company Act of 1940. Our partnership agreement restricts the rights of shareholders owning 20% or more of our shares. If PAA's general partner, which is owned by AAP, is not fully reimbursed or indemnified for obligations and liabilities it incurs in managing the business and affairs of PAA, its value, and, therefore, the value of our Class A shares, could decline. The price of our Class A shares may be volatile, and a trading market that will provide you with adequate liquidity may not develop. Our Class A shares and PAA's common units may not trade in relation or proportion to one another. An increase in interest rates may cause the market price of our shares to decline. Future sales of our Class A shares in the public market could reduce our Class A share price, and any additional capital raised by us through the sale of equity or convertible securities may dilute your ownership in us. The underwriters of this offering may waive or release parties to the lock-up agreements entered into in connection with this offering, which could adversely affect the price of our Class A shares.

MLP AND REIT COMPANY RISKS
Monthly Statistical Review Member NYSE, SPIC June 2015, Page 79
The Existing Owners hold a majority of the combined voting power of our Class A and Class B shares. If we or PAA fails to establish and maintain effective internal control over financial reporting, our ability to accurately report our financial results could be adversely affected. If we or PAA fails to develop or maintain an effective system of internal controls, we may not be able to accurately report our financial results or prevent fraud. As a result, our shareholders could lose confidence in our financial reporting, which would harm our business and the trading price of our Class A shares. A valuation allowance on our deferred tax asset could reduce our earnings. The NYSE does not require a limited partnership like us to comply with certain of its corporate governance requirements. Conflicts of interest may arise as a result of our organizational structure and the relationships among us, PAA, our respective general partners, the Existing Owners and affiliated entities. The duties of our general partner's officers and directors may conflict with those of GP LLC who act on behalf of PAA GP and our general partner's officers and directors may face conflicts of interest in the allocation of administrative time between our business and PAA's business. Our partnership agreement defines our general partner's duties to us and contains provisions that reduce the remedies available to our shareholders for actions that might otherwise be challenged as breaches of fiduciary or other duties under state law. By purchasing our Class A shares, each Class A shareholder automatically agrees to be bound by the provisions of our partnership agreement. The Existing Owners may have interests that conflict with holders of our Class A shares. If we are presented with business opportunities, PAA will have the first right to pursue such opportunities. Our general partner's affiliates and the Existing Owners may compete with us. Our general partner has a call right that may require you to sell your Class A shares at an undesirable time or price.

MLP AND REIT COMPANY RISKS
Monthly Statistical Review Member NYSE, SPIC June 2015, Page 80
QTS Company Risks
Set forth below are the risks that we believe are material to our stockholders. You should carefully consider the following risks in evaluating our Company and our business. If any of the risks discussed in this Form 10-K were to occur, our business, prospects, financial condition, liquidity, funds from operations and results of operations and our ability to service our debt and make distributions to our stockholders could be materially and adversely affected, which we refer to herein collectively as a “material adverse effect on us,” the market price of our common stock could decline significantly and you could lose all or part of your investment. Some statements in this Form 10-K, including statements in the following risk factors, constitute forward-looking statements. Please refer to the section entitled “Special Note Regarding Forward-Looking Statements” at the beginning of this Form 10-K.
Risks Related to Our Business and Operations
Because we are focused on the ownership, operation and redevelopment of data centers, any decrease in the demand for data center space or managed services could have a material adverse effect on us.
Because our portfolio of properties consists entirely of data centers, or properties to be converted to data centers, we are subject to risks inherent in investments in a single industry. Adverse developments in the data center market or in the industries in which our customers operate could lead to a decrease in the demand for data center space or managed services, which could have a greater material adverse effect on us than if we owned a more diversified real estate portfolio. These adverse developments could include: a decline in the technology industry, such as a decrease in the use of mobile or web-based commerce, industry slowdowns, business layoffs or downsizing, relocations of businesses, increased costs of complying with existing or new government regulations and other factors; a slowdown in the growth of the Internet generally as a medium for commerce and communication; a downturn in the market for data center space generally such as oversupply of or reduced demand for space; and the rapid development of new technologies or the adoption of new industry standards that render our or our customers’ current products and services obsolete or unmarketable and, in the case of our customers, that contribute to a downturn in their businesses, increasing the likelihood of a default under their leases or that they become insolvent or file for bankruptcy protection. To the extent that any of these or other adverse conditions occur, they are likely to impact market rents for, and cash flows from, our data center space, which could have a material adverse effect on us.
Our data center infrastructure may become obsolete or unmarketable and we may not be able to upgrade our power, cooling, security or connectivity systems cost-effectively or at all.
The markets for the data centers we own and operate, as well as certain of the industries in which our customers operate, are characterized by rapidly changing technology, evolving industry standards, frequent new service introductions, shifting distribution channels and changing customer demands. As a result, the infrastructure at our data centers may become obsolete or unmarketable due to demand for new processes and/or technologies, including, without limitation: (i) new processes to deliver power to, or eliminate heat from, computer systems; (ii) customer demand for additional redundancy capacity; or (iii) new technology that permits lower levels of critical load and heat removal than our data centers are currently designed to provide. In addition, the systems that connect our data centers to the Internet and other external networks may become outdated, including with respect to latency, reliability and diversity of connectivity. When customers demand new processes or technologies, we may not be able to upgrade our data centers on a cost effective basis, or at all, due to, among other things, increased expenses to us that cannot be passed on to customers or insufficient revenue to fund the necessary capital expenditures. The obsolescence of our power and cooling systems and/or our inability to upgrade our data centers, including associated connectivity, could reduce revenue at our data centers and could have a material adverse effect on us. Furthermore, potential future regulations that apply to industries we serve may require customers in those industries to seek specific requirements from their data centers that we are unable to provide. These may include physical security regulations applicable to the defense industry and government.

MLP AND REIT COMPANY RISKS
Monthly Statistical Review Member NYSE, SPIC June 2015, Page 81
SUN Company Risks Susser is our largest customer, and we are dependent on Susser for a significant majority of our revenues. Therefore, we are indirectly subject to the business risks of Susser. If Susser changes its business strategy, is unable to satisfy its obligations under our various commercial agreements for any reason, or significantly reduces the volume of motor fuel it purchases under the Susser Distribution Contract, our revenues will decline and our financial condition, results of operations, cash flows and ability to make distributions to our unitholders will be adversely affected.
For the year ended December 31, 2014, Susser accounted for approximately 60% of our revenues, 20% of our gross profit and 60% of our motor fuel volumes sold. We are the exclusive distributor of motor fuel to Susser’s existing Stripes® convenience stores and independently operated consignment locations pursuant to our long-term, fee based fuel distribution agreement with Susser (the “Susser Distribution Contract”). We are subject to the risk of nonpayment or nonperformance by Susser under the Susser Distribution Contract. Furthermore, the Susser Distribution Contract does not impose any minimum volume obligations on Susser and Susser will have a limited ability to remove Stripes® convenience stores from the Susser Distribution Contract. If Susser changes its business strategy or significantly reduces the volume of motor fuel it purchases for its Stripes® convenience stores and independently operated consignment locations, our cash flows will be adversely impacted. Any event, whether in our areas of operation or otherwise, that materially and adversely affects Susser's financial condition, results of operation or cash flows may adversely affect our ability to sustain or increase cash distributions to our unitholders. Finally, we have no control over Susser, our largest source of revenue and our primary customer. Susser may elect to pursue a business strategy that does not favor us and our business. Our general partner and its affiliates, including Susser and ETP, have conflicts of interest with us and limited fiduciary duties and they may favor their own interests to the detriment of us and our unitholders. We may not have sufficient cash from operations following the establishment of cash reserves and payment of costs and expenses, including cost reimbursements to our general partner, to enable us to pay the minimum quarterly distribution to our unitholders.
We may not have sufficient cash each quarter to pay the full amount of our minimum quarterly distribution of $0.4375 per unit, or $1.75 per unit per year, which will require us to have available cash of approximately $15.3 million per quarter, or $61.3 million per year, based on the number of common and subordinated units outstanding as of December 31, 2014. The amount of cash we can distribute on our common and subordinated units principally depends upon the amount of cash we generate from our operations, which will fluctuate from quarter to quarter based on a number of factors, some of which are beyond our control, including, among other things: Our financial condition and results of operations are influenced by changes in the prices of motor fuel, which may adversely impact our margins, our customers' financial condition and the availability of trade credit.
Our operating results are influenced by prices for motor fuel, pricing volatility and the market for such products. General economic and political conditions, acts of war or terrorism and instability in oil producing regions, particularly in the Middle East and South America, could significantly impact crude oil supplies and petroleum costs. Significant increases and volatility in petroleum costs could impact consumer demand for motor fuel and convenience merchandise. This volatility makes it extremely difficult to predict the impact future petroleum costs fluctuations will have on our operating results and financial condition. Our recent acquisition of MACS and Aloha increases our exposure to such volatility due to the inherently greater degree of volatility in retail, versus wholesale, motor fuel margins. Additionally, with the consummation of the MACS and Aloha acquisitions, we are now subject to dealer tank wagon pricing structures at certain locations further contributing to margin volatility. A significant change in any of these factors could materially impact both wholesale and retail fuel margins, the volume of motor fuel we distribute or sell at retail, and overall customer traffic, each of which in turn could have a material adverse effect on our business and results of operations and cash available for distribution to our unitholders.
In addition, when prices for motor fuel rise, some of our customers may have insufficient credit to purchase motor fuel from us at their historical volumes. Higher prices for motor fuel may also reduce our access to trade credit support or cause it to become more expensive. Significant decreases in wholesale motor fuel prices could also result in lower motor fuel gross margins per gallon due to the reduction in value of discounts from our suppliers. Our fuel storage terminals are subject to operational and business risks which, if occur, may adversely affect our financial condition, results of operations, cash flows and ability to make distributions to our unitholders.
MLP AND REIT COMPANY RISKS
Monthly Statistical Review Member NYSE, SPIC June 2015, Page 82
WPT Company Risks Please note that us, we and our refers to World Point Terminals, LP. Our business would be adversely affected if the operations of our customers experienced significant interruptions. In certain circumstances, the obligations of many of our key customers under their terminal services agreements may be reduced, suspended or terminated, which would adversely affect our financial condition and results of operations. Our financial results depend on the demand for the light refined products, heavy refined products, crude oil and other related services that we perform at our terminals, among other factors, and general economic downturns could result in lower demand for these products for a sustained period of time. We depend on Apex and a relatively limited number of our other customers for a significant portion of our revenues. The loss of, or material nonpayment or nonperformance by, Apex or any one or more of our other customers could adversely affect our ability to make cash distributions to you. If Apex satisfies only its minimum obligations under, or if we are unable to renew or extend, the terminaling services agreements we have with it, our ability to make distributions to our unitholders will be reduced. Apex’s or our parent’s level of indebtedness could adversely affect our ability to grow our business, our ability to make cash distributions to our unitholders and our credit ratings and profile. We are exposed to the credit risk of our customers, and any material nonpayment or nonperformance by our key customers could adversely affect our financial results and cash available for distribution. Our operations are subject to operational hazards and unforeseen interruptions, including interruptions from hurricanes, floods or severe storms, for which we may not be adequately insured. Reduced volatility in energy prices, certain market structures (including backwardated markets) or new government regulations could discourage our storage customers from holding positions in refined petroleum products or crude oil, which could adversely affect the demand for our storage services. Some of our current terminal services agreements are automatically renewing on a short-term basis, and may be terminated at the end of the current renewal term upon requisite notice. If one or more of our current terminal services agreements is terminated and we are unable to secure comparable alternative arrangements our financial condition and results of operations will be adversely affected. Competition from other terminals that are able to supply our customers with comparable storage capacity at a lower price could adversely affect our financial condition and results of operations. Our expansion of existing assets and construction of new assets may not result in revenue increases and will be subject to regulatory, environmental, political, legal and economic risks, which could adversely affect our operations and financial condition. If we are unable to make acquisitions on economically acceptable terms, our future growth would be limited, and any acquisitions we make may reduce, rather than increase, our cash generated from operations on a per unit basis. Our right of first offer to acquire Apex’s existing terminaling assets and any terminaling and ancillary assets that it may acquire or construct in the future is subject to risks and uncertainty, and ultimately we may not acquire any of those assets. Our operations are subject to federal and state laws and regulations relating to product quality specifications and we could be subject to damages based on claims brought against us by our customers or lose customers as a result of the failure of products we distribute to meet certain quality specifications. Revenues we generate from excess storage fees vary based upon the product volume handled at our terminals and the activity levels of our customers. Any short- or long-term decrease in the demand for the light refined products, heavy refined products and crude oil we handle, or any interruptions to the operations of certain of our customers, could reduce the amount of cash we generate and adversely affect our ability to make distributions to our unitholders.

MLP AND REIT COMPANY RISKS
Monthly Statistical Review Member NYSE, SPIC June 2015, Page 83
Any reduction in the capability of our customers to obtain access to barge facilities, third party pipelines or other transportation facilities, or to continue utilizing them at current costs, could cause a reduction of volumes transported through our terminals. Many of our terminal and storage assets have been in service for several decades, which could result in increased maintenance or remediation expenditures, which could adversely affect our business, results of operations, financial condition and our ability to make cash distributions to our unitholders. We may incur significant costs and liabilities in complying with environmental, health and safety laws and regulations, which are complex and frequently changing. We could incur significant costs and liabilities in responding to contamination that occurs at our facilities. Climate change legislation or regulations restricting emissions of greenhouse gases could result in increased operating and capital costs and reduced demand for our storage services. Debt we incur in the future may limit our flexibility to obtain financing and to pursue other business opportunities. Restrictions in our revolving credit facility could adversely affect our business, financial condition, results of operations, ability to make distributions to unitholders and value of our common units. Increases in interest rates could adversely impact our unit price, our ability to issue equity or incur debt for acquisitions or other purposes, and our ability to make cash distributions at our intended levels. The adoption of derivatives legislation by Congress could have an adverse impact on our customers’ ability to hedge risks associated with their business. Our executive officers and certain key personnel are critical to our business, and these officers and key personnel may not remain with us in the future. If we fail to develop or maintain an effective system of internal controls, we may not be able to report our financial results timely and accurately or prevent fraud, which would likely have a negative impact on the market price of our common units. None of the proceeds from the sale of common units by the selling unitholder in this offering will be available to fund our operations or to pay distributions. Terrorist attacks aimed at our facilities or surrounding areas could adversely affect our business. Our general partner and its affiliates, including our sponsors, have conflicts of interest with us and limited duties, and they may favor their own interests to the detriment of us and our unitholders. Our general partner intends to limit its liability regarding our obligations. Our partnership agreement requires that we distribute all of our available cash, which could limit our ability to grow and make acquisitions. Actions taken by our general partner may affect the amount of cash available for distribution to unitholders or accelerate the right to convert subordinated units. Our partnership agreement replaces our general partner’s fiduciary duties to holders of our common units with contractual standards governing its duties. Our partnership agreement restricts the remedies available to holders of our common and subordinated units for actions taken by our general partner that might otherwise constitute breaches of fiduciary duty. Our parent and other affiliates of our general partner, including Apex, may compete with us. Our sponsors, as the initial owners of our incentive distribution rights, may elect to cause us to issue common units to them in connection with a resetting of the target distribution levels related to the incentive distribution rights, without the approval of the conflicts committee of their board of directors or the holders of our common units. This could result in lower distributions to holders of our common units. Holders of our common units have limited voting rights and are not entitled to elect our general partner or its directors. Even if holders of our common units are dissatisfied, they cannot initially remove our general partner without its consent. Unitholders will experience immediate and substantial dilution in pro forma net tangible book value of $15.25 per common unit. Our general partner interest or the control of our general partner may be transferred to a third party without unitholder consent. Our general partner has a limited call right that may require unitholders to sell their common units at an undesirable time or price. We may issue additional units without unitholder approval, which would dilute existing unitholder ownership interests.

APPENDIX
Monthly Statistical Review Member NYSE, SPIC June 2015, Page 84
Investment Ratings
OVERWEIGHT (O) – The stock’s total return is expected to be greater than the total return of the company’s industry sector, on a risk-adjusted basis, over the next 12 months.
EQUAL-WEIGHT (E) – The stock’s total return is expected to be equivalent to the total return of the company’s industry sector, on a risk-adjusted basis, over the next 12 months.
UNDERWEIGHT (U) – The stock’s total return is expected to be less than the total return of the company’s industry sector, on a risk-adjusted basis, over the next 12 months.
VOLATILE (V) – The stock’s price volatility is potentially higher than that of the company’s industry sector. The company stock ratings may reflect the analyst’s subjective assessment of risk factors that could impact the company’s business. Distribution of Stephens Inc.'s Ratings (as of 03/31/15) % Investment Banking Clients Rating % (Past 12 Months) BUY 58 18 HOLD 41 11 SELL 1 0
Codes
NA-Not Applicable NR-Not Rated ADJ-Adjusted EPS CS-Cash EPS NM-Not Meaningful Susp-Rating Suspended ADJE-Adjusted EBITDA Per Share OP-Operating EPS NE-No Estimate UR-Under Review C-Canadian Dollars PF-Pro forma EPS
This report has been prepared solely for informative purposes as of its stated date and is not a solicitation, or an offer, to buy or sell any security. It does not purport to be a complete description of the securities, markets or developments referred to in the material. Information included in the report was obtained from internal and external sources which we consider reliable, but we have not independently verified such information and do not guarantee that it is accurate or complete. Such information is believed to be accurate on the date of issuance of the report, and all expressions of opinion apply on the date of issuance of the report. No subsequent publication or distribution of this report shall mean or imply that any such information or opinion remains current at any time after the stated date of the report. Prices, yields, and availability are subject to change with the market. Nothing in this report is intended, or should be construed, as legal, accounting, regulatory or tax advice. Any discussion of tax attributes is provided for informational purposes only, and each investor should consult his/her/its own tax advisors regarding any and all tax implications or tax consequences of any investment in securities discussed in this report. We do not undertake to advise you of any changes in any such information or opinion. Additional information available upon request.
Each analyst primarily responsible for the preparation of a portion or portions of this report certifies that (i) all views expressed by the analyst accurately reflect the analyst’s personal views about the subject companies and their securities, and (ii) no part of the analyst’s compensation was, is, or will be, directly or indirectly, related to the specific recommendations or views expressed by the analyst in this report. This report constitutes a compendium report (covers six or more subject companies). As such, Stephens Inc. chooses to provide specific disclosures for the companies mentioned by reference. To access current disclosures for the companies in this report, clients should refer to https://stephens2.bluematrix.com/sellside/Disclosures.action or contact your Stephens Inc. representative for additional information.

INSTITUTIONAL SALES
Monthly Statistical Review Member NYSE, SPIC June 2015, Page 85
BOB STATEN-MANAGER OF INSTITUTIONAL EQUITY SALES AND EQUITY TRADING
BOSTON NEW YORK Ken Murphy – Team Leader 617.239.7515 Blake James-Prod. Sales Mgr. 501.377.3759 Emily Green 617.239.7516 Martin Bynum 501.377.2255 George Karalis 617.239.7529 Joe Dacus 501.377.6381 Doug Sichol 617.239.7548 Matt Deuschle 501.377.2120 Sawyer Dunigan 501.377.8376 CANADA Dave Greene 501.377.3492 Paolo DiPasquale – Team Leader 501.377.3775 Anna Freeland 501.377.8364 Blake James 501.377.3759 Ara Hallajian 212.891.1739 Katie Huff 501.377.2432 MID-ATLANTIC Elizabeth Kadin 212.891.1726 Jim Klepper-Team Leader 501.377.2436 Mark Levin 501.377.2257 Jennifer Imbro 501.377.8102 Cody McGrath 501.377.2651 Lane Stafford 501.377.3706 Jackson Ratcliff 501.377.2107 MIDWEST SOUTHWEST Louis Wilson-Team Leader 312.292.5769 Brittany Davidson 501.377.3725 Jason Bowman 312.292.5761 Michael Muratore 312.292.5767 Ally Redecki 312.292.5758 EUROPE WEST COAST Jonathan Shively-Team Leader 501.377.8130 Doug Seelicke-Team Leader 501.377.8088 Drew Lipke 501.377.2108 Anna Mabrey 501.377.6332 Brittany Davidson 501.377.3725 Andy Rogers 501.377.2256 Capital Markets Marketing Analyst Robert Strauss 501.377.8295 LEON LANTS-HEAD OF EQUITY TRADING
SALES TRADING LITTLE ROCK TRADING NEW YORK Jeanie Brown 501.377.2088 Jimmy Law 212.891.1757 Scott Nelson 501.377.3773 Anthony Pignio 212.891.1741 Adam Raines 501.377.2076 Gray Standridge 501.377.2078 OTC TRADING LITTLE ROCK John Blackwell 501.377.2557 SALES TRADING BOSTON Leon Lants 501.377.2267 Scott Mutryn 617.239.7544 Brian Wardle 501.377.3468 Jerry Pawloski 617.239.7514 SALES TRADING CHICAGO Bruce Kos 312.292.5764 Jason Jarcho Head of Block/Listed Trading Brian Kowieski 312.292.5765 Luke Coop 501.377.8029 Lucy Dehner 501.377.6394 SALES TRADING NEW YORK Bill Franks 501.377.3405 Michael Conte-Head of Sales Trading 212.891.1724 Jason Jarcho 501.377.2074 George Boudria 212.891.1737 Bill Burchfield 212.891.1736 Jeffrey Castellano 212.891.1738 Matt Delia 212.891.1731 Rhonda LeDoux 212.891.1753
BRANCH OFFICES
Monthly Statistical Review Member NYSE, SPIC June 2015, Page 86
ATLANTA 3344 Peachtree Road, Suite 1650 Atlanta, GA 30326 800-862-1690 AUSTIN 100 Congress Avenue, Suite 750 Austin, TX 78701 800-892-7518 BATON ROUGE 445 North Boulevard Baton Rouge, LA 70802 877-514-0249 BOSTON 99 High Street Boston, MA 02110 617-239-7500 CHARLOTTE 4521 Sharon Road, Suite 200 Charlotte, NC 28211 800-892-7564 CHICAGO 191 North Wacker, Suite 1025 Chicago, IL 60606 312-292-5750 COLUMBIA 1320 Main Street, Suite 550 Columbia, SC 29201 803-343-0100 CONWAY 703 Chestnut Conway, AR 72032 800-827-5841 DALLAS 300 Crescent Court, Suite 600 Dallas, TX 75201 877-749-9991
FAYETTEVILLE 3425 N. Futrall Drive, Suite 201 Fayetteville, AR 72703 800-205-8613 FT. WORTH 777 Main Street, Suite 600 Ft. Worth, TX 76102 877-887-8197 HOT SPRINGS 161 Television Hill Road Hot Springs, AR 71913 800-392-8593 HOUSTON 9 Greenway Plaza, Suite 1905 Houston, TX 77046 713-993-4200 JACKSON 140 Township Avenue Ridgeland, MS 39157 601-605-5660 JONESBORO 2479 Browns Lane Jonesboro, AR 72401 870-819-0300 MEMPHIS 6075 Poplar Avenue, Suite 200 Memphis, TN 38119 NASHVILLE 3100 West End Avenue, Suite 630 Nashville, TN 37203 800-732-6847
NEW YORK 65 East 55th Street, 22nd Floor New York, NY 10022 212-891-1700 PORTLAND Two Union Street Portland, ME 04101 207-808-5025 ROGERS 3100 Market Street, Suite 301 Rogers, AR 72758 800-553-0234 SAN FRANCISCO 101 2nd Street, Suite 850 San Francisco, CA 94105 415-548-6900 SHREVEPORT 401 Edwards Street, Suite 1100 Shreveport, LA 71101 855-803-4600 ST. PETERSBURG 150 2nd Avenue North, Suite 700 St. Petersburg, FL 33701 800-755-1476 WINSTON-SALEM 101 South Stratford Road, Suite 200 Winston-Salem, NC 27104 877-301-0501
111 Center Street • Little Rock, Arkansas 72201 • 800-643-9691 •stephens.com

Stephens Research Department Directory Director of Research: Nik Fisken, CFA (501) 377-6335 Executive Assistant/Supervisor: Dena Page (501) 377-6368 CONSUMER Food and Agribusiness Farha Aslam, Analyst (212) 891-1778 Connor Hustava, CFA, Associate (212) 891-1762 Dan Shiparo, Associate (212) 891-1784 Yerlie Chatelain, Assistant (212) 891-1706 Healthy Living Joe Edelstein, CFA, Analyst (312) 292-5762 John Brick, Associate (312) 292-5752 Grace Tokarski, Assistant (312) 292-5750 Restaurants Will Slabaugh, Analyst (501) 377-2259 Billy Sherrill, Associate (501) 377-8513 Angela Crowe, Assistant (501) 377-2347 Retail/Broadlines John R. Lawrence, Analyst (901) 681-1346 Ben Bienvenu, Associate (901) 681-1347 Angela Crowe, Assistant (501) 377-2347 Retail/Hardlines Rick Nelson, CFA, CPA, Analyst (312) 292-5768 Nicholas Zangler, CFA, Associate (312) 292-5753 Grace Tokarski, Assistant (312) 292-5750 Retail/Softlines Rick Patel, CFA, Analyst (212) 891-1715 Shreya Jawalkar, Associate (212) 891-1709 Yerlie Chatelain, Assistant (212) 891-1706 ENERGY Exploration and Production Will Green, Analyst (817) 900-5712 Matt Beeby, Associate (817) 900-5711 Joshua Stevens, Associate (817) 900-5713 Kat Gregg, Assistant (817) 900-5700 Exploration and Production Ben Wyatt, Analyst (817) 900-5714 Matt Beeby, Associate (817) 900-5711 Joshua Stevens, Associate (817) 900-5713 Kat Gregg, Assistant (817) 900-5700 Master Limited Partnerships Matt Schmid, Analyst (817) 900-5716 Kat Gregg, Assistant (817) 900-5700 Oilfield Services Matthew Marietta, Analyst (713) 993-4211 Brooks Braden, Associate (713) 993-4204 Chris Denison, Associate (713) 993-4214 Natasha Sykes, Assistant (501) 377-2250
FINANCIAL SERVICES Banks-Midwest Erik Zwick, CFA, Analyst (617) 510-1239 Austin Nicholas, Associate (207) 808-5027 Angela Crowe, Assistant (501) 377-2347 Banks-Southwest Matt Olney, CFA, Analyst (501) 377-2101 Gordon McGuire, Associate (501) 377-3717 Matthew Sealy, Associate (501) 377-3721 Russell Warden, Associate (501) 377-8095 Wes Zwiegers, Associate (501) 377-2284 Angela Crowe, Assistant (501) 377-2347 Banks-Southeast Tyler Stafford, Analyst (501) 377-8362 Gordon McGuire, Associate (501) 377-3717 Matthew Sealy, Associate (501) 377-3721 Russell Warden, Associate (501) 377-8095 Wes Zwiegers, Associate (501) 377-2284 Angela Crowe, Assistant (501) 377-2347 Banks-Super-Regional & Midwest Terry McEvoy, CFA, Analyst (207) 808-5025 Austin Nicholas, Associate (207) 808-5027 Angela Crowe, Assistant (501) 377-2347 Real Estate Services John Campbell, Analyst (501) 377-6362 Hayden Blair, Associate (501) 377-8215 Sonja Kenyon, Assistant (501) 377-8104 Specialty Finance J.R. Bizzell, Analyst (501) 377-8237 Eric Jaschke, Associate (415) 548-6912 Angela Crowe, Assistant (501) 377-2347
HEALTHCARE Diagnostics and Life Science Tools Drew Jones, Analyst (501) 377-2369 Garrett Phelps, Associate (501) 377-8221 Christy Barker, Assistant (501) 377-2057 Healthcare Services Dana Hambly, CFA, Analyst (615) 279-4329 Christy Barker, Assistant (501) 377-2057 Medical Devices Chris Cooley, CFA, Analyst (501) 377-2516 Blevin Brown, Associate (501) 377-8506 Christy Barker, Assistant (501) 377-2057 INDUSTRIALS Building Materials and Construction Svcs. Trey Grooms, Analyst (501) 377-2318 Blake Hirschman, Associate (501) 377-8046 Drew Lipke, Associate (501) 377-2108 Christy Barker, Assistant (501) 377-2057 Industrial Products and Services Matt Duncan, CFA, Analyst (501) 377-3723 Will Steinwart, Associate (501) 377-8303 Angela Crowe, Assistant (501) 377-2347 Transportation/Airfreight and Logistics/Maritime Jack Atkins, Analyst (501) 377-2298 Andrew Hall, Associate (501) 377-2562 Sonja Kenyon, Assistant (501) 377-8104 Transportation/Railroad and Transportation Suppliers Justin Long, Analyst (501) 377-2036 Brian Colley, Associate (501) 377-8231 Sonja Kenyon, Assistant (501) 377-8104 Transportation/Truckload and Less-Than-Truckload Brad Delco, Analyst (501) 377-8057 Scott Schoenhaus, Associate (501) 377-2532 Sonja Kenyon, Assistant (501) 377-8104
TECHNOLOGY Business Services Brett Huff, CFA, Analyst (501) 377-8068 James Rutherford, Associate (501) 377-2303 Sonja Kenyon, Assistant (501) 377-8104 Communications Technology Tim Quillin, CFA, Analyst (501) 377-8078 Aaron Fogle, Associate (501) 377-8065 Sonja Kenyon, Assistant (501) 377-8104 Infrastructure Software and Security Jonathan Ruykhaver, CFA, Analyst (615) 279-4331 Nathan Leiphardt, Associate (615) 279-4376 Natasha Sykes, Assistant (501) 377-2250 Media Kyle Evans, Analyst (501) 377-6376 Tommy Moll, Associate (501) 377-6306 Natasha Sykes, Assistant (501) 377-2250 Power & Industrial Technology Ben Hearnsberger, Analyst (512) 542-3272 Brandon Wright, Associate (512) 542-3273 Christy Barker, Assistant (501) 377-2057 Semiconductors Harsh Kumar, Analyst (901) 681-1344 Richard Sewell, Associate (901) 681-1345 Angela Crowe, Assistant (501) 377-2347 Software as a Service Alex Zukin, Analyst (415) 548-6907 Scott Wilson, Associate (415) 548-6906 Natasha Sykes, Assistant (501) 377-2250 Telecommunications Services Barry McCarver, Analyst (501) 377-8131 Brian Hawthorne, Associate (501) 377-6372 Natasha Sykes, Assistant (501) 377-2250 PRODUCT MANAGEMENT GROUP Kelley Wilkins, Director Supervisory Analyst (501) 377-2020 Betty Farrar, Supervisory Analyst (501) 377-8183 Martha Graham, Supv. Analyst (501) 377-2260 Jennifer Keeling, Supv. Analyst (501) 377-8004 Natacha Hammerstad, Editorial Asst. (713) 993-4233 stephens.com


![CSC231 - Assembly€¦ · inc reg32 inc mem8 inc mem16 inc mem32 alpha db 3 beta dw 4 x dd 0 inc al inc cx inc ebx inc word[beta] ;beta](https://static.fdocuments.in/doc/165x107/5f9dc2880a2ac3769365ee04/csc231-inc-reg32-inc-mem8-inc-mem16-inc-mem32-alpha-db-3-beta-dw-4-x-dd-0-inc.jpg)