
June 2015 Manhattan Beach Real Estate Market Trends Update
15
Manhattan Beach Residential Real Estate Market Conditions June 2015
-
Upload
hhc-south-bay-real-estate-agents -
Category
Real Estate
-
view
21 -
download
1
Transcript of June 2015 Manhattan Beach Real Estate Market Trends Update

Table of
Contents
Key Statistics for June
Sales 2015 Residential Sales Stats Year-to-Year Total Sales by Map Area Median 2015 Median Sales Stats Year-to-Year Median Sales by Map Area Listings 2015 Active Listings by Map Area 2015 Total Active Listings vs. Total Sales Year-to-Year Active Listings by Map Area Inventory 2015 Months of Inventory by Map Area Year-to-Year Months of Inventory
Outlook for July
About Hady Chahine Contact Information

Key Statistics for June
Back to Table of Contents
= trending positive = trending positive
= trending negative = trending negative
Month-to-Month Comparison May 2015 June 2015 Delta (qty) Delta (%) Increase Decrease
Total Sales 36 35 -1 -2.8%
Median Sales Price 2,337,500 2,400,000 62,500 2.7%
Median Days to Sell 31 43 12 38.7%
Listings 82 90 8 9.8%
Sales/Listing Ratio 43.9% 38.9% -0.05 -11.4%
Months of Inventory 2.3 3 0.7 30.4%
Monthly Comparison Year-to-Year June 2014 June 2015 Delta Delta Increase Decrease
Total Sales 42 35 -7 -16.7%
Median Sales Price 1,902,500 2,400,000 497,500 26.1%
Median Days to Sell 39 43 4 10.3%
Listings 94 90 -4 -4.3%
Months of Inventory 2.0 3.0 1 50.0%

Back to Table of Contents
Total Sales Month-to-Month by Map Area Apr May Jun
Manhattan Bch Sand 9 11 7
Manhattan Bch Tree 10 16 10
Manhattan Bch Hill 1 0 4
Manhattan Village 2 1 2
Manhattan Bch Heights/Lib Vlg 3 4 2
Manhattan Bch Mira Costa 6 4 10
Total Sales 31 36 35
0
5
10
15
20
25
30
35
40
Apr May Jun
2015 Total Sales Month-to-Month by Map Area
Manhattan Bch Sand
Manhattan Bch Tree
Manhattan Bch Hill
Manhattan Village
Manhattan Bch Heights/Lib Vlg
Manhattan Bch Mira Costa
Total Sales
Back to Table of Contents
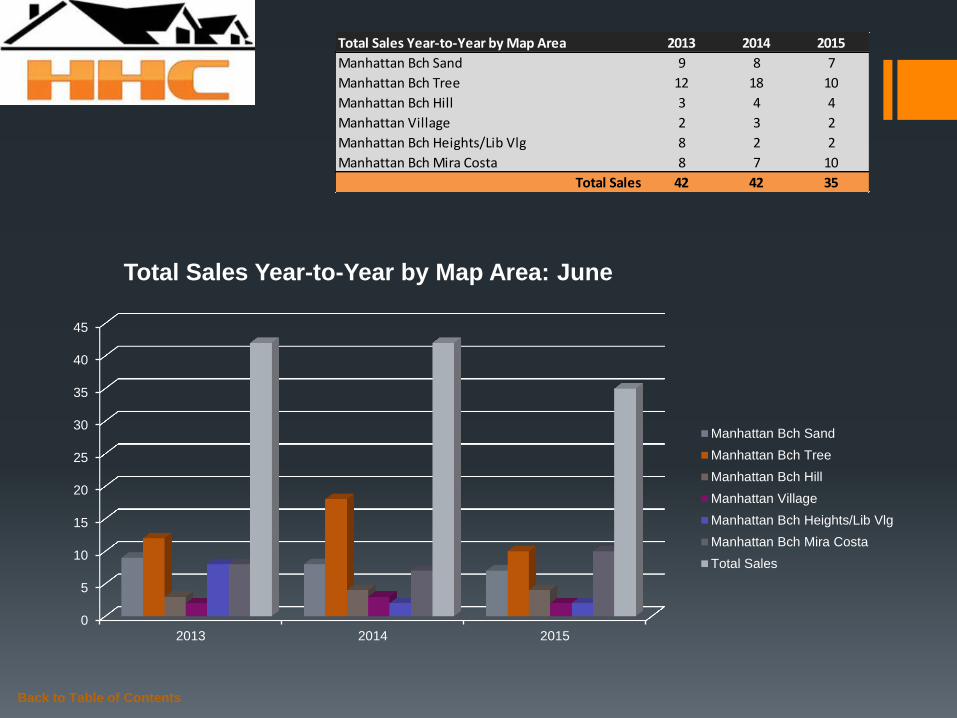
Total Sales Year-to-Year by Map Area 2013 2014 2015
Manhattan Bch Sand 9 8 7
Manhattan Bch Tree 12 18 10
Manhattan Bch Hill 3 4 4
Manhattan Village 2 3 2
Manhattan Bch Heights/Lib Vlg 8 2 2
Manhattan Bch Mira Costa 8 7 10
Total Sales 42 42 35
0
5
10
15
20
25
30
35
40
45
2013 2014 2015
Total Sales Year-to-Year by Map Area: June
Manhattan Bch Sand
Manhattan Bch Tree
Manhattan Bch Hill
Manhattan Village
Manhattan Bch Heights/Lib Vlg
Manhattan Bch Mira Costa
Total Sales

Back to Table of Contents
Median Sales Price Month-to-Month by Map Area Apr May Jun
Manhattan Bch Sand 2,990,000 2,825,000 3,075,000
Manhattan Bch Tree 1,900,000 2,137,500 2,195,000
Manhattan Bch Hill 2,525,000 - 2,875,000
Manhattan Village 1,787,500 855,000 1,412,000
Manhattan Bch Heights/Lib Vlg 1,460,000 1,662,000 1,477,500
Manhattan Bch Mira Costa 1,549,500 2,575,000 2,500,000
Market Median Sales Price 2,100,000 2,337,500 2,400,000
-
500,000
1,000,000
1,500,000
2,000,000
2,500,000
3,000,000
3,500,000
Apr May Jun
2015 Median Sales Price Month-to-Month by Map Area
Manhattan Bch Sand
Manhattan Bch Tree
Manhattan Bch Hill
Manhattan Village
Manhattan Bch Heights/Lib Vlg
Manhattan Bch Mira Costa
Market Median Sales Price

Back to Table of Contents
Median Sales Price Year-to-Year by Map Area 2013 2014 2015
Manhattan Bch Sand 1,874,473 1,855,000 3,075,000
Manhattan Bch Tree 1,842,500 2,112,500 2,195,000
Manhattan Bch Hill 1,680,000 3,465,000 2,875,000
Manhattan Village 1,263,500 1,618,000 1,412,000
Manhattan Bch Heights/Lib Vlg 960,000 1,260,500 1,477,500
Manhattan Bch Mira Costa 1,262,500 1,915,000 2,500,000
Market Median Sales Price 1,579,500 1,902,500 2,400,000
-
500,000
1,000,000
1,500,000
2,000,000
2,500,000
3,000,000
3,500,000
2013 2014 2015
Median Sales Price Year-to-Year by Map Area: June
Manhattan Bch Sand
Manhattan Bch Tree
Manhattan Bch Hill
Manhattan Village
Manhattan Bch Heights/Lib Vlg
Manhattan Bch Mira Costa
Market Median Sales Price
Back to Table of Contents
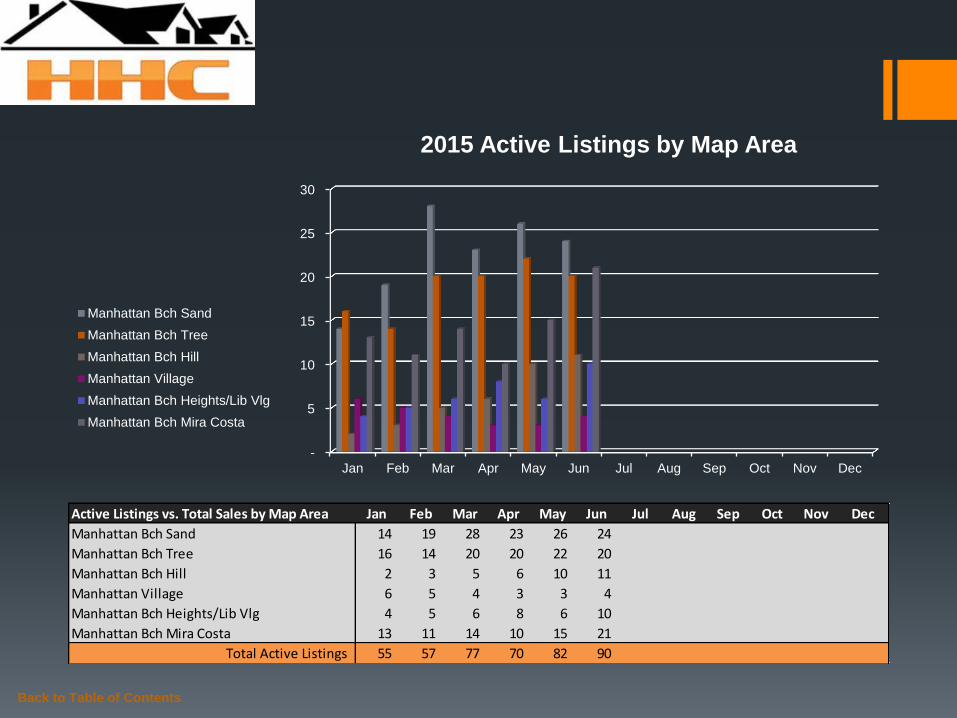
Active Listings vs. Total Sales by Map Area Jan Feb Mar Apr May Jun Jul Aug Sep Oct Nov Dec
Manhattan Bch Sand 14 19 28 23 26 24
Manhattan Bch Tree 16 14 20 20 22 20
Manhattan Bch Hill 2 3 5 6 10 11
Manhattan Village 6 5 4 3 3 4
Manhattan Bch Heights/Lib Vlg 4 5 6 8 6 10
Manhattan Bch Mira Costa 13 11 14 10 15 21
Total Active Listings 55 57 77 70 82 90
-
5
10
15
20
25
30
Jan Feb Mar Apr May Jun Jul Aug Sep Oct Nov Dec
2015 Active Listings by Map Area
Manhattan Bch Sand
Manhattan Bch Tree
Manhattan Bch Hill
Manhattan Village
Manhattan Bch Heights/Lib Vlg
Manhattan Bch Mira Costa

Back to Table of Contents
Active Listings vs. Total Sales by Map Area Jan Feb Mar Apr May Jun Jul Aug Sep Oct Nov Dec
Manhattan Bch Sand 14 19 28 23 26 24
Manhattan Bch Tree 16 14 20 20 22 20
Manhattan Bch Hill 2 3 5 6 10 11
Manhattan Village 6 5 4 3 3 4
Manhattan Bch Heights/Lib Vlg 4 5 6 8 6 10
Manhattan Bch Mira Costa 13 11 14 10 15 21
Total Active Listings 55 57 77 70 82 90
Total Sales 21 19 34 31 36 35
Sales/Listings Ratio 38.2% 33.3% 44.2% 44.3% 43.9% 38.9%
-
10
20
30
40
50
60
70
80
90
Jan Feb Mar Apr May Jun Jul Aug Sep Oct Nov Dec
2015 Total Active Listings vs. Total Sales
Total Active Listings
Total Sales

Back to Table of Contents
Active Listings Year-to-Year by Map Area 2013 2014 2015
Manhattan Bch Sand 29 27 24
Manhattan Bch Tree 28 20 20
Manhattan Bch Hill 17 8 11
Manhattan Village 3 10 4
Manhattan Bch Heights/Lib Vlg 7 8 10
Manhattan Bch Mira Costa 21 21 21
Total Active Listings 105 94 90
0
20
40
60
80
100
120
2013 2014 2015
Active Listings Year-to-Year by Map Area: June
Manhattan Bch Sand
Manhattan Bch Tree
Manhattan Bch Hill
Manhattan Village
Manhattan Bch Heights/Lib Vlg
Manhattan Bch Mira Costa
Total Active Listings

Back to Table of Contents
Months of Inventory by Map Area Jan Feb Mar Apr May Jun Jul Aug Sep Oct Nov Dec
Manhattan Bch Sand 2.3 6.3 2.3 2.6 2.4 3.0
Manhattan Bch Tree 16.0 2.3 3.3 2.0 1.4 2.0
Manhattan Bch Hill 0.7 1.5 5.0 6.0 - 3.0
Manhattan Village 2.0 2.5 1.0 1.5 3.0 2.0
Manhattan Bch Heights/Lib Vlg 2.0 1.7 1.5 2.7 1.5 5.0
Manhattan Bch Mira Costa 2.2 3.7 2.0 1.7 3.8 2.0
-
2.0
4.0
6.0
8.0
10.0
12.0
14.0
16.0
Jan Feb Mar Apr May Jun Jul Aug Sep Oct Nov Dec
2015 Months of Inventory by Map Area
Manhattan Bch Sand
Manhattan Bch Tree
Manhattan Bch Hill
Manhattan Village
Manhattan Bch Heights/Lib Vlg
Manhattan Bch Mira Costa

Back to Table of Contents
Months of Inventory Year-to-Year Jan Feb Mar Apr May Jun Jul Aug Sep Oct Nov Dec
2013 2.9 3.4 2.0 1.7 1.8 2.5 2.1 2.0 2.2 2.0 1.5 0.8
2014 3.0 2.2 2.2 2.0 2.0 2.0 2.2 2.0 2.8 1.9 1.5 1.1
2015 2.6 3.0 2.3 2.3 2.3 3.0
-
0.5
1.0
1.5
2.0
2.5
3.0
3.5
Jan Feb Mar Apr May Jun Jul Aug Sep Oct Nov Dec
Months of Inventory Year-to-Year
2013
2014
2015

Outlook for July July was a good month for Manhattan Beach real estate activity as 35 homes sold, the median sales price
jumped $62.5K, and listings increased 9.8%. Year-over-year, this highly coveted beach community has
experienced a 26.1% improvement in its median sales price.
In the news… According to C.A.R., “home sales reach highest level in two years” despite modest inventory
constraints on housing supply (http://www.car.org/newsstand/newsreleases/2015releases/june2015sales/?view=Standard).
Given the time of year (middle of summer) and ridiculously low mortgage rates, I suspect real estate interest to
remain strong throughout the month of July. Thinking of selling? Please call to schedule a free market analysis.
Are you in the market to buy? Don’t hesitate to bring me on board – let’s get you pre-qualified today!
Back to Table of Contents

Serving South Bay Home Buyers and Sellers Since 2001
RE/MAX Top 4 Team in California – 2012
RE/MAX 100% Club - 2011
Shorewood Realtors Top 5% in Overall Sales 2001-2006, 2008-2010
Back to Table of Contents
About
Hady Chahine…

The information being provided by CARETS (CLAW, CRISNet MLS, DAMLS, CRMLS, i-Tech MLS, and/or VCRDS) is for the visitor’s personal, non-commercial use and may not be used for
any purpose other than to identify prospective properties visitor may be interested in purchasing. Any information relating to a property referenced on this web site comes from the Internet
Data Exchange (IDX) program of CARETS. This web site may reference real estate listing(s) held by a brokerage firm other than the broker and/or agent who owns this web site. The accuracy
of all information, regardless of source, including but not limited to square footages and lot sizes, is deemed reliable but not guaranteed and should be personally verified through personal
inspection by and/or with the appropriate professionals.
Back to Table of Contents
Listings MLS BLOG Website


