June 2015 Calgary Real Estate Market Statistics
21
Calgary & Area Real Estate Statistics: June 2015 1 Request Your Free Home Evaluation Today!
-
Upload
coldwell-banker-compete-real-estate -
Category
Real Estate
-
view
215 -
download
2
Transcript of June 2015 Calgary Real Estate Market Statistics

Calgary & Area
Real Estate
Statistics:
June 2015
1
Request Your Free Home
Evaluation Today!
TABLE OF CONTENTS
3
June Real Estate Summary
4 - 5
City of Calgary Detached Homes Sales Data
6 - 7
City of Calgary Attached Homes Sales Data
8 - 9
City of Calgary Apartment Homes Sales Data
10 - 11
Rural Rockyview Detached Sales Data
12
Message From The Calgary Real Estate Board
13 – 14
Rural Foothills Detached Sales Data
15 – 16
City of Airdrie Detached Sales Data
17 – 18
City of Airdrie Attached Sales Data
19 - 20
City of Airdrie Apartment Sales Data
2
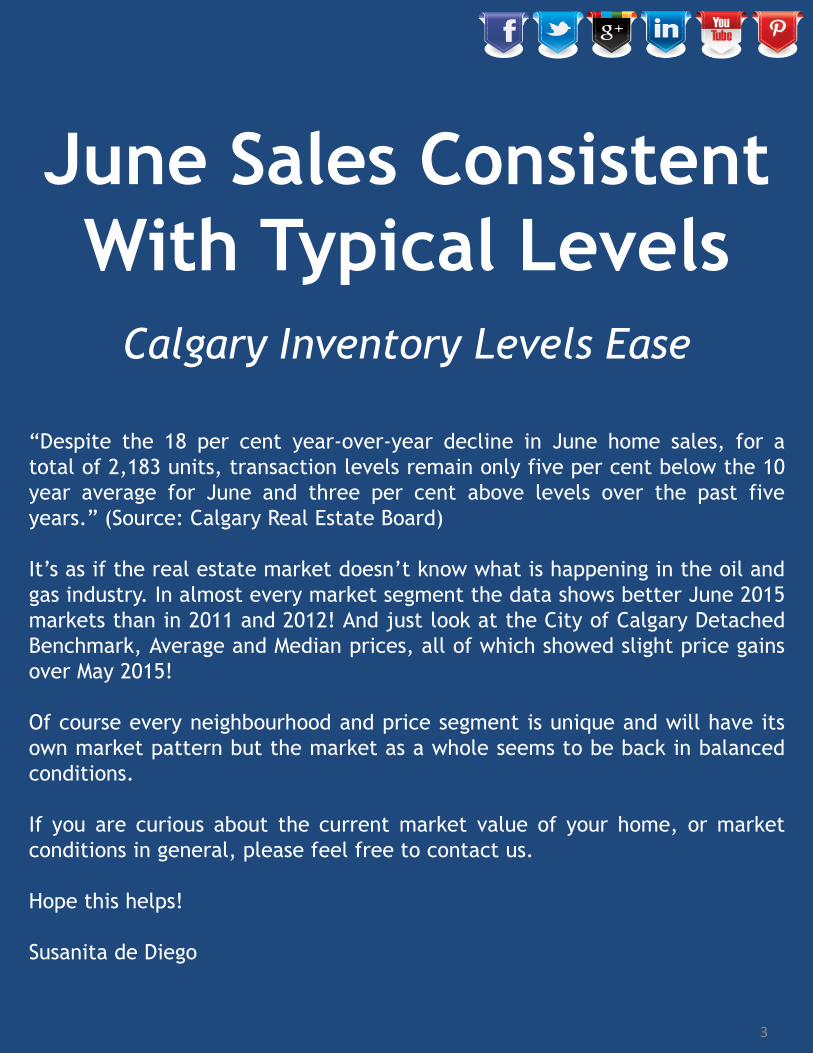
June Sales Consistent
With Typical Levels
Calgary Inventory Levels Ease
“Despite the 18 per cent year-over-year decline in June home sales, for a
total of 2,183 units, transaction levels remain only five per cent below the 10
year average for June and three per cent above levels over the past five
years.” (Source: Calgary Real Estate Board)
It’s as if the real estate market doesn’t know what is happening in the oil and
gas industry. In almost every market segment the data shows better June 2015
markets than in 2011 and 2012! And just look at the City of Calgary Detached
Benchmark, Average and Median prices, all of which showed slight price gains
over May 2015!
Of course every neighbourhood and price segment is unique and will have its
own market pattern but the market as a whole seems to be back in balanced
conditions.
If you are curious about the current market value of your home, or market
conditions in general, please feel free to contact us.
Hope this helps!
Susanita de Diego
3
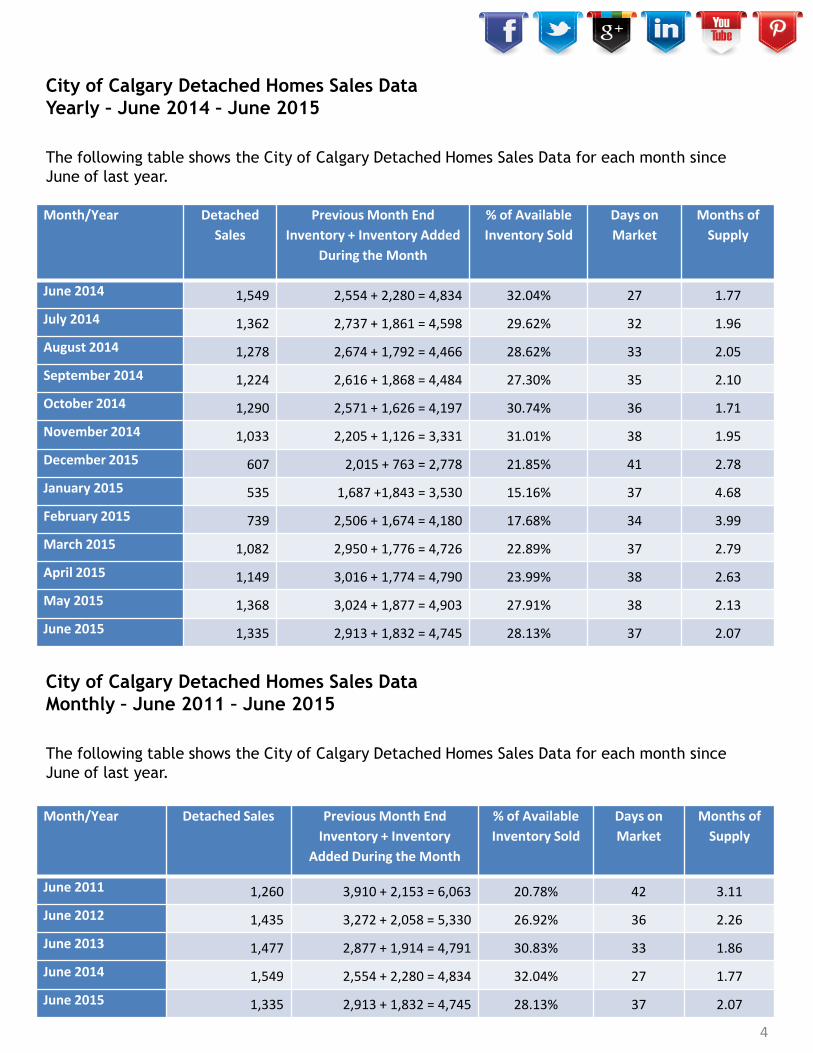
City of Calgary Detached Homes Sales Data
Yearly – June 2014 – June 2015
The following table shows the City of Calgary Detached Homes Sales Data for each month since
June of last year.
Month/Year Detached
Sales
Previous Month End
Inventory + Inventory Added
During the Month
% of Available
Inventory Sold
Days on
Market
Months of
Supply
June 2014 1,549 2,554 + 2,280 = 4,834 32.04% 27 1.77
July 2014 1,362 2,737 + 1,861 = 4,598 29.62% 32 1.96
August 2014 1,278 2,674 + 1,792 = 4,466 28.62% 33 2.05
September 2014 1,224 2,616 + 1,868 = 4,484 27.30% 35 2.10
October 2014 1,290 2,571 + 1,626 = 4,197 30.74% 36 1.71
November 2014 1,033 2,205 + 1,126 = 3,331 31.01% 38 1.95
December 2015 607 2,015 + 763 = 2,778 21.85% 41 2.78
January 2015 535 1,687 +1,843 = 3,530 15.16% 37 4.68
February 2015 739 2,506 + 1,674 = 4,180 17.68% 34 3.99
March 2015 1,082 2,950 + 1,776 = 4,726 22.89% 37 2.79
April 2015 1,149 3,016 + 1,774 = 4,790 23.99% 38 2.63
May 2015 1,368 3,024 + 1,877 = 4,903 27.91% 38 2.13
June 2015 1,335 2,913 + 1,832 = 4,745 28.13% 37 2.07
City of Calgary Detached Homes Sales Data
Monthly – June 2011 – June 2015
The following table shows the City of Calgary Detached Homes Sales Data for each month since
June of last year.
Month/Year Detached Sales Previous Month End
Inventory + Inventory
Added During the Month
% of Available
Inventory Sold
Days on
Market
Months of
Supply
June 2011 1,260 3,910 + 2,153 = 6,063 20.78% 42 3.11
June 2012 1,435 3,272 + 2,058 = 5,330 26.92% 36 2.26
June 2013 1,477 2,877 + 1,914 = 4,791 30.83% 33 1.86
June 2014 1,549 2,554 + 2,280 = 4,834 32.04% 27 1.77
June 2015 1,335 2,913 + 1,832 = 4,745 28.13% 37 2.07
4

The MLS® Home Price Index (HPI)
The MLS® Home Price Index (HPI) was launched on February 6, 2012 as part of a nationwide rollout
involving boards in Canada’s largest cities because average and median price changes can
misrepresent changes in market price. We often refer to the median price as being immune from
outliers. However, if there have been large movements in either the low end or high end of the
price spectrum, the median is unable to reflect the price changes.
The MLS® Home Price Index (HPI) was introduced to provide a better measurement of price and
price trends for residential properties. A benchmark home is one that is comprised of a set of
specific attributes that is typical for the area where it is located.
The City of Calgary Detached Benchmark, Average and Median Prices have shown the following
progression:
5

City of Calgary Attached Homes Sales Data
Yearly – June 2014 – June 2015
The following table shows the City of Calgary Attached Homes Sales Data for each month since June
of last year.
Month/Year Attached
Sales
Previous Month End
Inventory + Inventory Added
During the Month
% of Available
Inventory Sold
Days on
Market
Months of
Supply
June 2014 635 901 + 816 = 1,717 36.98% 28 1.46
July 2014 518 925 + 695 = 1,620 31.98% 32 1.79
August 2014 529 925 + 699 = 1,624 32.57% 34 1.71
September 2014 487 905 + 699 = 1,604 30.36% 34 1.87
October 2014 466 910 + 671 = 1,581 29.48% 38 1.97
November 2014 419 918 + 489 = 1,407 29.78% 36 2.02
December 2015 252 845 + 315 = 1,160 21.72% 45 2.82
January 2015 190 711 + 700 = 1,411 13.47% 41 5.27
February 2015 261 1,001 + 681 = 1,682 15.52% 34 4.66
March 2015 397 1,231 + 680 = 1,911 20.68% 39 3.17
April 2015 458 1,258 + 680 = 1,938 23.63& 41 2.64
May 2015 465 1,207 + 676 = 1,883 24.69% 43 2.44
June 2015 449 1,136 + 678 = 1,814 24.75% 44 2.48
City of Calgary Attached Homes Sales Data
Monthly – June 2011 – June 2015
The following table shows the City of Calgary Attached Homes Sales Data for each month since June
of last year.
Month/Year Attached Sales Previous Month End
Inventory + Inventory
Added During the Month
% of Available
Inventory Sold
Days on
Market
Months of
Supply
June 2011 350 1,258 + 597 = 1,855 18.87% 52 3.56
June 2012 409 1,054 + 668 = 1,722 23.75% 44 2.70
June 2013 461 837 + 571 = 1,408 32.74% 38 1.70
June 2014 635 901 + 816 = 1,717 36.98% 28 1.47
June 2015 449 1,136 + 678 = 1,814 24.75% 44 2.48
6
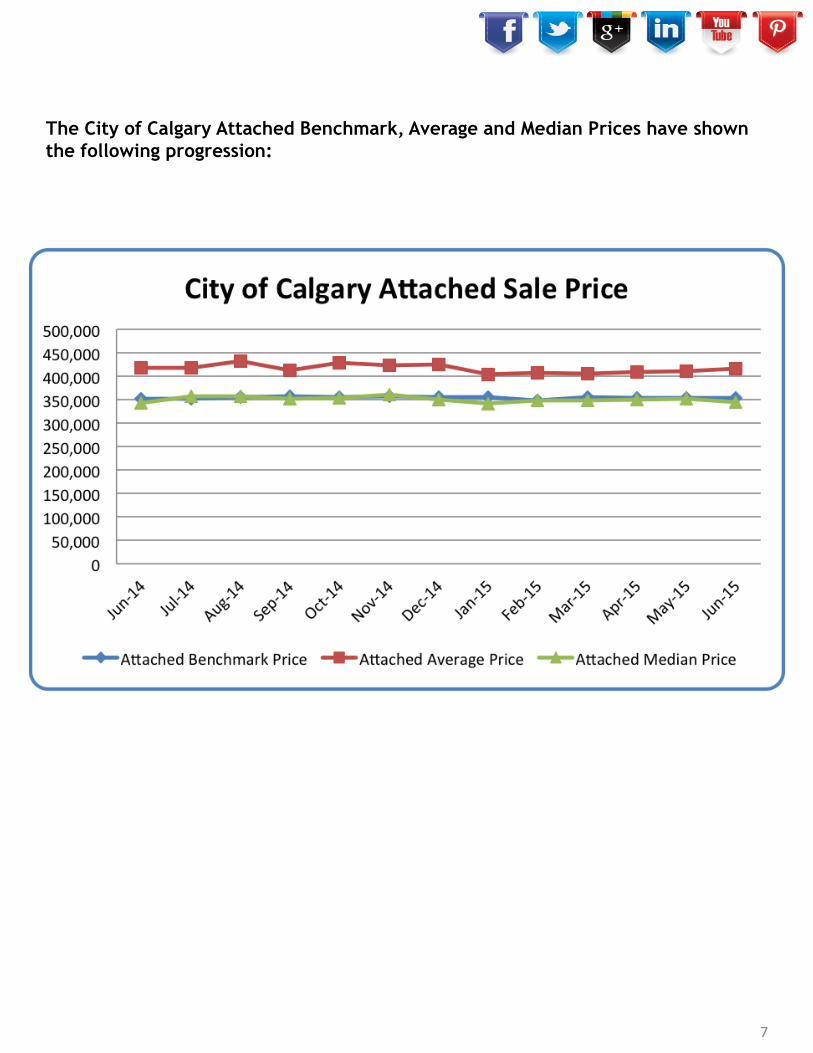
The City of Calgary Attached Benchmark, Average and Median Prices have shown
the following progression:
7

City of Calgary Apartment Homes Sales Data
Yearly – June 2014 – June 2015
The following table shows the City of Calgary Apartment Homes Sales Data for each month since
June of last year.
Month/Year Apartment
Sales
Previous Month End
Inventory + Inventory Added
During the Month
% of Available
Inventory Sold
Days on
Market
Months of
Supply
June 2014 480 1,073 + 721 = 1,794 26.76% 37 2.29
July 2014 448 1,097 + 663 = 1,760 25.45% 40 2.41
August 2014 456 1,079 + 656 = 1,735 26.28% 40 2.35
September 2014 435 1,070 + 692 = 1,762 24.69% 39 2.48
October 2014 389 1,078 + 622 = 1,700 22.88% 41 2.67
November 2014 327 1,039 + 478 = 1,517 21.56% 41 2.95
December 2015 223 966 + 303 = 1,269 17.57% 46 3.65
January 2015 155 815 + 745 = 1,560 9.94% 55 7.41
February 2015 217 1,148 + 595 = 1,743 12.45% 40 6.04
March 2015 303 1,134 + 672 = 2,006 15.10% 43 4.68
April 2015 350 1,419 + 610 = 2,029 17.25% 45 3.85
May 2015 359 1,348 + 612 = 1,960 18.32% 48 3.60
June 2015 399 1,293 + 612 = 1,905 20.94% 48 3.00
City of Calgary Apartment Homes Sales Data
Monthly –June 2011 – June 2015
The following table shows the City of Calgary Apartment Homes Sales Data for each month since
June of last year.
Month/Year Apartment
Sales
Previous Month End
Inventory + Inventory
Added During the Month
% of Available
Inventory Sold
Days on
Market
Months of
Supply
June 2011 342 1,276 + 581 = 1,857 18.42% 52 3.58
June 2012 346 1,182 + 552 = 1,734 19.95% 54 3.42
June 2013 361 920+ 496 = 1,416 25.49% 38 2.43
June 2014 480 1,073 + 721 = 1,794 26.76% 37 2.29
June 2015 399 1,293 + 612 = 1,905 20.94% 48 3.00
8
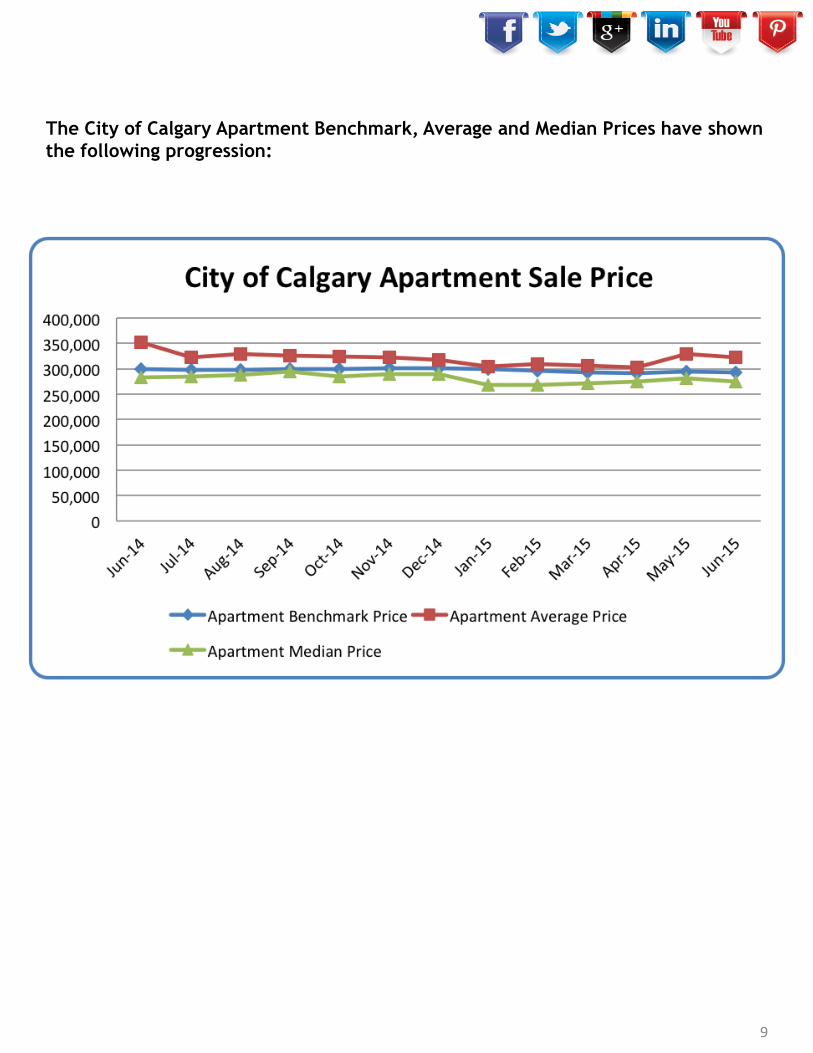
The City of Calgary Apartment Benchmark, Average and Median Prices have shown
the following progression:
9

Rural Rockyview Detached Sales Data
Yearly – June 2014 – June 2015
The following table shows the Rural Rockyview Detached Sales Data for each month since June of
last year.
Month/Year Detached
Sales
Previous Month End
Inventory + Inventory Added
During the Month
% of Available
Inventory Sold
Days on
Market
Months of
Supply
June 2014 38 339 + 126 = 465 8.17% 91 9.68
July 2014 45 368 + 83 = 451 9.98% 88 8.07
August 2014 41 363 + 75 = 438 9.36% 82 8.78
September 2014 46 360 + 86 = 446 10.31% 84 7.28
October 2014 37 335 + 69 = 404 9.16% 92 8.30
November 2014 10 307 + 49 = 356 2.81% 116 28.40
December 2015 15 284 + 31 = 315 4.76% 140 14.67
January 2015 19 220 + 88 = 308 6.17% 142 13.05
February 2015 20 248 + 76 = 324 6.17% 74 13.85
March 2015 23 277 + 82 = 345 6.67% 86 12.87
April 2015 28 296 + 68 = 364 7.69% 71 10.89
May 2015 35 305 + 87 = 392 8.93% 78 9.43
June 2015 41 330 + 84 = 414 9.90% 97 7.93
Rural Rockyview Detached Sales Data
Monthly – June 2011 – June 2015
The following table shows the Rural Rockyview Detached Sales Data for each month since June of
last year.
Month/Year Detached Sales Previous Month End
Inventory + Inventory
Added During the Month
% of Available
Inventory Sold
Days on
Market
Months of
Supply
June 2011 32 412 + 122 = 534 5.99% 73 13.66
June 2012 43 438 + 132 = 570 7.54% 107 10.70
June 2013 34 430 + 98 = 528 6.449% 91 12.35
June 2014 38 339 + 126 = 465 8.17% 91 9.68
June 2015 41 330 + 84 = 414 9.90% 97 7.93
10
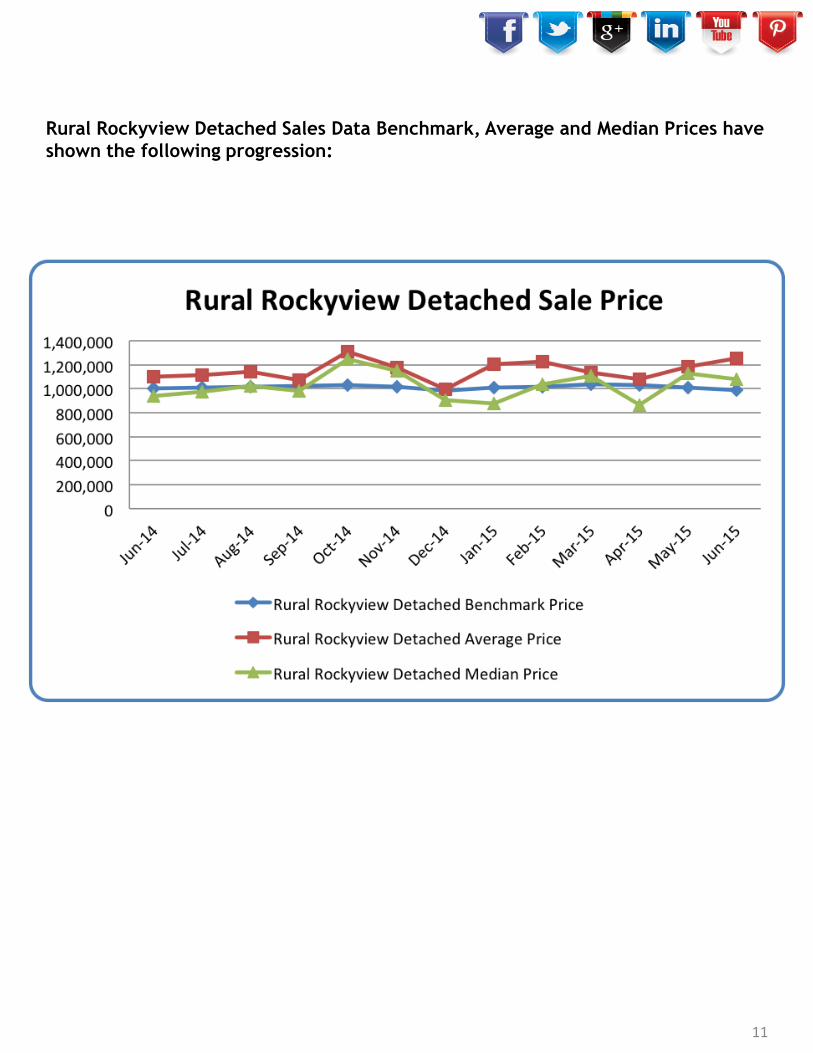
Rural Rockyview Detached Sales Data Benchmark, Average and Median Prices have
shown the following progression:
11

We’ve seen less concern from consumers
lately,” said CREB® president Corinne Lyall.
“One of the main reasons is that we haven’t
seen the worst case scenarios play out in the
energy and housing sectors.”
“Consumers who were waiting for wide-spread
price declines have been surprised to see that
it just hasn’t happened yet, and so they’ve
decided to take advantage of the improved
selection and lower lending rates,” said Lyall.
“
” 12

Rural Foothills Detached Sales Data
Yearly – June 2014 – June 2015
The following table shows the Rural Foothills Detached Sales Data for each month since June of last
year.
Month/Year Detached
Sales
Previous Month End
Inventory + Inventory Added
During the Month
% of Available
Inventory Sold
Days on
Market
Months of
Supply
June 2014 28 178 + 47 = 225 12.44% 64 6.39
July 2014 23 179 + 73 = 252 9.13% 98 8.61
August 2014 18 198 + 55 = 253 7.11% 64 11.83
September 2014 26 213 + 48 = 261 9.96% 96 7.77
October 2014 15 202 + 39 = 241 6.22% 79 12.13
November 2014 10 182 + 19 = 201 4.98% 103 16.30
December 2015 6 163 + 13 = 176 3.41% 167 19.83
January 2015 8 119 + 33 = 152 5.26% 151 15.13
February 2015 17 121 + 39 = 160 10.63% 139 7.94
March 2015 13 135 + 47 = 182 7.14% 139 11.69
April 2015 15 152 + 52 = 204 7.35% 96 11.93
May 2015 24 179 + 63 = 242 9.92% 102 8.21
June 2015 17 197 + 51 = 248 6.85% 52 12.41
Rural Foothills Detached Sales Data
Monthly – June 2011 – June 2015
The following table shows the Rural Foothills Detached Sales Data for each month since June of last
year.
Month/Year Detached Sales Previous Month End
Inventory + Inventory
Added During the Month
% of Available
Inventory Sold
Days on
Market
Months of
Supply
June 2011 15 242 + 81 = 323 4.64% 108 18.20
June 2012 20 252 + 63 = 315 6.35% 152 13.25
June 2013 19 222 + 56 = 278 6.83% 99 11.79
June 2014 28 178 + 47 = 225 12.44% 64 6.29
June 2015 17 197 + 51 = 248 6.85% 52 12.41
13
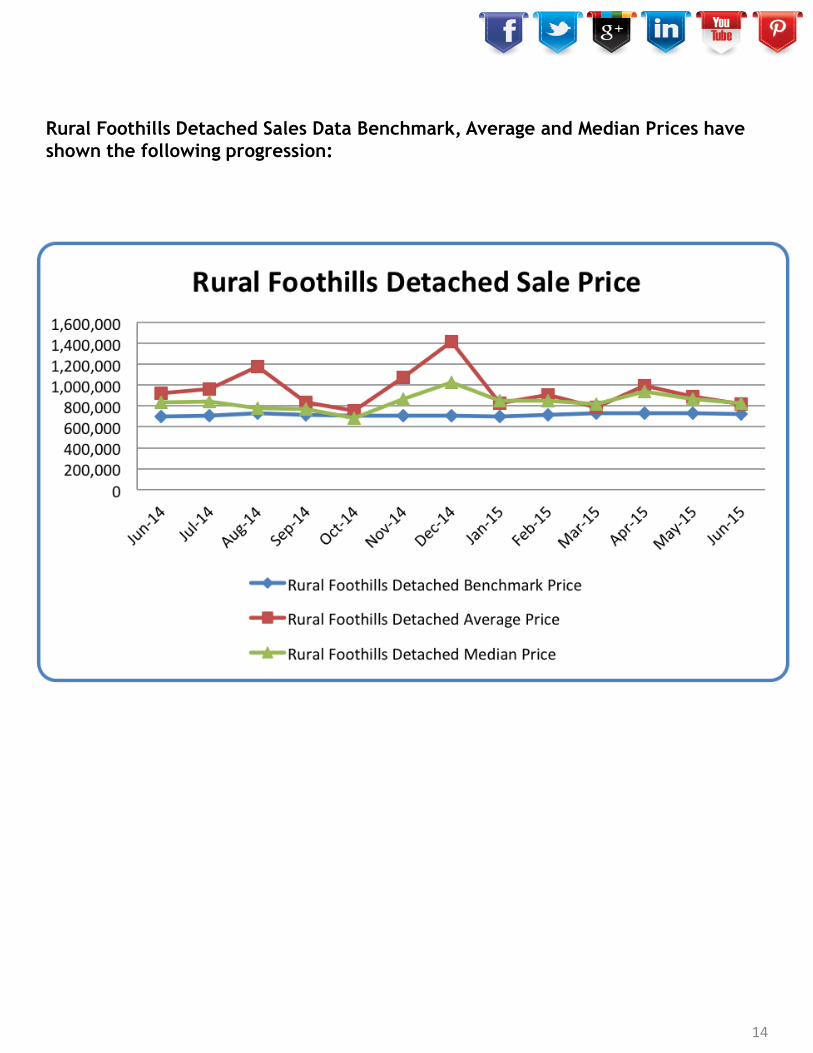
Rural Foothills Detached Sales Data Benchmark, Average and Median Prices have
shown the following progression:
14
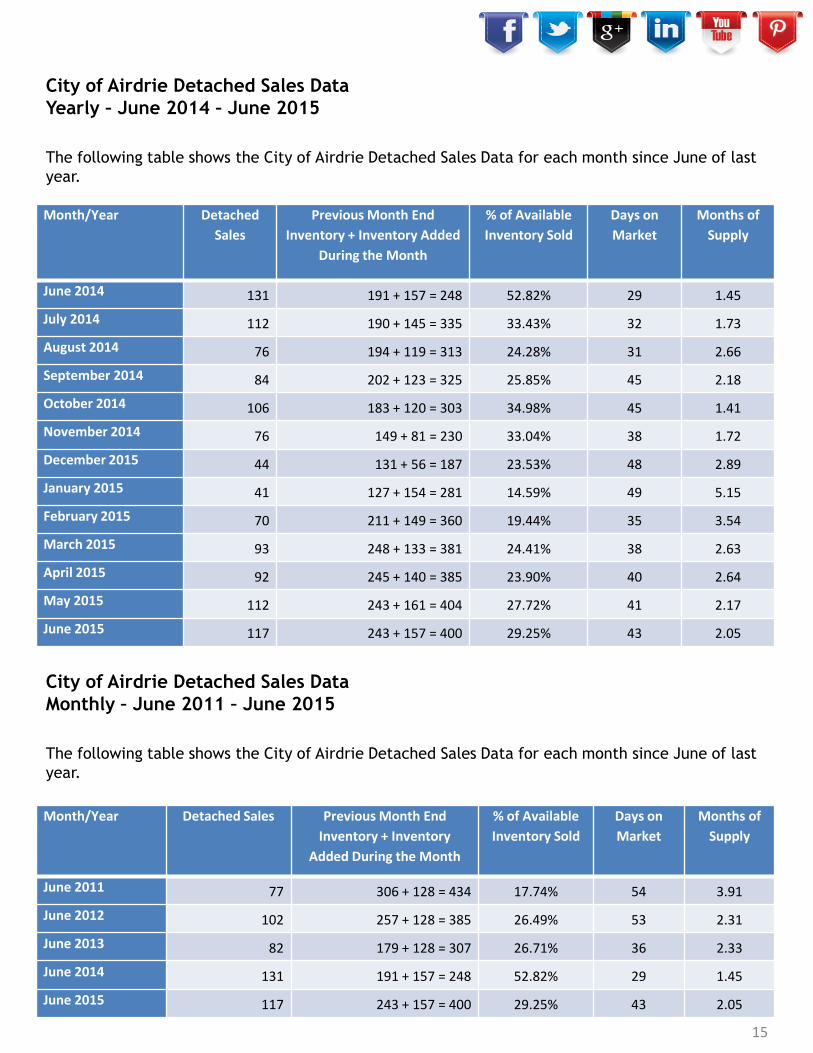
City of Airdrie Detached Sales Data
Yearly – June 2014 – June 2015
The following table shows the City of Airdrie Detached Sales Data for each month since June of last
year.
Month/Year Detached
Sales
Previous Month End
Inventory + Inventory Added
During the Month
% of Available
Inventory Sold
Days on
Market
Months of
Supply
June 2014 131 191 + 157 = 248 52.82% 29 1.45
July 2014 112 190 + 145 = 335 33.43% 32 1.73
August 2014 76 194 + 119 = 313 24.28% 31 2.66
September 2014 84 202 + 123 = 325 25.85% 45 2.18
October 2014 106 183 + 120 = 303 34.98% 45 1.41
November 2014 76 149 + 81 = 230 33.04% 38 1.72
December 2015 44 131 + 56 = 187 23.53% 48 2.89
January 2015 41 127 + 154 = 281 14.59% 49 5.15
February 2015 70 211 + 149 = 360 19.44% 35 3.54
March 2015 93 248 + 133 = 381 24.41% 38 2.63
April 2015 92 245 + 140 = 385 23.90% 40 2.64
May 2015 112 243 + 161 = 404 27.72% 41 2.17
June 2015 117 243 + 157 = 400 29.25% 43 2.05
City of Airdrie Detached Sales Data
Monthly – June 2011 – June 2015
The following table shows the City of Airdrie Detached Sales Data for each month since June of last
year.
Month/Year Detached Sales Previous Month End
Inventory + Inventory
Added During the Month
% of Available
Inventory Sold
Days on
Market
Months of
Supply
June 2011 77 306 + 128 = 434 17.74% 54 3.91
June 2012 102 257 + 128 = 385 26.49% 53 2.31
June 2013 82 179 + 128 = 307 26.71% 36 2.33
June 2014 131 191 + 157 = 248 52.82% 29 1.45
June 2015 117 243 + 157 = 400 29.25% 43 2.05
15
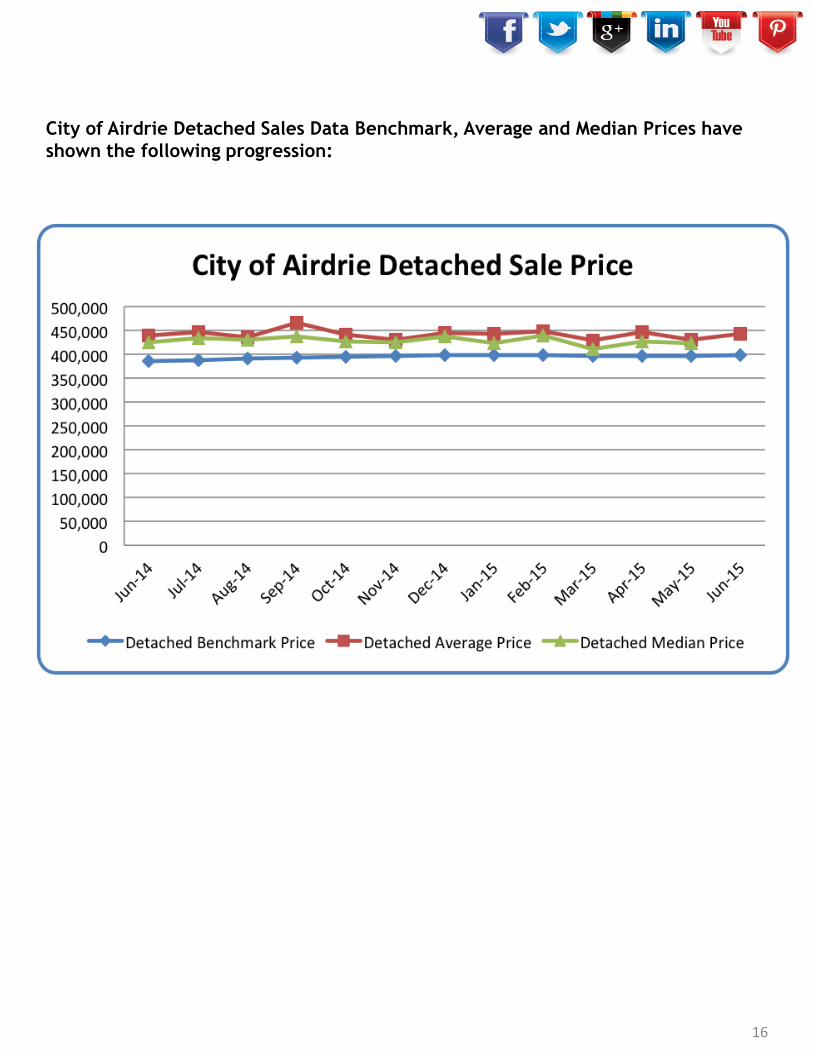
City of Airdrie Detached Sales Data Benchmark, Average and Median Prices have
shown the following progression:
16
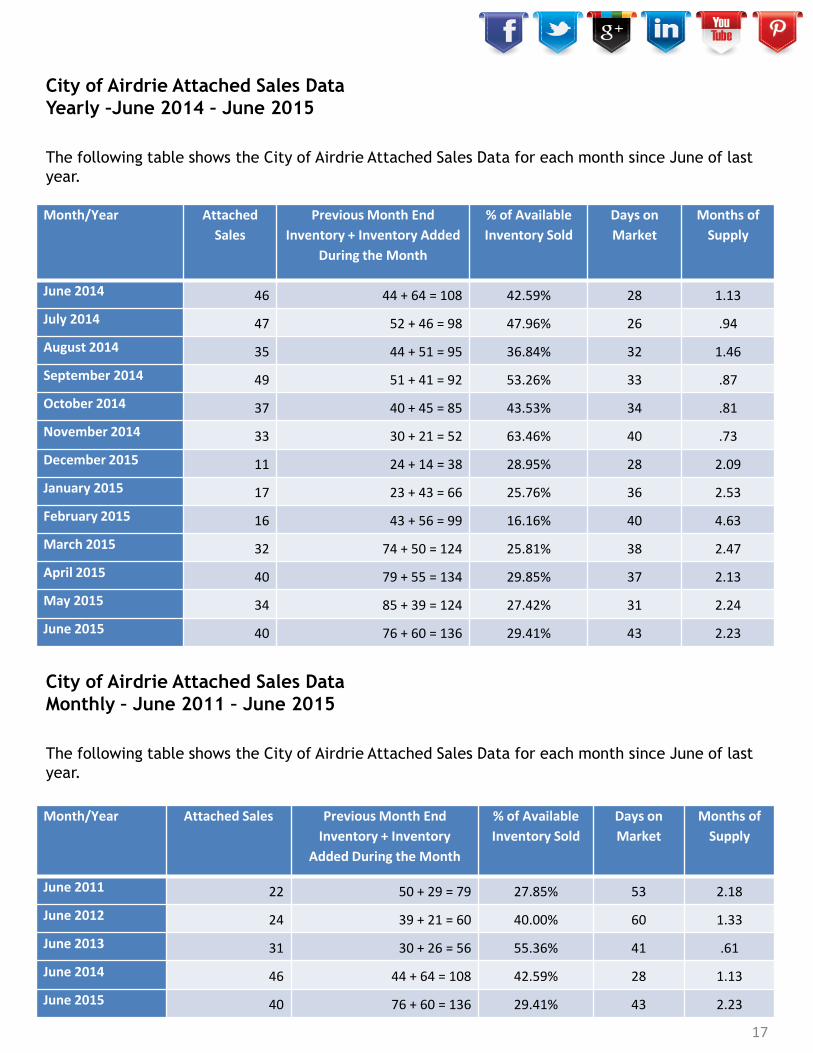
City of Airdrie Attached Sales Data
Yearly –June 2014 – June 2015
The following table shows the City of Airdrie Attached Sales Data for each month since June of last
year.
Month/Year Attached
Sales
Previous Month End
Inventory + Inventory Added
During the Month
% of Available
Inventory Sold
Days on
Market
Months of
Supply
June 2014 46 44 + 64 = 108 42.59% 28 1.13
July 2014 47 52 + 46 = 98 47.96% 26 .94
August 2014 35 44 + 51 = 95 36.84% 32 1.46
September 2014 49 51 + 41 = 92 53.26% 33 .87
October 2014 37 40 + 45 = 85 43.53% 34 .81
November 2014 33 30 + 21 = 52 63.46% 40 .73
December 2015 11 24 + 14 = 38 28.95% 28 2.09
January 2015 17 23 + 43 = 66 25.76% 36 2.53
February 2015 16 43 + 56 = 99 16.16% 40 4.63
March 2015 32 74 + 50 = 124 25.81% 38 2.47
April 2015 40 79 + 55 = 134 29.85% 37 2.13
May 2015 34 85 + 39 = 124 27.42% 31 2.24
June 2015 40 76 + 60 = 136 29.41% 43 2.23
City of Airdrie Attached Sales Data
Monthly – June 2011 – June 2015
The following table shows the City of Airdrie Attached Sales Data for each month since June of last
year.
Month/Year Attached Sales Previous Month End
Inventory + Inventory
Added During the Month
% of Available
Inventory Sold
Days on
Market
Months of
Supply
June 2011 22 50 + 29 = 79 27.85% 53 2.18
June 2012 24 39 + 21 = 60 40.00% 60 1.33
June 2013 31 30 + 26 = 56 55.36% 41 .61
June 2014 46 44 + 64 = 108 42.59% 28 1.13
June 2015 40 76 + 60 = 136 29.41% 43 2.23
17
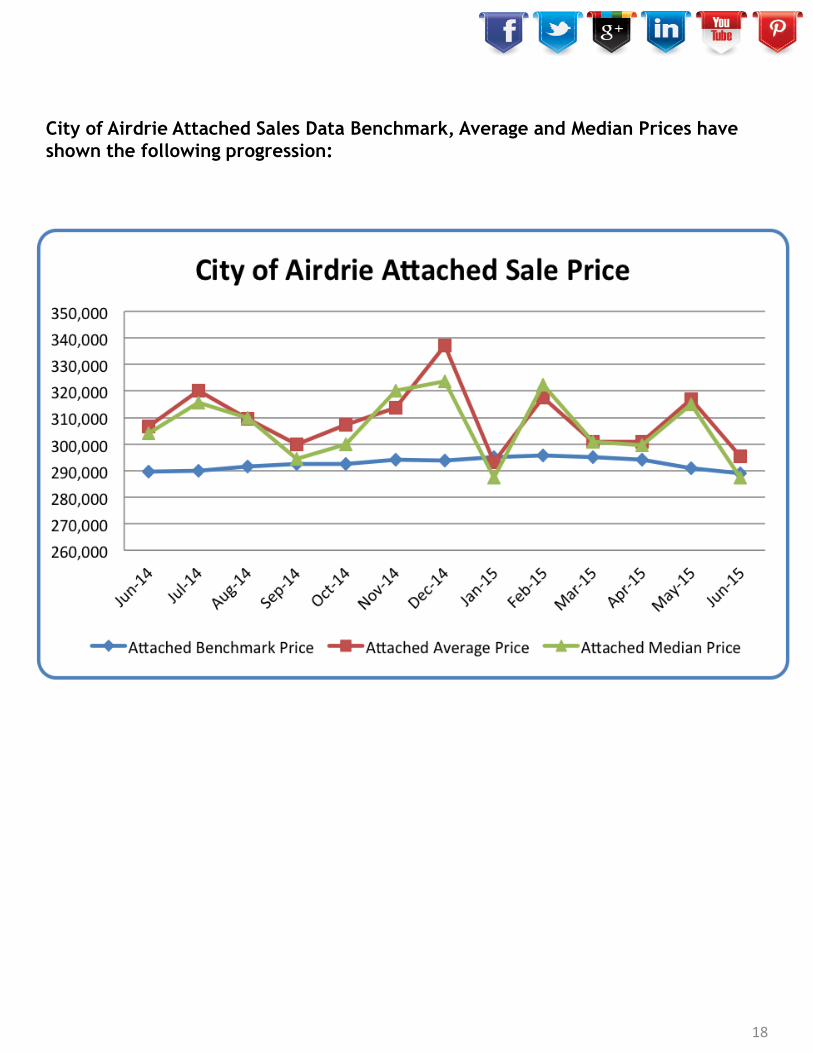
City of Airdrie Attached Sales Data Benchmark, Average and Median Prices have
shown the following progression:
18
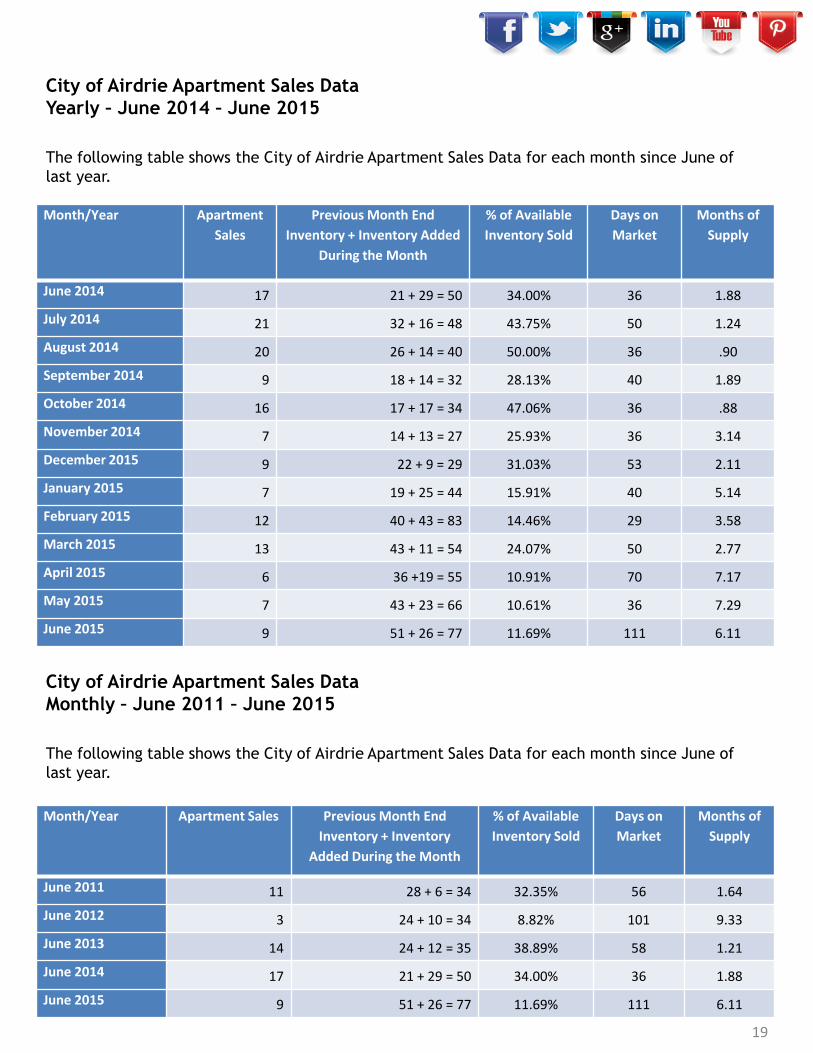
City of Airdrie Apartment Sales Data
Yearly – June 2014 – June 2015
The following table shows the City of Airdrie Apartment Sales Data for each month since June of
last year.
Month/Year Apartment
Sales
Previous Month End
Inventory + Inventory Added
During the Month
% of Available
Inventory Sold
Days on
Market
Months of
Supply
June 2014 17 21 + 29 = 50 34.00% 36 1.88
July 2014 21 32 + 16 = 48 43.75% 50 1.24
August 2014 20 26 + 14 = 40 50.00% 36 .90
September 2014 9 18 + 14 = 32 28.13% 40 1.89
October 2014 16 17 + 17 = 34 47.06% 36 .88
November 2014 7 14 + 13 = 27 25.93% 36 3.14
December 2015 9 22 + 9 = 29 31.03% 53 2.11
January 2015 7 19 + 25 = 44 15.91% 40 5.14
February 2015 12 40 + 43 = 83 14.46% 29 3.58
March 2015 13 43 + 11 = 54 24.07% 50 2.77
April 2015 6 36 +19 = 55 10.91% 70 7.17
May 2015 7 43 + 23 = 66 10.61% 36 7.29
June 2015 9 51 + 26 = 77 11.69% 111 6.11
City of Airdrie Apartment Sales Data
Monthly – June 2011 – June 2015
The following table shows the City of Airdrie Apartment Sales Data for each month since June of
last year.
Month/Year Apartment Sales Previous Month End
Inventory + Inventory
Added During the Month
% of Available
Inventory Sold
Days on
Market
Months of
Supply
June 2011 11 28 + 6 = 34 32.35% 56 1.64
June 2012 3 24 + 10 = 34 8.82% 101 9.33
June 2013 14 24 + 12 = 35 38.89% 58 1.21
June 2014 17 21 + 29 = 50 34.00% 36 1.88
June 2015 9 51 + 26 = 77 11.69% 111 6.11
19
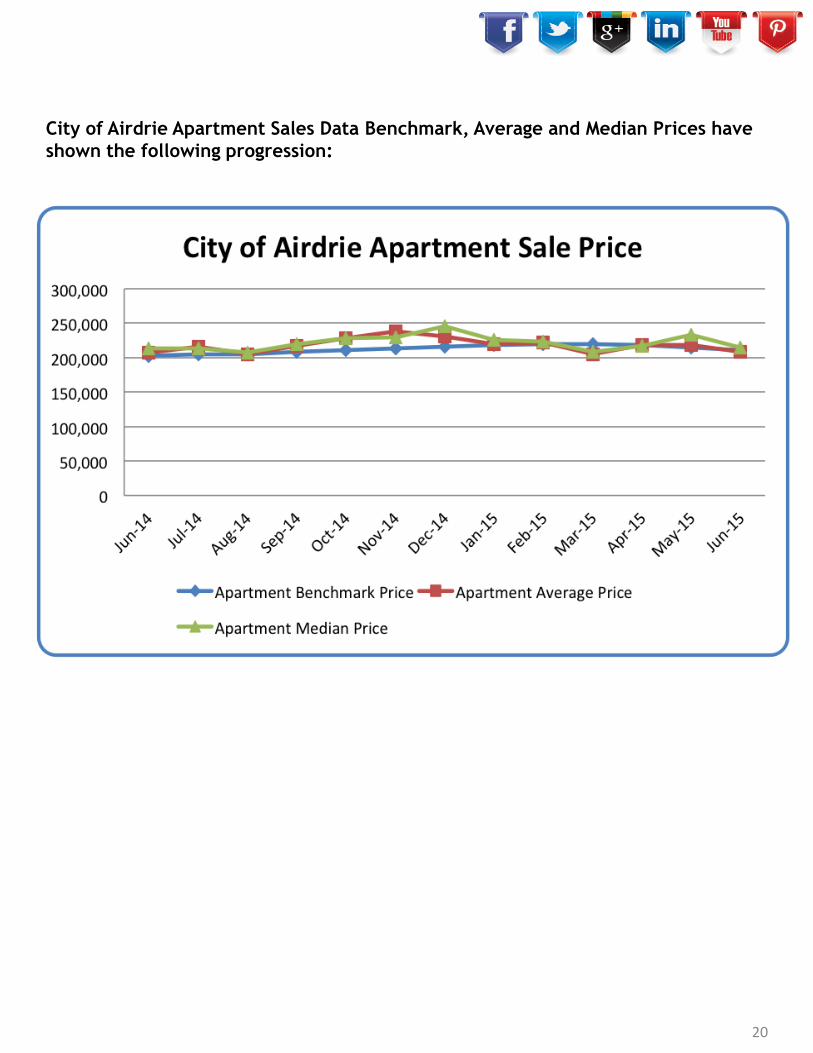
City of Airdrie Apartment Sales Data Benchmark, Average and Median Prices have
shown the following progression:
20

Curious About the
Value of Your Home?
As you can see, current market conditions play a critical role in determining the value of your home. Equally important however, is having an experienced and knowledgeable professional Realtor® on your side. Coldwell Banker Complete Real Estate would welcome the opportunity to discuss any of your Real Estate needs at your convenience.
#yesyoumatter
Request Your Free Home
Evaluation Today!
Coldwell Banker Complete Real Estate Phone: 403-686-1455
21