June 2012 SeismicWaves - NEHRPnehrp.gov/pdf/SeismicWavesJun12.pdfFor more information, visit or send...
3
SeismicWaves How the National Earthquake Hazards Reduction Program Is Advancing Earthquake Safety June 2012 hroughout most municipalities of the United States, structural engineers design new build- ings using the U.S.-focused International Build- ing Code (IBC). Updated editions of the IBC are pub- lished every 3 years. The latest edition (2012) contains new “risk-targeted maximum considered earthquake” (MCE R ) ground motion maps, which are enabling en- gineers to incorporate a more consistent and better- defined level of seismic safety into their building de- signs. The new maps were developed by the Building Seismic Safety Council and its Seismic Design Procedures Reas- sessment Group, in collaboration with the U.S. Geolog- ical Survey (USGS) and with funding from the Federal Emergency Management Agency (FEMA), two of the agencies that participate in the National Earthquake Hazards Reduction Program (NEHRP). Following their initial publication in the 2009 NEHRP Recom- mended Seismic Provisions for New Buildings and Oth- er Structures (FEMA P–750), the maps were adopted into the 2010 edition of the American Society of Civil Engineers (ASCE) Standard ASCE/SEI 7–10, Minimum Design Loads for Buildings and Other Structures, and subsequently into the 2012 IBC. The 2012 Internation- al Residential Code (IRC), 1 which governs the design and construction of one- and two-family dwellings, contains similar new maps (see figure 1). New “Risk-Targeted” Seismic Maps Introduced into Building Codes T Explanation Seismic Design Category %g E 125 D2 83 D1 67 D0 50 C 33 B 17 A 0 Figure 1—The seismic design maps in the 2012 IRC. Like those in the companion 2012 IBC, these maps are based on new “risk-targeted” ground motions developed via collaboration between USGS and the FEMA-supported Building Seismic Safety Council. Areas colored red (seismic design category E) represent sites where the most stringent design measures are required due to the highest potential ground motions. Source: USGS. 1 The IBC and IRC are among the family of model building codes published by the International Code Council (www.iccsafe.org/Pages/ default.aspx).
Transcript of June 2012 SeismicWaves - NEHRPnehrp.gov/pdf/SeismicWavesJun12.pdfFor more information, visit or send...

SeismicWavesHow the National Earthquake Hazards Reduction Program Is Advancing Earthquake Safety
June 2012
hroughout most municipalities of the United States, structural engineers design new build-ings using the U.S.-focused International Build-
ing Code (IBC). Updated editions of the IBC are pub-lished every 3 years. The latest edition (2012) contains new “risk-targeted maximum considered earthquake” (MCER) ground motion maps, which are enabling en-gineers to incorporate a more consistent and better-defined level of seismic safety into their building de-signs. The new maps were developed by the Building Seismic Safety Council and its Seismic Design Procedures Reas-sessment Group, in collaboration with the U.S. Geolog-
ical Survey (USGS) and with funding from the Federal Emergency Management Agency (FEMA), two of the agencies that participate in the National Earthquake Hazards Reduction Program (NEHRP). Following their initial publication in the 2009 NEHRP Recom-mended Seismic Provisions for New Buildings and Oth-er Structures (FEMA P–750), the maps were adopted into the 2010 edition of the American Society of Civil Engineers (ASCE) Standard ASCE/SEI 7–10, Minimum Design Loads for Buildings and Other Structures, and subsequently into the 2012 IBC. The 2012 Internation-al Residential Code (IRC),1 which governs the design and construction of one- and two-family dwellings, contains similar new maps (see figure 1).
New “Risk-Targeted” Seismic Maps Introduced into Building Codes
T
Explanation
Seismic DesignCategory%g
E125
D2
83D1
67D0
50C
33B
17A
0
Figure 1—The seismic design maps in the 2012 IRC. Like those in the companion 2012 IBC, these maps are based on new “risk-targeted” ground motions developed via collaboration between USGS and the FEMA-supported Building Seismic Safety Council. Areas colored red (seismic design category E) represent sites where the most stringent design measures are required due to the highest potential ground motions. Source: USGS.
1 The IBC and IRC are among the family of model building codes published by the International Code Council (www.iccsafe.org/Pages/default.aspx).

SeismicWaves June 2012
Page 2
Based on Conceptual Advances The MCER ground motion maps are used by structural designers in the same manner as the maximum consid-ered earthquake (MCE) maps included in previous edi-tions of the IBC.2 By locating the planned building site on the maps, an engineer can find the level of earth-quake ground motion that his or her design must con-sider. As their name suggests, however, the new “risk-targeted” maps were developed differently. As opposed to the MCE maps, which required that buildings throughout the country be designed to resist so-called uniform-hazard ground shaking levels, the new MCER maps require that buildings be designed to provide the same level of seismic performance, meaning that they will be equally (un)likely to collapse in earthquakes. The new maps are referred to as risk-targeted because the likelihood of collapse is known as the seismic risk level. This new requirement acknowledges that, even when similar buildings located in different regions are de-signed for uniform-hazard ground motion, or spectral acceleration3 (adjusted for differences in soil character-istics), regional differences in other attributes of the seismic hazard will likely result in differing probabili-ties of collapse. A uniform-hazard ground motion map does not fully encapsulate regional differences in how often earthquakes occur and how their seismic waves travel, which are both fundamental contributors to col-lapse risk. The ground motions displayed in the new maps have been adjusted so that at most locations, when engineers design buildings to resist these accel-erations, buildings will have about a 1 percent chance of collapsing due to an earthquake during their as-sumed lifespan of 50 years.4 The idea of using ground motion values for design that target a specified seismic risk level was pioneered in a 2005 ASCE design standard for nuclear power plants. Now that the concept is being applied more broadly to the collapse of buildings and other non-nuclear struc-tures, efforts are also under way, as part of the 2014 update of the NEHRP Recommended Seismic Provi-sions, to adapt risk targeting to damage-related down-time in hospitals and other essential facilities.
Impact for Design Because of their focus on uniform ground motion probability (seismic hazards) rather than uniform col-lapse probability (seismic risks), the old MCE maps have indirectly required that in some areas of the country, engineers design buildings more stringently (so that they are less likely to collapse) than in other regions. The new risk-targeted maps in the 2012 IBC have reduced this variability so that the risk of col-lapse and thereby the design stringency are nominally the same regardless of location. Around the New Madrid (MO) Seismic Zone in the Central United States and along coastal South Caroli-na and Oregon, the new maps have decreased the seismic forces that engineers must design against by as much as 30 percent compared to corresponding uniform-hazard maps like those used in previous IBC editions. At most other locations, the ground motions have changed by less than 15 percent. Around Sacra-mento, CA, however, the new risk-targeted values are approximately 20 percent higher than on earlier maps. Figure 2 shows other examples of the differ-ences between the new and previous ground motion values. Research Sources Although these differences are mostly due to the risk-targeting concept, several other changes made to the IBC maps in 2012 also contributed. Among these was the incorporation of updated data via the latest (2008) seismic hazard computations produced by the USGS National Seismic Hazard Mapping (NSHM) Project. Earlier maps were based on previous NSHM results. For decades, the NSHM Project has combined re-search on potential sources of earthquakes (faults and locations of past seismic events), on the potential magnitudes and frequencies of earthquakes from the-se sources, and on the ground motion values that could be generated by these events, to calculate the probabilities that these potential ground motions will be exceeded during a specified period such as 50 years. Development of the new risk-targeted maps depended not only on the ground-motion results
2 The IBC editions published in 2000, 2003, 2006, and 2009 contain MCE maps. 3 Spectral acceleration refers to the largest change in velocity experienced by a structure during an earthquake. 4 The collapse risk of 1% in 50 years is about what had been achieved in the western U.S. using the ground motions specified in the old MCE maps.
For more information, visit www.nehrp.gov or send an email to [email protected].
SeismicWaves June 2012
Page 3
provided through the NSHM Project, but also on de-termining how likely these levels of shaking were to collapse buildings. The relationship between ground motion and building collapse was examined in depth through FEMA-funded research completed in 2009 by the Applied Technology Council.5 This study conduct-
ed thousands of computer simulations of earthquake-induced building collapses in order to determine the expected probabilities of collapse associated with the potential ground motions identified by USGS.
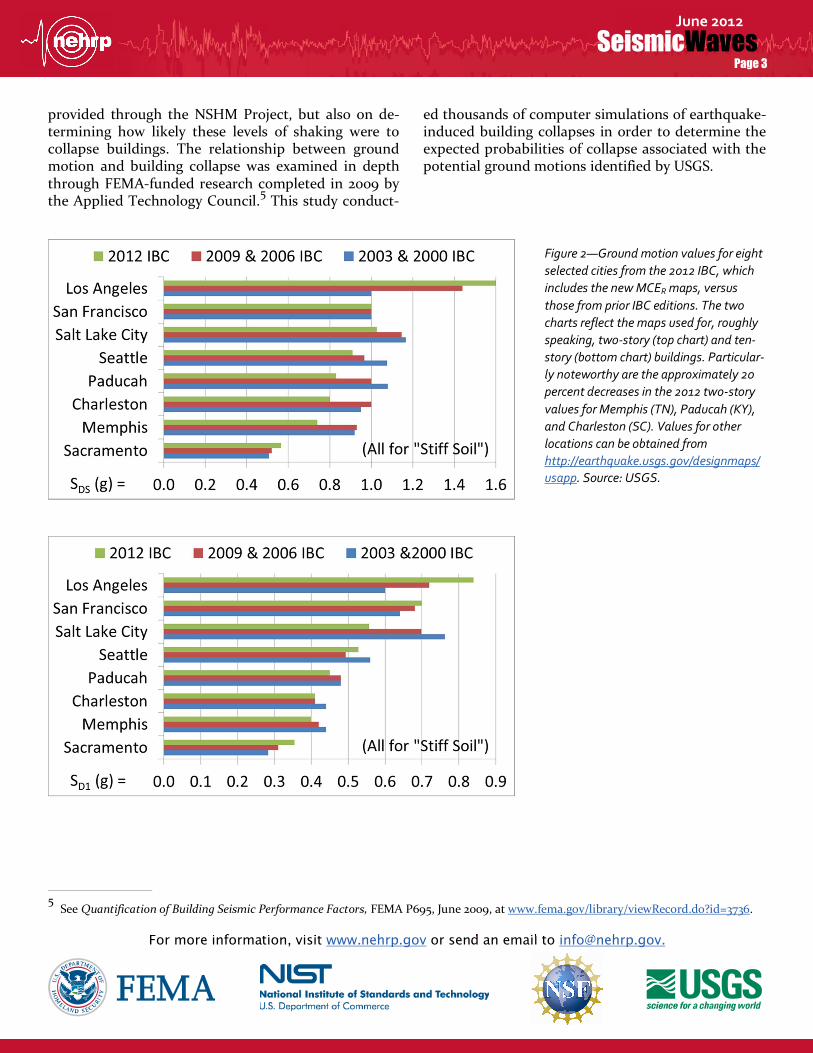
Figure 2—Ground motion values for eight selected cities from the 2012 IBC, which includes the new MCER maps, versus those from prior IBC editions. The two charts reflect the maps used for, roughly speaking, two-story (top chart) and ten-story (bottom chart) buildings. Particular-ly noteworthy are the approximately 20 percent decreases in the 2012 two-story values for Memphis (TN), Paducah (KY), and Charleston (SC). Values for other locations can be obtained from http://earthquake.usgs.gov/designmaps/usapp. Source: USGS.
5 See Quantification of Building Seismic Performance Factors, FEMA P695, June 2009, at www.fema.gov/library/viewRecord.do?id=3736.