JUNE 2009 Also in this issue: Special 16-Page Center ...pubs.awma.org/gsearch/em/2009/6/EM...
60
JUNE 2009 The Road Ahead What Is Driving Advanced Transportation Policies and Technologies? Also in this issue: Special 16-Page Center Pullout 2009 A&WMA Honors & Awards A Summary of the 39th Annual A&WMA Critical Review Who Owns Satellite Air Quality Measurements? p. 38
Transcript of JUNE 2009 Also in this issue: Special 16-Page Center ...pubs.awma.org/gsearch/em/2009/6/EM...

JUNE 2009
The Road AheadWhat Is Driving Advanced Transportation Policies and Technologies?
Also in this issue:
Special 16-Page Center Pullout2009 A&WMA Honors & Awards
A Summary of the 39th Annual A&WMA Critical ReviewWho Owns Satellite Air Quality Measurements? p. 38

PROFESSIONAL DEVELOPMENT OPPORTUNITIES
Harmonizing Greenhouse Gas Assessment and Reporting Processes
The reporting of accurate and consistent data is key to determining the success of climate action plans andmitigation measures. Harmonizing Greenhouse Gas Assessment and Reporting Processes will provide aforum to discuss advances in greenhouse gas emission estimation methods, emission inventories, andreporting. Industry experts will examine the convergence of mandatory and voluntary reporting initiatives,and emerging technical and policy issues.
Professional Development Courses:August 31 - AIR-129: Your GHG Program: Practical Considerations for Managing Greenhouse
Gas Emissions in an Evolving LandscapeAugust 31 - AIR-128: Greenhouse Gas Emissions Management
Air Quality Impacts of Oil and Gas Production in the Rocky Mountains
Air Quality Impacts of Oil and Gas Production in the Rocky Mountains will explore the potential impacts of oiland gas exploration and production activities on air quality in the Rocky Mountain region. Environmentalprofessionals working in the oil and gas industries, government, consulting, and academia will not want to missthis opportunity to join industry experts to discuss observations on air quality changes and air monitoring studiesin the Front Range region; positions and concerns about oil and gas; state regulatory programs and plans;industry concerns and actions to address air quality issues; and pollutant specific air quality issues.
Guideline on Air Quality Models: Next Generation of Models
Guideline on Air Quality Models: Next Generation of Models will provide a technical forum for environmentalprofessionals to discuss proposed revisions to the U.S. Environmental Protection Agency’s Guideline on AirQuality Models that is required for use in the preparation of state implementation plans, federal constructionpermits, and state permits. Source owners, regulatory agencies, and consultants won’t want to miss thisinternational symposium to discuss the technical and regulatory issues associated with these proposed changes.
Professional Development Courses:October 26 - AIR-298: Introduction to the CALPUFF Modeling SystemOctober 27 - AIR-297: Introduction to AERMOD
ISES 2009
The International Society of Exposure Science's (ISES) 2009 Annual Conference, Transforming ExposureScience in the 21st Century, will gather scientists from a wide range of disciplines to share research activitiesand identify critical needs for exposure science. ISES will provide a forum to discuss global, regional, local,emerging, and high impact issues in environmental exposure.
VISITWWW.AWMA.ORG/EVENTS FOR MORE INFORMATION
August 31-Sept. 2, 2009Baltimore, MD
September 15-16, 2009Centennial, CO
October 28-30, 2009Raleigh, NC
November 1-5, 2009Minneapolis, MN
Transforming Exposure Science in the 21st Century
2009ISESMinneapolis

awma.org june 2009 em 1Copyright 2009 Air & Waste Management Association
EM, a publication of the Air & Waste Management Association (ISSN 1088-9981), is published monthly with editorial and executive offices at One Gateway Center, 3rd Floor, 420 Fort Duquesne Blvd., Pittsburgh, PA 15222-1435. ©2009 Air & Waste Management Association. All rights reserved. Materials may not be reproduced, redistributed, or translated in any form without prior written permission of the Editor. Periodicals postage paid at Pittsburgh and at an additional mailing office. Postmaster: Send address changes to EM, Air & Waste Management Association, OneGateway Center, 3rd Floor, 420 Fort Duquesne Blvd., Pittsburgh, PA 15222-1435. GST registration number: 135238921. Subscription rates are $265/year for nonprofit libraries and nonprofit institutions and $405/year for all other institutions. Additional postage charges may apply. Pleasecontact A&WMA Member Services for current rates (1-800-270-3444). Send change of address with recent address label (6 weeks advance notice) and claims for missing issues to the Membership Department. Claims for missing issues can be honored only up to three months for domes-tic addresses, six months for foreign addresses. Duplicate copies will not be sent to replace ones undelivered through failure of the member/subscriber to notify A&WMA of change of address. A&WMA assumes no responsibility for statements and opinions advanced by contributors to thispublication. Views expressed in editorials are those of the author and do not necessarily represent an official position of the Association.
A Brief History of Technology-Forcing Motor Vehicle Regulationsby Paul Miller and Matt Solomon, Northeast States for Coordinated Air Use ManagementPage 4
Moving Toward Clean Vehicles and Fuels: A Global Overviewby Michael Walsh, international transportation consultantPage 10
FEATURES
ASSOCIATIONNEWSMessage from the President . . . . . . . . . . . . . . 2June in Detroit—Big Doingsand Big Ideas
Message from theTreasurer . . . . . . . . . . . . . 43Financial Statement for 2008
The Member Minute . . . 56Steve Rybolt
DEPARTMENTSAdvertisers’ Index . . . . . . . . 36IPEP Quarterly . . . . . . . . . . 44EPA Research Highlights . . 46News Focus. . . . . . . . . . . . . 48ICAC Update . . . . . . . . . . . 50Washington Report. . . . . . . 51Canadian Report. . . . . . . . . 52Professional Development Programs. . . . . . . . . . . . . . . 53JA&WMA Table of Contents . . . . . . . . . . . . . . . 54Calendar of Events . . . . . . . 55
Electricity Grid Impacts of Plug-In Electric Vehicle Chargingby Christopher Yang and Ryan McCarthy, the Sustainable Transportation Energy Pathways(STEPS) Program at the University of California, DavisPage 16
A Summary of the 39th Annual A&WMA Critical Review: Who Owns Satellite Air Quality Measurements?by Ray HoffIn the 39th Annual A&WMA Critical Review, “Remote Sensing of Particulate Pollution from Space: Have We Reached the Promised Land?,” R.M. Hoff and S.A. Christopher discuss the state of the art of the measurement of air pollutionfrom space-borne platforms.Page 38
Reducing Heavy-Duty Vehicle Fuel Consumption andGreenhouse Gas Emissionsby Coralie Cooper, Northeast States for Coordinated Air Use Management;Fanta Kamakat, International Council on Clean Technology; Thomas Reinhart,Southwest Research Institute; and Robert Wilson, TIAX LLCPage 21
Bus Rapid Transit: A Cost-Effective Mass Transit Technologyby Walter Hook, Institute for Transportation and Development PolicyPage 26
Reducing Transportation Sector Greenhouse Gas Emissions:Case Studies in Operational Strategiesby Jennifer DunnPage 32
Advanced Transportation TechnologiesTo coincide with A&WMA’s 2009 Annual Conference & Exhibition, which takes place later this month in Detroit, EM takesa look at emerging advanced transportation policies and technologies, including electric plug-in vehicles, hydrogen fuelcells, hybrids, and rapid mass transit, along with associated infrastructure issues and the status of vehicle greenhouse gasemissions in the United States.
NEXT MONTH:
Mercury Control Technologies
Printed on Recycled Paper
2009 A&WMA Honors & Awards
Special 16-page Insert!
2009
A&WMAHonors & Awards

awma.org
I hope you are reading this while on your way toDetroit for A&WMA’s Annual Conference & Exhi-bition (ACE) because there’s going to be “a wholelot a shakin’ going on.” Our program reflects theideas in the world at large and the events that areunfolding as we convene.
Take a look at this year’s technical program andyou’ll see plenty for most every professional need,with a special emphasis on climate and energy. I’mequally excited to hear about carbon emissioncontrols and the evolving policies leading up to the United Nation’s meeting in Copenhagen inDecember.
So why is ACE so timely? Let’s begin with the “little” matter of an auto emission standard waiverfor California (and at least a dozen other states) thatU.S. Environmental Protection Agency (EPA) Administrator Lisa Jackson and her staff are consid-ering. The first step came on April 16, when EPAproposed a finding of endangerment from green-house gas emissions from vehicles. The waiver decision is due at the end of this month. I’ll forgoa treatise on the U.S. Clean Air Act and court decisions, but this is a very big deal for environ-mental advocates, numerous states, automakers,and…perhaps even our environment. Many considerthis a slam dunk to reverse the Bush administration’sdecision, but there’s a lot at stake with U.S. au-tomakers struggling mightily to stay afloat in thecurrent economy.
An interesting wrinkle is that the Waxman–Markeydraft energy/climate bill, titled the American CleanEnergy and Security Act of 2009, proposes a moreuniform national emission standard. Released onMarch 31, the “discussion” runs 648 pages, so this
ADVERTISINGMalissa [email protected]
EDITORIAL Lisa BucherManaging Editor
EDITORIAL ADVISORY COMMITTEEA. Gwen Eklund, ChairTRCAnn McIver, QEP, Vice ChairCitizens Energy GroupFerdinand B. AlidoNavistar Inc.John D. BachmannVision Air ConsultingJane C. BartonPatterson ConsultantsPrakash Doraiswamy, Ph.D.State University of New York at AlbanyJennifer B. Dunn, Ph.D.URS Corp.Steven P. Frysinger, Ph.D.James Madison UniversityJohn D. KinsmanEdison Electric InstituteAshok KumarUniversity of ToledoMiriam Lev-On, Ph.D.The LEVON GroupJulian A Levy, Jr.Exponent Inc.Mingming LuUniversity of CincinnatiCharles E. McDadeUniversity of California at DavisPaul J. MillerNortheast States for Coordinated Air
Use ManagementDan L. Mueller, P.E.CDM Inc.Chris Pepper Jackson WalkerS.T. RaoU.S. Environmental Protection AgencyDaniel R. WeissDuke Energy IndianaSusan S.G. WiermanMid-Atlantic Regional Air
Management Association
PUBLICATIONS COMMITTEEJudith C. Chow, ChairDesert Research Institute
A&WMA HEADQUARTERSAdrianne Carolla, CAEExecutive Director
Air & Waste Management AssociationOne Gateway Center, 3rd Floor420 Fort Duquesne Blvd.Pittsburgh, PA 15222-14351-412-232-3444; 412-232-3450 (fax)[email protected]
June in Detroit—Big Doings and Big Ideasby Rick [email protected]
is a mammoth piece of legislation. My copy of the1990 Clean Air Act tops out at 451 pages and weare still trying to sort out some details 19 years on!Beyond its bulk, the most notable feature of thisproposal is that so much of it was derived from rec-ommendations of the U.S. Climate Action Partnership(USCAP; www.us-cap.org).
USCAP is a pretty surprising partnership that includesthe likes of Detroit’s Big Three Automakers, Dow,Conoco-Phillips, and Duke Energy collaboratingwith the Environmental Defense Fund, Natural Re-sources Defense Council, World Resources Institute,and the Pew Center for Climate Change. My manyyears in the regulatory arena taught me at leastone major lesson: the best policy usually comesfrom constructive participation from the real playersin the matter. The ideas of USCAP and those in theWaxman–Markey draft are certainly not universallyembraced and nor they should be, but at least wehave a starting point with significant thought fromsome very focused business people and passionate,yet practical, environmental advocates.
Thank goodness our Association does not advocatepolices, but we do provide that neutral forumwhere spirited debate can take place and result ineven better informed professionals. After all, we arethe ones who have to figure out how to serve anddigest the policy sausage that is made in Congress!
emawma.org
em • message from the president
2 em june 2009 Copyright 2009 Air & Waste Management Association

Mark your calendars now and plan to join us in Calgary for the environmental industry’spremier education, networking, and solutions event!
The Air & Waste Management Association’s 103rd Annual Conference & Exhibition (ACE)will feature:
• Over 500 exciting speakers • An expansive exhibit hall• Professional development courses • Fun social and networking eventstaught by industry leaders • And much more!
Based around the conference theme “Energy and Environment” the ACE technical programwill explore a wide range of related issues including the future of fossil fuels, alternativeenergy solutions, and greenhouse gas emissions management, innovation, and technology.
ENERGYAND ENVIRONMENT
CALGARY 2010
www.awma.org/ACE2010
A&WMA’S 103rd ANNUALCONFERENCE & EXHIBITIONJUNE 22-25, 2010 • CALGARY TELUS CONVENTION CENTRE • CALGARY, ALBERTA, CANADA

4 em june 2009 awma.orgCopyright 2009 Air & Waste Management Association
em • feature
by Paul Miller and Matt Solomon
Paul J. Miller is the deputy director and Matt Solomon isa mobile source analyst at theNortheast States for Coordi-nated Air Use Management(NESCAUM), Boston, MA. E-mail: [email protected].
Faced with the worst air quality in the United States, California began in the 1960s to pursuea “technology-forcing” approach in establishing motor vehicle tailpipe emission standards.This approach sought to advance vehicle pollution control technology by establishing future tailpipe emission limits even if no technologies existed to meet them at the timeregulators set the standards. The U.S. government later incorporated technology-forcinginto the 1970 U.S. Clean Air Act (CAA), and it has remained the main regulatory focusfor bringing cleaner cars to market in the United States for almost 40 years.
A Brief History ofTechnology-Forcing Motor Vehicle Regulations
4 em june 2009 awma.org

awma.org june 2009 em 5Copyright 2009 Air & Waste Management Association
Technology-forcing standards typically create muchdisagreement between regulators and automakersover what is technologically achievable at a reason-able cost by the regulatory deadline. A running example is the debate surrounding California’s low-emission vehicle (CA LEV) program, launched in1990. Major issues since the inception of this program have been ultra-low-emission vehicle(ULEV) standards, a requirement for automakersto sell zero-emission vehicles (ZEVs), and a morerecent attempt to limit greenhouse gas (GHG)emissions from light-duty vehicles. The debatehas gone beyond California and now includes anumber of other states that have adopted California’sLEV program in lieu of federal standards.
In light of the continuing vigorous debate overtechnology-forcing standards, the question arises:how did California, and subsequently the U.S. federalgovernment, come to pursue a technology-forcingpath? This article briefly describes California’s experience during the 1960s that eventually ledthe state to shift to technology-forcing approaches,the adoption of this approach at the federal level,and some of the results.
Technology-Following in CaliforniaPolicies to require advanced pollution control tech-nologies did not originally start out as technology-forcing. California initially began by implementingtechnology-following policies. Under this approach,California did not require automobile pollution controls until a minimum number of developersdemonstrated that they had technologies capableof meeting a predetermined emissions level at areasonable cost. California regulators establishedcriteria to be met by proposed control devices, taking into account purchase and installation cost,durability, ease of ensuring continuing reliabilityonce installed, and any other factors thought tobear on the suitability of the devices. The “otherfactors” included the financial stability of the manufacturer, and the manufacturer’s ability to
produce, distribute, and maintain adequate stocksto fit most cars.2
California’s technology-following approach requiredtwo devices to be certified by regulators beforethey were mandated for installation in new vehicles.California required two demonstrated technologiesrather than one because it did not want to give thefirst innovator a monopoly in the pollution controlmarket. For automakers, this provided an incentivenot to acknowledge their own efforts until at leasttwo control devices were certified.
California’s attempt at technology-following playedout in the following sequence of events. In March1964, the major automakers stated that they wouldnot be able to meet California’s new emissionsaveraging standard until 1967. Just three monthslater, however, state regulators certified four exhaustdevices that could meet the averaging standard.All four devices were developed by independentmanufacturers, not the major automakers. Becausethe two-device certification threshold had beenreached, the automakers were required to meetthe emissions averaging standard in 1966, a fullyear before they previously said they could.
In August 1964, only two months after Californiacertified the first four exhaust devices, the automakers announced they had developedengine modifications that were superior to the independent manufacturers’ add-on devices andcould be installed by the 1966 model year. Noneof the four independently developed devices wasactually used by the automakers. As a result of theirexperience, many independent technology devel-opers left the field of automotive emission controls, saying that the California process was too unreli-able to justify the investments needed to developcleaner technologies.2
The speed with which the auto companies com-mercialized their emission control technologies,
California initially began by implementingtechnology-following policies.
“We’d like to tell you we just up and did it, but it’s the regs.”General Motors’ Camaro design team member, commenting in 1995 on how federal motor vehicle pollution limits led to a trio of benefits: lower pollution, more power, and better fuel economy.1

6 em june 2009 awma.orgCopyright 2009 Air & Waste Management Association
after claiming that it would take them longer, raisedquestions of whether the companies had colludedto keep cleaner vehicle technologies from the mar-ket. In January 1969, the U.S. Justice Departmentfiled an action under the Sherman Antitrust Actagainst the auto industry’s trade association, thenknown as the Motor Vehicles Manufacturers Association (MVMA) and its individual membercompanies (General Motors, Ford, Chrysler, andAmerican Motors). The action charged that theauto industry had, from as early as 1953, “engagedin a combination whose dual objects were the elim-ination of all competition in the research, develop-ment, manufacture, and installation of air pollutioncontrol equipment and the elimination of compe-tition in the purchase of patents and patent rightsfrom other parties covering air pollution controlequipment.”3
The Justice Department’s suit was settled througha consent judgment in October 1969. One provisionof the consent judgment prohibited the automakersfrom exchanging unpublished policy or technicalinformation on pollution control devices. A secondprovision also prohibited the automakers from filing any jointly-authored statements with any government regulatory agency having authority toissue automobile emission standards. The consent
judgment expired in 1982 and is no longer in effect.
As a result of this experience with technology-following, California shifted to technology-forcing,of which the California LEV program is a currentmanifestation.
Technology-Forcing at theNational LevelUp until the 1970 CAA, the federal government,like California, had pursued a technology-followingpolicy for automobiles. It too failed to adequatelyadvance technology development, as reflected intestimony by the U.S. Health, Education, and Welfare Secretary John Gardner at a 1967 con-gressional hearing:
[T]he state of the art has tended to meander alonguntil some sort of regulation took it by the hand andgave it a good pull. … There has been a long period of waiting for it, and it hasn’t worked verywell. … If we can stimulate more rapid developmentof the state of the art through setting the standardsat a point which we really have to reach for them, somuch the better.4
Senator Edmund Muskie of Maine spoke outstrongly during the legislative debates in supportof the change in policy to technology-forcing:
The first responsibility of Congress is not the makingof technological or economic judgments—or even tobe limited by what is or appears to be technologicallyfeasible. Our responsibility is to establish what thepublic interest requires to protect the health of persons.This may mean that people and industries will beasked to do what seems to be impossible at the present time. But if health is to be protected, thesechallenges must be met.2
These arguments, coupled with historical experi-ence, led to the 1970 CAA Amendments largelyabandoning technology-following in favor of technology-forcing in setting vehicle emission stan-dards at the national level.
Results of Technology-ForcingFigure 1 displays the downward trend in vehicleemission limits for nitrogen oxides (NOX) since1970 with the shift to technology-forcing approaches
Figure 1. Comparative trends in California and U.S. NOX technology-forcing tailpipe emissionstandards for passenger cars since 1970, and projected future trends for GHG limits.
Notes: Dashed lines indicate future limits not formally adopted. California’s GHG standard is set in grams per mile, which is not a fuel economy standard given by miles per gallon as withCAFE. For purposes of comparison with CAFE projections, however, the impact of the standardhas been projected on a miles per gallon basis.11

awma.org june 2009 em 7Copyright 2009 Air & Waste Management Association
in California and at the national level. Similar down-ward trends occurred with volatile organic com-pounds (VOCs) and carbon monoxide tailpipelimits (not shown in figure). Note that the federalNOX limits, while trending downward, tend to lagin time behind California’s.
Figure 1 also shows past and projected futuretrends in the U.S. Corporate Average Fuel Economy(CAFE) standard for passenger vehicles. The CAFEtrend shows little sustained historical change, and ittook congressional action in 2007 to alter its expectedfuture trend. California is seeking to adopt GHGlimits for light-duty vehicles to address climatechange, and while not for the same purpose asCAFE (a fuel economy standard), Figure 1 suggeststhat California has taken a more aggressive approach for GHG reductions,5 which would beconsistent with the historical trends seen with NOX
(i.e., California standards tend to lead federal limits).
Technology-forcing at perhaps its most extreme isCalifornia’s requirement to produce and sell zero-emission vehicles. This has at times been called a
failure and over-reaching. The ZEV rule has nowbeen modified several times, and its vision of significant fleet penetration (the original rule calledfor ZEVs to represent 10% of light-duty vehiclesales by 2000) has been scaled back. Even so, “failure” depends on perspective, as California’sZEV mandate has produced rapid advancementsin electric vehicle technology. The requirement hashelped accelerate the commercialization of hybridelectric vehicles that took advantage of advancesin batteries and other components for electric vehicles, and the technology push continues withplug-in hybrid electric vehicles that even moreclosely approach the goal of ZEVs.6
Historical VestigesWhile technology-forcing approaches grew out ofthe failures of technology-following policies, effortsakin to technology-following have not entirely disappeared. In 1995, for example, the U.S. Envi-ronmental Protection Agency (EPA) proposed analternative program, called National LEV, for statesoutside of California to adopt in lieu of the CA LEVprogram.

8 em june 2009 awma.orgCopyright 2009 Air & Waste Management Association
National LEV included an Advanced TechnologyVehicle (ATV) component that made sales of ZEVsvoluntary. EPA outlined a series of tasks to performto facilitate the emergence of an ATV market, andcalled for establishing criteria “needed to sustainretail sales.” EPA recognized this was a different approach than technology-forcing, but felt it wasappropriate to try a different model toward achievingenvironmental benefits.7 The use of prospective criteria, however, is the approach that Californiaand federal regulators tried in the 1960s that wassubsequently discarded as a failure.
In 1992, the U.S. automakers established the U.S.Council for Automotive Research (USCAR) to coordinate a variety of joint industry research efforts,such as the U.S. Advanced Battery Consortium andthe Partnership for a New Generation of Vehicles.Automakers developed performance and cost criteria to be met before a technology was deemedno longer at the pre-commercial stage. This is atechnology-following approach, as well as a formof industry collaboration that might have been prohibited under the expired 1969 antitrust consent judgment.
Responses to advances in vehicle technology alsofind recent parallels with past history. While ZEVswere considered the most onerous of the CaliforniaLEV program requirements, U.S. automakers alsostrongly criticized the ULEV standard when originallyadopted as unrealistically expensive to achieve.Honda announced in 1995, however, that it couldbuild a gasoline-powered engine that would achieveULEV emissions a reasonable cost.8 Other automak-ers quickly downplayed the announcement and
suggested that they too would soon bring compa-rable technologies to the market. A Ford spokesper-son said, “Probably all manufacturers have somevehicles that meet the ULEV levels… We justchoose not to make announcements until we’vegone through all the hurdles.”9 Another Fordspokesperson stated, “They’re the first to announceit, but it’s our hunch that you’re going to see otherpeople announcing the same thing, and bringingout other products in the same time frame.”10
Honda responded with, “There’s been a tone of,‘This can’t be done.’ Now it’s, ‘Aw, anybody can dothat.’ It’s kind of funny.”9 The “it can’t be done” followed by “we’ve already done it” harkens backto 1964 and the auto industry’s rapid rollout of engine modifications following the certification ofindependently developed emission control products.
SummaryLooking at the historical record, it’s clear that tech-nology-forcing mandates to promote advancedtechnology vehicles were not the result of sponta-neous generation. Rather, they branched off oftechnology-following policies that had reached evolutionary dead ends. Throwbacks to technol-ogy-following continue to arise from time to time,however, despite the positive progress made in developing cleaner cars with technology-forcingstandards. With the advent of efforts to regulateGHG emissions from motor vehicles, the back-and-forth tension between technology-following andtechnology-forcing is likely to continue. em
References1. Anti-Smog Push Sparks Revved-Up Engines; USA Today, August 17, 1995, p. 1B.2. Krier. J.E.; Ursin, E. Pollution and Policy: A Case Essay on California and Federal Experience with Motor Vehicle Air Pollution 1940–1975; University
of California Press: Berkeley, CA, 1977.3. United States vs. Motor Vehicles Mfrs. Ass’n, 643 F.2d 644, 645 (1981).4. Hearings on Air Pollution—1967, Hearings before the Subcommittee on Air and Water Pollution, Senate Committee on Public Works, 90th
Cong., 1st Sess., pt. 2, p. 766-767 (1967) (testimony of Secretary John Gardner, U.S. Department of Health, Education, and Welfare).5. The ability for California to adopt GHG emission standards for light-duty vehicles is dependent upon the U.S. Environmental Protection Agency
approving a request from the state.6. Burke, A.; Kurani, K.; Kenney, E. J. Study of the Secondary Benefits of the ZEV Mandate; Institute of Transportation Studies, University of California,
Davis, CA; Paper UCD-ITS-RR-00-07, 2000; available at http://repositories.cdlib.org/itsdavis/UCD-ITS-RR-00-07 (accessed March 2009).7. Fed. Regist. 1995, 60, 52,761 (October 10, 1995).8. Honda Announces Gas Engine Meets Anti-Pollution Goals; The Washington Post, January 7, 1995, p. A1.9. Flap over ‘Clean’ Engine: Competitors Cry Foul over Much-Publicized Announcement; USA Today, January 13, 1995, p. 2B.10. New Honda Engine a Threat to Natural Gas; The New York Times, January 9, 1995, p. D1.11. Comparison of Greenhouse Gas Reductions for the United States and Canada Under U.S. CAFE Standards and California Air Resources Board Green-
house Gas Regulations—An Enhanced Technical Assessment; California Air Resources Board, Sacramento, CA, 2008; available atwww.arb.ca.gov/cc/ccms/reports/pavleycafe_reportfeb25_08.pdf (accessed March 2009).
With the advent of efforts to regulate GHGemissions frommotor vehicles, the back-and-forthtension betweentechnology-following and technology-forcingis likely to continue.


10 em june 2009 awma.orgCopyright 2009 Air & Waste Management Association
em • feature
by Michael Walsh
Michael P. Walsh is an international transportationconsultant based in Virginia. E-mail: [email protected].
Since the end of World War II, the world’s motor vehicle population has seen strong andsteady growth. Over the past six decades, it has gradually spread from North America toEurope and now Asia and, to a lesser extent, Latin America. Vehicles have brought manyperceived improvements to people’s lives, but they have also changed many cities intosprawling conurbations, developed a huge thirst for oil, become a major source of airpollution, and now are the most rapidly growing contributor to climate change.
Moving Toward CleanVehicles and FuelsA G l o b a l O v e r v i e w

awma.org june 2009 em 11Copyright 2009 Air & Waste Management Association
Trends in World Motor Vehicle Production, Fleets, and EmissionsGrowth in motor vehicle production since 1945has been dramatic, rising from approximately 5 million vehicles annually to more than 60 million.Between 1970 and 2005, approximately 1 millionmore vehicles have been produced each year com-pared to the year before, with almost 66 millionvehicles produced in 2005 alone (see Figure 1).1
While the current global recession is causing adeep production decline, it is likely to rebound andgo beyond former levels within a few years.2
Since vehicles have been produced at a faster ratethan they have been scrapped, the global vehiclefleet has steadily grown (see Figure 2). The globalvehicle population exceeded 1 billion in 2002 andcontinues to rise. Since 1990, approximately 27 million more vehicles are on roads and high-ways each year compared to the previous year.
Motor vehicles emit carbon monoxide (CO), hydrocarbons (HCs), nitrogen oxides (NOX), sulfuroxides (SOX), and such toxic substances as benzene,formaldehyde, acetylaldehyde, 1,3,butadiene, particulate matter (PM10 and PM2.5), and lead(where still added to gasoline). Each of these, alongwith secondary byproducts such as ozone and small particles (i.e., nitrates and sulfates), can cause serious adverse effects on health and theenvironment.
The greenhouse gases (GHGs) most closely iden-tified with transportation are carbon dioxide (CO2),nitrous oxide (N2O), and methane (CH4). Othervehicle-related pollutants also contribute to globalwarming, although their quantification is more difficult; these include CO, nonmethane hydrocar-bons (NMHCs), nitrogen dioxide (NO2), andozone (O3). Black carbon (soot) emitted fromdiesel vehicles is another emerging GHG concern.3
Great progress in reducing emissions from gasoline-fueled cars has occurred in the major industrializedcountries and stringent requirements for diesel vehicles are starting to occur. However, the vehiclepopulation and vehicle kilometers traveled willlikely continue to grow, especially in developingcountries, which could offset reductions made to date.4
Emissions Reduction ProgressThe three dominant regulatory programs in theworld are the United States (including California),the European Union (EU), and Japan. The EU andU.S. standards and test procedures, or some mixture of them, have been adopted by manyother countries. With regard to passenger cars, approximately 60% of the world’s fleet is followingthe EU regulatory road map and almost 30% follow the U.S. path. The vast majority of diesel carsare following the EU path. For light trucks, morethan 60% follow the U.S. standards, whereas morethan 70% of heavy trucks follow the EU emissionsstandards. No other country outside of Japan requires the Japanese standards.
Figure 3 summarizes recent light-duty vehicle standards for NOX and PM emissions. While U.S.
Figure 1. Annual production of cars, trucks, and buses.
Figure 2. World motor vehicle population.

12 em june 2009 awma.orgCopyright 2009 Air & Waste Management Association
and EU compliance test procedures differ, the control technologies used are very similar and by2015 should be almost identical. With regard toheavy-duty vehicles and engines, the United Stateswill phase in very stringent NOX and PM require-ments in 2010 and Europe will introduce similarcontrols a few years later.
Diesel Vehicles and FuelsDiesel engines emit more NOX and PM thanequivalent gasoline engines. Reducing PM tendsto be the higher priority because ambient PM levels are often above recommended health levelsand are responsible for hundreds of thousands ofpremature deaths each year. The California Air Resources Board and many other organizationsconsider diesel particulate (soot) to be toxic. NOX
emissions are important for causing or contributingto ambient NO2, O3, and nitrate PM.
Modifying engine parameters to simultaneously reduce NOX and PM is difficult since the optimalsettings for one pollutant frequently increases emis-sions of the other. To attain very low levels of bothNOX and PM, therefore, requires exhaust treat-ment. Lean NOX catalysts, selective catalytic reduction, NOX storage traps, PM filter traps, andoxidation catalysts are technologies that are beingphased in at differing rates in various parts of theworld. A new type of diesel, the homogeneouscharge compression ignition engine, provides an-other approach to reducing NOX and particulatesthat is receiving significant attention and may beintroduced on some engines within a few years.
Diesel fuel is a complex mixture of hydrocarbonswith the main groups being paraffins, napthenes,and aromatics. Organic sulfur is also naturally present. Additives are generally used to influencefuel properties, such as flow, storage, and combus-tion characteristics. The actual diesel fuel propertiesdepend on refining practices and the crude oilfeedstock.
The quality and composition of diesel fuel can significantly influence emissions from diesel engines.The most important fuel characteristic is sulfur because it contributes directly to PM and high sulfur levels hinder applications of the most effectivePM and NOX control technologies. Filters or trapswhich reduce more than 90% of PM are becomingwidely available. NOX adsorbers and selective catalytic reduction systems are also being intro-duced, with NOX adsorbers being especially sensitive to sulfur. Complying with the most stringentstandards will require maximum sulfur levels aslow as 10–15 parts per million (ppm). Higher levels impair optimal performance of the controlsystems, and the in-use emissions will likely exceedstandards. For cleaner vehicles, depending on thetechnology employed, higher sulfur fuels couldcause permanent damage.
Gasoline Vehicles and FuelsThe pollutants of greatest concern from gasoline-fueled vehicles are CO, NOX, lead, and certaintoxic HCs such as benzene. Each of these can be
Euro 4Euro 5
Euro 6US Tier 2 Avg
CA LEV 2 MaxCA Sulev
0
0.05
0.1
0.15
0.2
0.25
0.3
Grams/Km
Gasoline NOx Diesel NOx Diesel PMx10
Figure 3. EU and U.S. light-duty gasoline and diesel vehicle standards.
Figure 4. Projected GHG emissions for new passenger vehicles by country/region.
Gram
s CO 2
-eq
per K
ilom
eter

awma.org june 2009 em 13Copyright 2009 Air & Waste Management Association
influenced by the composition of the gasoline usedby the vehicle.
The use of catalyst exhaust gas treatment requiredthe elimination of lead from gasoline. This change,which started during the 1970s and has now occurred throughout most of the world (the latestestimate is only 17 countries still allow lead), hasresulted in a dramatic reduction of ambient leadlevels. Other gasoline properties that can be adjusted to reduce emissions include, roughly inorder of effectiveness, sulfur level, vapor pressure,distillation characteristics, light olefin content, andaromatic content (including benzene).5
Modern gasoline engines use computer-controlledintake port fuel injection with feedback controlbased on an oxygen sensor to meter precisely thequantity and timing of fuel delivered to the engine.Control of in-cylinder mixing and use of high-energy ignition promote nearly complete combus-tion. The three-way catalyst provides greater than90% reduction of CO, HCs, and NOX. Designs for
rapid warm-up minimize cold-start emissions. On-board diagnostic systems sense control performance and identify component failures.Durability in excess of 160,000 km, with minimalmaintenance, is now common.
Sulfur in gasoline reduces the efficiency of catalystsand adversely affects heated exhaust-gas oxygensensors. High-sulfur gasoline is a barrier to the introduction of new lean burn technologies usingDeNOX catalysts. Lowering sulfur will enable newand future conventional vehicle technologies to realize their full benefits, and existing vehiclesequipped with catalysts will generally have improved emissions.
Certain other additives put in gasoline can also affect vehicle emissions. Additives such as methyl-cyclopentadienyl manganese tricarbonyl and ferrocene when added to gasoline will increasemanganese-oxide and iron-oxide emissions,respectively, from all categories of vehicles. Becauseof health concerns, an international workshop
14 em june 2009 awma.orgCopyright 2009 Air & Waste Management Association
recently concluded, “The addition of organic man-ganese compounds to gasoline should be haltedimmediately in all nations.”6
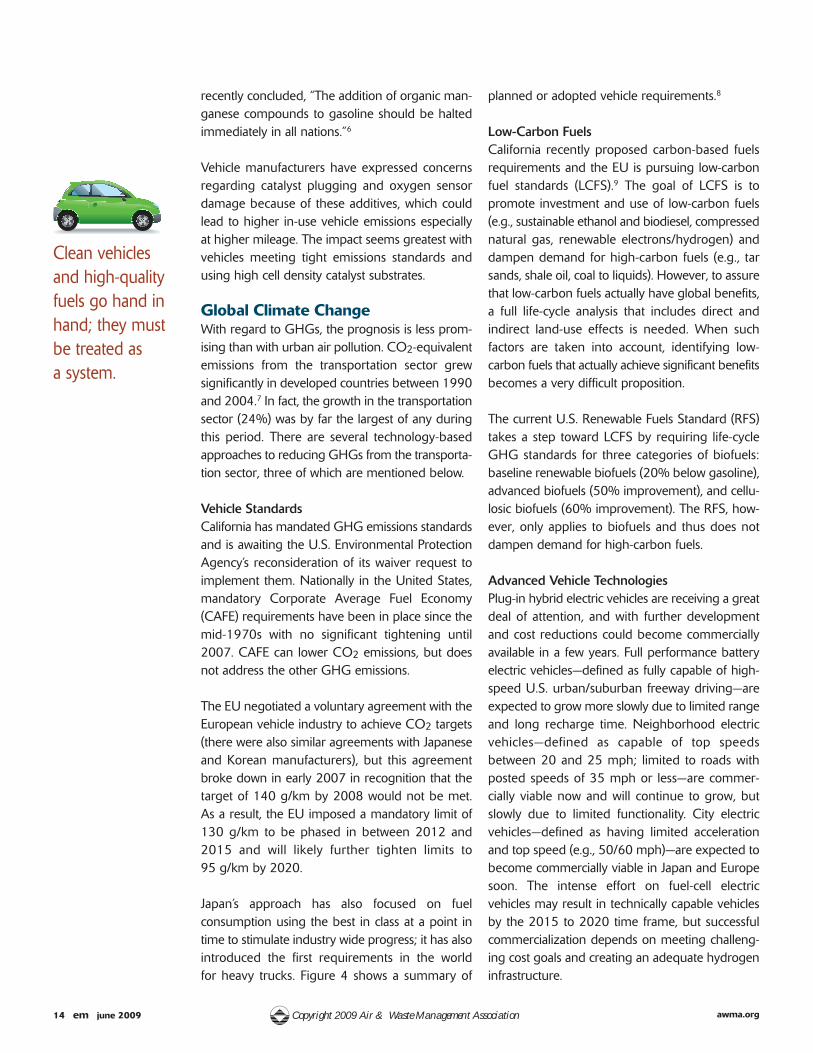
Vehicle manufacturers have expressed concerns regarding catalyst plugging and oxygen sensordamage because of these additives, which couldlead to higher in-use vehicle emissions especiallyat higher mileage. The impact seems greatest withvehicles meeting tight emissions standards andusing high cell density catalyst substrates.
Global Climate ChangeWith regard to GHGs, the prognosis is less prom-ising than with urban air pollution. CO2-equivalentemissions from the transportation sector grew significantly in developed countries between 1990and 2004.7 In fact, the growth in the transportationsector (24%) was by far the largest of any duringthis period. There are several technology-based approaches to reducing GHGs from the transporta-tion sector, three of which are mentioned below.
Vehicle StandardsCalifornia has mandated GHG emissions standardsand is awaiting the U.S. Environmental ProtectionAgency’s reconsideration of its waiver request toimplement them. Nationally in the United States,mandatory Corporate Average Fuel Economy(CAFE) requirements have been in place since themid-1970s with no significant tightening until2007. CAFE can lower CO2 emissions, but doesnot address the other GHG emissions.
The EU negotiated a voluntary agreement with theEuropean vehicle industry to achieve CO2 targets(there were also similar agreements with Japaneseand Korean manufacturers), but this agreementbroke down in early 2007 in recognition that thetarget of 140 g/km by 2008 would not be met. As a result, the EU imposed a mandatory limit of130 g/km to be phased in between 2012 and2015 and will likely further tighten limits to 95 g/km by 2020.
Japan’s approach has also focused on fuel consumption using the best in class at a point intime to stimulate industry wide progress; it has alsointroduced the first requirements in the world for heavy trucks. Figure 4 shows a summary of
planned or adopted vehicle requirements.8
Low-Carbon FuelsCalifornia recently proposed carbon-based fuels requirements and the EU is pursuing low-carbonfuel standards (LCFS).9 The goal of LCFS is to promote investment and use of low-carbon fuels(e.g., sustainable ethanol and biodiesel, compressednatural gas, renewable electrons/hydrogen) anddampen demand for high-carbon fuels (e.g., tarsands, shale oil, coal to liquids). However, to assurethat low-carbon fuels actually have global benefits,a full life-cycle analysis that includes direct and indirect land-use effects is needed. When such factors are taken into account, identifying low-carbon fuels that actually achieve significant benefitsbecomes a very difficult proposition.
The current U.S. Renewable Fuels Standard (RFS)takes a step toward LCFS by requiring life-cycleGHG standards for three categories of biofuels:baseline renewable biofuels (20% below gasoline),advanced biofuels (50% improvement), and cellu-losic biofuels (60% improvement). The RFS, how-ever, only applies to biofuels and thus does notdampen demand for high-carbon fuels.
Advanced Vehicle TechnologiesPlug-in hybrid electric vehicles are receiving a greatdeal of attention, and with further developmentand cost reductions could become commerciallyavailable in a few years. Full performance batteryelectric vehicles—defined as fully capable of high-speed U.S. urban/suburban freeway driving—areexpected to grow more slowly due to limited rangeand long recharge time. Neighborhood electric vehicles—defined as capable of top speeds between 20 and 25 mph; limited to roads withposted speeds of 35 mph or less—are commer-cially viable now and will continue to grow, butslowly due to limited functionality. City electric vehicles—defined as having limited accelerationand top speed (e.g., 50/60 mph)—are expected tobecome commercially viable in Japan and Europesoon. The intense effort on fuel-cell electric vehicles may result in technically capable vehiclesby the 2015 to 2020 time frame, but successfulcommercialization depends on meeting challeng-ing cost goals and creating an adequate hydrogeninfrastructure.
Clean vehicles and high-qualityfuels go hand inhand; they mustbe treated as a system.

awma.org june 2009 em 15Copyright 2009 Air & Waste Management Association
SummaryIncreasing vehicle production and ownership creates continuing pressure to maintain andimprove air quality in cities across the world. Com-pounding the adverse health effects of poor airquality is climate change, another global problemto which motor vehicles are major contributors.Necessary to address these challenges are newemissions control systems and vehicle propulsion
advances beyond the conventional internal combustion engine. Another critically importantlesson learned to date is that clean vehicles andhigh-quality fuels go hand in hand; they must betreated as a system. While success is by no meansguaranteed, vehicle technologies and fuels mustadvance in order to improve upon progress madeto date. em
References1. Wards World Motor Vehicle Data; Wards Communications, 2006.2. Sperling, D.; Gordon, D. Two Billion Cars: Driving Toward Sustainability; Oxford University Press, 2009.3. Ramanathan, V.; Carmichael, G. Global and Regional Climate Changes due to Black Carbon; Nature Geoscience 2008, 1; 221-227,
doi:10.1038/ngeo156; www.nature.com/ngeo/journal/v1/n4/abs/ngeo156.html.4. Mobility 2030: Meeting the Challenges to Sustainability; The Sustainable Mobility Project, Full Report; World Business Council on Sustainable
Development: Washington, DC, 2004.5. Sawyer, R.F. Reformulated Gasoline for Automotive Emissions Reduction. In Twenty-Fourth Symposium (International) on Combustion, 1423-
1432, The Combustion Institute, Pittsburgh, PA, 1992.6. Landrigan, P.; Nordberg, M.; Lucchini, R.; Nordberg, G.; Grandjean, P.; Iregren, A.; Alessio, L. The Declaration of Brescia on Prevention of the
Neurotoxicity of Metals. Am. J. Ind. Med. 2006, 4 (6), 689-690.7. National Greenhouse Gas Inventory Data for the Period 1990–2004 and Status of Reporting; United Nations Framework Convention on Climate
Change: Bonn, Germany, October 2006.8. Passenger Vehicle CO2 and Fuel Economy Standards: A Global Update; The International Council on Clean Transportation: Washington, DC,
August 2008.9. Farrell, A.; Sperling, D. (Project Directors); Arons, S.; Brandt, A.; Delucchi, M.; Eggert, A.; Farrell, A.; Haya, B.; Hughes, J.; Jenkins, B.; Jones, A.; Kammen,
D.; Kaffka, S.; Knittel, C.; Lemoine, D.; Martin, E.; Melaina, M.; Ogden, J.; Plevin, R.; Sperling, D.; Turner, B.; Williams, R.; Yang, C. (Contributors) A Low-Carbon Fuel Standard for California, Part 1: Technical Analysis. Conducted for California Air Resources Board, Sacramento, CA, 2007.

awma.orgCopyright 2009 Air & Waste Management Association
em • feature
by Christopher Yang and Ryan McCarthy
Christopher Yang is a director of the infrastructuresystem analysis research trackwithin the Sustainable Trans-portation Energy Pathways(STEPS) Program at the University of California, Davis(UC Davis). Ryan McCarthyis a Ph.D. candidate in civil andenvironmental engineering at UC Davis. E-mail:[email protected].
Concerns regarding air pollution, energy dependence, and, increasingly, climate changecontinue to motivate the search for new transportation solutions. Much of the focus is onlight-duty vehicles, as they account for approximately 60% of transportation energy useand greenhouse gas (GHG) emissions. Battery-powered, electric-drive vehicles (EVs), suchas plug-in hybrid electric vehicles (PHEVs) and battery electric vehicles (BEVs), are amongthe most promising of the advanced vehicle and fuel options that have been proposedto help reduce fuel usage and GHG emissions from light-duty vehicles.
Electricity GridImpacts of Plug-In Electric Vehicle Charging
16 em june 2009 awma.org

awma.org june 2009 em 17Copyright 2009 Air & Waste Management Association
PHEVs are like conventional hybrids in that they can bepowered by either gasoline or electricity, but unlike hybrids, PHEVs can be plugged in to obtain some oftheir energy from the electric power grid. The use of elec-tricity as a fuel in these vehicles can dramatically reduceGHG emissions because of the inherent efficiency ofelectric drivetrains, as well as the potential to use verylow-carbon electricity resources, such as renewables.
While the success of these “plug-in” vehicles largelyhinges on the development of robust, low-cost batteries,the fuel side of the equation is equally important to consider. A number of questions still need to be answered about the ability of the grid to handle the additional demand, and the costs and emissions associ-ated with charging these vehicles. This article discusseshow electricity demands for vehicle charging can interactwith the electricity grid and how costs and emissions depend on the quantity, location, and timing of vehicleelectricity demands.
The Electricity GridThe electricity grid is a collection of power plants andtransmission and distribution facilities that produces anddelivers electricity to end users. It must do so in real-time, because electricity cannot be practically stored insignificant quantities. The grid has evolved to meet continually changing electricity demands by using a suite ofpower plants that fulfill various roles in the grid network.
Each type of power plant operates differently, and can be a different size and employ different technologies and resources, and as a result, each has unique cost and emissions characteristics. Baseload facilities, oftenlarge coal or nuclear plants, are designed to operate con-tinuously and at low cost. Peaking power plants, whichare operated only a handful of hours per year when de-mand is highest, are often fired with natural gas or oil,and are more costly to operate. Many other types ofplants operate in between. The mix of power plants thatmake up the grid will vary significantly from one regionto another—based on local demand profiles, resourceavailability and cost, and energy policy.
While fossil fuels (mainly coal and natural gas) provide70% of U.S. electricity generation, the grid is evolvingas the level of renewable generation increases. Morethan half of U.S. states and several European countrieshave a renewable portfolio standard (RPS), which man-dates renewably-based electricity generation. However,these renewable resources are limited in resource quantity, temporal availability, and reliability. Intermittent renewables, such as solar and wind, can pose additional
challenges associated with integration into the grid.
Because of the structure of the grid, the cost of electricityand the emissions associated with generation will varywith demand and power plant availability. Charging anelectric vehicle requires the grid to respond by providingmore electricity. A key consideration for understandingthe cost and emissions implications of plug-in vehicles ishow the grid system responds to the additional demand.
Plug-In Electric VehiclesVehicle recharging will impact the grid in both the immediate and long term. In the near term, rechargingvehicles will require additional electricity to be generated.However, it will take a very large number of plug-in vehicles in a region before power plants are operateddifferently or new ones are needed. For example, adding1 million PHEVs in California (out of 26 million vehicles)only increases total electricity consumption in the state byapproximately 1%. If that increase occurs off-peak, nonew capacity is likely needed.
Over time, as greater numbers of plug-in vehicles areintroduced, their influence on the structure and operationof the grid, and resulting cost and emissions impacts, willbecome more important. This depends on the quantityand timing of vehicle electricity demand. As the numberof vehicles and their electricity requirements increase,more power plants are operated in the present, and willbe built in the future. If each of the 240 million registeredvehicles in the United States charged 5–10 kWh per day,this would require an additional 12–23% electricity generation. However, assuming that most vehicles willcharge overnight, the requirements for additional generation capacity would most likely be much lower.The spatial and temporal pattern of charging can ultimately influence the total generation capacity, the mixof power plants serving a region, and their cost andemissions. The spatial pattern of charging can influencethe distribution system, as well.
Vehicle Emissions and CostsEnvironmental impacts from conventional and advancedvehicles and fuels need to be analyzed on a “well-to-wheels,” or life-cycle, basis to fully account for their operational differences. Well-to-wheels emissions includethose associated with the production and transport of thefuel to the vehicle (i.e., “well-to-tank”) and those associatedwith fuel conversion in the vehicle (i.e., “tank-to-wheels”).Emissions from internal combustion engine vehicles arepredominantly tank-to-wheels, but for EVs, the well-to-tank (e.g., the generation of electricity) comprises the majority of emissions.

18 em june 2009 awma.orgCopyright 2009 Air & Waste Management Association
Thus, for vehicles that plug into the grid, characterizingthe emissions associated with electricity generation anddistribution is important for understanding the environ-mental impacts of the vehicles. This requires an under-standing of which power plants are operating duringvehicle recharging that would not be generating powerotherwise, also known as marginal generation. The marginal generation will typically be the easily controlled(i.e., dispatchable) power plants, but they are also themost expensive, and often least efficient, plants operatingat the time. Consequently, the GHG emissions rate fromthese power plants (i.e., the marginal rate) often differssignificantly from the emissions rate from all of the plantsoperating at a given time (i.e., the average rate).
Table 1 shows some representative numbers for the energy intensity (energy/mile), fuel carbon intensity (carbon/unit energy) and their product, and vehicle carbonintensity (carbon/mile) for conventional vehicles, hybrids,and PHEVs in charge sustaining “hybrid mode” and EVsand PHEVs in “all electric mode.”
Emissions attributable to plug-in vehicles depend on theregional characteristics of the grid and the magnitudeand timing of demand. A commonly held assumption isthat vehicle recharging is likely to occur at night, duringoff-peak hours, because that is when most cars areparked at home. However, if coal power plants (~1000gCO2/kWh) provide marginal generation for off-peakvehicle demands, GHG emissions from plug-in vehiclescould be higher than emissions from hybrid vehicles.However, if natural gas-fired power plants (~400–600gCO2/kWh) operate on the margin, which is often the case,well-to-wheel GHG emissions from plug-in vehicles willbe lower than those from conventional hybrids, and con-siderably lower than those from conventional vehicles.The exact emissions comparison will depend on the vehicle design (i.e., BEV vs. PHEV), the efficiency of aconventional vehicle, and how the vehicles are driven.
PHEVs will typically combine all-electric and hybridmodes, as shown in Figure 1. Most of the curves in Figure 1 assume a PHEV with 20 miles of all electricrange (PHEV20) that operates in all electric mode for the first 20 miles and then operates in hybrid modethereafter. If this vehicle were driven 50 miles betweenrecharging, it would operate 20 miles on electricity and30 miles on gasoline and the GHG emissions per mile
Figure 1. Representative GHG emissions for a PHEV20 operating on different electricity sources andrecharging intervals.
Vehicle Energy Fuel Carbon Vehicle CarbonIntensity (E) Intensity (C) Intensity (ExC)
MPGGE kWh/mi gCO2/gge gCO2/kWh gCO2/mi
Conventional Gasoline 27.5 1.21 10,997 330 400
Hybrids / PHEVs in “hybrid mode” 40 0.84 10,997 330 277
BEVs / PHEVs in “all electric mode” 111 0.3
Renewable electricity 0 0 0
Natural gas combined cycle 13,300 400 120
Avg. CA electricity 14,000 432 130
Avg. U.S. electricity 20,333 610 183
Coal steam 39,600 1188 356
Table 1. Energy and carbon intensity values for conventional vehicles, hybrids, and PHEVs.
GHG
emiss
ions (
gCO 2
e/m
ile)
Miles Driven Between Charging

awma.org june 2009 em 19Copyright 2009 Air & Waste Management Association
would be a combination of the emissions in each mode.As the distance a vehicle is operated between rechargingthe battery increases, the GHG emission per mile asymptotes toward the emissions associated with hybridmode operation. A BEV would operate in all electricmode for the entire vehicle range rather than only 20 miles.
Infrastructure ImpactsSeveral studies show that existing grid capacity (includinggeneration, transmission, and distribution) can fuel a significant number of PHEVs in the U.S. light-duty vehicle fleet.1 Many power plants are underutilized during off-peak hours and could be used to recharge amajority of vehicles in many areas of the United States.Studies have indicated that the transmission and distri-bution infrastructure that transports electricity to the end user will, in most cases, not be overburdened bycharging vehicles, either.
But there may be specific points along some distributionlines that face congestion if local patterns of electricitydemand change significantly because of vehicle recharg-ing. At the substation and feeder levels, where demandsare less aggregated—and as a result, more variable and
sensitive to the patterns of a few customers—distributionimpacts are important. If many consumers in a given circuit recharge their plug-in vehicles simultaneously(e.g., in the early evening after work), it could increasepeak demand locally and require utilities to upgrade thedistribution infrastructure. Utilities may want to managethe timing of recharging demand to maximize load factors and utilization of existing distribution resources.Typical U.S. households consumed approximately11,000 kWh annually in 2001. The addition of a PHEVwith 5–10 kWh of useable battery capacity that ischarged once per day could add an additional 21–43%(2200–4600 kWh) per year to the household electricityload, comparable to average central air conditioning andrefrigeration loads.
The mix of power plants supplying a region is largely afunction of peak demand and the hourly demand profile. Peak demand determines the total installedpower plant capacity needed to supply a region, whilethe hourly demand profile determines the best mix ofplants. Based upon the pattern of demand over the year,the economically-optimal mix of baseload, intermediate,and peaking power plants can be determined. As a result, if vehicle electricity demand adds to peak

20 em june 2009 awma.orgCopyright 2009 Air & Waste Management Association
demands, it may require the expansion of existing grid capacity and building new infrastructure. Or, by changingthe hourly demand profile, it may affect the generationmix. Charging off-peak will flatten the demand profile,thus improving the economics of baseload and inter-mediate power plants and lowering average electricitycosts. Charging at peak demand times will increase capacity requirements, while lowering the utilization ofexisting plants and increasing electricity costs.
Plug-In Vehicles as ‘Active Loads’The grid will adapt to meet the demand for vehiclecharging, as it does for all demands. However, plug-invehicles may be unique, if charging can be controlled tooccur when it is most optimal. Given that cars are parkedapproximately 95% of the time, this is a real possibility.
One model for understanding how plug-in vehicles canimpact the electricity grid is based upon the concept of“passive” and “active” grid elements (e.g., generators andloads). Passive elements are imposed on the system anddo not readily respond to grid conditions. Active elementscan be controlled and utilized when optimal. Baseloadand intermittent generators are passive, since they cannoteasily turn on or off, or up or down, in response to changesin demand. Active generators can be operated to followor match demand. Most electricity demand is passive, asit is imposed instantaneously on the electric system bymillions of individual customers and not easily controlled.But electricity demand for some loads, including plug-invehicles, can be active. The timing of recharging demandis controllable, because energy is stored onboard the vehicle in batteries, and vehicle travel is temporally separate from the time when recharging occurs.
The grid manages active and passive elements in real-timeto match supply and demand. Traditionally, the grid hasconsisted of passive electric demands, which requires pre-cise matching by active generation, such as dispatchablenatural gas power plants. But active loads, such as thosefrom plug-in vehicles, may be used to match passive ele-ments, potentially reducing the need for active generation.
Additionally, plug-in vehicles can enable the deploymentof intermittent renewable generators, such as wind orsolar. Since these passive generators are highly variable,they must be matched by standby active generation, typ-ically natural gas-fired generators that are utilized when
the renewable resource is unavailable. But aggregatedactive loads from plug-in vehicles could also be used, potentially reducing the required number of standbypower plants and decreasing the costs associated withintegrating intermittent power on the grid.
Managing Vehicle RechargingClearly, timing is crucial in determining whether thesevehicles are a benefit or detriment to the grid. Many utilities and policy-makers already recognize this, andstrategies are being developed to educate consumers.
Managing vehicle recharging requires a smart chargingsystem that enables communication between the customerand utilities. This enables the utility to manage customercharging patterns, and participating customers may receivelower rates and maximize the amount of renewable elec-tricity they purchase. This charging interface can also permit vehicle charging emissions to be appropriatelytracked and allocated, which will become increasinglyimportant as states and countries adopt low-carbon fuel standards and impose caps on GHG emissions indifferent sectors.
While recharging vehicles during off-peak hours ispreferable from a grid operations and cost perspective,off-peak recharging may not always be preferable to allstakeholders. For example, a consumer may be able toavoid a trip to the gas station by recharging during theday, and though this may be more costly than chargingoff-peak (the cost of peak electricity can be a factor ofthree or more higher than off-peak power), it may still becheaper and less polluting than operating the vehicle ongasoline. Some companies may even incentivize daytimerecharging by offering recharging stations at the work-place or around town.
ConclusionPlug-in vehicles offer environmental and energy securitybenefits for light-duty transportation. But it is importantto consider these benefits in terms of how new electricitydemand for vehicle charging impacts the grid. Ultimately,plug-in vehicles present a great opportunity to diversifyenergy supply and reduce transportation environmentalimpacts. But they must be considered in the context of regional grid structure and operations, and the appropriate technology and policy incentives should beimplemented to maximize benefit. em
Reference1. Hadley, S.W.; Tsvetkova. A. Potential Impacts of Plug-In Hybrid Electric Vehicles on Regional Power Generation; ORNL/TM-2006/554; Oak Ridge National
Laboratory, Oak Ridge, TN, 2008; and Kinter-Meyer, M.; Schneider, K.; Pratt, R. Impact Assessment of Plug-In Hybrid Vehicles on Electric Utilities and RegionalU.S. Power Grids. Part 1: Technical Analysis; Pacific Northwest National Laboratory, Richland, WA, 2007.
Timing is crucial in determiningwhether electricplug-in vehicles are a benefit or detriment to the grid.

awma.org june 2009 em 21Copyright 2009 Air & Waste Management Association
em • feature
by Coralie Cooper, Fanta Kamakaté, Thomas Reinhart, and Robert Wilson
Coralie Cooper is transporta-tion program manager at theNortheast States for Coordi-nated Air Use Management,Boston, MA; Fanta Kamakatéis program director with the International Council on CleanTechnology, San Francisco, CA;Thomas Reinhart is programmanager for engine designand development at SouthwestResearch Institute, San Antonio,TX; and Robert Wilson is director of the Clean Energyand Fuels Unit at TIAX LLC,Cambridge, MA. E-mail:[email protected].
Medium and heavy-duty trucks account for approximately 6% of total anthropogenicgreenhouse gas (GHG) emissions in the United States.1 From 1990 to 2007, medium- andheavy-truck GHG emissions increased 79%, representing the largest percentage increaseof any major transportation mode.1
ReducingHeavy-Duty Vehicle Fuel Consumptionand Greenhouse Gas Emiss ions

22 em june 2009 awma.orgCopyright 2009 Air & Waste Management Association
Heavy-duty truck activity is responsible for the majorityof total truck emissions, and miles traveled are projectedto increase steadily in coming decades.2 As such, policy-makers committed to reducing emissions that contributeto the risk of future climate change have a keen interestin addressing the emissions contribution of the heavy-duty vehicle fleet. The U.S. federal government is in theprocess of developing a heavy-duty vehicle fuel efficiencyregulation, but there is currently no regulation in place.Nor are there regulations for heavy-duty vehicle GHGemissions.
Study: Reducing GHGs and Fuel Con-sumption from Heavy-Duty VehiclesTo assist policy-makers in developing GHG andfuel consumption regulations for heavy-duty vehicles,the Northeast States Center for a Clean Air Future(NESCCAF) and the International Council on CleanTechnology (ICCT) conducted a study to assessavailable and emerging technologies to reduceGHG emissions and fuel consumption from heavy-duty, long-haul motor vehicles in the United Statesin the 2012–2017 timeframe.3 This article sum-marizes some of the key findings of the study relative to introducing advanced technology com-ponents into heavy-duty, long-haul trucks.
Study MethodThe analysis consisted of a series of modeled sim-ulations to predict the fuel consumption and emis-sions impacts of incorporating various technologycombinations in new trucks. The simulations wereperformed by Southwest Research Institute (SwRI)for a long-haul, Class 8 truck (i.e., a tractor-trailercombination with a gross vehicle weight ratingabove 33,000 lb) using publicly available software(RAPTOR and GT-POWER) that provides detailedinformation on the acceleration, braking, fuel con-sumption, and emissions performance of differenttruck designs, engine designs, and componentpackages.
Additional steps in the analysis involved estimatingthe cost of each package and creating technologycost curves based on the simulation results.Detailed cost estimates were developed by TIAXLLC using industry information gathered fromtechnical papers, published cost data, and inter-views. TIAX also conducted a fleet-wide fuel con-sumption and GHG emissions reduction analysis,
using a proprietary fleet model to estimate the fuelconsumption and GHG emissions that would bereduced in the United States between 2008 and2030, assuming two scenarios for fleet-wide adop-tion of technologies to reduce GHG emissions andfuel consumption.
Study ResultsThe results indicate that substantial, cost-effectiveGHG emission and fuel consumption reductionsare achievable for heavy-duty, long-haul trucks inthe 2012–2017 timeframe. Specifically, emissionsfrom heavy-duty, long-haul trucks could be reducedup to 51% relative to a 2007 baseline vehicle. Onewould expect that if market forces alone are allowedto drive the improvement, the result will be a muchlower reduction than 51%.
With the introduction of regulations designed toreduce fuel consumption, the results are expectedto be in the 25–50% improvement range. The reason for this is that, in recent years, numeroustechnologies that could substantially reduce heavy-duty vehicle GHG emissions and fuel consumptionhave been developed and brought to production.Some of these technologies have been used to improve the efficiency of heavy-duty trucks. Manyof them, however, have not been used by theheavy-duty trucking industry for a number of reasons,including the short payback times required by thetrucking industry; the lack of integration of truck,tractor, and trailer manufacturers; and the fact thatdifferent companies often own different parts of thetractor trailer combination.
All of these factors make it difficult to achieveacross-the-board improvements in truck fuel consumption and GHG emissions. Any technicalapproach to reduce truck fuel consumption andGHG emissions must include both the tractor andthe trailer in an integrated strategy. A regulationrequiring the introduction of new technologies toreduce fuel consumption and emissions is neededto ensure that technologies are introduced into this sector.
Table 1 presents fuel consumption and emissionreduction and cost estimates for 14 technologypackages modeled for heavy-duty, long-haul trucks.Column 1 lists the technology package reference
Assuming a 15-year pay-back period,fuel cost savings far outweigh theadditional technologycosts for most of thetechnologypackages.

awma.org june 2009 em 23Copyright 2009 Air & Waste Management Association
number (ordered according to increasing fuel con-sumption and GHG emission changes); column 2 lists the technologies included in each combina-tion package; column 3 provides the percent carbon dioxide (CO2) and fuel consumption reduction relative to the 2007 baseline vehicle; column 4 lists the estimated incremental vehiclecost of the technology package; column 5 indicatesthe net cost of the technology package, defined asthe incremental technology cost minus three yearsof cost savings; and column 6 shows the net cost of the technology package, in this case,defined as the incremental technology cost minus15 years of cost savings. The net cost analysis assumed a price of US$2.50 per gallon of
diesel fuel and a 7% discount rate on the initial investment.
Table 1 shows estimated emission and fuel consumption reductions up to 51%, relative to the2007 baseline vehicle, for the 14 technology pack-ages modeled. Assuming a standard size trailer,combinations of technologies already used in some production heavy-duty, long-haul trucks can reduce CO2 emissions up to 17.8%. Examples ofthese technologies include hybrid vehicle systems, turbocompounding (i.e., the use of a second powergenerating turbine in the exhaust system in addition to the normal turbocharger), as well asaerodynamic and rolling resistance improvements.
Table 1. Heavy-duty, long-haul GHG and fuel consumption reduction results for combinations of technologies.
Package # Technology Fuel consumption Marginal 3-Year 15-YearCombinations and CO2 Reduction Vehicle Costa Net Costa Net Costa
1 Baseline: Volvo D13 (2010 emissions),Kenworth T600, 10-speed automatic n/a n/a n/a n/a
7 Variable valve actuation 1.0% $300 -$1000 -$2500
11 Advanced exhaust gas recirculation 1.2% $750 -$400 -$1700
5 Mechanical turbocompound 2.4% $2650 $400 -$2100
10 Slower road speed (60 mph) 3.8% $0 -$5000 -$10,600
6 Electrical turbocompound 4.0% $6650 $3000 -$1000
4 Parallel hybrid system 5.8% $23,000 $21,100 $20,400
8 Bottoming cycle 7.8% $15,100 $13,000 $1800
2 Integrated sleeper cab roof fairing, aerodynamic 17.8% $22,930 $800 -$23,600mirrors, aerodynamic bumper, cab-side extenders,fuel tank fairings, super single tires with aluminumwheels, auxiliary power unit
3 Advanced aero package: boat tail, full skirting of 27.9% $30,580 -$5500 -$20,300cab and trailer, partially sealed gap, plus the deviceslisted above in package #2
9 Longer/heavier trailer (rocky mountain doubles— 20.6% (for freight density $17,500 $2600 -$18,50048- and 28-foot trailers) above 13.3 lb/ft3)
16.6% (for freight densitybelow 11.9 lb/ft3)
12 Standard trailer with hybrid, bottoming cycle, slower 39.3% (grossed out)b $65,480 $18,700 -$31,500road speed, advanced aero package 40.9% (cubed out)c
13 Longer heavier trailer with electrical turbocompound, 48.1% (grossed out) $74,230 $17,600 -$43,700hybrid, advanced aero package 45.5% (cubed out)
14 Longer heavier trailer with bottoming cycle, hybrid, 51.1% (grossed out) $82,980 $24,200 -$39,30060 mph, advanced aero package 48.7% (cubed out)
Notes: aCalculations based on 2022 high-volume technology costs and 2022 fuel price projection of (US$2.50/gal), all amounts in U.S. dollars; b“grossed out”means a truck that is loaded to its maximum legal weight, even if the trailer is not completely full. This applies to high-density freight; c“cubed out” refers to a truckthat has the trailer completely full, but is below the maximum legal weight. This applies to low-density freight.

24 em june 2009 awma.orgCopyright 2009 Air & Waste Management Association
Reductions beyond this level will require the intro-duction of more advanced technologies, such asadvanced aerodynamic improvements and a bottoming cycle (i.e., a secondary heat engine thatextracts power from the waste heat of the engine).For example, a package including advanced aerodynamic components and improved tires canprovide an estimated 27.9% reduction in CO2 andfuel consumption for an incremental vehicle costof US$30,580. Even greater CO2 and fuel consumption reductions can be achieved—up to40%—using a combination of bottoming cycle,slower road speed, advanced aerodynamics, andhybridization.4
Assuming a longer and heavier trailer design alone, CO2 and fuel consumption reductions rangingfrom 17% to 21% are feasible for an incrementalvehicle cost of US$17,500.5 Greater reductions canbe achieved by combining longer and heaviertruck trailers with advanced technologies such asbottoming cycle and hybridization. The technologypackage that provides the greatest CO2 and fuelconsumption reduction—51% from the baselinevehicle—includes advanced aerodynamics, lowrolling resistance tires, a longer and heavier trailercombination, and bottoming cycle. While the costsof using advanced technologies are greater thanthe cost of conventional long-haul truck technologies,fuel-cost savings in many cases outweigh additionaltechnology costs for the technology packages.Assuming a three-year payback requirement, thenet cost of 8 of the 10 technology packages evaluated that produce up to 27% CO2 and fuelconsumption reductions is within US$3000 of the
break-even point or negative, meaning that thesepackages result in little cost or in a net cost savingsover a three-year period.
Assuming a 15-year payback period, fuel cost savings far outweigh the additional technologycosts for most of the technology packages. Table 1and Figure 1 show negative net costs of technologypackages that produce up to 51% CO2 and fuelconsumption reductions. In the 15-year paybackscenario, owners of conventional trucks with 53-foot trailers save between US$1000 andUS$31,500 over the life of the vehicle due toavoided fuel purchases. The savings for trucks withlonger, heavier trailers are larger.
As noted in Table 1, the emission reduction packagesevaluated in this study include a range of individualtechnologies. Some of the most cost-effective pack-ages include advanced aerodynamics, lower rollingresistance tires, longer heavier trailers, turbocom-pounding, and slower road speeds. This study alsoassessed the CO2 and fuel consumption reductionpotential of technologies that are relatively expen-sive in an effort to provide a robust overview of thebenefits and costs of candidate CO2 reductiontechnologies. Consequently, the complete set oftechnology packages does not constitute a low-costsolution to any particular CO2 reduction scenario,but rather presents a host of possible solutionsacross a range of reductions and costs.
Figure 1 depicts the relative benefits and costs ofeach of the evaluated technology packages. Theplotted shapes indicate the relationship betweenCO2 emissions reduction potential and cost. Onlytechnologies that will fit within the existing regulatoryenvironment in all 50 states were included (nolonger, heavier trucks are included). The diamondshapes in Figure 1 represent the fuel consumptionand CO2 reductions for packages given a three-year payback period requirement. The squareshapes represent the same technology packageswith an assumed payback period of 15 years ratherthan three. The zero line on the graph representsthe break-even point for vehicle owners.
In the three-year payback scenario, technologypackages providing CO2 reductions from 2.4% to27.9% encompass a net cost range from approxi-mately –US$5000 (i.e., net consumer savings) to+US$21,000 for standard size trucks. Clearly, aFigure 1. Net vehicle costs for heavy-duty, long-haul trucks, given two payback period scenarios.
-$50
-$40
-$30
-$20
-$10
$0
$10
$20
$30
0% 10% 20% 30% 40% 50% 60%
% Reduction in CO2 and Fuel Consumption
Net
Cos
t (1,
000$
)
3-Yr PaybackLifetime NPV

awma.org june 2009 em 25Copyright 2009 Air & Waste Management Association
least-cost solution would favor the technologypackages in the lower end of this cost range. Theleast-cost technologies, however, may not be viablefor some segments of the market, so vehicle manufacturers may not introduce specific least-costCO2 reduction solutions across the entire vehicleclass. For example, because an approach such asturbocompounding may be limited to a subset ofheavy-duty vehicles, an analysis constructed solelyon the basis of least-cost solutions may understatethe actual cost of class-wide CO2 reduction solution.
The three-year payback scenario shows modestcost penalties for CO2 and fuel consumption reduction, ranging from near zero for small reduc-tions up to US$18,700 for a 40% reduction. The15-year supply curve shows cost savings over the vehicle life. At the 51% reduction point, thesavings is US$39,300.
By 2030, assuming the U.S. fleet employs the tech-nology combinations modeled in this study, 45%of total U.S. heavy-duty, long-haul fleet CO2 andprojected business-as-usual fuel consumptioncould be avoided. If this were the case, an esti-mated 7 billion gallons of diesel fuel would besaved annually by 2030, with lesser reductionsbeing achieved as soon as 2012. Cumulative fuelsavings between now and 2030 would equal 93 billion gallons of diesel fuel. Approximately 60 million metric tons of CO2 emissions would bereduced annually by 2030. Cumulative avoidedCO2 emissions between now and 2030 wouldequal 1,130 million metric tons. This assumes thattechnologies are adopted in new heavy-duty, long-haul trucks over a 30-year timeframe and there isa 15-year payback period for all technologies. Ouranalysis does not assume that any existing vehiclesare retrofitted with technologies, and as such, mayunderestimate the total potential emissions and fuel use avoided from heavy-duty technologiesevaluated in this study.
ImplicationsOur analysis of existing and emerging truck tech-nologies indicates that they can achieve substantialand cost-effective reductions in heavy-duty vehicleGHG emissions and fuel consumption in the2012–2017 timeframe. Specifically, GHG and fuelconsumption emissions from heavy-duty vehiclescould be reduced by as much as 51%.
This analysis did not evaluate fuel consumption andGHG reductions that could occur due to technology,design, nor engineering advances that may occur inthe future. Rather, it evaluated only the technologiesfor which a technical design is currently available. Tothe extent that scientific advances in design occur,the future emissions and fuel consumption benefitsmay be higher than predicted.
Assuming a three-year payback period and a diesel fuel price of US$2.50 per gallon, half of the analyzed technology packages would result in anet cost savings to vehicle owners, taking into account both incremental technology costs andfuel savings over the three-year period. Some ofthe technology combinations that provide thegreatest reductions, however, would not beadopted into the fleet when assuming a three-yearpayback requirement. This indicates that given theshort payback period demanded by the truckingindustry, a number of these technologies will notbe adopted into the U.S. fleet absent regulation.With a longer payback period of 15 years, estimatedlifetime net savings are US$39,300 for owners ofvehicles that achieve GHG and fuel consumptionreductions of up to 51%. em
References1. Inventory of U.S. Greenhouse Gas Emissions and Sinks: 1990–2007; U.S. Environmental Protection Agency: Washington, DC, April, 2009.2. VISION Model: Description of Model Used to Estimate the Impact of Highway Vehicle Technologies and Fuels on Energy Use and Carbon Emissions
to 2050; Argonne National Laboratory: Argonne, IL, December, 2003.3. Reducing Heavy-Duty Vehicle Fuel Consumption and Greenhouse Gas Emissions; Draft Report; Northeast States Center for a Clean Air Future
(NESCCAF) and the International Council on Clean Technology (ICCT), 2009.4. Slower road speeds would need to be mandated through a regulation such as lower speed limits or mandatory road speed governor settings in
order to be effective. With regard to hybridization, it should be noted that this approach was included in this study mainly to facilitate the use ofother technologies. The fuel consumption reductions reported for the hybrid package alone are relatively low, and this is due to the fact that thedrive cycle consisted mostly of highway driving. An urban or suburban driving cycle would result in greater fuel savings from a hybrid system.
5. The longer/heavier combinations considered in this study comply with federal bridge formula for weight and do not exceed axle loading requirements for current trucks. Thus, the combinations evaluated should not contribute to increased road wear.
An estimated 7 billion gallons of diesel fuel could be saved annually by 2030.

Copyright 2009 Air & Waste Management Association
em • feature
by Walter Hook
Walter Hook is the execu-tive director of the Institutefor Transportation and Develop-ment Policy, New York City. E-mail: [email protected].
Bus Rapid TransitA Cost-Effective Mass Transit Technology
U.S. BRT systems from their counterparts in Latin America.
Successful BRT SystemsThe first, and still one of the best BRT systems in theworld, is in Curitiba, Brazil. Opened in 1974, Curitiba’sBRT featured the following characteristics:
• Physically segregated exclusive bus lanes• Large, comfortable articulated or bi-articulated
buses• Fully enclosed bus stops that feel like a metro
station, where passengers pay to enter the BRT station through a turnstile rather than paying the bus driver
• A bus station platform level with the bus floor• Free and convenient transfer between lines at
Some of the most important technical innovations in the transportation field have nothingto do with vehicle technology or alternative fuels. Rather, they involve the way bus servicesare operated and infrastructure is used to optimize their speed, comfort, and capacity.The U.S. Federal Transit Administration (FTA) has helped to popularize a term for suchmeasures: Bus Rapid Transit, or BRT.
26 em june 2009 awma.org
The best examples of BRT are found in Latin America,where the speed, capacity, and quality of service rival allbut the best metro and light rail systems. In the UnitedStates, unfortunately, the FTA’s criteria for calling a systemBRT, and hence making it eligible for BRT program financing, are fairly lax. This has allowed some marginalbus service improvements to be labeled BRT. Unfamiliarwith what BRT has become in Latin America, manypeople in the United States have turned against BRT asa poor substitute for rail-based modes. While the qualityof recent U.S. BRT systems is improving, and there area few quite good systems now in operation, none ofthem compare to the speed, comfort, capacity, or servicequality of the best Latin American systems. This articleoutlines the key features that differentiate even the best

june 2009 em 27Copyright 2009 Air & Waste Management Association
The best examplesof BRT are foundin Latin America,where the speed,capacity, andquality of servicerival all but thebest metro andlight rail systems.
awma.org
enclosed transfer stations• Bus priority at intersections, largely by restricting
left hand turns by mixed traffic vehicles• Private bus operators paid by the bus kilometer
Prior to Curitiba’s BRT system, traffic engineers believedthat bus lanes could move approximately 6000 passen-gers per direction per hour in a single lane at averagespeeds around 15 kilometers per hour (kph) (assumingnormal distances between stations of around 500 m).Curitiba, using bi-articulated buses and the measuresmentioned above, was able to move 15,000 passengersper direction at peak hour (pphpd) at average speedsjust above 20 kph in a single traffic lane. This speed andcapacity is similar to even the best light rail systems.
The cost of construction, at only US$2 million/km, was afraction of most light rail systems (generally greater thanUS$20 million/km). The most important measures werethe prepaid boarding stations. This reduced the boardingand alighting time per passenger from 2–3 seconds onaverage to about 0.3 seconds. With large numbers ofpassengers, this amounts to very significant time savings,far more important than changes in traffic signals.
Because BRT systems are less expensive and can be builtmuch faster, they are able to expand much faster. Onlycities that have built and continued to expand BRT systemshave actually managed to stabilize public transit’s shareof total trips.
The share of trips in Curitiba taken by public transportremained above 70% for more than two decades,though it began to diminish when the city stoppedexpanding the system. Today, it is approximately54%—still high for a city with motor vehicle ownershipof around 400 cars per 1000 people.
Brazilian cities such as São Paulo, Belo Horizonte, andPorto Alegre have built bus lanes superficially resemblingCuritiba’s, but without the key elements: prepaid plat-form-level boarding stations, restructured bus routes,and bus priority through the city center. The next full-featured BRT was not opened in Latin America until1998 in Quito, Ecuador. Quito’s electric trolleybus BRTwent boldly through the city’s historical core on narrowstreets open only to buses. The success of the systemsoon led to a spate of additional BRT systems throughoutLatin America.
The most important of the second phase of BRT systemsopened in Bogotá in 2000. Bogota’s TransMilenio BRTsystem made several critical technical improvements overthe Curitiba system. The main bottleneck in Curitiba is thebus stop. During rush hour, buses back up waiting todischarge passengers. TransMilenio’s principal innovationwas to put a passing lane and multiple stopping bays ateach stop. At TransMilenio’s largest stations, up to fivebuses can allow passengers to board and alight at once.As soon as a bus finishes the boarding and alightingprocess, it can pull out of the stop, regardless of whetheror not the bus in front of it has completed the boardingand alighting process, significantly reducing delay.
The introduction of a passing lane at the bus stop alsoallowed for significant innovation in the nature of servicesoffered. With a single lane light rail line or BRT system,all services have to stop at all stops. The construction ofa passing lane at each station stop makes it possible toput a wide variety of express and limited stop servicesinside the BRT system.
With the introduction of limited-stop services, Trans-Milenio achieved an operating capacity of 35,000 pphpdand average speeds of 29 kph. With overcrowding,TransMilenio moves 45,000 passengers per directionper hour, comparable to all but the highest-capacity met-ros. While the addition of a passing lane consumes additional road space, this passing lane is not requiredeverywhere, only at the station. TransMilenio also builtbike lanes and significantly widened sidewalks along the

28 em june 2009 awma.orgCopyright 2009 Air & Waste Management Association
need to build far more expensive metro systems, andcities that already had metro systems decided to buildBRT on corridors that otherwise might have been addi-tional metro lines. Between 2001 and 2009, new full-featured BRT systems were built in Guayaquil, Ecuador;Guatemala City, Guatemala; Jakarta, Indonesia; Perreira,Colombia; Cali, Colombia; Mexico City, Mexico; Beijing,China; and several other cities.
TransMilenio and Curitiba are “trunk and feeder” systems.These require passengers to take a feeder bus (whichoperates in mixed traffic) to a transfer terminal wherethey switch to a special, higher capacity articulated trunkline bus that interfaces with the elevated BRT platforms.Because the BRT infrastructure requires special buses,the feeder network allows the system to cover a muchlarger area without having to buy a large number ofspecial buses. This routing structure does introduce sometransfer delay and indirectness of route, however.
entire BRT corridor, important because in Curitiba thebusway is frequently used by cyclists, often with fatalconsequences.
TransMilenio also implemented a number of state-of-the-art contracting procedures. Unlike most Latin AmericanBRT systems, where a monopoly of the former privatebus operators was allowed to take control of the newBRT business, in TransMilenio the new services werecompetitively tendered to four separate operating com-panies. The performance of these companies is continuallymonitored against some contractually determined performance indicators, and if they fail to meet these performance targets they are forced to pay fines into anescrow account. These fines are then given to the companyproviding the best quality of service at the end of eachmonth. This has ensured a very high quality of service.
TransMilenio proved to many cities that they really didn’t
Bogota’s TransMilenio BRT system with its bus stations and passing lanes.
One of the best BRT systems in the world is in Curitiba, Brazil.
Photo: Karl Fjellstrom

awma.org june 2009 em 29Copyright 2009 Air & Waste Management Association
Other systems, like in São Paulo and Porto Alegre inBrazil and Brisbane in Australia, use normal buses thatoperate in mixed traffic, then enter a busway on a majorarterial, and then leave it again. Because they are normalbuses, their interface with the station platform lacks thespecial BRT characteristics that allows for very rapidboarding and alighting, so the operation within the trunkcorridor is slower and the capacity is lower, and stationstend to experience frequent bottlenecks.
Future BRT SystemsThe next wave of BRT systems will be hybrids of thetraditional direct service busways and trunk and feederBRT systems, offering the benefits of direct services withthe high speed boarding and alighting of trunk andfeeder BRT systems. This will be achieved in two ways.
The new Guangzhou BRT system in China, currentlyunder construction, provides trunk corridor stations thatare designed like a traditional trunk and feeder system,with a sufficient number of substations and passing lanesto avoid any bus congestion at the station stop. On thetrunk lines, passengers enter all doors of the bus at oncefrom a platform level with the bus floor. Off the trunkcorridor, however, passengers will enter the same bus,
but they can only enter the front door and pay the driver.
Most of the Johannesburg Rea Vaya BRT system inSouth Africa, also under construction, is a trunk andfeeder service, but some buses will operate on the trunkcorridor and in mixed traffic, with the left side doorsdesigned for an elevated BRT station, and the right sidedoors designed as traditional curbside boarding doors.
BRT Systems in the United StatesThe U.S. systems most closely resembling Latin AmericanBRT systems are Los Angeles’ Orange Line, Cleveland’sEuclid Avenue line, Boston’s airport branch of the SilverLine, and the Eugene, Oregon system. Los Angeles,Cleveland, and Eugene all have prepaid boarding. Whileincreasing boarding and alighting speed considerably,most of these systems do not have station platforms levelwith the bus floor, thus do not have the same secure feelof a metro station or the BRT stations in Latin America.Much more could be done with the architectural designof the stations, the pedestrian access facilities, and thelevel of passenger service amenities offered.
One of the two branches of Boston’s Silver Line operatesin an expensive tunnel while offering fairly limited time
A&WMABuyers GuideTap into the incredible network of the Air & Waste Management Association with the A&WMA Buyers Guide. Powered by MultiView, the Guide is the premier search tool for environmental professionals. Find the suppliers you need, within the network of the association you trust.
Start your search today at awma.org.

30 em june 2009 awma.orgCopyright 2009 Air & Waste Management Association
savings, proving that money can be wasted on BRT aswell as on rail-based mass transit. The other branch ofthe Silver Line operates in mixed traffic with an articulatedbus. Unfortunately, because it was marketed as a BRT, ithas gone a long way to damage BRT’s reputation in theUnited States.
Most U.S. systems operate as if constrained to a light railline—offering services only within the BRT infrastructure.Denver, for example, is building a large number of lightrail corridors, and plans to build one BRT corridor betweenBoulder and Denver. The BRT corridor has services exactlylike the light rail line, with stops at every station. BecauseDenver is very low density, roughly one quarter of thecapital cost of the combined system is for parking places.
Unfortunately, because Boston’s Silver Line wasmarketed as aBRT, it has gone a long way todamage BRT’sreputation in theUnited States.
The entire system is conceived as a park-and-ride system.Yet there is no reason, given the low frequency of thebus services, that the BRT corridor could not have busescontinuing on in mixed traffic to the most populardestinations in downtown Boulder and downtownDenver. In fact, if the entire system had been designedas a BRT system, there could have been direct routesbetween all of the corridors, removing a significanttransfer time penalty, increasing frequency and, hence,ridership. This sort of operational flexibility is a very attractive option for U.S. BRT systems where urban density is generally quite low and bus frequency is alsotoo low to congest the busway.
BRT CompetitorsNaturally, light rail and metro interests are threatened bythe proliferation of cheaper, more flexible BRT systems.Rail interests in the United States, and particularly com-panies from France, Germany, and Japan, are financiallythreatened by the rapid proliferation of BRT. Japan’stechnical cooperation agency, JICA, and to a lesser extentthe French and German governments, have been activearound the world promoting their rail companies bydisseminating misinformation about the limitations ofBRT systems. They finance feasibility studies that tend to exaggerate the projected ridership and financial feasibility of proposed light rail or metro systems.
The current fiscal crisis creates a political opportunity todemand better transit system performance for less tax-payer funds. The United States could develop world-classBRT systems, with speeds, capacities, and levels ofservice comparable to the best metro and light rail sys-tems, but costing far less. New, performance-basedcontracting could be used to get better quality of servicefor a lower price, while protecting unionized workers.
In exchange for fresh infusions of funds, transit authoritiescould be required to invest their capital in ways that mostdirectly improves speed and quality of service, whilereducing operating costs. Transit authorities could berequired to perform an alternatives analysis, subject topublic scrutiny, comparing alternative mass transit optionsfor reaching a desired service standard for any new masstransit system. The gravity of the current fiscal crisis inmany of our transit authorities calls for greater experi-mentation. If different mass transit options were actuallyforced to compete on a level playing field, in many cases,BRT would prove to be highly competitive. em
Mercury Control Technologies
EM considers recent developments and experiences with mercury pollution controltechnologies, mercury monitoring, and issuessurrounding the disposal of coal byproductsfrom mercury control equipment.
Plus: Read analyses of the National Academies’recent risk assessment recommendations report “Science and Decisions”.
Also look for…
• PM File
• Competitive Strategy
• Waste 101
• EPA Research Highlights
…As well as the results of the 2010 Board of Directors Election
In Next Month’s Issue…


awma.org
em • feature
by Jennifer B. Dunn
Jennifer B. Dunn, Ph.D., is a senior environmental engineer with URS Corp. Dr. Dunn works in the fields ofGHG management, air quality,and sustainability. She will return to Chicago from a temporary transfer to Belgiumin August 2009. Email: [email protected].
The transportation sector contributes significantly to greenhouse gas (GHG) emissionsworldwide, as Table 1 illustrates.1-4 Three broad, interrelated techniques exist to reduce transportation sector emissions, each with an important role: technology advancements,policy measures, and operational strategies.
32 em june 2009
The first technique, technology advancements, includes fuel economy improvements and low-carbon fuels. One drawback to relying completelyon new technologies can be high costs. Policymeasures, the second technique, are currentlyunder much scrutiny as the U.S. EnvironmentalProtection Agency (EPA) reconsiders its denial of awaiver of preemption for the state of California toregulate GHG emissions from certain new vehicles.If EPA grants the waiver, California can implementlegislation to reduce GHG emissions from passengercars (2009 and newer) by 30% by 2016.5 The 16 other states poised to follow California’s leadcan proceed should the waiver be granted.6
California is also developing legislation to curbGHG emissions from heavy-duty trucks.7
The third technique, operational strategies, is thesubject of this article. These strategies conserve fuelthrough behavioral changes, such as idle reductionand route optimization, and are often attractive because they can be near-term and yield cost savings.This article presents an overview of vehicle GHGemissions in the United States and two case studies,which describe operational strategies to reduceemissions from the two biggest contributors to U.S. transportation sector GHG emissions: movingfreight via diesel-fuelled trucks and travel in gasoline-fuelled cars.
Transportation Sector GHG EmissionsWorldwide, 2006 carbon dioxide (CO2) emissionsresulting from fossil fuel combustion, includingCO2 from transportation sources, were 29,195 teragrams (Tg).4 The United States contributed approximately 20% of these emissions. This sectionfocuses on CO2 emissions from the U.S. trans-portation sector because this sector emits signifi-cantly more CO2 than other GHGs that formduring fuel combustion (e.g., methane [CH4] andnitrous oxide [N2O]). In 2007, transportation-related sources were 31% of national CO2 emis-sions, but only 0.4% and 10% of national CH4 andN2O emissions, respectively.4 Additionally, CH4
and N2O emissions from the U.S. vehicle fleet have decreased 52% since 1990 and 45% since1998, respectively, as a result of emissions controltechnology.
Figure 1 displays the absolute changes in CO2
emissions from the following sectors: industry,transportation, commercial, residential, and agri-cultural.4 Electricity production has been allocatedamong these sectors. Of the sectors in Figure 1,the transportation sector was the greatest CO2
emitter in 2007 and experienced a 27% increasein CO2 emissions between 1990 and 2007. Incontrast, industrial CO2 emissions increased byonly 1% in that time span. Emissions from the
Reducing Transportation SectorGreenhouse Gas EmissionsCase Studies in Operational Strategies
Copyright 2009 Air & Waste Management Association

awma.org june 2009 em 33
residential and commercial sectors are increasingalthough emissions trends in these sectors typicallydepend more upon weather than economic conditions. As manufacturing in the United Statesdecreases and cross-country shipment of goods increases, transportation will continue to play a lead-ing role in U.S. CO2 emissions. With the economychanging significantly during the current recession,however, it is unclear exactly how the trends in Figure 1 will play out through 2009.
One question that arises when considering pathstoward lower U.S. vehicle fleet GHG emissions iswhether to focus on reducing emissions fromheavy- or light-duty vehicles. The data in Figures 2and 3 provide insight.4 Figure 2 shows that gaso-line-fuelled vehicles are the largest contributor totransportation CO2 emissions. Unsurprisingly, then,passenger cars are the largest CO2 emitters in theU.S. vehicle fleet (Figure 3). Based on these data,efforts to reduce emissions from the nation’s passenger fleet would yield the greatest immediatereturns. The decrease in gasoline-fuelled vehicleCO2 emissions between 2004 and 2007 comparedto the increase in diesel-fuelled vehicles’ emissions,however, affirms the importance of also address-ing diesel-fuelled vehicles. Further supporting thisconclusion are the data in Figure 4, which revealdiesel-fuelled vehicle CO2 emissions increased by80% since 1990 whereas gasoline-fuelled vehicles’CO2 emissions have increased by 20%. Note thateach vehicle type in Figure 4 contains gasoline- anddiesel-fuelled vehicles, although some categories(e.g., cars) largely consume one fuel type. Whilegasoline-fuelled vehicles are the largest CO2 emit-ters in the U.S. vehicle fleet, diesel-fuelled vehiclesemissions are increasing at a faster rate.
The data in Figures 5 and 6 shed light on the causesof gasoline-fuelled vehicles’ CO2 emissions declinesince 2004. Figure 5 shows the market share oflight-duty trucks versus passenger cars since 1976and illustrates the decreasing market share of light-duty trucks since 2004.8 Figure 6 reveals the corresponding increase in sales-weighted fueleconomy, which higher light-duty truck fuel economystandards, on the rise since 2005, also influenced.8
Table 1. Percent of total CO2 emissions contributed by the transportationsector in selected countries or regions.
Country/Region Year Percent (%) of Total National or Regional CO2 Emissions Contributedby the Transportation Sector
European Union1 2006 21a
Australia2 2006 18
Canada3 2006 32
United States4 2007 31
Note: aRoad transportation only.
Copyright 2009 Air & Waste Management Association
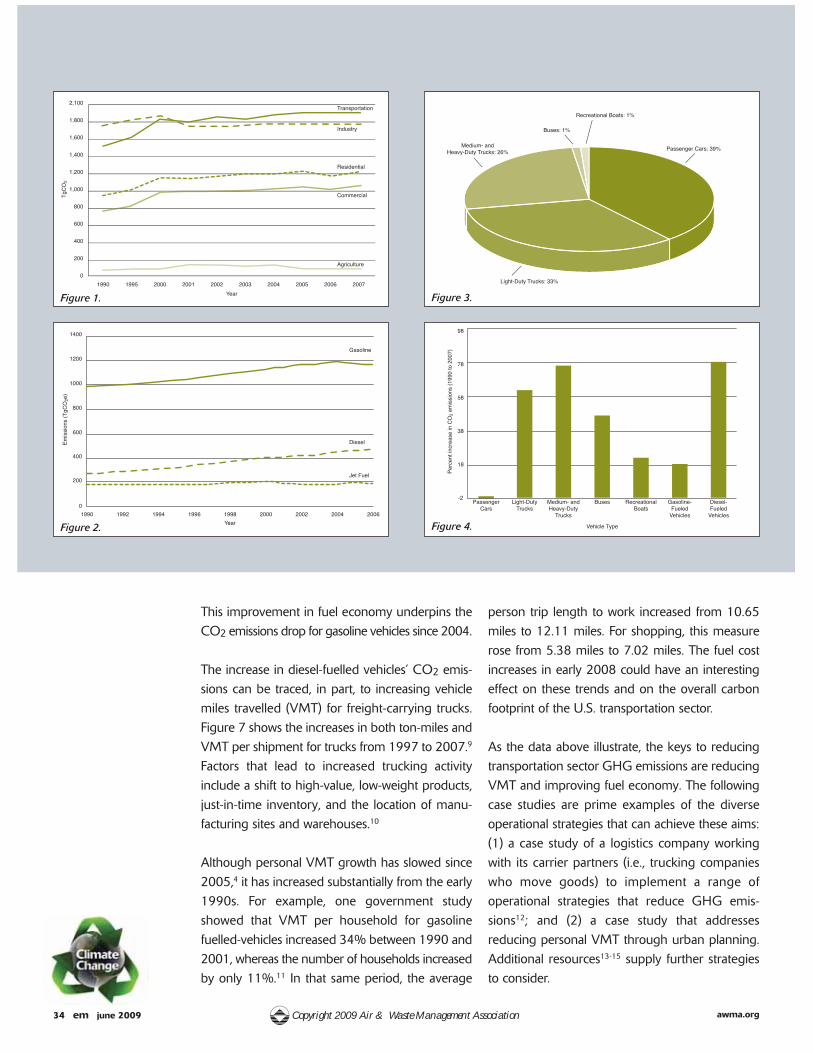
awma.org34 em june 2009
This improvement in fuel economy underpins theCO2 emissions drop for gasoline vehicles since 2004.
The increase in diesel-fuelled vehicles’ CO2 emis-sions can be traced, in part, to increasing vehiclemiles travelled (VMT) for freight-carrying trucks.Figure 7 shows the increases in both ton-miles andVMT per shipment for trucks from 1997 to 2007.9
Factors that lead to increased trucking activity include a shift to high-value, low-weight products,just-in-time inventory, and the location of manu-facturing sites and warehouses.10
Although personal VMT growth has slowed since2005,4 it has increased substantially from the early1990s. For example, one government studyshowed that VMT per household for gasoline fuelled-vehicles increased 34% between 1990 and2001, whereas the number of households increasedby only 11%.11 In that same period, the average
person trip length to work increased from 10.65miles to 12.11 miles. For shopping, this measurerose from 5.38 miles to 7.02 miles. The fuel cost increases in early 2008 could have an interestingeffect on these trends and on the overall carbonfootprint of the U.S. transportation sector.
As the data above illustrate, the keys to reducingtransportation sector GHG emissions are reducingVMT and improving fuel economy. The followingcase studies are prime examples of the diverse operational strategies that can achieve these aims: (1) a case study of a logistics company workingwith its carrier partners (i.e., trucking companieswho move goods) to implement a range of operational strategies that reduce GHG emis-sions12; and (2) a case study that addresses reducing personal VMT through urban planning.Additional resources13-15 supply further strategiesto consider.
Transportation2,100
1,800
TgC
O2
1,600
1,400
1,200
1,000
800
600
400
200
1990 1995 2000 2001 2002 2003Year
2004 2005 2006 20070
Industry
Residential
Commercial
Agriculture
Gasoline
Diesel
Jet Fuel
Emis
sion
s (T
gCO
2e)
1990 1992 1994 1996 1998 2000 2002 2004 2006Year
0
200
400
600
800
1000
1200
1400
Passenger Cars: 39%
Light-Duty Trucks: 33%
Medium- andHeavy-Duty Trucks: 26%
Buses: 1%
Recreational Boats: 1%
Perc
ent i
ncre
ase
in C
O2 e
mis
sion
s (1
990
to 2
007)
PassengerCars
Light-DutyTrucks
Medium- andHeavy-Duty
Trucks
Buses RecreationalBoats
Gasoline-Fueled
Vehicles
Diesel-Fueled
Vehicles
Vehicle Type
-2
18
38
58
78
98
Figure 1.
Figure 2.
Figure 3.
Figure 4.
Copyright 2009 Air & Waste Management Association

awma.org june 2009 em 35
Using Logistics to Reduce Freight Transportation EmissionsLakeside Logistics is a non-asset-based, multiservice,third-party logistics (3PL) company. Headquarteredin Oakville, Ontario, the company develops trans-portation management solutions, assisting its customers in reducing transportation costs and,more recently, GHG emissions. Lakeside workswith 3500 carrier partners, or companies that own vehicle fleets and accept contracts to move freight,operating in the United States and Canada.
In 2007, Lakeside began its initiative to reduceGHG emissions from its shipper customers andjoined EPA’s SmartWay Transport Partnership. Thispartnership aims to reduce fuel consumption andincrease the efficiency of transportation. As aSmartWay 3PL partner, Lakeside Logistics encour-ages its carrier partners to also join the partnership.The carriers then receive technical support and
emissions tracking software to help them reducefleet emissions. The strategies SmartWay partnersuse include idle reduction technologies (e.g., aux-iliary power units) and other operational strategiessuch as tag-team drivers. A full list of SmartWaypartner strategies is available on the SmartWayWeb site.16
Ton
Mile
s (m
illion
s)
Aver
age
Mile
s Pe
r Shi
pmen
t
1997 2002 2007Year
Average miles per shipment
Tom-miles carried by for-hire and private trucks
0 0
20
40
60
80
100
120
140
160
180
200
200000
400000
600000
800000
1000000
1200000
1400000
1600000
Figure 1. U.S. CO2 emissions by economic sector with electricity-related emissions distributed (Tg CO2).4
Figure 2. U.S. transportation-related CO2 emissions by fuel (Tg CO2).4
Figure 3. Percent contribution to transportation-related CO2 emissions by vehicle type in the United States (2007).4
Figure 4. Percent increase in CO2 emissions from 1990 to 2007 by vehicle type.4
Figure 5. Vehicle market share of light-duty vehicles sold from 1976 to 2007.8
Figure 6. Sales-weighted fuel economy from 1978 to 2007.8
Figure 7. Ton-miles carried and average miles per shipment by trucks from1997 to 2007.9
Cars
Light Trucks
Vehi
cle
Mar
ket S
hare
(%)
1975 1980 1985 1990 1995 2000 20050%
10%
202
30%
40%
50%
60%
70%
80%
90%
Mile
s pe
r Gal
lon
1978 1983 1988 1993Model Year
1998 200318
19
20
21
22
23
24
25
26
27
Figure 5.
Figure 6.
Figure 7.
Copyright 2009 Air & Waste Management Association

awma.orgCopyright 2009 Air & Waste Management Association36 em june 2009
While gasoline-fuelled vehicles arethe largest CO2emitters in the U.S. vehicle fleet,diesel-fuelled vehicles emissionsare increasing at a faster rate.
SmartWay partners set and track progress towardenvironmental performance goals with a three-yeartime horizon. Because Lakeside carrier partnerswho have joined SmartWay are reducing theiremissions, Lakeside can promote them to shippercustomers looking to trim supply-chain carbonemissions. Approximately 30% of Lakeside’s loadsare carried by SmartWay carriers. Additionally, thecompany has more than doubled the share of milesof freight carried by SmartWay carriers from 10%to 25% in one-and-a-half years. The company aimsto increase that percentage to 30% within threeyears of partnering with SmartWay. Lakeside willuse the next generation of EPA software, to be released this year,17 to quantify emissions reductionsfrom the actions of its carrier partners.
To help customers track GHG emissions, Lakesideprovides data to its customers with an ExecutiveDashboard tool,18 which taps data generated byexisting SmartWay emissions tracking software.19
Each month, customers receive key performancemetrics such as on-time deliveries, along with theircarbon emissions. The customers also see a non-SmartWay carrier carbon emissions benchmark,and the percent of miles and load pulled by Smart-Way carriers. Another operational strategy Lakesideuses is load optimization software. Called Prophecy,it models product manipulations. Prophecy helpsLakeside achieve optimal transport scenarios andavoid less-than-truckload shipments by buildingtruckloads with up to four customers’ productsfrom one shipper.
Mulling the future of carbon management in thelogistics industry, Lakeside considers increased collaboration with delivery schedulers as a measurethat merits more attention. Heightened collabora-
tion could reduce rescheduling, which wastes timeand fuel.
When 3PLs and shippers take advantage of pro-grams like SmartWay they can reduce carbonemissions from freight movement. A company’sfirst step toward emissions reductions might be toinventory emissions and apply an Executive-Dash-board-like data tracking system to understandemission trends. Once emissions are known, ashipper can decide how to reduce emissionsthrough operational strategies within its own fleetor carrier partner fleets. Adopting operationalstrategies can save costs, bring recognition for social responsibility, and put freight movementcompanies in a proactive stance toward any upcoming regulation.
Urban Planning for Lower GHG Emissions from Personal TransportationUrban planning arguably plays the same role forreducing personal VMT as logistics planning doesfor the freight industry. A recent report on urbandevelopment and climate change20 postulates that,based on a review of research in the field, compactdevelopment will reduce the need to drive by approximately 30%. The authors further speculatethat smart growth independently could reduce totalvehicle-derived CO2 emissions by 7–10% by2050. The report also estimates that shifting 60%of new growth into smart growth would reduceU.S. CO2 emissions by 79 million metric tons annually by 2030.
Numerous communities are employing smartgrowth tactics to achieve many environmental improvements, including VMT and subsequentGHG emission reductions. The case study selected
Advertisers’ IndexEM Advertiser (www) Go to page
Aarcher Institute of Environmental Training LLC (aarcherinstitute.com) . . . . . . . . . . . . . . . . . . . . . . . . . . . . . 9Bio Reaction Industries (bioreaction.com) . . . . . . . . . . . . . 41Economic Development Alliance of Sinclair County(edascc.com) . . . . . . . . . . . . . . . . . . . . . . . . . . . . . . . . . . . . 35Lakes Environmental Software Inc. (weblakes.com). . . . . . Back Cover
EM Advertiser (www) Go to page
Met One Instruments Inc. (metone.com). . . . . . . . . . . . . . 13Tri-Mer Corp. (tri-mer.com) . . . . . . . . . . . . . . . . . . . . . . . . 15Trinity Consultants Inc. (trinityconsultants.com) . . . . . . . . . 19UL DQS Inc. (ul-dqsusa.com). . . . . . . . . . . . . . . . . . . . . . . 7
To advertise in EM, call Malissa Goodman at 1-412-904-6012.

awma.org june 2009 em 37
for this article, Atlantic Station, is among the mostprominent of these communities and was accom-plished in the somewhat unique environment ofAtlanta, a city with mixed industrial, commercial,and residential character. The community is underdevelopment on the site of an abandoned steel millin downtown Atlanta. It is a mixed-use site, withresidences (e.g., condos, single-family homes, apart-ments), offices, and commercial space either existingor in development. The final site will accommodatemore than 12,000 residents and employees.
Community designers targeted an average resident daily VMT below 27 miles with a modeof transportation split of at least 25% non-single-occupancy vehicles. An initial study of residents revealed that the average daily VMT per residentis well below that target at 8.6 miles.21 This resultcompares extremely favorably with the regional average VMT of 32 miles per person per day. Themode split is nearly 50% non-single-occupancy vehicles. Furthermore, total vehicle trips per yearare 30,000 below the target number of 70,000.
Atlantic Station is a unique case in that developersessentially created a large community from scratch.The results, however, are remarkable. The keytake-away message is that communities can incor-porate VMT, mode split, and trip-per-year goals inplanning. Indeed, policy measures in the pipeline,such as California’s SB 375, which aims to cut emis-sions from poor urban planning that can cause increased VMT, may spur more community development designed to reduce VMT.22
ConclusionUnmistakably, transportation of both freight andpassengers is a significant source of GHG emis-sions. While technology and policy measures arepivotal resources in efforts to reduce emissionsfrom this sector, strategy options that can increasethe efficiency of goods and people movement areindispensible, can be near term without the delaysinherent in technology and regulation develop-ment, and can bring financial benefits such aslower fuel costs for businesses and families. em
References1. Annual European Community Greenhouse Gas Inventory 1990–2006 and Inventory Report 2008; European Environment Agency: Copenhagen,
Denmark, 2008. See www.eea.europa.eu/publications/technical_report_2008_6/Annual-European-Community-greenhouse-gas-inventory-1990-2006-and-inventory-report-2008 (accessed April 2009).
2. Australian Government Department of Climate Change Emissions Information System. See http://www.ageis.greenhouse.gov.au/GGIDMUserFunc/QueryModel/Ext_QueryModelResults.asp (accessed April 2009).
3. National Inventory Report: Greenhouse Gas Sources and Sinks in Canada, 1990–2006; Environment Canada: Ottawa, Ontario, Canada. Seewww.ec.gc.ca/pdb/ghg/inventory_report/2006_report/tdm-toc_eng.cfm (accessed April 2009).
4. Inventory of U.S. Greenhouse Gas Emissions and Sinks: 1990–2007; U.S. Environmental Protection Agency: Washington, DC, 2009. Seewww.epa.gov/climatechange/emissions/usinventoryreport.html (accessed March 2009). Note: The 2007 inventory is in draft form and openedfor public comment on March 5, 2009.
5. See www.epa.gov/otaq/climate/ca-waiver.htm (accessed February 2009).6. See www.pewclimate.org/what_s_being_done/in_the_states/vehicle_ghg_standard.cfm (accessed February 2009).7. See www.arb.ca.gov/cc/hdghg/hdghg.htm (accessed February 2009).8. Transportation Energy Data Book, Edition 27; U.S. Department of Energy: Washington, DC, 2008.9. Commodity Flow Surveys for 1997, 2002, and 2007; U.S. Department of Transportation, Bureau of Transportation Statistics; Washington, DC,
2008. See www.bts.gov/publications/commodity_flow_survey/index.html (accessed February 2009).10. Greenhouse Gas Emissions from the U.S. Transportation Sector, 1990–2003; U.S. Environmental Protection Agency: Washington, DC, 2006.
See www.epa.gov/otaq/climate/420r06003.pdf (accessed April 2009).11. Summary of Travel Trends, 2001 National Household Travel Survey; U.S. Department of Transportation and U.S. Federal Highway Administration:
Washington, DC, 2004.12. Personal Communication with Susan Moore (Director of Sustainability) and Tom Coates (Vice President of Supply Chain Services), Lakeside
Logistics. February 19, 2009.13. Green, D.L.; Schafer A. Reducing Greenhouse Gas Emissions from U.S. Transportation; Pew Center on Global Climate Change: Arlington, VA,
2003. See www.pewclimate.org/docUploads/ustransp.pdf (accessed April 2009).14. See www.epa.gov/oms/climate/whatyoucando.htm (accessed April 2009).15. Freight Transportation Action Plan; Commission of the European Communities: Brussels, Belgium, 2007. See http://ec.europa.eu/transport/
logistics/freight_logistics_action_plan/doc/action_plan/2007_com_logistics_action_plan_en.pdf (accessed April 2009).16. See www.epa.gov/smartway/transport/partner-resources/resources-publications.htm#technologies (accessed April 2009).17. U.S. Environmental Protection Agency SmartWay Transport Partnership Newsletter, March 2009. See www.epa.gov/smartway/newsroom/
documents/e-update-mar-09.pdf (accessed April 2009).18. See www.lakesidelogistics.com/AboutUS/Campaign/dash.htm (accessed April 2009).19. See www.epa.gov/smartway/transport/partner-resources/resources-complete.htm#tools (accessed April 2009).20. Ewing, R.; Bartholomew K.; Winkelman, S.; Walters, J.; and Chen, D. Growing Cooler: The Evidence on Urban Development and Climate
Change; Urban Land Institute: Los Angeles, CA, 2008.21. Sustainable Urban Redevelopment and Climate Change: The Dual Benefits of Energy-Efficient Buildings in Energy-Efficient Locations; Northeast–
Midwest Institute: Washington, DC. Prepared for Congressional Briefing, July 17, 2008.22. See www.arb.ca.gov/cc/sb375/sb375.htm (accessed February 2009).
Copyright 2009 Air & Waste Management Association

38 em june 2009 awma.orgCopyright 2009 Air & Waste Management Association
em • feature
by Ray Hoff
Raymond M. Hoff, Ph.D., is a professor in the Departmentof Physics and director of theJoint Center for Earth SystemsTechnology and the GoddardEarth Sciences and TechnologyCenter at the University ofMaryland, Baltimore, MD. Dr. Hoff has worked for morethan 34 years on remote sensing of air quality using light detection and ranging(lidar), as well as issues of toxic chemical deposition tothe Great Lakes. E-mail:[email protected].
This year marks the 50th anniversary of the first measurements of the Earth’s atmosphericcomposition from space. Grainy television images from orbit showed cloud motion, whichhas led to our current satellite meteorological additions to forecasting and prediction.1
Iconic images of the planet from the moon seen in the Apollo missions made the fragilityof the planet all too obvious. Encompassed by the vacuum of space, our planet has alayer of atmosphere that is as thin as a piece of paper when viewed in scale to the size ofEarth. Yet man’s activities changed the radiative transfer and health properties of that tenuous layer of the troposphere. We are still lacking significant observations of the loweratmosphere, which are relevant to air quality monitoring, measurement, and assessment.The 39th Critical Review addresses this opportunity in detail.2
A Summary of the 39th AnnualA&WMA Cr i t i c a l Rev i ewWho Owns Satellite Air Quality Measurements?
38 em june 2009 awma.org

awma.org june 2009 em 39Copyright 2009 Air & Waste Management Associationawma.org june 2009 em 39
The physics of the atmosphere and the ability tosee through clouds from space is a primary limitationof measuring tropospheric pollution. All satellitesensors are remote sensors. The second constrainton measurement has to do with the optical thick-ness of the atmosphere itself. While optical depth(i.e., the integral of extinction with height) is a primary variable for retrieving four-dimensional atmospheric concentration, the density of air nearthe surface limits our ability to see visible light scat-tering and the absorption of infrared radiation fromspace. Measurements for which the atmosphere isopaque, whether from clouds or gases, are notgoing to be useful for air quality applications wherethe surface concentration of critical pollutant tracegases need to be measured precisely.
Satellite measurement can be made in the tropo-sphere of air quality-related gases, including ozone(O3), carbon dioxide (CO2), methane (CH4), andsulfur dioxide (SO2). But for none of those gasescan a claim be made that concentrations at the surface are measured from space. The atmosphereis too opaque in the ultraviolet to see down thatfar, and in the infrared, the source of the thermalradiance from these gases is well aloft. For a numberof trace gases (e.g., O3, SO2, nitrogen dioxide[NO2], nitrous oxide [N2O], nitric acid [HNO3],formaldehyde [HCHO], glyoxal [CHOCHO],bromine oxide [BrO], carbon monoxide [CO],CH4, and CO2), there is a strong, developing community of air quality users, described in recentreview articles.3-5 For example, NO2 emissions inEurope from the Global Ozone Monitoring Exper-iment (GOME) measurements parallel emission estimates from the European Monitoring and Evaluation Programme (EMEP). While short-termfluctuations in emissions of NO2 and SO2 duringan experiment to turn off emission sources inChina during the 2008 Summer Olympics showskill in detecting regional sources. For developingcountries, with no surface measurements, satelliteobservations are critically important.
Aerosol Optical DepthThe primary measure of particulate pollution isaerosol optical depth (or AOD; i.e., the opticaldepth corrected for extinction of other gases, includ-ing nitrogen [N2], oxygen [O2], water [H2O], and
O3). Relationships between AOD and particulatemass at the surface have been widely made overthe past five years. The Critical Review examinesthe variability of the results from such measure-ments and shows that the precision of the meas-urement is not as good as one can make fromground-based sampling of fine particulate matter(PM2.5), but that coverage and spatial filling of gapsin surface monitoring is an advantage. Further research remains on techniques to improve the relationships between PM2.5 and AOD from space-borne measurement. These techniques revolvearound better retrievals of the planetary boundarylayer height in which the aerosols are primarilybound, in estimation of the humidification of aerosolsand in the determination of the relationship between extinction and mass. These issues are similar to the relationships between visibility andmass measurements at the surface previously discussed in the 2002 Critical Review.6
Aerosol measurements of emissions from fireshave been shown to bring more precision toground-based estimates of fire area burned andbiomass consumed. Without a doubt, the early detection of fires is valuable as source inputs to numerical models that have no other real-timeemission information. The value of satellite data inalerting environmental managers to situationalawareness (i.e., fire detection, fire motion, transport,dust storms, long-range transport from other continents) is obvious. The ability of newer satellitesin geostationary (staring) orbits will allow the detection of aerosol motion on time scales of minutes. There is some evidence that long-termmeasurements of AOD will allow the assessmentof trends in regional and global scale haziness.
Agency ResponsibilitiesWith these measurements bringing a valuable addition to the already significant ground networkof samplers in United States, Europe, and Asia, it isworth examining why no agency “owns” satelliteair quality measurements. In the Critical Review,2 itis noted that only one legislative mandate exists formaking satellite composition measurements andthat is the requirement for the National Aeronau-tics and Space Administration (NASA) to measurestratospheric ozone under Title VI of the U.S. Clean
Editor’s Note: In the39th Annual A&WMACritical Review, “RemoteSensing of ParticulatePollution from Space:Have We Reached thePromised Land?,”2
R.M. Hoff and S.A.Christopher discuss thestate of the art of themeasurement of airpollution from space-borne platforms. TheCritical Review focuseson atmospheric particu-lates as an importantpart of air quality measurement andmanagement, but alsodiscusses trace gasmeasurements from a number of differentplatforms, orbits, andtechniques.

40 em june 2009 awma.orgCopyright 2009 Air & Waste Management Association
Air Quality Measurement
Platform/Instrument
ResponsibleAgency
Cooperating Agencies
Timeframe
Fire detections MODIS/AVHRR/GOES/VIIRS (future)
U.S. Department of Agriculture
(USDA)/ U.S. For-est Service (USFS)NOAA, NASA, U.S.Naval ResearchLaboratory (NRL)
Current
Smoke transport MODIS/GOES/OMI
NOAA NASA, USDA, U.S.Department of Energy (DOE),NRL
Current
Fire emission rate MODIS/GOES/AVHRRVIIRS (future)
EPA NOAA, NASA,DOE, NRL
Current
Dust emission AIRS/GOES-R NOAA NRL, NASA Future
Real-time transportair quality alerts
MODIS/GOES/OMI/VIIRS(future)
EPA USFS, U.S. Depart-ment of HomelandSecurity (DHS),Centers for DiseaseControl and Prevention (CDC)
Current
Long-range transport
MODIS/VIIRS/GOES/OMI
NASA NRL, NOAA, DOE, Current
Surface NO2prediction
OMI/GOME/GOMOS
EPA NASA, NOAA, European SpaceAgency (ESA)
Future
Surface PM2.5prediction
MODIS/GOES/VIIRS/GOES-R(future)
EPA NOAA, NASA,CDC, ESA
Future
Free tropospherictrace gases (CH4,CO, CHOCHO,SO2, etc.)
AIRS/IASI/MOPITT/GeoCAPE(future)
NASA NOAA, National Science Foundation(NSF), DOE, ESA,Joint Center forSatellite Data As-similation (JCSDA)
Current
AOD trends for regional haze
MODIS/POLDER/VIIRS (future)
EPA NASA Future
Table 1. Strawman agency lead roles in air quality-related satellite measurements.
Air Act. The U.S. Environmental Protection Agency(EPA) has taken a satellite observations role for itself in the Exceptional Events Rule.7 If a region canshow conclusively that they are being impacted byan event (e.g., a fire, dust storm, etc.), which is out-side their jurisdiction to regulate, the event can beflagged as a nonexceedance event. This provides a
significant motivation for regional air quality districtsto examine transport from other areas to seewhether there are such extenuating circumstances.
The rule states:Information demonstrating the occurrence of theevent and its subsequent transport to the affected
There is no oneagency that shouldown air quality, asthere is likely to beno one agency thatwould have soleresponsibility forclimate change.

awma.org june 2009 em 41Copyright 2009 Air & Waste Management Association
monitors. This could include, for instance, documen-tation from land owners/managers, satellite-derivedpixels (portions of digital images) indicating the pres-ence of fires; satellite images of the dispersing smokeand smoke plume transport or trajectory calculations(calculations to determine the direction of transportof pollutant emissions from their point of origin) connecting fires with the receptors.
AOD tracking from day to day can provide evidencethat may help make such a case. There is the onus,however, to show that the event was significantenough that had it not occurred—the “but for”test—the site would have been in compliance withEPA air quality guidelines.7 The Critical Review2
shows that the state of the art in PM2.5 estimationwill not help the “but for” test unless significantlymore precision is brought to satellite measurements.
Agency efforts to define who is responsible forsatellite air quality measurements have led to bilateralagreements between the National Oceanic and Atmospheric Administration (NOAA) and NASA,NASA and EPA, and EPA and NOAA, but there isno clear legislative definition as to who should beresponsible for ensuring that satellite measure-ments of air quality continue to be made. The currentsituation is one of serendipity and persistence onthe part of atmospheric scientists who continue topush measurements into applications of societalrelevance without a clear indication from the U.S.Congress that such measurements must be made.
The National Academy of Sciences (NAS) hasweighed in twice in the past four years on this subject. In a report on the NASA Applied Sciencesprogram,8 the relationship between NASA AppliedSciences and the relationship to responsibilities inthe decision-making agencies was discussed in somedetail. In the NAS Decadal Survey recommenda-tions, air quality was clearly identified as a nationalneed and applications were highlighted.9 Yet, asone of the author’s of the Decadal Survey recentlytold Congress:
“Our ability as a nation to sustain climate observa-tions has been complicated by the fact that no single
agency has both the mandate and requisite budgetfor providing ongoing climate observations.”10
That testimony called for referral of issues of juris-diction in satellite measurements to the InteragencyWorking Group on Global Earth Observations(IWGEO). The exact same concern can be voicedby changing the word “climate” to “air quality”above. The issue of ownership and responsibilityfor such measurement will continue to plague theU.S. agency mandates unless the Office of Scienceand Technology Policy (OSTP) intervenes and aidsin some definition and guidance for the agencieswhich are involved in air quality assessment. As theDecadal Survey recommended:9
[OSTP], in collaboration with the relevant agenciesand in consultation with the scientific community,should develop and implement a plan for achievingand sustaining global Earth observations. Such juris-dictional issues are difficult and turf protectionabounds within existing agencies. OSTP should
For developingcountries with no surface measurements,satellite observa-tions are criticallyimportant.

awma.orgCopyright 2009 Air & Waste Management Association
remember that protection of the environment andthe public takes precedence over agency turf wars.IWGEO can aid in such guidance of how the majoragencies should cooperate on these issues, butIWGEO has neither the legislative or financial abilityto define and direct such measurements. Providing alegislative mandate would be a step forward, butonly if the mandate is funded.
There is sympathy in Washington for resolvingthese jurisdictional gaps. One unnamed Senatortold the author “Can’t you give me something thatwill make NOAA and NASA work together onsomething?” Clearly, the agencies do cooperate onmajor missions where NASA builds the satellitesand NOAA operates them. Unfortunately, the National Polar Orbiting Environmental Satellite System (NPOESS) has not been a model of a well-managed government program with authoritativedecision-making and this has led to cost overrunsthat affect the viability of the scientific measure-ments and threaten the program. Very recently,NPOESS’s schedule has been pushed back another year because of difficulty in constructingthe visible infrared imager radiometer suite (VIIRS) sensor.
Summary and RecommendationsWith the risk of showing hubris, this article recom-mends some leadership roles for the agencies whoparticipate in air quality observations from satellites.Table 1 looks at some current and upcoming opportunities, which would be aided if the agenciesinvolved took ownership over the measurementand were given concomitant budgetary resourcesto manage the issue. There is no one agency that
should own air quality, as there is likely to be noone agency that would have sole responsibility forclimate change. However, without leadership, supportfrom partner agencies, advocacy, and a legislativemandate (either from Congress or by agency rule-making) many of the potential scientific measure-ments and advances that can be made from spacewill just not happen.
Alternatively, the IWGEO process could be givensome real authority (including funding) to ensurethat measurements relevant to societal needs continue to be made. In the 2010 US$107 millionNOAA NESDIS budget under discussion, onlyUS$500,000 was set aside for global earth obser-vation activities.11 There remains considerable skepticism in the scientific community that such interagency cooperation will be possible with part-per-thousand funding. Congress puts up significantbarriers to interagency programs through the appropriation process. It is difficult, if not impossible,to transfer funds from one agency to another tosupport work on a mission or measurement whoseexpertise lies in another agency. This leads to duplication of effort or, at worse, complete lack ofeffort where the responsibility lies in an agency thatdoesn’t have the expertise. The author is not sonaïve as to believe that this one issue will serve as motivation for Congress to change how they fundresearch, but without some study of the issue byOSTP, little will change to advance the use of newtechnologies on old problems. The Critical Review2
states that “we have not yet reached the PromisedLand” of satellite air quality measurements, but abetter path forward is clearly in sight. em
References1. Wexler, H. TIROS Observational Results; Space Sci. Rev. 1962, 1, 7-67.2. Hoff, R.M.; Christopher, S.A. Remote Sensing of Particulate Pollution from Space: Have We Reached the Promised Land?; J. Air Waste Manage.
Assoc. 2009, 6, 645-675; doi: 10.3155/1047-3289.59.6.645.3. Martin, R.V. Satellite Remote Sensing of Surface Air Quality; Atmos. Environ. 2008, 42 (34), 7823-7843.4. Fishman, J.; Bowman, K.W.; Burrows, J.P.; Richter, A.; Chance, K.V.; Edwards, D.P.; Martin, R.V.; Morris, G.A.; Pierce, R.B.; Ziemke, J.R.; Al-Saadi, J.A.;
Creilson, J.K.; Schaack, T.K.; Thompson, A.M., Remote Sensing of Tropospheric Pollution from Space; Bull. Am. Meteor. Soc. 2008, 89 (6), 805-821.5. Veefkind, P.; van Oss, R.F.; Eskes, H.; Borowiak, A.; Dentner, F.; Wilson, J. The Applicability of Remote Sensing in the Field of Air Pollution. Institute
for Environment and Sustainability; European Joint Commission: Ispra, Italy, 2007; 54 pp.6. Watson, J.G. Visibility: Science and Regulation; J. Air Waste Manage. Assoc. 2002, 52 (6), 628-713.7. Treatment of Data Influenced by Exceptional Events, Final Rule; Fed. Regist. 2007, 72 (55), 13560-13581.8. Assessment of the NASA Applied Sciences Program; National Academies Press: Washington, DC, 2007.9. Earth Science and Applications from Space: National Imperatives for the Next Decade and Beyond; The National Academies Press: Washington,
DC, 2007.10. Critical Satellite Climate Change Datasets; Subcommittee on Commerce, Justice, Science, and Related Agencies, Congress of the United States:
Washington, DC, 2009.11. Omnibus Appropriations Act, Division B. H.R. 1105, Congress, U. S., Ed. 2009.
Attend the 39th AnnualCritical ReviewPresentation
“Remote Sensing of Particulate Pollution from Space:Have We Reachedthe Promised Land?”
by Raymond M. Hoffand Sundar A.Christopher
Wednesday, June 17, 2009Cobo CenterDetroit, MI8:00 – 11:30 a.m.www.awma.org/ACE2009
42 em june 2009
Sundar A. Christopher
Raymond M. Hoff

awma.org june 2009 em 43Copyright 2009 Air & Waste Management Association
In the past, the Association was profitable in years when the Mega meetingoccurred. This year, A&WMA used these funds for increased membershipprograms, such as the member-get-a-member campaign, and an analysisto improve information technology operations. These decisions, combinedwith the poor performance of the stock market, resulted in a loss ofUS$327,000. The decrease was mainly due to the poor performance of investment funds. (Note: The S&P 500 was down 38% in 2008, however,A&WMA’s overall invested capital was only down by 15% because at least35% of our fund balance is invested in fixed-income investments.) The organization has a current fund balance of US$1.1 million.
Revenue and ExpensesOverall, the Association saw aloss of US$327,000. This wasUS$413,000 worse thanbudget and US$250,000 lessthan 2007. Even thoughA&WMA programs per-formed better than budget(e.g., ACE was US$159,000better than budget and Megawas US$57,000 better thanbudget), income from invest-ments were below budget by$357,000 and below the previous year by $269,000due to the current trend inthe market. The investmentportfolio was changed in thesecond quarter. This resulted
in a lower overall investment loss than the market, since a large percentageof our investment funds were in cash during the transition.
MembershipTotal membership saw a 1% increase over 2007 to 8487. Over the pastseveral years, individual memberships have decreased, while organizationaland other memberships have increased. A&WMA saw a 3% decrease (174members) in individual membership over 2007, but had a 12% (299) increase in other memberships. The charts below show the changes inmembership by category. The individual organization category saw thelargest increase with 136 members or 13%, while the emeritus (52) andstudent (71) categories both saw large increases.
A&WMA is truly an international organization. The chart above shows alllocations with five or more members in 2008, sorted by membership total.The chart excludes U.S. (6898 members) and Canadian (1011 members)memberships.
ScholarshipsThe goal is to grow the Scholarship Fund and to pay scholarships from theinvestment returns. The Scholarship Fund currently stands at US$480,000,which saw a US$82,000 decrease in 2008 over 2007, mainly due to theperformance of equities. In 2008, the Scholarship Fund received US$6,000in individual contributions, US$9,500 from Bechtel, US$10,000 from Feld-stein, and US$18,000 from ACE special events (i.e., the Silent Auction,US$6,500 and Golf Outing, US$11,400). Unfortunately, the investmentsexperienced a loss of US$83,000 in 2008.
The Scholarship Trustees decided to award US$35,000 in 2009. Scholar-ships are based on a three-year average and the initial calculations for 2010scholarships are that they will need to be reduced by US$7,000. Pleaseconsider a donation to the Scholarship Fund.
A&WMA Fund Balance
In 2006, A&WMA reached a five-year goal to have a fund balance ofUS$1.5 million. A&WMA’s Board of Directors decided that was an accept-able fund balance to maintain and that in 2007 and 2008, the Associationwould look to reinvest profits into the organization to grow membership.Unfortunately, the decrease of investments due to market volatility in 2008resulted in a fund balance of US$1.1 million, a US$327,000 decrease in thefund balance over 2007. The budget for 2009 is to have a flat bottom linebefore investments, which means that the market volatility will determinewhether the A&WMA fund balance will increase or decrease. em
em • message from the treasurer
Financial Statement for 20082008 was a turn-around year, which included increases in membership, improved performance of theAnnual Conference & Exhibition (ACE) in Portland, and the bi-annual Mega Conference.
by Amy Gilligan

44 em june 2009 awma.orgCopyright 2009 Air & Waste Management Association
em • ipep quarterly
by Richard Crume andDiana Kobus
Richard Crume is a member of IPEP’s Board of Trustees,and Diana Kobus is IPEP’s Executive Director.
In these tough economic times, students and recent graduates in the environmental sciences and engineering fields are seeking direction in their budding careers as theystruggle to pay their tuition bills. Many students enroll in environmental programs becausethey want to make a positive difference in their communities and nation—many are inspired by President Obama’s call to tackle the global warming issue—but these studentsalso want, and deserve, some reasonable assurance that they will find jobs upon graduation.Several years ago the employment outlook was strong, anticipating vigorous economicgrowth and a monumental number of baby boomer retirements on the horizon. Today,finding a job right out of school is far less certain.
Environmental Professional Intern Certification
Now More Than Ever
At a time when layoffs exceed job creation, students competing for limited employment opportunities need tostand out, and having a degree from a top university is notalways enough. Employers want to see evidence that grad-uating students have worked hard to learn the fundamen-tals while going the extra mile to prepare for the challengesthat lie ahead. One way an environmental student candemonstrate both competence and a high level of motiva-tion is to become certified as an Environmental ProfessionalIntern (EPI). This credential is available to qualified studentsabout to graduate and also to environmental professionalswho have entered the field within the past five years. It is thefirst step for many professionals in securing their QualifiedEnvironmental Professional (QEP) certification.
Both the EPI and QEP are administered by the Instituteof Professional Environmental Practice (IPEP), formed in1992 by a visionary group of A&WMA leaders seeingthe need for a broad-based environmental credential.These visionaries have been joined over the years byother organizations, including
• American Academy of Environmental Engineers• American Industrial Hygiene Association• Carolinas Air Pollution Control Association• Institute of Clean Air Companies• National Association for Environmental Management• Solid Waste Association of North America• Water Environment Federation

awma.org june 2009 em 45Copyright 2009 Air & Waste Management Association
The Institute of ProfessionalEnvironmental Practice (IPEP)is a member of the Council ofEngineering and ScientificSpecialty Boards (CESB), anindependent organization thataccredits engineering, scientific,and technology programs. Formore information about IPEPand the QEP and EPI certifica-tions, contact CertificationServices Coordinator, IPEP,600 Forbes Ave., 339 FisherHall, Pittsburgh, PA 15282;phone 1-412-396-1703; fax: 1-412-396-1704; e-mail: [email protected]; web: www.ipep.org.
The EPI and QEP certifications were conceived with theintention of making it easier for those using the servicesof environmental professionals to identify competent andexperienced individuals committed to a code of envi-ronmental ethics. In creating the EPI credential, IPEP rec-ognized a growing need to promote and assist qualifiedprofessionals just entering the field and to instill in thema professional standard of ethical conduct. Today, the EPIis the only independent, international, and interdiscipli-nary credential that upholds standards of knowledge andethical conduct for environmental students and recentgraduates. The EPI is available to individuals meeting oneof the following conditions:
• College or university seniors working on a technicalbaccalaureate or master’s degree in physical, earth, ornatural sciences; engineering; or mathematics.
• Individuals who have received a baccalaureate or mas-ter’s degree in one of the above disciplines and havejust entered the field, are anticipating entering thefield, or have less than five years of qualifying envi-ronmental work experience.
Through IPEP, EPIs become part of an international net-work of highly skilled and well-trained environmentalprofessionals that stretches across the traditional bound-aries between industry, government, academia, and con-sulting. IPEP members are available to mentor EPIs, and
the lines of communication that can be opened throughthis membership network are invaluable for job-seekersand young professionals. As the world struggles in themidst of a serious economic recession, quality profes-sional relationships and networking are more importantthan ever.
Students need encouragement to pursue their goals andto never give up, no matter how tough their individual circumstances. They need to learn by example that asenvironmental professionals, we must work together tofind the most effective solutions to the energy, economic,and environmental issues we face as a global community.And they need to know what earlier generations learnedduring the Great Depression, two World Wars, and a terrorist attack on the United States—that the humanspirit cannot be denied, and we will recover from theeconomic downturn stronger than ever.
The environmental profession can help students andyoung professionals facing today’s challenges by pro-moting programs like the EPI that build the confidenceand optimism needed to succeed in the global market-place. As employers fill limited vacancies in the comingyears, having an EPI certification is a clear signal to thehiring manager that the individual under consideration isreally something special! em
Since its inception in 1993, IPEP has certified more than 1500 environmental professionals.
As a proud supporter of IPEP and the QEP and EPI certifications, A&WMA congratulates the newest* QEPs and EPIson their outstanding achievement.
QEPsBlair Corning, Commerce City, COHarold McElhoe, Oak Ridge, TNGreg Gemgnani, Allentown, PA
Daniel Robeen, Fort Walton Beach, FLPaul Scott, Pittsburgh, PAKerwei Sew, St. Paul, MN
Joseph Sorge, Somerville, NJEric Welling, Indianapolis, INMichelle York, Corvallis, OR
EPIsJamie Akiki, Fayetteville, ARLindsay Baxter, Pittsburgh, PAWilliam Bond, Fayetteville, ARWilliam Drake, Fayetteville, ARValentine Forcha, Columbus, OHTravis Gasnier, Fayetteville, ARErin Grantz, Fayetteville, AR
Orville Grey, Kingston, JamaicaDerian Jackson, Kingston, JamaicaCody Johnson, Sanger, TXRaghunatha Komaragiri, Torrance, CAKristy McCullough, Soldotra, ARAngela Moore, Fayetteville, ARAmanda Muir, Pittsburgh, PA
Latoya Palmer, Clarendon, JamaicaAdam Poll, Santa Maria, CAMatthew Reid, Fayetteville, ARTamarah Schultz, Victoria, TXStephen Steward, Fayetteville, ARChristopher Stoneburg, Columbus, OHNathan Walker, Fayetteville, AR
*QEPs and EPIs certified after April 30, 2009, will be acknowledged in the August 2009 edition of IPEP Quarterly.

46 em june 2009 awma.orgCopyright 2009 Air & Waste Management Association
The “P3” stands for the three pillars of sustainability:people, prosperity, and the planet. The program sup-ports science-based designs developed by college anduniversity students that benefit people by improvingtheir quality of life, promote prosperity by developinglocal economies, and protect the planet by conservingresources and minimizing pollution.
Solutions to Real-World ProblemsLaunched in 2004, EPA’s P3 program offers collegestudents quality, hands-on experience addressingreal-world problems. Through a competitive process,interdisciplinary teams of students are awarded “Phase I”grants of US$10,000 to design a solution to a challengein sustainability. P3 Phase I grants can address one ormore of six areas: water, energy, agriculture, builtenvironment, materials and chemicals, and informationtechnology.
Teams work on their projects throughout the year, andthen travel to Washington, DC, in the spring todemonstrate their work and compete for Phase II grantsof US$75,000. The additional funding supports effortsto test ideas at the pilot scale, implement them in thefield or community, and bring them to market.
Over the past five years, P3 projects have seeded severalsmall businesses and local community projects here inthe United States, as well as in developing countries.
Water, Alternative Energy Popular ThemesThe 2008–2009 class of Phase I projects includes 43teams with almost half addressing a challenge related towater. For example, students at the University of Pittsburghare partnering with Tsinghua University and the ShenyanInstitute of Environmental Sciences in China to designand implement low-cost treatment to remove arsenicfrom wells, using naturally occurring iron available
inexpensively from Inner Mongolia. Meanwhile, stu-dents from The State University of New York Collegeof Environmental Science and Forestry are designingmedium-sized constructed wetlands to remove nitrogenfrom dairy wastewater.
Alternative energy and green buildings are also popularthemes this year. A University of Missouri team isdesigning and testing a solar thermal and electric energyhybrid roof panel system in a modular form to makealternative energy sources available and affordable fortypical homes. And Drexel University students are usingglass hollow microspheres for architectural coatingscapable of scattering and reflecting ultraviolet, visible,and near-infrared radiation from the sun to reduce solargain on the exterior of a building.
Several other teams are focusing on challenges in thebiofuels area. They include how to produce butanol frombiomass, how much biofuel can be produced fromswitchgrass planted on public land, and how to increasethe efficiency of solar thermal and biofuels technologiesand decrease the carbon dioxide emissions comparedto diesel generators.
Important BenefitsEach year, EPA’s P3 competition culminates in theNational Sustainable Design Expo held on the NationalMall in Washington, DC. Open to the public, the expohosts the student teams, as well as nonprofit andgovernment organizations, providing a wonderful net-working opportunity for students, faculty, and programleaders. The students’ energy and ingenuity is infectious,and generates new collaborations and partnerships for allparticipants.
There are other important benefits of EPA’s P3 pro-gram beyond the project results themselves and theopportunities for competition and collaboration. The
em • epa research highlights
“P3 stands for the threepillars ofsustainability:people, prosperity,and theplanet. ”
P3 Program Ignites the Next Generationof Environmental Problem-SolversIn the world of million-dollar research grants, laboratory campuses, and research consortiums, it’seasy to forget that sometimes an innovative idea or significant results can come from a smallprogram and a few people collaborating on solving some aspect of a big problem. The U.S.Environmental Protection Agency’s (EPA) Office of Research and Development manages justsuch an effort to advance environmental sustainability—the P3 program.

awma.org june 2009 em 47Copyright 2009 Air & Waste Management Association
program helps to infuse sustainability principles intothe curricula offered by the participating colleges anduniversities. Using the P3 program as an educationaltool is one of the criteria used to evaluate all proposalsfor funding.
Many educators have used their P3 project as the subjectof a course such as a senior capstone design course. Forexample, University of Tennessee students receivedcredit for a P3 project as an alternative to a requiredclass. Meanwhile, University of Virginia offered a six-creditelective class centered on a P3 project to design andbuild an award-winning environmental educationbarge—powered by solar and wind energy systems—forstudents in grades K through 12.
The P3 program also provides an opportunity for ad-dressing real-world problems. Hands-on learning, longknown in the education world as an essential componentof any engineer’s training, is also central to the success ofthe students who participate and move on to build theircareers.
“We’ve seen how effective it is for education and lighting
fires underneath students, to use it as a way to introducestudents to the emerging markets of green collar jobs…We’ve even had students being offered positions inbiodiesel technology after graduation,” said ShaneLashawa of Loyola University in Chicago, when talkingabout the biodiesel program that received P3 funding.
Every year the judges, convened by the American Asso-ciation for the Advancement of Science, are amazed atthe high quality of all the projects and recommend moreprojects for the US$75,000 grant than EPA can fund.Building on the success of the first five years of theprogram, EPA is planning to join with other federalsustainability programs to leverage its funding to expandthe program.
As this article went to press, the 2009 competition forPhase II grants had not been completed and the awardshad not been announced. To find out who won, visitwww.epa.gov/p3. em
This article was written by Cynthia Nolt-Helms, EPA P3Program Manager, and Mary Wigginton, EnvironmentalProtection Specialist. Barbara Levinson also contributed.
For more information on the research discussed in this column, contact DeborahJanes, Public Information Officer, U.S. EnvironmentalProtection Agency (B205-01),Office of Research and Development, Research Triangle Park, NC 27711;phone: 1-919-541-4577; e-mail: [email protected]. Disclaimer: Although this textwas reviewed by EPA staff andapproved for publication, itdoes not necessarily reflect official EPA policy.

48 em june 2009 awma.orgCopyright 2009 Air & Waste Management Association
em • news focus
Ray Lahood; and Carol Browner, assistant to thepresident for energy and climate change.
Emissions Cut ExpectedAccording to the White House, the standards wouldachieve the same GHG emissions reductions in 2016as would be achieved under emissions limits adoptedby California, 13 other states, and the District of Columbia. The California standards are designed toachieve a 30% emissions reduction by 2016.
Obama cited the state standards, the existing corpo-rate average fuel economy standards administeredby DOT’s National Highway Traffic Safety Adminis-tration, and a U.S. Supreme Court mandate for EPAto make a decision on emissions limits for autoswhen he said “the rules governing fuel economy inthis country are inadequate, uncertain, and in flux.”
The proposed national policy “changes all that,” he said. “The goal is to set one national standardthat will rapidly increase fuel efficiency—withoutcompromising safety—by an average of 5% eachyear between 2012 and 2016.
A White House official told BNA that before EPAcan propose emissions limits, it must first finish action under a proposal it issued April 17 to findthat GHG emissions from vehicles endanger pub-lic health and welfare. The agency cannot regulateGHG emissions without this finding, the officialsaid. EPA was required by a 2007 Supreme Courtdecision to make a determination on endangermentfrom vehicle emissions (Massachusetts vs. EPA, 127S. Ct. 1438, 63 ERC 2057 (2007)).
Cost Set at $600 per VehicleA senior White House official told reporters May18 that the new standards will cost approximatelyUS$600 per vehicle. This is on top of the US$700per vehicle the official said were imposed by requirements of the Energy Independence and Security Act of 2007 (Pub. L. No. 110-140), whichrequires a combined average of 35 mpg for carsand light trucks in 2020, the official said.
Obama said the fuel savings from the standardswould save consumers enough money to make upfor the added cost to vehicles in three years. “Sothis is a winning proposition for folks looking to
News Focus is compiledfrom the current editionof Environment Reporter,published by the Bureauof National Affairs Inc.(BNA). For more informa-tion, visit www.bna.com.
Obama Announces Rules for FuelEconomy, Emissions for AutomobilesDeclaring that “the status quo is no longer accept-able,” President Obama May 19 announced amajor increase in automobile fuel economy standards and an initiative to impose for the firsttime national limits on greenhouse gas (GHG)emissions from automobiles.
The new fuel economy standards to be issued bythe U.S. Department of Transportation (DOT) willrequire cars and light trucks to achieve a combinedaverage of 35.5 miles per gallon (mpg) in 2016,up from 25 mpg in 2008. In addition, the U.S. Environmental Protection Agency (EPA) intends topropose a national carbon dioxide (CO2) standardfor vehicles under Section 202 (a) of the U.S. CleanAir Act, and the agency is considering a limit of250 grams per mile in 2016, according to theObama administration.
EPA and DOT have prepared a notice of intent toconduct a joint rulemaking to put the standards inplace. The standards would begin with model-year2012 vehicles and would proceed “with a generallylinear phase-in” until they are fully implemented in2016, according to the notice. The new fuel economy standards will require cars to achieve anaverage of 39 mpg and light trucks 30 mpg by2016. The current standards are 27.5 mpg for carsand 23.1 mpg for light trucks.
According to the White House, the standards willreduce GHG emissions by 900 million metric tonsthrough 2016, the equivalent of shutting 194 coal-fired power plants or taking 177 million cars offthe road. “Just to give you a sense of magnitude,that’s more oil than we imported last year from Saudi Arabia, Venezuela, Libya, and Nigeriacombined,” Obama said during a Rose Gardenceremony at the White House.
The standards were endorsed by the three majorAmerican automakers, several foreign makers, theUnited Auto Workers, and the governors of California, Michigan, and Massachusetts. Amongthose appearing with Obama were representativesof U.S. and foreign automakers; Ron Gettelfinger,president of the United Auto Workers; EPA Administrator Lisa Jackson; Transportation Secretary

awma.org june 2009 em 49Copyright 2009 Air & Waste Management Association
buy a car. In fact, over the life of a vehicle, the typical driver would save about US$2,800 by getting better gas mileage,” Obama said.
The Alliance of Automobile Manufacturers issueda statement May 18 in anticipation of the Obamaannouncement saying the new standards will impose one set of nationwide standards, a key objective of the industry, and its chief point of opposition to the California standards.
Ford Motor Co. President Alan Mullally, who wasat the White House ceremony, said the agreement“allows us to, not only to improve the fuel mileageof every vehicle, whether small, medium, or large,a car or a truck, but also at the same time reduceCO2 and have those requirements harmonized,which means that we can really focus our investmentand deliver the future of energy independence andenergy security and … sustainability.”
‘Perfect Timing’ CitedMullally said the agreement came about becauseof pressure on the DOT to increase fuel economy,California’s action to regulate GHG emissions, andEPA’s forthcoming emissions standards. “It was perfect timing for the administration to pull all theparties together,” he said.
EPA is reconsidering its denial in 2007 of a Clean AirAct waiver to California to implement its own GHGemissions limits on vehicles. Lisa Page, spokes-woman for California Gov. Arnold Schwarzenegger(R), said the state still expects to get a waiver for itsstandards, but will defer to nationwide standards setby EPA and the Transportation Department.
LaHood, Jackson, and California Attorney General Edmund G. Brown Jr. (D) exchanged letters May 18agreeing that California will abide by GHG emissionslimits set by EPA in the years 2011 through 2015.The letters also said that the automobile industry willstay litigation it has filed in various federal courtsagainst the California standards, and will withdraw thelawsuits when California finalizes a rulemaking toadopt the federal standards. California Air ResourcesBoard Chair Mary Nichols told BNA, however, thatnone of the parties “gave up their legal rights.”
Page said that even though the EPA standards for
2011–2015 will be less stringent than those adoptedby California, they will achieve greater emissions reductions because they will be applied nationwide.
California also plans to develop regulations for thepost-2016 period to help the state achieve its 2020goal of cutting GHGs to 1990 levels and furtheringthe governor’s more aggressive goal or reducing theclimate-altering emissions 80% by 2050. The statewould need a separate waiver to implement thoseregulations. “This is a huge victory for California,”Schwarzenegger said. The California standards wouldapply to 40% of the United States, while the federalstandards will apply nationwide,” Schwarzeneggersaid. “That’s a 150% increase,” he said.
The Notice of Upcoming Joint Rulemaking to Establish Vehicle GHG Emissions and CAFE Standards by EPA and DOT is available online atwww.epa .gov /o t aq / c l ima te / re gu l a t i ons /joint-noi-vehicle-ghg.pdf.—by Steven D. Cook andCarolyn Whetzel, BNA em
FREE
ONE-YEAR
MEMBERSHIP
To help you stay connected to your colleagues aroundthe world, we are offering all graduates (undergraduates,
masters, or doctoral candidates) a FREE one-yearA&WMA membership!
This membership comes with all of the benefits ofyour student membership.
Contact a member services representative at412-232-3444 to take advantage of this offer.
Are you an A&WMAstudent member who willbe graduating this year?If so, we have a graduation gift for you!

50 em june 2009 awma.orgCopyright 2009 Air & Waste Management Association
em • icac update
State Regulators Briefed on StationaryEngine Controls and ESP UpgradesWorking with the Mid-Atlantic Regional Air Man-agement Association (MARAMA; www.marama.org),ICAC recently briefed state permitting officials onstationary engine control technologies and upgradeoptions for electrostatic precipitators (ESPs).
State permitting staff from Maryland, New Jersey,New York, Pennsylvania, and Virginia participatedin the session that reviewed emissions controls for stationary engines, highlighting available controloptions, such as diesel particulate filters and selectivecatalytic reduction, oxidation, and ammonia catalysts.In addition to outlining how the technologies operate, case study examples were provided tooffer a sense of the various applications and performance of controls available.
On a separate occasion, state regulators in theMARAMA region received an overview of the var-ious rebuild options for ESPs, including enlargingthe collection fields, design changes to dischargeelectrodes, and the addition of high-frequencytransformer rectifier sets to optimize power usage.
ICAC Offers History LessonAt a recent environmental conference, ICAC staffpresented a brief history of air pollution controltechnology for coal-fired electricity generation overthe past 40 years and outlined how regulatory drivers have spurred market innovation and com-petitiveness, sweeping technological developments,and the deployment of state-of-the-science emissioncontrol technologies for sulfur dioxide, nitrogen oxides, and mercury. In addition, ICAC staff looked athow that experience may translate to potential driversfor greenhouse gas emission control technology.
The presentation highlighted how state and federalactions have been the most significant factor in thecreation of markets for emission control technologyand reducing considerable uncertainty as to whenand what technologies will be needed.
ICAC believes that regulatory actions drive implementation of emission control technology,stimulate innovation needed to overcome operatingissues, and ultimately result in improved reliability,increased emission reductions, and lower costs. The
presentation described how many of the successfulprograms produced by the U.S. Clean Air Act havenot only resulted in significant health and quantifi-able environmental benefits, but also helped forman industry responsible for creating hundreds ofthousands of jobs.
New Air Pollution Control IndustryGuidance Documents AvailableICAC will publish three new guidance documentsthis year: an update to the Selective Catalytic Reduction (SCR) Whitepaper, the Activated CarbonInjection (ACI) Bid Specification and Evaluation Document, and the Nitrogen Oxides (NOx) Samplingfor Coal-Fired Boiler Applications Whitepaper.
The SCR whitepaper is a substantial update overthe original 1997 version that now discusses catalystmanagement strategies, recent and continueddevelopments in SCR technology, and mercury co-benefits of an SCR catalyst; the ACI bid specifi-cation guidance document provides forms and accompanying discussion to be used when collectingdata necessary to solicit bids from vendors for activated carbon injection systems, preparing spec-ifications and bid documents, and evaluating bidsreceived; and the NOx whitepaper provides guide-lines for the proper design and operation of SCRsystem sampling and monitoring systems.
ICAC and IPEP Form Professional Development PartnershipICAC recently partnered with the Institute of Pro-fessional Environmental Practice (IPEP; www.ipep.org)to help promote its multidisciplinary, multimediaenvironmental certification: the Qualified Environ-mental Professional (QEP; for professionals withmore than five years of experience in the environ-mental field) and the Environmental ProfessionalIntern (EPI; for students and those with less thanfive years of environmental experience).
Attainment of IPEP’s QEP and EPI certificationdemonstrates a breadth of knowledge in the environmental sciences and a commitment to excellence through continued professionaldevel-opment. ICAC is one of seven organizations, including A&WMA, actively supporting IPEP andthe certification process (see page 44 for moreabout IPEP). em
The latest news and activities from the Institute of Clean AirCompanies (ICAC), thenational trade associa-tion of companies thatsupply air pollutionmonitoring and controlsystems, equipment, andservices for stationarysources. For more infor-mation, contact DavidC. Foerter, ICAC Exec-utive Director, 1730 MSt., Ste. 206, Washing-ton, DC 20036; e-mail:[email protected];Web: www.icac.com.

awma.org june 2009 em 51
Advocates ask EPA to Add H2S to Hazardous Pollutants ListEnvironmental, public health, and community organiza-tions have asked EPA to formally list hydrogen sulfide(H2S) as a hazardous air pollutant subject to regulationunder the U.S. Clean Air Act (CAA). “It’s time for EPA totake action to formally acknowledge [H2S]’s clear toxicityat low concentrations,” the groups wrote in a letter toEPA Administrator Lisa Jackson. “As administrator, youhave CAA authority under Section 112(b)(2) to actbased on a pollutant that poses or may pose ‘a seriousthreat of adverse health benefits.’”
The letter, signed by representatives of the Sierra Club,Citizens for Environmental Justice, Earthjustice Legal Defense Fund, Environmental Integrity Project, and several other organizations, also calls on EPA to requireannual reporting of H2S as a toxic substance under theToxics Release Inventory (TRI) reporting program. According to the letter, “EPA needs a TRI reportingthreshold of 1.0 lb for H2S and not 10,000 lb, as wasoriginally the requirement.”
According to the letter, H2S is known to cause death athigh concentrations and adverse respiratory-brain-nervous system effects at lower levels.
H2S “escaped” being added to EPA’s original list of hazardous air pollutants in 1990, the groups said, due toopposition from the oil and gas industry. Neil Carman, aresearch chemist who is clean air program director forthe Lone Star Chapter of the Sierra Club and a former
Texas state environmental official, said H2S is a “hugepublic health issue. It’s probably the most toxic unregu-lated pollutant out there.”
U.S. GHG Emissions Higher in 2007 than First ReportedThe United States emitted 7,150 million tons of carbondioxide-equivalent (CO2e) in 2007, slightly more thanEPA had initially reported, according to a final green-house gas (GHG) inventory. EPA prepared the report,Inventory of Greenhouse Gas Emissions and Sinks: 1990–2007, with help from other federal agencies in responseto a United Nations Framework Convention on ClimateChange, ratified by the United States in 1992, detailingintergovernmental efforts to address climate change by185 member nations.
The report tracks emissions of CO2, as well as emissionsof methane, nitrous oxide, hydrofluorocarbons, perfluo-rocarbons, and sulfur hexafluoride. Emissions of the latter gases are measured in CO2e units, calculated bymultiplying their emissions (in metric tons) by their globalwarming potentials. The draft report had calculated U.S.GHG emissions at 7,125 million tons of CO2e.
The change in emissions between the draft and final report largely represented a methodological change required by the Intergovernmental Panel on ClimateChange that allocates additional emissions to the steeland iron industries, as well as other corrections to emissions estimates, according to EPA.
U.S. Environmental Protection Agency (EPA) Administrator Lisa Jackson has announced the release of US$600 million in economic stimulusfunds for the cleanup of 50 Superfund sites nationwide. Jackson said the funds, authorized by the American Recovery and ReinvestmentAct of 2009 (Pub. L. No. 111-5), will jump-start local economies by creating jobs in the communities where the sites are located, as theyaccelerate cleanup at some sites and fund new work at others.
Jackson made the announcement at a news conference at the New Bedford (Mass.) Harbor Superfund Site, accompanied by Massa-chusetts Governor Deval Patrick (D) and Rep. Barney Frank (D-Mass.). The New Bedford site will receive US$25–35 million, which will“provide a tremendous boost to the cleanup… that could more than triple the amount of PCB [polychlorinated biphenyl]-contaminatedsediment removed compared to recent years,” Jackson said. “The progress anticipated this year will significantly expedite the timetableto return a clean harbor back to the community.”
Three New Jersey Superfund sites will each get approximately US$25 million: the Roebling Steel Site in Florence, the Vineland Site in Vineland, and the Welsbach Co. and General Gas Mantle Co. Site in Camden. Five other New Jersey sites will also receive stimulusfunding. New Jersey has more Superfund sites than any other state. em
em • washington report
EPA Announces $600 Million in Stimulus for Superfund
Compiled by Mark WilliamsThe Bureau of National Affairs, Inc.www.bna.com
Copyright 2009 Air & Waste Management Association

52 em june 2009 awma.orgCopyright 2009 Air & Waste Management Association
Ontario Green Sector Held Back by Redtape, Industry SaysOntario’s current regulatory system isn’t keepingpace with technological innovation, according to astudy involving more than 180 businesses in theprovince’s environmental sector. The study, Readyto Grow: Making Ontario’s Environment Industry aWorld Leader at Home and Abroad, involved arange of companies from areas like waste processing,water purification, alternative energy, recycling, andenvironmental engineering.
47% of participants agreed that Ontario is a greatplace for environment companies to do business.Respondents named talent, population, access to theUnited States, and globally competitive educationalinstitutions as some of the province’s strengths. Butonly 16% agreed that Ontario is the best provincein Canada for environmental business.
Compared to Europe and some U.S. states, Ontario is slow to approve new technologies andthe review processes that the province uses are outdated and time consuming, respondents said.70% said that it takes at least 1.5 times as long toget certificates of approval in Ontario than in comparable jurisdictions.
Deloitte conducted the research in February andMarch 2009 on behalf of the Ontario EnvironmentIndustry Association and in partnership with theOntario Ministries of the Environment, Economic
Development, and Research and Innovation, andthe Ontario Centers of Excellence. The study isavailable online at www.oneia.ca/files/ONEIA%20Deloitte%20-%20Ready %20to%20Grow.pdf–byErika Beauchesne, EcoLog
GHG Emissions in Alberta Reducedby 6.5 Million TonsOne year after introducing mandatory greenhousegas (GHG) emission reduction targets, the Albertagovernment said that it reduced GHGs by 6.5 milliontons (Mt). The targets were part of the province’sGHG reduction program. A detailed, final reportwill be released later in 2009 when industry sub-mission audits are complete, the government said.
Under the province’s regulatory framework, facilitiesthat emit more than 100,000 tons of carbon dioxideequivalents have to improve their emissions intensityperformance by 12%, relative to an establishedbaseline emissions rate for each facility. Facilitiesthat go beyond the 12% reduction are issuedemissions performance credits that can be bankedfor future use or sold to other facilities. In the full yearof 2008, there were 1.89 Mt emissions perform-ance credits generated, compared to 1.03 Mt inhalf of 2007.
More information is available online at http://alberta.ca/home/news.cfm. em
em • canadian report
The Federal Court of Canada has issued an Order demanding that the federal government start publicly reporting pollutiondata from the metal mining industry. The court made the decision after several environmental groups filed a lawsuit alleging that the Minister of Environment broke the law when he failed to collect and report pollution information fromCanadian mines under the National Pollutant Release Inventory (NPRI). Pollution data from 2006 onward from Canada’s80 metal mining facilities will have to be reported to the NPRI.
In the United States, mining companies must report all pollutants to the Toxics Release Inventory (TRI), the U.S. equivalentto Canada’s NPRI. In 2005, the 72 mines reporting to the TRI released more than 500 million kilograms of mine tailingsand waste rock, which made up 27% of all U.S. pollutants reported.
Ecojustice filed the lawsuit in 2007 on behalf of MiningWatch Canada and Great Lakes United. More information is availableonline at www.ecojustice.ca/media-centre/press-releases/court-victory-forces-canada-to-report-pollution-data-for-mines.
Federal Government Ordered to Report Pollution Datafrom Canadian Mines
Canadian Report is compiledwith excerpts from EcoLogNews and the EcoCompli-ance.ca newsletter, both pub-lished by EcoLog InformationResources Group, a division ofBIG Information Product LP.For more Canadian environ-mental information, visitwww.ecolog.com or phone +1-888-702-1111, ext. 8.

awma.org june 2009 em 53Copyright 2009 Air & Waste Management Association
used for power production. Economical “front-end”changes in combustion equipment and more expensive“end-of-pipe” post-combustion controls are covered. Reg-ulations that affect allowable NOx levels are also reviewed.The knowledge gained in the course will allow attendeesto comply with myriad regulations and promote safe andeconomical operation. There are no prerequisites, how-ever, a scientific, engineering, or operations backgroundwould be beneficial, as would some knowledge of industrial applications (e.g., steam boilers, gas turbines).
SIX-WEEK ONLINE COURSES2009 Schedule:August 30–October 10 October 18–November 28
AIR-284E: Boilers, Process Heaters, and Air Quality RequirementsInstructor: Leo H. Stander, P.E., DEE, NSPE, Environmental ConsultantThe purpose of this course is to explain the air quality requirements that are involved in the design and oper-ation of industrial, commercial, and institutional boilersand process heaters. Prior knowledge of the operationof these units is useful, but is not required. Prior knowl-edge of air pollution control measures or requirementsis not necessary or expected. Upon completion of thiscourse, participants should be able to identify affectedboilers and process heaters; discuss air quality require-ments, including SIP, PSD, NSR, NSPS, NESHAP, andMACT; describe emissions limitations and work practicestandards; describe monitoring procedures for deter-mining initial and continuous compliance; and explainreporting and record keeping requirements.
EMGM-191E: Internal Environmental AuditorInstructor: David R. McCallum, M.E.Des., President, M+A Environmental Consultants, Inc.The purpose of this course is to develop the knowledgeand skills needed to effectively participate in internal auditing programs, for both environmental managementsystems (EMSs) and regulatory compliance. At the endof this course, participants should be able to explain the purpose of environmental auditing, describe the factors necessary for a successful audit, assist in the planning and undertaking of environmental audits, develop audit protocols, gather acceptable audit evidence, and prepare appropriate audit findings and follow-up audit results. Prior knowledge of EMSs, environmental regulations, or auditing techniques is useful, but is not required. em
FOUR-WEEK ONLINE COURSES2009 Schedule:July 5–August 1November 1–November 28
GEN-100E: Environmental Practices Review (EPR)Instructor: Tim C. Keener, Ph.D., P.E., QEP, Professor, University of CincinnatiThis course is intended to help those interested in reviewing their science and engineering skills as they relate to environmental problem-solving. Those inter-ested in using this material as a refresher before takingcertification examinations (e.g., QEP) should find it mosthelpful. This material can serve as both a review and astand-alone course for the study of fundamental concepts in environmental engineering and science. Theobjective of the course will be to teach students how tosolve problem typically found in environmental engi-neering and science, and assumes that the participanthas some previous knowledge of the subject matter.
GENAQ-100E: Environmental Practices Review (EPR)Specialty Course: Air QualityInstructor: Joseph P. Pezze, QEP, President, The Hillcrest Group, LLCThis course is designed to help students prepare for professional certification through a review of major airquality issues. In this course, students will not only focuson scientific and technical issues, but will also learn howto apply them to real-world scenarios. Discussions topicswill include ambient air quality standards, permit re-quirement, particulate and gaseous air pollution controls,toxic emissions, emission inventories, source testing, con-tinuous monitoring, air pollution meteorology, and com-bustion. Additionally, issues such as pollution preventionwill be discussed as alternatives to end-of-pipe controls.Upon completion of the course, students will have ageneral understanding of air quality, and know what ittakes to analyze and understand major air quality issues.
AIR-311E: NOx Control for Industrial and Utility ApplicationsInstructor: Thomas F. McGowan, P.E., President, TMTS Associates, Inc.This intermediate course is focused on the control of nitrogen oxides (NOx) emissions for industrial heatingequipment, including boilers, kilns, furnaces, and thermaloxidizers, as well as coal-fired boilers and gas turbines
em • professional development programs
Visit the E-Learning Center atwww.awma.org for up-to-dateschedules.
>>NEWFOR2009!
EMGM-382: Fundamentals of NewSource Review (NSR)Learn the basics aboutNSR. Watch for more details online atwww.awma.org.

54 em june 2009 awma.orgCopyright 2009 Air & Waste Management Association
The following two courses are being held in conjunctionwith the specialty conference, Harmonizing Greenhouse GasAssessment and Reporting Processes, August 31–September2, 2009, Baltimore, MD.
AUGUST 31 (8:00 A.M.–12:00 P.M.)AIR-128: GHG Emissions ManagementInstructors: Katherine N. Blue, Managing Consultant, andRam Ramanan, Ph.D., P.E., Principal Consultant, Trinity Consultants Inc.Learn the latest on this timely topic, including significant regional, U.S., and international policy developments related to climate change and methods of effective GHGemissions management. Real-world case studies and exercises demonstrate how to prepare effective GHG inventories according to World Resources Institute/World Business Council for Sustainable Development(WRI/WBCSD) Greenhouse Gas Protocols and other frequently used protocols. Participants will also learn aboutvoluntary program options, carbon risk management andstrategy development, carbon offsets and emissions trading,emissions reduction opportunities, and benchmarking bestpractice companies.
AUGUST 31 (1:00 P.M.–5:00 P.M.)AIR-129: Getting Started with Your Greenhouse Gas(GHG) Program: Practical Considerations for ManagingGHG Emissions in an Evolving ClimateInstructor: Terri Shires, URS Corp.
Climate change is receiving significant attention in theUnited States. States and regional organizations are takingaction now through voluntary and mandatory programs,while a myriad of federal activities are being explored. Thefinancial community and shareholders are questioning companies about potential exposures, their impact on sharevalue, and what specific actions are being taken to mitigatethese risks. Companies recognize that they will be affected,but are looking for guidance and direction in this uncertainand rapidly evolving GHG landscape.
The following two courses are being held in conjunctionwith the specialty conference, Guideline on Air Quality Models: Next Generation of Models, October 26–30, 2009,Raleigh, NC.
OCTOBER 26 (8:00 A.M.–5:00 P.M.)AIR-298: Introduction to the CALPUFF Modeling SystemInstructors: Joseph S. Scire, CCM, Vice President, Earth Tech Inc.CALPUFF has been designed by the U.S. EnvironmentalProtection Agency (EPA) as a guideline model for long-range transport applications and for use on a case-by-casebasis for both near- and far-field applications in complexflow situations where steady-state conditions do not apply.This course will provide an overview of the modeling systemand its capabilities, including recent developments.
OCTOBER 27 (8:00 A.M.–5:00 P.M.)AIR-297: Introduction to AERMODInstructors: Robert Paine, CCM, QEP, and Jeff Connors,both with AECOM Inc.AERMOD was adopted on December 9, 2005, by the U.S.Environmental Protection Agency (EPA) as a replacementfor the ISCST3 model, which has been in use in variousforms for 25 years. The advanced model will require theuser community to become acquainted with new conceptsin air quality modeling. This course provides an overviewof AERMOD’s features and performance. It discusses implementation issues regarding this new model. Severalcomputer exercises and debugging sessions are providedon CD as part of the course. Attendees should plan to bringa laptop with a CD drive to the session. em
For more infor-mation about the courses andconferences onthis page, go towww.awma.org/events.
em • professional development courses
Listed below are the articles appearing in theJune 2009 issue of the Journal. For ordering information, go to www.awma.org/journal or call1-412-232-3444.
In This Month’s Issue...2009 Critical Review—Remote Sensing of Particulate Pollution from Space: Have WeReached the Promised Land?
Gaseous Oxygen Uptake in Porous Media at Different Moisture Contents and Airflow Velocities
Real-Time Airflow Rate Measurements from Mechanically Ventilated Animal Buildings
Accuracy of Exhaust Emission Factor Measurementson Chassis Dynamometer
Wind Tunnel Measurements of the Dilution ofTailpipe Emissions Downstream of a Car, a Light-Duty Truck, and a Heavy-Duty Truck Tractor Head
Dilution Rates for Tailpipe Emissions: Effects of Vehicle Shape, Tailpipe Position, and Exhaust Velocity
Potential Flue Gas Impurities in Carbon DioxideStreams Separated from Coal-Fired Power Plants
Modeling of Personal Exposures to Ambient Air Toxics in Camden, New Jersey: An Evaluation Study
Low-Energy and Chemical-Free Activation of Pyrolytic Tire Char and Its Adsorption Characteristics
Analysis of Motorcycle Exhaust Regular TestingData—A Case Study of Taipei City
JUNE 2009 • VOLUME 59
JOURNAL

awma.org Copyright 2009 Air & Waste Management Association june 2009 em 55
2010MARCH22–26 Air Pollution and Health: Bridging the Gap
from Sources to Health Outcomes, An International Specialty Conference by theAmerican Association for Aerosol Research,San Diego, CA; www.aaar.org/index2.cfm?section=Meetings_and_Events
MAY17–20 Joint Conference: International Thermal
Treatment Technologies and HazardousWaste Combustors, San Francisco, CA
JUNE22–25 A&WMA’s 103rd
Annual Conference & Exhibition, Calgary, Alberta, Canada
AUGUSTAug 30 Power Plant Air Pollutant Control Mega –Sept 2 Symposium, Baltimore, MD
SEPTEMBER11–16 15th World Congress of the International
Union of Air Pollution Prevention Associations (IUAPPA): Achieving Environmental Sustainability in a Resource Hungry World, Vancouver, British Columbia, Canada
28–30 2010 Vapor Intrusion, Chicago, IL
NOVEMBER1–4 Symposium on Air Quality Measurement
Methods and Technology, Los Angeles, CA
2009JUNE16–19 A&WMA’s 102nd Annual Conference
& Exhibition, Detroit, MI
AUGUSTAug 31 Harmonizing Greenhouse Gas Assessment–Sept 2 and Reporting Processes, Baltimore, MD
SEPTEMBER15–16 Air Quality Impacts of Oil and Gas
Production in the Rocky Mountains, Centennial, CO
21–25 Energy Efficiency and Air Pollutant Control, Wroclaw, Poland; www.energy-air-wroclaw.pwr.wroc.pl
OCTOBER4–6 A&WMA Florida Section’s Annual
Conference, Captiva Island, FL; [email protected]
20–22 ASTM International Committee E50 on Envi-ronmental Assessment, Risk Management,and Corrective Action, Atlanta, GA;www.astm.org/COMMIT/E50.htm
25–29 International Air Quality VII Conference, Arlington, VA; www.undeerc.org
28–30 Guideline on Air Quality Models: Next Generation of Models, Raleigh, NC
NOVEMBER1–5 International Society of Exposure Science
(ISES) 2009 Annual Conference: Transforming Exposure Science in the 21st Century, Minneapolis, MN
17 A&WMA Rocky Mountain States Section’sConference on Air Quality Issues in theRocky Mountain Region, Golden, CO;[email protected]
em • calendar of events
ENERGY AND ENVIRONMENT
CALGARY 2010
Events sponsored and cosponsored by the Air &Waste Management Association (A&WMA) arehighlighted in bold. For moreinformation, call A&WMAMember Services at 1-800-270-3444 or visit theA&WMA Events Web site:www.awma.org/events.
To add your events to this calendar, send to: Calendar Listings, Air & Waste Manage-ment Association, One GatewayCenter, 3rd Floor, 420 FortDuquesne Blvd., Pittsburgh, PA15222-1435. Calendar listingsare published on a space-available basis and should be received by A&WMA’s editorialoffices at least three months inadvance of publication.
Go online for the most up-to-date events informationwww.awma.org/events

56 em june 2009 awma.orgCopyright 2009 Air & Waste Management Association
em: What inspired you to become an environmentalprofessional?Rybolt: I am very fortunate to have grown up in the PacificNorthwest and enjoy the natural environment greatly. Incollege, I studied business and science, and during that time Isaw a crucial connection between business operations andthe integration of environmental and sustainability practices.It only seemed fitting that my passion for the outdoors becombined with my interest in business.
What environmental leader do you admire mostand why?David Brower, a modern-day conservationist. Brower had aprofound impact on protecting America’s wilderness areasand helped create various national parks and protect vastwilderness areas throughout the United States. Whilesome may view Brower’s actions as radical, his dedication,enthusiasm, commitment, and perseverance has allowedmany to enjoy the natural environment.
What advice would you give to students and/oryoung professionals just starting out in the field?Meet as many people as you can—network. Have an openmind and a willingness to try something new or differentthat you may have not considered in order to gain valuableexperience. Learn from the experiences of others.
What does A&WMA membership mean to you?A&WMA is an excellent Association offering technicalknowledge, valuable leadership opportunities, and excitingsocial events. The individuals that I have had an opportunityto meet through A&WMA are amazing; sharing a wealth ofknowledge, experience, and entertainment.
What was the best A&WMA Annual Conferenceyou’ve attended (and why)?The 2008 Annual Conference & Exhibition (ACE) in Portland,OR. It was exciting to see the Association entering into itsnext 100 years. The events presented at ACE 2008, focus-ing on students, young professionals, and climate change,show that this Association has a vested interest in critical en-vironmental issues and the leaders of tomorrow.
Are you currently working on any interesting projects?I have been fortunate to see the construction, and nowoperation, of a new runway at a major airport, followed bya major rehabilitation of another runway. The investigationsconcerning potential environmental impacts for these projectsand the community interactions have truly been an experi-ence in and of themselves.
What’s the single biggest environmental problem facing the world today?Over consumption. We live in a world where there is anability to live simply. It is astonishing to me to visit placeswhere recycling or public transportation are not available.
How do you like to let off steam?I spend as much time as I can in the mountains skiing,climbing, and mountain biking. The fresh air is amazing,the scenery beautiful, and the opportunity to spend timewith family and friends is incredible. (Steve is pictured aboveon a typical weekend getaway, backcountry skiing nearMount Baker Ski Area. Mount Shucksan is shown in thebackground.)
MinuteSteve RyboltEnvironmental Management SpecialistPort of Seattle, Aviation Environmental ProgramsSeattle, WA
A&WMA Member Since 2004
Pacific Northwest International Section; PugetSound Chapter
Association leadership roles held: Chair, Standing Committee for Student Programs andDevelopment, Education Council; Young ProfessionalsAdvisory Committee; Chair, Student Programs Committee,Pacific Northwest International Section; Chair, HuxleyCollege Student Chapter; Secretary, Puget Sound Chapter;Chair, Local Host Committee, Student Programs, 2008Annual Conference & Exhibition
em • association news
The Member
“A&WMA is an excellent Association offering technicalknowledge, valuableleadership opportuni-ties, and exciting social events.”
Each month, this page profiles a different A&WMA member to find out what makes them tick at work and at home.
Tell Us What Makes You Tick!The Member Minute is a greatway to share your experiences,work, and accomplishementswith A&WMA’s membershipand EM readers. Want to seeyour photo and story high-lighted in EM, or do you wantto recommend someone to be featured? Just e-mail yourcontact information to EMManaging Editor Lisa Bucher at [email protected] for consideration.

Another Premier Publication from
Connecting the World’s Leading Environmental Professionals
Air PollutionEngineering ManualSecond Edition
Eight years in the making, this second edition is a vitalsource of information on air pollution control issues forindustries worldwide affected by regulations, includingthe Clean Air Act. Learn about the latest emissionfactors and control measures for reducing air pollutants.Read about the fundamental technological and regula-tory information you need to comply with recent airpollution standards for industry and government. Viewmore than 500 detailed flowcharts and photos. Utilizethe extensive listing of Internet resources.
Experts from diverse fields cover:
• Biological air pollution control
• Emission control methods for a multitude of industries,ranging from wood processing and brick, ceramic andpharmaceutical manufacturing to graphic arts, metallurgy,waste and wastewater
• Changes in emission factors for each source category,including particulate matter
• Updated MACT regulations and technologies, and more!
Order No
w!
Member price $
168
Nonmember P
rice $178
To place your order:• Online at www.awma.org/go/onlinelibrary (secure site)• E-mail [email protected]• Call A&WMA Publications Order Department at
+1-412-232-3444, ext. 6001.
• Order Number OTHP-01R: Air Pollution Engineering Manual,Second Edition, Edited by Wayne T. Davis, Ph.D., University ofTennessee, Copyright April 2000, John Wiley & Sons Inc.
• Shipping costs additional.
This book is a must for industry andgovernment professionals, and a great giftfor recent or soon-to-be graduates!