June 2001 Written Exam - Regents Examinations · JUNE 2001 Name School The questions on this test...
24
8 THE UNIVERSITY OF THE STATE OF NEW YORK GRADE 8 INTERMEDIATE-LEVEL TEST SCIENCE WRITTEN TEST JUNE 2001 Name School The questions on this test measure your knowledge and understanding of science. The test has two parts. Both parts are contained in this test booklet. Part I consists of 35 multiple-choice questions. Record your answers to these ques- tions on the separate answer sheet. Use only a No. 2 pencil on your answer sheet. Part II consists of 37 open-ended questions. Write your answers to Part II in the space provided in this test booklet. You may use a calculator to answer the questions on the test if you wish. You will have two hours to answer the questions on this test. DO NOT OPEN THIS TEST BOOKLET UNTIL YOU ARE TOLD TO DO SO. THE UNIVERSITY OF THE STATE OF NEW YORK THE STATE EDUCATION DEPARTMENT ALBANY, NEW YORK 12234
Transcript of June 2001 Written Exam - Regents Examinations · JUNE 2001 Name School The questions on this test...

8THE UNIVERSITY OF THE STATE OF NEW YORK
GRADE 8INTERMEDIATE-LEVEL TEST
SCIENCE
WRITTEN TESTJUNE 2001
Name
School
The questions on this test measure your knowledge and understanding of science. The test has two parts. Both parts are contained in this test booklet.
Part I consists of 35 multiple-choice questions. Record your answers to these ques-tions on the separate answer sheet. Use only a No. 2 pencil on your answer sheet.
Part II consists of 37 open-ended questions. Write your answers to Part II in thespace provided in this test booklet.
You may use a calculator to answer the questions on the test if you wish.
You will have two hours to answer the questions on this test.
DO NOT OPEN THIS TEST BOOKLET UNTIL YOU ARE TOLD TO DO SO.
THE UNIVERSITY OF THE STATE OF NEW YORKTHE STATE EDUCATION DEPARTMENT
ALBANY, NEW YORK 12234


Inter.-Level Science — June ’01 [3] [OVER]
Part I
DIRECTIONS
There are 35 questions on Part I of the test. Each question is followed by four choices,numbered 1 through 4. Read each question carefully. Decide which choice is the correctanswer. On the separate answer sheet, mark your answer in the row of circles for eachquestion by filling in the circle that has the same number as the answer you have cho-sen.
Read the sample question below:
Sample Question
Earth gets most of its light from
(1) the stars(2) the Sun(3) the Moon(4) other planets
The correct answer is the Sun, which is choice number 2. On your answer sheet, lookat the box showing the row of answer circles for the sample question. Since choice num-ber 2 is the correct answer for the sample question, the circle with the number 2 hasbeen filled in.
Answer all of the questions in Part I in the same way. Mark only one answer for eachquestion. If you want to change an answer, be sure to erase your first mark completely.Then mark the answer you want.
You will not need scrap paper. You may use the pages of this test booklet to work outyour answers to the questions.
You may use a calculator if needed.
When you are told to start working, turn the page and begin with question 1. Work care-fully and answer all of the questions in Part I.
When you have finished Part I, go right on to Part II.

Inter.-Level Science — June ’01 [4]
1 The information below shows what happens to incoming solar radiation.
Which pie graph best represents this information?
( 1 ) ( 2 ) ( 3 ) ( 4 )
30% reflected by atmosphere
20% absorbed by atmosphere
50% absorbed by Earth’s surface
Incoming Solar Radiation
Part I
2 The diagram below shows a cell.
This cell would be found in which type oforganism?
(1) animals (3) viruses(2) fungi (4) plants
3 Tissue is composed of a group of(1) similar cells working together(2) different organs working together(3) organ systems working together(4) nuclei in a cell working together
4 The diagram below shows a part of a humanbody system.
The possible movement represented by thearrows in the diagram is coordinated by the
(1) circulatory system(2) excretory system(3) nervous system(4) reproductive system
Cell wall
Nucleus

Inter.-Level Science — June ’01 [5] [OVER]
7 The endocrine system produces chemicals thataffect organ functions. These chemicals arecalled(1) nutrients (3) microbes(2) hormones (4) wastes
8 What is the function of DNA in a cell?(1) regulating the movement of nutrients(2) storing and releasing chemicals(3) carrying genetic material(4) providing energy for activities
5 The diagram below shows a food web.
Which three organisms in the food web are competing for the same foodresource?
(1) carrot, rabbit, and fox (3) fox, owl, and rabbit(2) grain, bird, and owl (4) bird, mouse, and grasshopper
6 The diagram below shows the development of a certain type of insect.
This diagram shows the process of
(1) metamorphosis (3) selective breeding(2) fertilization (4) environmental change
Egg Larva AdultPupa
( not drawn to scale )
FoxOwl
Rabbit
Mouse
Carrot GrainGrass
Grasshopper
Bird
( not drawn to scale)
Human Population and Carbon Dioxide Levels
Year Human Carbon Dioxide (CO2)Population Levels in the Atmosphere
(billions) (parts per million)
1960 2.50 317
1970 2.75 325
1980 3.00 337
1990 5.00 342
9 How have the size of the human population and the amount of carbon dioxide(CO2) in the atmosphere changed from 1960 to 1990?(1) The human population has increased while the amount of CO2 has decreased.(2) The human population has decreased while the amount of CO2 has increased.(3) Both the human population and the amount of CO2 have increased.(4) Both the human population and the amount of CO2 have decreased.
10 Which human activity might explain the change in carbon dioxide levels shown inthe graph?(1) storing nuclear waste (3) using wind energy(2) collecting solar energy (4) burning fossil fuels
11 The effects of natural selection are generallyseen most quickly in which organisms?(1) bacteria (3) humans(2) corn plants (4) cats
12 A plant forms new tissue at the tips of its roots andstems. This new tissue growth is a direct result of(1) circulation (3) cellular respiration(2) coordination (4) cell division
13 What do all organisms need to survive?(1) energy (3) carbon dioxide(2) blood (4) soil
14 Which substance provides humans with theirmain source of energy?(1) food (3) water(2) carbon dioxide (4) chlorophyll
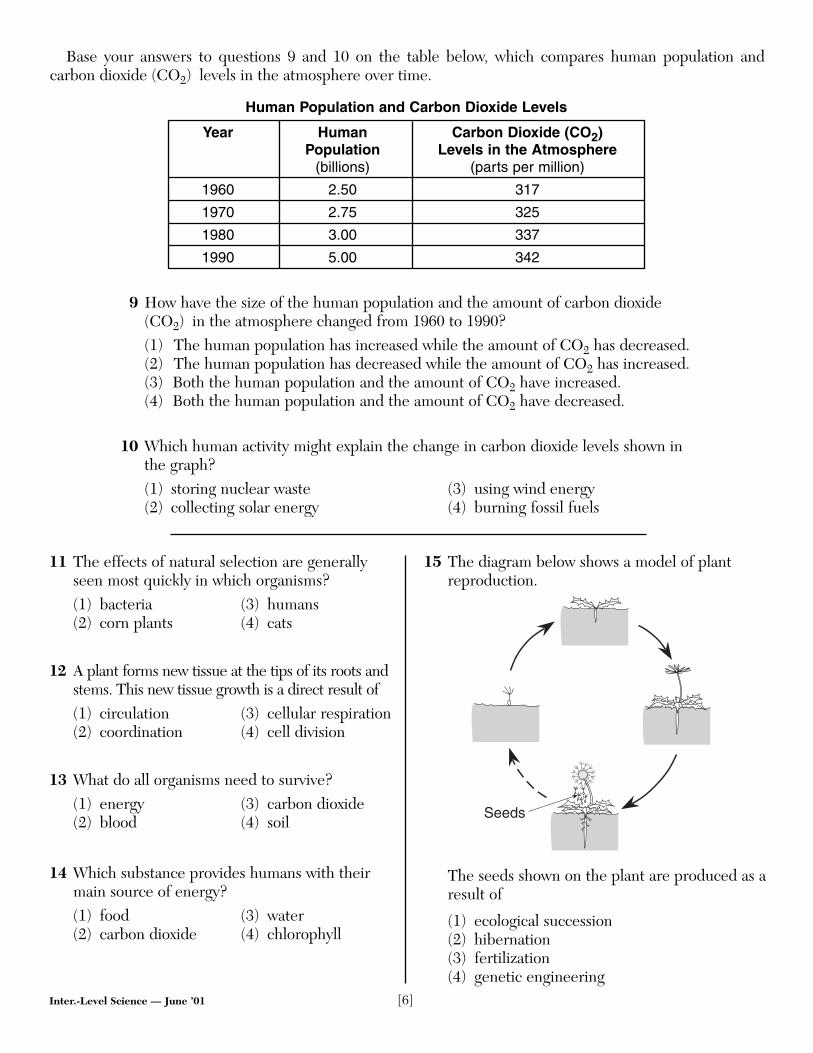
15 The diagram below shows a model of plantreproduction.
The seeds shown on the plant are produced as aresult of
(1) ecological succession(2) hibernation(3) fertilization(4) genetic engineering
Seeds
Inter.-Level Science — June ’01 [6]
Base your answers to questions 9 and 10 on the table below, which compares human population and carbon dioxide (CO2) levels in the atmosphere over time.
Inter.-Level Science — June ’01 [7] [OVER]
16 When a human exercises, sweat often forms onthe skin. Sweating is an example of the humanbody’s ability to(1) recycle nutrients(2) respond to the environment(3) obtain water for nourishment(4) make more energy
17 Which body in our solar system is classified as astar?(1) Earth (3) Venus(2) Mars (4) Sun
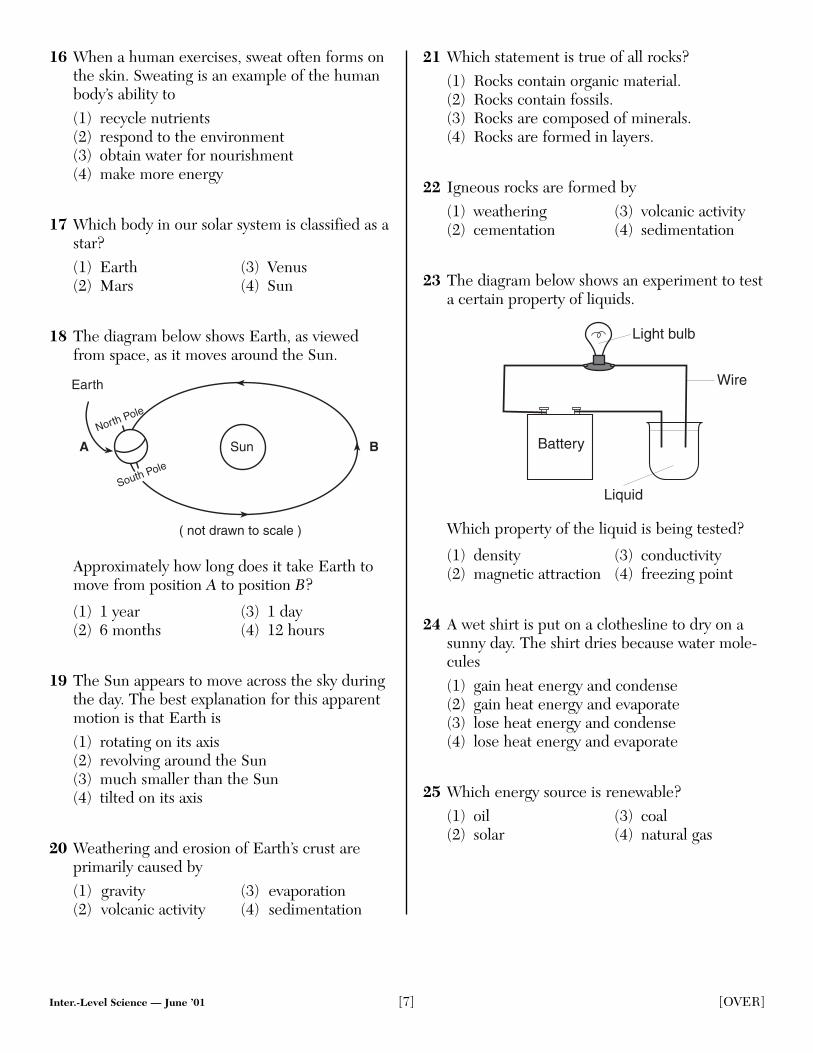
18 The diagram below shows Earth, as viewedfrom space, as it moves around the Sun.
Approximately how long does it take Earth tomove from position A to position B?
(1) 1 year (3) 1 day(2) 6 months (4) 12 hours
19 The Sun appears to move across the sky duringthe day. The best explanation for this apparentmotion is that Earth is(1) rotating on its axis(2) revolving around the Sun(3) much smaller than the Sun(4) tilted on its axis
20 Weathering and erosion of Earth’s crust are primarily caused by(1) gravity (3) evaporation(2) volcanic activity (4) sedimentation
21 Which statement is true of all rocks?(1) Rocks contain organic material.(2) Rocks contain fossils.(3) Rocks are composed of minerals.(4) Rocks are formed in layers.
22 Igneous rocks are formed by(1) weathering (3) volcanic activity(2) cementation (4) sedimentation
23 The diagram below shows an experiment to testa certain property of liquids.
Which property of the liquid is being tested?
(1) density (3) conductivity(2) magnetic attraction (4) freezing point
24 A wet shirt is put on a clothesline to dry on asunny day. The shirt dries because water mole-cules(1) gain heat energy and condense(2) gain heat energy and evaporate(3) lose heat energy and condense(4) lose heat energy and evaporate
25 Which energy source is renewable?(1) oil (3) coal(2) solar (4) natural gas
Battery
Liquid
Wire
Light bulb
Sun
Earth
( not drawn to scale )
BA
North Pole
South Pole

Inter.-Level Science — June ’01 [8]
26 The diagram below shows a tall beaker withfour different liquids and their densities.
If a ball that has a density of 1.73 g/cm3 is placedin the beaker, where will the ball come to rest?
(1) on top of liquid A(2) between liquids B and C(3) between liquids C and D(4) on the bottom of the beaker
27 The four diagrams below model the results ofmixing atoms of different substances. Eachatom is represented by a different symbol.Which diagram correctly models a chemicalchange?
28 Which statement best describes the property oflight waves illustrated in the diagram below?
(1) Some materials absorb light waves.(2) Some materials reflect light waves.(3) Light waves are refracted by some materials.(4) Light waves are emitted by some materials.
29 The diagrams below show a person moving a50-kilogram object up a ramp. In which dia-gram is there the least amount of friction on theobject?
1 meter
Roughsurface
Wheels
50 kg
( 1 )
( 2 )
( 3 )
( 4 ) 1 meter
50 kg
Wheels
Smoothsurface
1 meter50 kg
Smoothsurface
1 meter
50 kg
Roughsurface
+( 1 )
+( 2 )
+( 3 )
+( 4 )
A 0.89 g/cm3
B 1.00 g/cm3
C 1.21 g/cm3
D 2.34 g/cm3

Inter.-Level Science — June ’01 [9] [OVER]
30 The drawings below represent four different forms of electromagnetic energy.
Which diagram represents electromagnetic energy with the shortest wavelength?
(1) A (3) C(2) B (4) D
31 Four machines that convert electrical energy to mechanical energy were tested forfuel efficiency. The results of the test are shown in the chart below.
Test of Fuel Efficiency
Machine Units of Electrical Equivalent Units ofEnergy Consumed Mechanical Energy
Produced
A 120 100
B 130 100
C 135 100
D 160 100
Which machine produced the most heat energy?
(1) A (3) C(2) B (4) D
32 Which graph below shows an object slowing down?
Time (sec)
( 2 )
Spe
ed (
m/s
ec)
Time (sec)
( 3 )
Spe
ed (
m/s
ec)
Time (sec)
( 4 )
Spe
ed (
m/s
ec)
Time (sec)
( 1 )
Spe
ed (
m/s
ec)
A B C D
Inter.-Level Science — June ’01 [10]
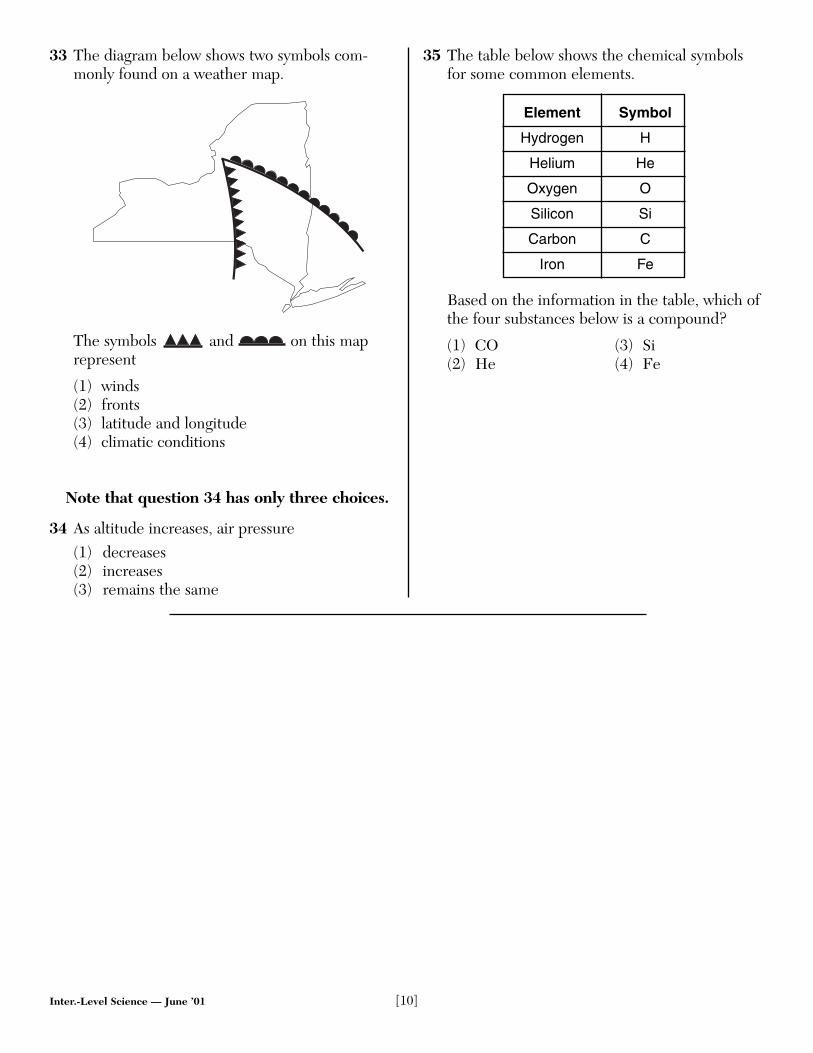
33 The diagram below shows two symbols com-monly found on a weather map.
The symbols and on this maprepresent
(1) winds(2) fronts(3) latitude and longitude(4) climatic conditions
Note that question 34 has only three choices.
34 As altitude increases, air pressure(1) decreases(2) increases(3) remains the same
35 The table below shows the chemical symbolsfor some common elements.
Element Symbol
Hydrogen H
Helium He
Oxygen O
Silicon Si
Carbon C
Iron Fe
Based on the information in the table, which ofthe four substances below is a compound?
(1) CO (3) Si(2) He (4) Fe

Inter.-Level Science — June ’01 [11] [OVER]
Part II
Directions (36–72): Record your answers in the spaces provided in this test booklet.
Base your answers to questions 36 through 38 on the woodland and pond ecosystems illustrated below.The members of these ecosystems interact with one another as well as with the nonliving environment.
36 What is the main source of energy for these ecosystems? [1]
37 Identify a consumer in these ecosystems. [1]
38 Identify one organism in these ecosystems that produces chlorophyll. [1]
Trees
DeerGrass
Fish
RabbitFrog
Human
Inter.-Level Science — June ’01 [12]
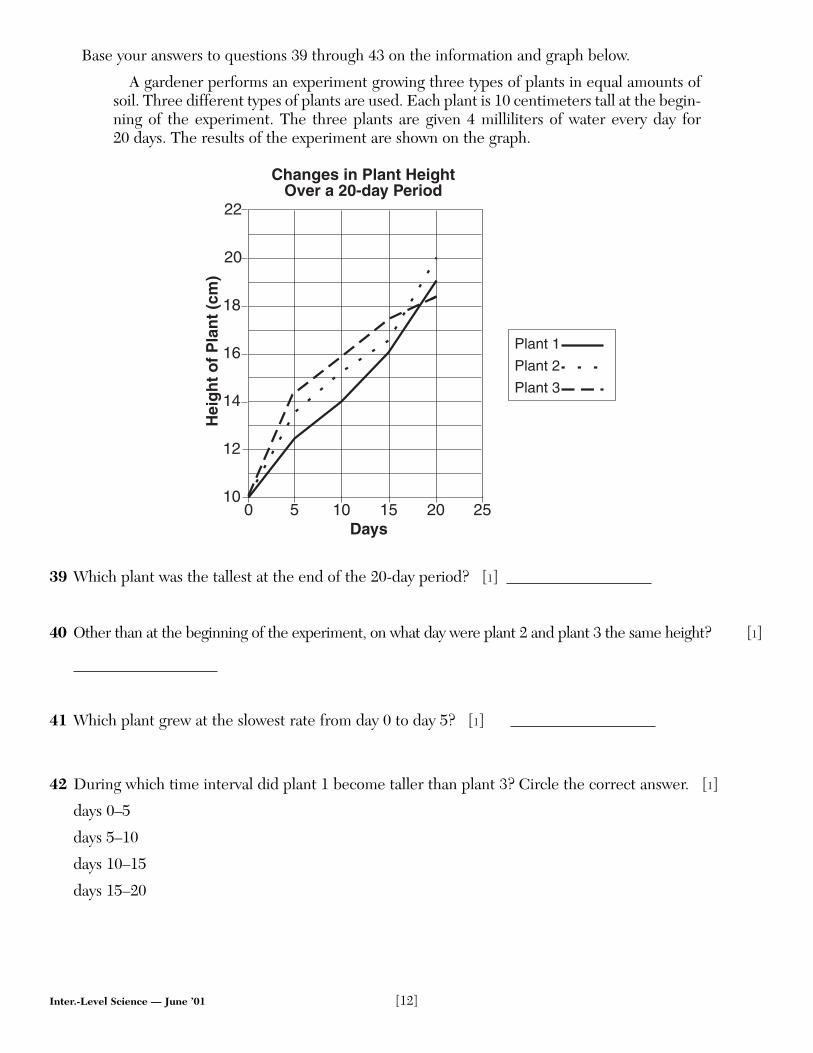
Base your answers to questions 39 through 43 on the information and graph below.
A gardener performs an experiment growing three types of plants in equal amounts ofsoil. Three different types of plants are used. Each plant is 10 centimeters tall at the begin-ning of the experiment. The three plants are given 4 milliliters of water every day for 20 days. The results of the experiment are shown on the graph.
39 Which plant was the tallest at the end of the 20-day period? [1]
40 Other than at the beginning of the experiment, on what day were plant 2 and plant 3 the same height? [1]
41 Which plant grew at the slowest rate from day 0 to day 5? [1]
42 During which time interval did plant 1 become taller than plant 3? Circle the correct answer. [1]
days 0–5
days 5–10
days 10–15
days 15–20
0
12
14
16
18
20
22
5 10 15 20 25Days
Hei
gh
t o
f P
lan
t (c
m)
Changes in Plant HeightOver a 20-day Period
10
Plant 1
Plant 2
Plant 3

Inter.-Level Science — June ’01 [13] [OVER]
43 The gardener repeated the experiment using identical conditions. Plant 1 grew the fastest. Suggest onechange to the experimental design that would help the gardener decide which plant really grows fastest.[1]
______________________________________________________________________________________
______________________________________________________________________________________
__________________________________________________________________________________ [1]
44 The two human body systems shown below interact to perform several functions for the whole organ-ism. Describe how gas exchange occurs when the circulatory and respiratory systems work together. [2]
______________________________________________________________________________________
______________________________________________________________________________________
__________________________________________________________________________________ [2]
The Punnett square below shows an RR pea plant crossed with an Rr pea plant.
R r
RRR Rr
R
RR Rr
45 What percentage of the offspring will have a full, round pod shape? [1]
Human Circulatory System Human Respiratory System
%
Key
R = full, round pod shape (dominant)
r = wrinkled pod shape (recessive)
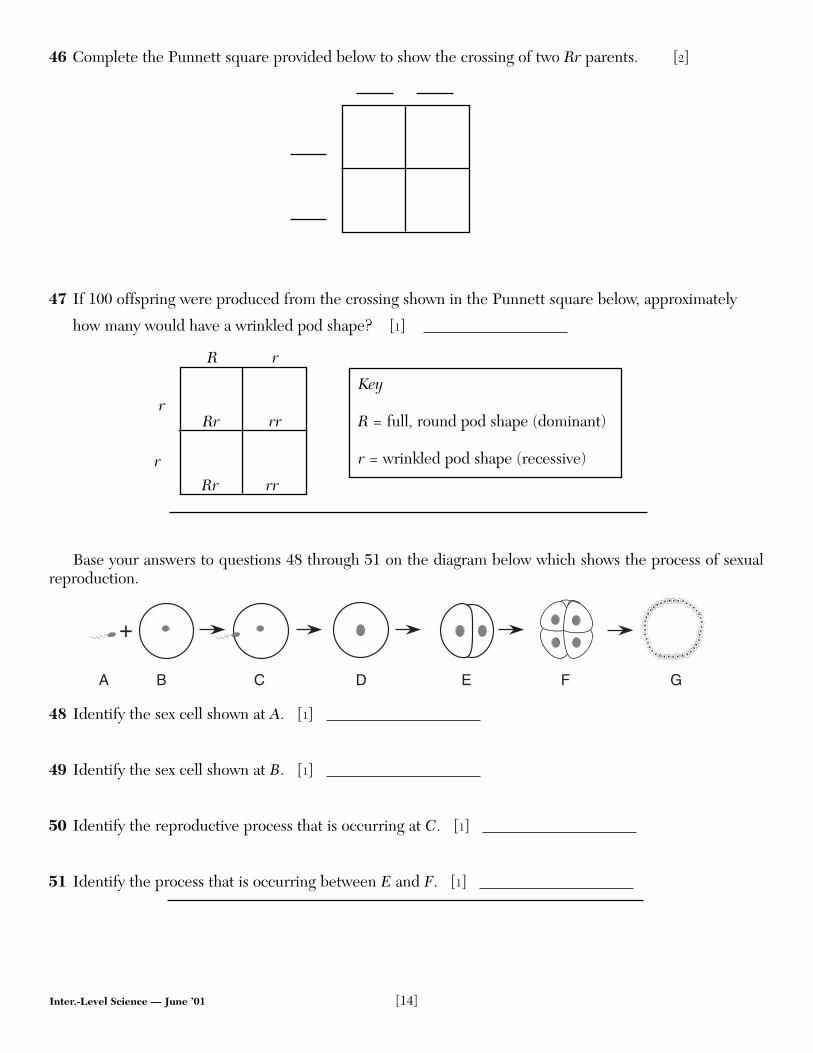
46 Complete the Punnett square provided below to show the crossing of two Rr parents. [2]
47 If 100 offspring were produced from the crossing shown in the Punnett square below, approximately
how many would have a wrinkled pod shape? [1]
R r
rRr rr
r
Rr rr
Base your answers to questions 48 through 51 on the diagram below which shows the process of sexualreproduction.
48 Identify the sex cell shown at A. [1]
49 Identify the sex cell shown at B. [1]
50 Identify the reproductive process that is occurring at C. [1]
51 Identify the process that is occurring between E and F. [1]
A B C
+
D E F G
Inter.-Level Science — June ’01 [14]
Key
R = full, round pod shape (dominant)
r = wrinkled pod shape (recessive)

Inter.-Level Science — June ’01 [15] [OVER]
Base your answers to questions 52 through 54 on the diagram below. The diagram shows the position ofEarth and four positions of the Moon during one orbit of Earth.
52 On the diagram, draw an X to show where the Sun would need to be located to create the Moon phasesshown. [1]
53 Which letter in the diagram shows the position of the Moon when an observer on Earth sees a fullMoon? [1]
54 What motion is represented by the arrows in the diagram? [1]
(not drawn to scale)
A C
B
D
Earth
Base your answers to questions 55 through 57 on the information below.
Models are often used to explain natural phenomena. Develop a model to show therelationship between heat energy and the motion and position of particles in a sample ofmatter. Use a group of 20 students in an empty room to represent the particles in a sam-ple of matter.
55 How should the students be placed in the room to represent the arrangement of particles in a solid? [1]
______________________________________________________________________________________
______________________________________________________________________________________
56 What instruction should be given to the 20 student “particles” to show the addition of heat to the “solidsample of matter”? [Note: The solid is simply being heated; it should not melt.] [1]
______________________________________________________________________________________
______________________________________________________________________________________
57 What instruction should be given to the 20 student “particles” to represent a liquid? [1]
______________________________________________________________________________________
Inter.-Level Science — June ’01 [16]
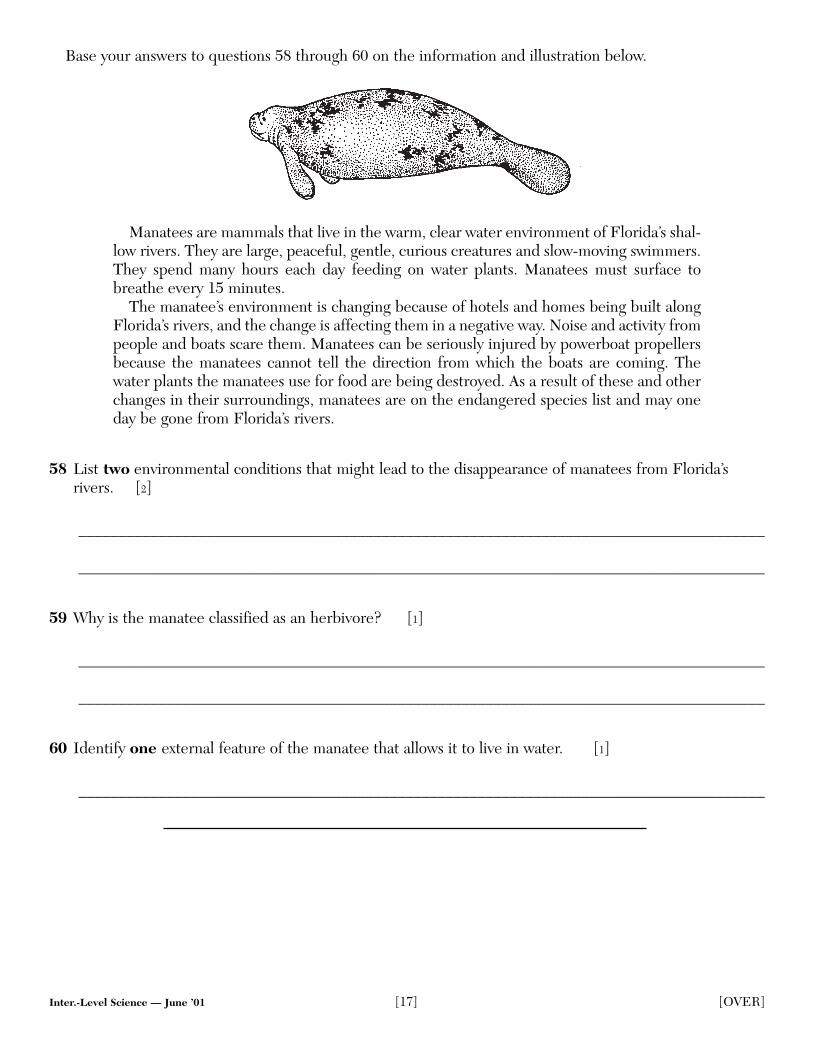
Base your answers to questions 58 through 60 on the information and illustration below.
Manatees are mammals that live in the warm, clear water environment of Florida’s shal-low rivers. They are large, peaceful, gentle, curious creatures and slow-moving swimmers.They spend many hours each day feeding on water plants. Manatees must surface tobreathe every 15 minutes.
The manatee’s environment is changing because of hotels and homes being built alongFlorida’s rivers, and the change is affecting them in a negative way. Noise and activity frompeople and boats scare them. Manatees can be seriously injured by powerboat propellersbecause the manatees cannot tell the direction from which the boats are coming. Thewater plants the manatees use for food are being destroyed. As a result of these and otherchanges in their surroundings, manatees are on the endangered species list and may oneday be gone from Florida’s rivers.
58 List two environmental conditions that might lead to the disappearance of manatees from Florida’srivers. [2]
______________________________________________________________________________________
______________________________________________________________________________________
59 Why is the manatee classified as an herbivore? [1]
______________________________________________________________________________________
______________________________________________________________________________________
60 Identify one external feature of the manatee that allows it to live in water. [1]
______________________________________________________________________________________
Inter.-Level Science — June ’01 [17] [OVER]

Base your answers to questions 61 through 65 on the experiment described below.
Heat was applied at a constant rate to a solid substance under controlled conditions.The temperature of the substance was recorded every 3 minutes. These data are recordedin the table below.
Time (min) 0 3 6 9 12 15 18 21 24 27
Temperature (°C) 12° 14° 16° 16° 16° 20° 24° 28° 32° 36°
Inter.-Level Science — June ’01 [18]
Time (min)
Tem
pera
ture
(°C
)
10
15
20
25
30
35
0 3 6 9 12 15 18 21 24 27
40
61 Use the grid above to construct a line graph from the data in the table. Follow the steps below. a Use Xs to plot the data for time and temperature. [1]
b Draw a solid line that connects the Xs. [1]
62 Provide an appropriate title for the graph. [1]
Title: ________________________________________________________________________________
63 According to your graph, what would the temperature of the substance be at 23 minutes? [1]
_______ °C

64 What is the independent (manipulated) variable in this experiment? [1]
65 If heat was added at a constant rate to the solid substance, why did the temperature remain at 16°C forapproximately 6 minutes? [1]
______________________________________________________________________________________
______________________________________________________________________________________
Inter.-Level Science — June ’01 [19] [OVER]
a Condition to be held constant b Reason
(1) (1)
(2) (2)
(3) (3)
66 A student wants to design a controlled experiment to solve the following problem: When placed in a freezer, will hot water or cold water reach 0°C faster? The student plans to place two containers with equal masses of water (one hot and one cold) in thesame freezer in the classroom.
a List three conditions the student should keep constant for the hot-water and cold-water setups whenplanning this experiment. [3]
b For each condition you name, give a scientific reason why the condition needs to be the same forboth the hot-water and cold-water setups. [3]

Base your answers to questions 67 through 71 on the diagrams of a food chain and energy pyramid belowand on your knowledge of science. Food chains and energy pyramids are used to help us understand the flowof energy in an ecosystem.
Circle the correct answer for questions 67, 68, and 69.
67 If the plants die during a summer drought, the cricket population would most likely [1]
decrease
increase
remain the same
68 If the number of frogs increases, the snake population would most likely [1]
decrease
increase
remain the same
Plant Cricket Frog Snake Hawk
Food Chain
Energy Pyramid
(Not drawn to scale)
Inter.-Level Science — June ’01 [20]
69 If another predator that preyed on snakes was introduced into the ecosystem, the hawk populationwould most likely [1]
decrease
increase
remain the same
70 State one similarity between what food chains and energy pyramids represent regarding energy flow. [1]
______________________________________________________________________________________
______________________________________________________________________________________
______________________________________________________________________________________
71 State one difference between what food chains and energy pyramids represent regarding energy flow. [1]
______________________________________________________________________________________
______________________________________________________________________________________
______________________________________________________________________________________
72 The usage of electricity in the United States has increased dramatically over the past 20 years. Most ofthis electricity is currently produced by burning fossil fuels. a State one reason for this increased usage of electricity. [1]
______________________________________________________________________________________
______________________________________________________________________________________
______________________________________________________________________________________
b Describe a strategy to reduce the amount of fossil fuels people use in the United States. [1]
______________________________________________________________________________________
______________________________________________________________________________________
______________________________________________________________________________________
Inter.-Level Science — June ’01 [21]

Inter.-Level Science — June ’01 [22]

Question Max CreditCredit Allowed
36 1
37 1
38 1
39 1
40 1
41 1
42 1
43 1
44 2
45 1
46 2
47 1
48 1
49 1
50 1
51 1
52 1
53 1
54 1
55 1
56 1
57 1
58 2
59 1
60 1
61 2
62 1
63 1
64 1
65 1
66 6
67 1
68 1
69 1
70 1
71 1
72 2
Total 47
For Teacher Use OnlyPart II Credits