
June 1999 Characteristics of the EPPE Project sample at...
73
A Longitudinal Study funded by the DfEE 1997-2003 department for education and skills Technical Paper 2 – June 1999 Characteristics of the EPPE Project sample at entry to the study The Effective Provision of Pre-School Education (EPPE) Project
Transcript of June 1999 Characteristics of the EPPE Project sample at...

1
The Effective Provision of Pre-School
Education [EPPE] Project
A longitudinal Study funded by the DfES
The Effective Provision of Pre-School
Education [EPPE] Project
A longitudinal Study funded by the DfES
(1997 – 2003)
A Longitudinal Study funded by the DfEE 1997-2003
department for
education and skills
Technical Paper 2 – June 1999
Characteristics of the EPPE Project sample at entry to the study
Th
e Effectiv
e Pro
visio
n o
f Pre-Sch
oo
l Ed
ucatio
n (E
PP
E) P
roject
The Effective Provision of Pre-School
Education [EPPE] Project
A longitudinal Study funded by the DfES
(1997 – 2003)
Technical Paper 2 – June 1999 Characteristics of the EPPE Project sample at
entry to the study
Address for correspondence:
EPPE Project University of London Institute of Education Tel:+44 (0) 207 612 6219 20 Bedford Way Fax:+44 (0) 207 612 6230
London WC1H 0AL Email:[email protected]
Technical Paper 2 CHARACTERISTICS OF THE EPPE PROJECT
SAMPLE AT ENTRY TO THE STUDY
AUTHORS :
Pam Sammons Kathy Sylva
Edward Melhuish Iram Siraj-Blatchford
Brenda Taggart Rebecca Smees
Anne Dobson Marjorie Jeavons
Katie Lewis Maria Morahan Sharon Sadler
ACKNOWLEDGEMENT The EPPE project is a major five year study funded by the DfES. The research would not be possible without the support and co-operation of the six Local Authorities (LAs) and the many pre-school centres, primary schools, children and parents participating in the research. The important contribution of the Regional Research Officers Anne Dobson, Isabella Hughes, Marjorie Jeavons, Margaret Kehoe, Katie Lewis, Maria Morahan, Sharon Sadler and our part-time Research Assistants has been vital to the project's completion. We are grateful to both the project's Steering and Consultative Committee for their helpful advice on the study

The EPPE Research Team
Principal Investigators Professor Kathy Sylva Department of Educational Studies, University of Oxford
Professor Edward Melhuish Birkbeck, University of London Professor Pam Sammons Institute of Education, University of London Professor Iram Siraj-Blatchford Institute of Education, University of London
Research Co-ordinator Brenda Taggart Institute of Education, University of London
Regional Research Officers Anne Dobson Isabella Hughes Marjorie Jeavons Margaret Kehoe Katie Lewis Maria Morahan Sharon Sadler
First Published in September 1999 by the Institute of Education University of London
20 Bedford Way, London WC1H 0AL
Pursuing Excellence in Education
ISBN 085473 592 5
Printed by Formara Ltd. Southend on Sea. Essex.
The views expressed in this report are the authors’ and do not necessarily reflect those of the Department for Education and Skills.
© IoE
Contents Page Number Overview of the Project 1-10
Executive Summary i -iv
Introduction 1
Section One 1
The EPPE Sample 1
Pre-School Experience 3
Child Baseline Assessments 5
Age and BAS Scores 6
Gender and BAS scores 9
Ethnic Group and BAS Scores 9
Type of Pre-School Provision 11
Age at Entry to Pre-School 12
Children’s Social and Behavioural Development 13
Age and ASBI factor scores 16
Links between BAS and ASBI Measures at Entry 17
Gender and Ethnic Differences in Social and Behavioural Development 18
Summary 18
Section Two 18
Family characteristics 19
Parents’ Age Group 20
Parents’ Education and Qualifications 20
Parents’ Occupations 21
Type of Pre-school and Socio-Economic Background 23
Choice of Pre-School Centre 27
Summary 28
Section Three 29
The Role of Multilevel Models 29
Results : Overall Cognitive Attainment 29
Pre-School Centre Differences 30
Child Characteristics 30
Amount of Pre-School Experienced 33
Home Environment 34
Parent Characteristics 36
Parent and Child Characteristics 39
The Final Model – Parent, Child and Home Environment 40
Child Characterisitcs 40
Home Environment 40
Parents 40
Amount of Pre-School Experience 41
Type of Pre-School 41
Summary and Conclusions 41
Note 1: Variables tested in combined multilevel model 44
References 45
Appendix 1- Patterns of participation in pre-school provision by ethnic group 46
Appendix 2.1 – The Full Contexualised Model:Total BAS Score at Entry 47
Appendix 2.2 – The Full Contexualised Model: Non-Verbal Score at Entry 49

Tables Page Number
Section One
Table 1.1 : Distribution of the EPPE sample at entry 2
Table 1.2 : Pre-School experience of EPPE sample 3
Table 1.3 : Variation in amount of provision by type of pre-school centre 4
Table 1.4 : Numbers of EPPE children at the centre level 5
Table 1.5 : Age in months when BAS first administered 6
Table 1.6 : Correlations between child’s age in months at BAS entry assessment
and scores in the BAS assessments 7
Table 1.7 : Example of variation in the mean BAS scores by age in months 7
Table 1.8 : Variation in children’s BAS assessments at entry to EPPE study 8
Table 1.9 : BAS scores at entry analysed by gender 9
Table 1.10 : BAS scores at entry analysed by ethnic group 10
Table 1.11 : Variation between Centres in number of EPPE children, mean BAS
scores and mean age by type of pre-school provision 11
Table 1.12 : Variation in children’s age at entry to target pre-school centre 12
Table 1.13 : Children’s scores on selected ASBI items at entry to the study 14
Table 1.14 : Factor loadings of ASBI items at entry to EPPE study 15
Table 1.15 : Children’s factor scores at entry to EPPE study 16
Table 1.16 : Correlations between children’s social, behavioural and cognitive
attainments at entry to the EPPE study 17
Table 1.17 : ASBI factor scores at entry analysed by gender 18
Section Two
Table 2.1 : Children’s family structure 19
Table 2.2 : Number of siblings 19
Table 2.3 : Parents’ marital status 19
Table 2.4 : Parents’ age group 20
Table 2.5 : Parents’ age on leaving full time education 20
Table 2.6 : Parents’ qualification levels 21
Table 2.7 : Parents’ current employment status 21
Table 2.8 : Mother’s reason for not working 22
Table 2.9 : Parents’ occupational status 22
Table 2.10 : Mothers’ qualifications by type of pre-school centre 23
Table 2.11 : Parents’ current employment status by type of pre-school provision 24
Table 2.12 : Social class of parents’ current or last occupation by type of
pre-school provision 25

Table 2.13 : Mean raw BAS scores at entry by mothers’ qualification level 26
Table 2.14 : Mean raw BAS scores at entry by mothers’ occupational level 26
Table 2.15 : Mean raw BAS scores at entry by mothers’ marital status 27
Table 2.16 : Reasons given for choosing their child’s pre-school centre 28
Section Three
Table 3.1 : Variation in Children’s total BAS scores at entry to the EPPE study (Null Model) 30
Table 3.2 : Percentage of variance in total BAS scores accounted for by specific
measures tested individually and intra centre correlation (Child Variables) 30
Table 3.3 : Results of the multilevel analyses of child characteristics 32
Table 3.4 : Variation in children’s total BAS scores at entry to EPPE study (Child Model) 32
Table 3.5 : Variation in children’s total BAS scores at entry to EPPE study (Pre-School
Experience Model) 33
Table 3.6 : Percentage of variance in total BAS scores accounted for by specific
measures tested individually and intra centre correlations (Home Environment
Variables) 34
Table 3.7 : Results of the multilevel analyses of Home Environment Characteristics 35
Table 3.8 : Variation in children’s total BAS scores at entry to EPPE study (Home
Environment Model) 35
Table 3.9 : Percentage of variance in total BAS scores accounted or by specific
measures tested individually and intra centre correlations (Parent Variables) 36
Table 3.10 : Results of the Multilevel analyses of parent characteristics 37
Table 3.11 : Variation in children’s total BAS scores at entry to EPPE study (Parent Model) 38
Table 3.12 : Results of multilevel analyses of parent and child variables 39
Table 3.13 : Variation in children’s total BAS scores at entry to EPPE study (Parent and
Child Model) 39
Table 3.14 : Variation in children’s total BAS scores at entry to EPPE study (Final Model) 41
Table 3.15 : Contextualised multilevel analaysis of total BAS scores comparison of different
Models 42

1
Effective Provision of Pre-school Education
“EPPE”
Overview of the Project
This series of 12 reports describes the research on effective pre-school provision funded by the UK Department for Education & Employment (DfEE). Further details appear in Technical Paper 1 (Sylva, Sammons, Melhuish, Siraj-Blatchford & Taggart 1999). This longitudinal study assesses the attainment and development of children followed longitudinally between the ages of 3 and 7 years. Three thousand children were recruited to the study over the period January 1997 to April 1999 from 141 pre-school centres. Initially 114 centres from four types of provision were selected for the study but in September 1998 an extension to the main study was implemented to include innovative forms of provision, including ‘combined education and care’ (Siraj-Blatchford et al. 1997). Both qualitative and quantitative methods (including multilevel modelling) have been used to explore the effects of individual pre-school centres on children's attainment and social/behavioural development at entry to school and any continuing effects on such outcomes at the end of Key Stage 1 (age 7). In addition to centre effects, the study investigates the contribution to children’s development of individual and family characteristics such as gender, ethnicity, language, parental education and employment. This overview describes the research design and discusses a variety of research issues (methodological and practical) in investigating the impact of pre-school provision on children’s developmental progress. A parallel study is being carried out in Northern Ireland. There have been many initiatives intended to improve educational outcomes for young children. Will these initiatives work? Will they enable children to enter school ‘more ready’ to learn, or achieve more at the end of Key Stage 1? Which are the most effective ways to educate young children? The research project described in this paper is part of the new emphasis on ensuring ‘a good start’ for children.
PREVIOUS RESEARCH ON THE EFFECTS OF EARLY EDUCATION IN THE UK There has been little large-scale, systematic research on the effects of early childhood education in the UK. The ‘Start Right’ Enquiry (Ball 1994; Sylva 1994) reviewed the evidence of British research and concluded that small-scale studies suggested a positive impact but that large-scale research was inconclusive. The Start Right enquiry recommended more rigorous longitudinal studies with baseline measures so that the ‘value added’ to children’s development by pre-school education could be established. Research evidence elsewhere on the effects of different kinds of pre-school environment on children's development (Melhuish et al. 1990; Melhuish 1993; Sylva & Wiltshire 1993; Schweinhart & Weikart 1997; Borge & Melhuish, 1995; National Institute of Child Health Development 1997) suggests positive outcomes. Some researchers have examined the impact of particular characteristics, e.g. gender and attendance on children's adjustment to nursery classes (Davies & Brember 1992), or adopted cross-sectional designs to explore the impact of different types of pre-school provision (Davies & Brember 1997). Feinstein, Robertson & Symons (1998) attempted to evaluate the effects of pre-schooling on children’s subsequent progress but birth cohort designs may not be appropriate for the study of the influence of pre-school education. The absence of data about children’s attainments at entry to pre-school means that neither the British Cohort Study (1970) nor the National Child Development Study (1958) can be used to explore the effects of pre-school

education on children’s progress. These studies are also limited by the time lapse and many changes in the nature of pre-school provision which have occurred. To date no research using multilevel models (Goldstein 1987) has been used to investigate the impact of both type of provision and individual centre effects. Thus little research in the UK has explored whether some forms of provision have greater benefits than others. Schagen (1994) attempted multilevel modelling but did not have adequate control at entry to pre-school. In the UK there is a long tradition of variation in pre-school provision both between types (e.g. playgroup, local authority or private nursery or nursery classes) and in different parts of the country reflecting Local Authority funding and geographical conditions (i.e. urban/rural and local access to centres). A series of reports (House of Commons Select Committee 1989; DES Rumbold Report 1990; Ball 1994) have questioned whether Britain's pre-school education is as effective as it might be and have urged better co-ordination of services and research into the impact of different forms of provision (Siraj-Blatchford 1995). The EPPE project is thus the first large-scale British study on the effects of different kinds of pre-school provision and the impact of attendance at individual centres.
OVERVIEW OF RESEARCH METHODS The EPPE project is a major study instituted in 1996 to investigate three issues which have important implications for policy and practice:
• the effects on children of different types of pre-school provision, • the ‘structural’ (e.g. adult-child ratios) and ‘process’ characteristics (e.g. interaction styles) of
more effective pre-school centres, and • the interaction between child and family characteristics and the kind of pre-school provision
a child experiences. An educational effectiveness research design was chosen to investigate these topics because this enabled the research team to investigate the progress and development of individual children (including the impact of personal, socio-economic and family characteristics), and the effect of individual pre-school centres on children's outcomes at both entry to school (the start of Reception which children can enter between the ages of 4 and 5 plus) and at the end of Key Stage 1 (age 7 plus). Such research designs are well suited to social and educational research with an institutional focus (Paterson & Goldstein 1991). The growing field of school effectiveness research has developed an appropriate methodology for the separation of intake and school influences on children's progress using so called 'value added' multilevel models (Goldstein 1987, 1995). As yet, however, such techniques have not been applied to the pre-school sector, although recent examples of value added research for younger ages at the primary level have been provided by Tymms et al. 1997; Sammons & Smees 1998; Jesson et al. 1997; Strand 1997; and Yang & Goldstein 1997. These have examined the relationship between baseline assessment at reception to infant school through to Key Stage 1 (age 7 plus years). School effectiveness research during the 1970s and 1980s addressed the question "Does the particular school attended by a child make a difference?" (Mortimore et al. 1988; Tizard et al. 1988). More recently the question of internal variations in effectiveness, teacher/class level variations and stability in effects of particular schools over time have assumed importance (e.g. Luyten 1994; 1995; Hill & Rowe 1996; Sammons 1996). This is the first research to examine the impact of individual pre-school centres using multilevel approaches. The EPPE project is designed to examine both the impact of type of pre-school provision as well as allow the identification of particular pre-school characteristics which have longer term effects. It is also designed to establish whether there are differences in the effects of individual pre-school centres on children's progress and development. In addition, the project explores the impact of pre-school provision for different groups of children and the extent to which pre-schools are effective in promoting different kinds of outcomes (cognitive and social/behavioural).

The 8 aims of the EPPE Project
• To produce a detailed description of the 'career paths' of a large sample of children and their families between entry into pre-school education and completion (or near completion) of Key Stage 1.
• To compare and contrast the developmental progress of 3,000+ children from a wide range
of social and cultural backgrounds who have differing pre-school experiences including early entry to Reception from home.
• To separate out the effects of pre-school experience from the effects of education in the
period between Reception and Year 2. • To establish whether some pre-school centres are more effective than others in promoting
children's cognitive and social/emotional development during the pre-school years (ages 3-5) and across Key Stage 1 (5-7 years).
• To discover the individual characteristics (structural and process) of pre-school education in
those centres found to be most effective. • To investigate differences in the progress of different groups of children, e.g. second
language learners of English, children from disadvantaged backgrounds and both genders. • To investigate the medium-term effects of pre-school education on educational performance
at Key Stage 1 in a way which will allow the possibility of longitudinal follow-up at later ages to establish long-term effects, if any.
• To relate the use of pre-school provision to parental labour market participation.
The sample: regions, centres and children
In order to maximise the likelihood of identifying the effects of individual centres and also the effects of various types of provision, the EPPE sample was stratified by type of centre and geographical location.
• Six English Local Authorities (LAs) in five regions were chosen strategically to participate in the research. These were selected to cover provision in urban, suburban and rural areas and a range of ethnic diversity and social disadvantage. (Another related project covering Northern Ireland was instituted in April 1998 [Melhuish et al. 1997]. This will enable comparison of findings across different geographical contexts.)
• Six main types of provision are included in the study (the most common forms of current
provision; playgroups, local authority or voluntary day nurseries, private day nurseries, nursery schools, nursery classes, and centres combining care and education. Centres were selected randomly within each type of provision in each authority.
In order to enable comparison of centre and type of provision effects the project was designed to recruit 500 children, 20 in each of 20-25 centres, from the six types of provision, thus giving a total sample of approximately 3000 children and 140 centres1. In some LAs certain forms of provision are less common and others more typical. Within each LA, centres of each type were selected by stratified random sampling and, due to the small size of some centres in the project (e.g. rural playgroups), more of these centres were recruited than originally proposed, bringing the sample total to 141 centres and over 3000 children.
1 The nursery school and combined centre samples were added in 1998 and their cohorts will be assessed somewhat later; results will be reported separately and in combined form.

Children and their families were selected randomly in each centre to participate in the EPPE Project. All parents gave written permission for their children to participate. In order to examine the impact of no pre-school provision, it was proposed to recruit an additional sample of 500 children pre-school experience from the reception classes which EPPE children entered. However in the five regions selected a sample of only 200+ children was available for this ‘home’ category. The progress and development of pre-school children in the EPPE sample is being followed over four years until the end of Key Stage 1. Details about length of sessions, number of sessions normally attended per week and child attendance have been collected to enable the amount of pre-school education experienced to be quantified for each child in the sample. Two complicating factors are that a substantial proportion of children have moved from one form of pre-school provision to another (e.g. from playgroup to nursery class) and some will attend more than one centre in a week. Careful records are necessary in order to examine issues of stability and continuity, and to document the range of pre-school experiences to which individual children can be exposed.
Child assessments
Around the third birthday, or up to a year later if the child entered pre-school provision after three, each child was assessed by a researcher on four cognitive tasks: verbal comprehension, naming vocabulary, knowledge of similarities seen in pictures, and block building. A profile of the child’s social and emotional adjustment was completed by the pre-school educator who knew the child best. If the child changed pre-school before school entry, he or she was assessed again. At school entry, a similar cognitive battery was administered along with knowledge of the alphabet and rhyme/alliteration. The Reception teacher completed the social emotional profile. Further assessments were made at exit from Reception and at the end of Years 1 and 2. In addition to standardised tests of reading and mathematics, information on National Assessments will be collected along with attendance and special needs. At age 7, children will also be invited to report themselves on their attitudes to school.
Measuring child/family characteristics known to have an impact on children’s
development
1) Information on individual ‘child factors’ such as gender, language, health and birth order was
collected at parent interview. 2) Family factors were investigated also. Parent interviews provided detailed information about
parent education, occupation and employment history, family structure and attendance history. In addition, details about the child's day care history, parental attitudes and involvement in educational activities (e.g. reading to child, teaching nursery rhymes, television viewing etc) have been collected and analysed.
Pre-school Characteristics and Processes
Regional researchers liaised in each authority with a Regional Coordinator, a senior local authority officer with responsibility for Early Years who arranged ‘introductions’ to centres and key staff. Regional researchers interviewed centre managers on: group size, child staff ratio, staff training, aims, policies, curriculum, parental involvement, etc.
‘Process’ characteristics such as the day-to-day functioning within settings (e.g. child-staff interaction, child-child interaction, and structuring of children's activities) were also studied. The Early Childhood Environment Rating Scale (ECERS) which has been recently adapted (Harms, Clifford & Cryer 1998) and the Caregiver Interaction Scale (Arnett 1989) were also administered. The ECERS includes the following sub-scales:
• Space and furnishings • Personal care routines • Language reasoning • Activities • Interaction • Programme structure • Parents and staffing
In order that the more educational aspects of English centres could be assessed, Sylva, Siraj-Blatchford, Taggart & Colman (unpublished) developed four additional ECERS sub-scales describing educational provision in terms of: Language, Mathematics, Science and the Environment, and Diversity.
Setting the centres in context
In addition to describing how each centre operated internally, qualitative interviews were conducted with centre managers to find out the links of each setting to local authority policy and training initiatives. Senior local authority officers from both Education and Social Services were also interviewed to find out how each local authority implemented Government early years policy, especially the Early Years Development Plans which were established to promote education and care partnerships across providers in each local authority.
Case Studies
In addition to the range of quantitative data collected about children, their families and their pre-school centres, detailed qualitative data will be collected using case studies of several “effective” pre-school centres (chosen retrospectively as ‘more effective’ on the basis of the multilevel analyses of intake and outcome measures covering the period baseline to entry into reception). This will add the fine-grained detail to how processes within centres articulate, establish and maintain good practice. The methodology of the EPPE project is thus mixed. These detailed case studies will use a variety of methods of data gathering, including documentary analysis, interviews and observations and the results will help to illuminate the characteristics of more successful pre-school centres and assist in the generation of guidance on good practice. Particular attention will be paid to parent involvement, teaching and learning processes, child-adult interaction and social factors in learning. Inevitably there are difficulties associated with the retrospective study of process characteristics of centres identified as more or less effective after children in the EPPE sample have transferred to school and it will be important to examine field notes and pre-school centre histories to establish the extent of change during the study period.
ANALYTIC STRATEGY
The EPPE research was designed to enable the linking of three sets of data: information about children's attainment and development (at different points in time), information about children's

personal, social and family characteristics (e.g. age, gender, SES etc), and information about pre-school experience (type of centre and its characteristics).
Identifying individual centre effects and type of provision at entry to school
Longitudinal research is essential to enable the impact of child characteristics (personal, social and family) to be disentangled from any influence related to the particular pre-school centre attended. Multilevel models investigate the clustered nature of the child sample, children being nested within centres and centres within regions. The first phase of the analysis adopts these three levels in models which attempt to identify any centre effects at entry to reception class. Given the disparate nature of children's pre-school experience it is vital to ensure that the influences of age at assessment, amount and length of pre-school experience and pre-school attendance record are accounted for when estimating the effects of pre-school education. This information is also important in its own right to provide a detailed description of the range of pre-school provision experienced by different children and any differences in the patterns of provision used by specific groups of children/parents and their relationship to parents' labour market participation. Predictor variables for attainment at entry to reception will include prior attainment (verbal and non-verbal sub scales), social/emotional profiles, and child characteristics (personal, social and family). The EPPE multilevel analyses will seek to incorporate adjustment for measurement error and to examine differences in the performance of different groups of children at entry to pre-school and again at entry to reception classes. The extent to which any differences increase/decrease over this period will be explored, enabling equity issues to be addressed. After controlling for intake differences, the estimated impact of individual pre-school centres will be used to select approximately 12 ‘outlier’ centres from the 141 in the project for detailed case studies (see ‘Case Studies’ above). In addition, multilevel models will be used to test out the relationship between particular process quality characteristics of centres and children's cognitive and social/behavioural outcomes at the end of the pre-school period (entry to school). The extent to which it is possible to explain (statistically) the variation in children's scores on the various measures assessed at entry to reception classes will provide evidence about whether particular forms of provision have greater benefits in promoting such outcomes by the end of the pre-school period. Multilevel analyses will test out the impact of measures of pre-school process characteristics, such as the scores on various ECERS scales and Pre-School Centre structural characteristics such as ratios. This will provide evidence as to which measures are associated with better cognitive and social/behavioural outcomes in children.
Identifying continuing effects of pre-school centres at KS1
Cross-classified multilevel models have been used to examine the long term effects of primary schools on later secondary performance (Goldstein & Sammons, 1997). In the EPPE research it is planned to use such models to explore the possible mid-term effects of pre-school provision on later progress and attainment at primary school at age 7. The use of cross classified methods explicitly acknowledges that children's educational experiences are complex and that over time different institutions may influence cognitive and social/behavioural development for better or worse. This will allow the relative strength of any continuing effects of individual pre-school centre attendance to be ascertained, in comparison with the primary school influence.
THE LINKED STUDY IN NORTHERN IRELAND 1998-2003 The Effective Pre-school Provision in Northern Ireland (EPPNI) is part of EPPE and is under the directorship of Professor Edward Melhuish, Professor Kathy Sylva, Dr. Pam Sammons, and Dr. Iram
Siraj-Blatchford. The study explores the characteristics of different kinds of early years provision and examines children’s development in pre-school, and influences on their later adjustment and progress at primary school up to age 7 years. It will help to identify the aspects of pre-school provision which have a positive impact on children’s attainment, progress, and development, and so provide guidance on good practice. The research involves 70 pre-school centres randomly selected throughout Northern Ireland. The study investigates all main types of pre-school provision attended by 3 to 4 year olds in Northern Ireland: playgroups, day nurseries, nursery classes, nursery schools and reception groups and classes. The data from England and Northern Ireland offer opportunities for potentially useful comparisons.
SUMMARY
This “educational effectiveness” design of the EPPE research study enables modelling of the complicated effects of amount and type of pre-school provision (including attendance) experienced by children and their personal, social and family characteristics on subsequent progress and development. Assessment of both cognitive and social/behavioural outcomes has been made. The use of multilevel models for the analysis enables the impact of both type of provision and individual centres on children's pre-school outcomes (at age 5 and later at age 7) to be investigated. Moreover, the relationships between pre-school characteristics and children's development can be explored. The results of these analyses and the findings from the qualitative case studies of selected centres can inform both policy and practice. A series of 12 technical working papers will summarise the findings of the research.

EPPE Technical Papers in the Series Technical Paper 1 – An Introduction to the Effective Provision of Pre-School Education (EPPE) Project
ISBN: 0 85473 591 7 Published: Autumn 1999 Price £3.50 Technical Paper 2 – Characteristics of the Effective Provision of Pre-School Education (EPPE) Project sample at entry to the study
ISBN: 0 85473 592 5 Published: Autumn 1999 Price £4.00 Technical Paper 3 – Contextualising EPPE: Interviews with Local Authority co-ordinators and centre
managers ISBN: 0 85473 593 3 Published: Autumn 1999 Price £3.50 Technical Paper 4 – Parent, family and child characteristics in relation to type of Pre-School and socio-economic differences
ISBN: 0 85473 594 1 Published: Autumn 1999 Price £4.00 Technical Paper 5 – Report on centre characteristics in the EPPE Study : (Interviews)
ISBN: 0 85473 595 X Published: Autumn 2000 Price £5.00 Technical Paper 6 – Characteristics of the Centres in the EPPE Sample: Observational Profiles
ISBN: 0 85473 596 8 Published: Autumn 1999 Price £5.00 Technical Paper 6A – Characteristics of Pre-School Environments
ISBN: 0 85473 597 6 Published: Autumn 1999 Price £3.50 Technical Paper 7 – Social/behavioural and cognitive development at 3–4 years in relation to family
background ISBN: 0 85473 598 4 Published: Spring 2001 Price £5.00 Technical Paper 8a – Measuring the Impact of Pre-School on Children's Cognitive Progress over the Pre-School Period
ISBN: 0 85473 599 2 Published: Autumn 2002 Price £8.00 Technical Paper 8b – Measuring the Impact of Pre-School on Children's Social Behavioural Development over the Pre-School Period
ISBN: 0 85473 684 2 Published: Spring 2003 Technical Paper 9 – Report on age 6 assessment
ISBN: 0 85473 600 X Published: Summer 2003 Technical Paper 10 – Case Studies
ISBN: 0 85473 601 8 Published: Summer 2003 Technical Paper 11 – Report on the continuing effects of pre-school education at age 7
ISBN: 0 85473 602 6 Published: Autumn 2003 Technical Paper 12 – The final report
ISBN: 0 85473 603 4 Published: Spring 2004 The Early Years Transition and Special Educational Needs (EYTSEN) is a linked project which draws on data from the EPPE study. EYTSEN Papers : Technical Paper 1 – Special needs across the Pre-School Period ISBN 085473 680 8
Published: Autumn 2003 Technical Paper 2 – Special needs in the Early Years at Primary School ISBN 085473 681 6
Published: Summer 0223 Technical Paper 3 – Special needs in the Early Years : The Parents’ Perspective ISBN 085473 682 4
Published: Summer 2003 Ordering information The Bookshop at the Institute of Education, 20, Bedford Way, London, WC1H OAL. Tel: 00 44 (0) 207 612 6050 Fax: 0207 612 6407 Email: [email protected] Website: www.johnsmith.co.uk/ioe or The EPPE Office, The University of London, Institute of Education, 20, Bedford Way, London, WC1H OAL, UK Tel: 00 44 (0) 207 612 6219 Fax: 00 44 (0) 207 612 6230 Email: [email protected] Website: http://www.ioe.ac.uk/projects/eppe Please note : Prices will vary according to size of publication and quantities ordered.
REFERENCES Arnett, J. (1989) Caregivers in Day-Care Centres: Does training matter? Journal of Applied
Developmental Psychology, 10, 541-552. Ball, C. (1994) Startright: The Importance of Early Learning, London: RSA. Borge, A., & Melhuish, E., (1995) A Longitudinal Study of Childhood Behaviour Problems, Maternal
Employment and Day-care in Rural Norwegian Community, International Journal of Behavioural Development, 18, 23-42.
Davies, J. & Brember, I. (1992) The Effects of Gender, Attendance Period and Age on Children's
Adjustment to Nursery Classes, Research in Education, 47, 89-103. Davies, J, & Brember, I. (1997) The Effects of Pre-School Experience on Reading Attainment: a four year
cross-sectional study, Educational Psychology, 178, 3, 255-266. Department of Education & Science (1990) The Report of the Committee of Inquiry into the Quality of the
Educational Experience offered to 3- and 4-year olds (Rumbold, A), London: HMSO. Feinstein, L., Robertson, D. & Symons, J. (1998) Pre-school Education and Attainment in the NCDS and
BCSI Centre for Economic Performance, London Goldstein, H. (1987) Multilevel Models in Educational and Social Research, London: Charles Griffin and
Co. Goldstein, H. (1995) Multilevel Statistical Models (2nd Edition), London: Edward Arnold. Goldstein, H. & Sammons, P. (1997) The Influence of Secondary and Junior Schools on Sixteen Year
Examination Performance: A Cross-Classified Multilevel Analysis, School Effectiveness and School Improvement, 8, (2): 219-230.
Harms, T., Clifford, R. & Cryer, D. (1998) Early Childhood Environment Rating Scale Revised, New York
and London: Teachers' College Press. Hill, P. & Rowe, K. (1996) Multilevel Modelling in School Effectiveness Research, School Effectiveness
and School Improvement, 7, (1): 1-34. House of Commons Select Committee (1989) The Education of Children 3-5, London: HMSO. Jesson, D., Bartlett, D., & Machon, C., (1997) Baseline Assessment and School Improvement - the use of
data from the assessment of children on entry to school to support the raising of standards, paper presented to the annual conference of the British Educational Research Association, University of York, September 1997.
Luyten, H. (1994) Stability of School Effects in Dutch Secondary Education: The impact of variance
across subjects and years, International Journal of Educational Research, 21, (2): 197-216. Luyten, H. (1995) Teacher Change and Instability Across Grades, School Effectiveness and School
Improvement, 1, (1): 67-89. Melhuish, E.C. (1993) Pre-school care and education: Lessons from the 20th and the 21st century,
International Journal of Early Years Education, 1, 19-32. Melhuish, E.C., Lloyd, E., Martin, S. & Mooney, A. (1990) Type of day-care at 18 months: ii Relations with
Cognitive and Language Development, Journal of Child Psychology and Psychiatry, 31, 861-870. Melhuish, E.C., Sylva, K., Sammons, P. & Siraj-Blatchford, I. (1997) Effective Pre-School Provision in
Northern Ireland, proposal to the DfEE for research linked to the Effective Provision of Pre-school Education Project.
Mortimore, P., Sammons, P., Stoll, L., Lewis, D. & Ecob, R. (1988) School Matters: The Junior Years,
Wells: Open Books.
National Institute of Child Health & Development (1997) The effects of infant child care on infant-mother
attachment security: Restuls of the NICHD study of early child care, Child Development, 68, (5): 860-879.
Paterson, L. & Goldstein H. (1991) New statistical methods of analysing social structures: an introduction
to multilevel models, British Educational Research Journal, 17, (4): 387-393. Sammons, P. (1996) Complexities in the judgement of school effectiveness. Educational Research and
Evaluation, Vol. 2 113 – 149 Sammons, P. & Smees, R. (1998) Measuring Pupil Progress at Key Stage 1: using baseline assessment
to investigate value added. School Leadership and Management, Vol. 18, No. 3, pp.389 – 407 Schweinhart, L.J. & Weikart, D.P., (1997) Lasting Differences, The High/Scope preschool curriculum
comparison through age 23. High/Scope Press, Ypsilanti, Michigan. Siraj-Blatchford, I. (1995) Expanding Combined Nursery Provision: Bridging the gap between care and
education, in P Gammage and J Meighan The Early Years: The Way Forward, Nottingham: Education New Books.
Siraj-Blatchford, I., Sylva, K., Melhuish, E. & Sammons, P. (1997) Studying the Effects of Innovations in
Nursery School Provision, a proposal to the DfEE for research linked to the Effective Provision of Pre-school Education Project
Strand, S. (1997) Pupil Progress during Key Stage 1: A value added analysis of school effects, British
Educational Research Journal, 23, (4): 471-487. Sylva, K., Sammons, P., Melhuish, E., Siraj-Blatchford, I. & Taggart, B. (unpublished) Technical Paper 1.
An Introduction to the EPPE Project Sylva, K., Siraj-Blatchford, I., Taggart, B. & Colman, P. (forthcoming) The Early Childhood Environment
Rating Scales: 4 Curricular Subscales, London: Institute of Education. Sylva, K. (1994) A Curriculum for Early Learning. In Ball, C. (Ed.) Startright: The Importance of Early
Learning, London: RSA. Sylva, K. & Wiltshire, J. (1993) The Impact of Early Learning on Children's Later Development. A review
prepared for the RSA enquiry 'Start Right', European Early Childhood Education Research Journal, 1, (1): 17-40.
Tizard, P., Blatchford, P, Burke, J., Farquhar, C. & Plewis, I. (1988) Young Children at School in the Inner
City, Hove: Lawrence Erlbaum Associates Ltd. Tymms, P., Merrell, C. & Henderson, B. (1997) The First Year at School: A quantitative Investigation of
the Attainment and Progress of Pupils, Educational Research and Evaluation, 3, (2): 101-118. Yang, M. & Goldstein, H. (1997) Report on Value Added Analysis for Primary Schools in Hampshire
County, Mathematical Sciences, Institute of Education, University of London, August 1997.

Technical Paper 2
Characteristics of the EPPE Project Sample at entry to the
study
EXECUTIVE SUMMARY The Effective Provision of Pre-school Education (EPPE) project was designed to explore the impact of pre-school provision on young children’s progress and development from age three plus to seven years. Full details of the project design and scope are provided in the first working paper of this series. The Effective Provision of Pre-School Education (EPPE) Project: Technical Paper 1. This second paper provides a description of the child sample at entry to the study. In order to investigate the impact of different types of provision and of individual pre-school centres it is essential to have accurate baseline data about children's cognitive attainments and details of their social and behavioural development, so that subsequent progress and development can be measured. The information is also interesting in its own right because it provides a snapshot of children and families at the start of the study. Children’s personal, social and family characteristics can influence their progress and development. As a consequence it is essential to establish the extent to which the background characteristics of children attending different centres and types of pre-school provision vary. Only in this way is it possible to identify any possible pre-school effects on children's later educational outcomes (at entry to school, and on later attainments at the end of Key Stage 1). To date no studies of pre-school provision have adopted an educational effectiveness research design which enables this issue to be explored. There is considerable policy interest in the question of whether certain kinds of pre-school experience have an ‘equalising impact’, i.e. help to reduce inequalities in children's later educational outcomes (affective, social and cognitive). By investigating the relationships between children's personal, social and family characteristics at entry to pre-school to establish the nature of existing disparities in attainments and their relationships to patterns of pre-school use, it will be possible to address this important issue. This working paper provides an analysis of baseline information about a large sample of young children (n=2146) entering 114 different pre-school centres drawn from four types of pre-school provision during the period 1997 to 1998, and up-to-date evidence about the links between background and attainment at age three plus1.This information enables contextualisation of the entry measures of attainment and social and behavioural development at entry to the EPPE study. The paper is divided into three sections. The first describes children's entry attainments and their characteristics at entry. The second section reports details obtained from the parent interviews and examines patterns of association between parent and family characteristics and children's entry assessments. The third section describes the multilevel analysis strategy used to examine the relationships between children's personal, family and home environment characteristics and their cognitive attainments in order to provide a secure baseline for the later study of children's progress and development over the pre-school period.
1 In 1998 the EPPE Project was extended to include nursery schools and combined centres. Data on a sample of 27 of these centres will be added to the main sample in the final report of the Project in 2001.

MAIN FINDINGS
The descriptive analyses of the EPPE sample at entry to the study draw together information from parent interviews and from assessments of individual children. The results provide powerful evidence of associations between young children’s overall cognitive attainment and a variety of personal, socio-economic and family characteristics. In line with earlier longitudinal birth cohort studies, the results reveal the existence of strong links between parents' educational and occupational backgrounds and their children’s cognitive development. Differences were also identified which point to the adverse impact on later cognitive attainment, of premature birth, and relationships with gender, family size and ethnic and language background. In addition, aspects of the ‘educational climate’ of the home (such as the extent to which the parents are involved in reading to the child, using the library, teaching songs and nursery rhymes) were found to be correlated with children’s cognitive attainments at age three plus. These differences reflect variations between the five geographical regions included in the study, and patterns of access to different types of pre-school centre. The baseline analysis revealed important differences in the characteristics of children entering the four main types of pre-school provision sampled (playgroups, nursery classes, Local Authority day nurseries, private day nurseries). The existence of differences in children’s cognitive attainment at entry to different centres and by types of provision (as well as statistically significant associations between children’s personal and family background characteristics and their attainments) have important implications for a study which seeks to explore the impact of pre-school upon children’s subsequent progress and development. These findings point to the importance of making proper control for differences in the characteristics of child intakes in comparisons of specific pre-school centres and different types of provision. The results of the EPPE entry assessments suggest that there are statistically significant variations in patterns of access to, and use of, different kinds of pre-school provision. These variations may have implications for policies concerned with combating social disadvantage and exclusion. The relationships between parents’ labour market participation and child care use are not straightforward. They are likely to reflect a complex mix of choice, other child-care commitments for siblings, and the limitations imposed by the part-time and in some instances inflexible nature of much pre-school provision. In addition, families’ abilities to pay for certain kinds of provision and geographical access to and availability of places at centres, as well as local employment opportunities, constrain participation in the labour market. Thus, the EPPE data indicate that for only a minority of families is the use of pre-school provision associated with mothers’ full time participation in the labour market.
KEY POINTS The main findings of the study indicate that there are statistically significant associations between children’s overall cognitive attainments at entry to pre-school (as measured by total score on the British Abilities Scale) and a range of personal, family and home environment characteristics. Some key points are listed below.
Girls show significantly higher overall cognitive attainments at entry to the study when the impact of other factors is controlled, though there are suggestions that gender effects are moderated by social class as measured by fathers’ occupation.
Older children have significantly higher scores than others at entry reflecting the known relationship between cognitive development and maturity.
Children from large families (3 or more siblings) have significantly lower overall cognitive attainments than those from smaller families
Children born prematurely (37 weeks or fewer weeks gestation) show a significantly lower cognitive attainments at entry.
Children whose first language is not English show significantly lower cognitive attainments.
.
There are differences between children from different ethnic backgrounds in terms of overall cognitive attainments at entry to pre-school, and these differences are in line with those reported for children at primary school in recent studies (see Strand, 1999; Slough Borough Council 1998). Nonetheless, they are much reduced when account is taken of the influence of factors such as parents’ educational and occupational characteristics. It should be noted that the ethnic differences in non-verbal cognitive attainment (in contrast to those of total score which includes a verbal component) were not statistically significant after control of other background factors, indicating that verbal assessments of cognitive attainments are less appropriate for some ethnic minority groups.
Socio-economic background is highly significant. Children whose mothers had higher qualification levels were at an advantage in terms of overall cognitive attainment at entry to the study, as were children whose fathers were in professional or managerial work. By contrast, those whose fathers were not working, or were in semi or unskilled manual work had lower scores.
A number of measures of home environment have a positive association with higher cognitive attainments particularly the frequency with which parents reported reading to their child, took them to the library, children played with letters or numbers, parents taught the alphabet, and taught songs/nursery rhymes to children. It should be noted that, although such activities are themselves associated with parents’ educational status, they were found to have a significant impact even when parents’ educational and occupational status were controlled for in the multilevel analysis.
The analysis of children’s baseline scores at entry to the EPPE study provides evidence that children who have had more pre-school experience (in terms of entering the target centre at a younger age and attending for more sessions per week) show higher cognitive attainments than others. These relationships hold even when controlling for

the influence of child, family and home environment factors noted above. Goldstein (1998) has argued that, “In order to describe the complex reality that constitutes educational systems we require modelling tools that involve a comparable level of complexity” (p2). Multilevel modelling approaches were selected for the analysis of children’s assessments at entry to the EPPE study in order to explore the complex range of personal, social and family influences upon young children’s cognitive attainments. The multilevel analyses of children’s overall cognitive attainments at entry to the EPPE study show the existence of important variations between the 114 pre-school centres, and according to type of pre-school provision when no control is made for intake differences in terms of children’s personal, family and home environment characteristics. After including information about such factors no significant differences were found for the four types of school provision, and the percentage of total variation on children’s scores attributed to their pre-school centre was reduced from 25.9 per cent to only 2.4 per cent. These findings are important because they show that the EPPE data base provides good control for relevant background characteristics of children at entry to the pre-school study. The contextualisation of children’s cognitive assessments at entry to the EPPE study suggests that later analyses of the impact of pre-school centres on children’s progress up to school entry (i.e. at transfer to reception classes) can be interpreted securely in the knowledge that the baseline controls of intake differences for the 114 pre-school centres are robust. Furthermore, the absence of significant differences in the EPPE entry assessments according to type of pre-school provision or region (after control for child, parent and home background factors concerning differences in intake at the pre-school centre level) likewise indicates that later comparison of the impact of type of pre-school provision will also be securely based. The modelling strategy used to contextualise the EPPE study’s entry assessments is of theoretical, as well as of practical, interest because it identifies and separates the relative contribution to young children’s cognitive attainment of factors relating to child, parental and family characteristics, and measures of the home environment at age 3 plus years.
Acknowledgement We are grateful to Professor Harvey Goldstein who provided valuable comments on an earlier draft of this paper.

INTRODUCTION
The Effective Provision of Pre-School Education project was designed to explore the impact of pre-school provision on young children's progress and development from age three to seven years. The main aims of the study are:
to produce a detailed description of the 'career paths' of a large number of children and their families between entry into pre-school education and completion (or near completion) of Key Stage 1.
to compare and contrast the developmental progress of over 2,000 children from a wide range of social and cultural backgrounds who attend different types of pre-school provision.
to establish whether some pre-school centres are more effective than others in promoting children’s cognitive and social/emotional development during pre-school years (age 3-5) and the beginning of primary education (4-7 years).
to discover the individual characteristics (structural and process) of pre-school education in those centres found to be most effective.
to investigate differences in the progress of different groups of children, say second language learners of English, children from disadvantaged backgrounds and both genders.
SECTION 1
THE EPPE SAMPLE
Children were recruited to the EPPE study from four main types of pre-school provision (nursery classes, playgroups, private or voluntary day nurseries and combined centres, local authority day nurseries) in five regions during the period January 1997 to June 1998. (A further sample of children attending nursery schools has been recruited from September 1998. The results for this form of provision will be reported in a later paper). The original sample design was intended to include 20 children from 20 centres chosen randomly within each of the five regions giving a total of 400 children for each pre-school type and a total sample of 2000 pre-school children in the study. It was recognised that, due to geographical variations in the distribution of different types of pre-school centres, some regions would select more centres of specific kinds (e.g. East Anglia, playgroups; the North East, extra local authority day nurseries) in order to maintain balance across the EPPE sample as a whole. Children became eligible for recruitment to the EPPE sample when they reached their third birthday or when they first entered a centre in the sample if they were aged over three (up to age 4 years 3 months). Children were assessed within ten weeks of entry or of their third birthday using a range of entry assessments. Parental interviews were undertaken to obtain background details about children's earlier childcare experiences, health, social and family characteristics. Children included in the EPPE sample also needed to satisfy the following criteria: • stay for at least 10 weeks in the EPPE centre subsequent to recruitment to the study (this
was considered to be the minimum time in which a pre-school centre might have a traceable impact). Children who had been given entry assessments but left this setting within 10 weeks were characterised as ‘phantom’ children who were 'lost' to the sample. Attempts are made to track all other children if they change centres.
• spend three or more sessions (or 5 hours) (relaxed to 2 sessions in rural playgroups) a week at their EPPE pre-school centre. Additionally, if the child attended more than one pre-

school centre (those in dual provision) the EPPE centre must be the dominant centre (in terms of amount of time per week). Children recruited to the sample who were later found to be in dual provision and who failed to meet these criteria (or who moved to dual provision within 10 weeks and for which the EPPE centre was no longer the dominant mode) were categorised as 'impostors' and dropped from the study.
In all, a total of 2146 children from four types of provision were included in the original EPPE sample (5% over the recruitment target). In addition a substantial number of children (over 300) were baseline assessed who later proved to be either ineligible (in dual provision, left before 10 weeks or left and could not be traced to another centre). Due to high mobility rates and the large numbers of small playgroups, 14 additional centres were selected in an effort to ensure the sample size would remain adequate for subsequent analysis, giving a centre sample of 114 in all.
Table 1.1. provides basic details about the distribution of the EPPE child sample at entry to the study. Just over half (52.4%) of the sample are male, and just over three quarters were classified as of White UK heritage. The next most numerous ethnic group were of mixed heritage (6.5%), followed by those of White European (4.1%), Black Caribbean (3.5%) and Pakistani (2.7%) heritage. Just over a tenth (10.5%) of the sample spoke two or more languages, although English was the first language of the vast majority of children (92.8%). TABLE 1.1: DISTRIBUTION OF THE EPPE SAMPLE AT ENTRY
n* % Region East Anglia
Shire County Inner London North East
West Midlands
464 463 469 365
385
21.6 21.6 21.9 17.0
17.9 Gender
Female Male
1021 1125
47.6 52.4
Ethnic Group White UK heritage Mixed heritage White European heritage Black Caribbean heritage Black African heritage Black Other heritage Pakistani heritage Indian heritage Bangladeshi heritage Chinese heritage
Other heritage
1655 139 88 74 48 9 58 31 9 3
31
77.1 6.5 4.1 3.5 2.2 0.4 2.7 1.4 0.4 0.1
1.4
Child's First
Language
English Other
Two or more languages, including English
1991 147
8
92.8 6.8
0.4
Number of
Languages
spoken by
child
None (e.g. elective mute, language delay) 1 2
3
2 1918 208 18
0.1 89.4 9.7
0.8
* n of children = 2146
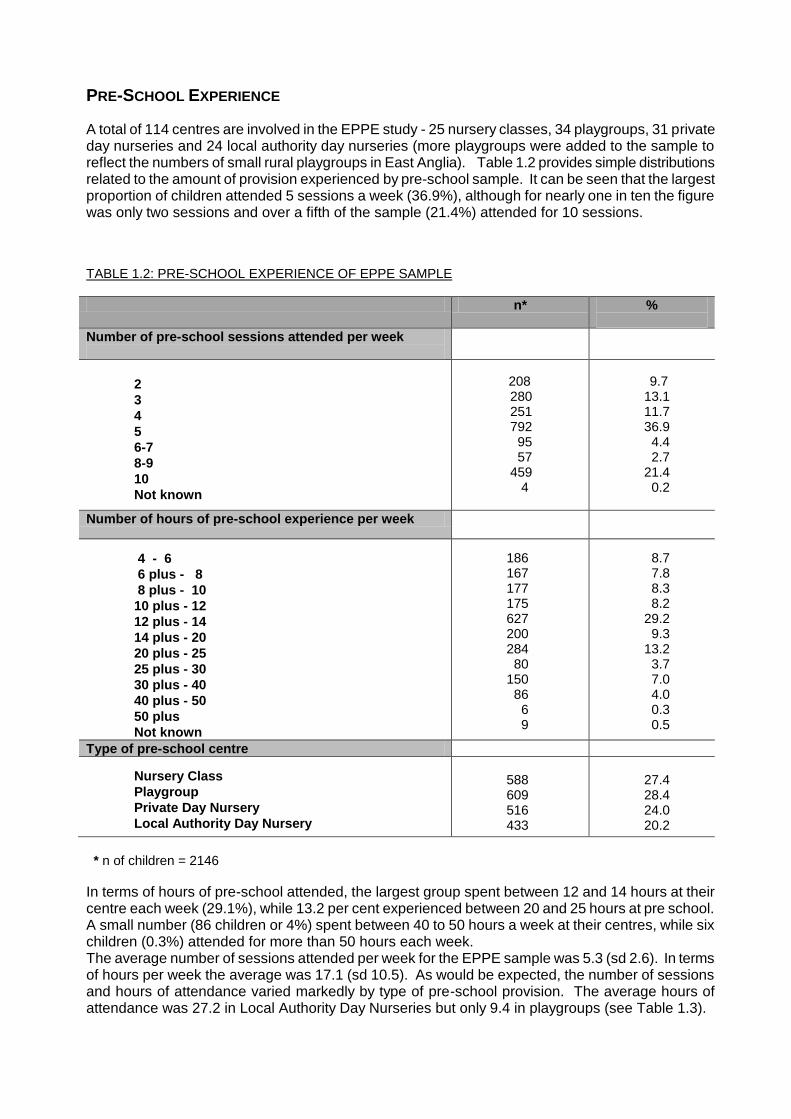
PRE-SCHOOL EXPERIENCE
A total of 114 centres are involved in the EPPE study - 25 nursery classes, 34 playgroups, 31 private day nurseries and 24 local authority day nurseries (more playgroups were added to the sample to reflect the numbers of small rural playgroups in East Anglia). Table 1.2 provides simple distributions related to the amount of provision experienced by pre-school sample. It can be seen that the largest proportion of children attended 5 sessions a week (36.9%), although for nearly one in ten the figure was only two sessions and over a fifth of the sample (21.4%) attended for 10 sessions. TABLE 1.2: PRE-SCHOOL EXPERIENCE OF EPPE SAMPLE
n* %
Number of pre-school sessions attended per week
2
3
4
5
6-7
8-9
10
Not known
208
280 251 792 95 57 459 4
9.7
13.1 11.7 36.9 4.4 2.7 21.4 0.2
Number of hours of pre-school experience per week
4 - 6
6 plus - 8
8 plus - 10
10 plus - 12
12 plus - 14
14 plus - 20
20 plus - 25
25 plus - 30
30 plus - 40
40 plus - 50
50 plus
Not known
186 167 177 175 627 200 284 80 150 86 6 9
8.7 7.8 8.3 8.2 29.2 9.3 13.2 3.7 7.0 4.0 0.3 0.5
Type of pre-school centre
Nursery Class
Playgroup
Private Day Nursery
Local Authority Day Nursery
588 609 516 433
27.4 28.4 24.0 20.2
* n of children = 2146
In terms of hours of pre-school attended, the largest group spent between 12 and 14 hours at their centre each week (29.1%), while 13.2 per cent experienced between 20 and 25 hours at pre school. A small number (86 children or 4%) spent between 40 to 50 hours a week at their centres, while six children (0.3%) attended for more than 50 hours each week. The average number of sessions attended per week for the EPPE sample was 5.3 (sd 2.6). In terms of hours per week the average was 17.1 (sd 10.5). As would be expected, the number of sessions and hours of attendance varied markedly by type of pre-school provision. The average hours of attendance was 27.2 in Local Authority Day Nurseries but only 9.4 in playgroups (see Table 1.3).

TABLE 1.3: VARIATION IN AMOUNT OF PROVISION BY TYPE OF PRE-SCHOOL CENTRE
Hours Sessions
Mean sd mean sd
Nursery Class n = 588
Playgroup n= 609
Private Nursery n= 516
Local Authority Day Nursery n=433
14.5 4.9 9.4 4.0 20.9 12.6 27.2 10.4
5.8 1.9 3.7 1.5 5.2 2.7 8.0 2.6
Total Sample 17.1 10.5 5.3 2.6
n= 2146
The average number of children in the EPPE sample at the centre level was 18.8. Figures in Table 1.4 show that in some centres it was not possible to recruit the numbers of children eligible for the EPPE child sample originally anticipated. In particular some playgroups were affected by the introduction of vouchers and threatened with closure or amalgamation during this period. The earlier movement of children into nursery classes or schools also had an impact, as did mobility in some areas (where children had entry assessments but then moved centre before the 10 week minimum period necessary to be retained in the study).
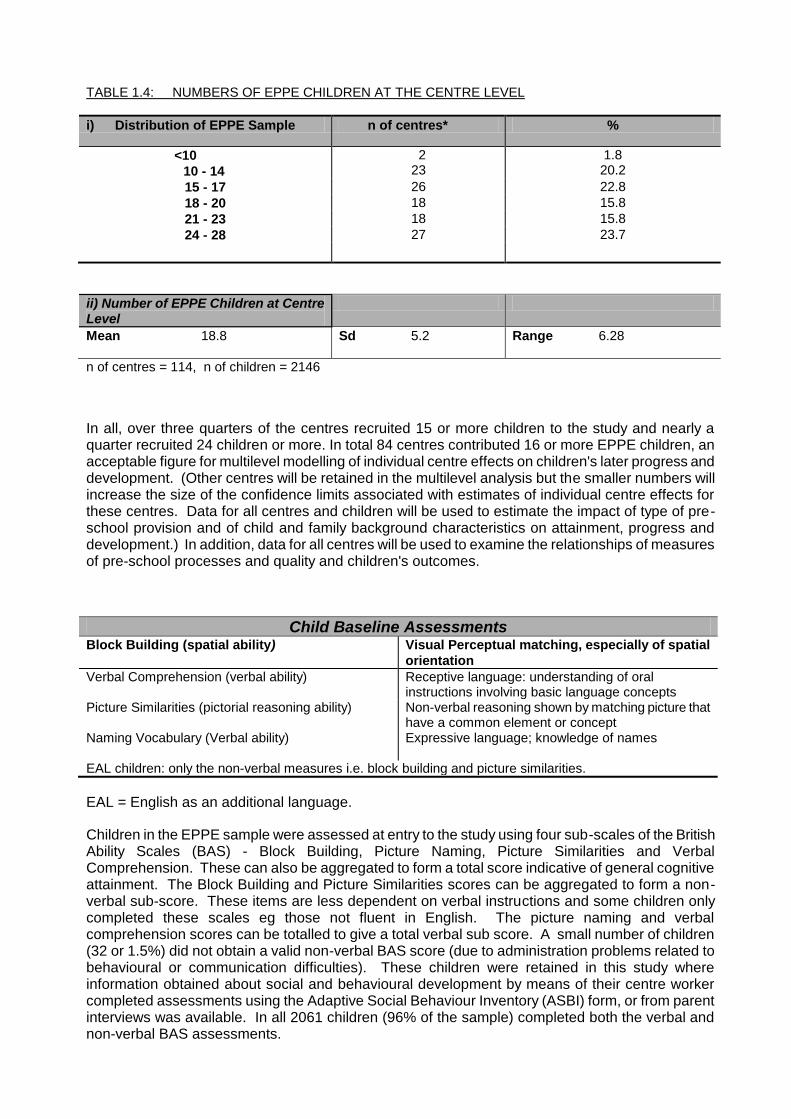
TABLE 1.4: NUMBERS OF EPPE CHILDREN AT THE CENTRE LEVEL
i) Distribution of EPPE Sample n of centres* %
<10
10 - 14
2 23
1.8 20.2
15 - 17 26 22.8
18 - 20 18 15.8
21 - 23 18 15.8
24 - 28 27 23.7
ii) Number of EPPE Children at Centre Level
Mean 18.8 Sd 5.2 Range 6.28
n of centres = 114, n of children = 2146
In all, over three quarters of the centres recruited 15 or more children to the study and nearly a quarter recruited 24 children or more. In total 84 centres contributed 16 or more EPPE children, an acceptable figure for multilevel modelling of individual centre effects on children's later progress and development. (Other centres will be retained in the multilevel analysis but the smaller numbers will increase the size of the confidence limits associated with estimates of individual centre effects for these centres. Data for all centres and children will be used to estimate the impact of type of pre-school provision and of child and family background characteristics on attainment, progress and development.) In addition, data for all centres will be used to examine the relationships of measures of pre-school processes and quality and children's outcomes.
Child Baseline Assessments Block Building (spatial ability) Visual Perceptual matching, especially of spatial
orientation
Verbal Comprehension (verbal ability) Receptive language: understanding of oral instructions involving basic language concepts
Picture Similarities (pictorial reasoning ability) Non-verbal reasoning shown by matching picture that have a common element or concept
Naming Vocabulary (Verbal ability) Expressive language; knowledge of names
EAL children: only the non-verbal measures i.e. block building and picture similarities.
EAL = English as an additional language.
Children in the EPPE sample were assessed at entry to the study using four sub-scales of the British Ability Scales (BAS) - Block Building, Picture Naming, Picture Similarities and Verbal Comprehension. These can also be aggregated to form a total score indicative of general cognitive attainment. The Block Building and Picture Similarities scores can be aggregated to form a non-verbal sub-score. These items are less dependent on verbal instructions and some children only completed these scales eg those not fluent in English. The picture naming and verbal comprehension scores can be totalled to give a total verbal sub score. A small number of children (32 or 1.5%) did not obtain a valid non-verbal BAS score (due to administration problems related to behavioural or communication difficulties). These children were retained in this study where information obtained about social and behavioural development by means of their centre worker completed assessments using the Adaptive Social Behaviour Inventory (ASBI) form, or from parent interviews was available. In all 2061 children (96% of the sample) completed both the verbal and non-verbal BAS assessments.
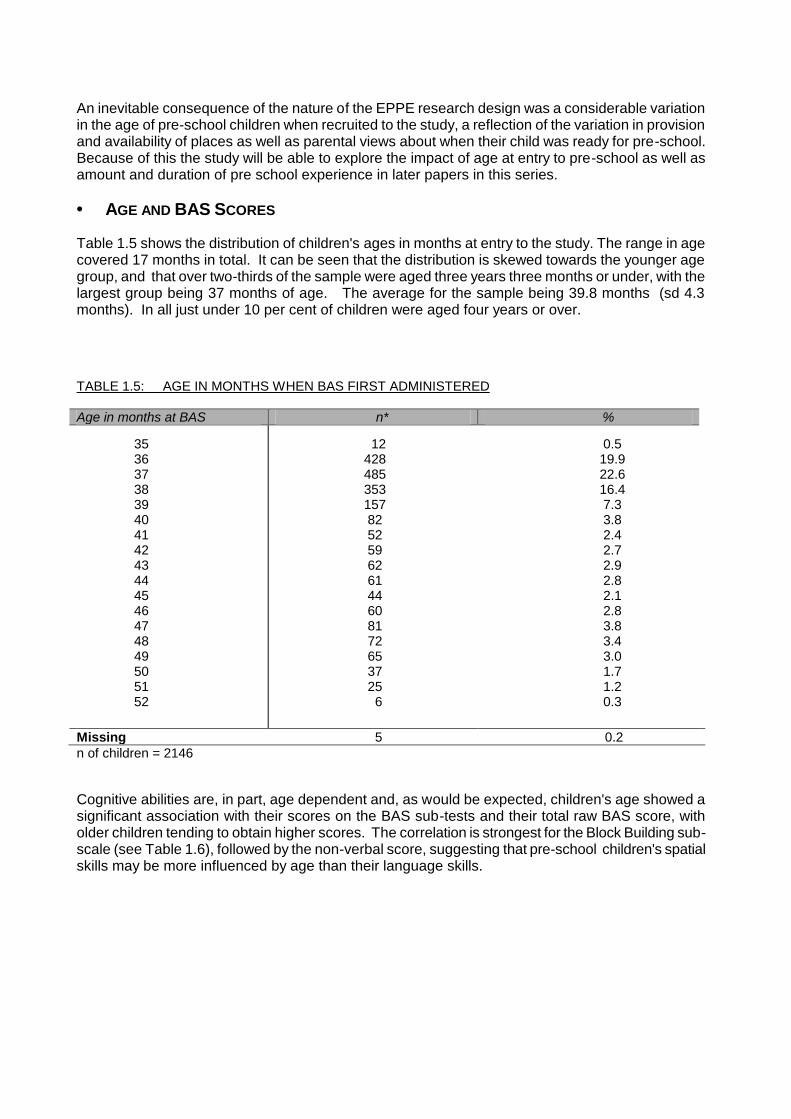
An inevitable consequence of the nature of the EPPE research design was a considerable variation in the age of pre-school children when recruited to the study, a reflection of the variation in provision and availability of places as well as parental views about when their child was ready for pre-school. Because of this the study will be able to explore the impact of age at entry to pre-school as well as amount and duration of pre school experience in later papers in this series.
• AGE AND BAS SCORES
Table 1.5 shows the distribution of children's ages in months at entry to the study. The range in age covered 17 months in total. It can be seen that the distribution is skewed towards the younger age group, and that over two-thirds of the sample were aged three years three months or under, with the largest group being 37 months of age. The average for the sample being 39.8 months (sd 4.3 months). In all just under 10 per cent of children were aged four years or over. TABLE 1.5: AGE IN MONTHS WHEN BAS FIRST ADMINISTERED
Age in months at BAS n* %
35 36 37 38 39 40 41 42 43 44 45 46 47 48 49 50 51 52
12 428 485 353 157 82 52 59 62 61 44 60 81 72 65 37 25 6
0.5 19.9 22.6 16.4 7.3 3.8 2.4 2.7 2.9 2.8 2.1 2.8 3.8 3.4 3.0 1.7 1.2 0.3
Missing 5 0.2
n of children = 2146
Cognitive abilities are, in part, age dependent and, as would be expected, children's age showed a significant association with their scores on the BAS sub-tests and their total raw BAS score, with older children tending to obtain higher scores. The correlation is strongest for the Block Building sub-scale (see Table 1.6), followed by the non-verbal score, suggesting that pre-school children's spatial skills may be more influenced by age than their language skills.

TABLE 1.6: CORRELATIONS BETWEEN CHILD'S AGE IN MONTHS AT BAS ENTRY ASSESSMENT AND SCORES IN THE BAS ASSESSMENTS
r n
Block 0.473 2111
Picture Naming 0.301 2063
Picture Similarities 0.325 2111
Verbal Comprehension 0.251 2065
Total BAS Score 0.426 2060
Non Verbal Score (Block + Picture Similarities) 0.455 2108
Verbal Score (Picture Naming + Verbal Comprehension) 0.306 2062
p <0.001
The relationship between age in months and children's BAS performance can also be illustrated for selected groups covering the 12 month age range from 3.0 to 4.0 years (see Table 1.7). Despite the different numbers of children in each group, it is evident that older the group of children (48 months) show a significantly higher average score than the youngest group (age 36 months). TABLE 1.7: EXAMPLE OF VARIATION IN THE MEAN BAS SCORES BY AGE IN MONTHS
36 months Mean sd
39 months Mean sd
42 months Mean sd
45 months Mean sd
48 months Mean sd
Total BAS
Score
Total
Non-Verbal
Score
Total Verbal
Score
46.86 11.35 n = 415 17.63 5.71 n = 420 29.15 7.40 n = 415
47.50 12.01 n = 150 18.46 5.56 n = 156 29.05 8.39
n = 151
50.37 13.17 n = 54 20.13 7.27 n = 56
29.74 8.36 n = 54
54.10 13.27 n = 39 21.74 6.86 n = 43 32.03 7.34 n = 39
66.21 12.58 n = 71 27.60 6.69 n = 72 38.52 7.76 n = 71
Due to doubts about the suitability of using nationally standardised scores in assessments which cover a relatively small number of points in a scale (see Tymms, 1998) standardised scores are not reported here 1. In later multivariate analyses age in months at assessment will be treated as an
independent (predictor) measure and controlled for. This procedure is important due to the variation in the EPPE children's ages between individual pre-school centres and between the four types of pre-school provision (discussed below). Children recorded a wide range in BAS scores at entry as is illustrated in Table 1.8. The lower half of this table also shows the correlations between children's scores in the four sub-scales and total BAS scores. The strongest association was between the two verbal subscales - picture naming and verbal comprehension (r=0.630).
1. It should be noted that the EPPE sample is considerably larger than that used for the BAS standardisation for the 36 to 39 month age range, although because it is not a random or nationally representative sample it cannot be treated as representative of pre-school children as a whole.

TABLE 1.8: VARIATION IN CHILDREN'S BAS ASSESSMENTS AT ENTRY TO EPPE STUDY i] Range in BAS sub-scores and total score at entry
mean sd Min Max Top Quartile Bottom Quartile
Block
4.77
3.34
0
16
7
2
Picture Naming
n = 2064
Picture
Similarities
n = 2112
Verbal
Comprehension
n =2066
Total Non-Verbal
Score*
n = 2109
Total Verbal
Score
n = 2063
Total BAS Score
n = 2061
16.39 14.68 14.10 19.45 30.51 50.06
4.65 4.58 4.50 6.76 8.26 13.8
0 0 0 0 0 0
27 29 32 44 56 90
19 17 17 24 36 59
12 12 10 15 24 40
ii] Correlations between children's scores on the different BAS assessments at entry
Block Picture Naming Picture Similarities
Verbal Comprehension
Total BAS Score
Block
Picture Naming
Picture
Similarities
Verbal
Comprehension
Total BAS Score
1.00
0.443
n=2109
1.00
0.443 n=2109 0.471 n=2062 1.00
0.444 n=2063 0.630 n=2063 0.408 n=2064 1.00
0.710 n=2061 0.835 n=2061 0.755 n=2061 0.809 n=2061 1.00

• GENDER AND BAS SCORES
A statistically significant difference (p<0.05) was found between the BAS performance of girls and boys at entry to the study. Table 1.9 illustrates that on average girls outperformed boys on all assessments although the higher standard deviations indicate greater variability in boys' performance around the mean for all subscales. Further analyses were conducted to establish whether the higher performance of girls held for all social class groups. The results indicated that girls' performance was not significantly different from that of boys for children whose fathers were in professional occupations (Registrar General's Classification Class I), indeed the mean score for boys was slightly higher than for girls in this instance. For other occupational groups the gender difference was in favour of girls and was significant statistically for children whose fathers were in the non-manual groups II and III, and manual groups III and V. For children whose fathers were in semi-skilled manual work (class IV) the mean scores of girls were higher but the difference was not statistically significant. These results suggest that, for young children whose fathers are in employment which is accorded the highest social status in terms of occupational classification schemes, there is no evidence of under performance by boys. It will be of interest to establish whether the pattern of relationships between gender and performance identified at entry to the EPPE study for these young children remains stable for children of different social class backgrounds over the pre-school period. TABLE 1.9: BAS SCORES AT ENTRY ANALYSED BY GENDER
n
BOYS mean
sd
n
GIRLS mean
sd
Block
1102
4.59
3.37
1010
4.96
3.30
Picture Naming
1076
16.02
4.73
988
16.80
4.53
Picture Similarities
1100
14.22
4.67
1012
15.18
4.44
Verbal Comprehension
1077
13.82
4.64
989
14.41
4.32
Non-Verbal Score
1100
18.81
6.85
1009
20.15
6.59
Total Verbal Score
1076
29.84
8.45
987
31.23
7.99
Total BAS Score
1075
48.77
13.53
986
51.45
12.98
ETHNIC GROUP AND BAS SCORES
As noted earlier, less than a quarter (22.9%) of the EPPE project child sample was of minority ethnic background and the project design was not intended to form a nationally representative sample. Given the small number of certain ethnic groups (Black- other, Chinese, Bangladeshi and the Other group) comparisons of the entry attainments of different ethnic groups at entry to the study should be treated as tentative (for example, the ethnic composition of children attending the four different types of provision varied as will be shown in the next sub-section). Figures are reported for the seven most numerous groups in the sample. Table 1.10 illustrates the existence of differences in BAS attainment at entry for specific groups at entry to the study. The results indicate significant differences in the average attainment of the seven groups, however, they should be interpreted with considerable caution because no account is taken of the impact of language fluency or of differences in parental education or socio-economic factors which are likely to have influenced the results (see Sammons, 1995 for a discussion). Sections 2 and 3 of this paper consider these aspects further. Technical Paper 4 (Melhuish et al, 1999a) also explores the relationships between socio-economic and parental education measures and patterns of pre-school use in more detail.

TABLE 1.10: BAS SCORES AT ENTRY ANALYSED BY ETHNIC GROUP
Ethnic Group
Total BAS Score
Age in months at BAS
n
mean
sd
mean
sd
White UK
1634
51.45
13.09
39.9
4.41
White European
69
48.23
12.99
38.9
3.20
Black Caribbean
74
46.18
10.52
39.1
4.03
Black African
43
41.79
12.55
38.7
3.58
Indian
30
44.17
14.69
38.7
3.52
Pakistani
45
34.04
12.47
40.7
4.49
Mixed
131
46.96
12.17
38.7
3.61
Ethnic Group
Total Non Verbal Reasoning Score
Total Verbal Reasoning Score
n
mean
sd
n
mean
sd
White UK
1636
19.80
6.77
1636
31.64
7.83
White Europe
86
18.79
6.41
69
28.67
8.73
Black Caribbean
74
18.76
6.05
74
27.42
6.34
Black African
46
16.59
6.29
43
24.95
7.39
Indian
31
19.90
8.10
30
24.23
7.56
Pakistani
54
15.98
7.12
45
18.09
8.23
Mixed
133
18.32
6.25
131
28.50
7.97
Overall, children from the Pakistani group recorded the lowest mean total BAS score (mean = 34.0) followed by those of Black African heritage (mean = 41.8). Children of White UK heritage had the highest average score (mean = 51.5). Ethnic differences in children’s non-verbal scores were smaller (performance in these areas is less likely to be influenced by language and socio-economic factors). In this non-verbal assessment children of Indian heritage and those of White UK heritage obtained the highest average scores, while those of Pakistani and Black African, recorded the lowest scores. Also shown in Table 1.10 is the average age in months of each group at BAS. Differences in the average age of children of different ethnic origins are fairly small although the Pakistani group were somewhat older than those of Indian, White European or Mixed heritage. The results suggest that age differences are not likely to account for the ethnic differences in children’s BAS performance evident at entry to the study. Although the EPPE sample is not a representative sample, and the numbers of ethnic minority children in the study are small, the pattern of differences in attainment reported here is in line with those found amongst larger samples of school age children (Slough Borough Council, 1998; Strand 1999). It will be important to monitor any changes in the pattern of ethnic differences in children’s cognitive attainments as they progress through pre-school and into primary school to establish whether differences are reduced by the time children enter school. This study will also explore the extent of variation in the pre-school experiences of children of different ethnic groups (in terms of measures of pre-school centre processes and quality).
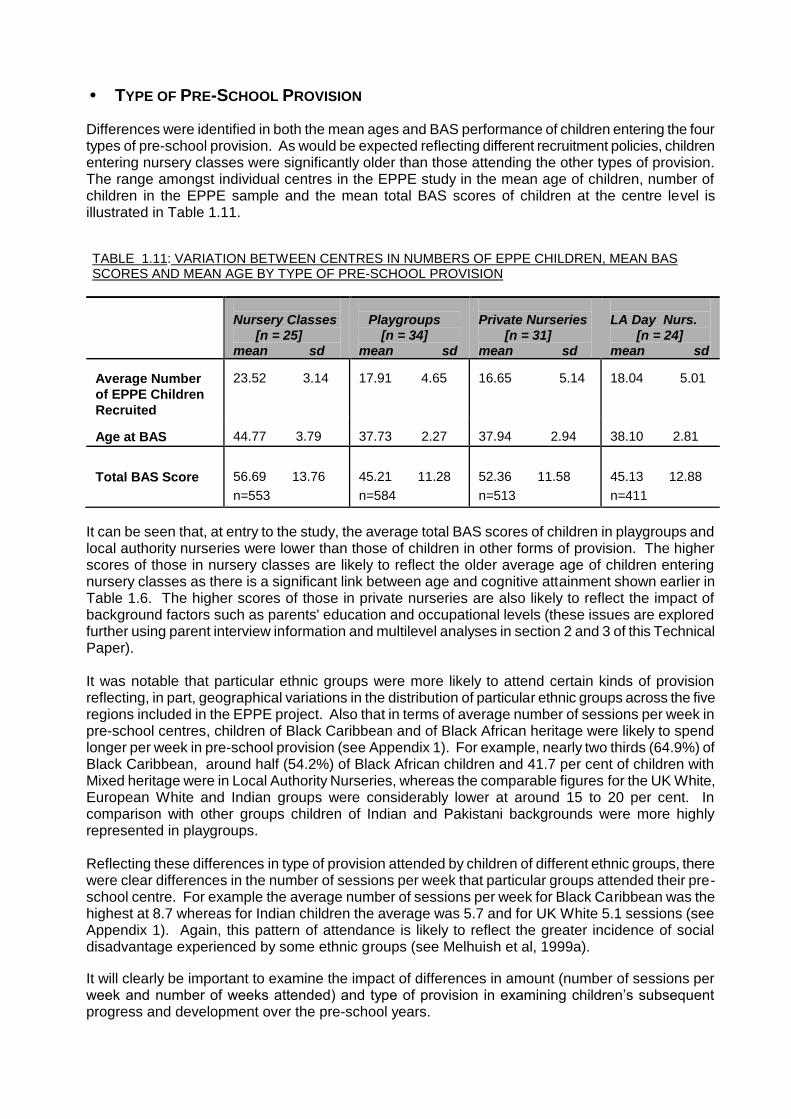
• TYPE OF PRE-SCHOOL PROVISION
Differences were identified in both the mean ages and BAS performance of children entering the four types of pre-school provision. As would be expected reflecting different recruitment policies, children entering nursery classes were significantly older than those attending the other types of provision. The range amongst individual centres in the EPPE study in the mean age of children, number of children in the EPPE sample and the mean total BAS scores of children at the centre level is illustrated in Table 1.11. TABLE 1.11: VARIATION BETWEEN CENTRES IN NUMBERS OF EPPE CHILDREN, MEAN BAS SCORES AND MEAN AGE BY TYPE OF PRE-SCHOOL PROVISION
Nursery Classes [n = 25] mean sd
Playgroups [n = 34] mean sd
Private Nurseries [n = 31] mean sd
LA Day Nurs. [n = 24] mean sd
Average Number
of EPPE Children
Recruited
23.52 3.14
17.91 4.65
16.65 5.14
18.04 5.01
Age at BAS
44.77 3.79
37.73 2.27
37.94 2.94
38.10 2.81
Total BAS Score
56.69 13.76
n=553
45.21 11.28
n=584
52.36 11.58
n=513
45.13 12.88
n=411
It can be seen that, at entry to the study, the average total BAS scores of children in playgroups and local authority nurseries were lower than those of children in other forms of provision. The higher scores of those in nursery classes are likely to reflect the older average age of children entering nursery classes as there is a significant link between age and cognitive attainment shown earlier in Table 1.6. The higher scores of those in private nurseries are also likely to reflect the impact of background factors such as parents' education and occupational levels (these issues are explored further using parent interview information and multilevel analyses in section 2 and 3 of this Technical Paper). It was notable that particular ethnic groups were more likely to attend certain kinds of provision reflecting, in part, geographical variations in the distribution of particular ethnic groups across the five regions included in the EPPE project. Also that in terms of average number of sessions per week in pre-school centres, children of Black Caribbean and of Black African heritage were likely to spend longer per week in pre-school provision (see Appendix 1). For example, nearly two thirds (64.9%) of Black Caribbean, around half (54.2%) of Black African children and 41.7 per cent of children with Mixed heritage were in Local Authority Nurseries, whereas the comparable figures for the UK White, European White and Indian groups were considerably lower at around 15 to 20 per cent. In comparison with other groups children of Indian and Pakistani backgrounds were more highly represented in playgroups. Reflecting these differences in type of provision attended by children of different ethnic groups, there were clear differences in the number of sessions per week that particular groups attended their pre-school centre. For example the average number of sessions per week for Black Caribbean was the highest at 8.7 whereas for Indian children the average was 5.7 and for UK White 5.1 sessions (see Appendix 1). Again, this pattern of attendance is likely to reflect the greater incidence of social disadvantage experienced by some ethnic groups (see Melhuish et al, 1999a).
It will clearly be important to examine the impact of differences in amount (number of sessions per week and number of weeks attended) and type of provision in examining children’s subsequent progress and development over the pre-school years.
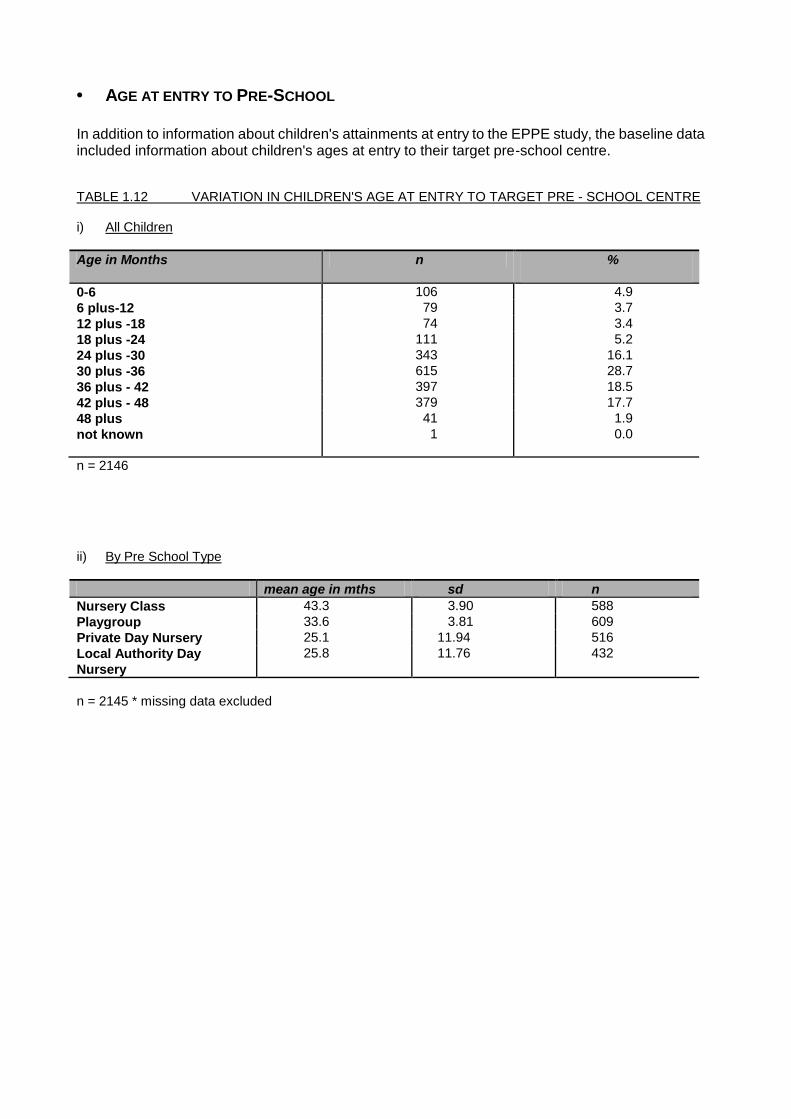
• AGE AT ENTRY TO PRE-SCHOOL
In addition to information about children's attainments at entry to the EPPE study, the baseline data included information about children's ages at entry to their target pre-school centre. TABLE 1.12 VARIATION IN CHILDREN'S AGE AT ENTRY TO TARGET PRE - SCHOOL CENTRE i) All Children
Age in Months n %
0-6 106 4.9
6 plus-12 79 3.7
12 plus -18 74 3.4
18 plus -24 111 5.2
24 plus -30 343 16.1
30 plus -36 615 28.7
36 plus - 42 397 18.5
42 plus - 48 379 17.7
48 plus 41 1.9
not known 1 0.0
n = 2146 ii) By Pre School Type
mean age in mths sd n
Nursery Class 43.3 3.90 588
Playgroup 33.6 3.81 609
Private Day Nursery 25.1 11.94 516
Local Authority Day
Nursery
25.8 11.76 432
n = 2145 * missing data excluded
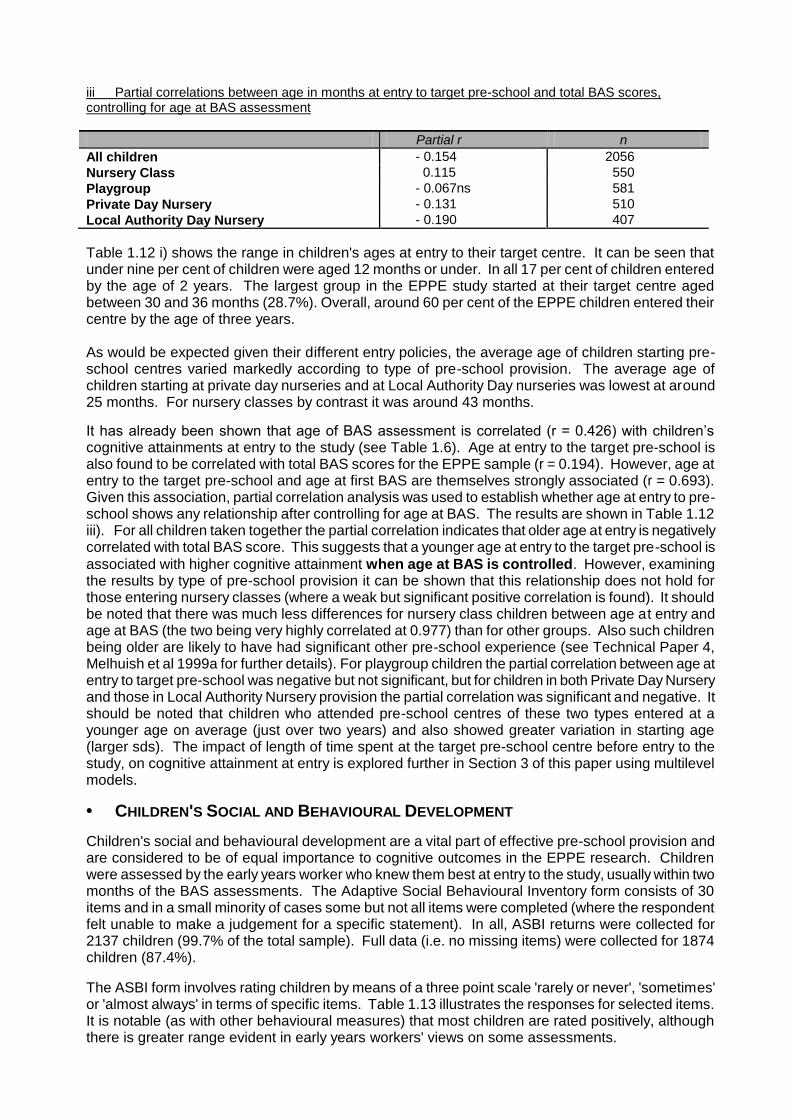
iii Partial correlations between age in months at entry to target pre-school and total BAS scores, controlling for age at BAS assessment
Partial r n
All children - 0.154 2056
Nursery Class 0.115 550
Playgroup - 0.067ns 581
Private Day Nursery - 0.131 510
Local Authority Day Nursery - 0.190 407
Table 1.12 i) shows the range in children's ages at entry to their target centre. It can be seen that under nine per cent of children were aged 12 months or under. In all 17 per cent of children entered by the age of 2 years. The largest group in the EPPE study started at their target centre aged between 30 and 36 months (28.7%). Overall, around 60 per cent of the EPPE children entered their centre by the age of three years. As would be expected given their different entry policies, the average age of children starting pre-school centres varied markedly according to type of pre-school provision. The average age of children starting at private day nurseries and at Local Authority Day nurseries was lowest at around 25 months. For nursery classes by contrast it was around 43 months.
It has already been shown that age of BAS assessment is correlated (r = 0.426) with children’s cognitive attainments at entry to the study (see Table 1.6). Age at entry to the target pre-school is also found to be correlated with total BAS scores for the EPPE sample (r = 0.194). However, age at entry to the target pre-school and age at first BAS are themselves strongly associated (r = 0.693). Given this association, partial correlation analysis was used to establish whether age at entry to pre-school shows any relationship after controlling for age at BAS. The results are shown in Table 1.12 iii). For all children taken together the partial correlation indicates that older age at entry is negatively correlated with total BAS score. This suggests that a younger age at entry to the target pre-school is
associated with higher cognitive attainment when age at BAS is controlled. However, examining the results by type of pre-school provision it can be shown that this relationship does not hold for those entering nursery classes (where a weak but significant positive correlation is found). It should be noted that there was much less differences for nursery class children between age at entry and age at BAS (the two being very highly correlated at 0.977) than for other groups. Also such children being older are likely to have had significant other pre-school experience (see Technical Paper 4, Melhuish et al 1999a for further details). For playgroup children the partial correlation between age at entry to target pre-school was negative but not significant, but for children in both Private Day Nursery and those in Local Authority Nursery provision the partial correlation was significant and negative. It should be noted that children who attended pre-school centres of these two types entered at a younger age on average (just over two years) and also showed greater variation in starting age (larger sds). The impact of length of time spent at the target pre-school centre before entry to the study, on cognitive attainment at entry is explored further in Section 3 of this paper using multilevel models.
• CHILDREN'S SOCIAL AND BEHAVIOURAL DEVELOPMENT
Children's social and behavioural development are a vital part of effective pre-school provision and are considered to be of equal importance to cognitive outcomes in the EPPE research. Children were assessed by the early years worker who knew them best at entry to the study, usually within two months of the BAS assessments. The Adaptive Social Behavioural Inventory form consists of 30 items and in a small minority of cases some but not all items were completed (where the respondent felt unable to make a judgement for a specific statement). In all, ASBI returns were collected for 2137 children (99.7% of the total sample). Full data (i.e. no missing items) were collected for 1874 children (87.4%).
The ASBI form involves rating children by means of a three point scale 'rarely or never', 'sometimes' or 'almost always' in terms of specific items. Table 1.13 illustrates the responses for selected items. It is notable (as with other behavioural measures) that most children are rated positively, although there is greater range evident in early years workers' views on some assessments.
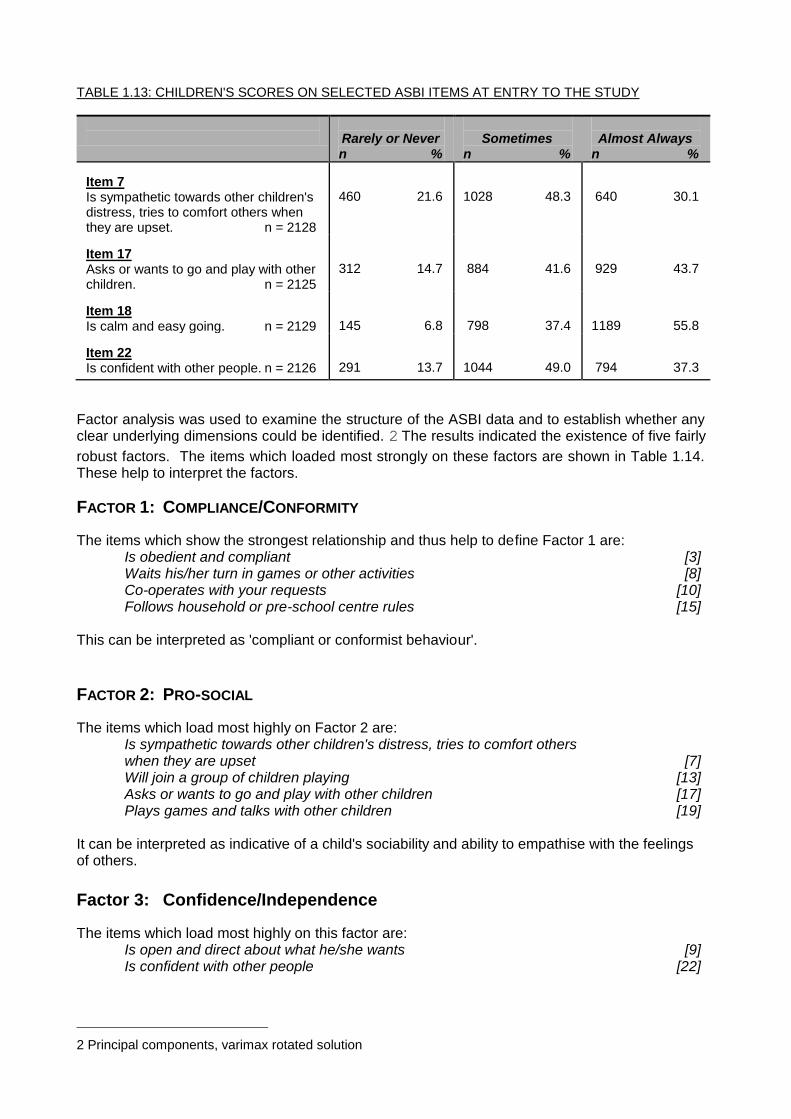
TABLE 1.13: CHILDREN'S SCORES ON SELECTED ASBI ITEMS AT ENTRY TO THE STUDY
Rarely or Never n %
Sometimes n %
Almost Always n %
Item 7 Is sympathetic towards other children's distress, tries to comfort others when they are upset. n = 2128
460 21.6
1028 48.3
640 30.1
Item 17 Asks or wants to go and play with other children. n = 2125
312 14.7
884 41.6
929 43.7
Item 18 Is calm and easy going. n = 2129
145 6.8
798 37.4
1189 55.8
Item 22 Is confident with other people. n = 2126
291 13.7
1044 49.0
794 37.3
Factor analysis was used to examine the structure of the ASBI data and to establish whether any clear underlying dimensions could be identified. 2 The results indicated the existence of five fairly
robust factors. The items which loaded most strongly on these factors are shown in Table 1.14. These help to interpret the factors.
FACTOR 1: COMPLIANCE/CONFORMITY
The items which show the strongest relationship and thus help to define Factor 1 are: Is obedient and compliant [3] Waits his/her turn in games or other activities [8] Co-operates with your requests [10] Follows household or pre-school centre rules [15]
This can be interpreted as 'compliant or conformist behaviour'.
FACTOR 2: PRO-SOCIAL
The items which load most highly on Factor 2 are: Is sympathetic towards other children's distress, tries to comfort others when they are upset [7] Will join a group of children playing [13] Asks or wants to go and play with other children [17] Plays games and talks with other children [19]
It can be interpreted as indicative of a child's sociability and ability to empathise with the feelings of others.
Factor 3: Confidence/Independence
The items which load most highly on this factor are: Is open and direct about what he/she wants [9] Is confident with other people [22]
2 Principal components, varimax rotated solution
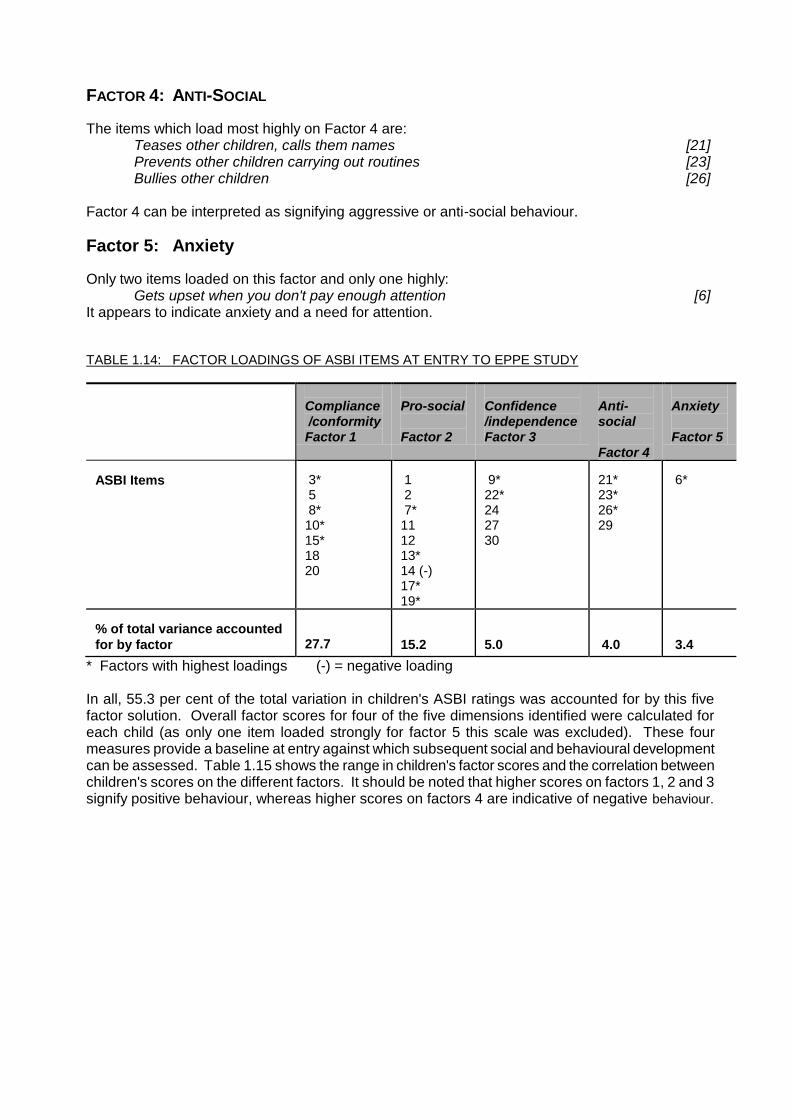
FACTOR 4: ANTI-SOCIAL
The items which load most highly on Factor 4 are: Teases other children, calls them names [21] Prevents other children carrying out routines [23] Bullies other children [26]
Factor 4 can be interpreted as signifying aggressive or anti-social behaviour.
Factor 5: Anxiety
Only two items loaded on this factor and only one highly: Gets upset when you don't pay enough attention [6]
It appears to indicate anxiety and a need for attention. TABLE 1.14: FACTOR LOADINGS OF ASBI ITEMS AT ENTRY TO EPPE STUDY
Compliance /conformity Factor 1
Pro-social Factor 2
Confidence /independence Factor 3
Anti-social Factor 4
Anxiety Factor 5
ASBI Items
3* 5 8* 10* 15* 18 20
1 2 7* 11 12 13* 14 (-) 17* 19*
9* 22* 24 27 30
21* 23* 26* 29
6*
% of total variance accounted
for by factor
27.7
15.2
5.0
4.0
3.4
* Factors with highest loadings (-) = negative loading In all, 55.3 per cent of the total variation in children's ASBI ratings was accounted for by this five factor solution. Overall factor scores for four of the five dimensions identified were calculated for each child (as only one item loaded strongly for factor 5 this scale was excluded). These four measures provide a baseline at entry against which subsequent social and behavioural development can be assessed. Table 1.15 shows the range in children's factor scores and the correlation between children's scores on the different factors. It should be noted that higher scores on factors 1, 2 and 3 signify positive behaviour, whereas higher scores on factors 4 are indicative of negative behaviour.
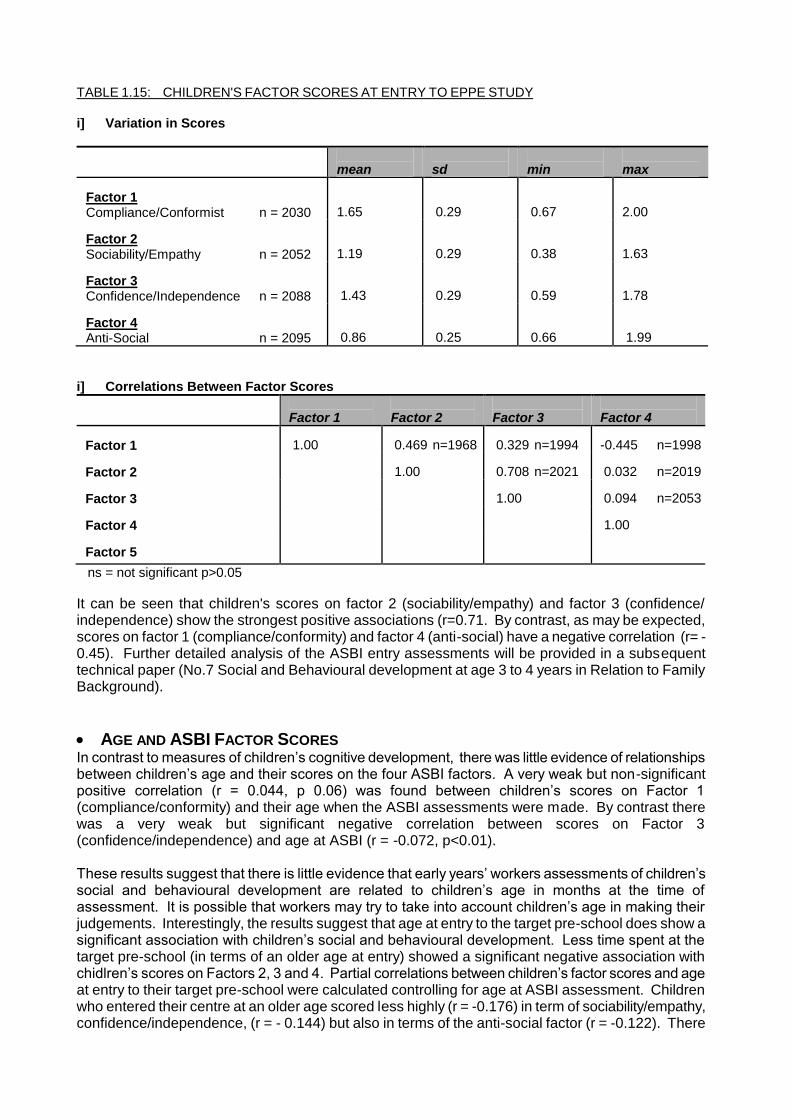
TABLE 1.15: CHILDREN'S FACTOR SCORES AT ENTRY TO EPPE STUDY
i] Variation in Scores
mean
sd
min
max
Factor 1 Compliance/Conformist n = 2030
1.65
0.29
0.67
2.00
Factor 2 Sociability/Empathy n = 2052
1.19
0.29
0.38
1.63
Factor 3 Confidence/Independence n = 2088
1.43
0.29
0.59
1.78
Factor 4 Anti-Social n = 2095
0.86
0.25
0.66
1.99
i] Correlations Between Factor Scores
Factor 1
Factor 2
Factor 3
Factor 4
Factor 1
1.00
0.469 n=1968
0.329 n=1994
-0.445 n=1998
Factor 2
1.00
0.708 n=2021
0.032 n=2019
Factor 3
1.00
0.094 n=2053
Factor 4
1.00
Factor 5
ns = not significant p>0.05
It can be seen that children's scores on factor 2 (sociability/empathy) and factor 3 (confidence/ independence) show the strongest positive associations (r=0.71. By contrast, as may be expected, scores on factor 1 (compliance/conformity) and factor 4 (anti-social) have a negative correlation (r= -0.45). Further detailed analysis of the ASBI entry assessments will be provided in a subsequent technical paper (No.7 Social and Behavioural development at age 3 to 4 years in Relation to Family Background).
AGE AND ASBI FACTOR SCORES In contrast to measures of children’s cognitive development, there was little evidence of relationships between children’s age and their scores on the four ASBI factors. A very weak but non-significant positive correlation (r = 0.044, p 0.06) was found between children’s scores on Factor 1 (compliance/conformity) and their age when the ASBI assessments were made. By contrast there was a very weak but significant negative correlation between scores on Factor 3 (confidence/independence) and age at ASBI (r = -0.072, p<0.01). These results suggest that there is little evidence that early years’ workers assessments of children’s social and behavioural development are related to children’s age in months at the time of assessment. It is possible that workers may try to take into account children’s age in making their judgements. Interestingly, the results suggest that age at entry to the target pre-school does show a significant association with children’s social and behavioural development. Less time spent at the target pre-school (in terms of an older age at entry) showed a significant negative association with chidlren’s scores on Factors 2, 3 and 4. Partial correlations between children’s factor scores and age at entry to their target pre-school were calculated controlling for age at ASBI assessment. Children who entered their centre at an older age scored less highly (r = -0.176) in term of sociability/empathy, confidence/independence, (r = - 0.144) but also in terms of the anti-social factor (r = -0.122). There
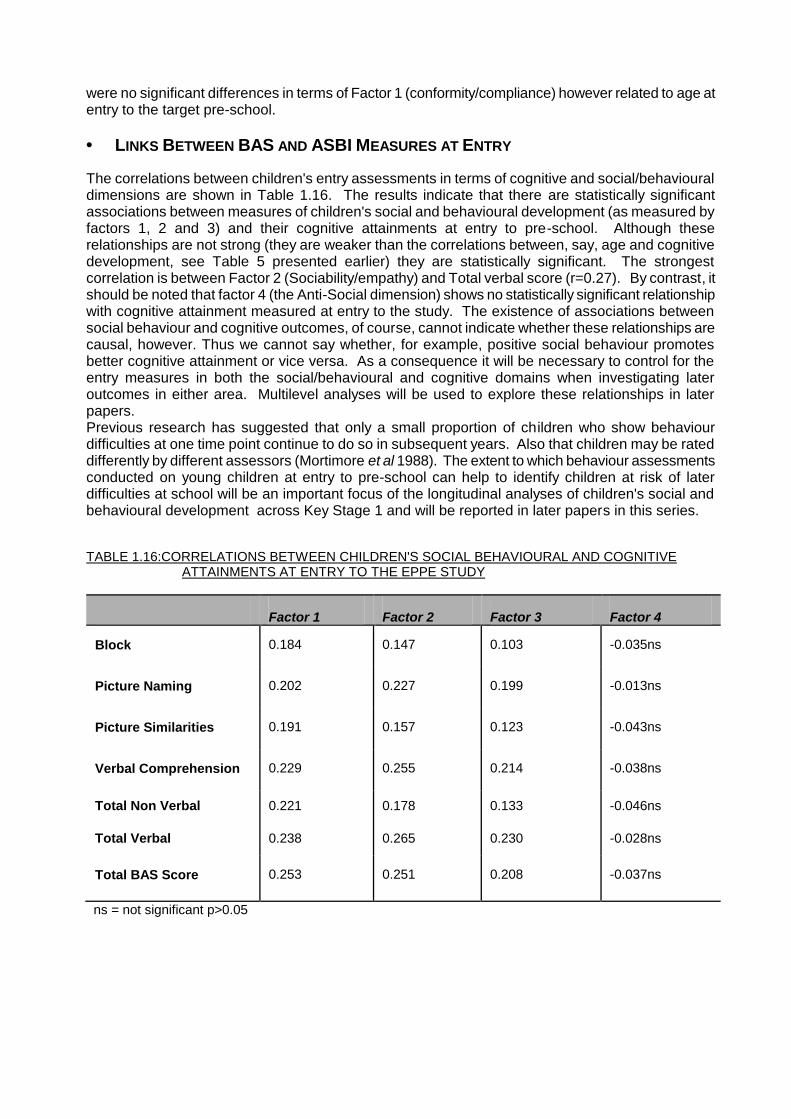
were no significant differences in terms of Factor 1 (conformity/compliance) however related to age at entry to the target pre-school.
• LINKS BETWEEN BAS AND ASBI MEASURES AT ENTRY
The correlations between children's entry assessments in terms of cognitive and social/behavioural dimensions are shown in Table 1.16. The results indicate that there are statistically significant associations between measures of children's social and behavioural development (as measured by factors 1, 2 and 3) and their cognitive attainments at entry to pre-school. Although these relationships are not strong (they are weaker than the correlations between, say, age and cognitive development, see Table 5 presented earlier) they are statistically significant. The strongest correlation is between Factor 2 (Sociability/empathy) and Total verbal score (r=0.27). By contrast, it should be noted that factor 4 (the Anti-Social dimension) shows no statistically significant relationship with cognitive attainment measured at entry to the study. The existence of associations between social behaviour and cognitive outcomes, of course, cannot indicate whether these relationships are causal, however. Thus we cannot say whether, for example, positive social behaviour promotes better cognitive attainment or vice versa. As a consequence it will be necessary to control for the entry measures in both the social/behavioural and cognitive domains when investigating later outcomes in either area. Multilevel analyses will be used to explore these relationships in later papers. Previous research has suggested that only a small proportion of children who show behaviour difficulties at one time point continue to do so in subsequent years. Also that children may be rated differently by different assessors (Mortimore et al 1988). The extent to which behaviour assessments conducted on young children at entry to pre-school can help to identify children at risk of later difficulties at school will be an important focus of the longitudinal analyses of children's social and behavioural development across Key Stage 1 and will be reported in later papers in this series. TABLE 1.16:CORRELATIONS BETWEEN CHILDREN'S SOCIAL BEHAVIOURAL AND COGNITIVE
ATTAINMENTS AT ENTRY TO THE EPPE STUDY
Factor 1
Factor 2
Factor 3
Factor 4
Block
0.184
0.147
0.103
-0.035ns
Picture Naming
0.202
0.227
0.199
-0.013ns
Picture Similarities
0.191
0.157
0.123
-0.043ns
Verbal Comprehension
0.229
0.255
0.214
-0.038ns
Total Non Verbal
0.221
0.178
0.133
-0.046ns
Total Verbal
0.238
0.265
0.230
-0.028ns
Total BAS Score
0.253
0.251
0.208
-0.037ns
ns = not significant p>0.05

GENDER AND ETHNIC DIFFERENCES IN SOCIAL AND BEHAVIOURAL DEVELOPMENT A comparison of the ASBI factor scores for boys and girls indicates the existence of small but statistically significant differences (p <0.05) in early years workers’ assessments of the behaviour of the two groups for the three factors compliance/conformity, pro-social and confidence/independence, although it should be remembered that the vast majority of children of both sexes were positively rated (see Table 1.17). TABLE 1.17:ASBI FACTOR SCORES AT ENTRY ANALYSED BY GENDER
BOYS
GIRLS
n
mean
Sd
n
mean
sd
Factor 1
Compliance / Conformity
1060
1.61
0.30
970
1.70
0.28
Factor 2
Pro-Social
1071
1.15
0.29
981
1.23
0.29
Factor 3
Confidence / Independence
1092
1.41
0.30
996
1.46
0.28
Factor 4
Anti-Social
1097
0.86
0.25
998
0.85
0.24
Girls tended to be rated somewhat more favourably in terms of compliance/conformity and pro-social behaviour and confidence/independence. By contrast to the findings concerning gender, no significant variation in overall mean factor scores were identified for children from the different ethnic groups in terms of early years workers’ ratings of social and behavioural development at entry to the EPPE study. This is in contrast to the results of the analyses of cognitive attainment at entry described earlier in this section.
SUMMARY
Section 1 of this paper provides a description of some features of the EPPE child sample at entry to pre-school and details about their pre-school experience. Further analyses have been conducted to examine additional information relating to children’s family and health background obtained from parent interviews. The next section reports the results of these preliminary analyses of children’s attainments at entry in relation to the variables described here.
SECTION 2
This section of the working paper presents some information about the EPPE child sample derived from short parental interviews (lasting approximately 20 minutes on average) conducted after children were recruited to the study. It should be noted that most interviews were with children's mothers and usually took place at the child's pre-school centre, although for some working parents telephone interviews were found to be more convenient. All parents had already agreed to take part in the study and signed consent forms. The parent interviews were designed to obtain information about the child's health and care history, details of family structure and parents' educational and occupational backgrounds as well as some indications of parent-child activities and routines. Parents were assured of confidentiality and anonymity in the presentation of results. In all, 2121 parent interviews have been conducted (representing data for 98.8% of the total child sample). The descriptive results reported in this section cover a number of key background

indicators likely to be important in accounting for variations in children's attainments and adjustment at entry to pre-school.
FAMILY CHARACTERISTICS
Figures in Table 2.1 show that the vast majority of children lived with their mothers (98.7%) while around three quarters lived with their father. Only a tiny minority lived with their father only. TABLE 2.1: CHILDREN'S FAMILY STRUCTURE
n %
Live with mother and father 1588 74.9
Lone parent live with mother 505 23.8
Lone parent live with father 16 0.8
Live with siblings 1605 75.7
n=2121
The majority of children lived with one or more siblings. An indication of family size is provided by the number of siblings and birth position. In all 46.7 per cent of children were first born with 34.6 per cent second born children in their families and only under one in five was born third or later (18.7%). Figures in Table 2.2 indicate that just over a fifth of the sample were only children at this stage, while a little over a third had one sibling and 28 per cent two siblings. Only a small number (13.5%) were from large families (classified as 3 or more siblings at home, i.e. 4 plus children). TABLE 2.2: NUMBER OF SIBLINGS
Siblings
n*
%
0
1
2
3
4
5
6 or more
No response
477 754 596 206 53 14 14 7
22.5 35.6 28.1 9.7 2.5 0.7 0.7 0.3
* n = 2121 n of missing parental interviews = 25 TABLE 2.3: PARENTS' MARITAL STATUS
Marital Status n %
Never married, lone parent 299 14.1
Never married, live with partner 299 14.1
Married, live with spouse 1290 60.8
Separated/divorced,lone parent 221 10.3
Widow/widower, lone parent 3 0.1
Other 8 0.4
No response 1 0
n= 2121
It can be seen that the majority (three fifths of children) lived with married parents, and around a quarter of children's mothers were separated/divorced or classified themselves as 'never married' and a 'lone parent'.
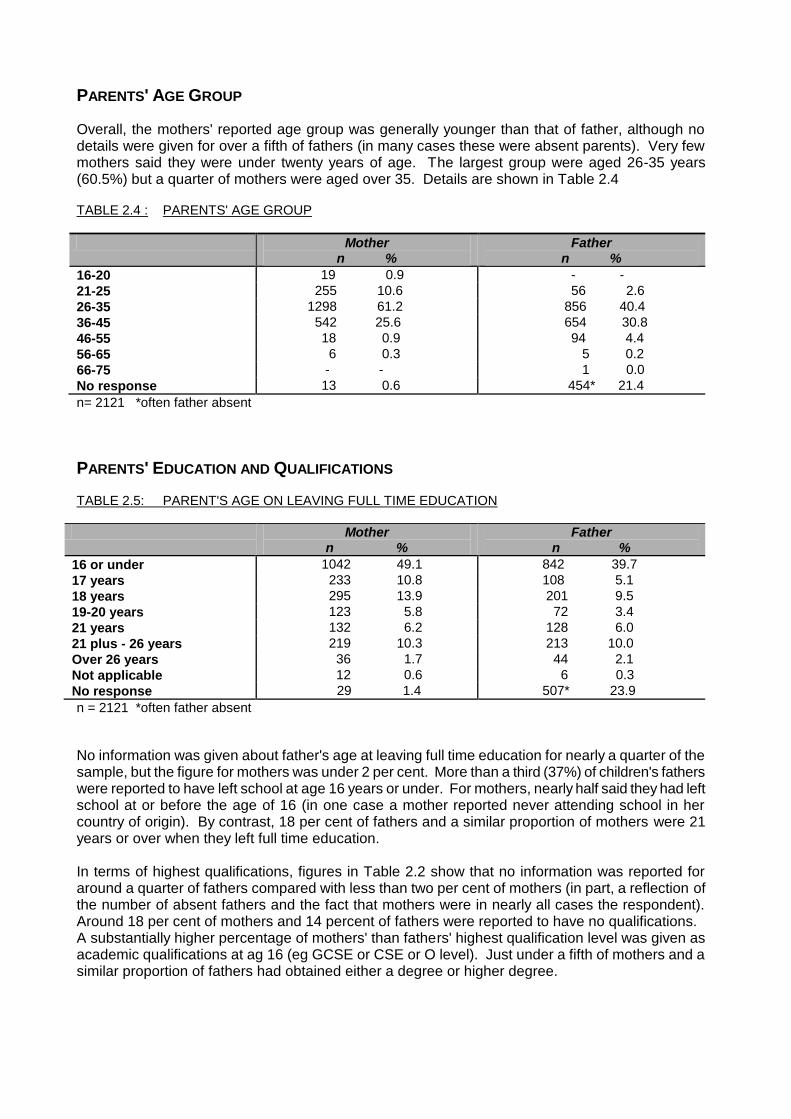
PARENTS' AGE GROUP
Overall, the mothers' reported age group was generally younger than that of father, although no details were given for over a fifth of fathers (in many cases these were absent parents). Very few mothers said they were under twenty years of age. The largest group were aged 26-35 years (60.5%) but a quarter of mothers were aged over 35. Details are shown in Table 2.4 TABLE 2.4 : PARENTS' AGE GROUP
Mother n %
Father n %
16-20 19 0.9 - -
21-25 255 10.6 56 2.6
26-35 1298 61.2 856 40.4
36-45 542 25.6 654 30.8
46-55 18 0.9 94 4.4
56-65 6 0.3 5 0.2
66-75 - - 1 0.0
No response 13 0.6 454* 21.4
n= 2121 *often father absent
PARENTS' EDUCATION AND QUALIFICATIONS TABLE 2.5: PARENT'S AGE ON LEAVING FULL TIME EDUCATION
Mother n %
Father n %
16 or under 1042 49.1 842 39.7
17 years 233 10.8 108 5.1
18 years 295 13.9 201 9.5
19-20 years 123 5.8 72 3.4
21 years 132 6.2 128 6.0
21 plus - 26 years 219 10.3 213 10.0
Over 26 years 36 1.7 44 2.1
Not applicable 12 0.6 6 0.3
No response 29 1.4 507* 23.9
n = 2121 *often father absent
No information was given about father's age at leaving full time education for nearly a quarter of the sample, but the figure for mothers was under 2 per cent. More than a third (37%) of children's fathers
were reported to have left school at age 16 years or under. For mothers, nearly half said they had left school at or before the age of 16 (in one case a mother reported never attending school in her country of origin). By contrast, 18 per cent of fathers and a similar proportion of mothers were 21 years or over when they left full time education. In terms of highest qualifications, figures in Table 2.2 show that no information was reported for around a quarter of fathers compared with less than two per cent of mothers (in part, a reflection of the number of absent fathers and the fact that mothers were in nearly all cases the respondent). Around 18 per cent of mothers and 14 percent of fathers were reported to have no qualifications. A substantially higher percentage of mothers' than fathers' highest qualification level was given as academic qualifications at ag 16 (eg GCSE or CSE or O level). Just under a fifth of mothers and a similar proportion of fathers had obtained either a degree or higher degree.
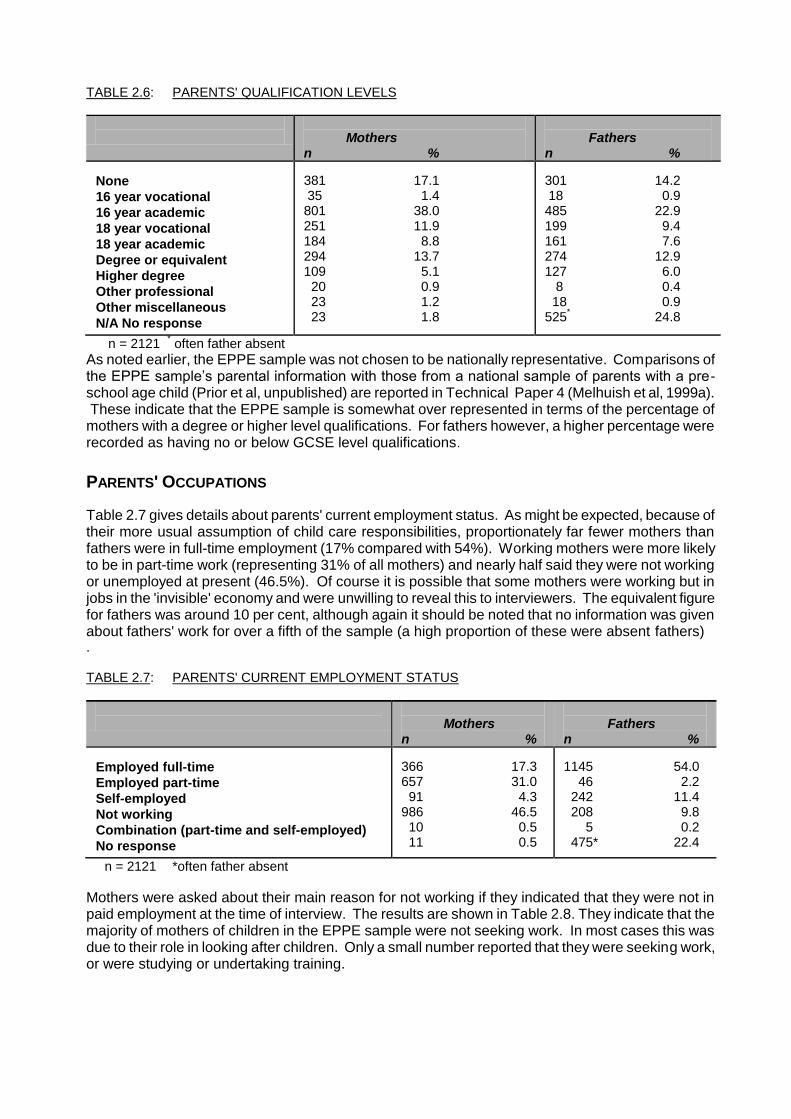
TABLE 2.6: PARENTS' QUALIFICATION LEVELS
Mothers n %
Fathers n %
None
16 year vocational
16 year academic
18 year vocational
18 year academic
Degree or equivalent
Higher degree
Other professional
Other miscellaneous
N/A No response
381 17.1 35 1.4 801 38.0 251 11.9 184 8.8 294 13.7 109 5.1 20 0.9 23 1.2 23 1.8
301 14.2 18 0.9 485 22.9 199 9.4 161 7.6 274 12.9 127 6.0 8 0.4 18 0.9 525
* 24.8
n = 2121 * often father absent
As noted earlier, the EPPE sample was not chosen to be nationally representative. Comparisons of the EPPE sample’s parental information with those from a national sample of parents with a pre-school age child (Prior et al, unpublished) are reported in Technical Paper 4 (Melhuish et al, 1999a). These indicate that the EPPE sample is somewhat over represented in terms of the percentage of mothers with a degree or higher level qualifications. For fathers however, a higher percentage were recorded as having no or below GCSE level qualifications.
PARENTS' OCCUPATIONS
Table 2.7 gives details about parents' current employment status. As might be expected, because of their more usual assumption of child care responsibilities, proportionately far fewer mothers than fathers were in full-time employment (17% compared with 54%). Working mothers were more likely to be in part-time work (representing 31% of all mothers) and nearly half said they were not working or unemployed at present (46.5%). Of course it is possible that some mothers were working but in jobs in the 'invisible' economy and were unwilling to reveal this to interviewers. The equivalent figure for fathers was around 10 per cent, although again it should be noted that no information was given about fathers' work for over a fifth of the sample (a high proportion of these were absent fathers) . TABLE 2.7: PARENTS' CURRENT EMPLOYMENT STATUS
Mothers n %
Fathers n %
Employed full-time
Employed part-time
Self-employed
Not working
Combination (part-time and self-employed)
No response
366 17.3 657 31.0 91 4.3 986 46.5 10 0.5 11 0.5
1145 54.0 46 2.2 242 11.4 208 9.8 5 0.2 475* 22.4
n = 2121 *often father absent
Mothers were asked about their main reason for not working if they indicated that they were not in paid employment at the time of interview. The results are shown in Table 2.8. They indicate that the majority of mothers of children in the EPPE sample were not seeking work. In most cases this was due to their role in looking after children. Only a small number reported that they were seeking work, or were studying or undertaking training.
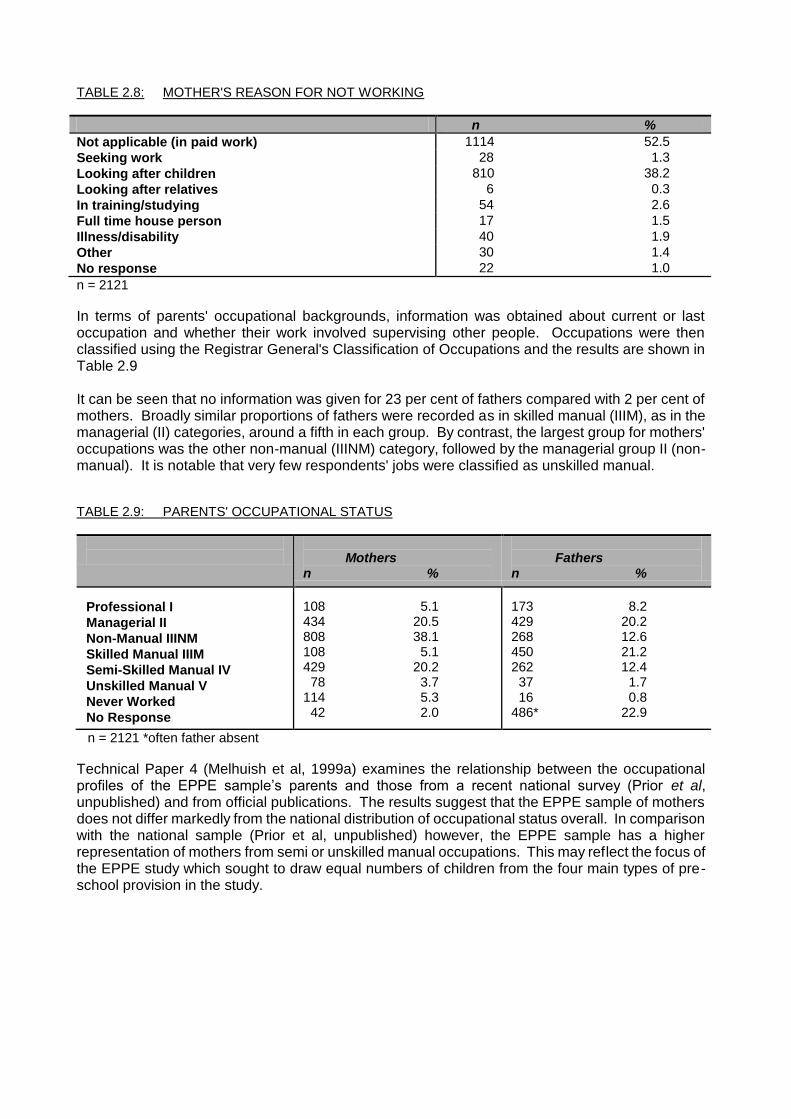
TABLE 2.8: MOTHER'S REASON FOR NOT WORKING
n %
Not applicable (in paid work) 1114 52.5
Seeking work 28 1.3
Looking after children 810 38.2
Looking after relatives 6 0.3
In training/studying 54 2.6
Full time house person 17 1.5
Illness/disability 40 1.9
Other 30 1.4
No response 22 1.0
n = 2121
In terms of parents' occupational backgrounds, information was obtained about current or last occupation and whether their work involved supervising other people. Occupations were then classified using the Registrar General's Classification of Occupations and the results are shown in Table 2.9 It can be seen that no information was given for 23 per cent of fathers compared with 2 per cent of mothers. Broadly similar proportions of fathers were recorded as in skilled manual (IIIM), as in the managerial (II) categories, around a fifth in each group. By contrast, the largest group for mothers' occupations was the other non-manual (IIINM) category, followed by the managerial group II (non-manual). It is notable that very few respondents' jobs were classified as unskilled manual. TABLE 2.9: PARENTS' OCCUPATIONAL STATUS
Mothers n %
Fathers n %
Professional I
Managerial II
Non-Manual IIINM
Skilled Manual IIIM
Semi-Skilled Manual IV
Unskilled Manual V
Never Worked
No Response
108 5.1 434 20.5 808 38.1 108 5.1 429 20.2 78 3.7 114 5.3 42 2.0
173 8.2 429 20.2 268 12.6 450 21.2 262 12.4 37 1.7 16 0.8 486* 22.9
n = 2121 *often father absent
Technical Paper 4 (Melhuish et al, 1999a) examines the relationship between the occupational profiles of the EPPE sample’s parents and those from a recent national survey (Prior et al, unpublished) and from official publications. The results suggest that the EPPE sample of mothers does not differ markedly from the national distribution of occupational status overall. In comparison with the national sample (Prior et al, unpublished) however, the EPPE sample has a higher representation of mothers from semi or unskilled manual occupations. This may reflect the focus of the EPPE study which sought to draw equal numbers of children from the four main types of pre-school provision in the study.

TYPE OF PRE-SCHOOL AND SOCIO-ECONOMIC BACKGROUND
An analysis of the educational and occupational backgrounds of the EPPE children's parents revealed evidence of significant differences according to type of pre-school attended. Clearly this in part reflects geographical access, knowledge, availability of places as well as parents' ability or willingness to pay for provision. Any comparisons of the impact of different types of pre-school provision on children's later attainment and progress need to acknowledge and control for differences in the characteristics of children entering different forms of pre-school provision. Table 2.10 illustrates the differences in terms of mothers' qualification levels for the four main types of provision. It can be seen that proportionately fewer mothers whose children attended a play group possessed a degree or higher level qualification (10.8%) than those whose children were at either a private day nursery (36.7%) or a local authority day nursery (17.9%). Also significantly fewer mothers of children in private nurseries reported that they had no qualifications (5.3%) compared with those whose children attended Local Authority day nurseries (27.6%). (Of course these differences tend to reflect the purposes of Local Authority nurseries which tend to give priority places to 'at risk' and disadvantaged groups, but may also have places for other categories such as teachers' children). TABLE 2.10: MOTHERS' QUALIFICATIONS BY TYPE OF PRE-SCHOOL CENTRE
Highest Qualification Level
Nursery Class n %
Playgroup n %
Private Nursery n %
Local Authority Day Nursery n %
None
130 22.2
108 17.9
27 5.3
116 27.6
16 year old vocational or
academic
264 45.1
290 48.0
163 31.8
119 28.3
18 year old vocational
67 11.6
77 12.8
42 8.2
65 15.5
18 year old academic
37 12.8
49 8.1
70 13.7
28 6.7
Degree or higher degree
75 13.2
65 10.8
188 36.7
75 17.9
Other
7 1.2
12 2.0
17 3.3
7 1.7
No response
5 0.9
3 0.5
5 1.1
10 2.4
n = 585
n = 604
n = 512
n = 420
The pattern of differences in parents' employment status between the different types of provision is also marked (see Table 2.11). Mothers with children in private nurseries, as might be expected, were more likely to be working full-time than other mothers. Likewise they were more likely to report fathers in full-time work. Mothers whose children were at playgroup were more likely to report not working (54.7%). It should be noted that more mothers of children in Local Authority Day nurseries worked full time (over a fifth) reflecting the policy of making a proportion of places available to parents who can pay for such provision in these centres. Under three in ten of fathers of children at Local Authority day nurseries were reported to be employed full-time (28.6%) and the no response figure was much higher for this group for fathers' (though not for mothers') employment status (46.1%), which is likely to reflect a significant difference in the proportion of absent fathers. The equivalent figures for no response regarding father's employment status were much lower for children attending either nursery classes or private day nurseries.
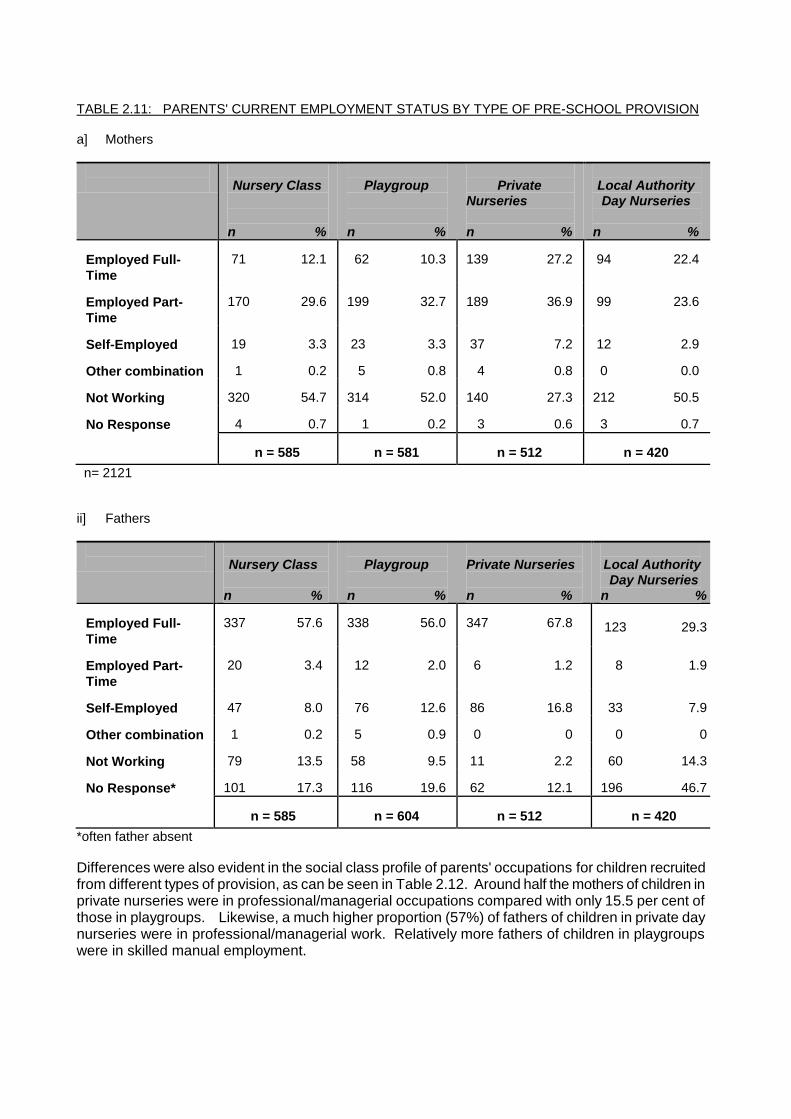
TABLE 2.11: PARENTS' CURRENT EMPLOYMENT STATUS BY TYPE OF PRE-SCHOOL PROVISION a] Mothers
Nursery Class n %
Playgroup n %
Private Nurseries n %
Local Authority Day Nurseries n %
Employed Full-
Time
71 12.1
62 10.3
139 27.2
94 22.4
Employed Part-
Time
170 29.6
199 32.7
189 36.9
99 23.6
Self-Employed
19 3.3
23 3.3
37 7.2
12 2.9
Other combination
1 0.2
5 0.8
4 0.8
0 0.0
Not Working
320 54.7
314 52.0
140 27.3
212 50.5
No Response
4 0.7
1 0.2
3 0.6
3 0.7
n = 585
n = 581
n = 512
n = 420
n= 2121 ii] Fathers
Nursery Class n %
Playgroup n %
Private Nurseries n %
Local Authority Day Nurseries n %
Employed Full-
Time
337 57.6
338 56.0
347 67.8
123 29.3
Employed Part-
Time
20 3.4
12 2.0
6 1.2
8 1.9
Self-Employed
47 8.0
76 12.6
86 16.8
33 7.9
Other combination
1 0.2
5 0.9
0 0
0 0
Not Working
79 13.5
58 9.5
11 2.2
60 14.3
No Response*
101 17.3
116 19.6
62 12.1
196 46.7
n = 585
n = 604
n = 512
n = 420
*often father absent
Differences were also evident in the social class profile of parents' occupations for children recruited from different types of provision, as can be seen in Table 2.12. Around half the mothers of children in private nurseries were in professional/managerial occupations compared with only 15.5 per cent of those in playgroups. Likewise, a much higher proportion (57%) of fathers of children in private day nurseries were in professional/managerial work. Relatively more fathers of children in playgroups were in skilled manual employment.
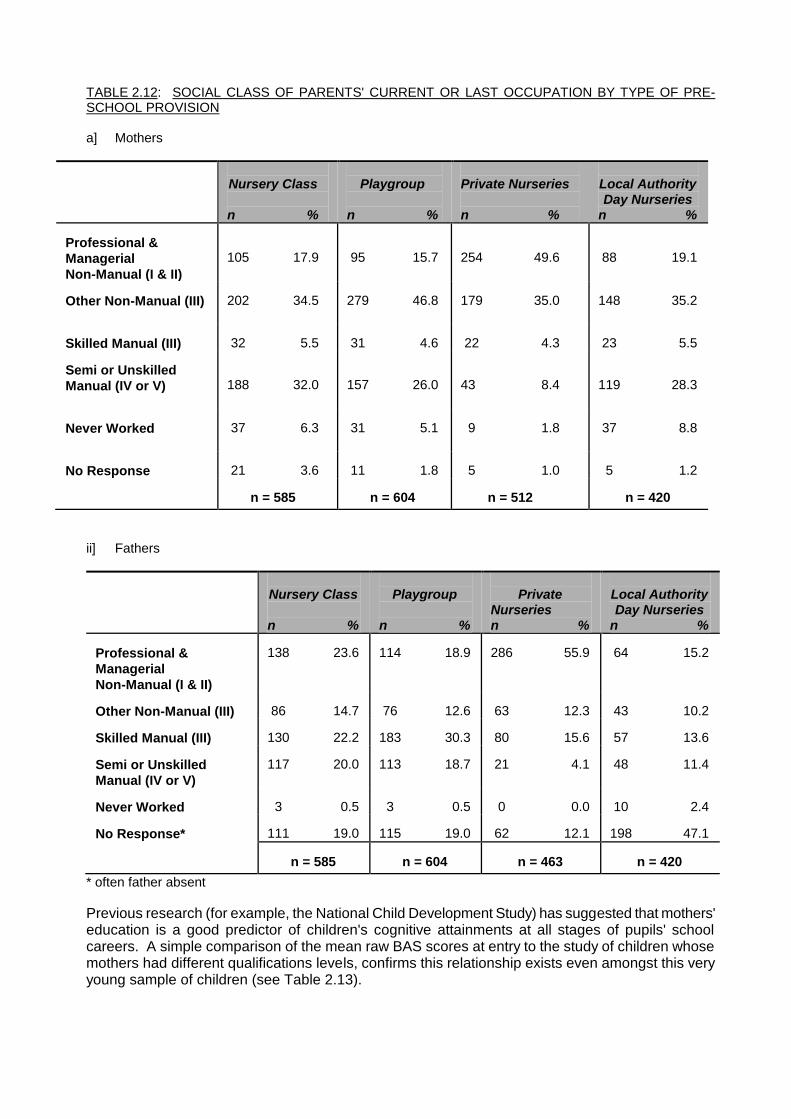
TABLE 2.12: SOCIAL CLASS OF PARENTS' CURRENT OR LAST OCCUPATION BY TYPE OF PRE-SCHOOL PROVISION a] Mothers
Nursery Class n %
Playgroup n %
Private Nurseries n %
Local Authority Day Nurseries n %
Professional &
Managerial
Non-Manual (I & II)
105 17.9
95 15.7
254 49.6
88 19.1
Other Non-Manual (III)
202 34.5
279 46.8
179 35.0
148 35.2
Skilled Manual (III)
32 5.5
31 4.6
22 4.3
23 5.5
Semi or Unskilled
Manual (IV or V)
188 32.0
157 26.0
43 8.4
119 28.3
Never Worked
37 6.3
31 5.1
9 1.8
37 8.8
No Response
21 3.6
11 1.8
5 1.0
5 1.2
n = 585
n = 604
n = 512
n = 420
ii] Fathers
Nursery Class n %
Playgroup n %
Private Nurseries n %
Local Authority Day Nurseries n %
Professional &
Managerial
Non-Manual (I & II)
138 23.6
114 18.9
286 55.9
64 15.2
Other Non-Manual (III)
86 14.7
76 12.6
63 12.3
43 10.2
Skilled Manual (III)
130 22.2
183 30.3
80 15.6
57 13.6
Semi or Unskilled
Manual (IV or V)
117 20.0
113 18.7
21 4.1
48 11.4
Never Worked
3 0.5
3 0.5
0 0.0
10 2.4
No Response*
111 19.0
115 19.0
62 12.1
198 47.1
n = 585
n = 604
n = 463
n = 420
* often father absent
Previous research (for example, the National Child Development Study) has suggested that mothers' education is a good predictor of children's cognitive attainments at all stages of pupils' school careers. A simple comparison of the mean raw BAS scores at entry to the study of children whose mothers had different qualifications levels, confirms this relationship exists even amongst this very young sample of children (see Table 2.13).
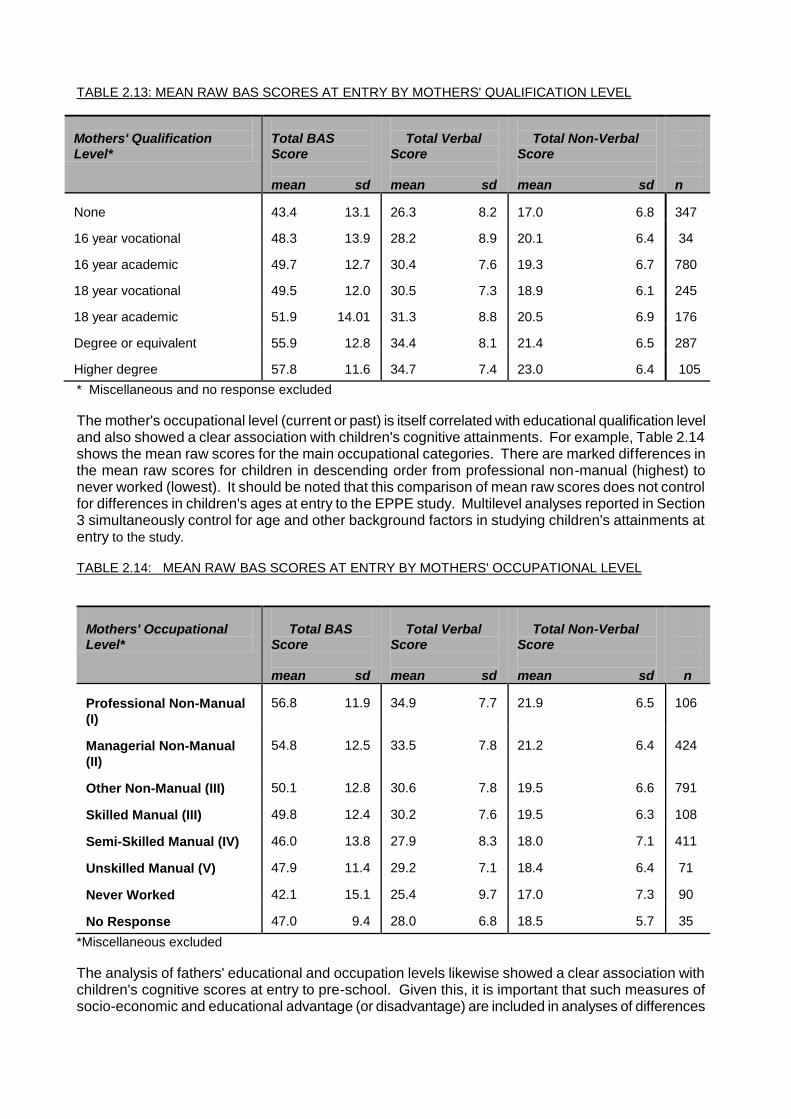
TABLE 2.13: MEAN RAW BAS SCORES AT ENTRY BY MOTHERS' QUALIFICATION LEVEL
Mothers' Qualification Level*
Total BAS Score mean sd
Total Verbal Score mean sd
Total Non-Verbal Score mean sd
n
None
43.4 13.1
26.3 8.2
17.0 6.8
347
16 year vocational
48.3 13.9
28.2 8.9
20.1 6.4
34
16 year academic
49.7 12.7
30.4 7.6
19.3 6.7
780
18 year vocational
49.5 12.0
30.5 7.3
18.9 6.1
245
18 year academic
51.9 14.01
31.3 8.8
20.5 6.9
176
Degree or equivalent
55.9 12.8
34.4 8.1
21.4 6.5
287
Higher degree
57.8 11.6
34.7 7.4
23.0 6.4
105
* Miscellaneous and no response excluded
The mother's occupational level (current or past) is itself correlated with educational qualification level and also showed a clear association with children's cognitive attainments. For example, Table 2.14 shows the mean raw scores for the main occupational categories. There are marked differences in the mean raw scores for children in descending order from professional non-manual (highest) to never worked (lowest). It should be noted that this comparison of mean raw scores does not control for differences in children's ages at entry to the EPPE study. Multilevel analyses reported in Section 3 simultaneously control for age and other background factors in studying children's attainments at entry to the study. TABLE 2.14: MEAN RAW BAS SCORES AT ENTRY BY MOTHERS' OCCUPATIONAL LEVEL
Mothers' Occupational Level*
Total BAS Score mean sd
Total Verbal Score mean sd
Total Non-Verbal Score mean sd
n
Professional Non-Manual
(I)
56.8 11.9
34.9 7.7
21.9 6.5
106
Managerial Non-Manual
(II)
54.8 12.5
33.5 7.8
21.2 6.4
424
Other Non-Manual (III)
50.1 12.8
30.6 7.8
19.5 6.6
791
Skilled Manual (III)
49.8 12.4
30.2 7.6
19.5 6.3
108
Semi-Skilled Manual (IV)
46.0 13.8
27.9 8.3
18.0 7.1
411
Unskilled Manual (V)
47.9 11.4
29.2 7.1
18.4 6.4
71
Never Worked
42.1 15.1
25.4 9.7
17.0 7.3
90
No Response
47.0 9.4
28.0 6.8
18.5 5.7
35
*Miscellaneous excluded
The analysis of fathers' educational and occupation levels likewise showed a clear association with children's cognitive scores at entry to pre-school. Given this, it is important that such measures of socio-economic and educational advantage (or disadvantage) are included in analyses of differences
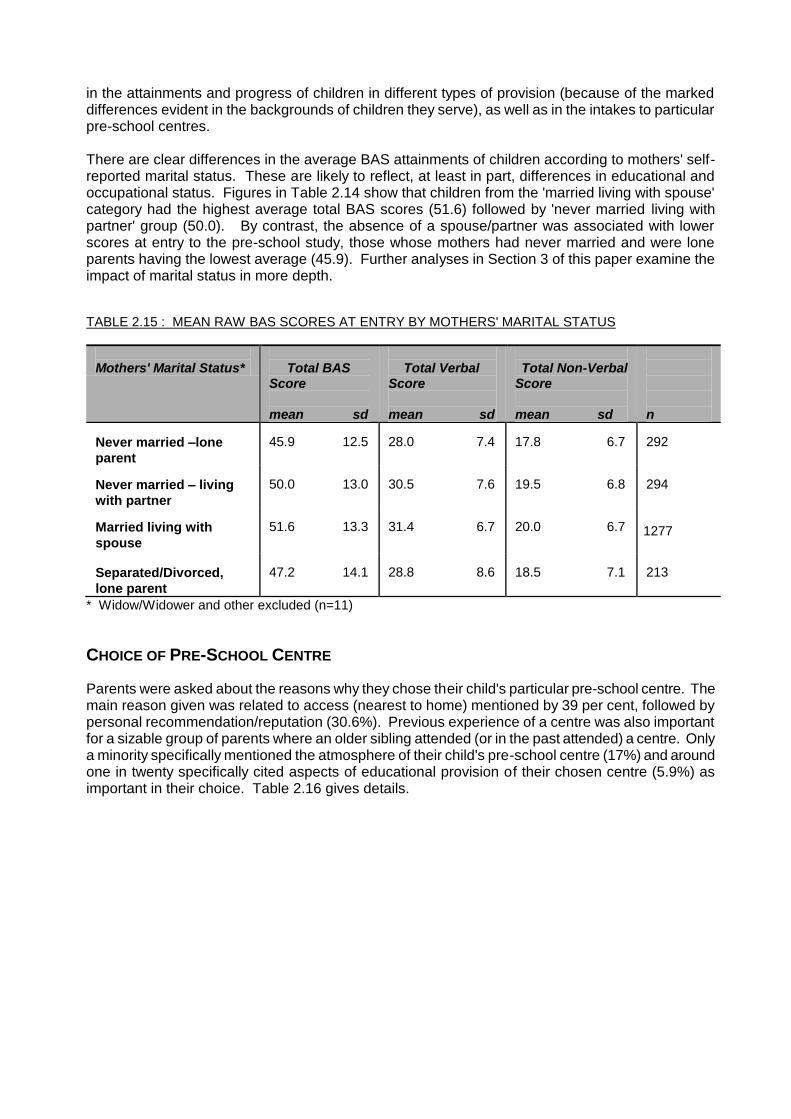
in the attainments and progress of children in different types of provision (because of the marked differences evident in the backgrounds of children they serve), as well as in the intakes to particular pre-school centres. There are clear differences in the average BAS attainments of children according to mothers' self-reported marital status. These are likely to reflect, at least in part, differences in educational and occupational status. Figures in Table 2.14 show that children from the 'married living with spouse' category had the highest average total BAS scores (51.6) followed by 'never married living with partner' group (50.0). By contrast, the absence of a spouse/partner was associated with lower scores at entry to the pre-school study, those whose mothers had never married and were lone parents having the lowest average (45.9). Further analyses in Section 3 of this paper examine the impact of marital status in more depth. TABLE 2.15 : MEAN RAW BAS SCORES AT ENTRY BY MOTHERS' MARITAL STATUS
Mothers' Marital Status*
Total BAS Score mean sd
Total Verbal Score mean sd
Total Non-Verbal Score mean sd sd
n
Never married –lone
parent
45.9 12.5
28.0 7.4
17.8 6.7
292
Never married – living
with partner
50.0 13.0
30.5 7.6
19.5 6.8
294
Married living with
spouse
51.6 13.3
31.4 6.7
20.0 6.7
1277
Separated/Divorced,
lone parent
47.2 14.1
28.8 8.6
18.5 7.1
213
* Widow/Widower and other excluded (n=11)
CHOICE OF PRE-SCHOOL CENTRE
Parents were asked about the reasons why they chose their child's particular pre-school centre. The main reason given was related to access (nearest to home) mentioned by 39 per cent, followed by personal recommendation/reputation (30.6%). Previous experience of a centre was also important for a sizable group of parents where an older sibling attended (or in the past attended) a centre. Only a minority specifically mentioned the atmosphere of their child's pre-school centre (17%) and around one in twenty specifically cited aspects of educational provision of their chosen centre (5.9%) as important in their choice. Table 2.16 gives details.

TABLE 2.16 : REASONS GIVEN FOR CHOOSING THEIR CHILD'S PRE-SCHOOL CENTRE
n % +
Nearest to home
833 39.3
Recommendation of others/reputation
648
30.6
Older sibling already attends/attended
624
29.4
Atmosphere
357
16.8
Educational environment
126
5.9
Type of place available (PT/FT)
53
2.5
Cost
51
2.4
Early age of entry possible
18
0.9
Other
313
14.8
* n = 2121 + it was possible to cite more than one reason therefore totals do not sum to 100 per cent.
There were variations according to type of pre-school provision in the reasons parents (respondents were nearly always mothers) gave for choosing a particular pre-school centre. For example, 46 per cent of those whose children attended private day nursery cited educational reasons for their choice compared with figures of 26 per cent for nursery classes, 18 per cent for play groups and under 10 per cent for Local Authority Day Nurseries. Atmosphere was also much more frequently cited by parents who chose a private day nursery. Previous experience through attendance of an older sibling was more commonly reported by parents whose children were in nursery classes (42%) or a play group (34%). Accessibility (nearness to home) was also more frequently cited by those with children in nursery classes (34%) and playgroups (28%). Recommendation/Reputation was equally cited by parents whose children attended playgroups, private day nurseries and Local Authority Day nurseries, but was less commonly reported by those with children in nursery classes.
SUMMARY
Section 2 of this paper provides some simple descriptive results of analyses of parent interview data for over 98 per cent (2121) of children in the EPPE sample at entry to the study. It demonstrates in terms of selected measures the existence of marked differences in the family characteristics of children attending different types of centres and the existence of significant associations between parents' educational and occupational levels and children's attainments at entry to pre-school. The findings also suggest that there are important variations in patterns of access to, and use of, different kinds of pre-school provision. These variations may have implications for policies concerned with the combatting of social disadvantage and exclusion. For example, the EPPE data suggest that for only a minority of families is the use of pre-school provision clearly associated with mothers' full-time participation in the labour market. This is likely to reflect a complex mix of choice, other child care commitments for siblings and the limitations imposed by the part-time and in some instances inflexible nature of much pre-school provision, as well as ability to pay for certain kinds of provision and geographical access to centres.

SECTION 3
Section 3 of this paper presents the results of multilevel analyses of the Effective Provision of Pre-School Education (EPPE) child sample at entry to pre-school education. These analyses seek to provide a contextualisation of children's initial cognitive attainments and social behavioural development as a baseline for later assessment of progress across the pre-school period. The analyses presented in this paper examine children’s scores in terms of the baseline cognitive assessments made at entry to pre-school centres (BAS scores) and measures of their social behavior derived from pre-school centre carers’ ratings using the Adaptive Social Behaviour Inventory (ASBI). The findings reported here provide important evidence concerning the impact of young children's personal, family and home environment characteristics at entry to the EPPE study.
THE ROLE OF MULTILEVEL MODELS
Multilevel models provide a method of exploring the extent of variation in children’s attainments (or other social or behavioural measures) which can be attributed to differences between individual children, and also the extent which such variation is related to differences between group attributes such as the area in which they live or the institution (in this case the pre-school centre) they attend.2
For the EPPE project multilevel models allow the variation in children’s entry assessments to be analyzed in terms of centre and child level variation. These models also allow the extent of differences related to particular child characteristics (e.g. age, gender, ethnic group, language background) to be explored. In addition, these models enable any systematic differences related to children's social and family characteristics. A variety of models were explored
child characteristics
parent characteristics
parent and child characteristics
home environment
pre-school experience (quantity)
final model (parent, child, home environment and pre-school experience)
RESULTS: OVERALL COGNITIVE ATTAINMENT
Two-level models (children grouped by pre-school centres) were employed for the analysis of EPPE baseline data. The multilevel models reported are based on a sample of 2059 children for whom full BAS data were collected, drawn from 114 pre-school centres In all,85 children were omitted due to missing total BAS scores, and two due to missing data relating to age at BAS or age at entry to their target centre. Details of the final model are shown in Appendix 2.1. In addition to the main analysis of total BAS score, multilevel models were also tested using total non-verbal score at entry to the study as the dependent variable. These models are based on a slightly larger sample (n=2099) because a small number of children (40) often with English as an additional language, only completed the two non-verbal baseline assessments. The results for the non-verbal analysis are reported separately in Appendix 2.2.
2 Multi-level models are a generalised form of regression analysis, particularly suited to the study of educational and social data exhibiting a hierarchical structure (Paterson and Goldstein, 1991, Golstein, 1995)
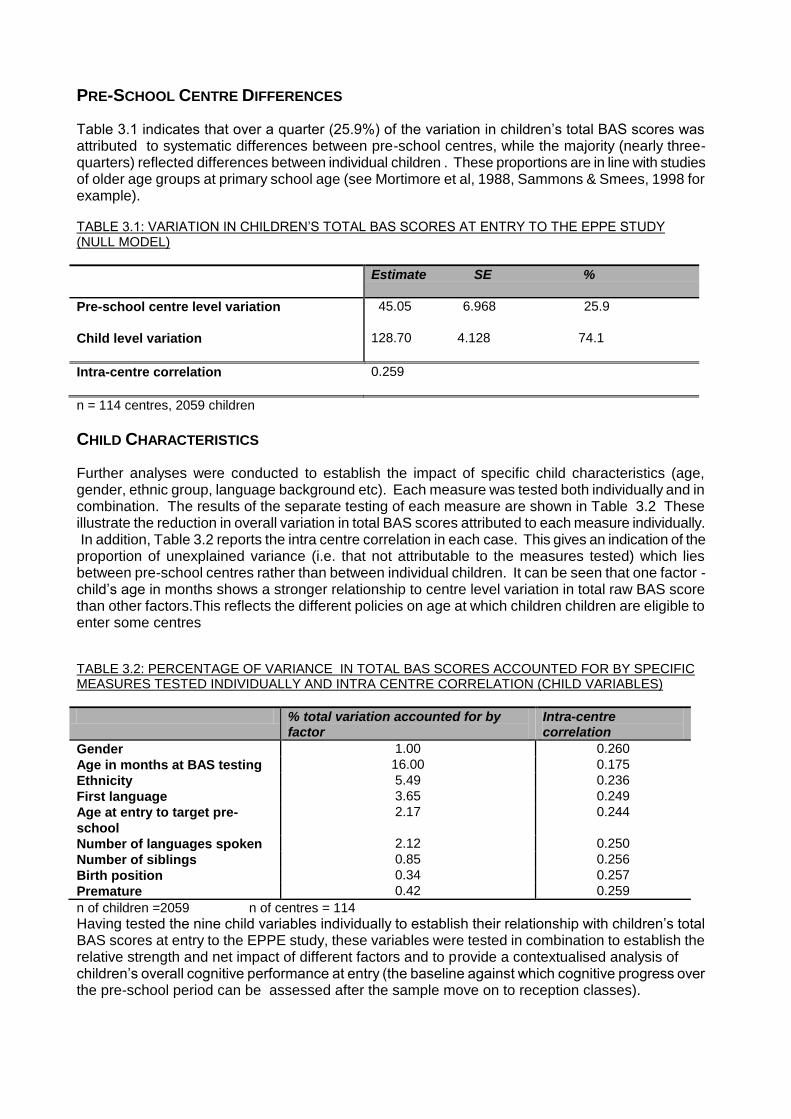
PRE-SCHOOL CENTRE DIFFERENCES
Table 3.1 indicates that over a quarter (25.9%) of the variation in children’s total BAS scores was attributed to systematic differences between pre-school centres, while the majority (nearly three-quarters) reflected differences between individual children . These proportions are in line with studies of older age groups at primary school age (see Mortimore et al, 1988, Sammons & Smees, 1998 for example). TABLE 3.1: VARIATION IN CHILDREN’S TOTAL BAS SCORES AT ENTRY TO THE EPPE STUDY (NULL MODEL)
Estimate SE %
Pre-school centre level variation
45.05 6.968 25.9
Child level variation
128.70 4.128 74.1
Intra-centre correlation
0.259
n = 114 centres, 2059 children
CHILD CHARACTERISTICS
Further analyses were conducted to establish the impact of specific child characteristics (age, gender, ethnic group, language background etc). Each measure was tested both individually and in combination. The results of the separate testing of each measure are shown in Table 3.2 These illustrate the reduction in overall variation in total BAS scores attributed to each measure individually. In addition, Table 3.2 reports the intra centre correlation in each case. This gives an indication of the proportion of unexplained variance (i.e. that not attributable to the measures tested) which lies between pre-school centres rather than between individual children. It can be seen that one factor - child’s age in months shows a stronger relationship to centre level variation in total raw BAS score than other factors.This reflects the different policies on age at which children children are eligible to enter some centres TABLE 3.2: PERCENTAGE OF VARIANCE IN TOTAL BAS SCORES ACCOUNTED FOR BY SPECIFIC MEASURES TESTED INDIVIDUALLY AND INTRA CENTRE CORRELATION (CHILD VARIABLES)
% total variation accounted for by factor
Intra-centre correlation
Gender 1.00 0.260
Age in months at BAS testing 16.00 0.175
Ethnicity 5.49 0.236
First language 3.65 0.249
Age at entry to target pre-
school
2.17 0.244
Number of languages spoken 2.12 0.250
Number of siblings 0.85 0.256
Birth position 0.34 0.257
Premature 0.42 0.259
n of children =2059 n of centres = 114
Having tested the nine child variables individually to establish their relationship with children’s total BAS scores at entry to the EPPE study, these variables were tested in combination to establish the relative strength and net impact of different factors and to provide a contextualised analysis of children’s overall cognitive performance at entry (the baseline against which cognitive progress over the pre-school period can be assessed after the sample move on to reception classes).

Table 3.3 summarises the results of testing each of these child characteristics simultaneously using total BAS score as the outcome (dependent) measure. The key points emerging from this contextualised analysis are summarised below.
girls show significantly higher attainment in overall cognitive attainment when the impact of other factors is controlled.
older children also attain more highly than others (reflecting the known relationship between cognitive development and maturity). Age at BAS assessment has a marked impact on the estimate of pre-school centre level variation, reflecting differences between centres (and especially types of provision) of children's average age at entry.
children from large families (3 or more siblings) had significantly lower overall cognitive attainments at entry to pre-school, although birth position was not important when control for other measures was made.
pre-maturity (37 weeks or fewer at birth) showed a negative association with cognitive attainment when other child factors are included in the model.
older age at entry to the target pre-school also was found to have a significant negative impact when tested in combination with other child factors. 1
children whose first language is not English showed significantly lower overall cognitive attainments.
ethnic group also shows a significant relationship with cognitive performance. The groups with statistically significantly lower attainments in terms of total BAS score after control for other child characteristics are: Black African, and Pakistani. 2
1 As noted in the preliminary analyses reported in Section 1 when tested individually, older age at entry is associated with higher scores. However, it must be remembered that age at BAS assessment and age at entry to target pre-school are themselves correlated (r=0.689) because many children enter at age three years or over and are assessed within 10 weeks. When age at BAS assessment and other factors are controlled, the results of the child model indicate that older age at entry to the target pre-school is associated with lower scores: in other words, children who enter their target pre-school at a younger age show better cognitive attainments at age three plus than those who are relatively older at entry. This may indicate that earlier entry to pre-school can be associated with a beneficial impact on cognitive development. 2. However, it should be noted that no control has been make in this analysis for parents’ educational level or other socio-economic factors known to impact on attainment (these will be discussed later in section 3).

TABLE 3.3: RESULTS OF THE MULTILEVEL ANALYSIS OF CHILD CHARACTERISTICS
Measures Tested Individually Tested in Combination
Age at BAS (centred around mean age)
+ +
Age at entry to target pre-school (centred around mean age)
+ -
Gender (compared with boys) + girls + girls
Ethnicity (compared with white UK) - black African - Indian - Pakistani - Mixed Heritage - Other
- black African - Pakistani
Number of languages spoken (compared with one)
- 2 or more ns
First language (compared with English)
- not English - not English
Number of siblings (compared with none)
- 3 or more - 3 or more
Birth position (compared with first) - 4 or later ns
Prematurity (compared with full term) - Premature (37weeks gestation or less)
- premature
+ statistically significant positive relationship p<0.05 - statistically significant negative relationship p<0.05 ns not significant
The inclusion of child characteristics accounted for over a quarter (27.1 per cent) of the total variation in children’s total BAS scores at entry as can be seen in Table 3.4. In terms of the variation between pre-school centres in children’s total BAS scores the model accounted for nearly two thirds of the centre-level variation (64.7%). These results are in line with those identified in studies of primary schools and demonstrate the vital importance of including information about the background characteristics of individual children in order that proper account is taken of pre-existing intake differences between pre-school centres and by type of provision before any comparisons of children's outcomes. TABLE 3.4: VARIATION IN CHILDREN'S TOTAL BAS SCORES AT ENTRY TO EPPE STUDY (CHILD MODEL)
Estimate SE
Pre school centre level
variation
15.89 2.965
Child level variation 110.80 3.552
Intra-Centre correlation 0.125
Reduction in total variance
27.08%
Reduction in centre level
variance
64.73%
n= 114 centres n=2059 children
Table 3.4 shows that the child characteristics model (reported in Tables 3.2 and 3.3) accounts for a significant percentage of the total variance in children's baseline BAS assessment at entry to the study. Controlling for the relationship between child variables and BAS scores has a particularly strong impact on the extent of centre-level variance accounted for, the intra-centre correlation for the child model being only 0.125

AMOUNT OF PRE-SCHOOL PROVISION EXPERIENCED
Further analyses were conducted to explore the impact of number of sessions attended by the child at their target pre-school centre on baseline scores. This model controlled for children's age at BAS assessment, number of sessions attended per week and age the child started at their target pre-school. The results indicated that children who had more pre-school experience (in terms of starting at a relatively young age in months) than average, and those who attended for a higher number of sessions a week had better cognitive attainments than others at entry to the study. There were no significant differences between those experiencing 7 to 9 or 10 sessions a week. However, those experiencing 4 to 6 sessions a week showed significantly lower attainments, and those experiencing only 2-3 sessions a week had the lowest attainments. TABLE 3.5 : VARIATION IN CHILDREN'S TOTAL BAS SCORES AT ENTRY TO EPPE STUDY (PRE SCHOOL EXPERIENCE MODEL)
Estimate SE
Pre-school centre level
variation
24.39 4.175
Child level variation 118.40 3.796
Intra centre correlation 0.1708
Reduction in total variance 17.82%
Reduction in centre variance 45.86%
n = 114 centres n = 2059 children

HOME ENVIRONMENT
A variety of measures relating to children's home environment were collected during the parent interview. Tables 3.6 and 3.7 shows the results from the multilevel testing of links between these and children's total BAS scores at entry to their target pre-school. The results suggest that items which show a statistically significant association with higher cognitive attainments relate to parents' involvement in pre-reading and reading related activities and to singing (eg. nursery rhymes, songs etc). Children whose parents often taught them songs, rhymes, letters/numbers, read to them frequently and took them to the library had significantly higher cognitive attainments at entry to the EPPE study (age 3+ to 4 years) than other children. It should be noted that this model does not control for parents' educational and occupational characteristics, further analyses are reported later which examine this aspect. TABLE 3.6 : PERCENTAGE OF VARIANCE IN TOTAL BAS SCORES ACCOUNTED FOR BY SPECIFIC MEASURES TESTED INDIVIDUALLY AND INTRA CENTRE CORRELATIONS (HOME ENVIRONMENT VARIABLES)
% total variance accounted for by factor
Intra-centre correlation
Regular bedtime 1.17 0.255
Rules for watching TV 0.93 0.258
Frequency watching TV ns not tested
Frequency child has friends home
to play
1.84 0.251
Frequency child plays with friends
elsewhere
1.13 0.255
Frequency child goes shopping
with parent
ns not tested
Frequency child visits friends with
parent
ns not tested
Frequency family meals 0.79 0.256
Frequency child read to by parent 6.95 0.238
Frequency child taken to library 10.99 0.246
Frequency child plays with
letter/numbers
1.73 0.266
Frequency child paints 1.29 0.255
Parents' emphasis on teaching
alphabet
4.05 0.250
Parents' emphasis on teaching
numbers
2.01 0.255
Parents' emphasis on teaching
songs, poems, nursery rhymes
5.50 0.242
The results in Table 3.7 show that although associated with a small effect when tested individually, aspects of the home environment related to rules, TV viewing and playing with friends did not show a significant link with overall cognitive attainment at entry to the study, when other factors are included in the multilevel model.

TABLE 3.7: RESULTS OF THE MULTI LEVEL ANALYSES OF HOME ENVIRONMENT CHARACTERISTICS
Tested Individually Tested in Combination
Regular bedtime - no ns
Rules for TV - no ns
Frequency of watching TV ns ns
Frequency child has friends to play at
home weekly (compared with less than once per week)
+ (1-4)
ns
Frequency child goes shopping with
parent (compared with less than once per week)
ns
not tested
Frequency child visits friends/relatives
with parents
ns not tested
Frequency child read to (compared with less than once a week)
+once a week +several times a week +daily +twice a week
+several times a week +daily +twice a week
Frequency go to library (compared with no visits)
+special occasions +once a month +once a fortnight +once a week
+special occasions +once a month +once a fortnight +once a week
Frequency letters/number played with (compared with none or less than once a week)
+ 1 - 4 times a week + 5 - 7 times a week
+ 5-7 times a week
Parent teaches alphabet (compared with none)
+some +a lot of emphasis
+1-4 times a week +5-7 times a week
Parent teaches numbers (compared with none)
+some +a lot of emphasis
ns
Parent teaches songs, poems, nursery
rhymes (compared with none)
+some +a lot of emphasis
+ a lot of emphasis
In combination the home environment measures accounted for a significant percentage (25.6%) of the total variance in children's BAS attainments at entry to the target pre-school, as can be seen in Table 3.8. TABLE 3.8: VARIATION IN CHILDREN'S TOTAL BAS SCORES AT ENTRY TO EPPE STUDY (HOME ENVIRONMENT MODEL)
Estimate SE
Pre school centre level variance 33.50 5.333
Child level variance 114.30 3.666
Intra-centre correlation
0.227
Reduction in total variance 25.64%
Reduction in centre level
variance
14.94%
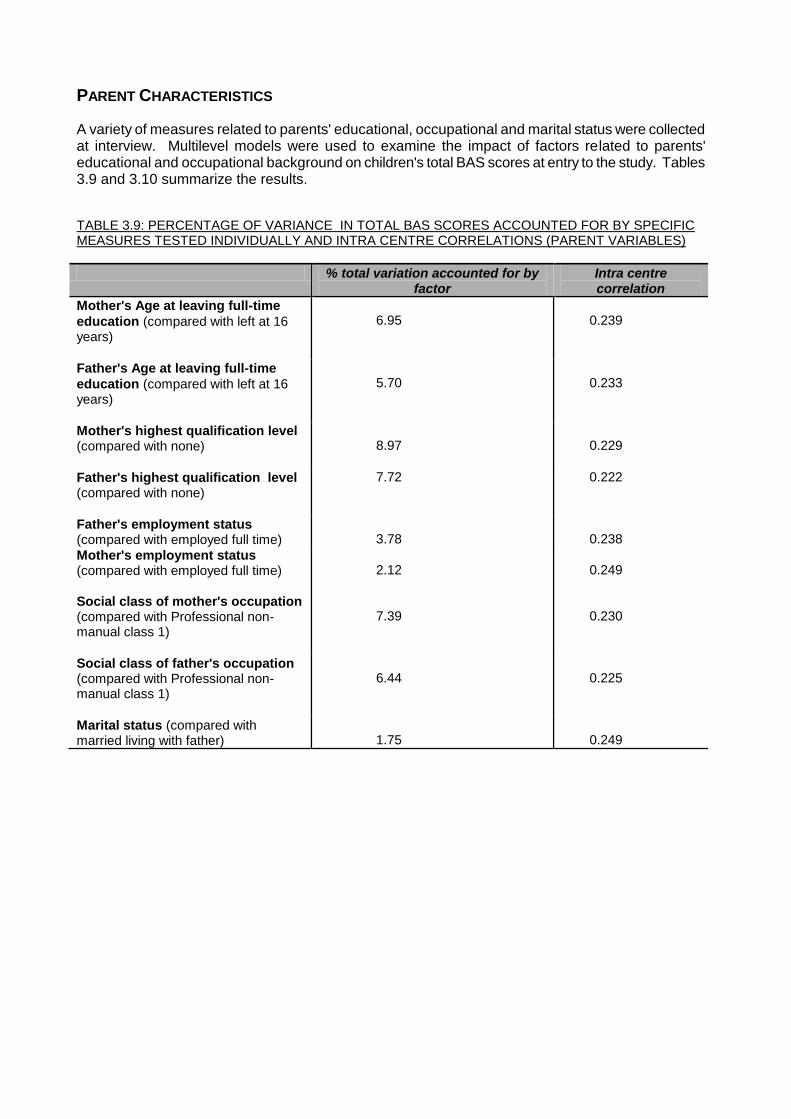
PARENT CHARACTERISTICS
A variety of measures related to parents' educational, occupational and marital status were collected at interview. Multilevel models were used to examine the impact of factors related to parents' educational and occupational background on children's total BAS scores at entry to the study. Tables 3.9 and 3.10 summarize the results. TABLE 3.9: PERCENTAGE OF VARIANCE IN TOTAL BAS SCORES ACCOUNTED FOR BY SPECIFIC MEASURES TESTED INDIVIDUALLY AND INTRA CENTRE CORRELATIONS (PARENT VARIABLES)
% total variation accounted for by factor
Intra centre correlation
Mother's Age at leaving full-time
education (compared with left at 16 years)
6.95
0.239
Father's Age at leaving full-time
education (compared with left at 16 years)
5.70
0.233
Mother's highest qualification level (compared with none)
8.97
0.229
Father's highest qualification level (compared with none)
7.72 0.222
Father's employment status (compared with employed full time)
3.78
0.238
Mother's employment status (compared with employed full time)
2.12
0.249
Social class of mother's occupation (compared with Professional non-manual class 1)
7.39
0.230
Social class of father's occupation (compared with Professional non-manual class 1)
6.44
0.225
Marital status (compared with married living with father)
1.75
0.249

TABLE 3.10: RESULTS OF MULTILEVEL ANALYSES OF PARENT CHARACTERISTICS
Tested Individually Tested in Combination
Mother's education (compared with left at age 16)
+All
removed from final model as mother's qualification a stronger relationship
Father's education (compared with left at age 16)
+All
removed from final model as mother's qualification a stronger relationship
Mother's qualification level (compared with none)
+All
+
Father's qualification level (compared with none)
+All
removed from final model as mother's qualification a stronger relationship
Mother's occupation (compared with employed full-time)
- not working/unemployed
ns
Father's occupation (compared with employed full-time)
- not working/unemployed
-
Social class of Mother's
occupation (compared with professional non manual class 1)
-
Removed from final model as father's social class a stronger relationship when mother's qualification included
Social class of Father’s
occupation (compared with professional non manual class 1)
-All
-
Marital status (compared with married living with father)
- single lone parent - separated/ divorced lone parent
ns
These demonstrate that the measures of parents' educational background (highest level of qualification) showed the strongest association with children's total BAS scores at entry to the project. Also the variables related to father's occupational status were better predictors than those related to mother's occupational status when mother's highest qualification was included in the combined model. It is notable that although parent's marital status showed a significant relationship when tested independently, it was not found to be a significant predictor of children's overall cognitive attainments at entry to pre-school when tested in combination. This suggests that lone parent status is less relevant than the impact of socio-economic factors such as parent's educational and occupational backgrounds. Due to the close associations between many of these measures only a limited set were retained in the final parent multilevel model. The final parent model indicated that, in combination, variables related to mother's highest level of qualification, father's employment status and father's social class of occupation accounted for a significant percentage of the total variance in children's total BAS scores at entry (11.1%) and over a quarter (25.8%) of the pre-school centre level variance. Children whose mother's had higher degrees or degree level qualifications showed the most advantage in performance, though all qualification levels except 16 year old vocational showed a positive relationship. By contrast, those whose fathers were not working/unemployed had significantly lower scores. The results suggest that children whose fathers were in semi or unskilled manual work also had poorer total BAS scores than those whose fathers were in professional or managerial occupations (Class I and II).

TABLE 3.11: VARIATION IN CHILDREN'S TOTAL BAS SCORES AT ENTRY TO EPPE STUDY (PARENT MODEL)
Estimate SE
Pre-school centre level variance 33.41 5.377
Child level variance 121.0 3.880
Intra-centre correlation 0.216
Reduction in total variance 11.03 %
Reduction in centre level variance 25.77 %
It can be seen that in comparison with the Home Environment Model the Parent Model accounts for less of the total variance but more of the centre level variance in children's total cognitive attainment at entry to the study. In order to establish the best contextualisation of children's baseline attainment at entry, further analyses were conducted to establish the impact of parent, child and home environment characteristics when analysed in combination.

PARENT AND CHILD CHARACTERISTICS
Multilevel analyses were used to explore the combined impact of child and parent characteristics simultaneously. The results indicated that 11 variables are statistically significant predictors of total cognitive attainments at entry to the study. The results are summarised in Table 3.12 TABLE 3.12: RESULTS OF MULTILEVEL ANALYSES OF PARENT AND CHILD VARIABLES
Child Measures Tested in Combination
Age at BAS in months +
Age at entry to target pre-school in months -
Gender (compared with boys) + girls
Ethnic group (compared with white UK) - Black African - Indian - Pakistani - Mixed Heritage
First language (compared with English) - not English
Number of siblings (compared with none) - (3 plus siblings)
Prematurity (compared with full term)
- (37 weeks or under)
Parent Measures
Mother's highest level of qualification (compared with none)
+ 16 academic + 18 vocational + 18 academic + Degree + Higher Degree + Other Professional + Other Misc.
Father's employment status (compared with employed FT)
- Self employed - Employed PT - Not working/ Unemployed
Social Class of Father's occupation (compared with Professional non manual class 1)
- Class III non-manual - Class IV semi skilled manual - Class V unskilled /manual
Number of sessions attended per week (compared with 10 sessions)
- 2-3 sessions per week
This combined model (Parent and Child) accounted for 39 percent of the total variance in children's total BAS scores at entry and over 90 per cent of the centre level variance (see Table 3.13). TABLE 3.13 : VARIATION IN CHILDREN'S TOTAL BAS SCORES AT ENTRY TO EPPE STUDY (PARENT AND CHILD MODEL)
Estimate SE
Pre-school centre level variance
4 .065 1 .303
Child level variance 101 .70 3 .257
Intra centre correlation 0 .0384 Reduction in total variance 39 .13% Reduction in centre level variance
91 .00%
THE FINAL MODEL - PARENT, CHILD AND HOME ENVIRONMENT
Further analyses were conducted to examine the combined impact of variables related to child and parent characteristics and measures of the home environment. The final model demonstrates that measures from each of these three main categories are statistically significant predictors of young children's total cognitive attainment at entry to the study. The combination of these three groups of explanatory variables achieves a statistically significantly better model fit and thus provide a better baseline contextualisation of cognitive attainment.
CHILD CHARACTERISTICS
Of the child variables, age at BAS assessment remained highly significant with older children showing higher scores. Also children's age at entry to the target pre-school remained significant with older age at entry showing a negative relationship, suggesting that taking account of other factors, (child, parent and home environment) earlier entry to pre-school may be associated with a beneficial impact upon cognitive development. The negative link between later age at entry and total BAS scores was not removed by the inclusion of socio-economic or home environment measures derived from the parental interviews. It should also be noted that type of pre-school centre was not significant in the model and thus this factor does not explain the relationship identified. After control for other factors the ethnic differences in attainment were much reduced, though children of Black African, Pakistan and Mixed heritage showed significantly lower total baseline scores than White children. Children whose first language was not English also had significantly lower attainments. However, it should be noted that in the comparable multilevel analysis of children’s
non verbal attainment at entry to the study, ethnic differences in cognitive scores are not statistically significant when other factors are controlled (see Appendix 2.2). This indicates that, for children of minority ethnic backgrounds, the verbal component of the BAS may be a less appropriate measure of cognitive abilities. There was a significant negative impact associated with prematurity, (children born at 37 weeks or below). Children from larger families (three or more siblings) also showed significantly lower total BAS scores. Gender was also found to have a significant link with total BAS scores, girls attaining higher scores than boys at entry to the study, controlling for other factors.
HOME ENVIRONMENT
A number of measures related to the home environment in the final model demonstrated an independent effect on young children's total BAS scores at entry to the study. Frequency with which parents reported reading to their child was significant, those who read twice a day showed the most positive impact, though reading daily or several times a week also showed a positive relationship in comparison with reading less than once a week. Reported frequency of taking the child to the library also had a significant positive effect, with weekly visits showing the strongest relationship. Children whose parents reported that their child frequently played with letters or numbers also showed higher scores, as did those who reported that they taught their children the alphabet, and those who taught a variety of songs (poems and nursery rhymes) to their children. It should be noted that the impact of
these aspects of the home environment remains significant after controlling for parents' education and occupational status.
PARENTS
Children whose mothers had higher qualification levels were at an advantage in terms of overall cognitive attainment at entry, as were those whose fathers were in professional or managerial work (Registrar General Classification Class l and II). By contrast, those whose fathers were not working had significantly lower attainments as did those whose father's work was classed as semi or unskilled manual (Class IV or V). This suggests that such measures of social disadvantage/advantage have an independent impact on children's cognitive attainment not attributable to differences in the home environment measures described above.
AMOUNT OF PRE-SCHOOL EXPERIENCE
The baseline models provide some evidence that children who attended for more sessions per week had higher cognitive attainment at entry than others. It should be remembered that a substantial number of children (70%) entered their target pre-school at age 30 months or under. This suggests that, having controlled for other factors (child, family and home environment) children who have a greater amount of pre-school experience (attending for more sessions) appear to have higher cognitive scores at entry and is in line with the findings concerning age at start at the target pre-school. The final multilevel model demonstrates that information relating to children's personal and family characteristics, their parents' educational and occupation status and their home environment show statistically significant relationships with overall cognitive attainments at entry to the study. The results are summarised in Table 3.14.
TYPE OF PRE-SCHOOL AND REGION
The multilevel model was extended to establish whether type of pre-school or region showed a relationship with cognitive performance after controlling for intake characteristics. The results showed no statistically significant impact for pre-school type or for region suggesting that good control for intake has been achieved. The final contextualised model should thus provide a sound basis for future study of children’s progress over the pre-school period. TABLE 3.14: VARIATION IN CHILDREN'S TOTAL BAS SCORES AT ENTRY TO EPPE STUDY (FINAL MODEL)
Estimate SE
Pre-school centre level
variance
4.236 1.275
Child level variance 94.680 3.034
Intra-centre correlation 0.043
Reduction in total variance 43.07 %
Reduction in centre level
variance
90.60 %
Table 3.14 shows that the combination of child, parent and home environment variables accounts for a substantial proportion of the total variance in children's total BAS scores at entry to the study (43.1%). Moreover, it is clear that, in terms of centre level variance, the model accounts for over 90 per cent of the differences between centres in children's achievement. This is important in ensuring that adequate control is made for differences between centres in their child intakes in later comparisons of children's progress.
SUMMARY AND CONCLUSIONS
The results of the multilevel analyses of the EPPE child sample’s assessments at entry to the study reveal the significant impact of background factors on cognitive attainment at entry. These have important implications for the promotion of equity in pre-school education and demonstrate the existence of powerful pre-existing inequalities in cognitive attainment at an early age (three to four years). There is evidence that gender, age (younger children) and a first language other than English were related to lower cognitive attainments at entry to the EPPE study. There was also some evidence of ethnic differences in overall cognitive attainment at entry, although these are much reduced when account is taken of differences in parents' educational and occupational backgrounds and
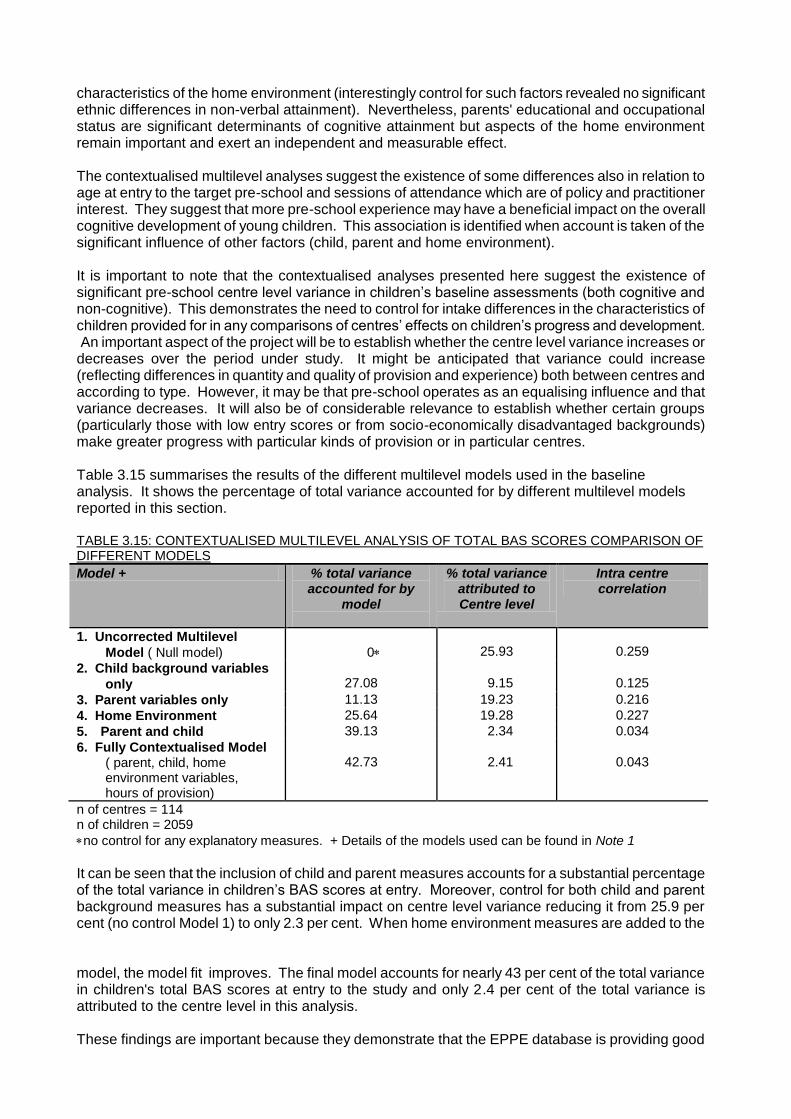
characteristics of the home environment (interestingly control for such factors revealed no significant ethnic differences in non-verbal attainment). Nevertheless, parents' educational and occupational status are significant determinants of cognitive attainment but aspects of the home environment remain important and exert an independent and measurable effect. The contextualised multilevel analyses suggest the existence of some differences also in relation to age at entry to the target pre-school and sessions of attendance which are of policy and practitioner interest. They suggest that more pre-school experience may have a beneficial impact on the overall cognitive development of young children. This association is identified when account is taken of the significant influence of other factors (child, parent and home environment). It is important to note that the contextualised analyses presented here suggest the existence of significant pre-school centre level variance in children’s baseline assessments (both cognitive and non-cognitive). This demonstrates the need to control for intake differences in the characteristics of children provided for in any comparisons of centres’ effects on children’s progress and development. An important aspect of the project will be to establish whether the centre level variance increases or decreases over the period under study. It might be anticipated that variance could increase (reflecting differences in quantity and quality of provision and experience) both between centres and according to type. However, it may be that pre-school operates as an equalising influence and that variance decreases. It will also be of considerable relevance to establish whether certain groups (particularly those with low entry scores or from socio-economically disadvantaged backgrounds) make greater progress with particular kinds of provision or in particular centres. Table 3.15 summarises the results of the different multilevel models used in the baseline analysis. It shows the percentage of total variance accounted for by different multilevel models reported in this section. TABLE 3.15: CONTEXTUALISED MULTILEVEL ANALYSIS OF TOTAL BAS SCORES COMPARISON OF DIFFERENT MODELS
Model + % total variance accounted for by
model
% total variance attributed to Centre level
Intra centre correlation
1. Uncorrected Multilevel
Model ( Null model)
0
25.93
0.259
2. Child background variables
only
27.08
9.15
0.125
3. Parent variables only 11.13 19.23 0.216
4. Home Environment 25.64 19.28 0.227
5. Parent and child 39.13 2.34 0.034
6. Fully Contextualised Model ( parent, child, home environment variables, hours of provision)
42.73
2.41
0.043
n of centres = 114 n of children = 2059
no control for any explanatory measures. + Details of the models used can be found in Note 1
It can be seen that the inclusion of child and parent measures accounts for a substantial percentage of the total variance in children’s BAS scores at entry. Moreover, control for both child and parent background measures has a substantial impact on centre level variance reducing it from 25.9 per cent (no control Model 1) to only 2.3 per cent. When home environment measures are added to the model, the model fit improves. The final model accounts for nearly 43 per cent of the total variance in children's total BAS scores at entry to the study and only 2.4 per cent of the total variance is attributed to the centre level in this analysis. These findings are important because they demonstrate that the EPPE database is providing good

control for relevant background characteristics of children at entry to the study. This suggests that subsequent analyses of any centre level variance in children’s later outcomes (i.e. at transfer to reception classes) can be interpreted securely in the knowledge that the baseline controls of intake differences are robust. Furthermore, the absence of significant differences according to type of pre-school provision or region, after control for child, parent and home background factors, likewise indicates that later comparisons of rates of children’s progress in different types of centre can be conducted in the knowledge that the impact of prior existing intake differences do not account for later variations in outcomes. The modeling strategy is of theoretical interest because it identifies and separates the relative contribution to young age (3 plus) children’s cognitive attainments at pre-school of a range of factors relating to child and family characteristics, parents' educational and occupational status, and measures of home environment.

NOTE 1 VARIABLES TESTED IN COMBINED MULTILEVEL MODELS
Model 1 (Null Model) No explanatory variables
Model 2 (Child Model) Child variables Age at BAS
Gender Ethnic group First Language
Age at entry to Pre-school Number of Siblings Pre-maturity
Model 3 (Parent Model) Parent variables Mother’s highest qualification level Social class of Father’s occupation Father's employment status
Model 4 (Home Environment Model) Home Environment variables Frequency parent reads to child Frequency child taken to library Frequency child plays with letters/numbers Parents' emphasis on teaching alphabet/letters Parents' emphasis on teaching songs/poems/nursery rhymes
Model 5 (Parent and Child Model) Parent and Child variables Age at BAS Gender Ethnic group First Language Mother’s qualification level Father’s employment status Social class of father's occupation
Age at entry to Pre-School Number of Siblings Pre-maturity
Model 6 Final Model Full Contextualised Model Child, parent and home environment variables as above Amount of provision (sessions per week)

REFERENCES Batra, S. (1999) Ethnic minority Achievement Grant Action Plan, Slough Borough Council Town Hall Slough SL1 3U4 Goldstein, H. (1995) Multilevel Statistical Models (2
nd Edition), London: Edward Arnold.
Melhuish et al (1999a) Parent, Family and Child Characteristics in Relation to Types of Pre-School and Socio-Economic Differences. The Effective Provision of Pre-school Education Project, Technical Paper 4. Institute of Education, University of London. Melhuish et al (1999b forthcoming). Social and behavioural development at 3-4 years in relation to family background. The Effective Provision of Pre-school Education Project, Technical Paper 7. Institute of Education, University of London. Mortimore, P. et al (1988) School Matters: The Junior Years, (republished Paul Chapman 1994) London, Open Books Paterson, L. & Goldstein, H. (1991) New statistical methods of analysing social structures : an introduction to multilevel models, British Educational Research Journal, 17, (4) : 387-393 Plewis, I. (1991) Pupils’ progress in reading and mathematics during primary school: Associations with ethnic groups and sex, Educational Research 33, 133-140 Prior, G., Courteney, G. & Charkin, E. (1999) Report on a survey of parents of three and four year olds. Unpublished report to DfES. Sammons, P. (1995) Gender, Ethnic and Socio-Economic Differences in Attainment and Progress: A longitudinal study of children’s achievement over 9 years. British Educational Research Journal. 21, 4, 465 - 485. Sammons, P. & Smees, R. (1998) Measuring Pupil Progress at Key Stage 1 : using baseline assessment to investigate value added, School Leadership & Management, 18, (3), 389 – 407. Slough Borough Council (1999) see Batra, 1999. Siraj-Blatchford, I. et al (1999) Contextualising the EPPE Project: Interviews with Local-Authority Co-ordinators and Centre Managers, Technical Paper 3. Institute of Education, University of London. Strand, S. (1999) Pupil background and Baseline Assessment results at age 4, Journal of Research in Reading, 22, 1, 14-26. Strand, S. (1999) Ethnic Group, Sex and Economic Disadvantage : Associations with pupils’ educational progress from Baseline to the end of Key Stage 1, British Educational Research Journal 25, 2, 179-202. Sylva, K. et al (1999) Introduction to the Effective Provision of Pre-School Education Project. The Effective Provision of Pre-school Education Project, Technical Paper 1. Institute of Education, University of London. Tymms, P., Morell, C. & Henderson, B. (1997) The first year of school : A quantitative investigation of the attainment and progress of pupils. Educational Research and Evaluation, 3, 101 – 118 Tymms, P. (1998) Opening a can of worms: a critical examination of age-standardised scores. British Journal of Curriculum and Assessment 8, 3, 21 - 25
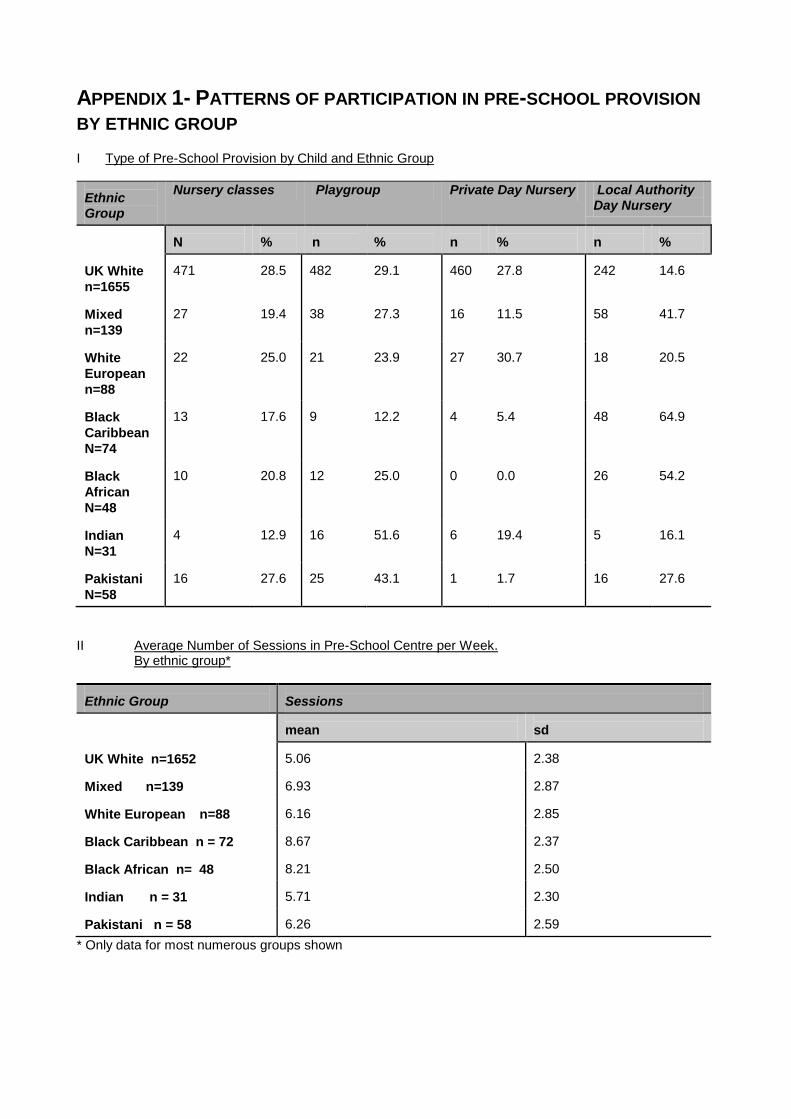
APPENDIX 1- PATTERNS OF PARTICIPATION IN PRE-SCHOOL PROVISION
BY ETHNIC GROUP I Type of Pre-School Provision by Child and Ethnic Group
Ethnic Group
Nursery classes Playgroup Private Day Nursery Local Authority Day Nursery
N
%
n
%
n
%
n
%
UK White
n=1655
471
28.5
482
29.1
460
27.8
242
14.6
Mixed
n=139
27
19.4
38
27.3
16
11.5
58
41.7
White
European
n=88
22
25.0
21
23.9
27
30.7
18
20.5
Black
Caribbean
N=74
13
17.6
9
12.2
4
5.4
48
64.9
Black
African
N=48
10
20.8
12
25.0
0
0.0
26
54.2
Indian
N=31
4
12.9
16
51.6
6
19.4
5
16.1
Pakistani
N=58
16
27.6
25
43.1
1
1.7
16
27.6
II Average Number of Sessions in Pre-School Centre per Week.
By ethnic group*
Ethnic Group
Sessions
mean
sd
UK White n=1652
5.06
2.38
Mixed n=139
6.93
2.87
White European n=88
6.16
2.85
Black Caribbean n = 72
8.67
2.37
Black African n= 48
8.21
2.50
Indian n = 31
5.71
2.30
Pakistani n = 58
6.26
2.59
* Only data for most numerous groups shown

APPENDIX 2.1 : THE FULL CONTEXTUALISED MODEL: TOTAL BAS
SCORE AT ENTRY
Random Parameter Matrix Estimate SE
Centre level variance 4.236 1.275 Child level variance 94.680 3.034
Fixed Effects
Intercept 40.330 2.29
Reading (compared with less than once a week) special occasions
4.928
2.62
once a week 4.130 2.183 several times week 2.910 1.760 daily 4.678* 1.763 twice daily 6.534* 1.900 reading frequency nk/no response 0.003 6.026
Library visits (compared with none) special occasions
0.414
0.179
once a month 2.537* 0.672 once a fortnight 2.609* 0.758 once a week 3.046* 0.787 nk/no response 2.348 9.893
Frequency child plays with letters/numbers (compared with never/ infrequently) 1-4 times per week
1.015
0.636
5-7 times per week 1.613* 0.711
Parents' emphasis on teaching alphabet (compared with no mention) some emphasis a lot of emphasis nk/no response
Parents' emphasis on teaching songs/ poems/
nursery rhymes (compared with no mention) some emphasis a lot of emphasis nk/no response
Child's age at BAS (centered around mean age)
Child's age at entry to target pre-school (centered around mean age)
Gender (compared with boys) girls
2.656* 0.705 2.905* 1.021 0.812 3.260
0.406 2.838* 0.362
0.974 0.995 13.59
1.546*
-1.107*
2.139*
0.085
0.032
0.444

APPENDIX 2.1: CONTINUED….. Fixed Effects Estimate SE
Ethnic Group (compared with White UK)
White European 0.486 1.254 Black Carribbean 1.250 1.315
Black African 3.223* 1.706 Black other 0.117 3.370 Indian 3.355 2.096 Pakistani 7.523* 2.159 Other 2.245 2.672 Mixed Heritage 2.452* 0.953
First Language (compared with English) Not English 6.489* 1.589
Number of Siblings (compared with none) 1-2 siblings 0.029 0.560 3 plus 2.638* 0.809
Pre-maturity (compared with full term) premature 1.585* 0.629 prematurely nk 3.937 5.188
Mother's highest level qualification (compared with none) 16 vocational 0.858 1.794 16 academic 3.094* 0.687 18 vocational 3.434* 0.863 18 academic 3.432* 1.005 degree 6.324* 0.975 higher degree 8.461* 1.339 Other Professional 4.528 2.34 Other Misc. 3.987 2.255 Qual. nk 2.693 2.259
Father's employment status (compared with employed full time) self employed 0.159 0.179 employed pt -2.712 1.650 not working/unemployed -2.190* 0.888 status nk -1.469 1.358
Social class of father's occupation (compared with professional non-manual) non manual II -0.081 0.969 skilled man III -1.380 1.082 semi-skilled man IV -3.113* 1.192 unskilled manual V -4.188* 2.048 social class nk -2.197 1.637
Number of sessions a week at pre-school centre (compared with 10 sessions) 7-9 sessions 1.224 1.412 4-6 sessions -1.307 0.695 2-3 sessions -2.156* 0.838 sessions nk -9.344 4.576 *p <0.05 n = 2059 children n = 114 centres
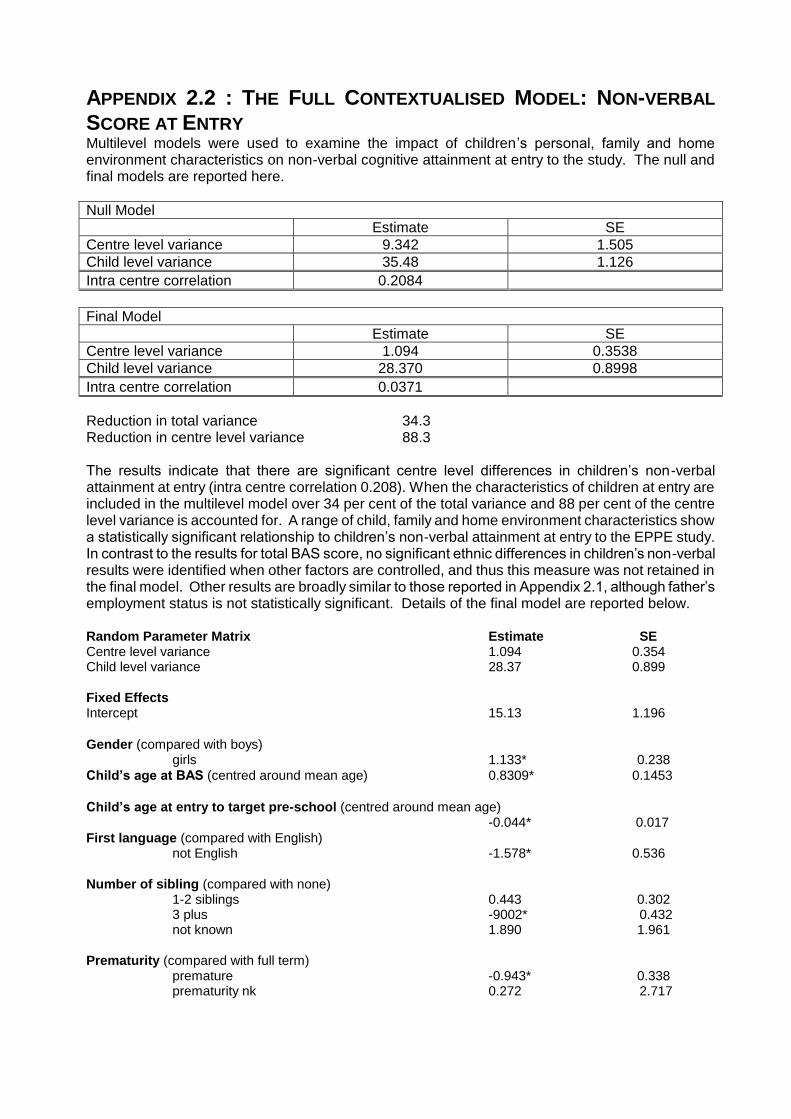
APPENDIX 2.2 : THE FULL CONTEXTUALISED MODEL: NON-VERBAL
SCORE AT ENTRY Multilevel models were used to examine the impact of children’s personal, family and home environment characteristics on non-verbal cognitive attainment at entry to the study. The null and final models are reported here.
Null Model
Estimate SE
Centre level variance 9.342 1.505
Child level variance 35.48 1.126
Intra centre correlation 0.2084
Final Model
Estimate SE
Centre level variance 1.094 0.3538
Child level variance 28.370 0.8998
Intra centre correlation 0.0371
Reduction in total variance 34.3 Reduction in centre level variance 88.3 The results indicate that there are significant centre level differences in children’s non-verbal attainment at entry (intra centre correlation 0.208). When the characteristics of children at entry are included in the multilevel model over 34 per cent of the total variance and 88 per cent of the centre level variance is accounted for. A range of child, family and home environment characteristics show a statistically significant relationship to children’s non-verbal attainment at entry to the EPPE study. In contrast to the results for total BAS score, no significant ethnic differences in children’s non-verbal results were identified when other factors are controlled, and thus this measure was not retained in the final model. Other results are broadly similar to those reported in Appendix 2.1, although father’s employment status is not statistically significant. Details of the final model are reported below. Random Parameter Matrix Estimate SE Centre level variance 1.094 0.354 Child level variance 28.37 0.899
Fixed Effects Intercept 15.13 1.196
Gender (compared with boys) girls 1.133* 0.238
Child’s age at BAS (centred around mean age) 0.8309* 0.1453
Child’s age at entry to target pre-school (centred around mean age) -0.044* 0.017
First language (compared with English) not English -1.578* 0.536
Number of sibling (compared with none) 1-2 siblings 0.443 0.302 3 plus -9002* 0.432 not known 1.890 1.961
Prematurity (compared with full term) premature -0.943* 0.338 prematurity nk 0.272 2.717

Mother’s highest qualification level (compared with none) 16 vocational 1.668 0.977 16 academic 1.585* 0.364 18 vocational 1.377* 0.462 18 academic 2.463* 0.533 degree 2.698* 0.517 higher degree 4.311* 0.715 other professional 2.835* 1.275 other misc. 1.086 1.225 qualification nk 2.217 1.229
Father's employment status (compared with employed full time) self employed 0.293 0.390 employed pt -0.969 0.949 not working/unemployed -0.688 0.466 status nk -0.664 0.736
Social class of father's occupation (compared with professional non-manual) non manual II -0.350 0.529 non manual lll -1.243* 0.610
skilled man III -0.384 0.587 semi-skilled man IV -1.139 0.644 unskilled manual V -1.717 1.087 Social class nk -0.904 0.881
Reading to child (compared to less than once a week) special occasions 2.362 1.310 once a week 2.111 1.109 several time per week 1.514* 0.880 daily 2.166* 0.869 twice daily 2.653* 0.951 reading frequently -2.414 3.022 nk/no response
Parent’s Emphasis on teaching numbers (compared with no mention) some emphasis 0.775 0.567 a lot of emphasis 1.492* 0.718 nk known / no response 0.731 2.294
Parent’s emphasis on teaching songs/poems/nursery rhymes (compared with no mention) some emphasis 0.423 0.515 a lot of emphasis 1.126* 0.527 nk / no response 1.701 4.093
Number of sessions per week at pre-school centre (compared with 10 sessions) 7-9 sessions 1.336 0.766 4-6 sessions -0.723* 0.359 2-3 sessions -1.406* 0.437 sessions nk -0.948 2.788 n of children = 2099 n of centres = 114 *p < 0.05 nk = not known

Ordering Information:
The Bookshop at the Institute of Education, 20, Bedford Way,
London, WC1H 0AL Telephone: 020 7612 6050 Facsimile: 020 7612 6407
Email: [email protected] website: www.johnsmith.co.uk/ioe
Price £8.50
Price £8.50
ISBN 0 85473592-5
Address for correspondence:
EPPE Project University of London Institute of Education 20 Bedford Way London WC1H 0AL
Tel: +44 (0) 207 612 6219 Fax: +44 (0) 207 612 6230
Email: [email protected]


![The Effective Provision of Pre-School Education … Effective Provision of Pre-School Education [EPPE] Project A Longitudinal Study funded by the DfEE (1997 – 2003) Ratios in Pre-School](https://static.fdocuments.in/doc/165x107/5acd1c5b7f8b9a875a8d6814/the-effective-provision-of-pre-school-education-effective-provision-of-pre-school.jpg)


![The Effective Provision of Pre-School Education [EPPE] Project · The Effective Provision of Pre-school Education (EPPE) project investigated the effects of pre-school education and](https://static.fdocuments.in/doc/165x107/5f022b4e7e708231d402ea2d/the-effective-provision-of-pre-school-education-eppe-project-the-effective-provision.jpg)