
June 19, 2016.docx with charts
22
Option Queen Letter By the Option Royals Jeanette Young , CFP ® , CFTe, CMT, M.S. 4305 Pointe Gate Drive Livingston, New Jersey 07039 www.OptnQueen.com [email protected] June 19, 2016 This past week, options went off the board without a hitch, the futures moved to the September expiry, and the FOMC acted as they were expected to (they did nothing). There was enough bad news out of Florida for a life-time. We can only hope that very tragic, horrific event\ will not trigger more copy-cat shootings. As to the horrible incident in at the Disney resort, there are no words to express the sadness of this incidence. The summer doldrums will be accented this week with the vote on Brexit which should cause a violent reaction on Thursday and probably Friday as well. We do not expect to see much action in the markets until this is sorted out, then, fasten your seat-belts. If we were smart we would buy both call and put options on the financials which, stand to feel either immense pain or immense joy. Alas, these options are costly and only one side will have any value. Perhaps the better strategy is to purchase options on companies tied to gold, maybe the miners. The metal tends to act as a currency and surely will react in the wake of Brexit. This is likely a less crowded, and hence a less expensive trade. Then again there might be no reaction….we doubt that. The S&P retreated just .50 handles (points) in the Friday session. What we see is a doji like candlestick on the chart. The market has not moved out of its range. All the indicators that we follow herein are issuing a buy-signal. The volume actually fell for the last part of the week hitting a peak on Tuesday the 14 th of June. The range is from 2022 to 2118.50 with the old high at 2128.75. The Bollinger Bands are contracting at this time. The Market Profile chart shows us that the range of the trade contracted in the Friday session. The most frequently traded prices were 2081 and 2077. The weekly chart shows a clear range bound market. All the indicators are issuing a sell-signal. The monthly chart shows the clearest picture of this range-bound market with an expansion of the lower levels. The indicators for the monthly chart are mixed, or diverging. The RSI is pointing lower, the stochastic indicator is curling over to the downside and our own indicator is pointing higher. What is obvious is the decrease in volume. It is quite likely that the market will back and fill until the announcement regarding Brexit on Thursday. Following this, , look for the volatility to spike.
-
Upload
scutify -
Category
Economy & Finance
-
view
2.872 -
download
0
Transcript of June 19, 2016.docx with charts

Option Queen Letter By the Option Royals
Jeanette Young, CFP®, CFTe, CMT, M.S.
4305 Pointe Gate Drive
Livingston, New Jersey 07039
www.OptnQueen.com
June 19, 2016
This past week, options went off the board without a hitch, the futures moved to the September
expiry, and the FOMC acted as they were expected to (they did nothing). There was enough bad
news out of Florida for a life-time. We can only hope that very tragic, horrific event\ will not
trigger more copy-cat shootings. As to the horrible incident in at the Disney resort, there are no
words to express the sadness of this incidence.
The summer doldrums will be accented this week with the vote on Brexit which should cause a
violent reaction on Thursday and probably Friday as well. We do not expect to see much action
in the markets until this is sorted out, then, fasten your seat-belts. If we were smart we would
buy both call and put options on the financials which, stand to feel either immense pain or
immense joy. Alas, these options are costly and only one side will have any value. Perhaps the
better strategy is to purchase options on companies tied to gold, maybe the miners. The metal
tends to act as a currency and surely will react in the wake of Brexit. This is likely a less
crowded, and hence a less expensive trade. Then again there might be no reaction….we doubt
that.
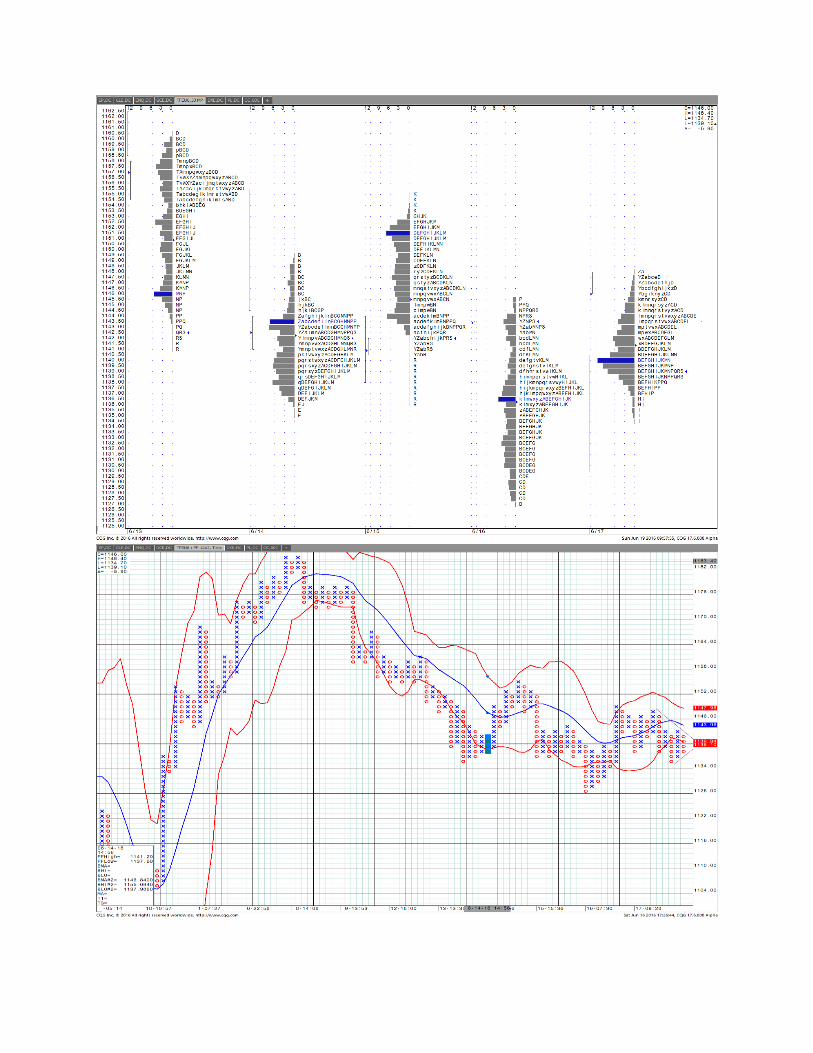
The S&P retreated just .50 handles (points) in the Friday session. What we see is a doji like
candlestick on the chart. The market has not moved out of its range. All the indicators that we
follow herein are issuing a buy-signal. The volume actually fell for the last part of the week
hitting a peak on Tuesday the 14th of June. The range is from 2022 to 2118.50 with the old high
at 2128.75. The Bollinger Bands are contracting at this time. The Market Profile chart shows us
that the range of the trade contracted in the Friday session. The most frequently traded prices
were 2081 and 2077. The weekly chart shows a clear range bound market. All the indicators are
issuing a sell-signal. The monthly chart shows the clearest picture of this range-bound market
with an expansion of the lower levels. The indicators for the monthly chart are mixed, or
diverging. The RSI is pointing lower, the stochastic indicator is curling over to the downside and
our own indicator is pointing higher. What is obvious is the decrease in volume. It is quite
likely that the market will back and fill until the announcement regarding Brexit on Thursday.
Following this, , look for the volatility to spike.


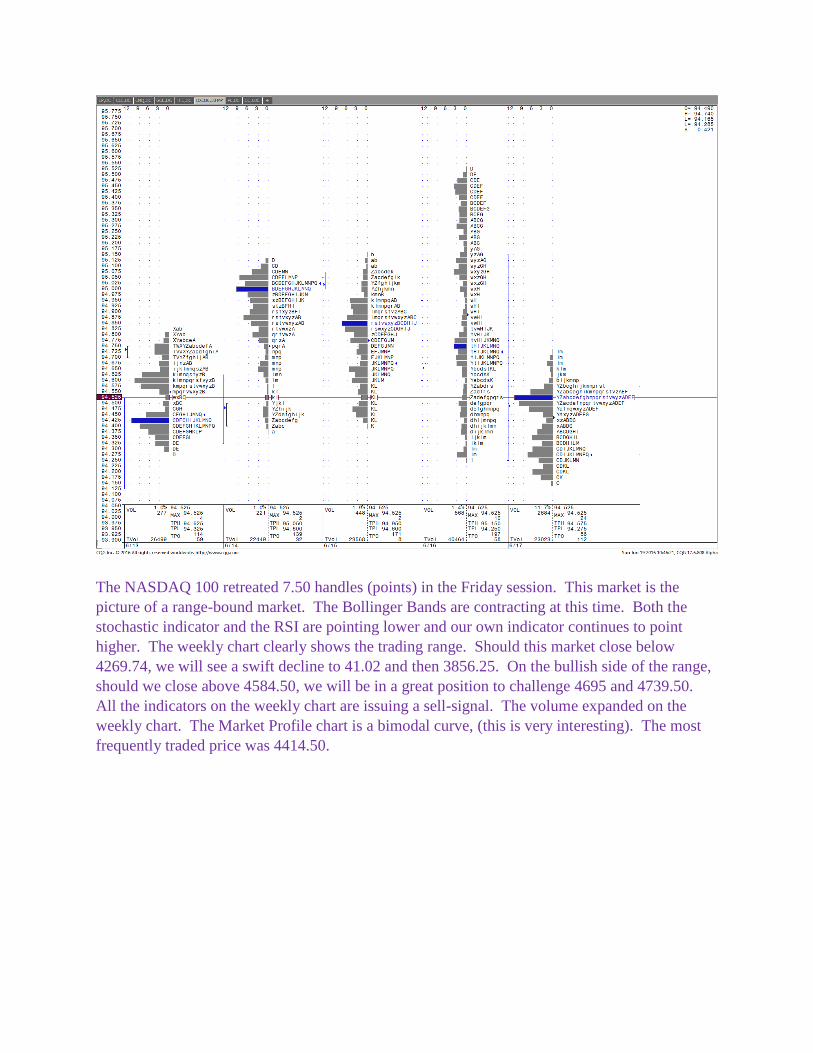
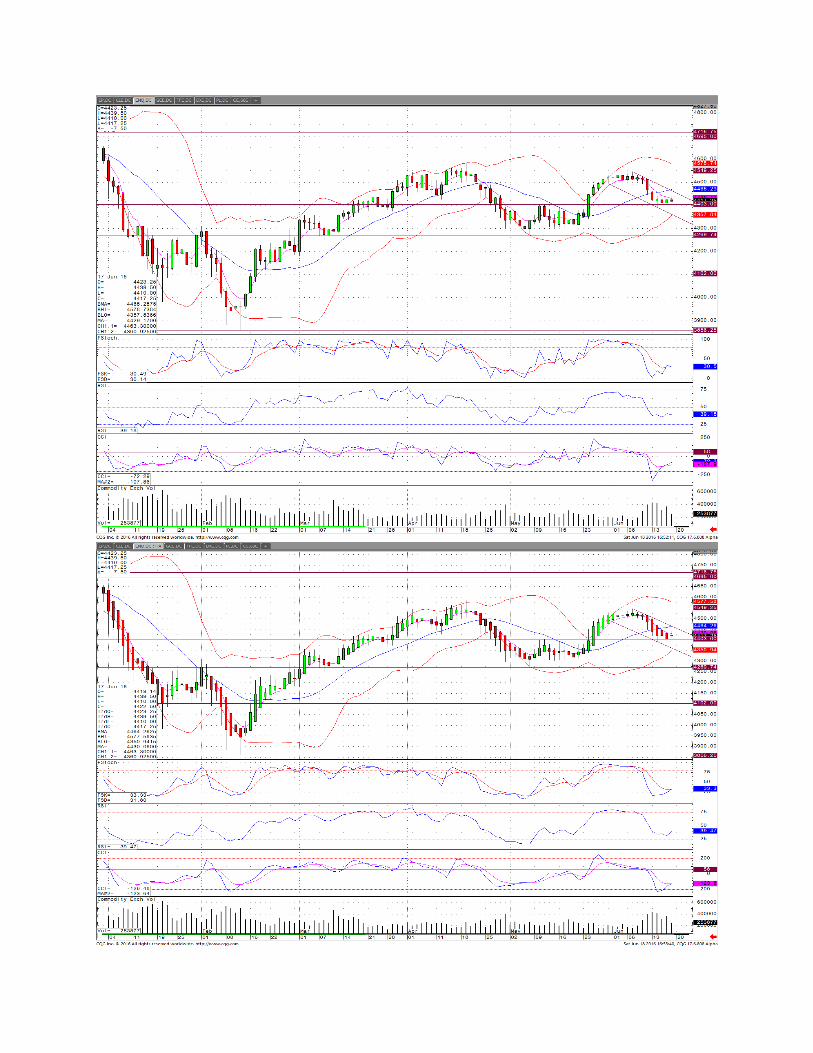
The NASDAQ 100 retreated 7.50 handles (points) in the Friday session. This market is the
picture of a range-bound market. The Bollinger Bands are contracting at this time. Both the
stochastic indicator and the RSI are pointing lower and our own indicator continues to point
higher. The weekly chart clearly shows the trading range. Should this market close below
4269.74, we will see a swift decline to 41.02 and then 3856.25. On the bullish side of the range,
should we close above 4584.50, we will be in a great position to challenge 4695 and 4739.50.
All the indicators on the weekly chart are issuing a sell-signal. The volume expanded on the
weekly chart. The Market Profile chart is a bimodal curve, (this is very interesting). The most
frequently traded price was 4414.50.
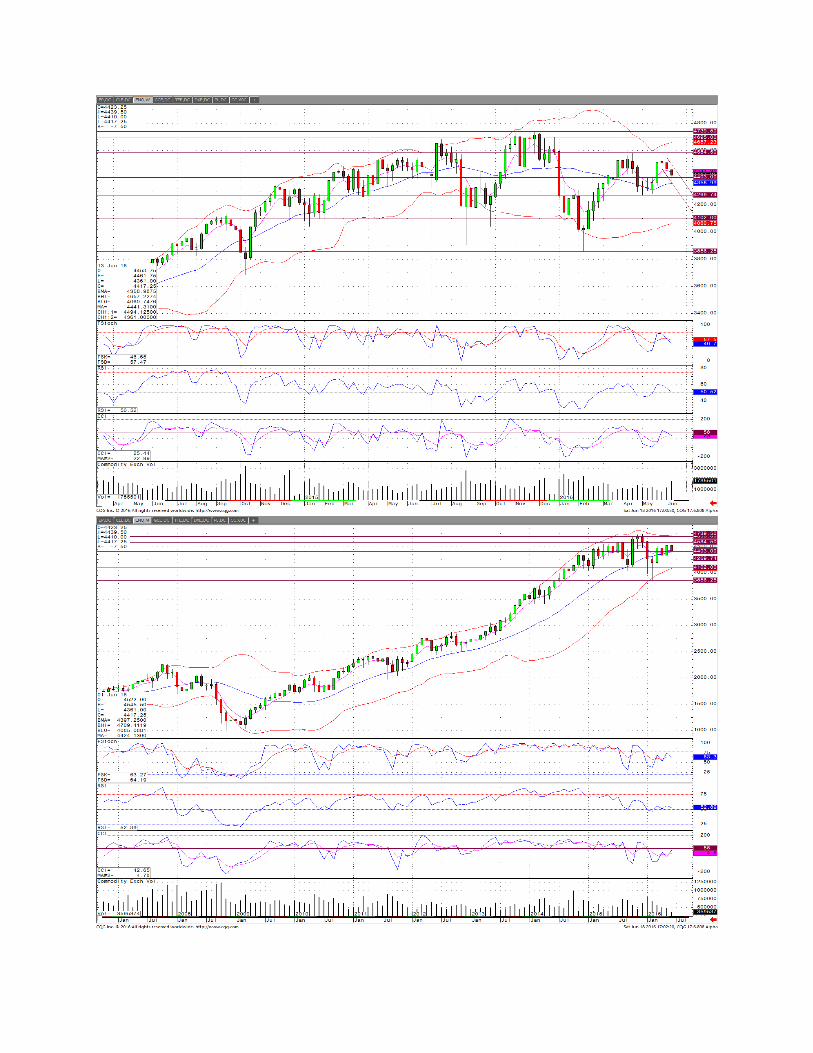
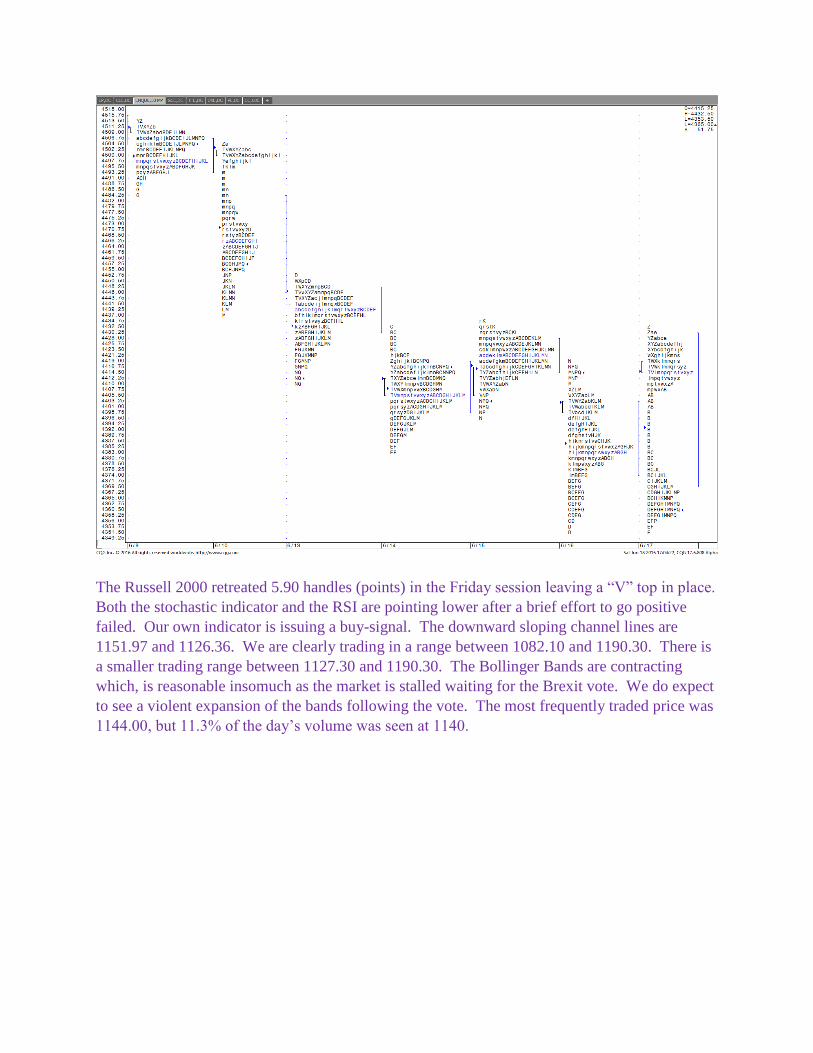
The Russell 2000 retreated 5.90 handles (points) in the Friday session leaving a “V” top in place.
Both the stochastic indicator and the RSI are pointing lower after a brief effort to go positive
failed. Our own indicator is issuing a buy-signal. The downward sloping channel lines are
1151.97 and 1126.36. We are clearly trading in a range between 1082.10 and 1190.30. There is
a smaller trading range between 1127.30 and 1190.30. The Bollinger Bands are contracting
which, is reasonable insomuch as the market is stalled waiting for the Brexit vote. We do expect
to see a violent expansion of the bands following the vote. The most frequently traded price was
1144.00, but 11.3% of the day’s volume was seen at 1140.


The US Dollar Index retreated in the Friday session losing 0.421 handles (points). Both the
stochastic indicator and the RSI continue to point lower, our own indicator is flattish but
positive. For the US Dollar to remain on the upside, it must stay above 94.16. The long term
downtrend line is 95.39. The most frequently traded price was 94.525 where 11.7% of the
volume was seen. The .10 by 3-box point and figure chart is very interesting and tells us that
94.20 is indeed an important level. The most recent target on the point and figure chart was 97.1
until you look at the 0.1% point and figure chart which has a target of 91.90. The 10 minute
Trade Flow chart tells us that by 11:30 the high was seen then light volume trading until 3:00
with a 20 minute bulge in volume then going nowhere fast into the close. The weekly chart
shows an index in a downtrend. That said a cross above 95.56 would open the door to 95.94,
97.50-98.43, 99.70 and 100.60.


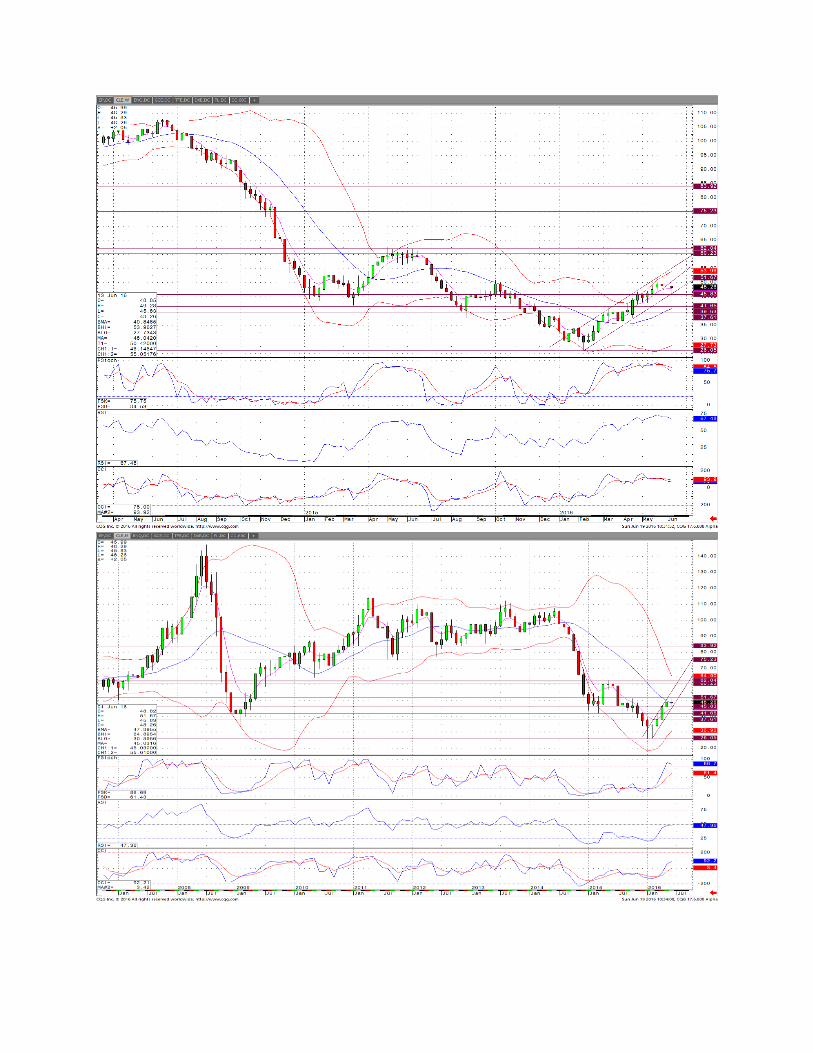
Crude Oil had a bullish engulfing candlestick on the chart as a result of the Friday session. Both
the stochastic indicator and the RSI are pointing higher with plenty of room to the upside. Our
own indicator is pointing lower. The biggest problem with the trade in the Friday session is that
the volume retreated slightly from that seen during the week. This market actually rallied for
most of the day session with a big thrust at about 2:15 taking the market higher, then another
thrust to the upside, but much smaller, at the close of trading. When we review the Heikin-Ashi
chart, the world looks a little different and not very bullish at all. That said, it could be turning
bullish but we will have to wait to see on that one. Both the weekly and the monthly chart are
bullish, but are at a point where they could fail. We continue to believe that 60-62 is likely. This
week was the second week with rig expansion rather than contraction, a good sign that things
might be turning around.

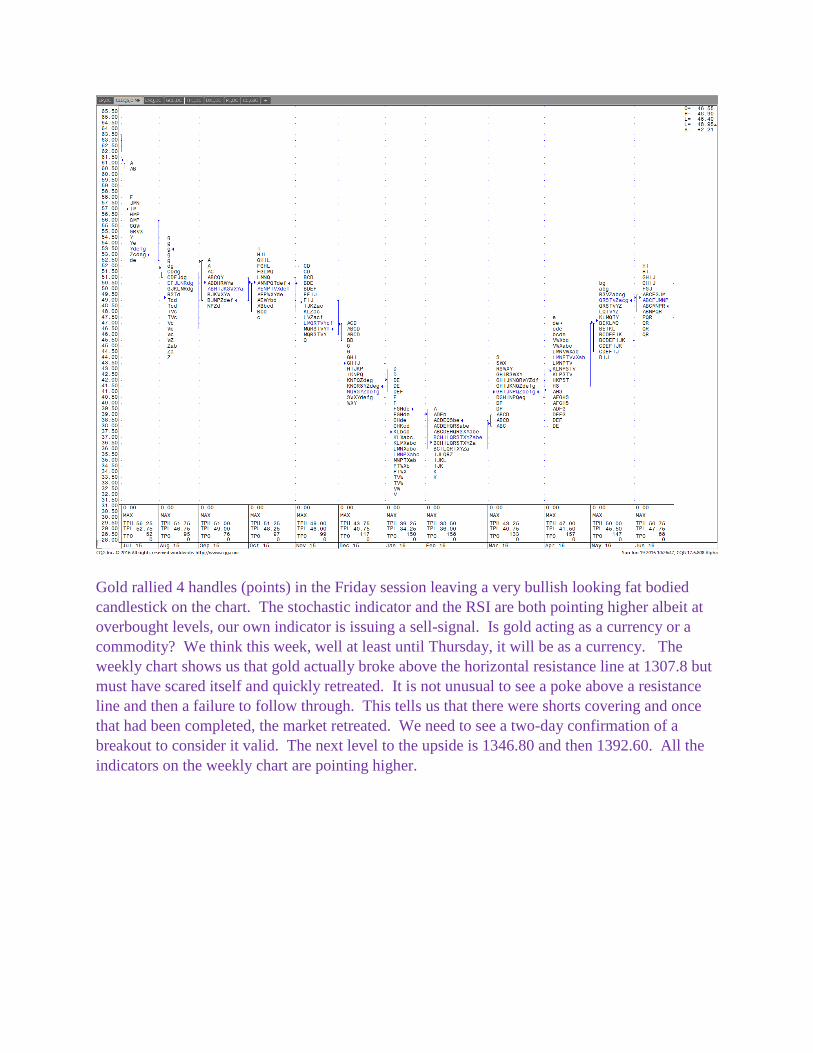
Gold rallied 4 handles (points) in the Friday session leaving a very bullish looking fat bodied
candlestick on the chart. The stochastic indicator and the RSI are both pointing higher albeit at
overbought levels, our own indicator is issuing a sell-signal. Is gold acting as a currency or a
commodity? We think this week, well at least until Thursday, it will be as a currency. The
weekly chart shows us that gold actually broke above the horizontal resistance line at 1307.8 but
must have scared itself and quickly retreated. It is not unusual to see a poke above a resistance
line and then a failure to follow through. This tells us that there were shorts covering and once
that had been completed, the market retreated. We need to see a two-day confirmation of a
breakout to consider it valid. The next level to the upside is 1346.80 and then 1392.60. All the
indicators on the weekly chart are pointing higher.


Risk
Trading futures, options on futures and retail off-exchange foreign currency transactions involves
substantial risk of loss and is not suitable for all investors.
Past performance is not necessarily indicative of future results.
Copywrite 2016 The Option Royals