July 21, 2011 Presented by: Thomas D. Skaggs, Ph.D., … WllTtfScale Shear Wall Tests for Force...
15
F ll S l Sh W ll T t f F ll S l Sh W ll T t f Full-Scale Shear Wall T ests for Force Transfer Around Openings Full-Scale Shear Wall T ests for Force Transfer Around Openings WoodWorks – Web-based Seminar WoodWorks – Web-based Seminar July 21, 2011 July 21, 2011 Presented by: Thomas D. Skaggs, Ph.D., P.E. AIA Statement “The Wood Products Council” is a Registered Provider with The AIA Statement The Wood Products Council is a Registered Provider with The American Institute of Architects Continuing Education Systems (AIA/CES). Credit(s) earned on completion of this program will be reported to AIA/CES for AIA members. Certificates of Completion for both AIA AIA/CES for AIA members. Certificates of Completion for both AIA members and non-AIA members are available upon request. This program is registered with AIA/CES for continuing professional education. As such, it does not include content that may be deemed or construed to be an approval or endorsement by the AIA of any material of construction or any method or manner of handling, using, distributing, or dealing in any material or product. Questions related to specific materials, methods, and services will be addressed at the conclusion of this presentation. AIA Learning Objectives AIA- Learning Objectives At the end of this program, participants will have: 1. Investigated past and current methods for determining force transfer around opening for wood shear walls 2. Compared the effects of different size of openings, size of full-height piers, and the relationships to the three industry standards for calculation of force and the relationships to the three industry standards for calculation of force transfer around openings 3. Observed how the study examines the internal forces generated by i i th f ll l ll t t reviewing the full-scale wall tests 4. Concluded that research results obtained from this study can be used to support different design methodologies in estimating the forces around the openings accurately. Research Overview Joint research project Research Overview Joint research project • The Engineered Wood Association • University of British Columbia (UBC), S ( ) Tom Skaggs & B.J. Yeh,APA - The Engineered Wood Association, USA F. Lam, University of British Columbia, CANADA • USDA Forest Products Laboratory (FPL) D. Rammer, J. Wacker, Forest Products Laboratory, USA Study was initiated in 2009 to: • Examine the variations of walls with code-allowable openings Examine the variations of walls with code allowable openings • Examines the internal forces generated during full-scale testing • Evaluate the effects of size of openings, size of full-height piers, and different construction techniques • Create analytical modeling to mimic testing data
Transcript of July 21, 2011 Presented by: Thomas D. Skaggs, Ph.D., … WllTtfScale Shear Wall Tests for Force...

F ll S l Sh W ll T t fF ll S l Sh W ll T t fFull-Scale Shear Wall Tests forForce Transfer Around Openings
Full-Scale Shear Wall Tests forForce Transfer Around Openings
WoodWorks – Web-based SeminarWoodWorks – Web-based Seminar
July 21, 2011July 21, 2011
Presented by: Thomas D. Skaggs, Ph.D., P.E.
AIA Statement
“The Wood Products Council” is a Registered Provider with The
AIA Statement
The Wood Products Council is a Registered Provider with The American Institute of Architects Continuing Education Systems (AIA/CES). Credit(s) earned on completion of this program will be reported to AIA/CES for AIA members. Certificates of Completion for both AIAAIA/CES for AIA members. Certificates of Completion for both AIA members and non-AIA members are available upon request.
This program is registered with AIA/CES for continuing professional p g g g peducation. As such, it does not include content that may be deemed or construed to be an approval or endorsement by the AIA of any material of construction or any method or manner of handling, using, distributing, or dealing in any material or product.
Questions related to specific materials, methods, and services will be paddressed at the conclusion of this presentation.
AIA Learning ObjectivesAIA-Learning Objectives
At the end of this program, participants will have:
1. Investigated past and current methods for determining force transfer around opening for wood shear walls
2. Compared the effects of different size of openings, size of full-height piers, and the relationships to the three industry standards for calculation of forceand the relationships to the three industry standards for calculation of force transfer around openings
3. Observed how the study examines the internal forces generated by i i th f ll l ll t treviewing the full-scale wall tests
4. Concluded that research results obtained from this study can be used to support different design methodologies in estimating the forces around the openings accurately.
Research Overview
Joint research project
Research Overview
Joint research project • The Engineered Wood Association• University of British Columbia (UBC),
S ( )
Tom Skaggs & B.J. Yeh,APA - The Engineered Wood Association, USAF. Lam, University of British Columbia, CANADA
• USDA Forest Products Laboratory (FPL)
D. Rammer, J. Wacker, Forest Products Laboratory, USA
Study was initiated in 2009 to:• Examine the variations of walls with code-allowable openingsExamine the variations of walls with code allowable openings• Examines the internal forces generated during full-scale testing• Evaluate the effects of size of openings, size of full-height piers,
and different construction techniques q• Create analytical modeling to mimic testing data

Research Overview
Study results will be used to:
Research Overview
Study results will be used to:• Support design methodologies in estimating the forces
around the openings Develop rational design methodologies for adoption in the• Develop rational design methodologies for adoption in the building codes
• Create new tools/methodology for designers to facilitate use of FTAOuse of FTAO
IntroductionIntroduction
Wood structural panel shear walls are the primary Wood structural panel shear walls are the primary lateral force resisting system for most light framed buildings
Architectural characteristics demand many large openings and limit available shear wallopenings and limit available shear wall
CBC/code supplements permit three solutions forCBC/code supplements permit three solutions for walls with openings Ignore openings (Segmented Shear)
E i i l A h (P f t d Sh AF&PA SDPWS) Empirical Approach (Perforated Shear AF&PA SDPWS) Rational Approach (Force Transfer Around Openings)
IntroductionIntroduction
Why use FTAOWhy use FTAO Architectural limitations
Lack of available shear wall lengthg Openings at critical locations Avoidance of specific wall sections
IntroductionIntroduction
Why use FTAOWhy use FTAO Value proposition
Reduction of more costly componentsy p Reduction in number of shear walls

FTAO Examples So. Ca. 18+ Sites: L A l O & S Di C tiLos Angeles, Orange & San Diego Counties TYPICAL FTAO APPLICAITONTYPICAL FTAO APPLICAITON
Random Survey September of 2010Random Survey September of 2010
Multi-Family y 40-90% of all shear applications utilized FTAO
Single FamilySingle-Family 80% Minimum 1-application on front or back elevation 70% Multiple applications on front, back or both 25% Side wall application in addition to front or back application
Residential - Segmented
ALL ELEVATIONS OF THIS PLAN HAVE FTAO APPLICATIONS
Residential - Segmented
FTAO
FTAO
ENTIRE ELEVATION OF THIS SINGLE FAMILY HAS FTAO

Residential - Segmented
FTAO
FTAO ATFTAO AT DOOR
FTAO
Residential - Segmented
FTAO
FTAO
Residential - Segmented
FTAO
FTAO
FTAOFTAO FTAO
Residential - Segmented
19
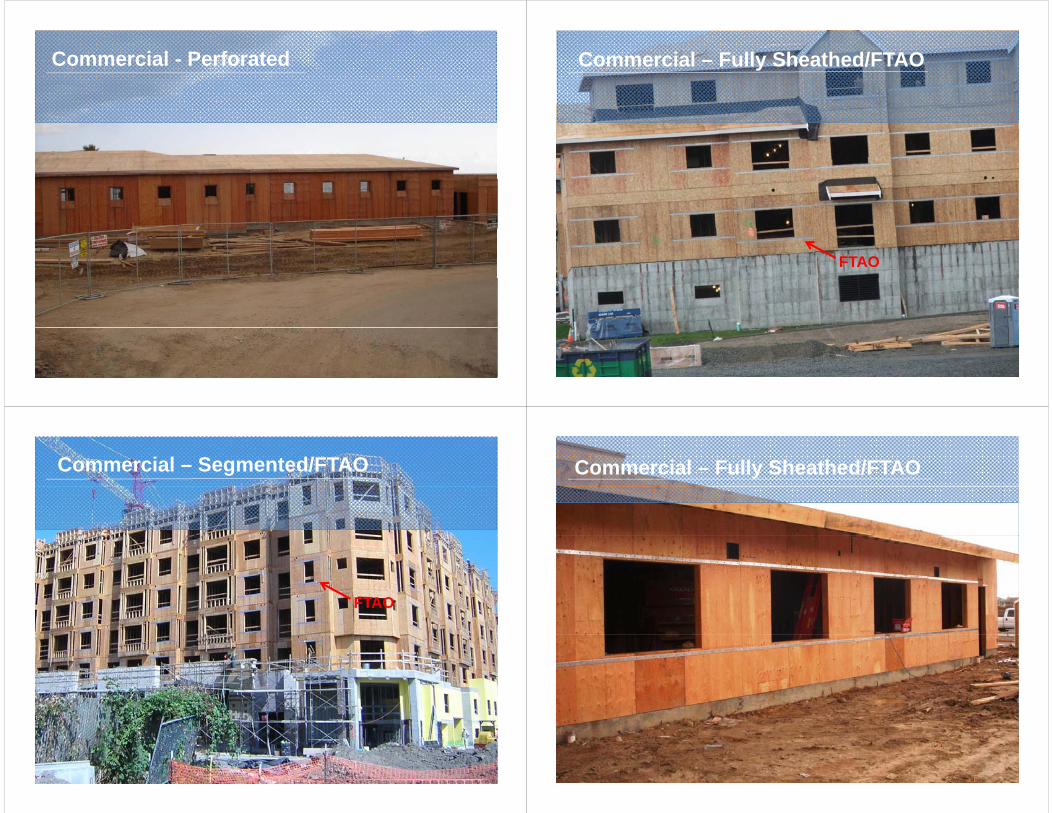
Commercial - Perforated
20
Commercial – Fully Sheathed/FTAO
FTAO
Commercial – Segmented/FTAO
FTAO
Commercial – Fully Sheathed/FTAO
23

Industrial – Fully Sheathed/FTAO
24
Different Techniques for FTAODifferent Techniques for FTAO
Drag Strut Analogy Drag Strut Analogy
Forces are collected andForces are collected and concentrated into the areas above and below openingsL1 Lo L2V
vp
v v1
h
p
v v2
vp
Different Techniques for FTAODifferent Techniques for FTAO
Cantilever Beam
L1
Cantilever Beam Analogy
h /2 F1
L1
hU
1 Forces are treated as moment couples
ho/2 F1
V1V2
Segmented panels are piers at sides of openings
h1
ho/2F2openings
L22
Different Techniques for FTAODifferent Techniques for FTAO
Diekmann
Assumes wall behaves as monolith
Internal forces resolved via principles of mechanics

Design ExamplesDesign Examples
V = 2 000 lbfV 2,000 lbf L1 = 2.3 ft L = 4 ft LO = 4 ft L2 = 4 ft L = 10 3 ft L = 10.3 ft hU = 2 ft
h 4 ft hO = 4 ft hL = 2 ft
fh = 8 ft
Ex 1 – Drag Strut AnalogyEx. 1 – Drag Strut Analogy
vp = 2 000/(10 3) = 194 plfv 2,000/(10.3) 194 plf v = 2,000/(2.3 + 4) = 317 plf F = (317-194)*2 3 = 284 lbf F1 = (317-194) 2.3 = 284 lbf F2 = (317-194)*4 = 493 lbf
Ex 2 – Drag Strut AnalogyEx. 2 – Drag Strut Analogy
v = 2 000/(2 3 + 4) = 317 plfv 2,000/(2.3 + 4) 317 plf V1 = 317 * 2.3 = 730 lbf V = 317 * 4 = 1 270 lbf V2 = 317 4 = 1,270 lbf F1 = (730 * 4)/2 = 1,460 lbf F = (1 270 * 4)/2 = 2 540 lbf
L11
F2 = (1,270 * 4)/2 = 2,540 lbfho/2 F1
V V2
hU
V1
h1
ho/2F2
V2
L22
Ex 3 – Diekmann MethodEx. 3 – Diekmann Method
H = (2 000 * 8)/10 3 = 1 553 lbfH (2,000 8)/10.3 1,553 lbf VD = VE = 1,553/(2+2) = 388 plf V = V = 2 000/10 3 = 317 plf VB = VG = 2,000/10.3 = 317 plf VA = VC = VF = FH =
388 317 = 71 plf V1 5 6 7 8
V1 5 6 7 8
V1 5 6 7 8
388 – 317 = 71 plf A
B
F
B
G
G
D D2
A
B
F
B
G
G
D D2
A
B
F
B
G
G
D D2
B
C HE
G
E
3
4
B
C HE
G
E
3
4
B
C HE
G
E
3
4
VH H
4
VH H
4
VH H
4

Ex 3 – Diekmann TechniqueEx. 3 – Diekmann Technique
F = 388 * 4 = 1 552 lbfF 388 4 1,552 lbf F1 = 1,552 * 2.3/(2.3 + 4) = 567 lbf F = 1 552 * 4/(2 3 + 4) = 986 lbf F2 = 1,552 4/(2.3 + 4) = 986 lbf
42 4212
68
268
1 4 1414
2
1 214
2
Design Example SummaryDesign Example Summary
D St t A lDrag Strut AnalogyF1 = 284 lbfF2 = 493 lbf2
Cantilever Beam AnalogyF1 = 1,460 lbfF2 = 2,540 lbf
Diekmann MethodF = 567 lbfF1 = 567 lbfF2 = 986 lbf
ReferencesReferences
D St t A l Drag Strut AnalogyMartin, Z.A. 2005. Design of wood structural panel shear walls with openings: A
comparison of methods. Wood Design Focus 15(1):18-20
Cantilever Beam Analogy Cantilever Beam AnalogyMartin, Z.A. (see above)
Diekmann MethodDiekmann E K 2005 Disc ssion and Clos re (Martin abo e) Wood Design Foc sDiekmann, E. K. 2005. Discussion and Closure (Martin, above), Wood Design Focus
15(3): 14-15Breyer, D.E., K.J. Fridley, K.E. Cobeen and D. G. Pollock. 2007. Design of wood
structures ASD/LRFD, 6th ed. McGraw Hill, New York.
SEAOC/Th M th d SEAOC/Thompson MethodSEAOC. 2007. 2006 IBC Structural/Seismic Design Manual, Volume 2: Building Design
Examples for Light-frame, Tilt-up Masonry. Structural Engineers Association of California, Sacramento, CA
Test DataTest Data

Test PlanTest Plan
Description Description 12 wall configurations tested (with and without
FTAO applied)pp ) Wall nailing; 10d commons (0.148” x 3”) at 2” o.c. Sheathing; 15/32 Perf Cat oriented strand board
(OSB) APA STR I All walls were 12 feet long and 8 feet tall Cyclic loading protocol following ASTM E 2126 Cyclic loading protocol following ASTM E 2126,
Method C, CUREE Basic Loading Protocol
Test PlanTest Plan
8'-0
"3'-0
"3'
-10"
Test PlanTest Plan
5'-0
"1'
-10"
Test PlanTest Plan
5'-0
"
0"7'
-
Wall 11Wall 12Objective:FTAO for asymmetric multiple pier wall.
Objective:FTAO for 3.5:1 Aspect ratio pier wall. No
4'-0"2'-6"2'-0"1'-6"
2'-0"
multiple pier wall.sheathing below opening. One hold downs on pier (pinned case) 4'
-0"
Wall is symmetric, sheathing and force transfer load '-4
"4'
-0"
measurement on right pier not shown for clarity
2'

Test PlanTest Plan
Information obtained Information obtained Cyclic hysteretic plots and various
cyclic parameters of the individual y pwalls
Hold down force plots Anchor bolt forces plots Hysteric plots of the applied load
versus the displacement of the wallsversus the displacement of the walls Hysteric plots of the applied load
versus strap forces
CUREE Basic Loading ProtocolCUREE Basic Loading Protocol
Local Response - InstrumentationLocal Response - Instrumentation Anchor InstrumentationAnchor InstrumentationWallID
Outboard Hold down
Force
Inboard Hold down ForceForce
(lbf) (lbf)
Wall 1a 7,881 5,313Wall 1b 6,637 6,216Wall 2a 2,216W ll 2b 3 248Wall 2b 3,248Wall 3a 2,602Wall 3b 4,090Wall 4a 1,140Wall 4b 3,674
Wall 4c (5) 1,336Wall 4d 1,598Wall 5b 5,216
Wall 5c (5) 4,795Wall 5d 4,413Wall 6a 1,573Wall 6b 1,285Wall 7a 6,024 3,677Wall 7b 6,577 3,844Wall 8a 4,805
Wall 8b (6) 5,548Wall 9a 4,679Wall 9b 5,212 Anchor bolt
Wall 10a 5,311 5,690Wall 10b 4,252 3,731Wall 11a 6,449Wall 11b 5,843Wall 12a 2,856Wall 12b 3,458
forces not shown in table

Data Notation – Opening Load BoltsData Notation – Opening Load Bolts
Bottom West Bolt Bottom East Bolt
HD
out
boar
d
HD
out
boar
d
AB
H H
Tracking of LoadsTracking of Loads
Testing ObservationsTesting ObservationsWall comparisons
Effects of shear Effects of openings/straps
8'-0
"3'-0
"3'
-10"
5'-0
"1'
-10"
Global Wall ResponseGlobal Wall ResponseWallID
ASD Unit Shear(1), V
Effective Wall
Length(2)Wall Capacity(3)
Average Applied
Load to Wall
ASD Load Factor(4)
Outboard Hold down
Force
Inboard Hold down Force
(1)Typical tabulated values are based on
(plf) (ft) (lbf) (lbf) (lbf) (lbf)
Wall 1a 4.5 3,915 5,421 1.4 7,881 5,313
Wall 1b 4.5 3,915 5,837 1.5 6,637 6,216
Wall 2a 4.5 3,631 7,296 1.9 2,216
Wall 2b 4.5 3,631 6,925 1.8 3,248
yp ca tabu ated a ues a e based oallowable stress design (ASD) unit shear.
(2)Based on sum of the lengths of the full height segments of the wall.
(3)The shear capacity of the wall V is theWall 3a 4.5 3,631 10,370 2.6 2,602
Wall 3b 4.5 3,631 8,955 2.3 4,090
Wall 4a 4.5 3,915 14,932 3.8 1,140
Wall 4b 4.5 3,915 17,237 4.4 3,674
Wall 4c (5) 4.5 3,915 17,373 4.4 1,336
Wall 4d 4.5 3,915 15,328 3.9 1,598
( )The shear capacity of the wall, V, is the sum of the full height segments times the unit shear capacity. For “perforated shear walls” (Walls 2 & 3), this capacity was multiplied by Co = 0.93. No reduction was taken based on aspect ratio of the walls
870
Wall 4d 4.5 3,915 15,328 3.9 1,598
Wall 5b 4.5 3,915 13,486 3.4 5,216
Wall 5c (5) 4.5 3,915 11,887 3.0 4,795
Wall 5d 4.5 3,915 11,682 3.0 4,413
Wall 6a 4.5 3,915 11,948 3.1 1,573
Wall 6b 4.5 3,915 13,582 3.5 1,285
Wall 7a 8 6 960 12 536 1 8 6 024 3 677
ratio of the walls.
(4)Wall capacity divided by the average load applied to the wall.
(5)Monotonic test.Wall 7a 8 6,960 12,536 1.8 6,024 3,677
Wall 7b 8 6,960 10,893 1.6 6,577 3,844
Wall 8a 8 6,960 15,389 2.2 4,805
Wall 8b (6) 8 6,960 15,520 2.2 5,548
Wall 9a 8 6,960 15,252 2.2 4,679
Wall 9b 8 6,960 16,647 2.4 5,212
(6)Loading time increased by 10x
Wall 10a 4 3,480 7,473 2.1 5,311 5,690
Wall 10b 4 3,480 6,976 2.0 4,252 3,731
Wall 11a 4 3,480 6,480 1.9 6,449
Wall 11b 4 3,480 5,669 1.6 5,843
Wall 12a 6 5,220 16,034 3.1 2,856
Wall 12b 6 5,220 15,009 2.9 3,458
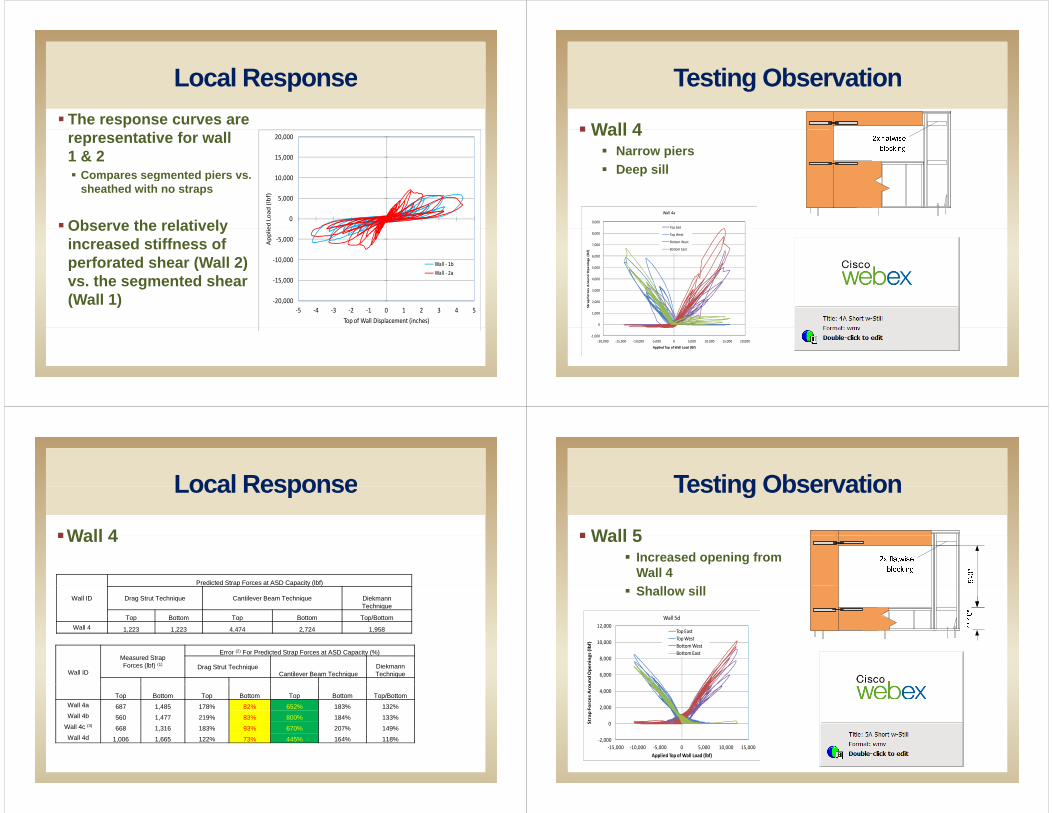
Local ResponseLocal Response The response curves are
10 000
15,000
20,000representative for wall 1 & 2 Compares segmented piers vs.
0
5,000
10,000
ed Load (lb
f)
Co pa es seg e ted p e s ssheathed with no straps
Observe the relatively
15 000
‐10,000
‐5,000App
lieWall ‐ 1bWall ‐ 2a
Observe the relatively increased stiffness of perforated shear (Wall 2)
th t d h‐20,000
‐15,000
‐5 ‐4 ‐3 ‐2 ‐1 0 1 2 3 4 5Top of Wall Displacement (inches)
vs. the segmented shear (Wall 1)
Testing ObservationTesting Observation
Wall 4Wall 4 Narrow piers Deep sill
9,000
Wall 4a
Top East
4 000
5,000
6,000
7,000
8,000
nd Ope
nings (lb
f)
Top East
Top West
Bottom West
Bottom East
0
1,000
2,000
3,000
4,000
Strap Forces Aroun
Click to Play
‐1,000‐20,000 ‐15,000 ‐10,000 ‐5,000 0 5,000 10,000 15,000 20,000
Applied Top of Wall Load (lbf)
Local ResponseLocal Response
Wall 4
Predicted Strap Forces at ASD Capacity (lbf)
Wall 4
Wall ID
p p y ( )
Drag Strut Technique Cantilever Beam Technique DiekmannTechnique
Top Bottom Top Bottom Top/BottomWall 4 1,223 1,223 4,474 2,724 1,958
Wall ID
Measured StrapForces (lbf) (1)
Error (2) For Predicted Strap Forces at ASD Capacity (%)
Drag Strut TechniqueCantilever Beam Technique
DiekmannTechnique
Top Bottom Top Bottom Top Bottom Top/BottomWall 4a 687 1,485 178% 82% 652% 183% 132%Wall 4b 560 1,477 219% 83% 800% 184% 133%
Wall 4c (3) 668 1,316 183% 93% 670% 207% 149%Wall 4d 1,006 1,665 122% 73% 445% 164% 118%
Testing ObservationTesting Observation
Wall 5Wall 5 Increased opening from
Wall 4 Shallow sill
12,000Wall 5d
Top East
6,000
8,000
10,000
und Ope
nings (lbf) Top West
Bottom WestBottom East
0
2,000
4,000
Strap Forces Arou
Click to Play
‐2,000‐15,000 ‐10,000 ‐5,000 0 5,000 10,000 15,000
Applied Top of Wall Load (lbf)
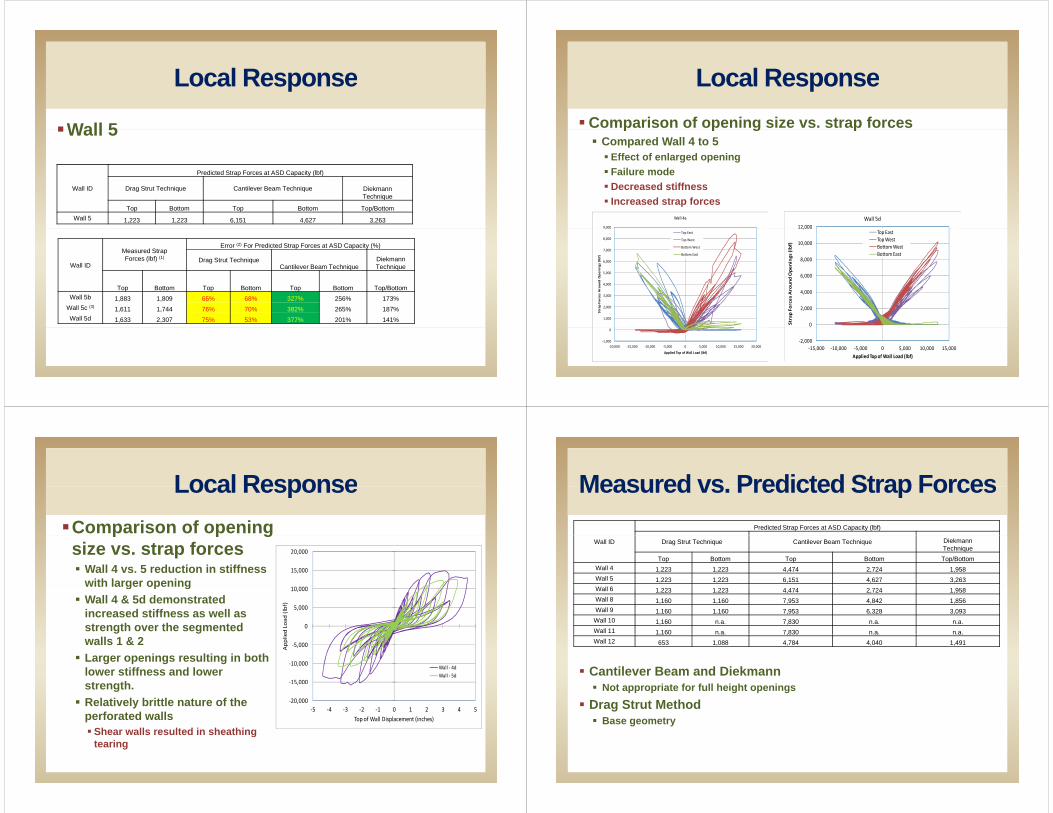
Local ResponseLocal Response
Wall 5
Predicted Strap Forces at ASD Capacity (lbf)
Wall 5
Wall ID Drag Strut Technique Cantilever Beam Technique DiekmannTechnique
Top Bottom Top Bottom Top/BottomWall 5 1,223 1,223 6,151 4,627 3,263
Wall ID
Measured StrapForces (lbf) (1)
Error (2) For Predicted Strap Forces at ASD Capacity (%)
Drag Strut TechniqueCantilever Beam Technique
DiekmannTechnique
Top Bottom Top Bottom Top Bottom Top/BottomWall 5b 1,883 1,809 65% 68% 327% 256% 173%
Wall 5c (3) 1,611 1,744 76% 70% 382% 265% 187%Wall 5d 1,633 2,307 75% 53% 377% 201% 141%
Local ResponseLocal ResponseComparison of opening size vs. strap forcesp p g p Compared Wall 4 to 5 Effect of enlarged opening Failure mode
12,000Wall 5d
9,000
Wall 4a
Decreased stiffness Increased strap forces
6,000
8,000
10,000
12,000
d Ope
nings (lbf)
Top EastTop WestBottom WestBottom East
5,000
6,000
7,000
8,000
9,000
Ope
nings (lb
f)
Top East
Top West
Bottom West
Bottom East
0
2,000
4,000
,
Strap Forces Aroun
d
1,000
2,000
3,000
4,000
Strap Forces Aroun
d O
‐2,000‐15,000 ‐10,000 ‐5,000 0 5,000 10,000 15,000
Applied Top of Wall Load (lbf)
‐1,000
0
‐20,000 ‐15,000 ‐10,000 ‐5,000 0 5,000 10,000 15,000 20,000Applied Top of Wall Load (lbf)
Local ResponseLocal ResponseComparison of opening
15,000
20,000
p p gsize vs. strap forces Wall 4 vs. 5 reduction in stiffness
with larger opening
0
5,000
10,000
ed Load (lb
f)
with larger opening Wall 4 & 5d demonstrated
increased stiffness as well as strength over the segmented
‐15,000
‐10,000
‐5,000App
lie
Wall ‐ 4dWall ‐ 5d
walls 1 & 2 Larger openings resulting in both
lower stiffness and lower strength
‐20,000
,
‐5 ‐4 ‐3 ‐2 ‐1 0 1 2 3 4 5Top of Wall Displacement (inches)
strength. Relatively brittle nature of the
perforated walls Shear walls resulted in sheathingShear walls resulted in sheathing
tearing
Measured vs Predicted Strap ForcesMeasured vs. Predicted Strap ForcesPredicted Strap Forces at ASD Capacity (lbf)
Wall ID Drag Strut Technique Cantilever Beam Technique DiekmannTechnique
Top Bottom Top Bottom Top/BottomWall 4 1,223 1,223 4,474 2,724 1,958Wall 5 1,223 1,223 6,151 4,627 3,263Wall 6 1,223 1,223 4,474 2,724 1,958Wall 8 1,160 1,160 7,953 4,842 1,856Wall 9 1,160 1,160 7,953 6,328 3,093Wall 10 1,160 n.a. 7,830 n.a. n.a.Wall 11 1,160 n.a. 7,830 n.a. n.a., ,Wall 12 653 1,088 4,784 4,040 1,491
Cantilever Beam and Diekmann N t i t f f ll h i ht i Not appropriate for full height openings
Drag Strut Method Base geometry

Measured vs Predicted Strap ForcesMeasured vs. Predicted Strap ForcesMeasured StrapForces (lbf) (1)
Error (2) For Predicted Strap Forces at ASD Capacity (%)
D St t T h i Diekmann(1)Reported strap forces
Wall IDForces (lbf) (1) Drag Strut Technique
Cantilever Beam TechniqueDiekmannTechnique
Top Bottom Top Bottom Top Bottom Top/BottomWall 4a 687 1,485 178% 82% 652% 183% 132%Wall 4b 60 1 4 219% 83% 800% 184% 133%
were based on the mean of the “East” and “West” recorded forces at the capacity of the walls as tabulated in Table 1.
(2)Error based on ratio of Wall 4b 560 1,477 219% 83% 800% 184% 133%Wall 4c (3) 668 1,316 183% 93% 670% 207% 149%Wall 4d 1,006 1,665 122% 73% 445% 164% 118%Wall 5b 1,883 1,809 65% 68% 327% 256% 173%
Wall 5c (3) 1,611 1,744 76% 70% 382% 265% 187%
( )predicted forces to mean measured strap forces. For Diekmann method, the larger of the top and bottom strap forces was used for calculation. Highlighted errors
Wall 5d 1,633 2,307 75% 53% 377% 201% 141%Wall 6a 421 477 291% 256% 1,063% 571% 410%Wall 6b 609 614 201% 199% 735% 444% 319%Wall 8a 985 1,347 118% 86% 808% 359% 138%
Wall 8b (4) 1 493 1 079 78% 108% 533% 449% 124%
g grepresent non-conservative predictions and significant ultra-conservative prediction (arbitrarily assigned as 300%).
Wall 8b ( ) 1,493 1,079 78% 108% 533% 449% 124%Wall 9a 1,675 1,653 69% 70% 475% 383% 185%Wall 9b 1,671 1,594 69% 73% 476% 397% 185%
Wall 10a 1,580 n.a. (5) 73% n.a. (5) 496% n.a. (5) n.a. (5)
Wall 10b 2,002 n.a. (5) 58% n.a. (5) 391% n.a. (5) n.a. (5)
(3)Monotonic test
(4)Loading time increased by 10x.
(5)Not applicable.
Wall 11a 2,466 n.a. (5) 47% n.a. (5) 318% n.a. (5) n.a. (5)
Wall 11b 3,062 n.a. (5) 38% n.a. (5) 256% n.a. (5) n.a. (5)
Wall 12a 807 1,163 81% 94% 593% 348% 128%Wall 12b 1,083 1,002 60% 109% 442% 403% 138%
Other Testing ObservationsOther Testing Observations Failure modes expected (Wall 4)p ( )
Relatively brittle nature of the perforated walls Shear walls resulted in sheathing tearing
Concentration of forces from analysis (SEAOC/Thompson) Drives shear type and nailing
Other Testing ObservationsOther Testing Observations Failure modes
Contributions of wall segments Variable stiffness Banging effect
ConclusionsConclusions
12 assemblies tested examining the three 12 assemblies tested, examining the three approaches to designing and detailing walls with openingswith openings Segmented Perforated Shear Wall
F T f A d O i Force Transfer Around Openings
Walls detailed for FTAO resulted in betterWalls detailed for FTAO resulted in better global response

ConclusionsConclusions
Comparison of analytical methods with tested Comparison of analytical methods with tested values for walls detailed as FTAO The drag strut technique was consistently un-conservativeg q y The cantilever beam technique was consistently ultra-conservative The Diekmann technique provided reasonable agreement with
measured strap forces
Better guidance to engineers will be developed by APA for FTAOdeveloped by APA for FTAO Summary of findings for validation of techniques New tools for CRC/IRC wall bracing
Questions?Questions?
This concludes The American Institute of Architects Continuing
Education Systems Course
Thomas D. Skaggs, Ph.D., [email protected]