JULY 2016 - Nebraska 2016/Trends_July... · table of contents 1 july 2016 fast facts - independence...
18
JULY 2016 Fast Facts - INDEPENDENCE DAY TRENDS Web Spotlight - PANHANDLE LABOR AVAILABILITY STUDY Feature - GOLF EMPLOYMENT IN NEBRASKA
Transcript of JULY 2016 - Nebraska 2016/Trends_July... · table of contents 1 july 2016 fast facts - independence...

TABLE OF CONTENTS 1
JULY 2016
Fast Facts - INDEPENDENCE DAY TRENDSWeb Spotlight - PANHANDLE LABOR AVAILABILITY STUDYFeature - GOLF EMPLOYMENT IN NEBRASKA
2
Table of Contents
FAST FACTS:
INDEPENDENCE DAY TRENDS
MAP FACTS - ICE CREAM SHOPS
IN NEBRASKA
OPENINGS & EXPANSIONS
WEB SPOTLIGHT: PANHANDLE
LABOR AVAILABILITY STUDY
GOLF EMPLOYMENT IN NEBRASKA
MAY UNEMPLOYMENT DATA
ECONOMIC INDICATORS
3
5
6
8
12
15
16
Helpful Links
Labor Market Publications
Nebraska INFOlink - Employment Data
Previous Issues
NEworks.nebraska.gov
CREDITS
Nebraska Workforce Trends is published by the Nebraska Department of Labor - Labor Market Information Center in cooperation with the U.S.
Department of Labor, Bureau of Labor Statistics.
This workforce product was funded by a grant awarded by the U.S. Department of Labor’s Employment and Training Administration. The product was created by the recipient and does not necessarily reflect the official position of the U.S. Department of Labor. The Department of Labor makes no guarantees, warranties, or assur-ances of any kind, express or implied, with respect to such information, including any information on linked sites and including, but not limited to, accuracy of the information or its completeness, timeliness, usefulness, adequacy, continued avail-ability, or ownership. This product is copyrighted by the institution that created it. Internal use by an organization and/or personal use by an individual for non-commercial purposes is permissible. All other uses require the prior authorization of the copyright owner.
Commissioner of LaborJohn H. Albin
LMI Administrator Phil Baker
Editor Scott Hunzeker
Editor Grace Johnson
EditorJennifer Gildersleeve
Graphic DesignerBrittney Lippincott
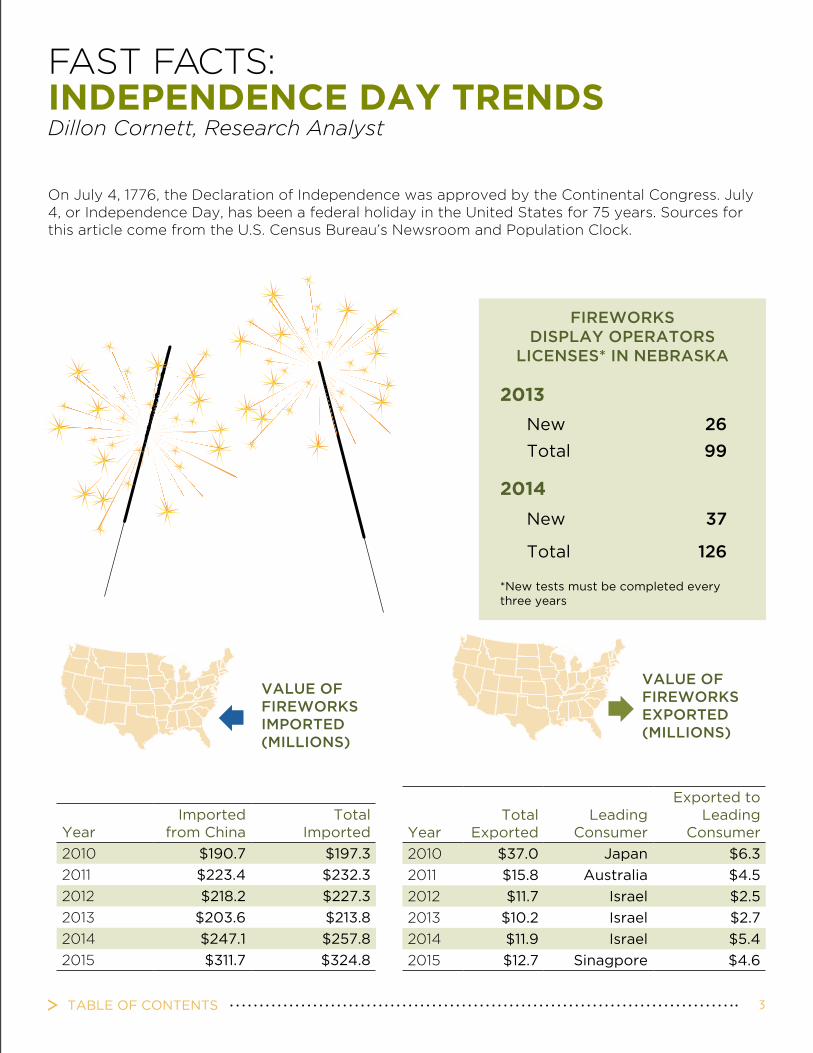
TABLE OF CONTENTS 3
FAST FACTS: INDEPENDENCE DAY TRENDSDillon Cornett, Research Analyst
On July 4, 1776, the Declaration of Independence was approved by the Continental Congress. July 4, or Independence Day, has been a federal holiday in the United States for 75 years. Sources for this article come from the U.S. Census Bureau’s Newsroom and Population Clock.
FIREWORKS DISPLAY OPERATORS
LICENSES* IN NEBRASKA
2013
2014
YearImported
from ChinaTotal
Imported
2010 $190.7 $197.3
2011 $223.4 $232.3
2012 $218.2 $227.3
2013 $203.6 $213.8
2014 $247.1 $257.8
2015 $311.7 $324.8
YearTotal
ExportedLeading
Consumer
Exported to Leading
Consumer
2010 $37.0 Japan $6.3
2011 $15.8 Australia $4.5
2012 $11.7 Israel $2.5
2013 $10.2 Israel $2.7
2014 $11.9 Israel $5.4
2015 $12.7 Sinagpore $4.6
*New tests must be completed every three years
New 26
Total 99
New 37
Total 126
VALUE OF FIREWORKS IMPORTED (MILLIONS)
VALUE OF FIREWORKS EXPORTED (MILLIONS)

4
SOURCES:1. U.S. Census Bureau. FFF: The Fourth of July 2015. Facts for Features. [Online] 2015. [Cited: 6 29, 2016.]
http://www.census.gov/newsroom/facts-for-features/2015/cb15-ff13.html.
2. U.S. Census Bureau. FFF: The Fourth of July 2014. Facts for Features. [Online] 2014. [Cited: 6 29, 2016.] http://www.census.gov/newsroom/facts-for-features/2014/cb14-ff16.html.
3. U.S. Census Bureau. FFF: The Fourth of July 2013. Facts for Features. [Online] 2013. [Cited: 6 29, 2016.] http://www.census.gov/newsroom/facts-for-features/2013/cb13-ff14.html.
4. U.S. Census Bureau. FFF: The Fourth of July 2012. Facts for Features. [Online] 2012. [Cited: 6 29, 2016.] http://www.census.gov/newsroom/releases/archives/facts_for_features_special_editions/cb12-ff12.html.
5. U.S. Census Bureau. FFF: The Fourth of July 2011. Facts for Features. [Online] 2011. [Cited: 6 29, 2016.] http://www.census.gov/newsroom/releases/archives/facts_for_features_special_editions/cb11-ff13.html.
6. U.S. Census Bureau. FFF: The Fourth of July 2016. Facts for Features. [Online] 2016. [Cited: 6 29, 2016.] http://www.census.gov/newsroom/facts-for-features/2016/cb16-ff13.html.
7. U.S. Census Bureau. U.S. and World Population Clock. [Online] 2016. [Cited: 6 29, 2016.] http://www.census.gov/popclock/.
8. Nebraska Department of Labor. Licensed Occupations In Nebraska 2015. [Online] 2015. [Cited: 6 29, 2016.] https://neworks.nebraska.gov/admin/gsipub/htmlarea/uploads/Licensed-Final.pdf.
ESTIMATED POPULATION OF U.S.A
1776 2.5 million
July 4, 2010 309.3 million
July 4, 2011 311.7 million
July 4, 2012 314.1 million
July 4, 2013 316.4 million
July 4, 2014 318.9 million
July 4, 2015 321.4 million
Year Made in ChinaTotal
Imported
2010 $2.8 $3.2
2011 $3.3 $3.6
2012 $3.6 $3.8
2013 $3.9 $4.0
2014 $3.5 $3.6
2015 $4.3 $4.4
YearTotal
ExportedLeading
Consumer Exported to
Leading Consumer
2010 $486,026 Mexico $256,407
2011 $663,071 Mexico $80,349
2012 $614,115 Mexico $188,824
2013 $781,222 Dominican Republic
$160,000
2014 $1,800,000 Turkey $673,000
2015 $3,100,000 Mexico $2,400,000
VALUE OF AMERICAN FLAGS IMPORTED (MILLIONS)
VALUE OF AMERICAN FLAGS EXPORTED

TABLE OF CONTENTS 5
MAP FACTS: ICE CREAM SHOPS IN NEBRASKAKermit Spade, Research Analyst
SNACK & NONALCOHOLIC BEVERAGE BARS BY COUNTY - 2ND QUARTER, 2015
»
On July 2, 1984, President Ronald Reagan signed S.J.Res.298, proclaiming July as National Ice Cream Month, and the third Sunday in July as National Ice Cream Day.1 The North American Industry Classification System (NAICS) classifies ice cream shops as “snack and nonalcoholic beverage bars”.2 Other shops that also fall into this category include doughnut shops, bagel shops, pretzel shops, cookie shops and coffee shops.2 It is also important to note that while many full service and fast food restaurants may also serve ice cream, they fall into a different NAICS category.
The following map shows the concentration of snack and nonaIcoholic beverage bars in Nebraska in the second quarter of 2015. In general, these shops are concentrated in areas of high population. The map also shows that many counties do not have any establishments. This could be because shops with only one or two employees or only open seasonally may not show up in Department of Labor records.
In May 2015, it was estimated that there were about 1,840 counter attendants, cafeteria, food concession and coffee shop workers in Nebraska.3 These workers earned an average hourly wage of $9.45 in the first quarter of 2016.
CherryHolt
Custer
Sioux
Lincoln
Sheridan
Morrill
Garden
Knox
Keith
Dawes
RockBrown
Gage
Hall
Dundy
Chase
Buffalo
Grant
Clay
Kimball
York
Frontier
Otoe
Dawson
Cedar
PlatteArthur
Burt
Perkins
Cheyenne
Hayes
Blaine Loup
Box Butte
Cass
Boyd
Boone
Banner
PolkButler
Furnas
Hooker
Antelope
Saline
Valley
Pierce
Logan
Thomas
Lancaster
Dixon
Harlan
Adams
Thayer
Dodge
Phelps
Saunders
McPherson
DeuelHoward
Cuming
Seward
Greeley
Fillmore
Hitchcock
Garfield
Franklin
Keya Paha
Webster
Nance
MadisonWheeler
Nuckolls
Merrick
Colfax
Gosper
Scotts Bluff
Jefferson
Wayne
Sherman
Red Willow
Kearney
Hamilton
Stanton
Pawnee Richardson
NemahaJohnson
Thurston
Douglas
Sarpy
Dakota
Washington
Source: Nebraska Department of Labor, Quarterly Census of Employment and Wages, Q2 2015SOURCES1. United State Congress. Public Laws, 98th Congress, PL 98-333 . congress.gov. [Online] 1984. [Cited: 6 14, 2016.]
https://www.congress.gov/public-laws/98th-congress.
2. U.S. Census. North American Industry Classification System. census.gov. [Online] 2012. [Cited: 6 14, 2016.] http://www.census.gov/cgi-bin/sssd/naics/naicsrch.
3. Nebraska Department of Labor, Office of Labor Market Information. Occupational Employment Statistics. neworks.nebraska.gov. [Online] 3 15, 2016. [Cited: 6 14, 2016.] neworks.nebraska.gov.
4. Nebraska Department of Labor, Office of Labor Market Infomation. Quarterly Census of Employment and Wages,
2nd Quarter, 2015. neworks.nebraska.gov. [Online] 6 15, 2015. [Cited: 6 14, 2016.] neworks.nebraska.gov.
Number of Establishments
0
1 - 6
7 - 22
23 - 61
62 - 122
6
Kermit SpadeResearch Analyst
MAY
OTHER
BUSINESS CATEGORY
RETAIL/SALES
HEALTHCARE & EDUCATION
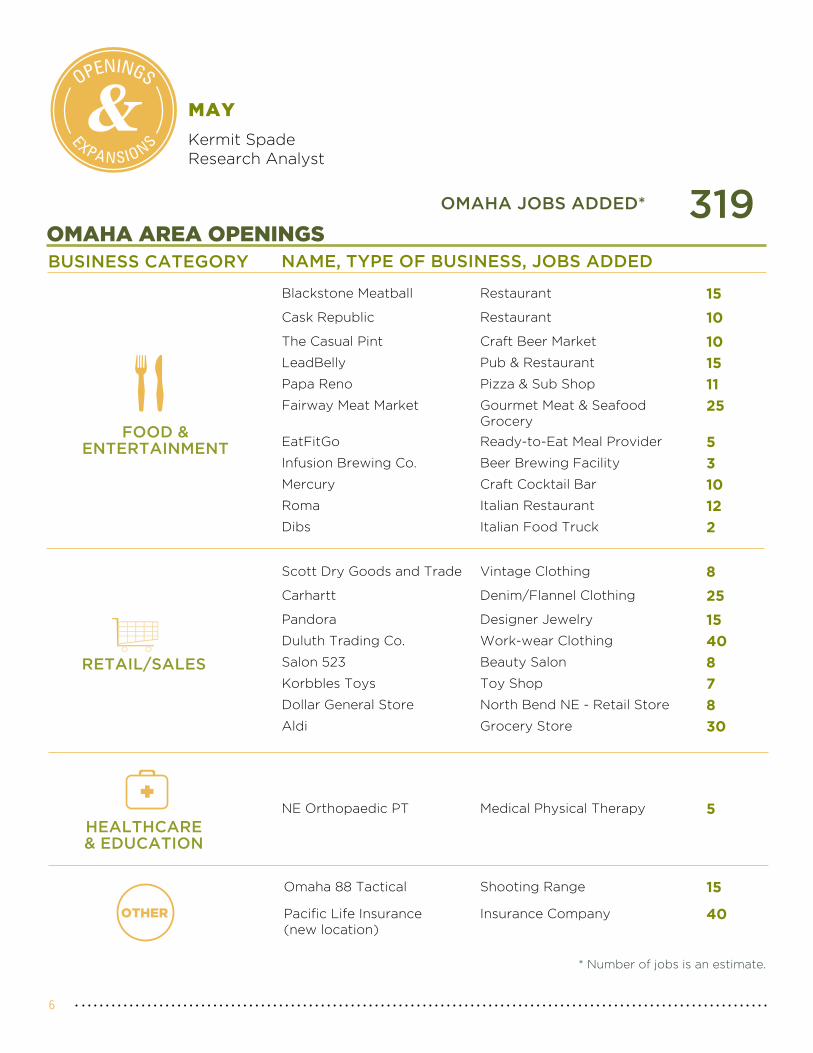
OMAHA AREA OPENINGSNAME, TYPE OF BUSINESS, JOBS ADDED
Scott Dry Goods and Trade Vintage Clothing 8
Carhartt Denim/Flannel Clothing 25
Pandora Designer Jewelry 15
Duluth Trading Co. Work-wear Clothing 40
Salon 523 Beauty Salon 8
Korbbles Toys Toy Shop 7
Dollar General Store North Bend NE - Retail Store 8
Aldi Grocery Store 30
Blackstone Meatball Restaurant 15
Cask Republic Restaurant 10
The Casual Pint Craft Beer Market 10
LeadBelly Pub & Restaurant 15
Papa Reno Pizza & Sub Shop 11
Fairway Meat Market Gourmet Meat & Seafood Grocery
25
EatFitGo Ready-to-Eat Meal Provider 5
Infusion Brewing Co. Beer Brewing Facility 3
Mercury Craft Cocktail Bar 10
Roma Italian Restaurant 12
Dibs Italian Food Truck 2
NE Orthopaedic PT Medical Physical Therapy 5
Omaha 88 Tactical Shooting Range 15
Pacific Life Insurance (new location)
Insurance Company 40
* Number of jobs is an estimate.
OTHER
OTHER
319OMAHA JOBS ADDED*
FOOD & ENTERTAINMENT
OTHER
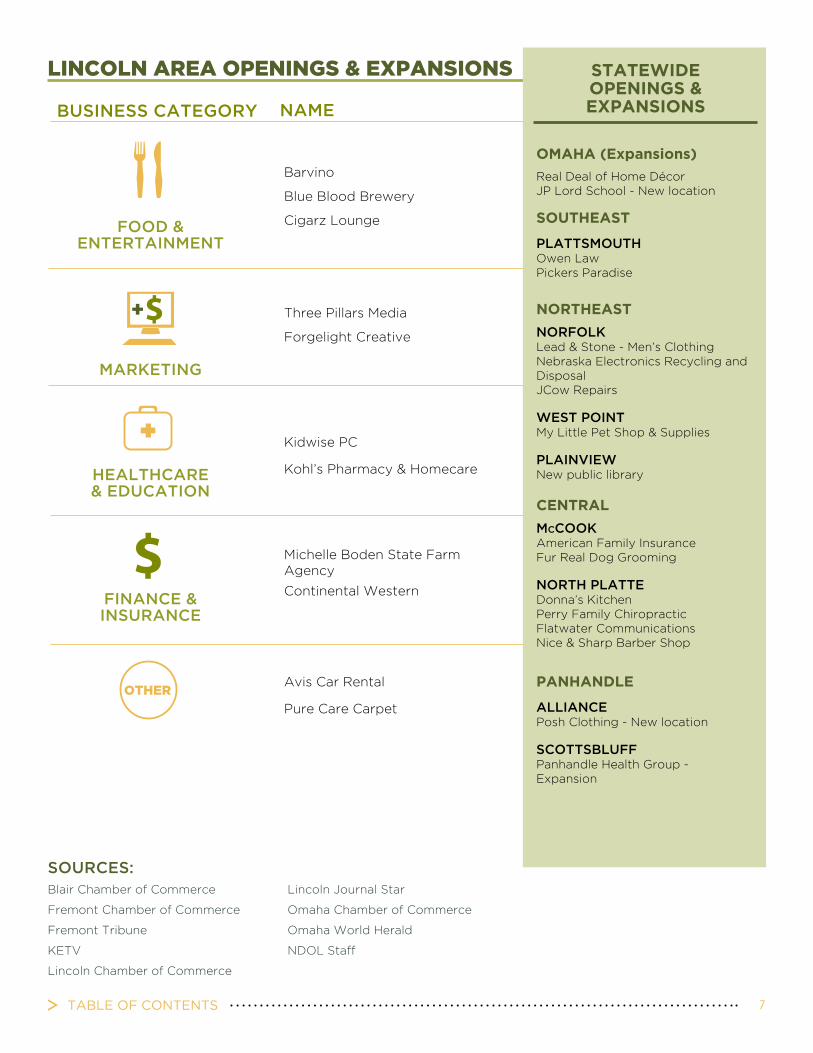
TABLE OF CONTENTS 7
OTHER
BUSINESS CATEGORY
FINANCE & INSURANCE
HEALTHCARE & EDUCATION
FOOD & ENTERTAINMENT
MARKETING
LINCOLN AREA OPENINGS & EXPANSIONS
NAME
Three Pillars Media
Forgelight Creative
Barvino
Blue Blood Brewery
Cigarz Lounge
Kidwise PC
Kohl’s Pharmacy & Homecare
Michelle Boden State Farm Agency
Continental Western
Avis Car Rental
Pure Care Carpet
OTHER
OTHER
OTHER
OTHER
STATEWIDE OPENINGS & EXPANSIONS
SOUTHEAST
OMAHA (Expansions)
PANHANDLE
NORTHEAST
CENTRAL
PLATTSMOUTHOwen LawPickers Paradise
Real Deal of Home DécorJP Lord School - New location
ALLIANCEPosh Clothing - New location
SCOTTSBLUFFPanhandle Health Group - Expansion
NORFOLKLead & Stone - Men’s ClothingNebraska Electronics Recycling and DisposalJCow Repairs
WEST POINTMy Little Pet Shop & Supplies
PLAINVIEWNew public library
MccooKAmerican Family InsuranceFur Real Dog Grooming
NORTH PLATTEDonna’s KitchenPerry Family ChiropracticFlatwater CommunicationsNice & Sharp Barber Shop
SOURCES:Blair Chamber of Commerce
Fremont Chamber of Commerce
Fremont Tribune
KETV
Lincoln Chamber of Commerce
Lincoln Journal Star
Omaha Chamber of Commerce
Omaha World Herald
NDOL Staff

8
WEB SPOTLIGHT: PANHANDLE LABOR AVAILABILITY STUDYDillon Cornett, Research Analyst
“Labor availability” describes how many people within a given area are available and willing to take on a new job. In the fall of 2015, the Nebraska Departments of Economic Development and Labor collaborated on a survey designed to measure labor availability in the Panhandle area of Nebraska.
The resulting report, released in June 2016, features detailed demographics, commuting patterns, skills and education, hours worked, pay and benefit expectations and other char-acteristics of potential job seekers. Analysis includes the factors that are important to those seeking new employment as well as barriers that may prevent people from taking a new job.
Results of the Panhandle Labor Availability Survey, which included some of the western-most counties in Nebraska and also Goshen County, Wyoming, revealed that there are an estimated 23,543 potential job seekers in the survey area. Over 80 percent of these potential job seekers are currently employed. Others are out of work or seeking to reenter the workforce after time spent in retirement or homemaking. These potential job seekers indicated that they were willing to take new work or change jobs in the next year if a suitable job presents itself. The median wage sought by this group was a minimum of $40,000 annually, or $19.23 an hour for full-time, year-round work. Nearly all (93 percent) potential job seekers stated that they were willing to commute 15 minutes or more each way for suitable work. The median tenure of employed potential job seekers at their current job was four and a half years. Over a third of potential job seekers (36.4 percent) said they had at least a bachelor’s degree. Potential job seekers identified salary, work schedule, and using skills they have as the most important factors in improving their employment situation.
They named lack of job opportunities in the area, inadequate pay offered at area employers and inadequate benefits offered by area employers as the most common barriers to improving their employment situation.
Nearly 30 percent of potential job seekers in the Panhandle reported they would not need a pay increase to improve their employment situation. Furthermore, over 20 percent of potential job seeker respondents would take less pay than they currently earn for a job that met their most important criteria.
27PANHANDLE LABOR AVAILABILITY REPORT
deSired PAy
Nearly 30% of potential job seekers in
the Panhandle reported they would not
need a pay increase to improve their
employment situation. Furthermore,
over 20% of potential job seeking
respondents would take less pay than
they currently earn for a job that met
their most important criteria. A higher
percentage of those who are not
potential job seekers reported they
would require at least a $10,000 raise
(43.9%) to change jobs compared to
potential job seekers (29.5%).
Only responses that listed both a
current wage and minimum pay
requirement to change jobs were
included in the analysis of wage
increases.
MINIMUM PAY INCREASE REQUIRED TO CHANGE JOBS
Section 5e i-ii.
20.6%
12.6%
9.3%
8.6%
15.2%
19.8%
14.2%
17.7%
12.0%
23.0%
17.7%
9.7%
9.7%
10.2%
NON-SEEKERS
POTENTIAL JOB SEEKERS
$20K+
$15 - 19.9K
$10 - 14.9K
$5 - 9.9K
$0 - 4.9K
ZERO
DECREASE
Section 5e i-ii.
20.6%
12.6%
9.3%
8.6%
15.2%
19.8%
14.2%
17.7%
12.0%
23.0%
17.7%
9.7%
9.7%
10.2%
NON-SEEKERS
POTENTIAL JOB SEEKERS
$20K+
$15 - 19.9K
$10 - 14.9K
$5 - 9.9K
$0 - 4.9K
ZERO
DECREASE
MININUM PAY INCREASE REQUIRED TO CHANGE JOBS
»
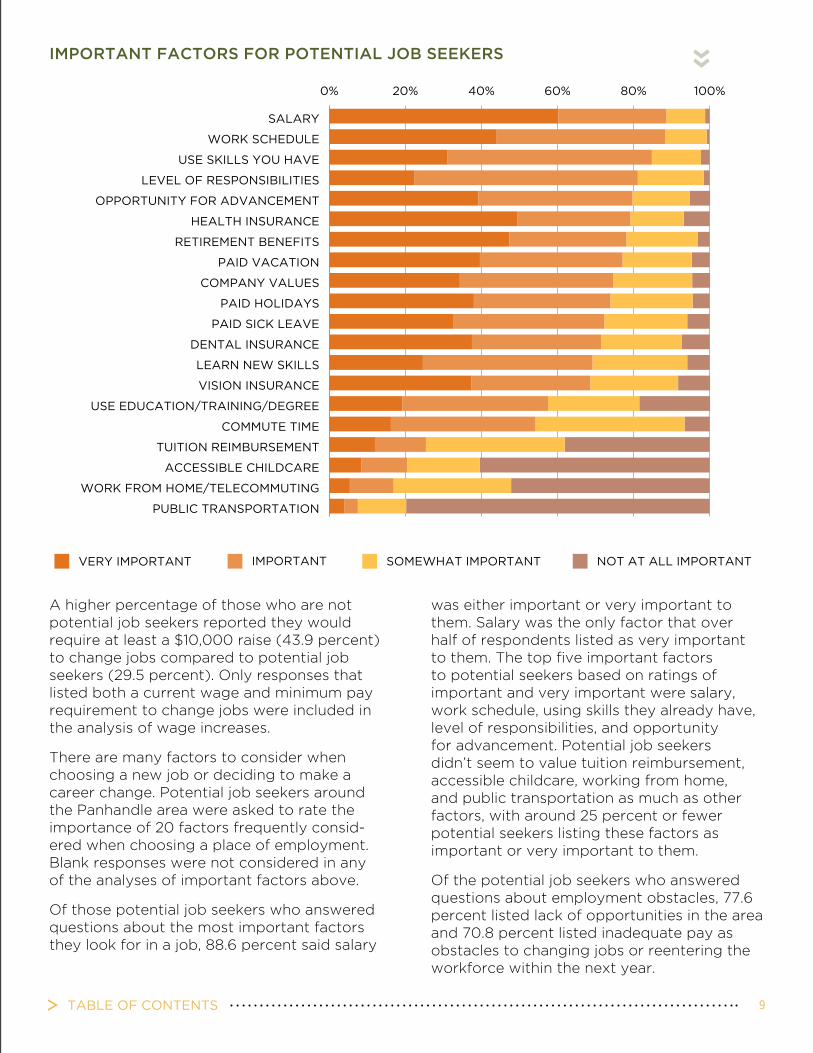
TABLE OF CONTENTS 9
A higher percentage of those who are not potential job seekers reported they would require at least a $10,000 raise (43.9 percent) to change jobs compared to potential job seekers (29.5 percent). Only responses that listed both a current wage and minimum pay requirement to change jobs were included in the analysis of wage increases.
There are many factors to consider when choosing a new job or deciding to make a career change. Potential job seekers around the Panhandle area were asked to rate the importance of 20 factors frequently consid-ered when choosing a place of employment. Blank responses were not considered in any of the analyses of important factors above.
Of those potential job seekers who answered questions about the most important factors they look for in a job, 88.6 percent said salary
was either important or very important to them. Salary was the only factor that over half of respondents listed as very important to them. The top five important factors to potential seekers based on ratings of important and very important were salary, work schedule, using skills they already have, level of responsibilities, and opportunity for advancement. Potential job seekers didn’t seem to value tuition reimbursement, accessible childcare, working from home, and public transportation as much as other factors, with around 25 percent or fewer potential seekers listing these factors as important or very important to them.
Of the potential job seekers who answered questions about employment obstacles, 77.6 percent listed lack of opportunities in the area and 70.8 percent listed inadequate pay as obstacles to changing jobs or reentering the workforce within the next year.
33PANHANDLE LABOR AVAILABILITY REPORT
imPortAnt fActorS to PotentiAL Job SeekerS
There are many factors to consider when choosing a new job or deciding to make a career change.
Potential job seekers around the Panhandle area were asked to rate the importance of 20 factors frequently
considered when choosing a place of employment. Blank responses were not considered in any of the
analyses of important factors below.
Of those potential job seekers who answered questions about the most important factors they look for in a
job, 88.6% said salary was either important or very important to them. Salary was the only factor that over
half of respondents listed as very important to them. The top five important factors to potential seekers
based on ratings of important and very important were salary, work schedule, using skills they already have,
level of responsibilities, and opportunity for advancement. Potential job seekers didn’t seem to value tuition
reimbursement, accessible childcare, working from home, and public transportation as much as other factors,
with around 25% or fewer potential seekers listing these factors as important or very important to them.
IMPORTANT FACTORS
Section 5f i.
0% 20% 40% 60% 80% 100%
NOT AT ALL IMPORTANTSOMEWHAT IMPORTANTIMPORTANTVERY IMPORTANT
PUBLIC TRANSPORTATION
WORK FROM HOME/TELECOMMUTING
ACCESSIBLE CHILDCARE
TUITION REIMBURSEMENT
COMMUTE TIME
USE EDUCATION/TRAINING/DEGREE
VISION INSURANCE
LEARN NEW SKILLS
DENTAL INSURANCE
PAID SICK LEAVE
PAID HOLIDAYS
COMPANY VALUES
PAID VACATION
RETIREMENT BENEFITS
HEALTH INSURANCE
OPPORTUNITY FOR ADVANCEMENT
LEVEL OF RESPONSIBILITIES
USE SKILLS YOU HAVE
WORK SCHEDULE
SALARY
IMPORTANT FACTORS FOR POTENTIAL JOB SEEKERS
»
10
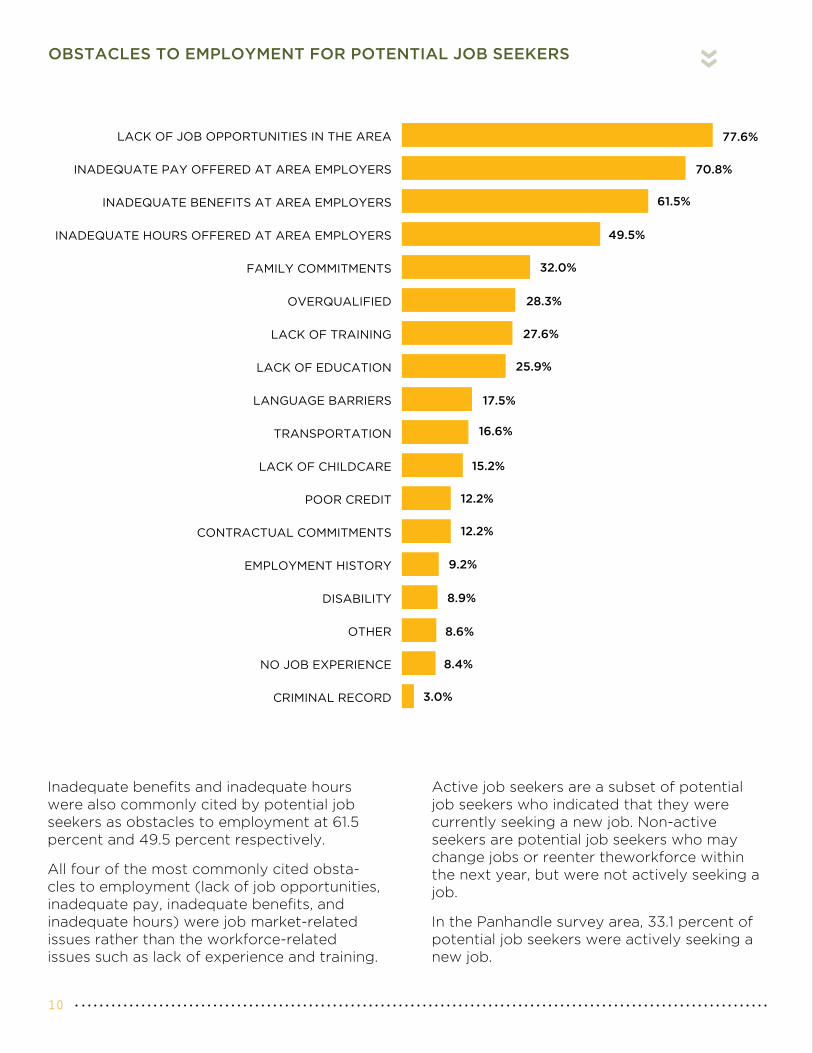
Inadequate benefits and inadequate hours were also commonly cited by potential job seekers as obstacles to employment at 61.5 percent and 49.5 percent respectively.
All four of the most commonly cited obsta-cles to employment (lack of job opportunities, inadequate pay, inadequate benefits, and inadequate hours) were job market-related issues rather than the workforce-related issues such as lack of experience and training.
51PANHANDLE LABOR AVAILABILITY REPORT
PotentiAL Job SeekerS
OBSTACLES TO EMPLOYMENT
emPLoyment obStAcLeS for PotentiAL Job SeekerS
Of the potential job seekers who answered questions about employment obstacles, 77.6% listed lack of
opportunities in the area and 70.8% listed inadequate pay as obstacles to changing jobs or reentering the
workforce within the next year. Inadequate benefits and inadequate hours were also commonly cited by
potential job seekers as obstacles to employment at 61.5% and 49.5% respectively.
All four of the most commonly cited obstacles to employment (lack of job opportunities, inadequate pay,
inadequate benefits, and inadequate hours) were job market-related issues rather than the workforce-related
issues such as lack of experience and training.
CRIMINAL RECORD
NO JOB EXPERIENCE
OTHER
DISABILITY
EMPLOYMENT HISTORY
CONTRACTUAL COMMITMENTS
POOR CREDIT
LACK OF CHILDCARE
TRANSPORTATION
LANGUAGE BARRIERS
LACK OF EDUCATION
LACK OF TRAINING
OVERQUALIFIED
FAMILY COMMITMENTS
INADEQUATE HOURS OFFERED AT AREA EMPLOYERS
INADEQUATE BENEFITS AT AREA EMPLOYERS
INADEQUATE PAY OFFERED AT AREA EMPLOYERS
LACK OF JOB OPPORTUNITIES IN THE AREA
Section 5g i.
77.6%
70.8%
61.5%
49.5%
32.0%
28.3%
27.6%
25.9%
17.5%
16.6%
15.2%
12.2%
12.2%
9.2%
8.9%
8.6%
8.4%
3.0%
Active job seekers are a subset of potential job seekers who indicated that they were currently seeking a new job. Non-active seekers are potential job seekers who may change jobs or reenter theworkforce within the next year, but were not actively seeking a job.
In the Panhandle survey area, 33.1 percent of potential job seekers were actively seeking a new job.
OBSTACLES TO EMPLOYMENT FOR POTENTIAL JOB SEEKERS
»
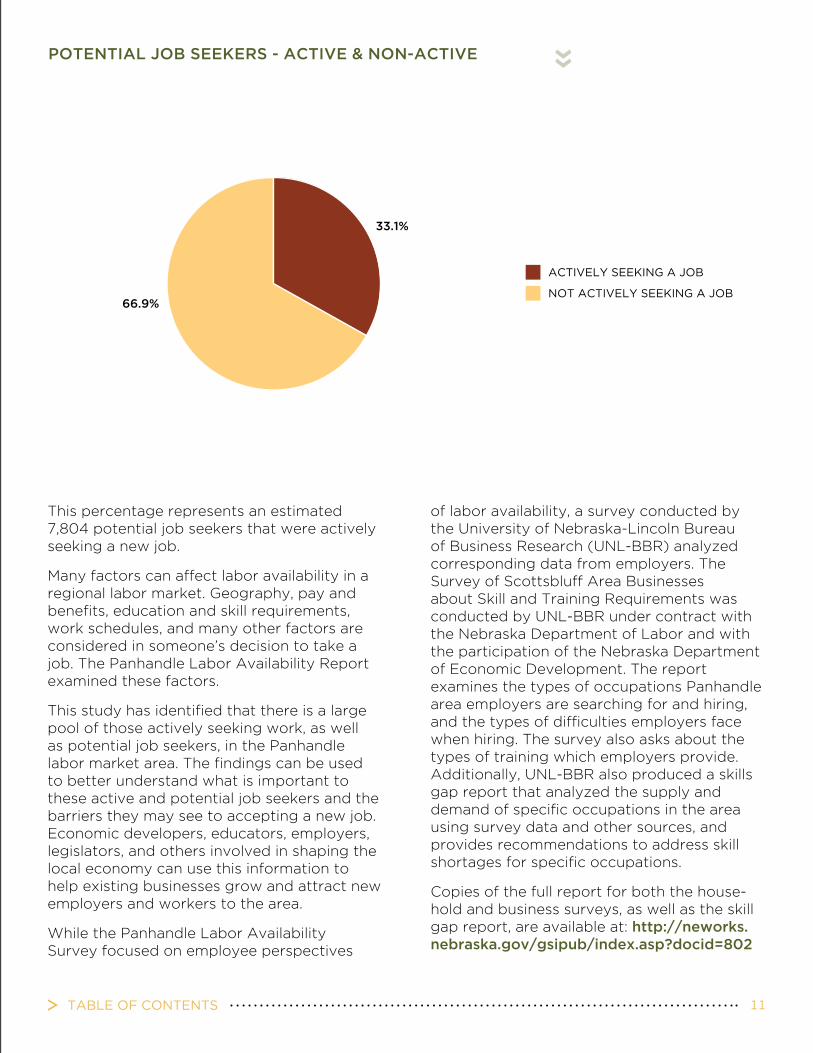
TABLE OF CONTENTS 11
This percentage represents an estimated 7,804 potential job seekers that were actively seeking a new job.
Many factors can affect labor availability in a regional labor market. Geography, pay and benefits, education and skill requirements, work schedules, and many other factors are considered in someone’s decision to take a job. The Panhandle Labor Availability Report examined these factors.
This study has identified that there is a large pool of those actively seeking work, as well as potential job seekers, in the Panhandle labor market area. The findings can be used to better understand what is important to these active and potential job seekers and the barriers they may see to accepting a new job. Economic developers, educators, employers, legislators, and others involved in shaping the local economy can use this information to help existing businesses grow and attract new employers and workers to the area.
While the Panhandle Labor Availability Survey focused on employee perspectives
of labor availability, a survey conducted by the University of Nebraska-Lincoln Bureau of Business Research (UNL-BBR) analyzed corresponding data from employers. The Survey of Scottsbluff Area Businesses about Skill and Training Requirements was conducted by UNL-BBR under contract with the Nebraska Department of Labor and with the participation of the Nebraska Department of Economic Development. The report examines the types of occupations Panhandle area employers are searching for and hiring, and the types of difficulties employers face when hiring. The survey also asks about the types of training which employers provide. Additionally, UNL-BBR also produced a skills gap report that analyzed the supply and demand of specific occupations in the area using survey data and other sources, and provides recommendations to address skill shortages for specific occupations.
Copies of the full report for both the house-hold and business surveys, as well as the skill gap report, are available at: http://neworks.nebraska.gov/gsipub/index.asp?docid=802
60 NEBRASKA DEPARTMENT OF LABOR
aCtive Job seekersintroduction
Active job seekers are a subset of potential job seekers who indicated that they were currently seeking a new
job. Non-active seekers are potential job seekers who may change jobs or reenter the workforce within the
next year, but were not actively seeking a job.
EMPLOYMENT STATUS
POTENTIAL JOB SEEKERS - ACTIVE & NON-ACTIVE
According to survey results, most
people actively searching for
work in the Panhandle area were
employed (78.3%), followed by
unemployed (17.5%), retired (3.1%),
and homemakers (1.1%).
Section 6a ii.
HOMEMAKER
RETIRED
UNEMPLOYED
EMPLOYED
1.1%3.1%
17.5%
78.3%
NOT ACTIVELY SEEKING A JOB
ACTIVELY SEEKING A JOB33.1%
66.9%
Section 6a ii.
HOMEMAKER
RETIRED
UNEMPLOYED
EMPLOYED
1.1%3.1%
17.5%
78.3%
NOT ACTIVELY SEEKING A JOB
ACTIVELY SEEKING A JOB33.1%
66.9%
Section 6a ii.
HOMEMAKER
RETIRED
UNEMPLOYED
EMPLOYED
1.1%3.1%
17.5%
78.3%
NOT ACTIVELY SEEKING A JOB
ACTIVELY SEEKING A JOB33.1%
66.9%
Section 6a ii.
HOMEMAKER
RETIRED
UNEMPLOYED
EMPLOYED
1.1%3.1%
17.5%
78.3%
NOT ACTIVELY SEEKING A JOB
ACTIVELY SEEKING A JOB33.1%
66.9%
In the Panhandle survey area, 33.1%
of potential job seekers were actively
seeking a new job. This percentage
represents an estimated 7,804
potential job seekers that were
actively seeking a new job.
POTENTIAL JOB SEEKERS - ACTIVE & NON-ACTIVE
»

12
2015-2017 short term industry projections show an expected statewide annual growth in the amusement, gambling and recreation industry of 1.84 percent. The 2015-2017 short term projections showed expected posi-tive growth in this industry for all economic regions except for the Grand Island MSA, which had a 0.33 percent expected annual decline. The economic regions with the high-est projected annual growth in the amuse-ment, gambling and recreation industry were the Lincoln MSA (2.55 percent) and the Mid Plains Economic Region (1.97 percent).4
SHORT TERM PROJECTIONS, 2015 - 2017
Region Growth Rate
Lincoln MSA 2.55%
Mid-Plains 1.97%
Southeast 1.95%
Northeast 1.86%
Sandhills 1.77%
Omaha Consortium 1.71%
Panhandle 1.16%
Central 0.94%
Grand Island MSA -0.33%
Data from the Occupational Employment Statistics (OES) program can be used to show the top employing occupations at the state-wide level within the Amusement, Gambling and Recreation industry and their average hourly wage in May of 2015.
Some of these top-employing occupations in the amusement, gambling and recreation industry include cashiers, who had an average hourly wage of $9.36 and an estimated 380 people working in that industry statewide; childcare workers, with an average hourly wage of $9.51 and an estimated 340 people working in that industry statewide;
Source: Nebraska Department of Labor, Labor Market Information, short term Industry Projections 2015-2017
GOLF EMPLOYMENT IN NEBRASKAByron Lefler, Research Analyst
Whether it is a leisurely round on the week-end, an evening golf league, a business outing, or a competitive tournament, many people will find themselves engaged in playing golf. With 100 plus golf courses, a number of which are highly ranked by national golf maga-zines, and many built by some of the top golf course designers in the business, Nebraska has a wealth of golfing opportunities avail-able. With the many golf courses comes a variety of jobs related to golf.1
EMPLOYMENT AND WAGES: AMUSEMENT, GAMBLING AND RECREATION INDUSTRY
Data from the Quarterly Census of Employment and Wages (QCEW) program can be used to determine whether an estab-lishment operates a golf course as its primary or secondary function. Establishments operat-ing a golf course are either categorized under the amusement, gambling and recreation industry or the traveler accommodations industries. Data from the QCEW program shows that a majority of establishments oper-ating a golf course fall into the amusement, gambling and recreation industry.2
Since golf is a very seasonal business in Nebraska, with most of its revenue generated in the 2nd and 3rd quarter, 2nd quarter 2015 Quarterly Census of Employment and Wages (QCEW) program and May 2015 Occupational Employment Statistics (OES) data will be used in this article. Some of the establishments found within the amusement, gambling and recreation industry include amusement and theme parks; casinos (except casino hotels); marinas; bowling centers; fitness and recreational sports centers and golf courses and country clubs. In the 2nd quarter of 2015 there were 588 establishments statewide in the amusement, gambling and recreation industry, employing on average 18 individuals.2
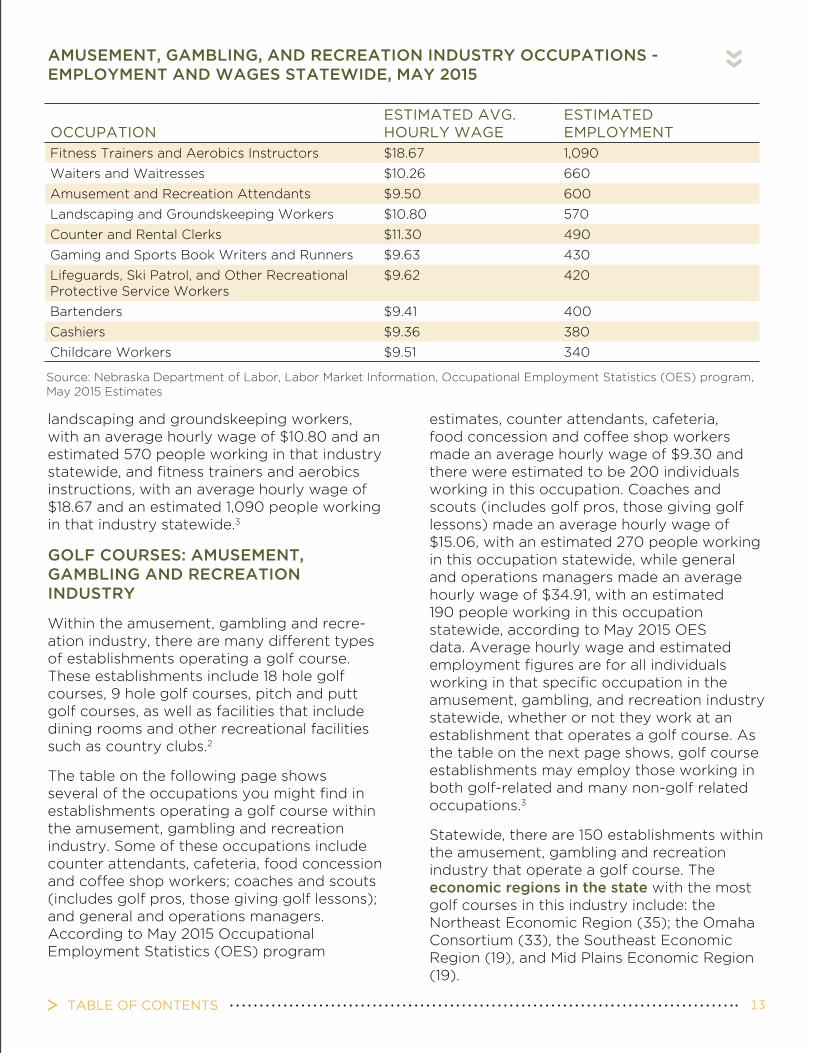
TABLE OF CONTENTS 13
Source: Nebraska Department of Labor, Labor Market Information, Occupational Employment Statistics (OES) program, May 2015 Estimates
landscaping and groundskeeping workers, with an average hourly wage of $10.80 and an estimated 570 people working in that industry statewide, and fitness trainers and aerobics instructions, with an average hourly wage of $18.67 and an estimated 1,090 people working in that industry statewide.3
GOLF COURSES: AMUSEMENT, GAMBLING AND RECREATION INDUSTRY
Within the amusement, gambling and recre-ation industry, there are many different types of establishments operating a golf course. These establishments include 18 hole golf courses, 9 hole golf courses, pitch and putt golf courses, as well as facilities that include dining rooms and other recreational facilities such as country clubs.2
The table on the following page shows several of the occupations you might find in establishments operating a golf course within the amusement, gambling and recreation industry. Some of these occupations include counter attendants, cafeteria, food concession and coffee shop workers; coaches and scouts (includes golf pros, those giving golf lessons); and general and operations managers. According to May 2015 Occupational Employment Statistics (OES) program
estimates, counter attendants, cafeteria, food concession and coffee shop workers made an average hourly wage of $9.30 and there were estimated to be 200 individuals working in this occupation. Coaches and scouts (includes golf pros, those giving golf lessons) made an average hourly wage of $15.06, with an estimated 270 people working in this occupation statewide, while general and operations managers made an average hourly wage of $34.91, with an estimated 190 people working in this occupation statewide, according to May 2015 OES data. Average hourly wage and estimated employment figures are for all individuals working in that specific occupation in the amusement, gambling, and recreation industry statewide, whether or not they work at an establishment that operates a golf course. As the table on the next page shows, golf course establishments may employ those working in both golf-related and many non-golf related occupations.3
Statewide, there are 150 establishments within the amusement, gambling and recreation industry that operate a golf course. The economic regions in the state with the most golf courses in this industry include: the Northeast Economic Region (35); the Omaha Consortium (33), the Southeast Economic Region (19), and Mid Plains Economic Region (19).
OCCUPATIONESTIMATED AVG. HOURLY WAGE
ESTIMATED EMPLOYMENT
Fitness Trainers and Aerobics Instructors $18.67 1,090
Waiters and Waitresses $10.26 660
Amusement and Recreation Attendants $9.50 600
Landscaping and Groundskeeping Workers $10.80 570
Counter and Rental Clerks $11.30 490
Gaming and Sports Book Writers and Runners $9.63 430
Lifeguards, Ski Patrol, and Other Recreational Protective Service Workers
$9.62 420
Bartenders $9.41 400
Cashiers $9.36 380
Childcare Workers $9.51 340
AMUSEMENT, GAMBLING, AND RECREATION INDUSTRY OCCUPATIONS - EMPLOYMENT AND WAGES STATEWIDE, MAY 2015»

14
Source: Nebraska Department of Labor, Nebraska Longitudinal Data System
During the 2nd quarter of 2015, the economic regions with the highest average quarterly employment at establishments operating a golf course were the Lincoln MSA with an average of 58 employees and the Omaha Consortium with an average of 51 employees. The rest of the state had on average 10 to 30 employees working at establishments operating a golf course.2 All employment estimates above refer to the estimated employment in the amusement, gambling and recreation industry statewide.
The next time you begin planning a golf trip, think about all the jobs in Nebraska created by this popular pastime.
SOURCES1. Nebraska Tourism Commission. 2013 Golf Nebraska Brochure
2. Nebraska Department of Labor, Labor Market Information, Quarterly Census of Employment and Wages (QCEW) program, 2nd quarter 2015 data https://neworks.nebraska.gov/vosnet/analyzer/results.aspx?session=ind202
3. Nebraska Department of Labor, Labor Market Information, Occupational Employment Statistics (OES) program, May 2015 estimates https://neworks.nebraska.gov/vosnet/analyzer/results.aspx?session=oeswage
4. Nebraska Department of Labor, Labor Market Information, Short Term Industry Projections 2015-2017 https://neworks.nebraska.gov/gsipub/index.asp?docid=439
OCCUPATIONESTIMATED AVG. HOURLY WAGE
ESTIMATED EMPLOYMENT
General and Operations Managers $34.91 190
Chefs and Head Cooks $25.55 30
Food Service Managers $22.58 10
First-Line Supervisors of Landscaping, Lawn Service, and Groundskeeper $22.49 110
Coaches and Scouts (includes Golf Pros, those giving golf lessons) $15.06 270
Locker room, Coatroom and Dressing Room Attendants $10.83 30
Landscaping and Groundskeeping workers $10.80 570
Lifeguards, Ski Patrol, and Other Recrational Protective Service Workers $9.62 420
Dishwashers $9.55 50
Counter Attendants, Cafeteria, Food Concession, and Coffee Shop $9.30 200
TYPICAL GOLF COURSE OCCUPATIONS IN THE AMUSEMENT, GAMBLING AND RECREATION INDUSTRY - EMPLOYMENT AND WAGES, MAY 2015»
Source: Nebraska Department of Labor, Labor Market Information, Occupational Employment Statistics (OES) program, May 2015 Estimates
AVG. QUARTERLY EMPLOYMENT PER ESTABLISHMENT
15026
3351
12
719
35
1915
1517
5
1914
185
10
12
58
AVG. QUARTERLY EMPLOYMENT PER ESTABLISHMENT
NUMBER OF ESTABLISHMENTS OPERATING A GOLF COURSE
PANHANDLE ECONOMIC REGION
MID-PLAINS ECONOMIC REGION
SANDHILLS ECONOMIC REGION
CENTRAL ECONOMIC REGION
SOUTHEAST ECONOMIC REGION
NORTHEAST ECONOMIC REGION
GRAND ISLAND MSA
LINCOLN MSA
OMAHA CONSORTIUM
STATEWIDE
AVG. QUARTERLY EMPLOYMENT PER ESTABLISHMENT
15026
3351
12
719
35
1915
1517
5
1914
185
10
12
58
AVG. QUARTERLY EMPLOYMENT PER ESTABLISHMENT
NUMBER OF ESTABLISHMENTS OPERATING A GOLF COURSE
PANHANDLE ECONOMIC REGION
MID-PLAINS ECONOMIC REGION
SANDHILLS ECONOMIC REGION
CENTRAL ECONOMIC REGION
SOUTHEAST ECONOMIC REGION
NORTHEAST ECONOMIC REGION
GRAND ISLAND MSA
LINCOLN MSA
OMAHA CONSORTIUM
STATEWIDE
AMUSEMENT, GAMBLING AND RECREATION ESTABLISHMENTS AND AVERAGE EMPLOYMENT BY REGION - 2ND QUARTER 2015
»

TABLE OF CONTENTS 15
MAY UNEMPLOYMENT DATAByron Lefler, Research Analyst
LINCOLN MSA (not seasonally adjusted) May Unemployment Rate: 2.5% May Total Non-farm: 188,843 Manufacturing: Largest OTM Increases:Mining & Construction: 282 (3.2%)Professional & Business Services: 94 (0.5%)
OMAHA MSA (not seasonally adjusted) May Unemployment Rate: 3.0%May Total Non-farm: 501,939Manufacturing: 32,485Largest OTM Increases: Leisure & Hospitality: 2,901 (5.8%)Trade, Transportation, & Utilities: 2,255 (2.3%)
GRAND ISLAND MSA (not seasonally adjusted) May Unemployment Rate: 3.0%May Total Non-farm: 42,777 Change (OTM): 420 (1.0%) Change (OTY): 653 (1.6%)
NEBRASKA (not seasonally adjusted)May Total Non-farm: 1,027,736Manufacturing: 97,948Nebraska (smoothed seasonally adjusted)May Unemployment Rate: 3.0%Change (OTM): Unchanged at 3.0%Change (OTY): 0.1 Economic Regions (not seasonally adjusted)Central: 2.5% Mid Plains: 2.7% Northeast: 2.9% Panhandle: 3.2% Sandhills: 2.3% Southeast: 2.7%
Sources: 1. Bureau of Labor Statistics Current Employment Statistics Program (CES)2. Bureau of Labor Statistics Local Area Unemployment Statistics (LAUS)
MAY UNEMPLOYMENT RATES BY COUNTY*
Cherry2.1 Holt
2.1
Custer2.5
Sioux2.2
Lincoln2.9
Sheridan2.4
Morrill3.5 Garden
2.9
Knox2.6
Keith2.5
Dawes2.5
Rock2.3
Brown3.9
Gage2.9
Hall3.1
Dundy1 .8
Chase2.0
Buffalo2.3
Grant2.2
Clay2.6
Kimball4.1
York2.6
Frontier3.1
Otoe2.9
Dawson2.8
Cedar2.3
Platte3.5
Arthur4.3
Burt3.1
Perkins2.2
Cheyenne2.6
Hayes2.3
Blaine4.1
Loup2.5
Box Butte3.7
Cass2.9
Boone2.1Banner
3.3
Polk2.4
Butler3.3
Furnas2.7
Hooker2.8
Antelope2.2
Saline2.6
Valley2.5
Pierce2.4
Logan2.6
Thomas2.9
Lancaster2.5
Dixon3.1
Harlan2.2
Adams2.7
Thayer2.4
Dodge2.8
Phelps2.2
Saunders2.9
McPherson1 .7
Deuel2.3
Howard2.7
Cuming2.6
Seward2.6
Greeley2.4
Fillmore2.6
Hitchcock2.9
Garfield2.1
Franklin3.1
Keya Paha1 .9
Webster2.8
Nance2.8
Madison2.5
Wheeler2.1
Nuckolls2.7
Colfax3.0
Gosper2.4
Scotts Bluff3.4
Jefferson2.2
Wayne2.5
Sherman2.9
Red Willow2.6
Kearney2.2
Hamilton2.4
Pawnee1 .7
Richardson2.9
Johnson2.7
Douglas3.0
Boyd2.2
Merrick3.1
Stanton2.3
Nemaha3.4
Thurston4.7
Sarpy2.7
Dakota3.2
Washington3.0
County Rates
1 .7 - 2.2
2.3 - 2.6
2.7 - 3.1
3.2 - 3.7
3.8 - 4.7
*Not seasonally adjusted

16
ECONOMIC INDICATORS UNEMPLOYMENT RATEKermit Spade, Research Analyst
In each new issue of Trends, the Economic Indicators section will feature a chart or graph focused on one of the economic indicators listed on the following page. This month, we’ll be focusing on the unemployment rate.
According to the Bureau of Labor Statistics, “Persons are classified as unemployed if they do not have a job, have actively looked for work in the prior four weeks, and are currently available for work. Persons who were not working and were waiting to be recalled to a job from which they had been temporarily laid off are also included as unemployed. Receiving benefits from the Unemployment Insurance (UI) program has no bearing on whether a person is classified as unemployed. The unemployment rate represents the number unemployed as a percent of the labor force.”1
UNEMPLOYMENT RATE
Source: U.S. Department of Labor, Bureau of Labor Statistics. Labor Force Characteristics.
0%
2%
4%
6%
8%
10%
12%
Jan-
90Ju
l-90
Jan-
91Ju
l-91
Jan-
92Ju
l-92
Jan-
93Ju
l-93
Jan-
94Ju
l-94
Jan-
95Ju
l-95
Jan-
96Ju
l-96
Jan-
97Ju
l-97
Jan-
98Ju
l-98
Jan-
99Ju
l-99
Jan-
00Ju
l-00
Jan-
01Ju
l-01
Jan-
02Ju
l-02
Jan-
03Ju
l-03
Jan-
04Ju
l-04
Jan-
05Ju
l-05
Jan-
06Ju
l-06
Jan-
07Ju
l-07
Jan-
08Ju
l-08
Jan-
09Ju
l-09
Jan-
10Ju
l-10
Jan-
11Ju
l-11
Jan-
12Ju
l-12
Jan-
13Ju
l-13
Jan-
14Ju
l-14
Jan-
15Ju
l-15
Jan-
16
Unemployment Rate
Recessions U.S. Nebraska
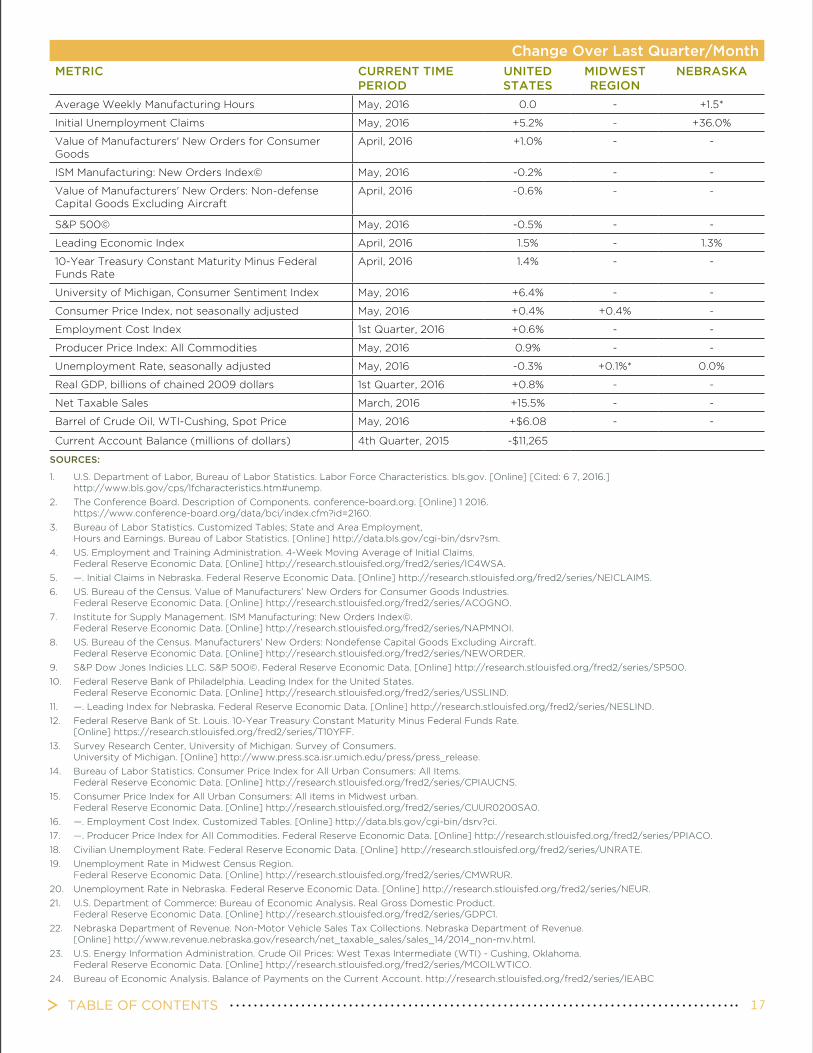
TABLE OF CONTENTS 17
Change Over Last Quarter/MonthMETRIC CURRENT TIME
PERIODUNITED STATES
MIDWEST REGION
NEBRASKA
Average Weekly Manufacturing Hours May, 2016 0.0 - +1.5*
Initial Unemployment Claims May, 2016 +5.2% - +36.0%
Value of Manufacturers' New Orders for Consumer Goods
April, 2016 +1.0% - -
ISM Manufacturing: New Orders Index© May, 2016 -0.2% - -
Value of Manufacturers' New Orders: Non-defense Capital Goods Excluding Aircraft
April, 2016 -0.6% - -
S&P 500© May, 2016 -0.5% - -
Leading Economic Index April, 2016 1.5% - 1.3%
10-Year Treasury Constant Maturity Minus Federal Funds Rate
April, 2016 1.4% - -
University of Michigan, Consumer Sentiment Index May, 2016 +6.4% - -
Consumer Price Index, not seasonally adjusted May, 2016 +0.4% +0.4% -
Employment Cost Index 1st Quarter, 2016 +0.6% - -
Producer Price Index: All Commodities May, 2016 0.9% - -
Unemployment Rate, seasonally adjusted May, 2016 -0.3% +0.1%* 0.0%
Real GDP, billions of chained 2009 dollars 1st Quarter, 2016 +0.8% - -
Net Taxable Sales March, 2016 +15.5% - -
Barrel of Crude Oil, WTI-Cushing, Spot Price May, 2016 +$6.08 - -
Current Account Balance (millions of dollars) 4th Quarter, 2015 -$11,265
SOURCES:
1. U.S. Department of Labor, Bureau of Labor Statistics. Labor Force Characteristics. bls.gov. [Online] [Cited: 6 7, 2016.] http://www.bls.gov/cps/lfcharacteristics.htm#unemp.
2. The Conference Board. Description of Components. conference-board.org. [Online] 1 2016. https://www.conference-board.org/data/bci/index.cfm?id=2160.
3. Bureau of Labor Statistics. Customized Tables; State and Area Employment, Hours and Earnings. Bureau of Labor Statistics. [Online] http://data.bls.gov/cgi-bin/dsrv?sm.
4. US. Employment and Training Administration. 4-Week Moving Average of Initial Claims. Federal Reserve Economic Data. [Online] http://research.stlouisfed.org/fred2/series/IC4WSA.
5. —. Initial Claims in Nebraska. Federal Reserve Economic Data. [Online] http://research.stlouisfed.org/fred2/series/NEICLAIMS.
6. US. Bureau of the Census. Value of Manufacturers’ New Orders for Consumer Goods Industries. Federal Reserve Economic Data. [Online] http://research.stlouisfed.org/fred2/series/ACOGNO.
7. Institute for Supply Management. ISM Manufacturing: New Orders Index©. Federal Reserve Economic Data. [Online] http://research.stlouisfed.org/fred2/series/NAPMNOI.
8. US. Bureau of the Census. Manufacturers’ New Orders: Nondefense Capital Goods Excluding Aircraft. Federal Reserve Economic Data. [Online] http://research.stlouisfed.org/fred2/series/NEWORDER.
9. S&P Dow Jones Indicies LLC. S&P 500©. Federal Reserve Economic Data. [Online] http://research.stlouisfed.org/fred2/series/SP500.
10. Federal Reserve Bank of Philadelphia. Leading Index for the United States. Federal Reserve Economic Data. [Online] http://research.stlouisfed.org/fred2/series/USSLIND.
11. —. Leading Index for Nebraska. Federal Reserve Economic Data. [Online] http://research.stlouisfed.org/fred2/series/NESLIND.
12. Federal Reserve Bank of St. Louis. 10-Year Treasury Constant Maturity Minus Federal Funds Rate. [Online] https://research.stlouisfed.org/fred2/series/T10YFF.
13. Survey Research Center, University of Michigan. Survey of Consumers. University of Michigan. [Online] http://www.press.sca.isr.umich.edu/press/press_release.
14. Bureau of Labor Statistics. Consumer Price Index for All Urban Consumers: All Items. Federal Reserve Economic Data. [Online] http://research.stlouisfed.org/fred2/series/CPIAUCNS.
15. Consumer Price Index for All Urban Consumers: All items in Midwest urban. Federal Reserve Economic Data. [Online] http://research.stlouisfed.org/fred2/series/CUUR0200SA0.
16. —. Employment Cost Index. Customized Tables. [Online] http://data.bls.gov/cgi-bin/dsrv?ci.
17. —. Producer Price Index for All Commodities. Federal Reserve Economic Data. [Online] http://research.stlouisfed.org/fred2/series/PPIACO.
18. Civilian Unemployment Rate. Federal Reserve Economic Data. [Online] http://research.stlouisfed.org/fred2/series/UNRATE.
19. Unemployment Rate in Midwest Census Region. Federal Reserve Economic Data. [Online] http://research.stlouisfed.org/fred2/series/CMWRUR.
20. Unemployment Rate in Nebraska. Federal Reserve Economic Data. [Online] http://research.stlouisfed.org/fred2/series/NEUR.
21. U.S. Department of Commerce: Bureau of Economic Analysis. Real Gross Domestic Product. Federal Reserve Economic Data. [Online] http://research.stlouisfed.org/fred2/series/GDPC1.
22. Nebraska Department of Revenue. Non-Motor Vehicle Sales Tax Collections. Nebraska Department of Revenue. [Online] http://www.revenue.nebraska.gov/research/net_taxable_sales/sales_14/2014_non-mv.html.
23. U.S. Energy Information Administration. Crude Oil Prices: West Texas Intermediate (WTI) - Cushing, Oklahoma. Federal Reserve Economic Data. [Online] http://research.stlouisfed.org/fred2/series/MCOILWTICO.
24. Bureau of Economic Analysis. Balance of Payments on the Current Account. http://research.stlouisfed.org/fred2/series/IEABC

18
Nebraska Department of LaborOffice of Labor Market Information550 S 16th StreetLincoln NE 68508
Telephone 800.876.1377Email [email protected]
Equal Opportunity Employer/Program.Auxiliary aids and services are available upon request to individuals with disabilities.TDD: 1.800.833.7352