July 2015 2Q 2015 Results Update - Beranda : BTPN · PDF fileNote: * Others include Joint...
18
July 2015 2Q 2015 Results Update
-
Upload
nguyenphuc -
Category
Documents
-
view
215 -
download
2
Transcript of July 2015 2Q 2015 Results Update - Beranda : BTPN · PDF fileNote: * Others include Joint...

July 2015
2Q 2015 Results Update

Loans Growth in line with Industry:
Loans growth: 11.4% (YoY); 7.1% (YTD) vs Industry: 10.4% (May ‘15 YoY)
Deposits growth: 8.4% (YoY) vs Industry: 12.5% (May ‘15 YoY)
Liquidity condition remains strong:
LFR: 86%; LFR (incl. Equity): 72%
LDR: 98%
Liquid Asset Ratio: 35%
Healthy Key Ratios:
NIM: 11.2%
NPL: 0.8%
ROE: 15.0%
CAR: 23.6%
Fee Income Growth:
Fee Income: IDR 366 bio (12% YoY)
Net Income:
1H NPAT: IDR 928 bio (-7% YoY)
2Q NPAT: IDR 448 bio (-7% QoQ; -11% YoY)
1
Steady Loans Growth and Strong Liquidity
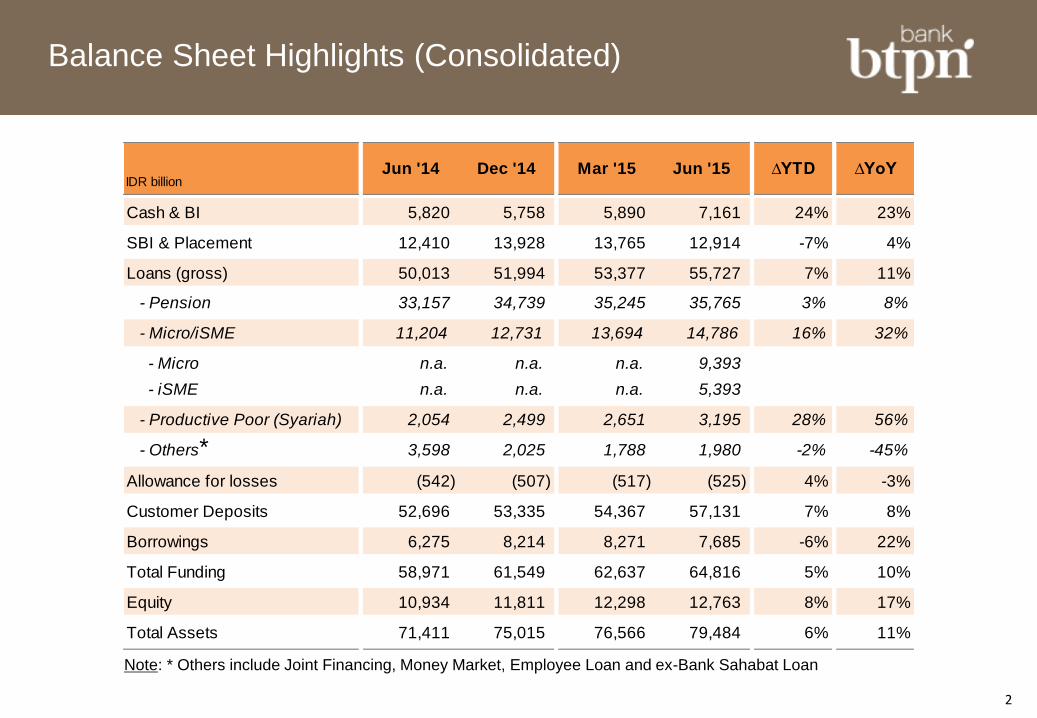
Balance Sheet Highlights (Consolidated)
2
Note: * Others include Joint Financing, Money Market, Employee Loan and ex-Bank Sahabat Loan
*
IDR billion
Cash & BI 5,820 5,758 5,890 7,161 24% 23%
SBI & Placement 12,410 13,928 13,765 12,914 -7% 4%
Loans (gross) 50,013 51,994 53,377 55,727 7% 11%
- Pension 33,157 34,739 35,245 35,765 3% 8%
- Micro/iSME 11,204 12,731 13,694 14,786 16% 32%
- Micro n.a. n.a. n.a. 9,393
- iSME n.a. n.a. n.a. 5,393
- Productive Poor (Syariah) 2,054 2,499 2,651 3,195 28% 56%
- Others 3,598 2,025 1,788 1,980 -2% -45%
Allowance for losses (542) (507) (517) (525) 4% -3%
Customer Deposits 52,696 53,335 54,367 57,131 7% 8%
Borrowings 6,275 8,214 8,271 7,685 -6% 22%
Total Funding 58,971 61,549 62,637 64,816 5% 10%
Equity 10,934 11,811 12,298 12,763 8% 17%
Total Assets 71,411 75,015 76,566 79,484 6% 11%
Jun '14 Dec '14 ∆YoYMar '15 Jun '15 ∆YTD

IDR billion
Interest income 6,093 12,293 3,150 3,223 6,372 5%
Interest expense 2,560 5,252 1,305 1,333 2,638 3%
Net interest income 3,533 7,041 1,845 1,890 3,734 6%
Fee income 327 740 181 185 366 12%
Operating income 3,860 7,780 2,026 2,075 4,101 6%
Operating expense 2,131 4,501 1,169 1,253 2,422 14%
- Business As Usual (BAU) 1,697 3,602 889 912 1,801 6%
- New Investment - 66 49 85 133
- TUR (Productive Poor) 404 784 225 241 466 15%
- MSOP 30 49 7 15 22 -26%
Net operating income 1,730 3,279 857 822 1,679 -3%
Loan loss provision 373 744 200 198 398 7%
NPBT 1,349 2,523 656 622 1,278 -5%
NPAT 996 1,853 481 448 928 -7%
1H '14 FY '14 ∆YoY1Q '15 2Q '15 1H '15
Profit & Loss Highlights (Consolidated)
3
*
Note: * New Investment for SME business and BTPN WOW!

Key Ratios
4
%
NIM 11.7 11.4 11.3 11.1 11.2
Cost to Income 55 58 58 60 59
Cost to Income (bank only) 55 56 54 58 56
Cost to Income (bank only - BAU) 54 55 51 52 51
LDR (end of period) 95 97 98 98 98
Loan to Funding 85 84 85 86 86
Loan to Funding (incl. Equity) 72 71 71 72 72
Liquid Asset Ratio 35 37 36 35 35
NPL 0.9 0.7 0.8 0.8 0.8
Cost of Credit/Avg. Loan 1.6 1.5 1.5 1.5 1.5
LLP/NPL 125 139 128 121 121
ROA (before tax) 3.9 3.6 3.5 3.2 3.4
ROE (after tax) 19.0 16.9 15.8 14.2 15.0
CAR (credit & ops risk) 23.4 23.3 24.9 23.6 23.6
Equity/Assets 15.3 15.7 16.1 16.1 16.1
2Q '15 1H '15FY '14 1Q '151H '14

LOANS COMPOSITION
75% 72%
69% 67% 64%
22%
23%
22%
24% 17%
10%
5%
9%
9% 9%
Dec '11 Dec '12 Dec '13 Dec '14 Jun '15
Pension Micro iSME Others*
NPL & COST OF CREDIT
1.7 1.7 1.5 1.5 1.5
0.87 0.81 0.70 0.76 0.78
Jun '14 Sep '14 Dec '14 Mar '15 Jun '15
Cost of Credit / Avg Loans NPL (gross)
IDR tio %
NPL BY BUSINESS
%
0.1 0.1
0.1
3.5 3.3 3.0 3.2
3.5
0.2 0.7 0.8 0.9
1.2 1.2
Jun '14 Sep '14 Dec '14 Mar '15 Jun '15
Pension Micro iSME SyariahNote: * including Syariah Financing, Joint Financing, Money Market loan,
Employee loan and ex-Bank Sahabat loan
Loans Composition & Portfolio Quality
30.3
38.8
46.1
52.0
5
55.7

COST OF FUND*
FUNDING COMPOSITION CUSTOMER DEPOSIT COMPOSITION
14 14 13 13 15
27 26 27 24 20
2 4 7
Dec '11 Dec '12 Dec '13 Dec '14 Jun '15
Primary Secondary Tertiary*
LIQUID ASSETS RATIO
(Against Total Customer Deposits)
* Revolving Standby Loan IFC/SMBC
89% 90%
89% 87% 88%
11%
10% 11% 13%
12%
Dec '11 Dec '12 Dec '13 Dec '14 Jun '15
Customer Deposits Bonds & Borrowings
IDR tio
%
83% 85%
86% 85% 83%
17%
15%
14% 15% 17%
Dec '11 Dec '12 Dec '13 Dec '14 Jun '15
TD CASA
IDR tio
52.2 53.3
%
8.8 9.2 9.4 9.7
9.0 8.9 8.6
Dec '13 Mar '14 Jun '14 Sep '14 Dec '14 Mar '15 Jun '15
* Customer deposits (BTPN only) – monthly
Funding Composition & Liquidity Reserves
40.1
50.2
58.6 61.5
57.1
45.1
6
35.6
64.8

Fee-based Income
2Q '14 3Q '14 4Q '14 1Q '15 2Q '15
IDR bio
185
FEE-BASED INCOME
181 185
227
186
Insurance commission related fee income:
63% 57% 72% 40% 41%
177 (48%)
148 (41%)
18 (5%)
23 (6%)
Loans Insurance Funding Others
IDR bio
FEE-BASED INCOME COMPOSITION – YTD
7

iSME
8

9
Productive Poor
Micro
iSME
STO: IDR 100 – 400 bio
Loan: IDR 10 – 50 bio SME
Medium &
Large
Corporation
STO: IDR 2.5 – 100 bio
Loan: IDR 1 – 10 bio
STO < IDR 2.5 bio
Loan: < IDR 1 bio
Loan: IDR 10 mio
Note: STO = Annual Sales Turnover
MARKET
(Customers)
~ 550K
~ 40 mio
~ 36 mio
(female only)
SERVED
BY
BUSINESS SIZE
(Jun ‘15)
OUR
CUSTOMERS
• Since 2014
• 1,300 customers
• IDR 5.4 tio lending
• Since 2012
• 1.9 mio customers
• IDR 3.2 tio
financing
• Since 2009
• 255K customers
• IDR 9.4 tio lending
New Target Market – Lending

iSME: 3-in-1 UVP for Growth
10
Success of
Our
Customers
Financial Solution
Open up Access to Market:
• Linkage to formal supply chain
• Create iSME Virtual Market to
connect the client to the potential
market
Access to Market
• Mitra Bisnis Info for generic and customized information sharing
• Mitra Bisnis Club for networking and exchange of experience
• Mitra Bisnis Consultant for business consultancy service provided by experienced and certifiied
Relationship Manager
Capacity Development
A bundle of Financial Solution delivered
in simple-flexible-fast fashion
• Basic lending products (overdraft
facility, demand loan, term loan /
investment loan)
• Asset Based Financing Products

11

12
Achievement (as of July 2015)
btpn WOW! Agent Management Model
Regional Sales Manager
(RSM)
Area Sales Manager
(ASM)
CUSTOMERS
National Sales Manager
(NSM)
Agents
WOW! Area Repre-
sentative (WAR)
549 WARs
2,835 Agents
86,904 Customers
Total Savings:
IDR 54 bio
A WAR also acquires
customers
Progress Update

13
Enable all points
of sales and WARs
with collaterals
and trainings
POS: collaterals Video for WAR: how to become a WOW! Agent
100 Agent Branding visibility
Build customer
education
through a BTL
heavy approach
(including WOM)
BTL Activation: Kampung WOW! Direct selling with 4 wheeler
Community Event: Layar Tancep, Bazaar, Fogging, etc,
WOM campaign: Agen Rumpi with Buzz & Co
Marketing Activities

14

1,354
2,054 2,189 2,499 2,651
3,195
Dec '13 Jun '14 Sep '14 Dec '14 Mar '15 Jun '15
IDR bio
FINANCING CUSTOMERS BY CYCLE
OUTLETS & EMPLOYEES FINANCING
TOTAL CUSTOMERS
1,174 1,292 1,423 1,627 1,683 1,724
52 15 23 8,011 8,368
9,774 10,828 11,427 11,939
Dec '13 Jun '14 Sep '14 Dec '14 Mar '15 Jun '15
Outlets - Operational Outlets - Ready to Roll-out Employees
932 1,141
1,273 1,565 1,710
1,919
Dec '13 Jun '14 Sep '14 Dec '14 Mar '15 Jun '15
Cycle 1 51%
Cycle 2 28%
Cycle 3 15%
Cycle 4 & 5 6%
Thousands
15
Productive Poor

IDR billion
Cash & BI 251 302
SBI & Placement 737 805
Financing & Loans (gross) 2,686 3,195
- Productive Poor (Syariah) 2,651 3,195
- Others 35 -
Allowance for losses (53) (50)
Deposits & Temporary Syirkah Funds 2,865 3,374
Equity 853 1,053
Total Assets 3,938 4,718
Mar '15 Jun '15
BTPN Syariah: 2Q 2015 Financial Results
BALANCE SHEET
16
PROFIT & LOSS
Note: * ex-Bank Sahabat loans
*
IDR billion
- Bank's share in profit sharing 270 312 582
- Other operating income 3 9 11
Operating income 272 321 593
Operating expense 225 241 466
Loan loss provision 17 26 43
NPAT 22 38 61
1Q '15 2Q '15 1H '15
THANK YOU