
July 2014 energy ltd Montney Lightstream Montney Nuvista Montney Paramount Montney RMP Montney 7G...
32
cequence energy ltd July 2014
Transcript of July 2014 energy ltd Montney Lightstream Montney Nuvista Montney Paramount Montney RMP Montney 7G...

cequenceenergy ltd
July 2014

Forward‐Looking Information and Definitions
Summary of Forward‐Looking Statements or InformationCertain information included in this presentation constitutes forward‐looking information under applicable securities legislation. This information relates to future events or future performance of the Company. Investors are cautioned that reliance on such information may not be appropriate for making investment decisions. Many factors could cause the Company’s actual results, performance or achievements to vary from those described herein. The forward‐looking information contained in this presentation is expressly qualified by this and other cautionary statements set forth in the continuous disclosure record of the Company.For a complete description of the forward‐looking statements or information and the definitions used in this presentation, see slide 30 "Forward‐Looking Statements or Information and Definitions."
2

British Columbia Alberta
PEACE RIVER
GRANDE PRAIRIE
Montney Focused Deep Basin Gas
3
USACANADA
Deep Basin
Large operated land position in core Montney trend in Alberta
Strong balance sheet, exit 2014 debt 0.6 times cashflow
Facilities in place Current production 10,400 Boepd Plan to reach 15,000 Boepd in next 9
months
SIMONETTE PROJECT
SIMONETTE PROJECT

Alberta Deep Basin Montney
Cequence owns 89 net sections of Montney land at Simonette in the liquids rich, over‐pressured Montney fairway
4
Approximate TopOver Pressure
XTO
XTOXTO
XTO
XTO
XTO
XTO
XTO XTO
XTO
XTO
XTO
XTO
XTO
XTO
KARR
WAPITI
KAKWA
RESTHAVEN
SIMONETTE
WASKAHIGAN
FIR
ANTE CREEK
Land LegendApache MontneyARC MontneyAthabasca MontneyCIOC MontneyCNRL MontneyCequence MontneyChevron MontneyCPC MontneyDelphi MontneyDonnybrook MontneyEncana MontneyEnerplus MontneyXTO Canada MontneyKelt MontneyLightstream MontneyNuvista MontneyParamount MontneyRMP Montney7G MontneyYoho All Rights
LegendXTO Hzntls Licensed since 2013
R21W5R1W6 R22R23R24R25R26R2R3R4R5R6R7R8R9
T55
T56
T57
T58
T59
T60
T61
T62
T63
T64
T65
T66
T67
T68
T69

Recent Highlights
5
Sold 1,600 Boepd non‐operated asset for $141 million
$135 million senior credit facility undrawn post asset sale
Pad style development drilling now started at Simonette
Increasing 2014 capital program to $170 million (net $23 million after divestitures) and $58 million in Q1 2015
Target exit rate in March 2015 of 15,000 Boepd and $82 million net debt
Production growth to over 40,000 Boepd by year end 2018
Corporate Profile
6
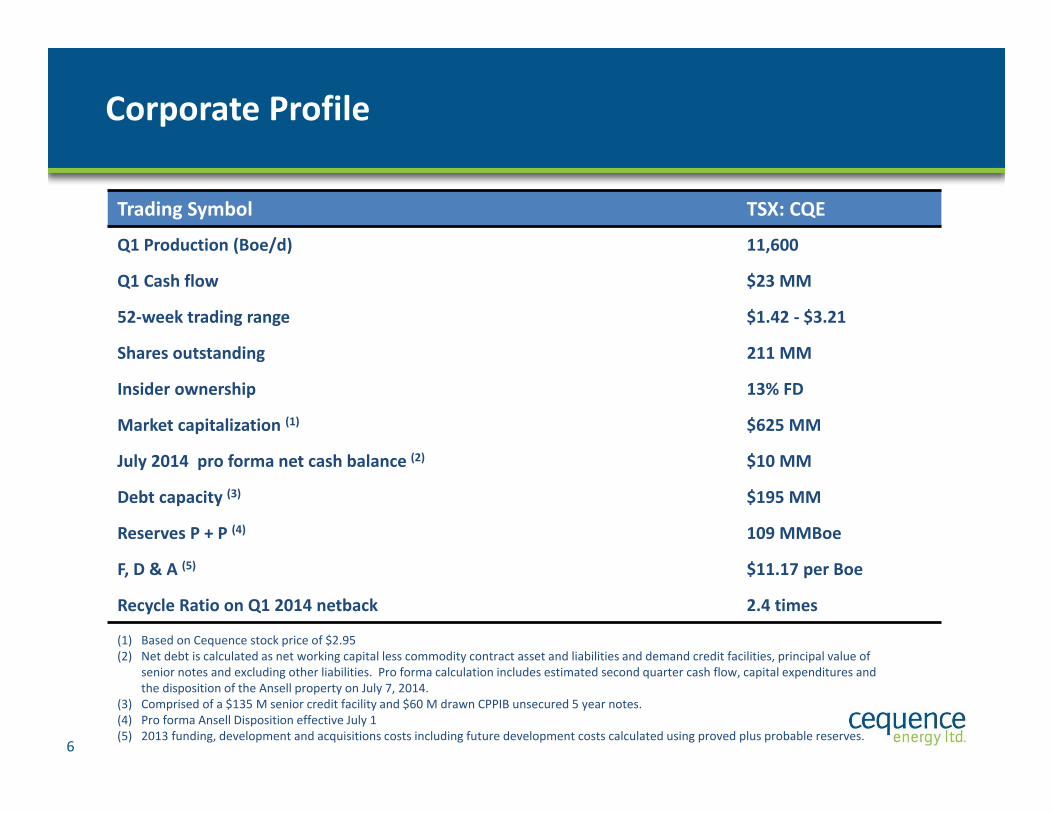
Trading Symbol TSX: CQE
Q1 Production (Boe/d) 11,600
Q1 Cash flow $23 MM
52‐week trading range $1.42 ‐ $3.21
Shares outstanding 211 MM
Insider ownership 13% FD
Market capitalization (1) $625 MM
July 2014 pro forma net cash balance (2) $10 MM
Debt capacity (3) $195 MM
Reserves P + P (4) 109 MMBoe
F, D & A (5) $11.17 per Boe
Recycle Ratio on Q1 2014 netback 2.4 times
(1) Based on Cequence stock price of $2.95(2) Net debt is calculated as net working capital less commodity contract asset and liabilities and demand credit facilities, principal value of
senior notes and excluding other liabilities. Pro forma calculation includes estimated second quarter cash flow, capital expenditures and the disposition of the Ansell property on July 7, 2014.
(3) Comprised of a $135 M senior credit facility and $60 M drawn CPPIB unsecured 5 year notes.(4) Pro forma Ansell Disposition effective July 1(5) 2013 funding, development and acquisitions costs including future development costs calculated using proved plus probable reserves.

Corporate Guidance
2014 Q1 2015
Average Production (Boe/d) 11,000 13,500
Exit production (Boe/d) 12,000 15,000
Capital expenditures, prior to dispositions (4) $170 MM $58 MM
Capital expenditures, net of dispositions $23 MM $58 MM
Wells drilled 19 (15.2) 6 (6.0)
Operating and transportation costs per Boe $9.00 $8.20
Royalties (% of revenue) 10% 8%
Crude oil – WTI (US$/Bbl) $99.75 $97.00
Natural gas – AECO (Cdn$/GJ) $4.60 $3.85
Funds flow from operations (2) $83 MM $27 MM
Net debt and working capital deficiency (3) $51 MM $82 MM
Basic shares outstanding 211 MM 211 MM
(1) Comprised of 84 percent natural gas and 16% of oil and liquids(2) Funds flow from operations is calculated as cash flow from operating activities before adjustments for decommissioning liabilities(3) Net debt and working capital (deficiency) is calculated as cash and net working capital less commodity contract assets and liabilities,demand credit facilities and the aggregate principal amount of the Notes and excluding other liabilities.(4) Includes an estimated $24.1 million of capital expenditures in 2014 on the Ansell property prior to disposition.7

8
Cequence Simonette 13‐11 Compressor Station
Cequence Simonette 13‐11 Compressor Station

3D SeismicCoverage
Trilogy PlantCQE W.I. = 25%Capacity 10 MMcf/d
9‐10Field Compressor
Keyera ProcessingFacility Capacity 153 MMcf/d
13‐11Compressor Station
To Aux SableDeep Cut PlantChicago, Illinois
CQE GAS To Aux Sable
CQE Land
Alliance PipelineCQE Gathering System3D Seismic Outline
TCPL PipelinePembina Pipeline
R23W5R1W6 R24R25R26R27R2
T60
T61
T62
T63
T64
Simonette Project Infrastructure‐ Ready for full scale development
9
6 miles
13‐11 Facility ‐ Current Capacity 70 MMcf/d
Cequence AllianceMeter StationCapacity 120 MMcf/d
Cequence owns and operates its facilities at Simonette
Phase 6 Facility expansion planned in Q4 to 95 MMcfd
Potential for future additional expansion up to 100 MMcfd to TCPL.
Simonette Area – Q1 operating netback was $35 per Boe prior to hedging

OIL
GAS(Avg 27 Bbls/MMcf Condensate)
100+
Bbls/MMcf
Montney Rights
CQE Montney Oil WellIndustry Montney Oil Well
CQE Montney Gas Well
Industry Montney HZ Well
CQE Wells to Q1 2015
Cequence Land
R25W5R1W6 R26R27
T60
T61
T62
Simonette Montney Drilling Plan through to Q1 2015
10
Currently drilling first pad at 1‐32, second pad at 12‐26 to spud in August
35 pad sites built or approved
Gas condensate yields have increased to 27 Bbls per MMcf, 40 Bbls per MMcf of total NGLs
6 miles
LOWER MONTNEYLOCATION
12‐26 PAD
1‐32PAD
OILGAS
Montney Rights
CQE Montney Oil WellIndustry Montney Oil Well
CQE Montney Gas Well
Industry Montney HZ Well
CQE Planned Wells
Cequence Land
R25W5R1W6 R26R27
T60
T61
T62
Simonette Upper Montney Development Plan
11
6 miles
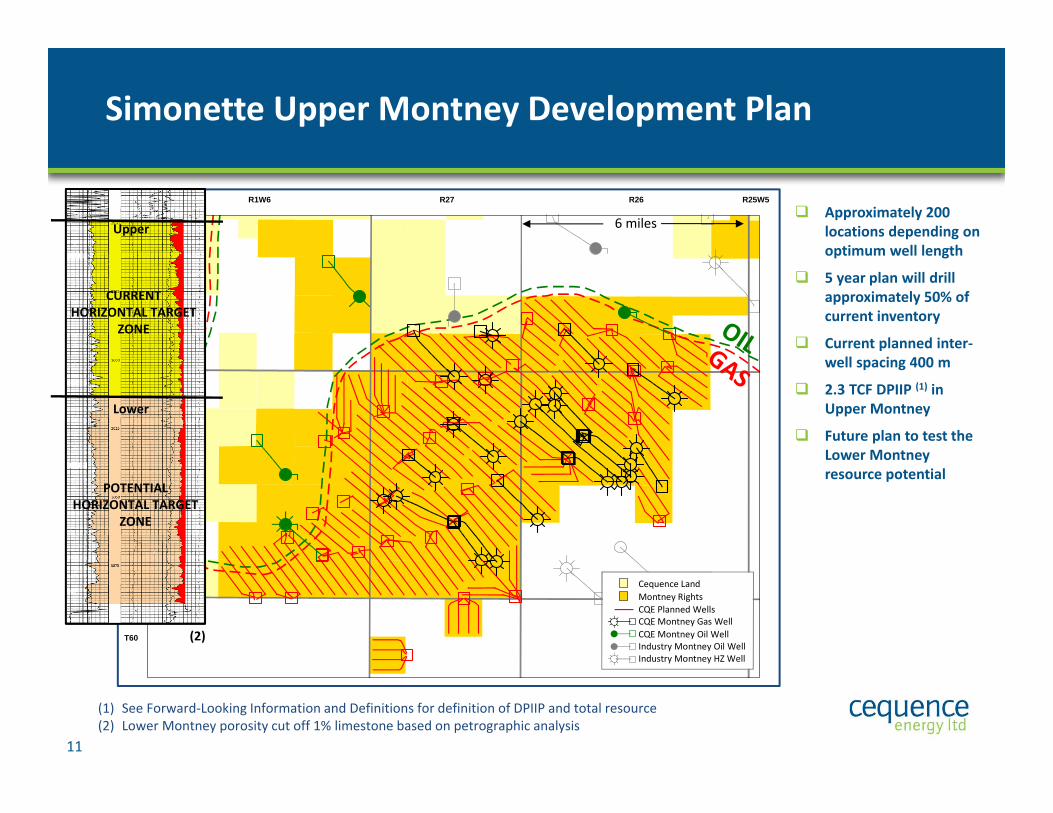
(1) See Forward‐Looking Information and Definitions for definition of DPIIP and total resource(2) Lower Montney porosity cut off 1% limestone based on petrographic analysis
Approximately 200 locations depending on optimum well length
5 year plan will drill approximately 50% of current inventory
Current planned inter‐well spacing 400 m
2.3 TCF DPIIP (1) in Upper Montney
Future plan to test the Lower Montneyresource potential
Lower
CURRENT HORIZONTAL TARGET
ZONE
POTENTIAL HORIZONTAL TARGET
ZONE
Upper
(2)

0
1
2
3
4
5
6
7
8
9
10
11
12
1 2 3 4 5 6 7 8 9 10 11 12 13 14 15 16 17 18 19 20
Prod
ucing Daily Gas Rate (M
Mcf/d)
Months on Production
CQE 7 BCF High Case
CQE 5 BCF Base Case
Cequence Montney gas producers – 19 wells to date
12
`HALF CYCLE ECONOMICS BASE CASE‐Budget model HIGH CASE
IP (MMcf/d)IP 30 (MMcf/d)EUR (MBoe) Raw Gas (Bcf) Condy (MBbl) NGL (MBbl)
5.54.69255.010050
7.56.91,2907.015065
CAPEX $MM (D,C + TI)ROR BT (%)NPV $MM (10%)PAYOUT (YEARS)CAPITAL EFFICIENCY(1st YEAR, $/Boed)
7.5606.61.6
14,000
7.5135121.0
10,000
Includes 5% GORR, Opex $4.00 per Boe Gas rate does not include liquids
Assumes 30 Bbls/MMcf of NGL’s and condensate Assumes $4.00/GJ AECO, $90 WTI flat *Wells with mechanical complications included
* Mechanical Complications

13
8‐21 costs contain original well combined with re‐drill 9‐21 completion costs 13‐35 was a re‐entry of an existing vertical uphole producer 16‐10 was a strat test with pilot hole and coring program
Montney Drilling and Completion Costs‐Long term target of $7.5 million is achievable
0
10
20
30
40
50
60
70
80
$‐
$1,000
$2,000
$3,000
$4,000
$5,000
$6,000
$7,000
$8,000
# of frac
stages
Total $/m
HZ
Total $/m HZ
# of frac stagesTotal $/m HZ includes pilot hole

Dunvegan
Dunvegan
Wilrich
Wilrich
Falhe
r
Dunvegan HZ GasDunvegan HZ OilWilrich HZFalher HZ
Vertical wells in trend
CQE Dunvegan/Falher Rights
R25W5R1W6 R26R27R2
T60
T61
T62
T63
Simonette Dunvegan, Falher and Wilrich plays
Dunvegan Oil and Gas/Condensate play 10‐2 well 90 day IP was 13
MMcf/d 5‐2 well 60 day IP was 9
MMcf/d Cequence has 11 net potential
sections on trend Up to 25 BCF/sec resource
potential
Falher play First two CQE wells – average
90 day IP of 5.5 MMcf/d with 21 bbls/MMcf condensate
Cequence has mapped 28 potential locations on 14 net existing sections
Analog pool produces 60 MMcf/d from 21 existing producers
Wilrich play 20 net sections currently
mapped with 40 potential locations
14
6 miles

Dunvegan Model
15
0
2
4
6
8
10
12
14
16
18
20
22
0 2 4 6 8 10 12 14 16 18 20 22 24
Daily Gas Rate (M
Mcf/d)
Months on Production
10‐02‐61‐02W6
05‐02‐61‐02W6
CQE Working Model
HALF CYCLE ECONOMICS Working Model
IP (MMcf/d)IP 30 (MMcf/d)EUR (MBoe) Raw Gas (Bcf) Condy (MBbl) NGL (MBbl)
10.59.310506.06070
CAPEX $MM (D,C + TI)ROR BT (%)NPV $MM (10%)PAYOUT (YEARS)CAPITAL EFFICIENCY(1st YEAR, $/Boed)
7.51639.90.88,500
Assumes 23 Bbls/MMcf of NGL’s and condensate Assumes $4.00/GJ AECO, $90 WTI flat
Year 1 Opex $2.00 per Boe Gas rate does not include liquids

Falher Model
16
0
2
4
6
8
10
12
14
0 2 4 6 8 10 12 14 16 18 20 22 24
Daily Gas Rate (M
Mcf/d)
Months on Production
16‐18‐61‐01W6
07‐06‐61‐01W6
CQE Working Model
MODEL
HALF CYCLE ECONOMICS Working Model
IP (MMcf/d)IP 30 (MMcf/d)EUR (MBoe) Raw Gas (Bcf) Condy (MBbl) NGL (MBbl)
7.86.08004.011060
CAPEX $MM (D,C + TI)ROR BT (%)NPV $MM (10%)PAYOUT (YEARS)CAPITAL EFFICIENCY(1st YEAR, $/Boed)
8.0535.71.7
15,000
Assumes 45 Bbls/MMcf of NGL’s and condensate Assumes $4.00/GJ AECO, $90 WTI flat
Year 1 Opex $2.00 per Boe Gas rate does not include liquids

Conclusions
17
Simonette Project – start of significant development drilling program to unlock this large resource play
Financial strength ‐ strong balance sheet with $135 million undrawn bank facility through year end 2014
Team has a proven record of capturing large resource opportunities
Highly experienced Board of Directors and Deep Basin Management team with significant ownership

18
Appendix
Cequence Simonette 13‐11 Compressor Station

Management and Board
19
Management Team
Paul Wanklyn ‐ President and CEOPaul Wanklyn ‐ President and CEO
Howard Crone ‐ Executive VP and COOHoward Crone ‐ Executive VP and COO
Steve Stretch ‐ VP Exploration and Chief GeophysicistSteve Stretch ‐ VP Exploration and Chief Geophysicist
Dave Gillis ‐ VP Finance and CFODave Gillis ‐ VP Finance and CFO
Dave Robinson ‐ VP Exploration and Chief GeologistDave Robinson ‐ VP Exploration and Chief Geologist
James Jackson ‐ VP EngineeringJames Jackson ‐ VP Engineering
Chris Soby ‐ VP Land and Corporate DevelopmentChris Soby ‐ VP Land and Corporate Development
Mike Stewart ‐ VP OperationsMike Stewart ‐ VP Operations
Erin Thorson ‐ ControllerErin Thorson ‐ Controller
Board of Directors
Don Archibald ‐ ChairmanDon Archibald ‐ Chairman
Peter BannisterPeter Bannister
Rob CookRob Cook
Howard CroneHoward Crone
Brian FeleskyBrian Felesky
Daryl GilbertDaryl Gilbert
Frank MeleFrank Mele
Paul WanklynPaul Wanklyn
James Gray ‐ Director EmeritusJames Gray ‐ Director Emeritus

Financial Highlights
Q1 2014 Q4 2013 % Change
Average Daily Production (Boe/d) 11,613 10,394 12
Funds flow from operations ($M) (1) $23,082 $14,855 55
Per share, basic and diluted $0.11 $0.07 57
Operating costs per Boe $7.40 $7.33 1
G&A per Boe $2.34 $1.65 42
Capital expenditures, net ($M) $55,318 $51,531 7
Net debt and working capital (deficiency) ($M)(2) ($143,536) ($111,433) 29
Weighted average shares outstanding (diluted) (M) 210,918 210,917 0
20
(1) Funds flow from operations is calculated as cash flow from operating activities before adjustments fordecommissioning liabilities expenditures and net changes in non‐cash working capital(2) Net debt and working capital (deficiency) is calculated as cash and net working capital less commodity contractassets and liabilities and demand credit facilities, long term debt and excluding other liabilities

Production and Cash Costs
21
(1) Operating cost, transportation, G&A and Interest
Simonette will drive 44% growth to exit in 2015
Total cash costs are in the top quartile of Canadian producers
0
2,000
4,000
6,000
8,000
10,000
12,000
14,000
16,000
2010 2011 2012 2013 2014Est.
Q12015Est.
Boe/d
Production (Boe/d)
Natural Gas Oil & NGL
Merger with Temple Energy
Includes Ansell disposition July 7 close
$0
$2
$4
$6
$8
$10
$12
$14
$16
$18
$20
2010 2011 2012 2013 2014Est.
Q12015Est.
$/Bo
e
Cash Cost ($/Boe)
Cash Cost ($/Boe)

Netback Table – Q1 2014
Simonette Corporate Total
Average daily production (Boe/d) 8,263 11,612Natural gas (MMcf/d) 41.7 59.9
Oil and liquids (Bbls/d) 1,308 1,630
Sales price ($/Boe) $45.76 $44.29
Royalties ($/Boe) ($4.08) ($4.13)
Operating cost ($/Boe) ($5.59) ($7.40)
Transportation cost ($/Boe) ($1.13) ($1.52)
Operating netback $34.96 $31.25
G&A ($/Boe) ($2.34)
Interest ($/Boe) ($1.79)
Cashflow netback ($/Boe) $22.14
22
Note: AECO C spot price of $5.59 CDN$/Mcf and WTI crude oil price of $98.65 US$/Bbl

Hedging
Contract Type Volume GJ/d CAD Price
2014 July 1, 2014 to December 31, 2014 Average GasSwap 30,000 $3.43/GJ AECO or
$3.90/Mcf
2015 January 1, 2015 to March 31, 2015 Average Gas Swap 20,000 $3.79/GJ AECO or
$4.32/Mcf
2015 April 1, 2015 to December 31, 2015 Average Gas Swap 10,000 $3.73/GJ AECO or
$4.25/Mcf
23
(1) Percentage calculated assuming current forecast production net of royalties and an estimated heat content

Reserves and Finding Costs – solid growth per share in reserves and value
$0.00
$2.00
$4.00
$6.00
$8.00
$10.00
$12.00
$14.00
$16.00
2010 2011 2012 2013
FD&A ($/Boe)
Proved + Probable (Incl FDC)
24
0.0
0.1
0.2
0.3
0.4
0.5
0.6
0.7
0
20
40
60
80
100
120
140
2010 2011 2012 2013Proved + Probable (2)Total Proved2P per share
49
91
67
3
4
5
6
0
200
400
600
800
1000
1200
2010 2011 2012 2013
2P Reserve Value
Reserve Value 2P per shareProved + Probable GLJ Dec.31, 2013
$1,004(1)
$525
$715$797
Reserves
109
MMBo
e
Boe/share
$MM
$/share
3 year average $11.61 per Boe Reserves increased
122% since 2010
Reserve value has doubled since 2010
(1) NPV10(2) Pro forma Ansell disposition

0
5,000
10,000
15,000
20,000
1.00 2.00 3.00 4.00 5.00 6.00 7.00
NPV
10%
BT ($M)
Flat AECO Gas Price ($/MMBtu)
3.0 BCF + NGL's 5.0 BCF + NGL's 7.0 BCF + NGL's
25
Montney Half Cycle Economics ‐ Sensitivity to Flat Gas Price and Recoverable Gas in Place per Well
Assumptions:Net NGL Yield: 30 Bbl/MMcf C3+Capital: $7.5 MMOil Price: $90/Bbl WTI
Notes: With 5% GORR, Oil $90/Bbl, C3 $31.5/Bbl,C4 $70/Bbl, C5+ $95/Bbl

Simonette Deep Basin Stack
26
Dunvegan
Falher Bluesky / Gething
MontneyWilrich
Simonette Upper
Simonette Lower
CURRENT HORIZONTAL TARGET ZONE
POTENTIAL HORIZONTAL TARGET ZONE

CEQUENCE LAND
27
5‐25 BCF
5‐24 BCF 5‐24 BCF
5‐25 BCF
30‐60 BCF
Dunvegan
FalherWilrich
Gething
UpperMontney
Zone Total ResourcePotential/Sec (1)
2,400m
2,950m
3,100m
2,700m
2,500m
2,800m
(1) See Forward‐Looking Information and Definitions for definition of total resource
6 miles
Multiple Zones with Significant Resource Potential at Simonette

Alberta Deep Basin ‐Montney HZ First 6 month cumulative gas production
28
0
0.2
0.4
0.6
0.8
1
1.2
1.4
1.6
1.8
Cum Gas (B
CF)
Cequence Wells
Average of CQE Wells540 MMcf
Average All Wells390 MMcf
Industry Wells
137 gas wells with production to Dec. 31, 2013, Geoscout data Oil wells excluded.

Alberta Deep Basin Montney HZ Drilling Analysis –CQE among most efficient drillers
29
Includes pilot wells, does not include re‐entries
0
2000
4000
6000
8000
10000
12000
0
50
100
150
200
250
300
2012 and older ‐ 245 wells
Measured Dep
th (m
)
0
2000
4000
6000
8000
10000
12000
0
50
100
150
200
250
300
Meters drilled
per day (m
)
2013 – 63 wells
CQE P50187 m/day
All Wells P50123 m/day
Measured Dep
th (m
)
Competitor WellsCequence Wells
CQE P50137 m/day
All Wells P50107 m/day
Cequence Wells Competitor Wells Measured Depth Measured Depth

Forward‐Looking Statements or Information and Definitions
Certain statements included in this presentation constitute forward‐looking statements or forward‐looking information under applicable securities legislation. Suchforward‐looking statements or information are provided for the purpose of providing information about management's current expectations and plans relating to thefuture. Readers are cautioned that reliance on such information may not be appropriate for other purposes, such as making investment decisions. Forward‐lookingstatements or information typically contain statements with words such as "anticipate", "believe", "expect", "plan", "intend", "estimate", "propose", "project" or similarwords suggesting future outcomes or statements regarding an outlook. Forward‐looking statements or information concerning Cequence in this presentation mayinclude, but are not limited to, statements or information with respect to: guidance, forecasts and related assumptions; expected production growth and cash flowgrowth and the respective timing thereof; use of proceeds from the CPPIB Private Debt Placement; the Company's plan to not issue additional equity until year‐end2018; capital spending; expected resource potential and future reserves; hedging objectives; business strategy and objectives; type curves; drilling, development andexploration plans and the timing, associated costs and results thereof; future net debt and funds flow; commodity pricing and expected royalties; costs associated withoperating in the oil and natural gas business; and future production levels, including the composition thereof. Forward‐looking statements or information are based on anumber of factors and assumptions which have been used to develop such statements and information but which may prove to be incorrect. The Company believes thatthe expectations reflected in such forward‐looking statements or information are reasonable; however, undue reliance should not be placed on forward‐lookingstatements because the Company can give no assurance that such expectations will prove to be correct. In addition to other factors and assumptions which may beidentified in this presentation, assumptions have been made regarding, among other things: the impact of increasing competition; the timely receipt of any requiredregulatory approvals; the ability of the Company to obtain qualified staff, equipment and services in a timely and cost efficient manner; the ability of the operator of theprojects which the Company has an interest in to operate the field in a safe, efficient and effective manner; the ability of the Company to obtain financing on acceptableterms; field production rates and decline rates; the ability to replace and expand oil and natural gas reserves through acquisition, development or exploration; thetiming and costs of operating the Company’s business; the ability of the Company to secure adequate product transportation; future oil and natural gas prices; currency,exchange and interest rates; the regulatory framework regarding royalties, taxes and environmental matters; and the ability of the Company to successfully market itsoil and natural gas products. Readers are cautioned that the foregoing list is not exhaustive of all factors and assumptions which have been used.
Forward‐looking statements or information are based on current expectations, estimates and projections that involve a number of risks and uncertainties which couldcause actual results to differ materially from those anticipated by the Company and described in the forward‐looking statements or information. These risks anduncertainties may cause actual results to differ materially from the forward‐looking statements or information. The material risk factors affecting the Company and itsbusiness are contained in the Company's Annual Information Form which is available at SEDAR at www.sedar.com.The forward‐looking statements or information contained in this presentation are made as of the date hereof and the Company undertakes no obligation to updatepublicly or revise any forward‐looking statements or information, whether as a result of new information, future events or otherwise unless required by applicablesecurities laws. The forward‐looking statements or information contained in this presentation are expressly qualified by this cautionary statement.
30

Forward‐Looking Statements or Information and Definitions
Additional AdvisoriesThis presentation contains references to terms commonly used in the oil and gas industry. Netback is not defined by IFRS in Canada and is referred to as a non‐GAAPmeasure. Netbacks equal total revenue less royalties, operating costs and transportation costs. Management utilizes this measure to analyze operating performance.Funds flow from operations is a non‐GAAP term that represents cash flow from operating activities before adjustments for decommissioning liability expenditures andchanges in working capital. The Company evaluates its performance based on earnings and funds flow from operations. The Company considers funds flow fromoperations to be a key measure as it demonstrates the Company's ability to generate the cash flow necessary to fund future growth through capital investment and torepay debt. The Company's calculation of funds flow from operations may not be comparable to that reported by other companies. Funds flow from operations per shareis calculated using the same weighted average number of shares outstanding used in the calculation of income (loss) per share."Total resources" are that quantity of petroleum that is estimated to exist originally in naturally occurring accumulations. Total resources include that quantity ofpetroleum that is internally estimated, at a given date, to be contained in known accumulations, prior to production, plus those quantities in accumulations yet to bediscovered.Discovered Petroleum in Place ("DPIIP") and "Contingent Resources": DPIIP is equivalent to discovered resources and is defined in the Canadian Oil and Gas EvaluationHandbook ("COGEH") as that quantity of petroleum that is estimated, as of a given date, to be contained in known accumulations prior to production. The recoverableportion of discovered petroleum initially‐in‐place includes production, reserves and contingent resources; the remainder is unrecoverable. "Contingent Resources" aredefined in COGEH as those quantities of petroleum estimated to be potentially recoverable from known accumulations using established technology or technology underdevelopment, but which are not currently considered to be economically recoverable due to one or more contingencies. Contingencies may include factors such aseconomic, legal, environmental, political, and regulatory matters, or a lack of markets. It is also appropriate to classify as contingent resources the estimated discoveredrecoverable quantities associated with a project in the early evaluation stage. The Contingent Resources estimates and the DPIIP estimates are estimates only and theactual results may be greater or less than the estimates provided herein. There is no certainty that it will be commercially viable to produce any portion of the resourcesexcept to the extent identified as proved or probable reserves."Best estimate" is defined in COGEH with respect to entity level estimates, as the value derived by an evaluator using deterministic methods that best represent theexpected outcome with no optimism or conservatism. If probabilistic methods are used, there should be at least a 50 percent probability (P50) that the quantities actuallyrecovered will equal or exceed the best estimate.The foregoing outlook and guidance has been provided to assist investors in analyzing the Company’s anticipated development strategies and prospects and it may not beappropriate for other purposes and actual results could differ from the guidance provided above. Cequence refers to initial production rates which may not be indicativeof long term well performance.BOEs are presented on the basis of one BOE for six Mcf of natural gas. Disclosure provided herein in respect of BOEs may be misleading, particularly if used in isolation. ABOE conversion ratio of 6 Mcf:1 Bbl is based on an energy equivalency conversion method primarily applicable at the burner tip and does not represent a valueequivalency at the wellhead.For the three months ended March 31, 2014, the ratio between the average price of West Texas Intermediate (“WTI”) crude oil at Cushing and NYMEX natural gas wasapproximately 21:1 (“Value Ratio”). The Value Ratio is obtained using the first quarter 2014 WTI average price of $98.65 (US$/Bbl) for crude oil and the first quarter 2014NYMEX average price of $4.72 (US$/MMbtu) for natural gas. This Value Ratio is significantly different from the energy equivalency ratio of 6:1 and using a 6:1 ratio wouldbe misleading as an indication of value.
31

Contacts:Paul WanklynPresident & CEO pwanklyn@cequence‐energy.com
www.cequence-energy.com3100, 525 - 8th Avenue SW Calgary AB T2P 1G1Phone: 403-229-3050 Fax: 403-229-0603
David GillisVice President, Finance & CFOdgillis@cequence‐energy.com