
July 1995 Heat Wave - National Weather Service · PDF fileFront Cover: High, low, average, and...
74
Natural Disaster Survey Report July 1995 Heat Wave U.S. DEPARTMENT OF COMMERCE National Oceanic and Atmospheric Administration National Weather Service, Silver Spring, Maryland
Transcript of July 1995 Heat Wave - National Weather Service · PDF fileFront Cover: High, low, average, and...

Natural Disaster Survey Report
July 1995 Heat Wave
U.S. DEPARTMENT OF COMMERCENational Oceanic and Atmospheric AdministrationNational Weather Service, Silver Spring, Maryland

Front Cover: High, low, average, and normal temperatures for Chicago, Illinois, during the mid-July 1995 heat wave.

Natural Disaster Survey Report
July 1995 Heat Wave
December 1995
U.S. DEPARTMENT OF COMMERCERonald H. Brown, Secretary
National Oceanic and Atmospheric AdministrationDr. D. James Baker, Administrator
National Weather ServiceDr. Elbert W. Friday, Jr., Assistant Administrator

ii
PREFACE
Heat kills by taxing the human body beyond its abilities. In a normal year, about 175 Americanssuccumb to the demands of summer heat. Among the large continental family of natural hazards,only the cold of winter—not lightning, hurricanes, tornadoes, floods, or earthquakes—takes agreater toll. In the disastrous heat wave of 1995, more than 1,000 people died.
I would like to express my gratitude to the National Oceanic and Atmospheric Administration(NOAA) Disaster Survey Team for their objectivity in producing this survey report on theperformance of the National Weather Service (NWS) during the July 1995 heat wave. I amparticularly grateful to the Centers for Disease Control and Prevention (CDC) for providingvaluable insight into the health aspects of the heat wave.
Elbert W. Friday, Jr.Assistant Administrator for Weather Services
December 1995

iii
FOREWORD
This report on the "July 1995 Heat Wave" was prepared by the NOAA Disaster Survey Teamafter numerous interviews and meetings with Federal, state, and local officials in Chicago,Illinois; Milwaukee, Wisconsin; Philadelphia, Pennsylvania; and St. Louis, Missouri.
Chicago and Milwaukee were selected due to the high heat-related death toll. Chicagoexperienced its worst weather-related disaster, with 465 heat-related deaths recorded during theperiod from July 11-27, 1995. Milwaukee also was severely affected, with 85 heat-related deathsrecorded during the same time period. Philadelphia and St. Louis experienced deadly heat wavesin 1993 and 1980, respectively, and were selected as complementary case studies.
The primary purpose of this disaster survey is to evaluate the performance of the NWS infulfilling its mission of providing timely and accurate warnings, watches, forecasts, advisories,and statements during the July 1995 heat wave. NOAA and the NWS are dedicated to continuingimprovements in warning and forecasting for these events to provide local and state officials withthe lead time required to implement emergency heat response plans.
The team is grateful to the many individuals who took the time from their duties to share theirimpressions of the events during the heat wave.
The Disaster Survey Team

iv
TABLE OF CONTENTS
Page
Preface . . . . . . . . . . . . . . . . . . . . . . . . . . . . . . . . . . . . . . . . . . . . . . . . . . . . . . . . . . . . . . . . . . . . . . . . . . . ii
Foreword . . . . . . . . . . . . . . . . . . . . . . . . . . . . . . . . . . . . . . . . . . . . . . . . . . . . . . . . . . . . . . . . . . . . . . . . . iii
Acronyms . . . . . . . . . . . . . . . . . . . . . . . . . . . . . . . . . . . . . . . . . . . . . . . . . . . . . . . . . . . . . . . . . . . . . . . . . . v
Glossary . . . . . . . . . . . . . . . . . . . . . . . . . . . . . . . . . . . . . . . . . . . . . . . . . . . . . . . . . . . . . . . . . . . . . . . . . . vi
The July 1995 Heat Wave NOAA Disaster Survey Team . . . . . . . . . . . . . . . . . . . . . . . . . . . . . . . . . . . vii
Executive Summary . . . . . . . . . . . . . . . . . . . . . . . . . . . . . . . . . . . . . . . . . . . . . . . . . . . . . . . . . . . . . . . . viii
Findings and Recommendations . . . . . . . . . . . . . . . . . . . . . . . . . . . . . . . . . . . . . . . . . . . . . . . . . . . . . . . x
Chapter 1 Meteorological/Climatological Analysis . . . . . . . . . . . . . . . . . . . . . . . . . . . . . . . . . . . . . . 1
Chapter 2 Health Impacts . . . . . . . . . . . . . . . . . . . . . . . . . . . . . . . . . . . . . . . . . . . . . . . . . . . . . . . . . 21Chicago, Illinois . . . . . . . . . . . . . . . . . . . . . . . . . . . . . . . . . . . . . . . . . . . . . . . . . . . . . 22Milwaukee, Wisconsin . . . . . . . . . . . . . . . . . . . . . . . . . . . . . . . . . . . . . . . . . . . . . . . . 24
Chapter 3 Provision of NWS Products and Services . . . . . . . . . . . . . . . . . . . . . . . . . . . . . . . . . . . . 29Chicago, Illinois . . . . . . . . . . . . . . . . . . . . . . . . . . . . . . . . . . . . . . . . . . . . . . . . . . . . . 29Milwaukee, Wisconsin . . . . . . . . . . . . . . . . . . . . . . . . . . . . . . . . . . . . . . . . . . . . . . . . 33
Chapter 4 Communication, Emergency Preparedness, and CommunityResponse . . . . . . . . . . . . . . . . . . . . . . . . . . . . . . . . . . . . . . . . . . . . . . . . . . . . . . . . . . . . . 37
Chicago, Illinois . . . . . . . . . . . . . . . . . . . . . . . . . . . . . . . . . . . . . . . . . . . . . . . . . . . . . 39Milwaukee, Wisconsin . . . . . . . . . . . . . . . . . . . . . . . . . . . . . . . . . . . . . . . . . . . . . . . . 42
Chapter 5 Case Studies in Heat Wave Preparedness . . . . . . . . . . . . . . . . . . . . . . . . . . . . . . . . . . . . 45Philadelphia, Pennsylvania . . . . . . . . . . . . . . . . . . . . . . . . . . . . . . . . . . . . . . . . . . . . . 45St. Louis, Missouri . . . . . . . . . . . . . . . . . . . . . . . . . . . . . . . . . . . . . . . . . . . . . . . . . . . 49
References . . . . . . . . . . . . . . . . . . . . . . . . . . . . . . . . . . . . . . . . . . . . . . . . . . . . . . . . . . . . . . . . . . . . . . . . 51
Appendix A Review Criteria for NWS Products, Services, and Actions . . . . . . . . . . . . . . . . . . . . A-1

v
ACRONYMS
CDC Centers for Disease Control and PreventionCDT Central Daylight TimeF FahrenheitMIC Meteorologist in ChargeNOAA National Oceanic and Atmospheric AdministrationNWR NOAA Weather RadioNWS National Weather ServiceNWWS NOAA Weather Wire ServiceOLR Outgoing Long-Wave RadiationSSI Surface Systems IncorporatedWCJIS Wisconsin Criminal Justice Information SystemWCM Warning Coordination MeteorologistWSH Weather Service HeadquartersWSOM Weather Service Operations Manual

vi
GLOSSARY
Advisory An Advisory is issued for less serious conditions that cause significant inconvenienceand, if caution is not exercised, could lead to situations that may threaten life and/orproperty.
Extended Forecast As part of a State Forecast, an Extended Forecast is valid for the third through fifthdays after issuance.
Outlook An Outlook is used to indicate a hazardous event may develop. It is intended toprovide information to those who need considerable lead time to prepare for theevent, typically 48 hours or more in advance.
Short Term Forecast The Short Term Forecast can be valid up to 6 hours after issuance. For fast-breakingor convective situations, however, the valid time may be less, such as 1 to 2 hoursafter issuance.
Statement Issued at frequent intervals, Special Weather Statements amplify warnings, watches,and advisories by reinforcing the message, indicating what is expected, and outliningappropriate response actions. During active weather, they should be issued morefrequently to highlight existing conditions and how they might change in time. Atforecaster discretion, Severe Weather Statements may be issued to heightenawareness and provide additional information for life-threatening conditions.
State Forecast The same as a Zone Forecast (see below) except for part or all of a state and withadditional extended forecast information.
Warning A Warning is issued when a hazardous event is occurring, is imminent, or has a veryhigh probability of occurrence. A Warning is used for conditions posing a threat tolife or property.
Watch A Watch is used when the risk of a hazardous event has increased significantly, butits occurrence, location, and/or timing is still uncertain. It is intended to provideenough lead time so those who need to set their plans in motion can do so, typically12 to 36 hours in advance.
Zone Forecast Zone Forecast is valid up to 36-48 hours after issuance. Periods within the forecastare usually 12 hours long. The first 12 hours, however, may be divided into sub-periods, usually 6 hours long.

vii
THE JULY 1995 HEAT WAVENOAA DISASTER SURVEY TEAM
After a significant weather event, such as a heat wave, a disaster survey team may be assigned by NOAA toevaluate the role played by the NWS, provide an objective appraisal, and make findings and recommendations.
Team Members
Leader, Dr. Kathryn D. Sullivan, NOAA Chief Scientist.
Technical Leader, Eugene P. Auciello, Service Implementation Manager, Office of Meteorology, WeatherService Headquarters (WSH).
Coordinator/Editor, Linda S. Kremkau, Technical Analyst, Customer Service, Office of Meteorology, WSH.
Dr. Christopher R. Adams, Sociologist, Cooperative Institute for Research in the Atmosphere, Colorado StateUniversity.
John Feldt, Meteorologist in Charge (MIC), NWS Forecast Office, Des Moines, Iowa.
Michael Franjevic, Warning Coordination Meteorologist (WCM), NWS Forecast Office, Phoenix, Arizona.
Randee Exler, Chief, NOAA/NWS Office of Public Affairs, WSH.
Dr. Annemarie Wasley, Epidemic Intelligence Service Fellow, National Center for Environmental Health, CDC.
Dr. Robert E. Livezey, Meteorologist, Climate Analysis Center, National Meteorological Center.
Dr. William H. Hooke, Program Director for Weather Research, NOAA Office of Oceanic and AtmosphericResearch.

viii
EXECUTIVE SUMMARY
Extreme heat may be one of the most underrated and least understood of the deadly weather phenomena. Incontrast to the visible, destructive, and violent nature associated with "deadly weather," like floods, hurricanes,and tornadoes, a heat wave is a "silent disaster." Unlike violent weather events that cause extensive physicaldestruction and whose victims are easily discernible, the hazards of extreme heat are dramatically less apparent,especially at the onset.
During the 3-day period from July 13-15, 1995, approximately 70 daily maximum temperature records were set atlocations from the central and northern Great Plains to the Atlantic coast. The July 1995 heat wave at Chicagoand Milwaukee was a highly rare and, in some respects, unprecedented event in terms of both unusually highmaximum and minimum temperatures and the accompanying high relative humidities. Chicago experienced itsworst weather-related disaster, with 465 heat-related deaths recorded during the period from July 11-27. Milwaukee was also severely affected, with 85 heat-related deaths recorded during the same time period. Thenumber of deaths in Chicago and Milwaukee exceeds the average number of lives lost each year in the UnitedStates to all floods, hurricanes, and tornadoes.
Large urban areas pose unique problems during excessive heat situations. Without the extent of urbanization inChicago and Milwaukee, the July 1995 heat wave might have been outstanding rather than unprecedented. Thereis sufficient circumstantial evidence to conclude that the urban heat island was at least partially responsible forthe severe conditions in Chicago’s south side. In fact, the elderly and infirm residing in urban areas are in thegreatest danger during heat waves.
Because of its nature, heat waves are easier to predict than more short-lived and highly localized weather eventslike tornadoes. In both Chicago and Milwaukee, NWS issued accurate warnings of the developing heat waveseveral days before it arrived, and these messages were quickly broadcast by the local media. Consequently, itmight be argued that given this advance warning, many, if not all, of the heat-related deaths associated with thisevent were preventable. Unfortunately, a heat wave connotates discomfort, not violence; inconvenience, notalarm.
Despite timely NWS warnings, forecasts, advisories, and statements and effective media coverage of the event,this information either failed to reach or was not used effectively by the people who could have prevented heat-related deaths. This group of people includes the victims themselves, many of whom were isolated elderly. Because of their isolation, they are very difficult to reach by any mechanism. However, the group also includesthe care providers for the victims as well as other persons in the communities. While these people may have beenmade aware of the heat emergency, it seems clear that they did not comprehend the potential health impact forthose at risk.
City officials had neither the experience nor emergency response capabilities to translate the physicalcharacteristics of the heat wave into human impact. Both Chicago and Milwaukee had extensive disaster

ix
preparedness plans for responding to more dramatic events, like floods or blizzards, but neither city possessed awell-developed plan for responding to heat emergencies. One reason for the general unpreparedness of thecommunities affected by the July heat wave was that neither local officials nor the community at large recognizedthe potentially lethal nature of extreme heat. In both Chicago and Milwaukee, extreme heat was initially viewedmore as an inconvenience than as a public health emergency or disaster. While public health officials madeefforts to mitigate the impact of the heat wave within their communities, neither city was prepared to respond tothe heat emergency as a citywide disaster.

x
FINDINGS ANDRECOMMENDATIONS
The following findings and recommendations are grouped by subject matter and are found within theirappropriate chapters as indicated.
Meteorological/Climatological Analysis
Finding: The July 1995 heat wave at Chicago and Milwaukee was a highly rare and, in some respects,unprecedented event in terms of both unusually high maximum and minimum temperatures and theaccompanying high relative humidities.
Finding: The principal cause of the July 1995 heat wave was a slow-moving, hot, and humid air mass producedby the chance occurrence at the same time of an unusually strong upper-level ridge of high pressure andunusually moist ground conditions.
Finding: Long-term processes played no obvious role in the July 1995 heat wave. Given current forecastsskills, there is no reason to believe increased risk of the event could have been anticipated more than a week inadvance or can be expected in the future.
Finding: The July 1995 heat wave was exacerbated by local effects, including urbanization. This effect wasespecially notable in Chicago.
Health Impacts
Finding: One of the difficulties with measuring the mortality associated with a heat emergency is the lack ofdefinition for a heat-related death that is both standardized and practical. A standard definition for heat-relateddeath, such as the one used in Chicago, should be developed and adopted for national use by all medicalexaminers.
Finding: The awareness of heat-related deaths by local medical examiners in Chicago and Milwaukee in 1995led to the initial recognition in those cities of excess deaths during heat-wave periods.
Finding: In Chicago and Milwaukee, the people most affected by the heat were the elderly.
Recommendation: Since the elderly in urban areas are in the greatest danger during heat waves, the NWS mustproactively focus heat preparedness efforts toward this group.
Finding: Heat waves are not clearly recognized as public health emergencies.

xi
Recommendation: Emergency response organizations at the Federal, state, and local levels should beencouraged to recognize severe heat waves as potential natural disasters, and areas at risk should be prompted todevelop emergency response plans for severe heat waves. These plans should target the groups most oftenaffected by the heat, including elderly persons, particularly those living alone; persons with chronic medicalconditions, especially cardiovascular or pulmonary disease; and persons taking psychotropic medications.
Recommendation: The analysis of morbidity during the July 1995 heat wave in Chicago and Milwaukee shouldbe investigated by public health officials in order to provide useful public health information about therelationship of morbidity to mortality.
Finding: The vulnerability of the elderly in urban core areas was underestimated during the heat wave.
Recommendation: Forecasters should target Heat Warnings, Watches, Advisories, and Statements to thosegroups that are most vulnerable.
Provision of NWS Products and Services
� Chicago, Illinois
Finding: The Extended Forecast Product issued by forecasters at the Chicago NWS Forecast Officecommunicated the likelihood of high levels of heat and humidity 48 hours prior to the event.
Finding: Extended range forecasts of temperatures were generally within 3 to 5 degrees for high temperaturesand 5 to 7 degrees for low temperatures.
Finding: NWS forecasters at the Chicago Forecast Office communicated a forecast calling for high heat andhumidities 36 to 48 hours prior to the event.
Finding: Short-range temperature forecasts had state of the art accuracy. High temperature forecasts wereaccurate to within 3 degrees. Low temperature forecasts were accurate to within 6 degrees. Both wereunderestimates.
Finding: Forecasters used descriptive terminology, such as "muggy" and "humid," to communicate importantweather information.
Finding: A Heat Outlook or Heat Watch was not issued as allowed for in WSOM Chapter C-44, Non-Precipitation Weather Hazards.
Recommendation: The NWS should ensure that forecasters at all field offices understand the flexibilityprovided by WSOM Chapter C-44 to issue a variety of critical information products on heat-related issues.

xii
Enhancement Concept 1: Stress the dangerous nature of excessive heat in NWS
Enhancement Concept 2: Keep a pulse on the community.
Finding: NWS forecasters at the Chicago Forecast Office issued accurate Short Term Forecasts that includedtemperature, humidity, and heat index levels.
Finding: Heat Advisories were issued prior to and during the excessive heat event.
Finding: The initial Heat Advisory issued at 3:30 p.m., CDT, July 12, was issued under an incorrect producttitle (Public Information Statement). A Non-Precipitation Weather Warning should have been issued.
Finding: NWS-issued forecast products contained highly detailed and accurate meteorological information,including the heat index, but lacked call to action statements. Heat Advisories were the only products thatcontained information relating to the potential impact of anticipated weather conditions or call to actioninformation.
Recommendation: Forecasters should focus on the health hazards associated with heat in warnings, watches,forecasts, advisories, and statements. All products should include call to action statements.
Recommendation: MICs and WCMs at all NWS forecast offices should work with state, city, and local healthofficials to determine threshold values for dangerous heat index levels tailored to their area.
Potential For Enhanced Service
Although the excessive heat was well forecast by forecasters at the NWS Forecast Office at Chicago, there areseveral ways in which service to the public could have been enhanced.
With forecast or actual temperatures near 100EF, dew points near 80EF, and heat index levels above 110EF, theseriousness of these weather conditions could have been stressed in Warnings, Watches, Advisories, andStatements.
It was nearly impossible for forecasters to learn of the increasing heat-related deaths until after the peak period oftemperature. The earliest indication of a developing crisis was an enormous increase in emergency roomadmissions. At one point, 18 Chicago-area hospitals were in bypass or unable to admit more people into theemergency room. This occurred relatively early in the event. During times of excessive heat, forecasters shouldestablish contact with public health officials to obtain this information.

xiii
Enhancement Concept 3: Understand local problems of the community.
Enhancement Concept 4: Develop local studies for the community.
Enhancement Concept 5: Keep the community well informed.
Enhancement Concept 6: Work with commercial service providers.
Early indications suggest that the elderly in urban areas were vulnerable to the excessive heat. Forecastersshould issue targeted products addressed to the most vulnerable.
In some cases, there are thresholds of temperature, humidity, and hence heat index at which heat-relatedproblems increase. Local studies, in cooperation with health officials, could better define these critical values. They will most likely vary from region to region and, perhaps, city to city.
Once forecasters target specific groups and critical threshold heat values, keep the community informed viafrequent statements.
Work with commercial service providers to develop a heat hazards training element for their radio and televisioncustomers to improve the on-air delivery of forecast information to the public.
� Milwaukee, Wisconsin
Finding: The Extended Forecast Product issued by forecasters at the Milwaukee NWS Forecast Office clearlycommunicated the likelihood of unusually high levels of heat 5 days prior to the event.
Finding: Extended range forecasts of temperatures were initially 6 to 10 degrees low in the 3- to 5-day rangebut improved to within 2 degrees in the 1- to 2-day range.
Finding: Two Special Weather Statements were issued 40 hours prior to the event and contained call to actioninformation for the elderly and others at risk.
Finding: NWS forecasters at the Milwaukee Forecast Office clearly, effectively, and accurately communicateda forecast calling for high heat and humidities 36 to 48 hours prior to the event.

xiv
Enhancement Concept 1: Focus on the highest at-risk groups.
Finding: Short-range temperature forecasts were accurate. Initial errors in forecast accuracy improved towithin 2 or 3 degrees at least 24 hours prior to the onset of the heat wave.
Finding: Forecasters used descriptive terminology, such as "muggy" and "humid," to communicate importantweather information.
Finding: A Heat Advisory was issued for 2 consecutive days, providing local officials excellent planninginformation.
Finding: NWS forecasters at the Milwaukee Forecast Office issued accurate Short Term Forecasts that includedtemperature, humidity, and heat index levels.
Finding: Heat Advisories were issued prior to and during the excessive heat event.
Finding: Heat index levels were provided in the first period (first 6 hours) of the Zone Forecasts.
Finding: NWS-issued forecast products contained highly detailed and accurate meteorological information,including the heat index.
Finding: NWS forecasters at the Milwaukee Forecast Office issued frequent Heat Advisories and SpecialWeather Statements to keep the community well informed.
Finding: All warnings, forecasts, advisories, and statements were of high quality and contained accurateforecast details, including heat index levels.
Recommendation: MICs and WCMs at all NWS forecast offices should work with state, city, and local healthofficials to determine threshold values for dangerous heat index levels tailored to their area.
Potential For Enhanced Service
Although forecasters at the NWS Forecast Office at Milwaukee kept the community well informed on the heatwave, there are a few ways in which service could have been enhanced.
Large urban areas pose unique problems during excessive heat situations. Forecasters are encouraged to providefrequent statements targeted to the groups at higher risk; in this case, the elderly and infirm residing in urbanareas.

xv
Enhancement Concept 2: Keep a pulse on the community.
Enhancement Concept 3: Develop local studies for the community.
Enhancement Concept 4: Work with commercial service providers.
It was nearly impossible for forecasters to learn of the increasing heat-related deaths until after the peak period oftemperature. The earliest indication of a developing crisis was an enormous increase in emergency roomadmissions. At one point, several Milwaukee-area hospitals were in bypass or unable to admit more people intothe emergency room. This occurred relatively early in the event. During times of excessive heat, forecastersshould establish contact with public health officials to obtain this information.
In some cases, there are thresholds of temperature, humidity, and heat index at which heat-related problems areincreased. Local studies, in cooperation with health officials, could better define these critical values.
Work with commercial service providers to develop a heat hazards training element for their radio and televisioncustomers to improve the on-air delivery of forecast information to the public.
Communication, Emergency Preparedness, and Community Response
Finding: Despite timely NWS warnings, forecasts, advisories, statements, and effective media coverage of theevent, city officials had neither the experience nor emergency response capabilities to translate the physicalcharacteristics of the heat wave into human impact.
Recommendation: NWS offices should work with local officials to develop a public awareness and communityresponse plan for such events, especially among vulnerable or disadvantaged groups.
Finding: Media coverage of the July 1995 heat wave in Chicago and Milwaukee was substantial from bothmeteorological and health angles.
Finding: Staff meteorologists at radio and television stations gave the NWS high marks for timely and accurateforecasts and related services during the heat wave.
Finding: The Chicago and Milwaukee media have not developed a public response to heat hazards as they havefor other severe weather phenomena.
xvi
Recommendation: The NWS must enhance its public education campaign regarding the use of the heat indexand the dangers of heat. The media and the private sector should be enlisted as partners through professionalassociations, such as the American Meteorological Society and the National Weather Association.
Finding: At the time of the July 1995 heat wave, the emergency preparedness program for extreme heat inChicago was organized and administered from the public health department, which was different from otherhazardous weather events.
Finding: Officials in Chicago did not realize the difference between NWS weather warnings and private sectorwarnings.
Recommendation: The Chicago NWS Forecast Office should work with Chicago officials to provide usertraining on NWS watch/warning products.
Finding: Chicago and Milwaukee officials and the public did not fully understand the heat index or the extentof the threat from heat waves.
Recommendation: The NWS must enhance its community education campaign regarding the use of the heatindex and the dangers of heat.
Case Studies in Heat Wave Preparedness
Recommendation: NOAA should actively encourage other Federal agencies, such as the Department of Healthand Human Services, the Environmental Protection Agency, and the Federal Emergency Management Agency, tojoin in research on excessive heat, mortality, and morbidity.
Recommendation: The NOAA Chief Scientist should convene a workshop comprised of interagency physicalscientists, private sector providers, social scientists, and epidemiologists to provide operational researchrecommendations in light of the scientific advances made over the last decade. The relationship between heat-related mortality and the heat index, as well as other proposed predictors of heat stress, should be simultaneouslyevaluated to determine which method most accurately predicts the health consequences of a heat wave.
� Philadelphia, Pennsylvania
Finding: Philadelphia’s Heat Wave Preparedness Task Force developed an extensive and detailed plan forresponding to heat emergencies.
Finding: Philadelphia’s Heat Response Emergency Plan is activated by Heat Warnings issued by the NWS.

xvii
Finding: Emergency heat-related activities in Philadelphia are mobilized on the basis of predictions of analternative model developed by Professor Laurence Kalkstein, Center for Climatic Research, University ofDelaware.
Finding: It is not clear how much better the Kalkstein model compares with other models in predicting thehealth effects of a heat wave.
Recommendation: The Kalkstein model should be reviewed after its proposed expansion to Chicago, Illinois,and Atlanta, Georgia, in 1996.
Finding: NWS forecasters clearly, effectively, aggressively, and accurately communicated a forecast for thePhiladelphia area calling for dangerously high heat and humidities 36 to 48 hours prior to the event.
Finding: Recognizing the unique situation of an urban center, NWS forecasters issued a Heat Warning forPhiladelphia (the highest level possible) for a consecutive 2-day period. This action provided communityofficials with key planning information.
Recommendation: NOAA should quantify the urban heat island effect to incorporate in NWS Heat Warnings,Watches, Advisories, and Statements.
� St. Louis, Missouri
Finding: St. Louis’ Operation Weather Survival, a loose affiliation of agencies involved in responding to heatemergencies and coordinated by the local chapter of the United Way, developed an extensive and detailed planfor responding to heat emergencies.
Finding: The St. Louis Heat Response Plan is activated by Heat Warnings jointly issued by the St. LouisDepartment of Health and the St. Louis County Health Department, based on readings of a wet bulb globethermometer not by Heat Warnings issued by the NWS.
Finding: NWS forecasters clearly and accurately communicated the likelihood of unusually high levels of heatfor St. Louis 5 days prior to the event.
Finding: NWS forecasters issued a Heat Advisory for St. Louis for a consecutive 2-day period. This actionprovided community officials with key planning information.

xviii

xix

1
July12 13 14 15 16 17
Chicago Midway Airport MAX 97 106 102 98 93MIN 75 81 84 77 76
Chicago O’Hare Airport MAX 97 104 100 98 93MIN 73 81 83 75 74
Milwaukee MAX 91 103 103 92 88MIN 65 78 84 69 68
Philadelphia MAX 94 98 103 91 94MIN 74 76 81 74 73
St. Louis MAX 100 101 99 98 96
CHAPTER 1
METEOROLOGICAL/CLIMATOLOGICALANALYSIS
Major weather events, like the remarkable heat wave that blanketed major midwestern and eastern cities forseveral days in mid-July 1995, are often the result of a number of meteorological and climatological factors thatoperate on several different time and space scales. Sufficient evidence for this event is available to addressseveral key questions, among them the roles of longer term phenomena, like trend, or the El Niño/SouthernOscillation system and the impact of urbanization. These issues will be discussed after the heat wave is firstplaced in a historical context at Chicago as well as three other major cities: Milwaukee, Wisconsin; Philadelphia,Pennsylvania; and St. Louis, Missouri. Chicago and Milwaukee were selected due to the high heat-related deathtoll. Philadelphia and St. Louis, having experienced deadly heat waves in 1993 and 1980, respectively, wereselected as complementary case studies.
Historical Context
During the 3-day period from July 13 through 15, approximately 70 daily maximum temperature records were setat locations from the central and northern Great Plains to the Atlantic coast. To examine just how unusual themid-July heat wave was at the four surveyed cities, the most readily available historical daily data set, maximumand minimum temperatures and their averages, was utilized. Table 1 depicts a chronology of the heat wave ateach of the four cities over the appropriate 5-day period.
Table 1
Daily Maximum and Minimum Temperatures (EF)for the mid-July 1995 Heat Wave

2
July12-13 13-14 14-15
Maximum TemperatureChicago O’Hare Airport (4) 2 (7) (38 years)Chicago Midway Airport 5 1 9 (48 years)Chicago Official (123 years) (11) (3) -Milwaukee (48 years) (17) 1 (11)Philadelphia (48 years) - - (4)St. Louis (48 years) - - -
Minimum TemperatureChicago O’Hare Airport (12) 1 (3)Chicago Midway Airport 13 1 (2)Chicago Official - 4 (17)Milwaukee - 1 5Philadelphia - - (5)St. Louis (20) (3) (6)
Average TemperatureChicago O’Hare Airport (4) 1 3Chicago Midway Airport 4 1 2Chicago Official (13) 1 (11)Milwaukee - 1 6Philadelphia - - (3)
Table 2 shows the all-record ranks of the mid-July 1995 2-day mean maximum, minimum, and daily averagetemperatures observed, respectively, for six records for the four cities. Over its long history, the official Chicagorecord has been measured in a number of locations, including Midway Airport from 1942 to 1979 and O’HareInternational Airport from 1980 to present. Because high temperature extremes can occur from mid-May throughmid-September, each year there are 120 days in which there is an opportunity for a specific temperature to beexceeded. Thus, a 40-year record represents about 4,800 opportunities, a 70-year record about 8,400, etc. Thesecounts help put into perspective rankings in table 2 and later in table 4. The table demonstrates that this year’sevent at Chicago and Milwaukee was at least highly rare and, in several respects in both of these cities, totallyunprecedented. To underscore this, one should note that the official average 2-day temperature of 92E Fahrenheit(F) observed at O’Hare International Airport for July 13 and 14 was the highest in 123 years. The peak 2-dayperiod at Philadelphia was highly unusual for its 48-year record but not as outstanding as that for Chicago,especially in light of the longer records for Chicago. St. Louis experienced highly unusual minimumtemperatures, but the mid-July ranks for 2-day mean maximum and average temperatures for its 48-year recorddo not rank among the top 20. The principal reason for these differences will be apparent from the discussion inthe following sections. The relative severity of the heat wave between cities is also reflected in the dailymaximum temperature records set at the four locations in mid-July, which are listed in table 3.
Table 2
Rank (if in top twenty) of Mean Temperaturesfor 2-day Periods in mid-July 1995 (ties in parentheses)

3
July12 13 14 15
Chicago/O’Hare 97 104 100Chicago/Midway 106Milwaukee 101Philadelphia 103
Table 3
Daily Maximum Temperature Records Set at Chicago, Milwaukee, and Philadelphia on July 12-15, 1995
(all-time daily maximum records in bold)
What ultimately distinguishes the 2-day period in mid-July at Chicago and Milwaukee from all others is thecombination of both unusually high maximum and minimum temperatures. The principal factor for the elevatednighttime temperatures was the relatively high moisture content (i.e., humidity) in the air. Observed dew points,a direct measure of the moisture content, were extraordinarily high on three straight nights at Chicago’s MidwayAirport. The accompanying relative humidities, well above 90 percent in the late evenings, added substantially tothe already considerable human stress implied by the high average observed temperatures. Data at several otherlocations in the Chicago metropolitan area and on a larger regional scale confirm that these extraordinary levelswere largely a consequence of a very moist regional air mass but also may be partially attributable to additionallocal effects at Chicago and perhaps some other midwestern locations.
Of some interest also is the extended period of high heat surrounding the 2 key days that have been emphasizedso far. Table 4 contains similar information as table 2 but for 3- to 5-day mean daily average temperatures. Datafor St. Louis are not tabulated since the ranks are not in the top twenty. Note that at Chicago, the mid-July eventstill ranks first or second in all respects over the most recent 50 years but not when viewed from the perspectiveof the long-term record. Ferocious heat waves, lasting 5 and 6 days and exceeding the 1995 heat wave, occurredin 1911 and 1916, respectively. In contrast, conditions over 3- to 5-day periods in July 1995 at Milwaukee wereexceeded in August 1988.
Finding: The July 1995 heat wave at Chicago and Milwaukee was a highly rare and, in some respects,unprecedented event in terms of both unusually high maximum and minimum temperatures and theaccompanying high relative humidities.

4
3-Day Mean12-14 13-15 14-16
Chicago O’Hare Airport 2 1 5 (38 years)Chicago Midway Airport 2 1 4 (48 years)Chicago Official (123 years) 5 4 -Milwaukee (48 years) 4 2 (20)Philadelphia (48 years) NC (5) (12)
4-Day Mean12-15 13-16 14-17
Chicago O’Hare Airport 1 (2) NCChicago Midway Airport 1 2 NCChicago Official 5 (6) NCMilwaukee (3) (3) NCPhiladelphia NC (14) (16)
5-Day Mean12-16 13-17
Chicago O’Hare Airport 1 NC
Table 4
Rank (if in top twenty) of Mean Daily Average Temperaturesfor 3- to 5-day Periods in mid-July 1995
(ties in parentheses)("NC" means not calculated)
Development of the Meteorological Event
The principal cause and origin of the heat wave is straight-forward—a slow-moving, hot, and humid air mass(figure 1) was produced by a very strong upper-level ridge of high pressure. This ridge originated as anamplification of the climatologically normal weak ridge which exists in the western United States in July. Itsgrowth was a downstream adjustment of the westerly winds to a major weather disturbance affecting thesubtropical ridge in the western Pacific Ocean several days before.
This sequence of events can be followed clearly in the series of 5-day mean charts in figures 2 and 3 which filterout day-to-day fluctuations. The pair of charts in figure 2 shows departures from normal of outgoing long-waveradiation (OLR), which are good proxies of anomalous rainfall and latent heating of the atmosphere in the tropicsand subtropics. A significant flare-up of this heating off the coast of east Asia extending out into the Pacific isindicated by a substantial increase in negative OLR anomalies between

5
C Figure 1. Daily progression of the mid-July 1995 heat wave in terms of maximumapparent temperatures (heat index) at least 105 F and minimum temperatures at least78 F.

6

7
Figures 3a, 3b, 3c, 3d. Sequence of 5-day mean upper-level pressure and flow conditions leading up to and including theheat wave. The lines depict the location of upper-level ridges and troughs of pressure in mid-latitudes and the colorsanomalies in the pressure. Upper-level westerly winds flow along the lines with jets located where the lines are mostclosely spaced. The color scale indicates 500 millibars height departures from normal in meters.

8
Figures 3e, 3f, 3g, 3h. Sequence of 5-day mean upper-level pressure and flow conditions leading up to and including theheat wave. The lines depict the location of upper-level ridges and troughs of pressure in mid-latitudes and the colorsanomalies in the pressure. Upper-level westerly winds flow along the lines with jets located where the lines are mostclosely spaced. The color scale indicates 500 millibars height departures from normal in meters.
9
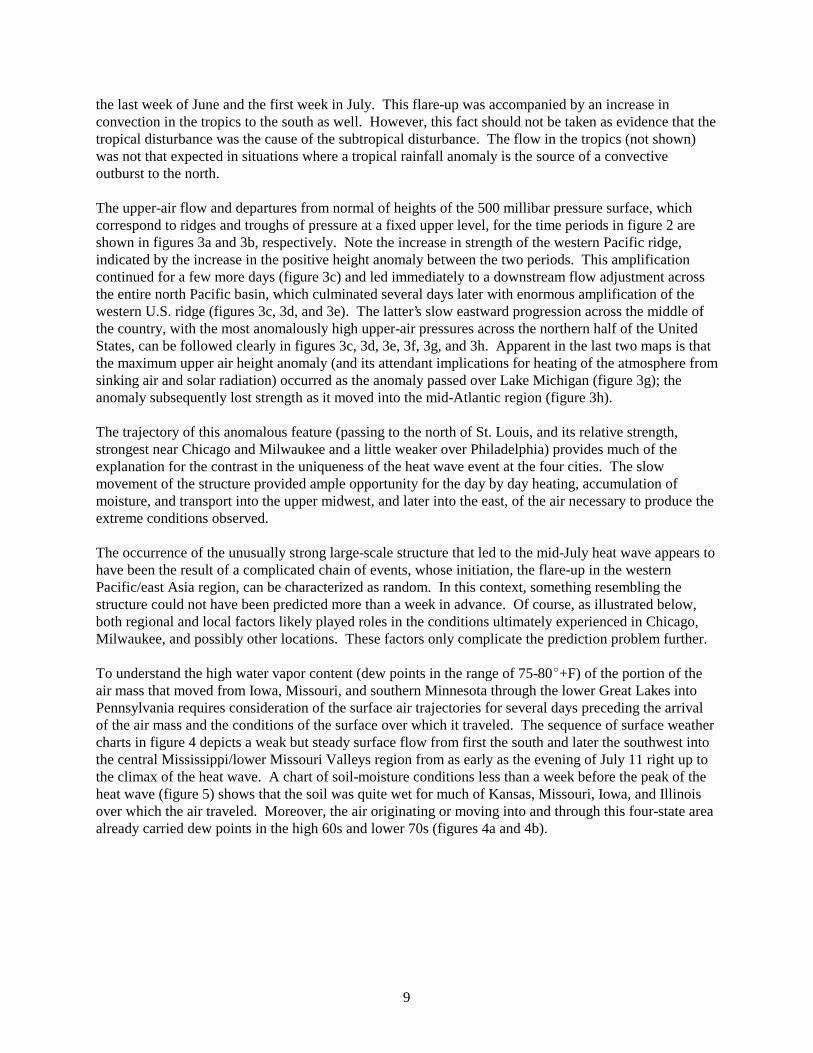
the last week of June and the first week in July. This flare-up was accompanied by an increase inconvection in the tropics to the south as well. However, this fact should not be taken as evidence that thetropical disturbance was the cause of the subtropical disturbance. The flow in the tropics (not shown)was not that expected in situations where a tropical rainfall anomaly is the source of a convectiveoutburst to the north.
The upper-air flow and departures from normal of heights of the 500 millibar pressure surface, whichcorrespond to ridges and troughs of pressure at a fixed upper level, for the time periods in figure 2 areshown in figures 3a and 3b, respectively. Note the increase in strength of the western Pacific ridge,indicated by the increase in the positive height anomaly between the two periods. This amplificationcontinued for a few more days (figure 3c) and led immediately to a downstream flow adjustment acrossthe entire north Pacific basin, which culminated several days later with enormous amplification of thewestern U.S. ridge (figures 3c, 3d, and 3e). The latter’s slow eastward progression across the middle ofthe country, with the most anomalously high upper-air pressures across the northern half of the UnitedStates, can be followed clearly in figures 3c, 3d, 3e, 3f, 3g, and 3h. Apparent in the last two maps is thatthe maximum upper air height anomaly (and its attendant implications for heating of the atmosphere fromsinking air and solar radiation) occurred as the anomaly passed over Lake Michigan (figure 3g); theanomaly subsequently lost strength as it moved into the mid-Atlantic region (figure 3h).
The trajectory of this anomalous feature (passing to the north of St. Louis, and its relative strength,strongest near Chicago and Milwaukee and a little weaker over Philadelphia) provides much of theexplanation for the contrast in the uniqueness of the heat wave event at the four cities. The slowmovement of the structure provided ample opportunity for the day by day heating, accumulation ofmoisture, and transport into the upper midwest, and later into the east, of the air necessary to produce theextreme conditions observed.
The occurrence of the unusually strong large-scale structure that led to the mid-July heat wave appears tohave been the result of a complicated chain of events, whose initiation, the flare-up in the westernPacific/east Asia region, can be characterized as random. In this context, something resembling thestructure could not have been predicted more than a week in advance. Of course, as illustrated below,both regional and local factors likely played roles in the conditions ultimately experienced in Chicago,Milwaukee, and possibly other locations. These factors only complicate the prediction problem further.
To understand the high water vapor content (dew points in the range of 75-80E+F) of the portion of theair mass that moved from Iowa, Missouri, and southern Minnesota through the lower Great Lakes intoPennsylvania requires consideration of the surface air trajectories for several days preceding the arrivalof the air mass and the conditions of the surface over which it traveled. The sequence of surface weathercharts in figure 4 depicts a weak but steady surface flow from first the south and later the southwest intothe central Mississippi/lower Missouri Valleys region from as early as the evening of July 11 right up tothe climax of the heat wave. A chart of soil-moisture conditions less than a week before the peak of theheat wave (figure 5) shows that the soil was quite wet for much of Kansas, Missouri, Iowa, and Illinoisover which the air traveled. Moreover, the air originating or moving into and through this four-state areaalready carried dew points in the high 60s and lower 70s (figures 4a and 4b).

10
Figure 4. Early evening surface winds and water vapor contents (in terms of dew points in EF) for 5 consecutive days inmid-July 1995 at locations throughout the eastern United States. The former are generally light in the Midwest andNortheast. Values of the latter in excess of 75EF (green shades) can be considered unusually high.

11
Figure 5. Soil moisture conditions less than 1 week before the onset of the heat wave. The ground overwhich the hottest part of the air mass moved was quite wet.

12
Thus, it is not surprising that, with the intense solar insolation and its potential for evaporation of watervapor accompanying the approaching mammoth upper-air ridge of high-pressure (figures 3f and 3g), atongue of air with dew points in excess of 75EF had formed by the evening of July 12 (figure 4b). This area correspondsclosely to the region of pre-existing wet ground and contained a smaller area with dew points in excess of80EF over eastern Iowa and southern Minnesota. This moisture-laden air spread mainly east, with itscenter passing over Chicago, Milwaukee, and finally Philadelphia over the next few days (figures 4c, 4d,and 4e) before moving offshore. Again, note that the core of the moistest air passed to the north of St.Louis, providing additional explanation for the somewhat less relative severity for conditions in that city.
Finding: The principal cause of the July 1995 heat wave was a slow-moving, hot, and humid airmass produced by the chance occurrence at the same time of an unusually strong upper-level ridgeof high pressure and unusually moist ground conditions.
Role of Long-term Factors
In this section, two factors—El Niño/Southern Oscillation and long-term trends—are examined that arecommonly associated with substantial departures from normal of surface conditions on monthly toseasonal time scales. This is important because monthly average temperature records were set at bothChicago and Philadelphia, and because some degree of predictability is implied when either factor is asignificant influence. Moreover, if either played a role, additional inferences can be made about futurevulnerability to similar events.
The link between climatic effects and El Niño is well established. The term "El Niño" has come to bereserved for exceptionally strong warm intervals that raise the water temperature across the equatorialPacific. The term "Southern Oscillation" represents the ups and downs of the east-west seesaw insouthern Pacific barometric pressure which is linked to dramatic changes in the distribution of rainfall inthe tropics. The warm waters associated with El Niño and the pressure seesaw of the SouthernOscillation are part of the same phenomena referred to as the El Niño/Southern Oscillation.
There is little support for El Niño/Southern Oscillation as a contributing mechanism for the heat wave. Tropical equatorial Pacific Ocean sea-surface temperature anomalies were quite small both prior to andduring the month of July, i.e., this was not an active El Niño summer. Additionally, recent studies thathave examined the El Niño/Southern Oscillation signal when the system is active show little or noresponse for the upper-midwest or middle-Atlantic regions during the month of July.
The question of whether the monthly mean temperature records for July are symptomatic of longer termtrends needs to be addressed separately for Chicago and Philadelphia. Note in figure 6 that the historicaltemperature ranks for July 1995 of the multistate regions encompassing the eastern seaboard are quitehigh, while those for the two regions covering the Ohio and upper Mississippi River Valleys are not evenin the upper quintile. Further, note in figure 7 that this same regional contrast is reflected on averageover the previous ten summers (i.e., the Atlantic coast has been quite warm on the average, while theMidwest has been cool or near normal). The former probably reflects an enhanced

13
Figure 6. Historical rank of July 1995 average temperature by region and Nation. The month overall wasexceptionally warm along the eastern seaboard but not unusually so in the Midwest.

14
Figure 7. Average summertime (June, July, and August) departures fromnormal temperature (oF times 10) for the 10 years preceding the summer of 1995. Note that recent trends around Lake Michigan have been for normal or slightlybelow normal temperatures but along the mid-Atlantic coast for above normaltemperatures.

15
Bermuda high, which played no apparent role in the early to mid-July weather sequence described in theprevious section.
Thus, the mid-July synoptic event, though not necessarily related to some longer term process, reinforcedthe 10-year tendency at Philadelphia but not at Chicago. Another argument against trend as an importantfactor for Chicago is the fact that the nearest rivals for the 2-day July 1995 event, in terms of averagetemperature, occurred in the summers of 1911 and 1916. In contrast, Philadelphia experienced a heatwave as recently as July 1993 that in many respects substantially exceeded the severity of the July 1995occurrence. The most reasonable conclusion is that the July 1995 heat wave in Chicago was the result ofa rare juxtaposition of an exceptionally strong upper-air ridge and unusually wet July soil in the nearbyupstream air mass source region. Corollaries to this are that increased vulnerability to such ameteorological event could not have been anticipated in late June, nor should necessarily be expected inthe future based on current information. Local effects, including urbanization, also may have playedenough of an additional role in Chicago to make the event unprecedented.
Finding: Long-term processes played no obvious role in the July 1995 heat wave. Given currentforecasts skills, there is no reason to believe increased risk of the event could have been anticipatedmore than a week in advance or can be expected in the future.
Role of Microclimate Factors in Chicago
Conditions in the Chicago area differed from one location to another during the mid-July heat wave. This was already evident from table 1 which indicated more severe conditions at Midway Airport thanO’Hare. This and even more pronounced local differences will now be examined more closely to clarifythe role played by factors like the urban heat island, lake proximity, evapotranspiration, wind direction,etc.
For this survey, daily maximum and minimum temperature data at 11 locations in the Chicagometropolitan area were available, of which nine were considered useable, either because of observationtimes or credibility. In addition, detailed hourly observations at Chicago’s O’Hare International andMidway Airports were available and proved enormously useful. The relative locations of these 11 sites,along with other features mentioned below, are mapped in figure 8.
Daytime maximum temperatures on July 13 and 14 are listed in table 5 for all 11 locations. Threelocations with the highest maximum average temperature for the 2 days (the first three listed)—the twoairports and Chicago Botanic Gardens—have two things in common. These locations are the threeobservation sites closest to downtown Chicago, Midway being the closest, followed by O'Hare, and theBotanic Gardens. They are three of the four points listed that are closest to Lake Michigan, with theBotanic Gardens adjacent to the lake, Midway somewhat inland, and O'Hare another several milesinland. Waukegan is also on Lake Michigan.

16
July13 14
Midway Airport 106 102Botanic Gardens 105 102O’Hare Airport 104 100Joliet 103 101Aurora 102 100Lake Villa 102 100Waukegan 102 100McHenryville 101 100Park Forest 102 99Elgin 101 98
Figure 8. Locations of key features and observing sites in and nearChicago.
Table 5
Maximum Temperatures (EF) for the Chicago Metropolitan Areaon July 13 and 14, 1995

17
July13 14
Midway Airport 81 84O’Hare Airport 81 83Lake Villa 77 81Romeoville 77 78
July13 14 15
Midway Airport 81 (81) 84 (83) 83 (83)O’Hare Airport 81 (77) 83 (79) 79 (78)Waukegan 78 83 78Botanic Gardens 78 82 78Joliet 73 78 79Elgin 71 80 78Park Forest 73 80 76
The contrast between close-in locations and sites more distant from Chicago’s Loop is again apparent intable 6 which contains minimum temperatures for the two calendar, 24-hour periods (i.e., observationstaken at midnight) at three points where they were reported as such and the two airports where hourlydata were available. These tables contain sufficient circumstantial evidence to conclude that the urbanheat island was at least partially responsible for the severe conditions in Chicago’s south side (nearMidway Airport), but other factors, like advective effects, locally strong evapotranspiration, andproximity to Lake Michigan, cannot be completely discounted as additional microclimatic influences.
Table 6
Minimum Temperatures (EF) for the Chicago Metropolitan Areaon July 13 and 14, 1995
Additional clues as to whether any of these other factors (just mentioned) affected nighttimetemperatures are contained in table 7, which lists minimum temperatures from the 24 hours prior to earlymorning observation times (ranging from 6 a.m. to 8 a.m., local time). Again, Midway stands out on allthree of the evenings, while O’Hare, Botanic Gardens, and Waukegan are noticeably warmer on theevenings of July 13 and 14.
Table 7
Minimum Temperatures (EF) and Maximum Dew Points (EF) (in parentheses)for the Chicago Metropolitan Area for the 24 Hours Preceding Morning (6 to 8 a.m.) Observation Times
on July 13-15, 1995

18
During the critical period, peak winds were mostly from the south and southwest, so one explanation forthe high minima at the Botanic Gardens and Waukegan is that they were downwind of the city core, atleast much more so than any other sites. This factor was strongest on the evening of July 12, less so onthe evening of July 13, and least so on the evening of July 14, as the winds shifted from the south todominantly southwest. The overall decrease in the difference in minima between the two lakesidestations and the other four locations (excluding the airports) from the evening of July 12 through theevening of July 14 is consistent with this wind shift. Nevertheless, winds were also generally quite light,so it is not implausible that Lake Michigan served as an additional source of water vapor for observationsites next to it. The light winds also imply reduced surface mixing of the lake water and the possibility ofsurface water temperatures well above normal. Moreover, as the winds shifted from more southerly tomore southwesterly, lake proximity would have had less relative impact, again consistent with the trendof the differences in minima between the Botanic Gardens and Waukegan and four other locations wellremoved from both the lake and the city core.
Maximum dew points are also listed for the two airports in table 7, while the minima at the other six sitesserve as approximate upper bounds for the dew points there. Dew points at Midway Airport turn out tobe substantially higher than those recorded at O’Hare. In view of prevailing wind directions, it isdoubtful that Lake Michigan was an important source of moisture for Midway, so an additional source ofwater vapor needs to be identified. One appealing candidate is heavy evapotranspiration over the nearbyPalos Forest Preserves, with its extensive woods and many sloughs located south and west ofMidway—i.e., upwind of Midway—during much of the heat wave. This idea is consistent withattribution of the high minima at the lakeside locations also to downwind advective processes.
Clearly, these data are insufficient to resolve clearly the extent to which certain microclimatic factorscontributed to the highly severe conditions in south Chicago. However, they provide sufficient evidenceto support a role for local effects, particularly for an urban heat island effect. Without the extent ofurbanization in Chicago, the mid-July heat wave might have been quite outstanding rather thanunprecedented.
Finding: The July 1995 heat wave was exacerbated by local effects, including urbanization. Thiseffect was especially notable in Chicago.
Conclusions
The mid-July heat wave that brought unprecedented conditions to Chicago and Milwaukee, dangerousconditions to Philadelphia, and harsh (but often observed) conditions to St. Louis was mainly a result ofthe fortuitous juxtaposition of two important factors, namely a very strong, slow-moving upper-air ridgeof high pressure and a conveniently located source region of high soil moisture content. Chicago andMilwaukee were ideally located to feel the full effects of this combination of factors. In at least Chicago,near-record conditions were probably exacerbated to record conditions by local microclimatic factors,including most certainly urbanization. The genesis and form of the event suggest that it was a weatherevent whose occurrence, or probability of occurrence, is not easily related to longer term processes, like

19
El Niño/Southern Oscillation or climatic trends. At this time, the occurrence or probability of such anevent probably cannot be forecast beyond the theoretical limit of dynamic predictability of 2 weeks, orpractically not currently beyond about 1 week.

20

21
CHAPTER 2
HEALTH IMPACTS
During and immediately following the heat wave, increased numbers of deaths, many of them attributeddirectly to the heat, were reported in both Chicago and Milwaukee. There were 465 heat-related deathsrecorded for the Chicago area alone (CDC, 1995). This exceeds the average number of lives lost eachyear in the United States to all floods, hurricanes, and tornadoes.
Methods
In both Chicago and Milwaukee, the first indication of the magnitude of the health effects of the heatwave came from the medical examiner’s office, where bodies that had been found dead in overheateddwellings began to be delivered on approximately the second day of the heat wave. While informationabout deaths reported by the medical examiner provided a rapid indicator of a potential problem, suchinformation must be interpreted carefully because only 20 percent of deaths are usually seen by medicalexaminers, and these deaths are not normally representative of the whole population. However, when asevere heat wave occurred in Philadelphia in July 1993, a retrospective review of the death certificatesfor that period found that of the approximately 110 certificates, which listed a heat-related cause orcondition, more than 90 percent of them had been included in the initial reports from the PhiladelphiaMedical Examiners’s Office. This suggests that, for heat-related deaths, medical examiner data providesa rapid and sensitive indicator.
Definition of Heat-related Death
One of the difficulties in measuring the mortality associated with a heat emergency is the lack ofdefinition for heat-related death that is both standardized and practical. Using the strict definition ofhyperthermia as the basis for classifying deaths requires that a core body temperature of 105EF or abovebe measured at the time of, or immediately following, death. However, deaths frequently occur that,judging by the circumstances of death, are clearly heat related but a core body temperature is eitherunavailable or not meaningful (because the body was not discovered until hours or days after death) andwhich, thus, cannot be strictly called hyperthermia deaths. Because of the obvious insensitivity of thestrict definition given above in these types of situations, the medical examiners of several cities(including the four visited in this assessment) use a less restrictive definition for heat-related deaths thatallows them to include those deaths which, while not meeting the body temperature criteria, are judged tobe heat related on the basis of circumstantial evidence.

22
The Medical Examiner of Cook County, Illinois, who is responsible for investigating deaths occurring inChicago, classified deaths as being heat related if any of the following conditions were met:
< a body temperature of 105EF or above was measured at/shortly after the time of death; or
< evidence of high environmental temperature in the place where the body was found was noted byrescuers; or
< the body was found in a decomposed state and was last seen alive at the time of the peak of theheat wave.
Similar definitions are used by the medical examiners in Milwaukee, Philadelphia, and St. Louis. However, not all medical examiners use this definition. Consequently, it is difficult to compare thenumbers of heat-related deaths from one city to another or from one heat wave to the next. It isrecommended that a standard definition for heat-related death, such as the one used in Chicago, bedeveloped and adopted for national use.
� Chicago, Illinois
Heat waves and heat-related deaths are not new to Chicago. In 1988, there were at least 77 heat-relateddeaths. However, when on July 12, 1995, the NWS predicted a maximum heat index of greater than100EF for the following day and issued a Heat Advisory, few people considered it a potential medicalemergency. Even the Chicago Department of Health, which had been monitoring the weather and hadrecommended that people modify their behavior because of the heat, expected that only a few peoplewould experience anything more than discomfort as a result of the hot weather. The first indication oftrouble came when the Chicago Police Department and Chicago Medical Examiner reported increasednumbers of non-violent deaths throughout the city. In Cook County (which includes Chicago), there areusually 65-70 deaths a day from all causes, of which 17-20 are seen by the medical examiner. On July 15alone, 162 heat-related deaths were reported by the medical examiner’s office (figure 9). For the periodof July 12-27, a total of 465 heat-related deaths were recorded. In contrast, no heat-related deaths werereported for the week of July 4-10.
At the same time that bodies were beginning to accumulate in the city morgue, hospitals were also beinginundated with people who had been affected by the heat. Some hospital emergency departments beganto turn away ambulances on July 12 because they had insufficient capacity to accept additional patients;by July 14th, 18 hospitals were on "bypass status" (figure 10). During very busy periods when anemergency room does not have the capacity to accept additional patients, the hospital may go on "bypassstatus," referring all incoming ambulances to less busy facilities. A planned review of the emergencyroom records from selected hospitals for the heat-wave period will provide information on thecharacteristics of the people who became sick because of the heat. It will be particularly useful to thepublic health community to compare the characteristics of those who became sick but recovered to thosewho died to determine if, or how, the two groups differed. It also will be valuable to determine whetherthe increase in heat-related

23
Figure 9. Heat-related deaths, Maximum Temperature (Tmax) and Heat Index (HI),Chicago, July 11-23, 1995. (As reported by the Office of the Medical Examiner.)
Figure 10. Hospitals on bypass status, Maximum Temperature (Tmax) and Heat Index(HI), Chicago, July 11-23, 1995.

24
illnesses (morbidity) preceded the increase in heat-related deaths (mortality) and, if so, whether suchinformation could be used to monitor developing heat emergencies.
Examining the characteristics of those whose deaths were classified as heat related, it was observed thatthe people most often affected by the heat were the elderly, particularly those living alone. While only15 deaths were recorded for people under 44 years of age, 101 deaths were reported for those between 65and 74 years of age, and 222 deaths occurred among those over 74 years of age (figure 11). Looking atthese numbers relative to the proportion of the population made up by each age category, the danger tothe elderly becomes even more clear. The estimated risk of death for those under 45 for the period July12 through July 27 was 20 per 100,000 persons. In contrast, the risk of death for persons 65 through 74years of age was 53 per 100,000, and for those greater than 74 years of age, it was 183 per 100,000. Deaths occurred throughout the city, with a slight clustering on the south side. With a cumulativemortality of 19 per 100,000, males were more often affected than females, whose risk of death was 14 per100,000. Although more blacks died (229) than whites (216), the rates for the two races do not differsignificantly. Very few heat-related deaths (less than 6 percent of the total number of heat-relateddeaths) occurred among Hispanics relative to their representation in the total population. The reason forthis is not clear, but it is speculated that strong community or family networks within Hispaniccommunities may have played a protective role.
Chicago and Illinois health officials are working with investigators from CDC to better determine thecharacteristics of the people who died during the heat wave, so that this information can be used in futureheat waves to better target preventive measures at persons at increased risk for heat-related illness ordeath. In addition to the deaths that were directly attributed to the heat, it is likely, given the experiencein other heat waves, that there were additional unmeasured increases in cardiovascular deaths which canbe indirectly attributed to the heat; these excess deaths should also be determined to better estimate thetotal health impact of the heat wave.
� Milwaukee, Wisconsin
With weather patterns similar to those of Chicago, heat waves are not unusual in Milwaukee either. A1988 heat wave claimed 11 lives, and in 1936, which was a drought year, 529 deaths were attributed tothe heat. Other notable heat waves occurred in 1947, 1955, 1968, and 1970. These previous heat wavesled the city to develop contingency plans for responding to such events, and a Heat Task Force has beenin existence since 1986. Consequently, on the afternoon of July 12 when the NWS predicted heat indexvalues of up to 120EF in the Milwaukee area and issued a Heat Advisory, the members of the Task Forcewere ready for action. They first met as a group on July 14. Agencies participating in the task forceincluded the American Red Cross, the Salvation Army, the Office of Emergency Government, theMilwaukee Department of Health, and the public utility companies.
Despite what appeared to be a reasonably good level of preparedness, on the evening of July 14 (at aboutthe same time that excess deaths were beginning to be reported in Chicago) the Milwaukee CountyMedical Examiner’s Office observed a higher number of deaths than usual, many of them obviously heatrelated. From July 14 to 17, the

25
Figure 11. Deaths by age, Chicago, July 12-27, 1995.
The age-specific risk of dying of a heat-related cause during the heat wave period (July 12-27, 1995) was calculatedby dividing the number of heat-related deaths reported for an age group during that period by the total number ofpersons in that age group as recorded in the census.

26
Milwaukee County Medical Examiner reviewed 129 deaths (versus a normal average of 30 deaths for asimilar 4-day time period). Eighty-five (85) of these deaths were attributed to the heat, of which 30 wereclassified as environmental hyperthermia (strict definition with measured core body temperature greateror equal to 105EF). The other 55 deaths occurred among older persons with pre-existing conditionswhere circumstantial evidence indicated that elevated environmental temperatures had contributed to thedeaths. Forty-eight (48) of the 85 heat-related deaths occurred within the city limits; the remainderoccurred elsewhere in the county. Victims ranged in age from 24 to 88 years. At least 12 of the victimswere known to be taking psychotropic (mind-altering) drugs which may impair thermoregulatory functionor inhibit perspiration and increase a person’s susceptibility to heat-related illness or death. At least twodeaths occurred in group homes for the mentally ill, raising questions regarding the regulation andlicensure of such accommodations. Emergency rooms were reported to have been very busy, and somehad to be closed for a period of time during the heat wave because they were full to capacity. However,use of a computer system allowed emergency medical system managers to adjust to the closure ofspecific emergency departments.
Finding: One of the difficulties with measuring the mortality associated with a heat emergency isthe lack of definition for a heat-related death that is both standardized and practical. A standarddefinition for heat-related death, such as the one used in Chicago, should be developed and adoptedfor national use by all medical examiners.
Finding: The awareness of heat-related deaths by local medical examiners in Chicago andMilwaukee in 1995 led to the initial recognition in those cities of excess deaths during heat-waveperiods.
Finding: In Chicago and Milwaukee, the people most affected by the heat were the elderly.
Recommendation: Since the elderly in urban areas are in the greatest danger during heat waves,the NWS must proactively focus heat preparedness efforts toward this group.
Finding: Heat waves are not clearly recognized as public health emergencies.
Recommendation: Emergency response organizations at the Federal, state, and local levels shouldbe encouraged to recognize severe heat waves as potential natural disasters, and areas at riskshould be prompted to develop emergency response plans for severe heat waves. These plansshould target the groups most often affected by the heat, including elderly persons, particularlythose living alone; persons with chronic medical conditions, especially cardiovascular orpulmonary disease; and persons taking psychotropic medications.
Recommendation: The analysis of morbidity during the July 1995 heat wave in Chicago andMilwaukee should be investigated by public health officials in order to provide useful public healthinformation about the relationship of morbidity to mortality.

27
The vulnerability of the elderly in urban core areas was underestimated. Although it is known that theelderly are more susceptible to heat-related illness because of their decreased physical ability to adapt toextreme changes in environmental temperature, information collected for this assessment suggests that,for some elderly in the urban core, there were additional social and behavioral factors which furtherincreased their vulnerability. Specifically, it was found that those most likely to be affected were thosewho were: (1) unlikely to receive warnings and forecasts disseminated in the normal fashion; (2) unableto fully appreciate the significance of the warnings and forecasts; (3) uninformed about properprecautions and actions that they should take to protect themselves from the effects of the heat; (4) toopoor to have adequate air conditioning or to operate it even if available; (5) too frightened of crime toleave their windows opened; (6) or too weak, infirm, or frightened to seek public shelter. Mostfundamentally, those at risk were isolated and lacked a concerned network of family and friends and, as alast resort, attention from social agencies.
Finding: The vulnerability of the elderly in urban core areas was underestimated during the heatwave.
Recommendation: Forecasters should target Heat Warnings, Watches, Advisories, and Statementsto those groups that are most vulnerable.

28

29
CHAPTER 3
PROVISION OF NWSPRODUCTS AND SERVICES
Since the mid-July heat wave brought unprecedented conditions to Chicago and Milwaukee, this chapterwill focus on the products and services provided by the NWS Forecast Offices at Chicago, Illinois, andMilwaukee, Wisconsin. The review criteria for NWS products, services, and actions are described inappendix A.
� Chicago, Illinois
Forecasters at the Chicago NWS Forecast Office provided forecasts of state of the art accuracy as muchas 5 days in advance of the excessive heat. This information clearly conveyed important detailsconcerning excessive temperatures and high humidities but understated the severity of what would proveto be a record event. A Heat Advisory was in effect prior to and throughout the event. As the eventneared, forecasters issued follow-up statements that relayed both emergency and climatologicalinformation to the community. However, neither the Chicago forecasters nor local officials recognizedthe potential for significant loss of life.
Extended Forecast Review
Information on expected weather conditions, generally greater than 48 hours in advance of the event, wascommunicated through the NWS Extended Forecast Product. The extended forecast products issued byforecasters at the Chicago NWS Forecast Office clearly called for hot, as well as humid, conditions wellin advance (as early as July 7). In fact, forecasters focused on humid conditions—an often difficult taskthis far in advance.
Finding: The Extended Forecast Product issued by forecasters at the Chicago NWS ForecastOffice communicated the likelihood of high levels of heat and humidity 48 hours prior to the event.
Finding: Extended range forecasts of temperatures were generally within 3 to 5 degrees for hightemperatures and 5 to 7 degrees for low temperatures.
Forecast Review
Forty-eight hours prior to the event, emphasis focuses on the provision of accurate forecasts of weatherconditions and the communication of potential public hazards relating to the anticipated heat. Inaddition, the Weather Service Operations Manual (WSOM) Chapter C-44, Non-Precipitation WeatherHazards, allows for the issuance of an Outlook or Watch for excessive heat to provide early planninginformation for both key officials as well as the general community. However, a Heat Outlook or HeatWatch was not issued.

30
NWS forecasters at Chicago issued accurate and timely forecasts relating to the anticipated heat andhumidity. High temperature forecasts during this time frame were accurate to within 3 degrees. Lowtemperature forecasts were accurate to within 6 degrees. The forecasts included descriptive wording thatadded extra detail to the forecasts. Nonetheless, these forecasts understated the conditions that actuallyoccurred and forecasters (as well as local officials) were not aware of the impact these conditions wouldhave on the general public.
Finding: NWS forecasters at the Chicago Forecast Office communicated a forecast calling forhigh heat and humidities 36 to 48 hours prior to the event.
Finding: Short-range temperature forecasts had state of the art accuracy. High temperatureforecasts were accurate to within 3 degrees. Low temperature forecasts were accurate to within 6degrees. Both were underestimates.
Finding: Forecasters used descriptive terminology, such as "muggy" and "humid," tocommunicate important weather information.
Finding: A Heat Outlook or Heat Watch was not issued as allowed for in WSOM Chapter C-44,Non-Precipitation Weather Hazards.
Recommendation: The NWS should ensure that forecasters at all field offices understand theflexibility provided by WSOM Chapter C-44 to issue a variety of critical information products onheat-related issues.
Short Term Forecast Review
During the event, forecasters are expected to issue accurate meteorological, climatological, and safetyinformation on a frequent basis. Short-range temperature forecasts for Chicago were highly accurate. High temperature forecasts were accurate to within 2 degrees. Low temperature forecasts were accurateto within 4 degrees. A Heat Advisory was issued for the city of Chicago 12 hours or more in advance ofthe worst physical conditions and most heat-related deaths. Numerous statements were issued to informthe community on the climatological aspects of the event. Fewer statements were issued, detailing safetyaspects and specific call to action information.
The wording of several forecasts was excellent. In particular, the Zone Forecasts issued at 4 a.m.,Central Daylight Time (CDT), July 13, contained enhanced heat caution wording as well as specificforecast heat index levels. For example, the headline highlighted "HEAT ADVISORY TODAY FOR AHEAT INDEX OF 110 TO 120," and the forecast called for "OPPRESSIVE HEAT AND HUMIDITY."
Heat Advisories were issued daily. The first advisory was issued at 3:30 p.m., CDT, July 12, withsubsequent advisories issued at 4:15 a.m., CDT, July 13, and 5:15 a.m., CDT, July 14. Two excellentstatements were issued at 4:15 a.m., CDT, July 13, and 5:15 a.m., CDT, July 14, which contained bothaccurate forecasts as well as call to action information.

31
Enhancement Concept 1: Stress the dangerous nature of excessive heat in
Finding: NWS forecasters at the Chicago Forecast Office issued accurate Short Term Forecaststhat included temperature, humidity, and heat index levels.
Finding: Heat Advisories were issued prior to and during the excessive heat event.
Finding: The initial Heat Advisory issued at 3:30 p.m., CDT, July 12, was issued under anincorrect product title (Public Information Statement). A Non-Precipitation Weather Warningshould have been issued.
The Short Term Forecast, routinely issued every 3 or 4 hours, was the primary product issued todistribute specific heat-related weather information and to follow up on previously issued HeatAdvisories. These forecasts contained little, if any, information relating to the potential impact ofanticipated weather conditions or call to action safety guidelines. The only attempt to target groups atrisk was in the daily Heat Advisory issuance.
Finding: NWS-issued forecast products contained highly detailed and accurate meteorologicalinformation, including the heat index, but lacked call to action statements. Heat Advisories werethe only products that contained information relating to the potential impact of anticipatedweather conditions or call to action information.
Recommendation: Forecasters should focus on the health hazards associated with heat inwarnings, watches, forecasts, advisories, and statements. All products should include call to actionstatements.
Recommendation: MICs and WCMs at all NWS forecast offices should work with state, city, andlocal health officials to determine threshold values for dangerous heat index levels tailored to theirarea.
Potential For Enhanced Service
Although the excessive heat was well forecast by forecasters at the NWS Forecast Office at Chicago,there are several ways in which service to the public could have been enhanced.
With forecast or actual temperatures near 100EF, dew points near 80EF, and heat index levels above110EF, the seriousness of these weather conditions could have been stressed in Warnings, Watches,Advisories, and Statements.

32
Enhancement Concept 2: Keep a pulse on the community.
Enhancement Concept 3: Understand local problems of the community.
Enhancement Concept 4: Develop local studies for the community.
Enhancement Concept 5: Keep the community well informed.
Enhancement Concept 6: Work with commercial service providers.
It was nearly impossible for forecasters to learn of the increasing heat-related deaths until after the peakperiod of temperature. The earliest indication of a developing crisis was an enormous increase inemergency room admissions. At one point, 18 Chicago-area hospitals were in bypass or unable to admitmore people into the emergency room. This occurred relatively early in the event. During times ofexcessive heat, forecasters should establish contact with public health officials to obtain this information.
Early indications suggest that the elderly in urban areas were vulnerable to the excessive heat. Forecasters should issue targeted products addressed to the most vulnerable.
In some cases, there are thresholds of temperature, humidity, and hence heat index at which heat-relatedproblems increase. Local studies, in cooperation with health officials, could better define these criticalvalues. They will most likely vary from region to region and, perhaps, city to city.
Once forecasters target specific groups and critical threshold heat values, keep the community informedvia frequent statements.
Work with commercial service providers to develop a heat hazards training element for their radio andtelevision customers to improve the on-air delivery of forecast information to the public.
Post-event Coordination
The MIC and WCM at the Chicago NWS Forecast Office have been closely involved with state, city, andlocal health and emergency management officials since the July heat wave and are members of theMayor’s Commission on Extreme Weather Conditions. As a result, significant progress has been madetowards improvement of weather warning and forecast services to the community during extremeweather events, including heat.

33
� Milwaukee, Wisconsin
Forecasters at the Milwaukee NWS Forecast Office provided accurate and timely forecast information asmuch as 5 days in advance of the excessive heat. This information clearly conveyed important detailsregarding excessive temperatures and high humidities. A Heat Advisory was in effect prior to andthroughout the event. As the event neared, forecasters frequently issued a variety of well-writtenstatements that relayed emergency and safety information to the community. However, neitherMilwaukee forecasters nor local officials recognized the significant potential for loss of life.
Milwaukee NWS forecasters exceeded operational requirements in keeping the community informed. Heat Advisories were issued for a consecutive 2-day period. This action, based on sound professionaljudgment, conveyed important information on the anticipated duration of the event. Additionally, anOutlook indicated the likelihood of 100EF temperatures over 40 hours in advance.
Extended Forecast Review
Information on expected weather conditions, generally greater than 48 hours in advance of the event, wascommunicated through the NWS Extended Forecast Product. The Extended Forecast Products issued byforecasters at the Milwaukee NWS Forecast Office clearly called for hot conditions well in advance (asearly as July 8). Extended forecasts did not emphasize humid conditions. Demonstrating extra initiative,NWS forecasters at Milwaukee issued two Special Weather Statements, indicating the likelihood ofdangerous heat. Special Weather Statements issued at 3:45 p.m., CDT, July 11, and 5:15 a.m., CDT, July12, were timely and accurate. Both contained information targeting the elderly (for example, "theelderly, very young, and persons with heart problems are most at risk in extreme heat"). Thesestatements, issued 40 hours prior to the event, provided the community advance notice of the expectedheat and raised awareness of physiological risk.
Finding: The Extended Forecast Product issued by forecasters at the Milwaukee NWS ForecastOffice clearly communicated the likelihood of unusually high levels of heat 5 days prior to theevent.
Finding: Extended range forecasts of temperatures were initially 6 to 10 degrees low in the 3- to5-day range but improved to within 2 degrees in the 1- to 2-day range.
Finding: Two Special Weather Statements were issued 40 hours prior to the event and containedcall to action information for the elderly and others at risk.
Forecast Review
Forty-eight hours prior to the event, emphasis focuses on the provision of accurate forecasts of weatherconditions and the communication of potential public hazards relating to the anticipated heat. In anaggressive maneuver, the Milwaukee NWS forecasters issued a Heat Advisory for 2 consecutive days. This action provided local officials with excellent planning information. Forecasts were accurate, timely,and focused on the anticipated heat and humidity. Temperature forecasts during this time frame wereaccurate to within 2 or 3 degrees. The quality of forecasts was high, with forecasters includingdescriptive wording that added extra detail to the forecasts. Nonetheless, similar to Chicago, forecasters(as well as local officials) did not appreciate clearly the impact these conditions could and did have.

34
Finding: NWS forecasters at the Milwaukee Forecast Office clearly, effectively, and accuratelycommunicated a forecast calling for high heat and humidities 36 to 48 hours prior to the event.
Finding: Short-range temperature forecasts were accurate. Initial errors in forecast accuracyimproved to within 2 or 3 degrees at least 24 hours prior to the onset of the heat wave.
Finding: Forecasters used descriptive terminology, such as "muggy" and "humid," tocommunicate important weather information.
Finding: A Heat Advisory was issued for 2 consecutive days, providing local officials excellentplanning information.
Short Term Forecast Review
During the event, forecasters are expected to issue accurate meteorological, climatological, and safetyinformation on a frequent basis. Short-range temperature forecasts for Milwaukee were highly accurate. Temperature forecasts were accurate to within 0 to 3 degrees. NWS forecasters at Milwaukee took anintegrated, multi-tier approach to informing the community of the impending dangerous heat. Heat wavesafety rules were disseminated as early as July 13 in warnings, forecasts, and statements. A HeatAdvisory was issued for the city of Milwaukee 12 hours or more in advance of most heat-related deaths. Additional Heat Advisories were issued twice daily in conjunction with the early morning and lateafternoon forecasts. Specifically, advisories were issued at 12:35 p.m., CDT, July 12; 5:15 a.m., CDT,July 13; 3:35 p.m., CDT, July 13; 4:25 p.m., CDT, July 14; 3:30 p.m., CDT, July 14; and 4:20 a.m., CDT,July 15. All advisories contained detailed temperature, humidity, and heat index information in additionto call to action statements for the elderly, the very young, and the infirm.
Finding: NWS forecasters at the Milwaukee Forecast Office issued accurate Short TermForecasts that included temperature, humidity, and heat index levels.
Finding: Heat Advisories were issued prior to and during the excessive heat event.
Finding: Heat index levels were provided in the first period (first 6 hours) of the Zone Forecasts.
NWS forecasters at Milwaukee used a combination of Short Term Forecasts, Heat Advisories, SpecialWeather Statements, and one Severe Weather Statement to convey urgent excessive heat information. All Short Term Forecasts contained public safety information. Heat Advisories were issued at 4 a.m. and

35
Enhancement Concept 1: Focus on the highest at-risk groups.
Enhancement Concept 2: Keep a pulse on the community.
4 p.m., CDT, with follow-up special weather statements issued at 10 a.m. and 10 p.m., CDT. Theseissuances provided a continuum of information to the community. Several statements targeted high riskgroups, such as the elderly, the very young, and the infirm. However, there was minimal targeting ofspecific areas at risk, such as the urban core. Numerous climatological information statements were alsoissued.
Finding: NWS-issued forecast products contained highly detailed and accurate meteorologicalinformation, including the heat index.
Finding: NWS forecasters at the Milwaukee Forecast Office issued frequent Heat Advisories andSpecial Weather Statements to keep the community well informed.
Finding: All warnings, forecasts, advisories, and statements were of high quality and containedaccurate forecast details, including heat index levels.
Recommendation: MICs and WCMs at all NWS forecast offices should work with state, city, andlocal health officials to determine threshold values for dangerous heat index levels tailored to theirarea.
Potential For Enhanced Service
Although forecasters at the NWS Forecast Office at Milwaukee kept the community well informed on theheat wave, there are a few ways in which service could have been enhanced.
Large urban areas pose unique problems during excessive heat situations. Forecasters are encouraged toprovide frequent statements targeted to the groups at higher risk; in this case, the elderly and infirmresiding in urban areas.
It was nearly impossible for forecasters to learn of the increasing heat-related deaths until after the peakperiod of temperature. The earliest indication of a developing crisis was an enormous increase inemergency room admissions. At one point, several Milwaukee-area hospitals were in bypass or unable toadmit more people into the emergency room. This occurred relatively early in the event. During times ofexcessive heat, forecasters should establish contact with public health officials to obtain this information.

36
Enhancement Concept 3: Develop local studies for the community.
Enhancement Concept 4: Work with commercial service providers.
In some cases, there are thresholds of temperature, humidity, and heat index at which heat-relatedproblems are increased. Local studies, in cooperation with health officials, could better define thesecritical values.
Work with commercial service providers to develop a heat hazards training element for their radio andtelevision customers to improve the on-air delivery of forecast information to the public.
Post-event Coordination
Since the July heat wave, the MIC and WCM at the Milwaukee NWS Forecast Office have been closelyinvolved in coordinating emergency preparedness plans with local officials for extreme heat events.

37
CHAPTER 4
COMMUNICATION, EMERGENCY PREPAREDNESS,AND COMMUNITY RESPONSE
"We knew it was going to be hot...but we had no idea it could be that deadly."Local Emergency Official
Extreme heat may be the most underrated and least understood of the deadly weather phenomena. Thecommunities of Chicago and Milwaukee had in place extensive disaster preparedness plans and responseprocedures for many weather and flood hazards. However, as seen in the July heat wave, extreme heatwas not one of the disasters they were prepared to respond to effectively. Local officials clearly did notunderstand the connection between very high heat and humidity and high death rates. In fact, the exactdefinition of heat-related deaths and illnesses and the extent of the mortality and morbidity associatedwith extreme heat is a debated topic in the medical, forensic, and public health communities.
The effects of a heat wave are often delayed in terms of: (1) increased illness and mortality and (2) thedetection of these increases by the medical, public health, and public safety monitoring systems incommunities. Heat is not like a flood, hurricane, or tornado that is a visible phenomenon whichdramatically impacts a community, leaving identifiable victims who receive immediate emergencymedical treatment.
In both Chicago and Milwaukee, extreme heat was viewed as a public health concern, not as a majorcommunity emergency or disaster. Therefore, this event fell within the purview of the local healthdepartment to provide planning for and coordinate community response to these events. Heat waveswere outside the realm of local disaster or emergency operations plans of the emergency managementofficials and the traditional disaster response systems. This shaped the nature and extent of eachcommunity’s actions during the July heat wave.
To better understand how local officials prepared for and responded to this event, the communication,emergency preparedness, and community response actions will be reviewed for Chicago and Milwaukeebased on interviews with local health and emergency response officials. The media response to thisevent will also be discussed in terms of how they provided the public with: (1) NWS warnings,forecasts, advisories, and statements; (2) the risks of excessive heat; and (3) safety tips.
In general, the warning process involves a series of interdependent actions in order to achieve itsgoal—to maximize the number of people who take timely and appropriate protective action. Thiswarning process may be viewed as an integrated warning system comprised of three functionalcomponents: (1) scientific detection and prediction; (2) emergency response, including warning; and (3)correct protective public response.

38
If any one of these components fails, the entire system can fail. The first component has been reviewedin preceding chapters; we focus here on factors affecting the second and third components.
Communication
The communication process involves two steps: (1) the communication of critical weather informationby the NWS to emergency managers, the news media, and other agencies that are part of the publicwarning process; and (2) the communication of this information via emergency preparednessorganizations and the media to those affected. The goal of effective communication is to maximize thenumber of people who take timely and appropriate protective action.
In the case of the July 1995 heat wave, it appears that the first step of this process went satisfactorily atboth Chicago and Milwaukee. Unlike small, highly-localized, short-lived but violent phenomena, such astornadoes, the nature of a heat wave—its broad extent, gradual development, and slow subsequentmotion—was such that it was forecast accurately days in advance. Thus, the performance of rapidresponse communications links (such as NOAA Weather Radio [NWR], NOAA Weather Wire Service[NWWS], and the Emergency Broadcast System) was not an issue here.
Despite timely NWS warnings, forecasts, advisories, statements, and effective media coverage of theevent, the communication process failed in Chicago and Milwaukee during the second step. There was afailure by city officials to translate the physical character of the heat wave (maximum temperatures,minimum temperatures, humidities, spatial extent, and duration) into human impacts. Emergencypreparedness for Chicago and Milwaukee will be reviewed in the next section.
Finding: Despite timely NWS warnings, forecasts, advisories, statements, and effective mediacoverage of the event, city officials had neither the experience nor emergency response capabilitiesto translate the physical characteristics of the heat wave into human impact.
Recommendation: NWS offices should work with local officials to develop a public awareness andcommunity response plan for such events, especially among vulnerable or disadvantaged groups.
Media Coverage
The July 1995 heat wave was a unique meteorological event for the Chicago and Milwaukee media. While the electronic (radio and television) and print media provided heat-wave forecasts and health-related reports, they failed to foresee the number of deaths that would result from this unprecedentedweather event. Media representatives interviewed in Chicago and Milwaukee reported good workingrelationships with their respective NWS offices and were satisfied with the level of service provided.
The Chicago and Milwaukee media received weather information from both the NWS and a variety ofcommercial weather vendors. Staff meteorologists at radio and television stations gave the NWS high

39
marks for timely and accurate forecasts and related services during the heat wave. They found NWSforecasts to be consistent with their own. According to Chicago’s WGN-TV meteorologist Tom Skilling,"The NWS made it absolutely clear that this extremely hot air mass was coming our way."
Radio and television stations provided the public with weather-related information through two differentvenues: weather and news reporting. While media coverage reported dangerous heat levels and offeredtips on staying cool, no one anticipated the number of deaths that would accompany the event. An articlein the Milwaukee Journal Sentinel (July 25, 1995) noted, "Milwaukee’s TV weathercasters did their jobwell in letting us know that killer heat was on its way. What viewers did with that information helpeddetermine how well they coped with the heat."
Several media representatives noted that people understand watch/warning terminology forthunderstorms and winter storms but not for heat. A few voiced concerns about the heat index. Forothers, triple digit temperatures, not the heat index, made the weather the top story. All said theyreflected severity of the event in their terminology and in changes of story context from "uncomfortableheat" to "dangerous heat."
Finding: Media coverage of the July 1995 heat wave in Chicago and Milwaukee was substantialfrom both meteorological and health angles.
Finding: Staff meteorologists at radio and television stations gave the NWS high marks for timelyand accurate forecasts and related services during the heat wave.
Finding: The Chicago and Milwaukee media have not developed a public response to heathazards as they have for other severe weather phenomena.
Recommendation: The NWS must enhance its public education campaign regarding the use of theheat index and the dangers of heat. The media and the private sector should be enlisted aspartners through professional associations, such as the American Meteorological Society and theNational Weather Association.
� Chicago, Illinois
Emergency Preparedness
Chicago’s disaster preparedness planning responsibility rests in the Chicago Fire Department. TheirOffice of Emergency Management maintains the city’s emergency operations plan. It addresses the majordisasters believed to threaten Chicago. A disaster is an event that causes community impacts whichoutstrip any single agency’s ability to respond and meet the demands for help or resources. Extremetemperatures were not identified as one of the hazards that could cause a disaster in Chicago; a heat wavewas viewed as a health emergency. An emergency is defined as heavily taxing the response capabilitiesof an agency or governmental function, such as emergency medical services, fire suppression, or crowdcontrol. Hot weather, considered a health emergency, falls under the responsibility of the ChicagoDepartment of Health. Therefore, the city’s response to extremely hot temperatures is not addressed inthe citywide disaster preparedness process.

40
The Chicago Health Department’s plan for heat waves that was in effect July 14 and 15 had three basiccomponents. First, public service announcements on heat safety actions are sent to the media outlets inearly June as a general preparedness measure for the coming summer. Second, forecasts for excessiveheat are brought to the attention of the media news departments by the health department. These aremonitored through weather forecasts on radio and television. Third, the Department of Human Services,the Department of Aging, and the Chicago Police Department are notified by the Department of Health ofheat wave forecasts. When excessive heat is forecast, cooling centers are activated to provide service tothe elderly at community centers.
Additionally, individual city agencies have internal heat wave response plans. These include suchactions as relief for firefighters battling blazes, precautions for public works and sanitation crewsworking outdoors in the heat, police awareness to heat-related problems, and spraying water on metalbridges to prevent buckling. The city also has in place a medical emergency plan, covering both patienttransport and hospital response to mass casualty incidents. This plan is designed to provide acoordinated delivery of medical services in case of a disaster that would overload hospitals with victims. The goal is to simultaneously activate the area hospitals’ individual disaster plans and coordinate patienttransport to hospitals based on patient need and available medical resources.
Chicago has a long history of meteorological forecast support from the private sector. This hastraditionally focused around winter weather and city snow removal operations. The Chicago Departmentof Streets and Sanitation, Bureau of Street Operations, serves as the focal point for all weather forecastsand information for the city. Their dispatch center is staffed around the clock, 7 days a week. The citycontracts for meteorological support from three different companies. They receive, via telephonefacsimile, forecasts three times daily from Murray and Trettel, Incorporated. This firm also issues itsown storm warnings for severe summer weather and snow and ice storms and sends them to the Bureauof Street Operations. The storm warnings are faxed out by Street Operations to most city agencies. Thedispatchers do not know the differences or similarities between these private storm warnings and NWSwarnings. Chicago also purchased a series of street surface sensors and meteorological support servicesfrom Surface Systems Incorporated (SSI). This firm provides real-time access to the sensors in the cityand surrounding area. They also provide computer access to NWS forecast products that can be printedand NWS Doppler weather surveillance radar products through a Next Generation Radar InformationDissemination Service vendor. The dispatchers must actively retrieve weather information, warnings,watches, and forecasts on this computer system. The third company the city uses is Compu-Weather, andit receives forecasts twice daily from this firm.
Chicago receives NWS warnings, watches, and forecasts indirectly via The Weather Channel, which isconstantly monitored in the dispatch center and over the SSI weather computer. There was no direct linkto the Chicago NWS Forecast Office. The dispatch center does not subscribe to the NWWS nor does itmonitor NWR.

41
Finding: At the time of the July 1995 heat wave, the emergency preparedness program forextreme heat in Chicago was organized and administered from the public health department,which was different from other hazardous weather events.
Finding: Officials in Chicago did not realize the difference between NWS weather warnings andprivate sector warnings.
Recommendation: The Chicago NWS Forecast Office should work with Chicago officials to provide user training on NWS watch/warning products.
Community Response
Chicago officials were aware that the forecast was for hot weather July 13 and 14, but they did not fullyunderstand the meaning of the heat index forecast nor did the forecast clearly convey the true severity ofwhat would occur. Moreover, they could not anticipate the potentially catastrophic nature of such anextreme heat wave and the extent of the threat to public health. It was beyond anyone’s realm ofexperience. Officials indicated that even if warnings for excessive heat had been issued by the ChicagoNWS Forecast Office, they would not have changed their response. Community centers stayed open ascooling facilities for the elderly but appeared to have been only slightly used. Public serviceannouncements were sent out about the cooling centers. Individual city agencies activated their heatresponse operating procedures, stressing the safety of their personnel. The city prepared for several daysof very uncomfortable weather that would affect city service operations. Weather forecasts for extremeheat were received in the Bureau of Street Operations dispatch center. However, there was no cityprotocol for relaying Warnings, Watches, Forecasts, Advisories, and Statements to other city agencies. The heat wave was not identified as a major weather or public health threat. Therefore, the ChicagoDepartment of Health relied on media-relayed NWS forecasts and periodic NWS briefings via telephone.
The real-time tracking of increased demand for emergency medical services did not detect the increasedhospital load during the heat wave. Therefore, the city’s medical emergency plan was not activated. Individual hospitals did implement their individual patient overload response plans, which called forambulances with patients to bypass emergency rooms that were full. The patients were taken to lesscrowded hospitals. The transportation and treatment of patients suffering heat-related illnesses was notcoordinated citywide.
The first indication of the catastrophic impact of the heat wave was the arrival of large numbers ofvictims at the Chicago Medical Examiner’s Office. The true nature of the disaster revealed itself as moreand more victims were discovered in their homes. In many ways, this was a silent disaster, quietly killinghundreds of people who did not escape the deadly heat. When it was all over, Chicago had experiencedits worst weather-related disaster with 465 heat-related deaths that occurred from July 11-27.

42
Recovery
Immediately after the impact of the heat wave was recognized, Chicago officials began a new program ofshort-term actions for a citywide heat response program. These included an interim Heat EmergencyPlan and a proactive city response to heat waves. A Mayoral Commission on Extreme WeatherConditions was convened, with the task of recommending long-term plans for preparing for andresponding to heat waves and other weather hazards.
In parallel with the Commission, officials at the Chicago Department of Health began immediately afterthe event to develop a detailed interim Heat Emergency Plan and a proactive city response to heat waves. This included daily monitoring of private sector and NWS forecasts by health officials. The city hasdirected Murray and Trettel, Incorporated, to provide a 5-day forecast for the heat index based on theNWS computational formula. These daily forecasts are faxed to the Chicago Department of Health andother city agencies. The Chicago Department of Health also developed a Heat Emergency Plan whichcalls for the health department to issue Heat Alert, Heat Warning, and Heat Emergency messages to thepublic based on NWS forecasts of heat index temperatures. Many agencies have stepped up theirsurveillance of those citizens at risk from heat-related illness and death. The Heat Emergency Plan alsoestablishes a city command post and phone bank if heat index temperatures exceed 105EF.
The Commission was created to advise the Mayor of Chicago on proposals for dealing with all types ofhazardous weather that affect Chicago. Its mission is to document the past occurrence and future risk ofhazardous weather conditions and develop emergency response capability as part of the city’s emergencyplanning. Members for all city agencies are appointed to the Commission as is the MIC from theChicago NWS Forecast Office. The Commission is divided into six committees: weather, mortality andmorbidity, geriatric behavior, role of the government, role of the private sector, and public education andoutreach. Members of the Commission have talked with representatives from both Philadelphia,Pennsylvania, and St. Louis, Missouri, to study their community heat response plans and operations. Chicago officials have identified these two cities as having effective community heat response programs.
� Milwaukee, Wisconsin
Emergency Preparedness
The emergency management structure for Milwaukee is located in the Milwaukee County Division ofEmergency Government. Local emergency management is well organized, has a very good relationshipwith the Milwaukee NWS office, and generally appears to be quite responsive to weather emergencies. However, local decision-makers do not receive weather information directly from the NWS via theNWWS or NWR. For routine weather information, local officials rely solely on the media. Localemergency officials receive emergency weather information for tornadoes, severe thunderstorms, andflash flooding via the Wisconsin Criminal Justice Information System (WCJIS), which has a fully-automated interface with NWWS to disseminate warnings and watches to all local law enforcementagencies. Printed warnings and watches are received by local officials. Other critical information (heatwaves, winter weather, etc.) is not relayed by WCJIS.

43
The city of Milwaukee’s heat wave preparedness and response is coordinated by the Milwaukee HealthDepartment. Several years ago, they brought together the Hot Weather Task Force, representing variouspublic and private organizations, to develop a coordinated response plan to extreme and prolonged hightemperatures. The plan calls for the issuance of Heat Warnings and Heat Alerts based on a forecast ofhot weather for 2 or more consecutive days. These issuances, designed to alert the media, public, andother response agencies, include information on air-conditioned public facilities, cool spots (i.e.,libraries), pools, cooling centers, and senior centers that are open. They also include phone numbers forvarious agencies, providing health advice during heat waves and specific health facts and tips. Theseissuances are disseminated to the media independent of NWS products.
Community Response
In Milwaukee, the community response to the heat wave was similar to that of Chicago. Local officialsexpected the predicted July heat wave to involve very hot weather and oppressive humidity with somehealth risks for the elderly. The event was not viewed as extremely dangerous and potentially deadly.
On July 11, the Milwaukee Department of Health issued a Hot Weather Advisory for the impending heatwave. The advisory was based on NWS forecasts for high temperatures and humidity. Lists of air-conditioned cooling centers at community centers, public facilities, and libraries were in the advisory. The heat information telephone lines were staffed from July 12 to 14 to answer health-related questionsfrom the public. The city advisory was forwarded to area health facilities and the media. Agencies thatwere part of the Milwaukee Department of Health Heat Disaster Plan were notified of the advisory. There was a sense of informal cooperation among the agencies but no formal coordination of efforts.
The magnitude of the problem only became apparent when health officials noticed the increase in heat-related morbidity and mortality. The city activated its Emergency Medical Services response plan, andindividual hospitals activated their disaster plans. The scope of the disaster was not fully realized untilthe death toll rapidly rose. The city opened more shelter space to help residents escape the deadly heat. The Milwaukee Division of Emergency Government became aware of the disaster when they received arequest for cots for the cooling shelters. Once again, the silent killer of extreme heat had struck beforethe danger had been fully recognized by local officials. In Milwaukee, 85 heat-related deaths wererecorded from July 14-17, 1995.
On July 14, the Milwaukee Department of Health, using its own criteria (3 consecutive days with heatindexes above 95EF), issued a health warning. It is not clear if or how the warning was perceiveddifferently from the NWS Heat Advisory by the media and the public. According to health departmentofficials, there was at most minimal confusion resulting from having warning messages from differentsources using different wording. They believe that the messages, rather than conflicting with each other,served to emphasize the heat concern in the public’s consciousness. Activities that were in operationprior to or soon after the start of the heat wave included a fan distribution program, the operation ofcooling centers, and contacting of shut-ins.

44
Recovery
In Milwaukee, a Community Task Force on Summer Weather Emergencies was convened immediatelyafter the heat wave. The Task Force consists of participants from the NWS; state, county, and citydivisions of emergency government and public health; emergency medical groups; utilities; volunteerorganizations (Salvation Army, American Red Cross, etc.); and the media. The Task Force isinvestigating improvements in preparedness and response to summer weather hazards.
Finding: Chicago and Milwaukee officials and the public did not fully understand the heat indexor the extent of the threat from heat waves.
Recommendation: The NWS must enhance its community education campaign regarding the useof the heat index and the dangers of heat.

45
CHAPTER 5
CASE STUDIES INHEAT WAVE PREPAREDNESS
In addition to Chicago and Milwaukee, the NOAA Disaster Survey Team visited Philadelphia,Pennsylvania, and St. Louis, Missouri. These cities experienced deadly heat waves in 1993 and 1980,respectively. The Survey Team wanted to determine whether previous experience during heatemergencies affected the impact of the July 1995 heat wave in these two cities.
Recommendation: NOAA should actively encourage other Federal agencies, such as theDepartment of Health and Human Services, the Environmental Protection Agency, and theFederal Emergency Management Agency, to join in research on excessive heat, mortality, andmorbidity.
Recommendation: The NOAA Chief Scientist should convene a workshop comprised ofinteragency physical scientists, private sector providers, social scientists, and epidemiologists toprovide operational research recommendations in light of the scientific advances made over thelast decade. The relationship between heat-related mortality and the heat index, as well as otherproposed predictors of heat stress, should be simultaneously evaluated to determine which methodmost accurately predicts the health consequences of a heat wave.
� Philadelphia, Pennsylvania
During a 3-week period in July 1993, the Philadelphia County Medical Examiner reported approximately118 heat-related deaths (CDC, 1994; CDC, 1993). Although the medical examiner was initially criticizedfor overestimating the number of deaths, a subsequent evaluation by CDC investigators confirmed thefindings. In fact, it was found that similar increases in deaths during the heat wave had occurred in otherurban areas near Philadelphia although they had not been recognized at the time.
From July 12 through August 17, 1995, 72 deaths in Philadelphia were attributed to the heat. Forty-two(42) of these occurred between July 13-21 when the same heat that had affected Chicago and Milwaukeeblanketed Philadelphia. Of the 72 deaths, 54 (75 percent) occurred in persons over 60 years of age. Many of the deceased had pre-existing medical conditions which may have made them, for physiologicor behavioral reasons, more susceptible to the effects of the heat.
As a result of its experience during the 1993 heat wave, the city of Philadelphia established a Heat WavePreparedness Task Force which developed an extensive and detailed Heat Response Emergency Plan forreacting to heat emergencies. The Plan provides a comprehensive system of prompt notification and

46
mobilization of agencies during an excessive heat event. Participants in the heat Plan include not onlythe Philadelphia Department of Health but also the Philadelphia Corporation on Aging, the PennsylvaniaEmergency Management Agency, the American Red Cross, representatives of the public utilities, and theNWS. Year-round preparedness is emphasized, and participating groups meet throughout the year toplan and coordinate their activities. The Heat Hotline, established during the 1993 heat wave, is thebackbone of the emergency response and is managed by the Philadelphia Corporation on Aging. Inresponse to calls received by the Hotline, teams consisting of a nurse and an environmental healthpractitioner evaluate the residences of persons potentially at risk and assess the resident’s health and theirability to cope with the heat. Other activities of the Heat Wave Preparedness Task Force include theestablishment of a plan for assisting the homeless during a heat emergency and modification of localordinances to require landlords of multiunit residences housing the elderly to maintain temperaturesbelow a certain threshold.
Philadelphia’s Heat Response Emergency Plan is activated by Heat Warnings issued by the NWS. Emergency activities are mobilized on the basis of a coordinated prediction plan between the NWS andthe University of Delaware. The University of Delaware uses an alternative model developed byProfessor Laurence Kalkstein, Center for Climatic Research, University of Delaware, and funded by theEnvironmental Protection Agency (Kalkstein and Smoyer, 1993; Kalkstein, 1993; Kalkstein, 1991;Kalkstein and Davis, 1989; Kalkstein and Valimont, 1986). The Kalkstein model first identifiescommonly occurring types of summer air masses. This is done through a statistically based classificationsystem which considers several weather forecast variables (air temperature, dew point temperature,atmospheric pressure, cloud cover, wind speed, and direction) at four time points in each 24-hour period. For many cities, Kalkstein claims that one type of air mass is associated with the greatest increase inmortality. For Philadelphia, this air mass is identified as maritime tropical, oppressive. However, not alldays within this air mass type are associated with elevated mortality totals. The model further identifieswhich days within the high risk air mass will have elevated mortality. In Philadelphia, the factors thatcontribute to high daily mortality when the high risk air mass is present include the number ofconsecutive days within the air mass, the date in the season, and maximum temperature. Ironically, theair mass described in chapter 1 that produced the severe conditions on July 14 and 15 in Philadelphia wasnot maritime tropical.
In 1994, the NWS initiated a new Health Watch/Warning System in coordination with Pennsylvaniaemergency management officials. In 1995, the city of Philadelphia started an enhanced HealthWatch/Warning System based on the Kalkstein model. The system consists of three levels: HealthWatch, Health Alert, and Health Warning. A Health Watch is issued by the Philadelphia HealthCommissioner 2 days prior to the forecasted arrival of a high risk air mass. A Health Alert is issued1 day prior to the forecasted arrival of a high risk air mass. These issuances are coordinated with theNWS Forecast Office at Mt. Holly, New Jersey. A Health Warning is issued by the Philadelphia HealthCommissioner either the afternoon before or the morning of the forecasted occurrence of a high risk airmass. Depending on the number of excess deaths predicted by the model, one of three Health Warningsis issued. A Level One warning is issued if one to four heat-related deaths are predicted; a Level Twowarning, if five to fourteen deaths are predicted; and a Level Three warning, if fifteen or more deaths arepredicted. The Health Warning is only issued in conjunction with the issuance of a Heat Warning by theNWS.

47
These Heat Warnings are based on heat index values reaching 105EF for 3 hours or more for 2consecutive days.
Advocates of Kalkstein’s work believe that this model can better predict the true health risks associatedwith a specific day than can the heat index criteria used by the NWS. This is because it models therelationship between meteorological characteristics and mortality and takes into account the effect ofadditional non-meteorological variables. There is not yet sufficient data to demonstrate clearly whetherin fact the Kalkstein method is consistently better at predicting the health effects of a heat wave. Forexample, between July 12 and August 16, 1995, the Kalkstein model recommended the issuanceof Health Warnings on 15 days in Philadelphia. On nine of these days, the NWS also issued warnings. Of the 70 heat-related deaths that were recorded during that period, 17 (24 percent) occurred on dayswhen warnings were issued by the NWS and recommended by Professor Kalkstein; 15 (21 percent)occurred on days when only Professor Kalkstein recommended a warning; 38 (54 percent) occurred ondays when no warnings were issued. The extent to which mortality was mitigated by appropriatecommunity response based on these warnings is also not known.
With the heightened awareness of city officials to the implications of high heat index values inconjunction with a re-evaluation of Heat Advisory thresholds currently used by the NWS, the heat index,with or without modification, may be as predictive as any proposed alternative models. Before beingadopted on a wide scale, any alternative method for predicting Heat Warnings needs to be thoroughlyevaluated. It is recommended that the relationship between heat-related mortality and the heat index, aswell as other proposed predictors of heat stress, should be simultaneously evaluated to determine whichmethod most accurately predicts the health consequences of a heat wave.
There has been significant research in the area of the health effects of extreme heat since the currentNWS heat index and warning/watch/advisory criteria was established. Many of the publications haveappeared since WSOM chapters were written. Research has been in the fields of public health,epidemiology, climatology, meteorology, gerontology, sociology, and geography (Kilbourne, 1989;Kalkstein, 1991; Lee, 1980; Riebsame, 1985; Riebsame, et al., 1986). This indicates the need for reviewof current knowledge on the impact of heat to health and public safety as well as a review of NWSoperations.
Finding: Philadelphia’s Heat Wave Preparedness Task Force developed an extensive and detailedplan for responding to heat emergencies.
Finding: Philadelphia’s Heat Response Emergency Plan is activated by Heat Warnings issued bythe NWS.
Finding: Emergency heat-related activities in Philadelphia are mobilized on the basis ofpredictions of an alternative model developed by Professor Laurence Kalkstein, Center forClimatic Research, University of Delaware.
Finding: It is not clear how much better the Kalkstein model compares with other models inpredicting the health effects of a heat wave.

48
Recommendation: The Kalkstein model should be reviewed after its proposed expansion toChicago, Illinois, and Atlanta, Georgia, in 1996.
The NOAA Disaster Survey Team believes the following recommendation to be of particular importance.
NWS Actions
During the July 1995 heat wave, forecasters at the NWS Forecast Office at Mt. Holly, New Jersey(whose responsibility includes the Philadelphia metropolitan area), took aggressive actions to informtheir community of the dangerous heat wave. Accurate and timely forecast information was provided asmuch as 5 days in advance of the excessive heat. Products issued by NWS forecasters clearly conveyedimportant and accurate forecast information regarding excessive temperature and high humidities. A Heat Warning/Advisory was in effect throughout the event. In fact, Heat Warnings/Advisories wereissued for a consecutive 2-day period. This action, based on sound professional judgment, conveyedimportant information on the anticipated duration of this event.
As the event neared, the office issued a variety of frequent, well-written statements that relayedemergency and safety information to the community. Statements were often targeted to high risk groupsand areas. NWS forecasters exceeded operational requirements in keeping the community informed. AnOutlook product indicated the likelihood of dangerous heat over 48 hours in advance of highesttemperatures. In an unusual and highly successful move even prior to the issuance of a Heat Advisory,Zone Forecasts were highlighted to reflect the anticipated dangerous heat. Temperature forecasts werehighly accurate and generally verified to within 2 or 3 degrees. NWS forecasters were also in contactwith state, city, and local officials during the event.
Finding: NWS forecasters clearly, effectively, aggressively, and accurately communicated aforecast for the Philadelphia area calling for dangerously high heat and humidities 36 to 48 hoursprior to the event.
Finding: Recognizing the unique situation of an urban center, NWS forecasters issued a HeatWarning for Philadelphia (the highest level possible) for a consecutive 2-day period. This actionprovided community officials with key planning information.
Recommendation: NOAA should quantify the urban heat island effect to incorporate in NWSHeat Warnings, Watches, Advisories, and Statements.
Media Coverage
Philadelphia summers are hot and humid, and the media are extremely knowledgeable about the dangersof excessive heat. During the July 1995 heat wave, the citizens of Philadelphia received excellent andthorough coverage of the event.
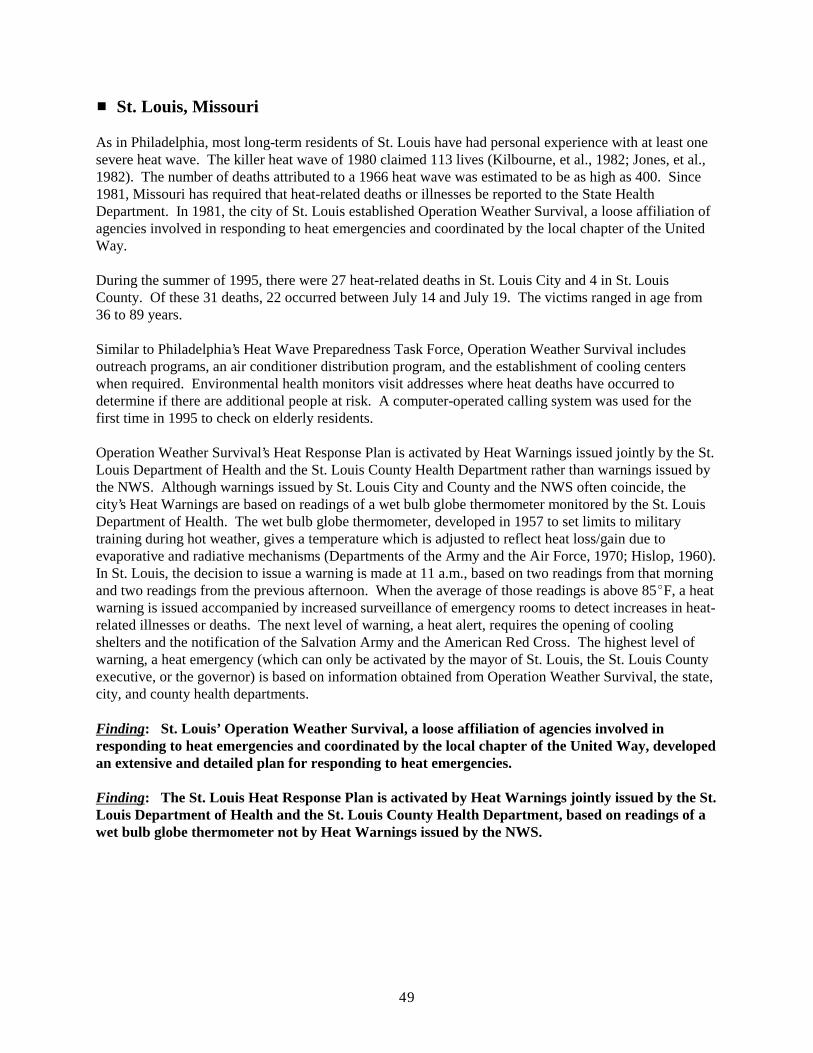
49
� St. Louis, Missouri
As in Philadelphia, most long-term residents of St. Louis have had personal experience with at least onesevere heat wave. The killer heat wave of 1980 claimed 113 lives (Kilbourne, et al., 1982; Jones, et al.,1982). The number of deaths attributed to a 1966 heat wave was estimated to be as high as 400. Since1981, Missouri has required that heat-related deaths or illnesses be reported to the State HealthDepartment. In 1981, the city of St. Louis established Operation Weather Survival, a loose affiliation ofagencies involved in responding to heat emergencies and coordinated by the local chapter of the UnitedWay.
During the summer of 1995, there were 27 heat-related deaths in St. Louis City and 4 in St. LouisCounty. Of these 31 deaths, 22 occurred between July 14 and July 19. The victims ranged in age from36 to 89 years.
Similar to Philadelphia’s Heat Wave Preparedness Task Force, Operation Weather Survival includesoutreach programs, an air conditioner distribution program, and the establishment of cooling centerswhen required. Environmental health monitors visit addresses where heat deaths have occurred todetermine if there are additional people at risk. A computer-operated calling system was used for thefirst time in 1995 to check on elderly residents.
Operation Weather Survival’s Heat Response Plan is activated by Heat Warnings issued jointly by the St.Louis Department of Health and the St. Louis County Health Department rather than warnings issued bythe NWS. Although warnings issued by St. Louis City and County and the NWS often coincide, thecity’s Heat Warnings are based on readings of a wet bulb globe thermometer monitored by the St. LouisDepartment of Health. The wet bulb globe thermometer, developed in 1957 to set limits to militarytraining during hot weather, gives a temperature which is adjusted to reflect heat loss/gain due toevaporative and radiative mechanisms (Departments of the Army and the Air Force, 1970; Hislop, 1960). In St. Louis, the decision to issue a warning is made at 11 a.m., based on two readings from that morningand two readings from the previous afternoon. When the average of those readings is above 85EF, a heatwarning is issued accompanied by increased surveillance of emergency rooms to detect increases in heat-related illnesses or deaths. The next level of warning, a heat alert, requires the opening of coolingshelters and the notification of the Salvation Army and the American Red Cross. The highest level ofwarning, a heat emergency (which can only be activated by the mayor of St. Louis, the St. Louis Countyexecutive, or the governor) is based on information obtained from Operation Weather Survival, the state,city, and county health departments.
Finding: St. Louis’ Operation Weather Survival, a loose affiliation of agencies involved inresponding to heat emergencies and coordinated by the local chapter of the United Way, developedan extensive and detailed plan for responding to heat emergencies.
Finding: The St. Louis Heat Response Plan is activated by Heat Warnings jointly issued by the St.Louis Department of Health and the St. Louis County Health Department, based on readings of awet bulb globe thermometer not by Heat Warnings issued by the NWS.

50
NWS Actions
During the July 1995 heat wave, forecasters at the NWS Forecast Office at St. Louis issued high qualityforecasts and statements that informed their community of the dangerous heat wave. Accurate and timelyforecast information was provided as much as 5 days in advance of the excessive heat. Products issuedby NWS forecasters clearly conveyed important and accurate forecast information regarding excessivetemperatures. A Heat Advisory was in effect well prior to and throughout the event. In fact, HeatAdvisories were issued for a consecutive 2-day period. This action, based on sound professionaljudgment, conveyed important information on the anticipated duration of this event.
As the event neared, the office issued a variety of frequent, well-written statements that relayedemergency and safety information to the community. Statements were often targeted to high risk groups. NWS forecasters issued a number of extra products that provided climate and other information to thecommunity. NWS forecasters were also in contact with state, city, and local officials during the event.
Finding: NWS forecasters clearly and accurately communicated the likelihood of unusually highlevels of heat for St. Louis 5 days prior to the event.
Finding: NWS forecasters issued a Heat Advisory for St. Louis for a consecutive 2-day period. This action provided community officials with key planning information.
Media Coverage
The St. Louis media recognize the dangers of excessive summer heat and reflect this in their frequentreporting. The media covered the July 1995 heat wave from both the meteorological and newsperspectives. In fact, the St. Louis media found it difficult to find different story angles as the heat wavelingered.

51
REFERENCES
Centers for Disease Control and Prevention. "Heat-Related Mortality — Chicago, July 1995." Morbidity and Mortality Weekly Report, 1995; 44:577-9.
_________. "Heat-Related Deaths — Philadelphia and United States, 1993-1994." Morbidityand Mortality Weekly Report, 1994; 43:453-5.
_________. "Heat-Related Deaths — United States, 1993." Morbidity and Mortality WeeklyReport, 1993; 42:558-560.
Departments of the Army and the Air Force, "Health Problems Related to ExtremeTemperatures," Field Hygiene and Sanitation, 1970; 80-81.
Hislop, Livingstone R., "Technical Notes: The Wet Bulb-Globe Temperature Index." U.S.Armed Forces Medical Journal, 1960; 11:709-712.
Jones, T.S.; Liang, A.P.; Kilbourne, E.M.; et al. "Morbidity and Mortality Associated with theJuly 1980 Heat Wave in St. Louis and Kansas City, Missouri." Journal of the American MedicalAssociation, 1982; 247:3327-31.
Kalkstein, L.S., "Health and Climate Change: Direct Impacts in Cities." The Lancet, 1993;342:1397-1399.
_________, "A New Approach to Evaluate the Impact of Climate Upon Human Mortality." Environmental Health Perspective; 1991; 96:145-50.
_________, and Davis, R.E., "Weather and Human Mortality: An Evaluation of Demographicand Inter-regional Responses in the United States." Annals of the Association of AmericanGeographers, 1989; 79:44-64.
_________, and Smoyer, K.E., "The Impact of Climate Change on Human Health; SomeInternational Implications." Experientia 49 (1993), Birkhauser Verlag.
_________, and Valimont, K.M., "An Evaluation of Summer Discomfort in the United Statesusing a Relative Climatological Index." Bulletin of the American Meteorological Society, 1986;67:842-48.
Kilbourne, E.M., "Heat Waves" in The Public Health Consequences of Disasters (Centers forDisease Control and Prevention monograph). Atlanta: U.S. Department of Health and HumanServices, Public Health Service, Centers for Disease Control and Prevention, 1989; 51-61.
_________; Choi, K.; Jones, T.S.; Thacker, S.B.; and the Field Investigation Team. "RiskFactors for Heat Stroke: A Case Control Study." Journal of the American Medical Association,1982; 247:3332-6.

52
Lee, D.H. "Seventy-five Years of Searching for a Heat Index." Environmental Research, 1980;22:331-56.
Riebsame, W.E. 1985. "Climate Hazards: Lessons from Recent Events in the United States." Disasters; 9:295-300.
_________; Diaz, H.F.; Moses T.; and Price, M. "The Social Burden of Weather and ClimateHazards." Bulletin of the American Meteorological Society, 1986; 67:1378-88.

A-1
APPENDIX A
REVIEW CRITERIA FOR NWS PRODUCTS,SERVICES, AND ACTIONS
In a review of NWS forecast office products and services, both objective and subjective actorsmust be considered. Objective actions include compliance with WSOM chapters that serve asbaseline instructions for forecast offices. Subjective factors also play a critical role, especiallyduring high impact meteorological events. Subjective actions include those actions taken byforecasters above and beyond what is specified by written guidance.
Objective Review
< General compliance with WSOM Chapter C-44, Non-Precipitation Weather Hazards, andrelated guidelines and policies.
< Frequency of statement issuance.< Accuracy of forecasts.
Subjective Review
A subjective review of forecast office actions is a more complex task. It must consider forecasterresponse that at times is based on limited information. It might include the following.
< Appropriateness of actions.< Recognition of magnitude of event.< Responsiveness.< Proper transition from an unusual into a critical weather event.< Quality of forecasts.< Quality of statements.
Time Sequence Review
In addition to these objective and subjective factors, this review will be defined further by thefollowing time sequences.
< Extended Forecast Review: Period of time generally greater than 48 hours prior to the onsetof the excessive heat event.
< Forecast Review: Period of time generally between 36 and 48 hours prior to the onset of theperiod of review.
< Short Term Forecast Review: Period of time within the excessive heat event.< Post-event Review: Period of time after the excessive heat event.


![Australian [Adelaide] Longitudinal Study of Aging, Waves 1 ...€¦ · additional clinical studies. Wave 2 (1993-1994), Wave 3 (1994-1995), Wave 4 (1995-1996), and Wave 5 (1996-1997)](https://static.fdocuments.in/doc/165x107/5fdef2451d665b4a4b7e8fae/australian-adelaide-longitudinal-study-of-aging-waves-1-additional-clinical.jpg)


