Julia C. Arciero, Ph.D. HHS Public Access Maria Branca ...
24
Using a continuum model to predict closure time of gaps in intestinal epithelial cell layers Julia C. Arciero, Ph.D. 1 , Qi Mi, Ph.D. 2,3 , Maria Branca 4 , David Hackam, M.D, Ph.D. 4,5 , and David Swigon, Ph.D. 6 1 Department of Mathematical Sciences, Indiana University-Purdue University, Indianapolis 2 Department of Sports Medicine and Nutrition, University of Pittsburgh 3 Center for Inflammation and Regenerative Modeling, McGowan Institute for Regenerative Medicine, University of Pittsburgh 4 Division of Pediatric Surgery, Children's Hospital of Pittsburgh 5 Pediatric Surgery, University of Pittsburgh School of Medicine 6 Department of Mathematics, University of Pittsburgh Abstract A two-dimensional continuum model of collective cell migration is used to predict the closure of gaps in intestinal epithelial cell layers. The model assumes cell migration is governed by lamellipodia formation, cell-cell adhesion, and cell-substrate adhesion. Model predictions of the gap edge position and complete gap closure time are compared with experimental measures from cell layer scratch assays (also called scratch wound assays). The goal of the study is to combine experimental observations with mathematical descriptions of cell motion to identify effects of gap shape and area on closure time and to propose a method that uses a simple measure (e.g., area) to predict overall gap closure time early in the closure process. Gap closure time is shown to increase linearly with increasing gap area; however, gaps of equal areas but different aspect ratios differ greatly in healing time. Previous methods that calculate overall healing time according to the absolute or percent change in gap area assume that the gap area changes at a constant rate and typically underestimate gap closure time. In this study, data from scratch assays suggest that the rate of change of area is proportional to the first power or square root power of area. Keywords cell migration; wound healing; intestinal epithelial cells; continuum mechanics mathematical model Corresponding Author and Reprints: Julia C. Arciero, Department of Mathematical Sciences, Indiana University-Purdue University Indianapolis, 402 N. Blackford St., LD 270D, Indianapolis, IN 46202-3267, Phone: 317-274-6998, Fax: 317-274-3460, ; Email: [email protected] There are no conflicts of interest. HHS Public Access Author manuscript Wound Repair Regen. Author manuscript; available in PMC 2016 June 07. Published in final edited form as: Wound Repair Regen. 2013 ; 21(2): 256–265. doi:10.1111/j.1524-475X.2012.00865.x. Author Manuscript Author Manuscript Author Manuscript Author Manuscript
Transcript of Julia C. Arciero, Ph.D. HHS Public Access Maria Branca ...
Using a continuum model to predict closure time of gaps in intestinal epithelial cell layers
Julia C. Arciero, Ph.D.1, Qi Mi, Ph.D.2,3, Maria Branca4, David Hackam, M.D, Ph.D.4,5, and David Swigon, Ph.D.6
1Department of Mathematical Sciences, Indiana University-Purdue University, Indianapolis
2Department of Sports Medicine and Nutrition, University of Pittsburgh
3Center for Inflammation and Regenerative Modeling, McGowan Institute for Regenerative Medicine, University of Pittsburgh
4Division of Pediatric Surgery, Children's Hospital of Pittsburgh
5Pediatric Surgery, University of Pittsburgh School of Medicine
6Department of Mathematics, University of Pittsburgh
Abstract
A two-dimensional continuum model of collective cell migration is used to predict the closure of
gaps in intestinal epithelial cell layers. The model assumes cell migration is governed by
lamellipodia formation, cell-cell adhesion, and cell-substrate adhesion. Model predictions of the
gap edge position and complete gap closure time are compared with experimental measures from
cell layer scratch assays (also called scratch wound assays). The goal of the study is to combine
experimental observations with mathematical descriptions of cell motion to identify effects of gap
shape and area on closure time and to propose a method that uses a simple measure (e.g., area) to
predict overall gap closure time early in the closure process. Gap closure time is shown to increase
linearly with increasing gap area; however, gaps of equal areas but different aspect ratios differ
greatly in healing time. Previous methods that calculate overall healing time according to the
absolute or percent change in gap area assume that the gap area changes at a constant rate and
typically underestimate gap closure time. In this study, data from scratch assays suggest that the
rate of change of area is proportional to the first power or square root power of area.
Keywords
cell migration; wound healing; intestinal epithelial cells; continuum mechanics mathematical model
Corresponding Author and Reprints: Julia C. Arciero, Department of Mathematical Sciences, Indiana University-Purdue University Indianapolis, 402 N. Blackford St., LD 270D, Indianapolis, IN 46202-3267, Phone: 317-274-6998, Fax: 317-274-3460, ; Email: [email protected]
There are no conflicts of interest.
HHS Public AccessAuthor manuscriptWound Repair Regen. Author manuscript; available in PMC 2016 June 07.
Published in final edited form as:Wound Repair Regen. 2013 ; 21(2): 256–265. doi:10.1111/j.1524-475X.2012.00865.x.
Author M
anuscriptA
uthor Manuscript
Author M
anuscriptA
uthor Manuscript

Introduction
Tissue injuries, which may result from trauma, surgery, or disease, are associated with
disrupted functionality of a tissue and an increased risk of infection. For example, injuries to
the skin compromise the body’s ability to protect itself against the environment [1] and
injuries to the intestinal epithelial layer could result in bacterial sepsis. Tissue repair requires
the migration of cells into the wounded region and the proliferation of new cells to restore
the original density of the tissue. A wound is considered healed once tissue functionality has
been fully restored [2].
The ability to predict wound healing time accurately could allow clinicians to quantify the
benefit of various treatment strategies and identify procedures that accelerate healing [3]. To
achieve this, simple and informative measurements to assess wounds during the healing
process are needed. Mathematical descriptions of wound healing may be useful in
determining quantifiable indicators of complete wound closure. As expected, the size and
location of a wound are factors that affect healing rates. Deep wounds heal more slowly than
superficial wounds since several cell layers and blood vessels are interrupted, requiring the
formation of a blood clot and the contraction of cells [4]. Superficial wounds, such as
wounds in the intestinal epithelial cell layer, disrupt only a single layer of cells and rely
primarily on cell migration in the initial stages of healing. A combination of clinical
observations with mathematical explanations of wound healing may help to elucidate
important factors and methods for predicting overall healing time for a variety of wound
types.
Observations of wound closure
To assess the progression of a wound, quantities such as absolute wound area remaining,
percentage of initial wound area remaining, wound volume remaining, wound perimeter
remaining, wound healing velocity, and mean adjusted healing rates have been measured [3, 5]. Some of these measurements can be difficult to obtain clinically, and there is currently no
universally accepted measure of wound healing [2]. While wound area is an obvious
measure of wound closure, predicting healing time based on the percent of wound area
healed tends to bias small wounds and based on the absolute wound area healed tends to bias
large wounds [6, 7].
Gilman [8] proposed an alternate measure, called the linear healing parameter, that
represents the average distance the wound margin has advanced over a given time period.
Gorin et al. [7] showed that healing rates calculated according to the linear healing
parameter had no correlation to initial wound area. The linear healing parameter tends to
remain relatively constant over time and thus may be a reliable forecaster of total healing
time [9].
In [6], three methods for calculating healing times based on wound area and the linear
healing parameter are described and compared. The healing times for a theoretical circular
wound of radius 50 mm were calculated using the three methods. It was observed that
calculating the absolute area or percent area will almost always underestimate the healing
time for a wound, whereas the linear healing rate of the wound was constant and provided
Arciero et al. Page 2
Wound Repair Regen. Author manuscript; available in PMC 2016 June 07.
Author M
anuscriptA
uthor Manuscript
Author M
anuscriptA
uthor Manuscript

the most accurate measure of healing time. It should be noted that these methods give
accurate predictions only if the rate of change of area or of the linear healing parameter is
nearly constant.
The principle of the “greatest inscribed circle” has also been used to explain wound closure
via epithelialization in the absence of wound contraction [10]. According to this theory, the
time for epithelialization of a wound is directly proportional to the radius of the largest circle
that can fit within the boundary of the original wound. It was observed that two rectangular
wounds with the same area but with different inscribed circle radii did not close in the same
amount of time; the rectangle with the larger inscribed circle radius closed more slowly
since the radius represents the greatest distance over which the epithelium must migrate
[10].
Wounds exhibit a wide variety of geometries, including concave, convex, and highly
irregular shapes. In [11], the change in shape of venous leg ulcers was evaluated over time,
and a regression analysis was used to conclude that wounds that shifted to a convex shape
over time were more likely to heal than those that did not change shape. In another study
involving venous leg ulcers, wound surface area decreased exponentially with time early in
the treatment phase [11]. However, it was noted that an exponential function is not accurate
over a long time period and thus may only be appropriate when describing the contraction
phase of wound closure.
Zahm et al. [12] examined in vitro wound repair of the respiratory surface epithelium.
Unlike the exponential healing time observed in venus leg ulcers, the wounded area of the
respiratory epithelium was observed to decrease linearly with time during the first half of
wound closure (~50 h). During the second half of closure, the repair process slowed, but the
number of proliferative cells in the repairing area increased dramatically until wound closure
was complete (~day 4). Video recordings of the wound culture showed lamellipodia
formation at the wound edge. This protrusion mechanism was observed to be accompanied
by cell-cell and cell-matrix interactions governing the migration of the remaining cell layer
[12].
The observations from these multiple wound scenarios demonstrate that healing time
predictions are affected by multiple factors such as wound geometry, tissue type, cell-cell
interactions, and the stage of the healing process (epithelialization, contraction, or
proliferation). In this paper, we analyze the influence of these factors on the closure time of
a gap in a cell layer using a recently developed two-dimensional continuum model [13] of
collective cell migration based on data from cell layer scratch assays (also known as scratch
wound assays, in other contexts). Using a mathematical model to assess these factors can
allow us to make predictions and derive analytical results that are not biased by experimental
uncertainty.
Mathematical modeling of wound healing
Many mathematical models have used reaction diffusion equations to describe wound
healing [14, 15]. For example, Sherratt and Murray [15] investigated planar epidermal
movement controlled by diffusion and a mitotic regulator that activates or inhibits migration.
Arciero et al. Page 3
Wound Repair Regen. Author manuscript; available in PMC 2016 June 07.
Author M
anuscriptA
uthor Manuscript
Author M
anuscriptA
uthor Manuscript
Model predictions of the decrease in the radius of a circular wound were consistent with
experimental data from wounds of a similar diameter for a range of species and wound
locations [14]. The model was also used to predict healing times for multiple wound
geometries, including cusped, diamond, and ovate-shaped wounds. Healing time was
predicted to decrease as the side-to-length ratio of rectangular wounds was increased,
regardless of activation or inhibition. In the presence of the regulation of mitosis via an
inhibitor mechanism, wounds with an initially cusped shape progressed into a rounded
wound during healing, whereas initially ovate wounds flattened and healed faster [14].
Sadovsky and Wan [16] also studied epidermal wound closure. They developed a continuum
mechanical model in which the circumferential contraction of the epidermis surrounding the
wound is governed by laws of mechanics and cell-cell signaling. They note that different
expressions for elastic strain or active stress may be necessary to explain the dynamics of the
wound closure process near complete closure, and they did not include proliferation or
differentiation in the current version of the model.
Javierre et al. [17] developed a two-dimensional model for wound closure of the epidermal
basal membrane; closure was mediated by cell mitosis and lamellipodia-induced cell
migration in the presence of a generic epidermal growth factor. Multiple wounds on planar
surfaces were considered, and wound morphology was identified as a key parameter
affecting healing kinetics. The model was used to predict that healing is initiated at regions
with high convexity and is delayed if the diffusion of the growth factor is slower than the
rate of cell migration. Lee and Wolgemuth [18] provided a biophysical description of
collective migration of epithelial cells based on the motility of single cells. They considered
four types of forces that act throughout an epithelial monolayer: intercellular stress,
polarization stresses generated inside of the cells by the action of the cytoskeleton, actin, and
molecular motors, thrust forces against the substrate, cell-cell adhesion forces, and drag
forces due to cell-substrate adhesions. Their seven-parameter model showed that the
mechanical process that drives single cell crawling is sufficient to drive motion of a layer if
cell-cell adhesion is taken into account.
Along the same lines, we have recently developed a two-dimensional continuum model to
describe the collective migration of an intestinal epithelial cell layer in response to a gap
[13]. Three mechanisms are assumed to govern gap closure: lamellipodia formation,
substrate adhesion, and cell-cell adhesion. The model includes the contribution of cell
migration to gap closure but neglects proliferation because the model was calibrated to
experimental data from scratch assays of intestinal epithelial cells over relatively short time
periods during which proliferation was balanced by apoptosis. The model parameters were
optimized according to the density of the cell layer and location of the gap edge in scratch
assays [13].
The model is used to track the closure of both hypothetical and experimentally-based
geometries of gaps in cell layers. Model parameters are varied to demonstrate the effect of
model assumptions and tissue type on the predicted healing time. The evolution of multiple
gaps is predicted, and different phases of gap edge velocity are identified. The effects of
initial gap geometry on gap closure characteristics are investigated, and gap closure time is
shown to differ for gaps of equal areas but different initial shapes. Closure time as a function
Arciero et al. Page 4
Wound Repair Regen. Author manuscript; available in PMC 2016 June 07.
Author M
anuscriptA
uthor Manuscript
Author M
anuscriptA
uthor Manuscript

of inscribed circle radii is also determined. The suitability of three common methods for
calculating healing time is explored by comparing model predictions with experimental time
measurements for intestinal epithelial cell scratch assays, and two new methods for
calculating healing time are proposed.
Materials and Methods
Experimental gap edge
In a scratch assay, rat intestinal enterocytes (IEC-6 cells) obtained by the Hackam Lab at the
University of Pittsburgh from ATTC are cultured on a glass coverslip, grown to 100%
confluence, serum-starved for 12 hours, and scraped with a pipette to induce an injured
region within the cell sheet. The cell sheet is one cell thick, and the motion and deformation
of the cells are captured at 5 minute intervals using differential interference contrast
imaging. Multiple points along the experimental gap edges are recorded by hand and used to
determine the area and perimeter of each experimental gap at multiple time points.
Computational gap edge
Migration of a two-dimensional cell layer with a gap is predicted using a previously-
developed continuum model [13]. The cell layer is defined by a density of cells, ρ(x,y,t), given as a function of the spatial coordinates x and y and time t. A relaxed (unstressed) cell
layer is given by ρ0. In the scratch assay, the initial cell layer is assumed to be pre-stressed
due to the forces generated by the lamellipodia of the cells throughout the entire layer. The
motion of the cell layer is assumed to be driven by the force of the lamellipodia (F) acting in
the direction normal to the gap edge, the stretching of the layer described by the elastic
modulus (k), and the friction between the cells and the substrate, which includes the effects
of the release of the trailing cell edge and is described by an adhesion constant b. For
simplicity, we neglect higher order effects such as adhesion of neighboring cells to each
other, which can be described as viscosity of the layer, and dipole moments arising from cell
polarizations. Such effects have been implemented in other models, such as [18]. Ratios of
these parameters are represented by two constants: ϕ = F/k and κ = k/b.
In [13], it was shown that the model reduces to the following free boundary problem:
(1)
Arciero et al. Page 5
Wound Repair Regen. Author manuscript; available in PMC 2016 June 07.
Author M
anuscriptA
uthor Manuscript
Author M
anuscriptA
uthor Manuscript
where g(ρ) defines the proliferation of cells in the layer, Ωt represents the time-dependent
tissue area, is the gap boundary, and ∂Ω2 is the boundary of the observed area (see
Figure 1). In the development of the model, the cell sheet is represented as a compressible
inviscid fluid. The form of Eq. 1 results from the choice of the constitutive equation for
material elasticity (see [19] for details) and does not arise from any underlying diffusion
process. The free boundary problem with g = 0 and the defined initial and boundary
conditions is known as the Stefan problem, which has been extensively studied in many
contexts [20, 21]. A numerical solution is found for a given gap geometry using a variation
of a level set method that was developed in [22] and applied to Stefan problems in [23, 24].
Optimal values of ϕ, κ, and ρ0 were found by minimizing the sum of the mean square
difference between the experimental and predicted cell density values and gap edge
positions. The values ϕ = 0.19, κ = 72.53 µm2/h, and ρ0 = 0.63 cells/µm2 were optimized
according to gap closure data from IEC-6 cells [13].
We analyze gaps of different geometries defined within a 100 µm by 100 µm region of cells
representing intact tissue. Predicted closure times and shapes of the gap contours would be
affected by the choice of Dirichlet or Neumann boundary conditions, as described in [13]. In
this study, the critical size for the computational domain was determined so that model
predictions were not affected by changes in domain size. Dirichlet boundary conditions are
chosen on the boundary of the tissue region since cells are assumed to extend far beyond the
gap edge. The time-dependent position of the gap edge is predicted using the model, and the
area and perimeter of the gap are calculated at multiple time points. The gap is considered
completely closed once the area of the gap falls below twice the area of a numerical grid
space (1 µm).
The computational representation of the gap edge consists of a discrete set of points. To
obtain the average instantaneous velocity along the computed gap edge, the normal velocity
at each point on the gap contour is calculated. Arc lengths between each consecutive pair of
points are calculated, and the velocity along each segment is estimated.
Healing time calculations
Three commonly used methods for estimating wound closure time are the Absolute Area
Reduction method, Percent Area Reduction method, and Linear Parameter method [6]. The
Area Reduction methods are based on the assumption that the time rate of change in wound
area, c, is constant. The Absolute Area Reduction method estimates the constant c in the
average sense as the ratio of the difference between the current wound area and original
wound area to the total change in time. The Percent Area Reduction method estimates c as
the instantaneous change by calculating the difference in wound areas between two
consecutive time points. The Linear Parameter method assumes that the average velocity of
the wound edge over the wound contour is constant in time [6]. The linear healing
Arciero et al. Page 6
Wound Repair Regen. Author manuscript; available in PMC 2016 June 07.
Author M
anuscriptA
uthor Manuscript
Author M
anuscriptA
uthor Manuscript

parameter, d, is defined as the ratio of the difference in wound areas to the average perimeter
for two consecutive time points:
(2)
where Ai is wound area and Pi is wound perimeter at time ti. The Linear Parameter method
was developed to remove the bias in the Area Reduction methods to wound size. Gilman [6]
used the Linear Parameter method to predict healing time for a circular wound in the
following way:
(3)
Since the rate of change of the radius is assumed to be constant,
(4)
Solving Eq. 4 for R(t) with initial condition (0, R0) gives
(5)
Closure time (tf) is calculated using this method by solving for t in Eq. 5 with R(tf) = Rmin:
(6)
For noncircular wound shapes, R0 is the radius of the inscribed circle of the initial wound
shape.
In addition to these three methods, we investigate two methods of calculating healing time in
which the time rate of change of area is not constant but is proportional to the square root of
area (Square Root Area method) or the first power of area (Proportional Area method).
The Square Root Area method is motivated by the observation that if wound area is assumed
to be proportional to the square of the inscribed radius and if the rate of change of the
inscribed radius is assumed constant (as in the Linear Parameter method), then the rate of
change of wound area will be proportional to the square root of area, which is consistent
with some experimental findings [25]. The Proportional Area method was hypothesized
according to area measurements obtained from the scratch assays examined in this study.
Arciero et al. Page 7
Wound Repair Regen. Author manuscript; available in PMC 2016 June 07.
Author M
anuscriptA
uthor Manuscript
Author M
anuscriptA
uthor Manuscript

The assumed relationship for each method is listed in row 1 of Table 1. The estimates of the
rates of change are given in row 2. In row 3, the solution to the differential equation from
row 1 is given in terms of ci and initial conditions. Finally, in row 4, healing time is found by
solving for the value of t in row 3 when A = Amin (or R = Rmin). Amin (or Rmin) represents
the minimal wound area (or radius) at which a wound is considered closed.
Results
Effect of model parameters on gap closure time
In Fig. 2, the optimized values of ϕ and κ (ϕ0 = 0.19 and κ0= 72.53 µm2/h) are varied to
illustrate the dependence of model predictions on parameter values. Recalling that ϕ = F/k and κ = k/b, it is evident that a change in F only affects the value of ϕ and a change in b only
affects the value of κ whereas a change in k alters both ϕand κ. The top row of Fig. 2 shows
that increasing the force of the lamellipodia (F), decreasing the frictional coefficient (b), or
decreasing the elastic modulus of the layer (k) can reduce gap closure time predictions.
In the second row of Fig. 2, parameter k is varied by factors of 5 (as in Fig. 2C). These k values correspond to ϕ=5ϕ0 and κ=κ0/5 (Fig. 2D, k = k0/5), ϕ=ϕ0 and κ=κ0 (Fig. 2E, k =
k0), and ϕ=ϕ0/5 and κ=5κ0 (Fig. 2F, k = 5k0). In panel D, the velocity of the edge is
observed to be independent of the curvature of the gap and slows with time. In panel F, the
gap edge velocity decreases with decreasing curvature (the velocity is effectively zero if the
curvature is negative, corresponding to an inside corner) and is uniform with time.
Differences in these parameters correspond to differences in tissue type, suggesting that
closure times can differ widely with location of a wound. For example, MDCK cells (used in
[18]) and IEC-6 enterocytes (used here) exhibit different cell-cell adhesion and migration
properties; IEC-6 cells do not show the complex wound edge evolution (oscillations) known
to occur in MDCK cells.
It follows from Eq. 1 that any change in can be accommodated by a change in the units of
time without affecting the solutions of the model. In other words if ρ(x,t) is a solution of the
boundary value problem in Eq. 1, then ρ̃(x,t) = ρ(x,tτ) is a solution of the BVP with kappa
replaced by κτ and vn replaced by vn,τ. Thus, solutions of the BVP with different κ values
but the same ϕ will give rise to the same sequence of shapes for the gap edge, only with
different times of progression through those shapes; the higher the κ, the faster the closure.
In the remaining results presented in this study, the optimized values of ϕ0 = 0.19 and κ0=
72.53 µm2/h [13] (shown in Fig. 2E) are used to describe the motion of the intestinal
epithelial cell layer.
Effect of gap geometry on gap closure time
Numerical computation of the evolution of the gap edge for various initial gap geometries
(Fig. 3) predicts that motion of the gap edge is always in the direction that closes the gap,
i.e., the edge never retracts to make the gap larger, even at the extreme corners. The model
predicts that convex gaps with more than one axis of symmetry, such as a square (Fig. 3A)
or circle (Fig. 3B), close symmetrically. Gap shapes with unequal dimensions, such as a
rectangle (Fig. 3C) or ellipse (Fig. 3D), tend to close faster in the direction perpendicular to
Arciero et al. Page 8
Wound Repair Regen. Author manuscript; available in PMC 2016 June 07.
Author M
anuscriptA
uthor Manuscript
Author M
anuscriptA
uthor Manuscript

the smallest dimension. Corners are generally smoothed out during the evolution except for
gaps with large initial aspect ratio where a sharp corner with high edge curvature forms as
the gap retreats from the area (Fig. 3E). The model predicts that the gap edge ultimately
converges toward a convex shape, even though convexity may be attained fairly late in the
closure process. In rare instances, the topology of the cell layer may change from an annulus
to a region with 2 or more holes (Fig. 3F), which has also been observed in experiments. The
six gaps in Fig. 3 have an initial area of 400 µm2. The plotted contours correspond to the
position of the gap edge at half hour intervals, and the gap area remaining after 2 hours has
been shaded. Similar images are provided in Figure 4, but with the initial geometry
corresponding to the positions of the gap edges in the epithelial cell layer scratch wound
assays. The contours represent positions of the gap edge every 30 minutes.
Model predictions of gap closure time as a function of initial gap area are shown in Fig. 5A
for multiple initial gap geometries with initial areas between 100 and 1200 µm2, including
squares, circles, and rectangles and ellipses with different aspect ratios. In addition,
experimentally measured closure times for the eight scratch assays shown in Fig. 4 are
included (Fig. 5A, open circles). As expected, closure time increases with initial gap area but
is not the same for all gap shapes of equal area. Gaps with an aspect ratio of one close in
approximately the same amount of time (e.g., circle and square gaps). However, as this
aspect ratio deviates from one, the time for gap closure predicted by the model decreases.
The ratios of the closure times of various gaps to the closure time of a circular gap are
shown in Fig. 5B to highlight how the difference in gap shape affects predicted closure time.
In addition, gap closure time as a function of inscribed circle radius is shown in Fig. 5C.
Gaps of equal area are connected by solid curves and labeled. As observed by Watts [10],
gaps with the same area but with different inscribed circle radii do not heal at the same rate.
Predicting closure time using area and perimeter measurements
In the limit of small ΔA, the ratio of the linear healing parameter to the time difference
converges to the mean normal velocity of gap closure when averaged over the gap edge. The
average instantaneous gap edge velocity predicted by the model for the experimental scratch
assay in Fig. 4A is denoted by the solid curve in Fig. 6A and is shown to be approximately
equal to the time rate of change of the linear healing parameter when calculated for the same
gap using Eq. 2 (Fig. 6A, open squares). This verifies that average instantaneous velocity
can be directly compared with the rate of change of linear healing parameters. The linear
healing rate calculated from the area and perimeter data for the experimental gap in Fig. 4A
is also shown (black dots) for Δt = 30 minutes. In Fig. 5B–D, the linear healing rate is
calculated for three additional experimental gaps from Fig. 4 (black dots) with Δt = 30
minutes and compared with the model predictions of average instantaneous velocity for
those gaps (solid curves).
The average instantaneous velocity of the gap edge, as predicted by the model, exhibits
different phases of behavior. Initially, the gap edge velocity is maximal; it then steadily
decreases to a lower value at which it remains relatively constant for the majority of the
closure process. In some cases, the velocity is predicted to increase slightly at the final stage
of gap closure. We hypothesize that this slight increase may be due to the increasing
Arciero et al. Page 9
Wound Repair Regen. Author manuscript; available in PMC 2016 June 07.
Author M
anuscriptA
uthor Manuscript
Author M
anuscriptA
uthor Manuscript
curvature of the gap edge at the final time steps. These phases have been observed in some
of the scratch assays, although the final increase is not always observed experimentally.
The Absolute Area, Percent Area, and Linear Parameter methods as well as the Square Root
and Proportional Area methods are used to predict the healing time of an experimental cell
layer scratch assay (Fig. 7, right column), which was found experimentally to be nearly 8.5
hours. In the left column of Fig. 7, the proportionality constants for all of the methods are
plotted as a function of time. These plots are used to investigate whether or not the assumed
proportionality constants indeed remain constant. In all panels, solid curves correspond to
model calculations and dots correspond to the measurements from the assay. The dashed
curve in Fig. 7F represents the closure time prediction according to the Square Root method,
which is based on the linear healing parameter but assumes gap area is always proportional
to the square of the radius. The results in Fig. 7 indicate that the Absolute and Percent Area
methods underestimate the closure time, verifying Gilman’s conclusions [6]. However,
unlike Gilman’s findings, the linear healing rate is not predicted to be constant for this
scratch assay, and thus the Linear Parameter method gives both an overestimate and
underestimate of the closure time during the different phases of closure instead of
converging to the actual closure time. The Square Root and Proportional Area methods are
shown to provide better overall predictions of total closure time.
Discussion
In this paper we use a previously developed two-dimensional continuum mechanical model
of gap closure [13] to study the dependence of gap closure times on initial gap shape, gap
area, and parameters reflecting tissue type and cell-cell interactions. In addition we employ
the model to evaluate the commonly used methods for predicting gap closure time and
propose two new alternative methods which show better accuracy of predictions.
The model we employ [13] describes all of the characteristic features of a migrating
intestinal epithelial cell layer in response to a gap: it predicts motion of the gap edge in the
direction of the gap (no retractions of the edge), faster motion of the edge in regions with
higher curvature, and a change in the topology of the gap from one to multiple holes under
certain conditions (Fig. 3F). The methods developed here can be applied to any wound
healing model; it would be illustrative to examine whether more complex models (such as
[18], which includes effects of cell polarization, dipole stress, and shear force) give similar
predictions as our model.
Effect of model parameters on gap closure time
The model indicates that the time for gap closure increases with decreasing lamellipod force,
increasing adhesion, or increasing elastic modulus of the cell layer. This is in accord with
observations that if lamellipod formation at the gap edge is inhibited, gap closure is slowed
or even stalled [26]. Throughout the paper we used a single pair of constants obtained by
fitting IEC-6 cell migration scratch assay results [13]. However, we have observed that
fitting model parameters to data is difficult due to the insensitivity of the gap shape to the
parameters. As seen in Fig. 2D–F, a ten-fold difference in parameter values gives rise to
solutions with similar gap shapes. In general, the prediction of the gap closure time is much
Arciero et al. Page 10
Wound Repair Regen. Author manuscript; available in PMC 2016 June 07.
Author M
anuscriptA
uthor Manuscript
Author M
anuscriptA
uthor Manuscript
more sensitive than the prediction of the gap shape. This significant error in the gap shape
results in an ill-posed optimization problem in the space of the two parameters, κ and ϕ.
The numerical solution of the gap closure contour in Fig. 3E was sensitive to the grid
spacing, and the closure progress slowed down severely as the program attempted to smooth
out any sharp corners that developed during the closure process. We are working to resolve
this issue by using a finite element method approach. For this study, we ran model
simulations on a refined mesh for the gap shapes shown in Fig. 3 (except panel E), and the
closure times and contours were not different. We also note that the Square Root and
Proportional Area Methods proposed in this study (see Table 1) were based on the closure of
cell layer scratch assays for which model predictions of gap closure did not depend on the
grid spacing. In addition, complete closure of gaps with aspect ratios that deviate from one
does not occur until the gap also closes in the longest dimension. This behavior differs from
behavior observed in vitro or in vivo in which wounds may be able to close along a seam
instead of being required to close to a single point. Therefore, the numerical implementation
of the model causes an overestimation of the closure time for gap with aspect ratios that are
different from one.
Effect of gap geometry on gap closure time
The ability to accurately quantify wound healing time is of crucial importance to both
clinicians and patients. Clinicians need to assess whether or not a particular treatment
strategy is optimal, and patients appreciate any indication of their expected recovery time.
An advantage of using a mathematical model to predict wound closure is the potential ability
to predict healing times without conducting a closely monitored study over several months
[3]. However, as illustrated in the present study (Fig. 5), it is important to be mindful that
model predictions of closure time are sensitive to wound shape, size, and type.
The results in Fig. 5A suggest that closure time increases linearly with increasing gap area,
although gaps of equal area do not necessarily close in the same amount of time (Fig. 5B).
Multiple initial gap geometries are explored in Fig. 5 to give a potential range of gap closure
time for gaps of a given initial area; as initial gap area increases, the range of possible
closure time varies more substantially (e.g., 4–9 hours for a gap with an initial area of 1200
µm2). Since it is impossible to predict all possible gap shapes, the time ranges provided here
are lower bounds on the actual closure time ranges for intestinal epithelial gap closure. As a
general rule, as the aspect ratio of the gap deviates from one, the time for gap closure
predicted by the model decreases (e.g., rectangles and ellipses). This prediction is consistent
with previous findings in an epidermal migration model [14]. Gap closure times for scratch
assays are included on the plot (open circles, Fig. 5A) to illustrate that the ranges of closure
times predicted by this model provide fairly good estimates of actual closure time of two-
dimensional gap within an epithelial cell layer. While a few of the points lie outside of the
predicted range, this is likely due to the position of the experimental gap (e.g., Neumann
boundary conditions may be more appropriate when tracking gaps located near the edge of
the cell layer) or due to uncertainty of the true initial gap area (e.g., the initial gap edges
were not always visible in the microscope image).
Arciero et al. Page 11
Wound Repair Regen. Author manuscript; available in PMC 2016 June 07.
Author M
anuscriptA
uthor Manuscript
Author M
anuscriptA
uthor Manuscript

The model accurately captures the edge velocity of actual experimental gaps in many cases
(Fig. 6B) but overestimates the time to gap closure in others (Fig. 6D). This may result from
overestimating the original gap dimension if the edges of the gap were not entirely within
the microscope viewing area. Also, some of the experimental gaps are observed to pinch off
into multiple pieces, while the model predicts the evolution of a single gap contour till
closure. By not predicting a pinch off, the model assigns a larger area to the gap, thereby
contributing to the overestimation of total gap closure time.
It is important to note that these predictions are based on a model calibrated to a particular
line of intestinal epithelial cells. Actual closure times for wounds in other tissue types may
differ significantly from the values given in this study. The model could be adapted to data
from different tissues (provided they can be approximated as two-dimensional) to provide
more appropriate healing time estimates in other tissue types. In addition, factors such as
cell proliferation, wound contraction, tissue growth factors, or blood supply are not modeled
here but could be added to the model to determine their impact on closure time in other
situations. For example, including a variable for growth factors can help to quantify which
mechanisms are most significantly impacted by growth factors. A viscous term is not
included in the current version of the model, but future work should include viscous effects,
as in [18], to take into account the viscous stress resulting from differences in velocity
between neighboring cells.
Predicting closure time using area and perimeter measurements
Given the observed variance of closure time with gap area, a method of predicting gap
closure times independent of wound geometry or initial area has important application in the
clinical setting. It is especially important to have a simple mathematical formula for
predicting wound closure time based on readily available measurements of wound
characteristics, such as wound area and wound perimeter. We found that the Absolute Area
method and Percent Area method underestimate closure times and fail to provide accurate
estimates until the very end of the closure process, which is in agreement with previously
established conclusions [6].
Gilman [6] claims that a Linear Parameter method provides a better estimate of the actual
healing time because the linear healing parameter is constant during the closure. However,
the scratch assays in this study did not exhibit this behavior. By definition, the ratio of the
linear healing parameter to time difference is equivalent to the average instantaneous normal
velocity of the gap edge (Fig. 6A). In the scratch assays, gap edge velocity was observed to
vary during the initial closure process but to be nearly constant after the first hour of closure.
Velocity is maximal at the beginning of closure, which Zahm et al. [12] hypothesized is due
to the availability of new space for the cells to occupy. For some gaps, the model predicts a
slight speed-up near the end of closure (Fig. 6C); this speed-up also occurs in some
experimental assays but is not seen consistently for all gaps. A comparison of the average
instantaneous velocity predictions for multiple gap shapes (including squares, circles,
rectangles, triangles, and ellipses) suggests that the speed-up occurs for gaps with multiple
axes of symmetry. We hypothesize that the presence or absence of this final speed-up stage
may be a function of initial gap geometry and the curvature of the evolving gap edge.
Arciero et al. Page 12
Wound Repair Regen. Author manuscript; available in PMC 2016 June 07.
Author M
anuscriptA
uthor Manuscript
Author M
anuscriptA
uthor Manuscript
We propose two additional methods for computing the closure time, the Square Root method
and Proportional Area method, which are based on the assumptions that the dependence of
the time-rate of change of the gap area is proportional to the square root of area or the first
power of area, respectively. These methods provide better estimates of gap closure time than
the three previously established methods since they both converge to the correct gap closure
time as more data is available and they provide accurate predictions at early stages of the
closure process. Thus, the model predictions support the use of a simple measure, such as
gap area, to provide a relatively accurate prediction of healing time after only the first few
steps of gap closure. The Square Root method slightly underestimates the closure time
initially, while the Proportional Area method slightly overestimates this time. It is possible
that a method with time-rate of change of the gap area proportional to some power p of the
area, where ½ < p < 1, would fit the data better, but we found that the estimation of this
parameter is very difficult. As a compromise one could simply average the predictions of
both methods to obtain a more accurate estimate. These two methods are useful for
predicting a range of closure times for superficial wounds; however, other clinical aspects
may be required to obtain accurate closure time predictions for wounds of various types and
sizes. In summary, using mathematical modeling to predict how factors such as wound
geometry and tissue type can affect closure time has an important application in studying
wound healing and other disorders that are affected by the presence of injured tissue.
Acknowledgments
Arciero and Swigon acknowledge support from NSF EMSW21-RTG 0739261. Mi acknowledges support from NIH P50-GM-53789-08, NIH U01 DK072146-06, and National Institute on Disability and Rehabilitation H133E070024.
References
1. Cukjati D, Rebersek S, Miklavcic D. A reliable method of determining wound healing rate. Med Biol Eng Comput. 2001; 39(2):263–271. [PubMed: 11361254]
2. Franz MG, Kuhn MA, Wright TE, Wachtel TL, Robson MC. Use of the wound healing trajectory as an outcome determinant for acute wound healing. Wound Repair Regen. 2000; 8(6):511–516. [PubMed: 11208178]
3. Robson MC, Hill DP, Woodske ME, Steed DL. Wound healing trajectories as predictors of effectiveness of therapeutic agents. Arch Surg. 2000; 135(7):773–777. [PubMed: 10896369]
4. Diegelmann RF, Evans MC. Wound healing: an overview of acute, fibrotic and delayed healing. Front Biosci. 2004; 9:283–289. [PubMed: 14766366]
5. Matousek S, Deva AK, Mani R. Outcome measurements in wound healing are not inclusive: a way forward. Int J Low Extrem Wounds. 2007; 6(4):284–290. [PubMed: 18048874]
6. Gilman T. Wound outcomes: the utility of surface measures. Int J Low Extrem Wounds. 2004; 3(3):125–132. [PubMed: 15866803]
7. Gorin DR, Cordts PR, LaMorte WW, Manzoian JO. The influence of wound geometry on the measurement of wound healing rates in clinical trials. J Vasc Surg. 1996; 23(3):524–528. [PubMed: 8601898]
8. Gilman T. Parameter for measurement of wound closure. Wounds. 1990; 3:95–101.
9. Cardinal M, Eisenbud DE, Phillips T, Harding K. Early healing rates and wound area measurements are reliable predictors of later complete wound closure. Wound Repair Regen. 2008; 16(1):19–22. [PubMed: 18211575]
10. Watts GT. Wound shape and tissue tension in healing. Br J Surg. 1960; 47:555–561. [PubMed: 13843173]
Arciero et al. Page 13
Wound Repair Regen. Author manuscript; available in PMC 2016 June 07.
Author M
anuscriptA
uthor Manuscript
Author M
anuscriptA
uthor Manuscript

11. Cardinal M, Phillips T, Eisenbud DE, Harding K, Mansbridge J, Armstrong DG. Nonlinear modeling of venous leg ulcer healing rates. BMC Dermatol. 2009; 9:2. [PubMed: 19335882]
12. Zahm JM, Kaplan H, Herard AL, Doriot F, Pierrot D, Somelette P, Puchelle E. Cell migration and proliferation during the in vitro wound repair of the respiratory epithelium. Cell Motil Cytoskeleton. 1997; 37(1):33–43. [PubMed: 9142437]
13. Arciero JC, Mi Q, Branca MF, Hackam DJ, Swigon D. Continuum model of collective cell migration in wound healing and colony expansion. Biophys J. 2011; 100(3):535–543. [PubMed: 21281567]
14. Sherratt JA, Murray JD. Epidermal wound healing: the clinical implications of a simple mathematical model. Cell Transplant. 1992; 1(5):365–371. [PubMed: 1344309]
15. Tranquillo RT, Murray JD. Mechanistic model of wound contraction. J Surg Res. 1993; 55(2):233–247. [PubMed: 8412105]
16. Sadovsky A, Wan FYM. The elastodynamics of embryonic epidermal wound closure. Stud Appl Math. 2007; 118(4):365–395.
17. Javierre E, Vermolen FJ, Vuik C, van der Zwaag S. A mathematical analysis of physiological and morphological aspects of wound closure. J Math Biol. 2009; 59(5):605–630. [PubMed: 19099307]
18. Lee P, Wolgemuth CW. Crawling cells can close wounds without purse strings or signaling. PLoS Comput Biol. 2011; 7(3):e1002007. [PubMed: 21423710]
19. Arciero JC, Mi Q, Branca MF, Hackam DJ, Swigon D. Continuum Model of Collective Cell Migration in Wound Healing and Colony Expansion. Biophys J. 2011; 100(3):535–543. [PubMed: 21281567]
20. Hanzawa E. Classical solutions of the Stefan problem. Tohoku Math J. 1981; 33:297–335.
21. Mullins WW, Sekerka RF. Stability of a planar interface during solidification of a dilute binary alloy. J Appl Phys. 2009; 35:444–451.
22. Osher S, Sethian J. Fronts propagating with curvature-dependent speed: algorithms based on Hamilton-Jacobi formulations. J Comput Phys. 1988; 79:12–49.
23. Chen S, Merriman B, Osher S, Smereka P. A simple level set method for solving Stefan problems. J Comput Phys. 1997; 135:8–29.
24. Javierre E, Vuik C, Vermolen FJ, Segal A. A level set method for three dimensional vector Stefan problems: Dissolution of stoichiometric particles in multi-component alloys. J Comput Phys. 2007; 224:222–240.
25. Snowden JM. Wound closure: an analysis of the relative contributions of contraction and epithelialization. J Surg Res. 1984; 37(6):453–463. [PubMed: 6513541]
26. Fenteany G, Janmey PA, Stossel TP. Signaling pathways and cell mechanics involved in wound closure by epithelial cell sheets. Curr Biol. 2000; 10(14):831–838. [PubMed: 10899000]
Arciero et al. Page 14
Wound Repair Regen. Author manuscript; available in PMC 2016 June 07.
Author M
anuscriptA
uthor Manuscript
Author M
anuscriptA
uthor Manuscript
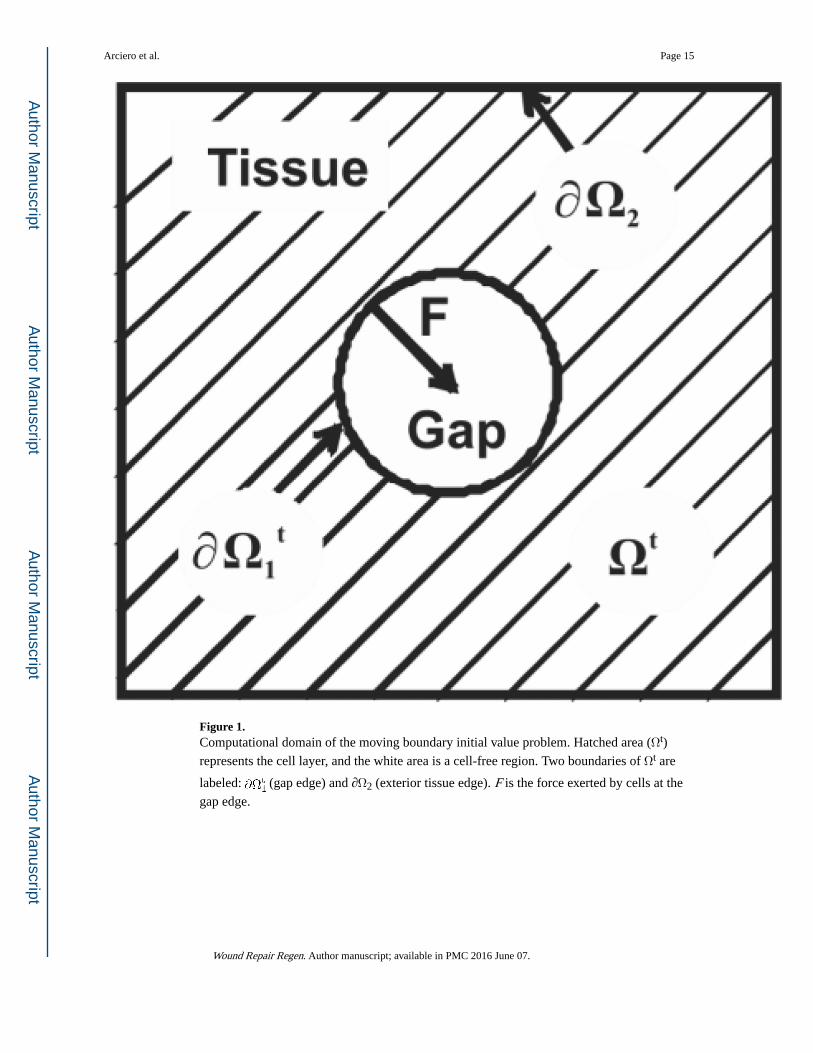
Figure 1. Computational domain of the moving boundary initial value problem. Hatched area (Ωt)
represents the cell layer, and the white area is a cell-free region. Two boundaries of Ωt are
labeled: (gap edge) and ∂Ω2 (exterior tissue edge). F is the force exerted by cells at the
gap edge.
Arciero et al. Page 15
Wound Repair Regen. Author manuscript; available in PMC 2016 June 07.
Author M
anuscriptA
uthor Manuscript
Author M
anuscriptA
uthor Manuscript

Figure 2. Model predicted healing times and evolution of L-shaped gap edge while varying parameter
values. Optimized parameter values for ϕ=F/k and κ=k/b are ϕ0 = 0.19 and κ0= 72.53
µm2/h. A. Effect of increasing parameter F = F0/5, F0, 5F0 on gap closure time. B. Effect of
increasing parameter b = b0/5, b0, 5b0 on gap closure time. C. Effect of increasing parameter
k = k0/5, k0, 5k0 on gap closure time. In the bottom row, the evolution of the gap edge is
shown for the three values of k in (C) at half hour increments. D. ϕ=5ϕ0 and κ=κ0/5. E.
ϕ=ϕ0 and κ=κ0. F. ϕ=ϕ0/5 and κ =5κ0.
Arciero et al. Page 16
Wound Repair Regen. Author manuscript; available in PMC 2016 June 07.
Author M
anuscriptA
uthor Manuscript
Author M
anuscriptA
uthor Manuscript

Figure 3. Evolution of the gap edge of 6 different initial gap shapes. Each gap has an initial area of
400 µm2 and is defined within a 100 µm × 100 µm tissue region. Gap contours are shown at
30 minute intervals, and the gap area remaining after 2 hours has been shaded. A. Square. B.
Circle. C. Rectangle. D. Ellipse. E. Cross. F. Cassini oval
Arciero et al. Page 17
Wound Repair Regen. Author manuscript; available in PMC 2016 June 07.
Author M
anuscriptA
uthor Manuscript
Author M
anuscriptA
uthor Manuscript

Figure 4. Evolution of the gap edge of 8 different scratch assays. Each gap is defined within a 100 µm
× 100 µm tissue region. Gap contours are shown at 30 minute intervals until closure.
Arciero et al. Page 18
Wound Repair Regen. Author manuscript; available in PMC 2016 June 07.
Author M
anuscriptA
uthor Manuscript
Author M
anuscriptA
uthor Manuscript

Figure 5. A. Gap closure time as a function of initial gap area for multiple gap shapes: 4×1 rectangle
(upward triangle), 2×1 rectangle (downward triangle), square (closed square), circle (closed
circle), 4×1 ellipse (hexagon), and 2×1 ellipse (diamond). Closure times are calculated for
all of these shapes with initial areas of 100, 200, 300, 400, 500, 600, 700, 800, and 1200
µm2. Actual closure times for 8 different experimental scratch assays are also included in the
figure (open circles). B. Ratio of closure time of each shape in panel A to the closure time of
a circle of the same initial area. Symbols as in panel A. C. Gap closure time as a function of
Arciero et al. Page 19
Wound Repair Regen. Author manuscript; available in PMC 2016 June 07.
Author M
anuscriptA
uthor Manuscript
Author M
anuscriptA
uthor Manuscript

inscribed circle radii. Gaps of equal area are connected by solid curves and labeled (values
in µm2). Symbols as in panel A.
Arciero et al. Page 20
Wound Repair Regen. Author manuscript; available in PMC 2016 June 07.
Author M
anuscriptA
uthor Manuscript
Author M
anuscriptA
uthor Manuscript

Figure 6. A. Model computed average instantaneous gap edge velocity for the experimental wound
shown in Fig. 4A (curve) is directly comparable to the time rate of change of the linear
healing parameter computed from the areas and perimeters of the gap contours (open
squares). The experimental values of time rate of change of the linear healing parameter are
also shown at half hour intervals (dots). B–D. The time rates of change of the linear healing
parameter is shown for three experimental scratch assays (dots) with Δt = 30 minutes and are
compared with model predictions of average instantaneous velocity for those gaps (curves).
Panel B shows good agreement between model predictions and experimental results. Panel C
shows the occasional speed-up that is predicted by the model at the end of closure. Panel D
shows that the model predictions overestimate gap closure times in some cases.
Arciero et al. Page 21
Wound Repair Regen. Author manuscript; available in PMC 2016 June 07.
Author M
anuscriptA
uthor Manuscript
Author M
anuscriptA
uthor Manuscript

Figure 7. Comparison of predicted healing times for an experimental scratch assay using five different
methods (see text). In column 1 (panels A, C, E, G), the constant ci for each method (see
Table 1) is plotted as a function of time. In column 2 (panels B, D, F, H), the predicted
healing time for each method is shown as a function of time. A, B: Absolute Area Reduction
method. C, D: Percent Area Reduction method. E, F: Linear Parameter method (solid line,
black dots) and Square Root method (dashed line, open dots). G, H: Proportional Area
Arciero et al. Page 22
Wound Repair Regen. Author manuscript; available in PMC 2016 June 07.
Author M
anuscriptA
uthor Manuscript
Author M
anuscriptA
uthor Manuscript

method. In all panels, solid lines correspond to model calculations and dots correspond to
experimental measures.
Arciero et al. Page 23
Wound Repair Regen. Author manuscript; available in PMC 2016 June 07.
Author M
anuscriptA
uthor Manuscript
Author M
anuscriptA
uthor Manuscript

Author M
anuscriptA
uthor Manuscript
Author M
anuscriptA
uthor Manuscript
Arciero et al. Page 24
Tab
le 1
A c
ompa
riso
n of
fiv
e m
etho
ds f
or p
redi
ctin
g ga
p cl
osur
e tim
e
Met
hod
1. A
bsol
ute
Are
a2.
Per
cent
Are
a3.
Lin
ear
Par
amet
er4.
Squ
are
Roo
t5.
Pro
port
iona
lA
rea
Rel
atio
n
Con
stan
t, c
Are
a, A
or R
adiu
s, R
A0
+ c 1
tA
i−1
+ c 2
(t−t
i−1)
R0
+ c 3
tA
i−1e
c 5(t
−ti−
l)
Clo
sure
tim
e,t f
Wound Repair Regen. Author manuscript; available in PMC 2016 June 07.