Juan Camilo Arias Robledo - WUR
62
Master Thesis Business, Management & Organization August 2019 An exploratory assessment of the existing frameworks and instruments used to evaluate organizations in terms of learning and innovation 2019 From team to organizational ambidexterity MSc Thesis Business, Management & Organization Juan Camilo Arias Robledo
Transcript of Juan Camilo Arias Robledo - WUR

Master Thesis Business, Management & Organization August 2019
An exploratory assessment of the existing frameworks and instruments used
to evaluate organizations in terms of learning and innovation
2019
From team to
organizational
ambidexterity
MSc Thesis
Business,
Management &
Organization
Juan Camilo Arias Robledo

Master Thesis Business, Management & Organization August 2019
From team to organizational ambidexterity: An exploratory assessment of the existing frameworks and
instruments used to evaluate organizations in terms of learning
and innovation
Juan Camilo Arias Robledo
August, 2019

Master Thesis Business, Management & Organization August 2019
Wageningen University
BMO – Business Management & Organization Group
From team to organizational ambidexterity:
An exploratory assessment of the existing frameworks and instruments
used to evaluate organizations in terms of learning and innovation
Author : Juan Camilo Arias Robledo
Registration nr. : 890810018020
Code : MST-80430
Supervisor : Renate Wesselink
Co-supervisor : Emiel Wubben
Supervisor Organization : Juan Pedro Fernández Sanin
Study : MSc Animal Sciences
Wageningen, August 2019

Master Thesis Business, Management & Organization August 2019
Copyright
Niets uit dit verslag mag worden verveelvoudigd en/of openbaar gemaakt door middel van druk,
fotokopie, microfilm of welke andere wijze ook, zonder voorafgaande schriftelijke toestemming van de
hoogleraar van de leerstoelgroep Business Management & Organisation van Wageningen Universiteit.
No part of this publication may be reproduced or published in any form or by any means, electronic,
mechanical, photocopying, recording or otherwise, without prior written permission of the head of the
Business Management & Organization Group of Wageningen University, The Netherlands.

Master Thesis Business, Management & Organization August 2019
asf
Master Thesis Business, Management & Organization August 2019
Abstract
The aim of this quantitative qualitative study is to identify the relationship between the
variables, responsible for organizational ambidexterity (AD). In the study the main focus is
on opportunity identification (OI) and organizational learning (OL). When researching the
relation between AD, OI and OL, the author believes organizations might be better able to
measure, prioritize and improve organizational AD. For the design, first a theoretical model
was created based on existing literature explaining AD, OL and OI. Secondly, an
encompassing survey was developed using 11 sets of standardized questions. 180
collaborators of an existing company completed the survey. That data was collected and
statistically analyzed using SPSS and AMOS.
In conclusion the author found that there is good correlation between the used
parameters of OI and OL. Hence, we can confirm that the methodology used was correct.
One conclusion drawn was that within companies, teams with empowered leadership, have
better OI and OL. However the tool is not valid to determine what the relationship is
between the OL, OI and AD.
For future research, it is recommended to reduce the amount of questions within a
survey, as the respondents lose focus after a certain amount of time. Moreover, more
research is needed to aim to define organizational AD directly, and not via other constructs
such as OL and OI.

Master Thesis Business, Management & Organization August 2019
Table of contents
Abstract VI
List of abbreviations III
List of tables IV
List of figures IV
1. Introduction 1
2. Theoretical framework 5
2.1. Ambidexterity 5
Exploration 6
Exploitation 7
2.2. Opportunity identification 8
2.3. Organizational learning 11
2.4. Levels of analysis 13
2.5. Other model variables 14
Team level predictors of innovation 15
Leadership 16
Environment 17
2.6. Connections between variables 18
2.7. Research questions 21
3. Methodology and research design 23
3.1. The object of research 23
Team Alpha 24
3.2. The survey 25
Demographics, leadership & team 30
Team level predictors of innovation 30
3.3. Leadership 33
3.4. Organizational learning 33
3.5. Opportunity identification 34
4. Results and analysis 35
Master Thesis Business, Management & Organization August 2019
4.1. Results and discussion 38
Cronbach's Alpha 38
4.2. Descriptive statistics and correlations 40
Organizational learning 40
Opportunity identification 41
Environment 42
5. Conclusion 45
6. Discussion 47
7. References 49

Master Thesis Business, Management & Organization August 2019
List of abbreviations
Abbreviation Explanation
4I Intuiting, interpreting, institutionalizing and integrating
AD Ambidexterity
BIE Business idea evaluation
BIG Business idea generation
OI Opportunity identification
OIC Opportunity identification competence
OL Organizational learning
SMAC Social, Mobile, Analytics, and Cloud
TLPOI Team-level predictors of innovation

Master Thesis Business, Management & Organization August 2019
List of tables
Table 2.1. The 4I model....................................................................................................... 12
Table 3.2. Model variables, subsections and constructs. ..................................................... 27
Table 4.1. Teams demographics and survey results, based on individual survey answers. 37
Table 4.2. Reliability analysis and Cronbach’s alpha coefficient. ...................................... 39
Table 4.3. Pearson correlations for sub-sections, constructs and frameworks. ................... 43
Table 4.4. Continuation Pearson correlations for sub-sections, constructs and frameworks.
.................................................................................................................................................. 44
List of figures
Figure 1.1. Theoretical framework. ....................................................................................... 3
Figure 2.1. Creativity-based model of entrepreneurial opportunity recognition. ................. 9
Figure 2.2. Flow between Team Level and Organizational Level ...................................... 14
Figure 2.3. Team-Level predictors of Innovation variables. ............................................... 15
Figure 2.4. Theorical framework. ....................................................................................... 22
Figure 2.5. Questionary flow and item distribution. ........................................................... 27

Master Thesis Business, Management & Organization August 2019
1. Introduction
As technology is speeding up its development, and the world becomes hyperconnected, the
capacity of an organization to learn becomes increasingly relevant. Those organizations that
perform well in predicting changes, and that innovate and implement regularly, may have better
chances to survive during chaos (Baggen, 2017)
Prior studies within this domain have concluded in order to be successful, organizations have
to understand themselves, their parts and interconnections, while developing strategies and
capabilities simultaneously (Duncan, 1976). Those organizations that want to remain relevant,
competitive and profitable, must learn to identify, evaluate and develop new skills and
capabilities consistently. This becomes challenging in current turbulent environment
“characterized by technological change and national and global competition” (Baggen, 2017,
p. 11).
To remain relevant, organizations must apply to the rules of competition, that fluctuate
through time. The old paradigm rules of competition that dictated success are being replaced
by new rules. Nowadays the focus is on continuous improvement and innovation. As Hodgetts
et al. (1994) also explain, this requires both exploration of new opportunities and the fast
exploitation of this opportunities. This trend is commonly known as ambidexterity, from now
on referred to as AD. Unlike management fads or purely quantitative techniques, ambidexterity
is not an addition nor supplement of the traditional management. Rather, it is an organizational
strategy that drives an ongoing, continuous process, one that requires radical changes in
organization design and day-to-day operations (Andriopoulos & Lewis, 2009; Ayd, 2017;
Saadat & Saadat, 2016).

Master Thesis Business, Management & Organization August 2019
While there are no universal criteria for identifying a total quality enterprise, 10 core values
are generally recognized (Hodgetts, Luthans, & Lee, 1994): customer-driven, leadership, full
participation, reward system, reduced cycle time, prevention not detection, management by
fact, long-range outlook, partnership development and public responsibility. These are
characteristics that successful organizations have in common; however, it is typical for
successful organizations, to divide the activities in teams, according to the company’s purpose
and milestones. Hence it is fair to say that the teams are causing, in a greater part, the
organizational success (Baggen, 2017; Bell, Brown, & Weiss, 2018; Hülsheger, Anderson, &
Salgado, 2009) and innovation (Edmondson & Harvey, 2018). However, teams are
heterogeneous and dynamic and are influenced by external and internal variables such as
participation safety, leadership, environment, motivation, etc. Moreover, various authors have
described interactions between the individual, team and organization levels (REFs). These
interactions allow for teams to transform knowledge into products and services (integration).
Also they assist organizations in re-evaluating processes or aspects already incorporated
(reflection).
Successful organizations need to learn, evaluate, incorporate and institutionalize new
knowledge. So, it is of upmost importance to identify, understand, measure and improve the
factors that influence these organizational capabilities such as, AD. Looking at the centrality of
the concept in this research, a more detailed notion is preferred. AD is the combination and
simultaneous execution of exploitation and exploration, explained as the simultaneous capacity
of detecting opportunities, together with an efficient process of integrating and,
institutionalizing said knowledge.
Many empirical and conceptual studies lack a clear procedure to evaluate organizational AD,
and it is not always evident which of the variables should be taken in to account. Hence, as the
Master Thesis Business, Management & Organization August 2019
evaluation is difficult, it is even more hard to improve weak points regarding AD. Thus, there
is still a lot that can to be learned from AD, both conceptually and empirically. Hence, this
research aims to identify the intricate relationships of the variables responsible for
organizational AD, which include opportunity identification (OI), and organizational learning
(OL). To shortly elaborate on the two concepts mentioned, OI can be defined as the ability of
individuals to think of new ideas for products, processes, practices or services that can lead to
new value-creation for the organization (Baggen, 2017). Furthermore, OL, can be divided in
the two most common categories; behavioral learning and cognitive learning (Lumpkin &
Lichtenstein, 2005). In the next chapter OL and OI will be explained in detail.
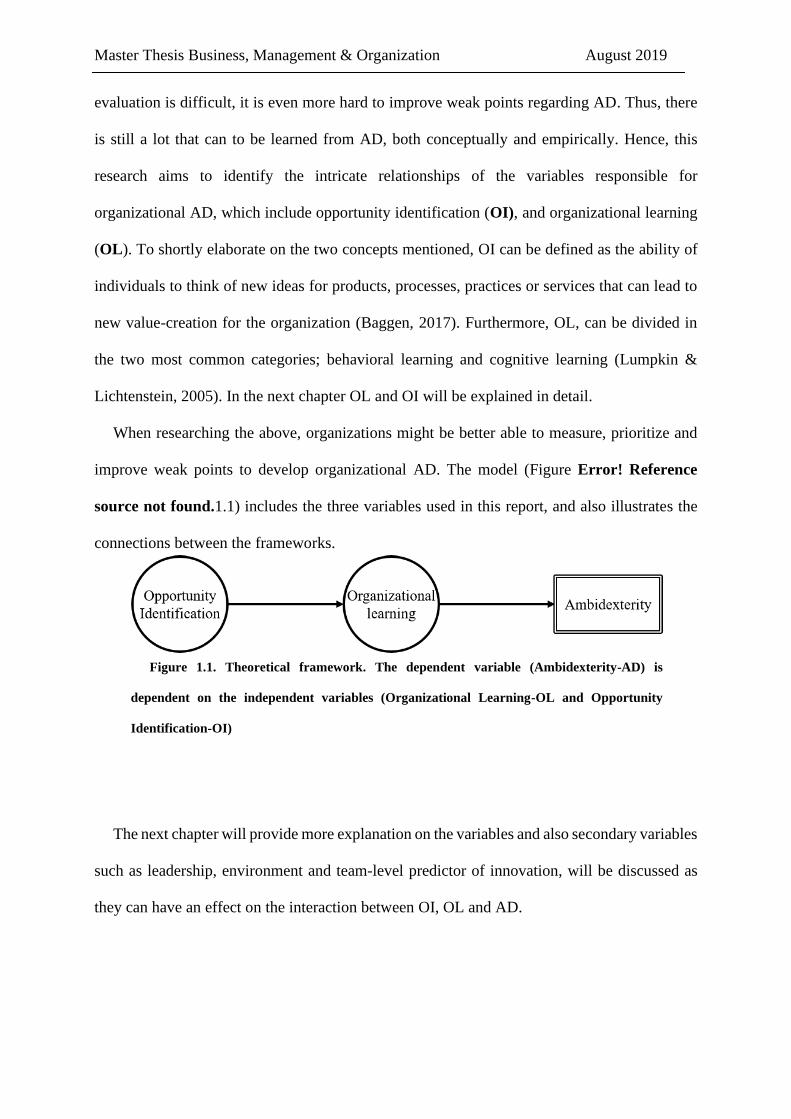
When researching the above, organizations might be better able to measure, prioritize and
improve weak points to develop organizational AD. The model (Figure Error! Reference
source not found.1.1) includes the three variables used in this report, and also illustrates the
connections between the frameworks.
The next chapter will provide more explanation on the variables and also secondary variables
such as leadership, environment and team-level predictor of innovation, will be discussed as
they can have an effect on the interaction between OI, OL and AD.
Figure 1.1. Theoretical framework. The dependent variable (Ambidexterity-AD) is
dependent on the independent variables (Organizational Learning-OL and Opportunity
Identification-OI)

Master Thesis Business, Management & Organization August 2019

Master Thesis Business, Management & Organization August 2019
2. Theoretical framework
In this chapter, the different concepts and notions will be explained based on current
literature and previous studies. This part explains the theoretical foundation of the research, and
puts it within the current scientific domain. Also it explains important concepts that need more
context and definition. First ambidexterity will be explained more into detail. Next, we will talk
about two other main concepts, namely OI and OL will be further explained. Later on, we will
discuss the levels of analysis that this research will use, and after we will talk about secondary
model variables and the connections between those. In the last section, we will provide the
research questions. We discuss these in the theoretical framework, as it is important to
understand all concepts before diving into the research questions.
2.1. Ambidexterity
This first section will focus on further explaining AD, as it is the main concept within the
research. Hence, it is important to talk about the definition. AD is described as the combination
and simultaneous execution of exploitation and exploration. AD creates tension for the teams
and the organization, due to the competitive and constant demand for organizational resources,
support and organizational structures (Andriopoulos & Lewis, 2009). Managers, generally
engage more in exploitation than exploration activities (Keller & Weibler, 2015). Keller &
Weibler also concluded that “managers that are considered ambidextrous, balance exploration
and exploitation in close correspondence to experienced leadership attempts of their superiors,
which account for the influence power of transformational leadership on AD at the team level”
(Keller & Weibler, 2015, p. 3). To move from learning, towards using that what has been
learned, an integration must take place and “managers below senior management level are
Master Thesis Business, Management & Organization August 2019
required to link exploration and exploitation to facilitate the integration and coordination of
exploration and exploitation” (Keller & Weibler, 2015, p. 3).
As discussed before, the concept of OL is directly linked with the capability of AD and is
related to high organizational performance. (Kitapçi & Çelik, 2013; Ojha, Acharya, & Cooper,
2018). AD can be analyzed by many factors, such as internal characteristics of the organization
(Jansen, Tempelaar, van den Bosch, & Volberda, 2009), leadership (Keller & Weibler, 2015),
and top management team skills (Cao, Simsek, & Zhang, 2010). It must be considered that these
processes and factors depend on the specific environment of each organization, team and
individual.
Exploration
Individuals seek knowledge by making connections between stimuli or by generating new
insights. In such situations, there is a focus on exploring new ideas that may lead to innovation
and change. Studies have been suggesting that individuals rarely come up with intuitive ideas
and insights without external support. As indicated by several studies, leaders play an important
role in directly influencing creative individuals (e.g., Amabile, Conti, Coon, Lazenby, & Heron,
1996; Redmond, Mumford, & Teach, 1993 in Berson et al., 2006). For example, a
comprehensive study of creative performance found that leaders who were successful in
encouraging followers to use their intuition as a driver for OL were found to be supportive and
non-controlling. Leaders may play an important role in helping individuals realize what they
have learned. Furthermore, leaders manage the meaning and frame the experience for their
collaborators as a viable basis for action. In other words, leaders help individuals set the
learning in a domain or context where it is meaningful. After the knowledge is acquired, the
stage of integrating involves sharing the learning and achieving convergence through
Master Thesis Business, Management & Organization August 2019
conversation among members that lead to shared understandings (Crossan, Lane, & White,
1999). This leads to the following propositions made by Berson et al. (2006, P.568, 588):
• Proposition 1. Leaders facilitate exploration among followers by providing the
contextual support to develop their ideas.
• Proposition 2a. Leaders provide the common basis and shared understanding
needed to integrate learning at both the group and organization level.
• Proposition 2b. Leaders at different organizational levels guide the integration
of new and existing learning.
Exploitation
As stated before, AD is the simultaneous application of both exploration and exploitation
(focused here on OL), and manifests itself in routines, structures, and practices of the
organization (Berson, Nemanich, Waldman, Galvin, & Keller, 2006; Crossan et al., 1999).
Depending on the nature of communications within organizations, leaders at lower levels may
have some influence over institutionalized learning. In terms of the organizational level,
exploitation depends more upon explicit knowledge, while exploration depends more upon tacit
knowledge.
• Proposition 3. Leaders at different organizational levels guide the
institutionalization of new and existing learning. (Berson et al., 2006, p. 590)
So, leadership and the environment in which teams learn, might play an important role in
the development of OI capabilities, and thus might influence OL and organizational AD. This
is why we included the variables as secondary variables in the model, to understand in which
extent, this variables might act as success and fail factors for organizational AD.
Master Thesis Business, Management & Organization August 2019
In this section we further explained AD, in order to get a better understanding of the concept.
AD can be described as the combination and simultaneous execution of exploitation and
exploration. Moreover, the role of leaders and AD is further discussed. Leaders play an
important role in stimulating creativity amongst individuals. Moreover, research has shown that
leaders help individuals to put the whole process of learning in a domain or context where it is
meaningful.
2.2. Opportunity identification
In this section OI will be explained in-depth. OI can be defined as the ability of individuals
to think of new ideas for products, processes, practices or services that can lead to new value-
creation for the organization (Baggen, 2017). Moreover, OI has an important relation with the
level of entrepreneurship within an organization; you must first have entrepreneurial
opportunities to create entrepreneurship (Venkataraman, 2000, p. 220).
A quote from the OL literature (Garvin, 1993) suggests the close link between OI and OL:
“New ideas are essential if learning is to take place. Sometimes they are created de novo
through flashes of insight or creativity; at other times, they arrive from outside the organization,
or are communicated by knowledge insiders. Whatever their source, they are a trigger for
organizational improvement” (Garvin, 1993, p. 81).
In order to model OI we will use the model “stage of creativity” which provides the necessary
elements. The stages of the model include: 1- Preparation, 2- Incubation, 3- Insight, which
together form the discovery phase; 4- Evaluation and 5- Elaboration, which together create the
formation phase. (Figure 2.1) (Lumpkin & Lichtenstein, 2005).
The discovery phase (number 2 and 3), can be understand as the generation of opportunity
ideas: initial ideas or envisioned futures in the mind of an individual (Lumpkin &

Master Thesis Business, Management & Organization August 2019
Lichtenstein, 2005). It can be measured with the Business Idea Generation instrument (BIG)
(Baggen, 2017, p. 48). The nature of these ideas is closely related to the prior knowledge and
experience of an individual (Venkataraman, 2000). Furthermore, idea generation is recognized
as being a domain-specific form of creativity (Hülsheger et al., 2009; Offermann & Coats,
2018).
Creative individuals are able to link relevant information and are sensitive to valuable,
unique information. Creativity can help in coming up with a new opportunity, but creativity
might be hindered by basic knowledge structures that constrain creative imagination
(Offermann & Coats, 2018). The second phase of the creativity-based model of entrepreneurial
opportunity recognition, the formation phase (number 4 and 5), can be understand as the
business idea evaluation, and is the capacity to recognize valuable ideas on the market. Based
on experience, individuals develop frameworks which help them to interpret new and seemingly
Figure 2.1. Creativity-based model of entrepreneurial opportunity recognition. Adapted from
Lumpkin & Lichtenstein, (2005)
Master Thesis Business, Management & Organization August 2019
independent situations, and to “connect the dots” between them (Baron & Ensley, 2006, p.
1341). This implies that individuals develop cognitive frameworks for identifying business
opportunities. An individual with an idea compares this idea to the developed framework in
order to estimate its potential. This phenomenon can be measured with the Business Idea
Evaluation (BIE) (Baggen, 2017, p. 50)
OI allows new information to be reshaped into products, services, etc. This
institutionalization allows to effectively satisfy the demands of the stakeholders and
shareholders inside the chaotic environment of the teams and organizations (Cao et al., 2010).
All the processes are carried by the people that conform to the organization and work on three
levels: individual, team and organizational. They are responsible for the variation, selection and
retention of new processes or learnings that can occur over time (Berson et al., 2006).
Employees that are able to identify opportunities significantly contribute to realizing all
kinds of profitable business outcomes. As such, OI is of interest to employers as it is a key
driver of competitiveness. In existing firms, OI can be an individual as well as a team effort
(Baggen, 2017). This means that the OI of teams and leaders, is directly related with the OL
capacity. It can be inferred that, if the teams possess good OI, the OL will also be good; this is
the assumed connection between OL and OI.
In short, this section focused on further explaining OI. The relation between OI and OL is
basically that new ideas and the identification of opportunities are essential for learning. To
model OI in this research, we will use ‘stage of creativity’ which has a discovery phase and a
formation phase. Within organization, OI causes new info to be reshaped into products, services
and more. Moreover, when employees possess good OI, OL will be good too. The latter is the
assumed connection between OI and OL.
Master Thesis Business, Management & Organization August 2019
2.3. Organizational learning
To remain relevant, organizations must be able to develop learning capabilities (Berson et
al., 2006). These focus on strategic renewal, which requires organizations to invest and search
new ways to do things, and at the same time, exploit what they have learned (Chen, 2017; Keller
& Weibler, 2015). Furthermore, learning can be considered as a permanent activity and as the
general objective of an organization (Bocaneanu, 2007). Learning goes beyond the individual
level (Berson et al., 2006) because it implies that the collective learning process, highly
depending of the leadership and its environment (Paul & Texas, 2014), extends from the group
level to the whole organization (Garvin, 1993; Saadat & Saadat, 2016). For this matter, OL
becomes of high interest for companies striving for differentiate from others.
The process of learning, or incorporating new concepts can be applied to many segments
like process manufacturing, business intelligence, human resources, product innovation,
culture, leadership, etc. Pervaiz K. et al., (2009) define organizational learning (OL) as the
organizational capability to keep and improve the performance. The learning is based on
previous experiences and the ability of achieving productivity from vivid and implicit science,
to share science and to use science in the organization (Crossan et al., 1999). Furthermore it is
relevant to acknowledge that the processes that contribute to learning outcomes, are complex
and they occur on multiple levels of analysis (Berson et al., 2006; Crossan et al., 1999; Leufvén,
Vitrakoti, Bergström, Ashish, & Målqvist, 2015)
Understanding the process is relevant in order to assess the efficiency of the integration and
the reflection processes within the organization, which are the processes through which the
teams can institutionalize new knowledge and, the organizations are able to re-evaluate policies,
products or processes already incorporated in the company’s structure (Figure 2.2).

Master Thesis Business, Management & Organization August 2019
The 4I framework (see table 1) places a clear connection between OL, and AD (exploration
and exploitation) and makes it possible to measure OL.
Level Process Inputs / Outcomes
Individual Intuiting Experiences
Images
Metaphors
Group Interpreting Language
Cognitive map
Conversation/dialogue
Institutionalizing Shared understandings
Mutual adjustment
Interactive systems
Organization Integrating Routines
Diagnostic systems
Rules and procedures
With this framework we identify the flow of learning between levels and the tension between
exploration and exploitation processes as fundamental challenges of strategic renewal. There
are many factors that could influence these processes, some of which are part of the
institutionalized learning itself (e.g., reward systems, information systems, resource allocation
systems, strategic planning systems, and structure). However, in the 4I model we recognize that
the ideas that occur to individuals, ultimately are shared through an integrating process. It is the
individuals, the social processes and the group dynamics through which they interact, that
finally may facilitate or inhibit organizational learning. One interesting aspect, might be the
effects of different types of leadership.
Table 2.1. The 4I model, including flow between individual and organizational level. Adapted from ‘’An
organizational learning framework: From intuition to institution, by M.M. Crossan, 1999, Academy of
Management Review, 24(3), 522-537. Copyright (1999) by the Academy of Management Review.

Master Thesis Business, Management & Organization August 2019
This section discussed OL. Learning goes beyond the individual level and flows through
different levels, and thus it can be said there is a collective learning process within
organizations. The 4I model can assist in measuring OL, as it identifies the flow of learning
between the different levels.
2.4. Levels of analysis
When analyzing a company on AD there are numerous levels of analysis, from the internal
factors which include individual, team and organizational learning (Crossan et al., 1999;
Hülsheger et al., 2009), to external factors, such as political, economic, social and technological
factors (Campbell, 1998). In this research the focus will be on organizational internal factors.
The internal levels of analysis (individual, team and organizational level) tend to interact,
and it is precisely this interaction that is the pathway for organizations towards learning
(Crossan et al., 1999). In the current study, we will illustrate the flow between these levels.
Imagine a feed company who wants to develop a new product for pets; the teams are the ones
that are able to make the discussion about the characteristics, but the tools provided by the
organization, the space to develop and the support to carry those ideas into a real product, will
play a relevant roll on the speed and success of the creation of this product. Another example
is that, in the organizational level, the company promotes the participation of the teams in
competitions and seminars, and this, will influence the teams, to come up with new ideas, or
recognize opportunities in those spaces (Pervaiz K., Ann Y. E., & Mohamed Z., 2009).
The flow from the team level, towards the organizational level, is to be understood as
“integration” (Pertusa-Ortega & Molina-Azorín, 2018; Senge, 1990), and is the moment when
the ideas created by teams are integrated in to the organization’s policies or portfolio. The flow
from the organizational level, towards the team level, is going to be understand as “reflection”

Master Thesis Business, Management & Organization August 2019
(Widmer, Schippers, & West, 2009), and it is the process through the organizations un-learn or
evaluate current aspects of their processes and involve teams to improve said aspects. For
example, once evaluations are done, as result, communication towards teams should be
assertive explanatory. The teams should understand, as part of the organization, what aspects
are being neglected, such as discipline, communication, perseverance, client service, etc.
(Figure 2.2). So, as said above, individuals are not as good predictors of innovation, and teams
are the actual engine in terms of integrating ideas into the organization. Besides this, managers
are reluctant to address innovation matters towards individuals. These are the main reasons for
this report on organizational level and team level, and not in individual level.
This section discussed the level of analysis of the research. First of all, this research will focus
on internal factors of an organization. Secondly, it will focus on team and organizational level.
2.5. Other model variables
For the correct assessment of teams and organizations, the aspects that might influence AD
must be characterized and categorized. For this matter, we choose to divide this aspects into
three variables, that are summed below. The variables are internal and respond to the daily
Figure 2.2. Key concepts do describe flow between Team Level and Organizational Level

Master Thesis Business, Management & Organization August 2019
activities or the teams. This variables have been studied before, and successfully proved
relationships with OL and OI.
1—Team level predictors of innovation, which are going to be analyzed using the framework
described by Hülsheger et al., 2009. This framework responds to the necessity of Meta-analysis
at the team level analyses focused on innovation processes. It covers a wide range of theories
and compares measurement methods and levels. This might be connected with the team’s OI
capacity. Therefore is interesting to address its variability.
2— Leadership, based on Berson’s Leadership and OL, defining the type of leader (Berson
et al., 2006)
3—Environment, using Hengen’s disciplines adapted by Walker (2017). To avoid confusion,
environment here refers to the atmosphere in which teams develop daily tasks. Hence, it is not
about an ´external´ environment such political, or economic factors.
Below the three variables will be explained further in detail.
Team level predictors of innovation
Organizations have great interest in teams inside the organization. They want teams learn to
transform, adapt and improve different aspects of its daily business. The general perception is
that inside organizations, some teams perform better than others. The characteristics of these
better performing teams allow these teams to learn faster, work better together, and achieve
Figure 2.3. Team-Level predictors of Innovation variables. Hülsheger, et.al (2009)

Master Thesis Business, Management & Organization August 2019
relevant milestones for the organizations. So it is important to know what are those
characteristics that make these particular teams special. Knowing the characteristics is of
importance to the companies that want to remain relevant.
The framework on Team-Level Predictors of Innovation can help to identify what makes
teams different (Hülsheger et al., 2009). Two types of variables can be differentiated: team-
input variables and team-process variables. Team-process variables display substantial and
generalizable relationships with innovation. Team-input variables display only relatively small
relationships with innovation. Following this, teams can be evaluated with seven input
variables: goal interdependence, background diversity, job relevant diversity, task
interdependence, team longevity, team size and cohesion. Also teams can be evaluated with
five team-process variables: vision, support for innovation, internal and external
communication and task orientation, which is directly related with motivation (Figure 2.3).
Leadership
Leaders are expected to act as drivers for innovation, they can use many tools to refer to
issues. Moreover they have the ability to get involved emotionally with all the team’s members,
and can contribute by sharing their learning and align it with the goals of the organization. “The
ideas of individuals become meaningful, legitimate, and integrated in their own cognitive maps
when they make sense to others, especially to their leaders” (Berson et al., 2006). For these
reasons, a leader’s vision may be a source for building a shared language or mental model,
which can validate, legitimate and connect the ideas of individuals to the team level.
It is clear that there is not a “magic combination” of skills and traits that makes a leader a
great leader (Dansereau, Seitz, Chiu, Shaughnessy, & Yammarino, 2013; Keller & Weibler,
2015). Furthermore different characteristics matter in different circumstances (Ojha et al.,

Master Thesis Business, Management & Organization August 2019
2018). However, this does not imply that organizations are unable to improve leadership. In
this report, we focused on behavioral theories, which is about what a good leader does. We
choose this theory as the focus in general is on internal factors that drive organizations. Later
on in this document, the use of the three leadership types (from behavioral theory) will be
explained.
Environment
Many authors state that environment is key for the team performance (Chiva, Alegre, &
Lapiedra, 2007; Ojha et al., 2018; Walker, 2017). However, organizations may fail in assigning
the team’s innovation performance to the environment, or to its intrinsic traits. It is relevant for
organizations to identify, whether the resources and efforts should focus on improving the
team’s core characteristics, or only improve the team’s performance in its business
environment. The environment of the teams, can be analyzed using the five “component
technologies” of a learning organization: personal mastery, mental models, shared vision, team
learning, and systems thinking (Senge, 1990). Nonetheless, these disciplines might miss the
influence of leadership in the before mentioned environment. To solve this, we will make use
of one extra discipline (the fifth discipline) called “empowering leadership”, which “is focused
on using knowledgeable change agents with authority to implement managerial policies and
initiatives to activate the latent learner and promote the desired behaviors of LO in the
workplace” (Walker, 2017, p. 28).
In this section we discussed the different internal variables that might influence AD. First
there is team level predictors of innovation, which can help to identify what makes teams
different. Then there is leadership, in which the focus is on behavioral theory, which is about
what a good leader does. The last variable is the team’s environment.
Master Thesis Business, Management & Organization August 2019
2.6. Connections between variables
In this final section, we will discuss the connections between the variables. The fifth
discipline, as discussed before, became a guideline on how to structure organizational
management values and initiatives to encourage effective learning (Senge, 1990; Walker,
2017). However, more than just increasing learning, the process to self-inform about the
knowledge and awareness generated by the organization, would and should, inform the
practices of the organization itself. This in turn would make the process more efficient and
effective, as the organization is better able to respond to what it learned, both about itself and
about the outside environment (Garvin, 1993). Following these ideas, five disciplines can be
identified which can be used to assess a learning organization. These disciplines can be
understand as “component technologies” of a learning organization and are the following
(Senge, 1990):
• Personal Mastery: “a discipline of continually clarifying and deepening our
personal vision, of focusing our energies, of developing patience, and of seeing reality
objectively.”
• Mental Models: “mental models are deeply ingrained assumptions,
generalizations, or even pictures of images that influence how we understand the world and
how we take action.”
• Shared Vision: “a practice of unearthing shared pictures of the future that foster
genuine commitment and enrollment rather than compliance.”
• Team Learning: “the capacity of members of a team to suspend assumptions and
enter into genuine thinking together.”
• Systems Thinking: “seeing inter-relationships that underlie complex situations

Master Thesis Business, Management & Organization August 2019
and interactions.” (Senge, 1990)
Using this approach, we will characterize the perceived environment, from the teams and the
leaders. Understanding the differences of the surroundings, protocols and rituals that are
intrinsic part of the teams, we will be able to assign the respective variation to the environment
interactions and not of the teams its selves.
The leadership has proven to be relevant for the OI and for the development of a LO (Avolio
et al., 2004). Leaders facilitate exploration among followers by providing the contextual support
to develop their ideas (Berson et al., 2006). For the learning organization, the innovation process
is part of the capabilities tool-box; the teams, as a learning organisms motivated by leaders,
engage in innovation, and have intrinsic characteristics, numerous variables that perform as
predictors of innovation performance (Baggen, 2017; Edmondson & Harvey, 2018). For the
correct assessment of a learning organization and its relationship with the AD, the proper
identification of the profile of the teams which engage in innovation becomes relevant, due to
the complexity of its interactions; if organizations can isolate the different aspects that influence
innovation, they have a clear approach to prioritize and make precise changes and
improvements.
Hülsheger et al. (2009) describes an approach to characterize teams, the different variables
that influence innovation process were divided in two categories; input –and process variables.
For the input variables, ‘team size’, ‘job-relevant diversity’ and ‘goal interdependence’ showed
a positive significant correlation with innovation performance, while ‘team longevity’, ‘task
interdependence’ and ‘background diversity’ displayed a small negative, yet, not significant,
relationship with innovation (Hülsheger et al., 2009). Their study also showed that, in general,
team process variables are strongly linked to overall measures of innovation, being ‘vision’,

Master Thesis Business, Management & Organization August 2019
‘external communication’, and ‘cohesion’ as the most relevant among all the variables
((Hülsheger et al., 2009)).
According to Senge’s theory, an organization which can facilitate these core concepts can
establish a cycle of perpetual learning and self-improvement, which will in turn generate a
sustainable competitive advantage for the organization. However, Walker, in his study, after a
critical review of the fifth discipline, decided to include a sixth discipline: “empowering
leadership”, which “is focused on using knowledgeable change agents with authority to
implement managerial policies and initiatives to activate the latent learner and promote the
desired behaviors of LO in the workplace” (Walker, 2017, p. 28).
To illustrate the connection between OI and OL Lumpkin & Lichtenstein (2005) made the
following propositions:
• The more organizational learning practices are enacted by both, entrepreneurs
and entrepreneurial firms, the higher the likelihood that new opportunities will be
recognized.
As mentioned, one of the factors affecting AD is leadership (Berson et al., 2006). Leaders
play a central role in the OL process in multiple ways. First, by providing the contextual support
in the organization (Berson et al., 2006; Keller & Weibler, 2015), leaders obtain the needed
resources for learning to occur through exploration and exploitation (Avolio et al., 2004).
Second, leaders are critical to the integration of learning across group and organizational levels.
Leaders enable and enhance this integration by providing a foundation of shared understandings
of needs and purpose at different levels of the organization (Keller & Weibler, 2015). These
processes can be evaluated from the optics of the 4I learning processes of entrepreneurial

Master Thesis Business, Management & Organization August 2019
intuition and interpretation (Baggen, 2017; Berson et al., 2006), and therefore, the choice is
made to focus on leadership as another one of the factors linking between teams and
organization.
2.7. Research questions
The aim of this study is to identify the intricate relationship between the variables
responsible for organizational AD, including OI and OL. The research can be seen as a
quantitative study design, which is used for a thorough, holistic and in-depth exploration in the
specific situation, phenomenon, group or community (Baxter & Jack, 2008).
The research is divided into three steps. The first step is building a theoretical or conceptual
model, based on the literature on AD, OL and OI and their interactions and flow among the
different levels, such as individual, team and organization. The second step includes the
development of a survey, which is build based on validated methods from primary and
secondary literature and its recommendations. The third and final step covers empirical research
on survey delivery and data collection.
AD is composed of exploration and exploitation and is dependent of OL. OL, in turn, will
be measured through the concept of 4I (Intuiting, Interpreting, Institutionalizing, Integrating).
The last variable is OI, which will be analyzed from the concepts of self-perceived opportunity
identification competence, Business Idea Generation (BIG) and Business Idea Evaluation
(BIE). Additionally, the secondary model variables will also be introduced. Environment,
Team-Level Predictors of innovation and Leadership might modulate the flow relationship
between the model variables.

Master Thesis Business, Management & Organization August 2019
Figure 2.4. Theorical framework. The dependent variable (Ambidexterity) is dependent on the independent
variables (organizational Learning and Opportunity identification), influenced by the moderator variables
(Environment, Team-level predictors of innovation and Leadership)
Now that the figure is explained, the main research question is as following:
What is the relationship between the variables responsible for organizational AD?
For this research question, focus will be on OI and OL, as these are main concepts expected
responsible for org AD. However, to measure OI and OL, other variables (such as the 4I model)
are necessary to explain OI and OL in turn.
To answer this question, we need to evaluate the connections between the variables, for this,
propositions also need to be addressed, and will be answered later in this report:
I. What is the relationship between the constructs and items of OI and OL frameworks?
II. How does OL influence organizational AD?

Master Thesis Business, Management & Organization August 2019
3. Methodology and research design
In this section we will introduce the design of this research, the methodology implemented,
and the motivation behind all the different decisions. The methodological part will be divided
in 4 main sections, which will respectively describe the object of research, the survey, and
define in-depth the concept of leadership, organizational learning and opportunity
identification. The survey contains theoretical categories, meaning that each framework,
consists of several constructs, and each of these constructs comprehends several subjects or
sub-sections. These subsections are derived from prior theories and inductively developed
theory. This report aims to connect strategies, and understand the data collected in the context
of Colombian agricultural and animal industry.
3.1. The object of research
To be able to answer the above research questions, it was proposed to work together with an
commercial organization. Because of the background of the main author, it was more
convenient to try to involve an organization active in lifestock production. The reason to use
only one organization is based on exclusiveness issues and confidentiality. This is illustrated
by the observation that none of the organizations contacted wanted to work along, other
organizations, some of these even requested to have the competence information, without
delivering their own.
The chosen organization is in the animal feed and technology sector, a Colombian enterprise
characterized and recognized for its innovation. This Colombian feed manufactured, from now
on referred as the Company, is composed by more than 600 collaborators, from 9 nationalities;
31% of the Company is female, and 46% is composed by young talent between 20 and 35 years

Master Thesis Business, Management & Organization August 2019
old. At the beginning, there was a proposal to work with 7 teams, however, after some
interviews with the CEO and the top managers, the number of teams raised to 36, with the pre-
condition that the managers will take full responsibility on the successful completion of the
survey. The filed “name” would be included, just for follow-up purposes, and once the
responses were recorded, the names are deleted from the data base, this to have anonymous
answers, because individual level, is not in the scope of this report.
The Company is characterized and recognized for its innovation (Cano, 2015; Colombia-
inn, 2017). It is based in Medellín, the capital of Antioquia – Colombia. Its main activity is
focused on food and innovation towards animal and human nutrition. The organization aims to
replicate successful behaviors and characteristics inside the Company; however, it lacks
information or tools to identify these and thus, improve the existing ones or learn new
capabilities. By characterizing its teams, based of literature and accepted variables as predictors
of innovation or learning capacities, the Company will be able to make precise improvements
on the teams and the organization, to develop further its organizational AD.
Team Alpha
In a meeting held in the Netherlands, the Company’s CEO said that the organization is
growing in numerous aspects: For example, Team Alpha is perceived as one of the Company’s
most important Business teams, due to the intricate relationship within the rest of the business
teams. This team is currently focused on developing everything related to the internet of animals
(IoA), extract-transform-load (ETL), and data services (DS). It is composed by a team of young
and motivated professionals. The CEO stated about Team Alpha “ This team has proved to go
beyond expectations, show fast learning, and delivers relevant projects that are placing the
Company on the spotlight”. However, effectively replicate Team Alpha’s success into other

Master Thesis Business, Management & Organization August 2019
parts of Company P, has proven to be difficult. Looking at the existing literature, Team Alpha
could be explained as “a division of technological and digital nature, which has as purpose to
enable technologies to be used in the protein production, transforming technology in tools and
knowledge to help the producer”, (“Premex, nutrition for the agricultural industry,” 2018). The
corporate structure is defined as a network structure, less hierarchical, more centralized and
flexible than most managerial structures, being the managers (leaders) who coordinate and
control relationships, both internal and external (Johnson, Whittington, Scholes, Angwin, &
Regnér, 2018). The chosen teams are playing a relevant roll on the strategy towards 2020. For
these reasons becomes of high interest to characterize them, identify defining aspects such as
environment, team profile and leadership, to facilitate the replica of Team A’s successful
behavior into the other teams. To wrap up Team A will work as the control group due to its
characteristics, from which we have reason to assume that Team A is ambidextrous.
3.2. The survey
The survey was developed with help of the human resources department using Qualtrics®
software, and it contains 11 sets of standardized questions which will be called items, following
a randomized scheme (Error! Reference source not found.Figure 2.5. Questionary flow and
item distribution) in order to collect individual data about the variables of interest. The first
questions should be of easy response to gain confidence and empathy with the respondents. A
difference in language might influence the quality of the answers (Baggen, 2017). Spanish,
which is the main language of the Company, is not the mother tongue of many of the employees,
for this reason the survey was developed both in English and Spanish, so the employee was
able to choose its preferred language. Due to the extensive length of the survey, 5 pauses were
located every certain number of questions at the end of each randomized block. The employee

Master Thesis Business, Management & Organization August 2019
then is able to stop the survey and pick it up another time. This will guarantee that the
respondent will receive the questions in different order, without affecting the related subjects,
so the mental fatigue won’t affect the same questions for every response. The questions were
reviewed and approved by the managers and the HR department.
The survey was administrated to the Company’s employees, with the collaboration of the
communications department, via institutional email and published in the Company’s internal
web page. The stimulus for all the respondents was the same, to get a similar cognitive and
social reaction. Next to the survey it was important to do more research. Hence, secondary
sources were researched and interviews were taken with the top level managers. These
interviews were done to get more in-depth information about the Company and its goals.
Furthermore, the interviews were held to give the Company information about the following
steps of the research and to inform them about the procedure. The managers had the task to
socialize with their team briefly about the relevance of the survey, then the survey was sent
through email. For two weeks, the weekly news flash contained a reminder. And at the last
reminder is an email from the manager reminding the team to complete the surveys. Qualtrics
was connected to a dashboard, that showed in real time the employees that answered the survey
and in which percentage were going. The HR department handed in the team employees list of
names and business units. This list would later be used to check the full competition of the
survey.
Both figure 2.5 and table 2 were created to clarify the survey. Figure 2.5 (see below) explains
how the survey is set up. From left to right, you can read the different stages that the
collaborators go through when making the survey. Based on figure 6, table 2 was created. Table
2 explains the literature review and the authors of the concepts that are being used, to address
the variables that are being measured.

Master Thesis Business, Management & Organization August 2019
The following sections will describe the segments of the survey (Figure 2.5. Questionary
flow and item distribution), the measurements and the relationships with the frameworks
described above. The figure shows how the collaborators received the questions (items). Each
framework contains several constructs, and each construct contains several items. These
constructs are presented randomly for each collaborator.
Fig
ure
2.5
. Q
ues
tio
nar
y f
low
an
d i
tem
dis
trib
uti
on
.

Master Thesis Business, Management & Organization August 2019
Table 3.2. Model variables, subsections and constructs.
Framework
(Variable)
Constructs Sub-sections Items Type of
variable
Author /
Reference
Team-Level
Predictors of
Innovation
Input variables 1 Background
diversity
2, 3, 5, 6, 7 General
demographics
Hülsheger et
al., 2009
2 Aim
interdependence
26 - 30 5-item Likert
scale
3 Job-relevant
diversity
4
4 Task
interdependence
21 - 25
5 Team size 13
6 Team longevity 8 9-item Likert
scale
7 9 6-item Likert
scale
8 Cohesion 86, 87, 88 5-item Likert
scale
Team Process
variables
9 External
communication
89, 90, 91 5-item Likert
scale
10 Internal
communication
14 - 20
11 Participation
safety
36 - 40
12 Support for
innovation
92, 93, 94
13 Task orientation 95, 96 5-item Likert
scale
14 97 5-item multiple
choice
15 Vision 31, 32, 33 Open question
16 34, 35 5-item Likert
scale
Organizational
Learning (OL)
4I 17 Intuiting 41, 42, 45,
54, 55, 56, 59
5-item Likert
scale
Baggen,
2017.,
Crossan et al.,
1999 18 Interpreting 44, 48, 49,
58, 62, 63
19 Integrating 46, 47, 51,
60, 61, 65
20 Institutionalizing 43, 50, 52,
53, 57, 64,
66, 67
Leadership 21 Type of leadership 68 - 85 5-item Likert
scale
Judge &
Piccol, 2004
Opportunity
identification
(OI)
22 Self-perceived Opportunity
Identification competence
98 - 101 5-item Likert
scale
Baggen, 2017.
23 Business Idea Generation (BIG) 102 Open ended
question
Business Idea
Evaluation
(BIE)
24 Experienced
entrepreneur
103 - 107 5-item rank
question
Baggen, 2017
25 Novice
entrepreneur
108 - 112
Environment 26 Mental models &
personal mastery
113, 114, 115 5-item rank
question
Walker, 2017.
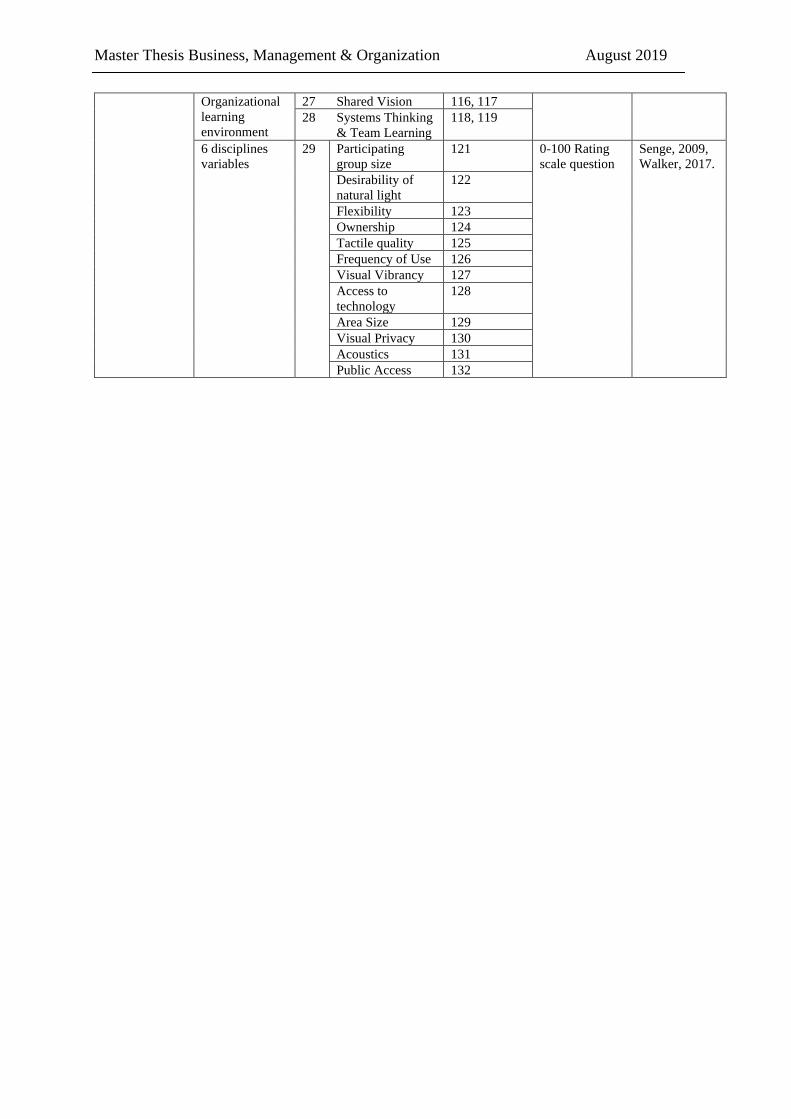
Master Thesis Business, Management & Organization August 2019
Organizational
learning
environment
27 Shared Vision 116, 117
28 Systems Thinking
& Team Learning
118, 119
6 disciplines
variables
29 Participating
group size
121 0-100 Rating
scale question
Senge, 2009,
Walker, 2017.
Desirability of
natural light
122
Flexibility 123
Ownership 124
Tactile quality 125
Frequency of Use 126
Visual Vibrancy 127
Access to
technology
128
Area Size 129
Visual Privacy 130
Acoustics 131
Public Access 132
Master Thesis Business, Management & Organization August 2019
Demographics, leadership & team
The questions contained in this block, are mainly demographics including age and gender.
The questions for Longevity in the Company (Q.8) and in the current team (Q.9), will define
the level of expertise, also contains the classification of leader (Q.10), to differentiate leaders
and collaborators answers from each other. The employees were asked to indicate the current
team or unit they belonged, indifferent if they had to work with many others, they ave to indicate
the main team (Q.5 & Q.6).
Team level predictors of innovation
This framework, adapted from Hülsheger et al. (2009), is divided in two main sections, Input
variables and Team-process variables. The measurement method is assessed via self-report. We
expect higher correlations between team process variables with self-ratings of innovation
compared with independent ratings or objective indicators of innovation, if the same individuals
report on team processes as well as on their team’s or their own innovative performance,
correlations are likely to be higher, because not only is the same measurement method used
(surveys) but also the same information source (team members) (Hülsheger et al., 2009). As
listed on the

Master Thesis Business, Management & Organization August 2019
Table 3.2, the Input variables described by Hülsheger are: Job-relevant diversity, Background
diversity, Task interdependence, explained as de ease of a team to complete tasks, without
depending on other teams. In other hand, Goal interdependence, another input variable, is
described as the amount of contrast between teams goals, without losing vision over the
organization`s purpose. Team size is also part of Team-level predictors of innovation, inside
Input variables construct, and is as simple of the amount of collaborators inside a team. And
finally, Team longevity, is the time average or experience that team members have inside said
team, can also be called “teams age”. Team process variables are Vision, referring to team’s
and organization’s purpose. Here, collaborators should indicate which one are the respective
goals and purposes. Low values in this item will indicate lack of communication from the
leaders and might also be a sign of lack of compromise from the employees. Consequently,
Participative safety, Support for innovation and Task orientation, are all deeply connected to
team’s leadership. Because is the leader who will facilitate the active participation of the
collaborators and give them confidence to make mistakes. At the same time, is the leader who
has certainty of organizational purpose. Thus, it is the leader who should orientate tasks towards
the accomplishments of said goals.
Cohesion, Internal communication and External communication, the last items of TLPOI
framework, will evaluate the capacity of teams to have discussion about non-job-related topics.
It is believed that most of the ideas, come from hall conversations inside the organizations. A
proper cohesion, boosted by internal communication will bring innovative discussions, and
once these ideas are fostered inside the teams, can be shared with other teams and leaders, to
bring them to life and generate innovation for the organization. All of these constructs have
several questions, and were evaluated with Likert scales and open questions for Background
diversity and Job-relevant diversity.

Master Thesis Business, Management & Organization August 2019
3.2.2.1. Background diversity. Described as the diversity of the origin of the team
members. This value is measured by the distance between the city in which the team members
grew, interpreted as, the larger the distance, the less aspects-in-common shared by the team
members. Background diversity should remain in low levels (Frances J & Luis L, 1996),
because differences in power-distance, language, rituals, etc., can hinder team innovation
performance (Hülsheger et al., 2009). The location of birth was recorded in open question (Q.3),
then the cities were homogenized, and the geographical coordinates are assigned. To measure
team-city of birth diversity, the average distance was calculated using the Haversine Equation
(Equation 1), where φ is latitude, λ is longitude, R is earth's radius (mean radius = 6,371km)
a = sin²(Δφ/2) + cos φ1 ⋅ cos φ2 ⋅ sin²(Δλ/2)
3.2.2.2. Job-relevant diversity. This sub-section of TLPOI, can be understand as the
heterogeneity of technical, social and scientific abilities inside a team. The heterogeneity should
not be low enough to lack objective discussion, and should not be high enough to slow internal
processes. The job relevant diversity was recorded using open question (Q.4) where the
respondent indicates its profession or expertise area. This categories where homogenized using
the International Standard Classification of Occupations (“International Standard Classification
of Occupations (ISCO),” 2014). These values where then used as distances for Job-relevant
diversity. We assumed that the bigger the distance between numbers, the bigger the differences
between respondent background. Averages for teams were then calculated.
Equation 1. Haversine formula to for distances between two longitudes and two latitudes.

Master Thesis Business, Management & Organization August 2019
3.3. Leadership
To determine the type of perceived leadership, we are going to differentiate between three
leadership styles, which have been mentioned before in chapter 2.5.2. Democratic leadership,
Laissez-faire leadership and Authoritarian leadership. These styles were chosen based on the
previous Company’s experience and each style is related to a group of 6 questions for a total of
18 questions. The respondent will choose one option between a 5-level Likert of agreement or
disagreement scale. The group with the highest score will be the most dominant perceived
leadership style, then 5 categories are assigned based on average scoring: 26-30, very high
range; 21-25, high range; 16-20, moderate range; 11-15, low range; 6-10, very low range.
3.4. Organizational learning
The 41's are related in feed-forward and feedback processes across the levels (Crossan et al.,
1999). Hence, for measuring the flow from individual level towards organizational level, the
survey included 27 items based on the 4I framework for organizational learning (Crossan et al.,
1999). The questions were modified to fit the Company’s language and culture and also to fit
the definitions given in the welcome page of the survey. For example ‘managers’ changed to
‘leaders’ and ‘employees’ changed to ‘collaborators’. The items were divided as indicated on
the Table 3.2. Model variables, subsections and constructs. The questions are oriented to pro-learning
culture and anti-learning culture and measured in a 5-level Likert scale of frequency (1- Always,
-2 Most of the time, 3- Half of the times, 4- Sometimes and 5- never). To illustrate this, the
items 41-53 are pro-learning behavior and the items 54-67 are anti-learning culture. Item 53
provides an example of a pro-learning culture: ‘Managers think about their interest in and
capacity for learning new things (their learning quotient), and the learning quotient of their
employees’. Item 67 provides an example of an anti-learning culture: ‘Managers think that

Master Thesis Business, Management & Organization August 2019
they personally know all they need to know and that their employees do not have the capacity
to learn much than they know’. These two items relate to the same aspect of the 4I framework,
Integrating. However, low-values answers will be evaluated differently, the first item, 53, in a
positive way, and the second item, 67, in a negative way.
3.5. Opportunity identification
The survey contains a performance test referred to as the opportunity identification
competence assessment test (OICAT) (Baggen, 2017, pp. 47–55). This test consists of two
tasks: Business Idea Generation (BIG) and Business idea Evaluation (BIE). In the first task, the
respondents were requested to come up with business ideas or projects related with
sustainability. These ideas were later evaluated by the Team A’s senior entrepreneurs using
three factors to score the competence of creative individuals: fluency, elaboration, and
flexibility (Carroll & Guilford, 1968) and then the results returned to the researchers. A
description of this method was shared with 3 collaborators, who scored these ideas
anonymously. The second task consisted of applying the frameworks about novice and
experienced entrepreneurs (Baron & Ensley, 2006) in which the respondents were requested to
rank the given arguments according to their importance when determining the potential success
of business ideas.
Master Thesis Business, Management & Organization August 2019
4. Results and analysis
As a principle of qualitative research, the data analysis was conducted simultaneously with
the data collection (Coffey & Atkinson, 1996). This allowed us to correct progressively adjust
the survey to the user experience, fix problems and react rapidly, reducing the amount of
desertion of the survey.
Each construct was calculated according to the methodologies described by the authors of
the frameworks (Table 3.2) and team averages were obtained for each construct. From 315
collaborators that were indicated to solve the survey, 226 started it (71.76%) and from these,
180 collaborators completed it (57.14% of the total of collaborators). As criteria for the
selection of the teams, the percentage of completeness of the surveys (100%) and the number
of completed surveys per team (more then 3) were used. Hence in the end, 17 teams remained
with a total of 180 completed surveys. From all the respondents, 43.4% were between 24 and
34 years, representing a big majority of young people, however, only 4.4% corresponded to the
ages of 18-24 years. For more information on the demography of the collaborators, please
reference to
. The amount of constructs and items is extensive compared with most of the references
(Baggen, 2017; Berson et al., 2006; Hülsheger et al., 2009; Lis, Tomanek, & Gulak-lipka, 2018;
Manuscript & Study, 2013; Raisch & Birkinshaw, 2008; Yang, 2016).

Master Thesis Business, Management & Organization August 2019

Master Thesis Business, Management & Organization August 2019
Characteristics Frequency Percentage
Background diversity: Age
Between 18 and 24 years 10 4%
Between 25 - 34 years 98 43%
Between 35 - 44 years 77 34%
Between 45 - 54 years 27 11%
Others ages 14 6%
Background diversity:
Gender
Men 120 53%
Women 106 46%
Team longevity:
Time inside the Company
Between 3 and 5 years 28 11%
Between 1 and 3 years 67 26%
Less than one year 51 20%
More than 5 years 49 19%
More than 10 years 31 12%
Others 28 11%
Job-relevant diversity:
Professional/technical
background
Animal Science 39 17%
Logistics 25 11%
Administration 18 7%
Chemical engineering 12 5%
Chemistry 11 4%
Industrial engineering 11 4%
Veterinary Medicine 11 4%
Commercial 9 4%
Others 91 40%
Background diversity:
City of birth
Medellín - Colombia 124 54%
Bogotá D.C. - Colombia 19 8%
Ciudad de Guatemala - Guatemala 8 3%
Itagüí - Colombia 7 3%
Armenia - Colombia 4 1%
Others - Colombia 64 28%
Self-perceived Leadership
No, I do not see myself as a leader inside my
team 143 63%
Yes, I see myself as a leader inside my team 83 36%
Total amount of collaborators in the target group 315
Total surveys answered: Surveys with at least three constructs answered (15%) 226
Response ratio: Collaborators who completed at least three constructs (15%) 72%
Total questions in the survey 132
Percentage of questions
answered for each survey
100% completed 180 79,60%
95% completed 2 0,90%
Table 4.1. Teams demographics and survey results, based on individual survey answers.

Master Thesis Business, Management & Organization August 2019
The amount on teams was reduced drastically to avoid missing values. As expected, team
Alpha was included inside the 17 selected teams.
4.1. Results and discussion
Several ways of statistical analysis were used to create results, with the majority of analyses
being unsuccessful to prove the validity of the construct. Confirmatory Factor Analysis (CFA)
was performed in order to test construct validity. CFA in AMOS with all the constructs
explained above, produced poor fit of the model. The p-value obtained for CFI (likelihood ratio
chi-square goodness of fit statistic) was 0.551. Literature reports that these values should be
higher than 0.6 to be acceptable (Arbuckle, 2005; Blunch, 2017). Consequently root mean
square error of approximation (RMSEA) was about 0.089, when values must be lower than 0.05
in most cases, although some reports work with values under 0.08. (Körner, Wirtz, Bengel, &
Göritz, 2015; Taghipour & Dejban, 2013)
Cronbach's Alpha
As the CFA was unsuccessful, an exploratory factor analysis (EFA) was conducted in SPSS
to assess the validity of all items regarding opportunity identification, organizational learning,
Team-level predictors of innovation, Leadership and Environment. Reliability analysis was
performed for each construct separately, evaluating each item for each construct. When
93% completed 2 0,90%
87% completed 3 1,30%
84% completed 1 0,40%
Others 38 16,80%
Total teams 36
Chosen teams: Teams with at least 3 surveys answered with 100% of the items
answered 17

Master Thesis Business, Management & Organization August 2019
performing reliability analysis in SPSS, Cronbach’s alpha coefficient showed survey’s
reliability with an Alpha of 0.738 and Cronbach's Alpha Based on Standardized Items showed
0.774 for 35 survey items. When corrected for those components with “Cronbach's Alpha if
Item Deleted” higher than the actual alpha, the Cronbach's Alpha Based on Standardized Items
rose to 0.87. Therefore, these items were discarded and excluded from further analysis. Type
of Leadership variables has zero variance, 100% of the respondents categorized its leaders as
Democratic leaders type (Judge & Piccol, 2004).
A second round of reliability analysis pointed out that the remaining factors do not increase
Cronbach’s alpha when deleted, therefore, 25 items remained. Reliability analysis was executed
based on Cronbach’s alpha α for each construct separately. A third round of EFA was executed,
which showed that all remaining variables loaded well on the intended factor, except for all
leadership factors, because all the collaborators got the same result: Democratic leadership, &
Laissez-faire, primary and secondary types of leadership. For this reason, Leadership variables
are not evaluated any further.
Table 4.2. Reliability analysis and Cronbach’s alpha coefficient.
Variable Construct Sub-section Valid cases
%
Cronbach's
Alpha
Rejected
items
Remaining
items
Corrected
Cronbach's
Alpha
Team-Level
Predictors of
Innovation
Input
variables
Background diversity 100,0% 0,173 2 0 0,215
Aim interdependence 94,7% 4,730 1 4 0,618
Job-relevant diversity 89,5% 0,170 2 3 0,205
Task interdependence 94,7% 0,440 0 5 0,456
Team size - - - 0 -
Team longevity - - - 0 -
Cohesion 92,1% 0,201 1 2 0,514
Team
Process
variables
External
communication 92,1% 0,765 1 2 0,828
Internal
communication 94,7% 0,894 2 1 0,921
Participation safety 94,7% 0,727 0 5 0,766
Support for
innovation 92,1% 0,605 1 4 0,670
Task orientation 92,1% 0,296 0 3 0,298

Master Thesis Business, Management & Organization August 2019
Vision - - - - -
Organizational
Learning (OL) 4I
Pro-learning 100,0% 0,826 0 13 0,843
Anti-learning 100,0% 0,819 0 13 0,830
Organizational
learning 100,0% 0,883 0 4 0,913
* Items with Cronbach's Alpha lower than 0.3, show poor reliability.
4.2. Descriptive statistics and correlations
To analyze connections between variables, Pearson correlations were performed for all the
constructs and sub-sections (Table 4.3). For the correlations, “**” means significance at the
0.01 level (2-talied), and “*” means significant correlations at the 0.05 level (2-tailed). All the
frameworks showed correlation within constructs and items.
Organizational learning
Organizational learning showed interesting correlations, for example, the framework possess
antilearning items, and these showed negative correlation, for example, in terms of anti-learning
behavior, Institutionalizing (-0.883**) and interpreting (-0.893**), indicating the negative
effects that can cause the lack of policies or assignation, once ideas are proposed. Connecting
Organizational learning with opportunity identification showed correlation with the business
idea evaluation – construct, for the sub-section Experienced entrepreneur. This is aligned with
the belief that experienced entrepreneurs will be more efficient taking new knowledge, and
transforming it to tangible products or services (Hébert & Link, 2006), compared with the
novice entrepreneur (0.154), which, might have fresh ideas and the advantage of technology
(Beckman, Eisenhardt, Kotha, Meyer, & Rajagopalan, 2012), but lack the capacity to connect
the dots and run a successful innovation efficiently.
Master Thesis Business, Management & Organization August 2019
In terms of team-level predictors of innovation, strong correlations with Support for
innovation (0.740**), Task orientation (0.746**), Participation safety (0.526*) and External
communication (0.560*). This brings light to the relationship between teams, and how this can
promote innovation within an organization. Leader, are the ones who support and orientate the
daily tasks, in order to accomplish organizational purposes. If leaders communicate clearly the
goals, and provide the proper support for the ideas, within a safe and respectful environment,
teams will be more efficient to incorporate new knowledge (organizational learning).
Environment showed no correlations, this might obey to the difference of scoring, and
because many of the team members work either from home, or are in the field 50% of the time.
Opportunity identification
Opportunity identification behaved differently that the other constructs and frameworks.
Opportunity identification had a complex evaluation. First, ideas had to be generated. Then
these ideas had to be evaluated by experienced members of team Alpha. The ideas are classified
in categories, and these categories are part of the index. This framework is able to evaluate the
capacity of a team to produce new ideas. In total, 615 ideas were created. From these ideas,
46% complied with the requirements of clarity, alignment with the organization purpose and
the subject, which was sustainability. These ideas were classified in a total of 26 categories, i.e.
water management, recycling, clean energy, circular economy, etc. Business idea generation
showed no correlation with any other item, however was highly significant within its own
construct (0.966**) indicating consistency. Self-perceived opportunity identification correlated
with institutionalization, only indicating that successful innovation, will promote more
innovation due to self-confidence (Dutta & Crossan, 2005).

Master Thesis Business, Management & Organization August 2019
By other hand, Business idea evaluation, showed important contrast in terms of experienced
and novice entrepreneurs. Novice entrepreneurs performed better when requested to generate
ideas compared with experienced entrepreneurs (0.539* vs 0.121).
This means that opportunity identification connects with organizational learning trough
conversations between teams, powered by proper guidance of leaders, and organizational clarity
in terms of purpose and goals. Experienced entrepreneurs will be able to develop the ideas
generated by the novice entrepreneurs.
Environment
The environment takes relevance when innovation is a daily task. Correlations between
environment and organizational learning were found in teams who expressed were found
between those teams that expressed to recognize a greater system (system thinking), but not an
obligation to it (0.650**). Also teams that scored high in personal mastery, showing self-
management, also showed high scored in the organizational learning construct
“institutionalizing”, indicating that teams which work in an environment that promotes learning
and reflection, rather than just production, will perform accordingly, when requested to
incorporate new learnings, needed maybe to create a new business unit, or launch a new product
to the market (Ayd, 2017; Yang, 2016). There is a clear connection between Organizational
learning and the environment in which teams learn and produce new ideas.

Master Thesis Business, Management & Organization August 2019
1 2 3 4 5 6 7 8 9 10 11 12 13 14
1 1 1
2 .876** 1 2
3 .908** .725** 1 3
4 .884** .741** .752** 1 4
5 .884** .735** .673** .722** 1 5
6 Intuiting + .826** .840** .742** .659** .709** 1 6
7 Interpreting + .688** .45 .902** .540* .422 .645** 1 7
8 Integrating + .763** .605* .755** .770** .580* .706** .688** 1 8
9 Institutionalizing + .646** .504* .475 .42 .838** .633** .379 .388 1 9
10 Intuiting - -.374 -.576* -.221 -.377 -.288 -.041 .142 -.057 .026 1 10
11 Interpreting - -.893** -.859** -.775** -.784** -.791** -.610** -.425 -.575* -.437 .669** 1 11
12 Integrating - -.294 -.293 -.102 -.463 -.302 -.029 .13 .209 -.107 .495* .401 1 12
13 Institutionalizing - -.883** -.759** -.684** -.797** -.921** -.628** -.371 -.604* -.560* .455 .890** .384 1 13
14 .355 .388 .104 .243 .568* .432 -.011 .16 .510* -.063 -.233 -.149 -.500* 1 14
15 BIG - Fluency .016 .037 .055 -.009 -.037 .172 .132 .136 -.088 .194 .072 .209 -.009 .113 15
16 BIG - Flexibility .044 .112 .051 .004 -.004 .192 .089 .057 -.039 .087 .018 .08 -.024 .086 16
17 BIG-Elaboration -.056 .026 -.056 -.072 -.08 .135 -.04 .001 -.19 .154 .051 .115 -.015 .118 17
18 BIE Experienced Entrepreneur .620** .729** .554* .492* .474 .635** .389 .335 .464 -.384 -.591* -.288 -.391 .075 18
19 BIE Novice Entrepreneur .154 .208 .191 .158 .016 -.072 .1 .082 -.117 -.488* -.257 -.123 -.105 -.131 19
20 .620** .760** .595* .543* .377 .775** .508* .559* .268 -.229 -.503* -.055 -.383 .233 20
21 Team size .448 .294 .438 .465 .376 .276 .399 .276 .495* -.129 -.332 -.327 -.217 -.088 21
22 Team longevity -.455 -.647** -.342 -.472 -.286 -.339 -.106 -.217 -.064 .682** .564* .417 .389 -.128 22
23 Job diversity .198 .373 .313 .047 -.028 .348 .371 .063 .013 -.149 -.113 .019 .05 -.082 23
24 Background diversity .033 .21 -.073 .111 -.016 .066 -.227 -.1 -.307 -.285 -.178 -.311 -.199 -.082 24
25 Task interdependency -.169 -.086 -.198 -.017 -.223 -.098 -.222 .229 -.354 .005 .089 .343 .087 -.009 25
26 Aim interdepend. .349 .145 .326 .425 .322 .471 .419 .475 .38 .441 -.068 .008 -.218 .111 26
27 Cohesion .241 .172 .252 .25 .177 .164 .207 .417 .008 -.068 -.227 .195 -.258 -.123 27
28 Support for innovation .740** .642** .612** .672** .719** .739** .462 .709** .523* -.077 -.604* -.046 -.720** .681** 28
29 Participation safety .526* .562* .38 .536* .469 .636** .237 .431 .331 -.081 -.45 -.224 -.477 .606** 29
30 Vision .246 .511* .098 .257 .156 .451 -.091 .276 .067 -.266 -.338 -.013 -.191 .224 30
31 Task orientation .746** .643** .735** .713** .565* .733** .694** .743** .421 -.08 -.523* -.062 -.555* .335 31
32 Internal communications .089 .215 .105 .061 -.025 .245 .109 .25 -.004 -.035 -.062 .255 .036 .228 32
33 External comunication .560* .537* .509* .498* .463 .752** .447 .624** .351 .138 -.41 .105 -.457 .276 33
34 .425 .241 .403 .176 .569* .187 .253 .27 .441 -.162 -.473 .102 -.548* .059 34
35 .081 -.052 .183 .136 -.019 -.218 .109 .251 -.221 -.233 -.225 .142 -.124 -.499* 35
36 .411 .650** .22 .469 .292 .540* .046 .239 .226 -.381 -.396 -.386 -.283 .186 36
37 -.162 -.173 -.063 -.147 -.219 -.264 -.064 -.403 -.318 -.081 .039 -.334 .105 -.179 37
38 .454 .234 .513* .466 .344 .352 .508* .33 .328 .088 -.332 -.253 -.289 .157 38
39 .48 .514* .478 .245 .43 .541* .414 .416 .44 -.136 -.397 .202 -.34 .497* 39 Leadership - Secondary style
En
vir
on
men
t
Personal mastery
Team learning
Sistem thinking
Shared vision
Empowerment of leadership
Op
p.
Iden
tifi
cati
on Self perceived opportunity
BIG
BIE
Team-level predictors of innovation
Tea
m-l
ev
el
pred
icto
rs
of
inn
ov
ati
on
Inp
ut
Team
Pro
cess
Pearson correlations
Organizational learning
Org
an
izati
on
al
learn
ing
- 4
I
Intuiting
Interpreting
Integrating
Institutionalizing
Pro
-lea
rnin
gA
nti
-lea
rnin
g
Organizational learningO
rgan
izati
on
al
learn
ing
- 4
I
Pro
-lea
rnin
gA
nti
-lea
rnin
gB
IGB
IE
Institutionalizing
Integrating
Interpreting
Intuiting
Tea
m-l
ev
el
pred
icto
rs
of
inn
ov
ati
on
Team-level predictors of innovation
Self perceived opportunity
Team learning
Personal mastery
Leadership - Secondary style
Op
p.
Iden
tifi
cati
on
En
vir
on
men
tPearson correlations
Inp
ut
Team
Pro
cess
Empowerment of leadership
Shared vision
Sistem thinking
Table 4.3. Pearson correlations for sub-sections, constructs and frameworks.

Master Thesis Business, Management & Organization August 2019
15 16 17 18 19 20 21 22 23 24 25 26 27 28 29
1 1
2 2
3 3
4 4
5 5
6 Intuiting + 6
7 Interpreting + 7
8 Integrating + 8
9 Institutionalizing + 9
10 Intuiting - 10
11 Interpreting - 11
12 Integrating - 12
13 Institutionalizing - 13
14 14
15 BIG - Fluency 1 15
16 BIG - Flexibility .966** 1 16
17 BIG-Elaboration .899** .891** 1 17
18BIE Experienced
Entrepreneur.121 .217 .06 1 18
19 BIE Novice Entrepreneur .539* .586* .396 .414 1 19
20 .001 .059 -.019 .524* -.01 1 20
21 Team size -.169 -.086 -.265 .396 .069 .301 1 21
22 Team longevity -.25 -.365 -.336 -.587* -.572* -.483* -.386 1 22
23 Job diversity .135 .225 -.035 .468 .286 .647** .051 -.247 1 23
24 Background diversity -.136 -.097 .019 -.077 -.189 .024 -.48 .012 .027 1 24
25 Task interdependency .167 .048 .179 -.098 .034 -.118 -.547* .087 -.245 .086 1 25
26 Aim interdepend. .034 .028 -.029 .006 -.399 .429 .558* .072 .016 -.217 -.348 1 26
27 Cohesion .129 .1 .096 -.15 .105 .327 .228 -.158 .105 .015 -.306 .449 1 27
28 Support for innovation .045 -.016 .073 .323 -.146 .543* .173 -.265 -.095 -.153 .189 .383 .046 1 28
29 Participation safety .181 .167 .309 .416 -.019 .582* .189 -.446 -.014 -.171 .099 .34 .024 .823** 1 29
30 Vision -.156 -.146 .039 .204 -.292 .549* .002 -.305 -.036 .239 .267 .098 .109 .438 .587* 30
31 Task orientation .048 .038 -.018 .397 .054 .816** .459 -.433 .38 -.222 -.198 .584* .474 .695** .615** 31
32 Internal communication -.082 -.057 .026 .123 -.113 .465 .037 -.275 .105 -.345 .363 .094 -.216 .490* .486* 32
33 External comunication .063 .042 .088 .373 -.358 .565* .07 -.1 .103 .086 .335 .442 -.121 .726** .522* 33
34 -.258 -.305 -.308 .063 -.126 -.055 .061 .134 -.087 .089 -.139 -.05 .271 .178 -.222 34
35 -.017 -.046 -.091 -.062 .245 -.007 .155 -.156 .045 -.129 .222 -.04 .393 -.131 -.323 35
36 .289 .444 .363 .651** .357 .558* .189 -.687** .325 .169 .026 .091 -.04 .273 .529* 36
37 -.309 -.216 -.192 -.09 -.076 -.016 .009 .059 .184 .16 -.437 .042 -.084 -.217 -.106 37
38 .197 .171 .227 .23 .088 .057 .401 -.184 -.308 -.272 -.083 .229 -.165 .471 .512* 38
39 .106 .052 .065 .543* .197 .297 -.037 -.219 .092 -.29 .257 -.204 -.332 .653** .535* 39 Leadership - Secondary style
En
vir
on
men
t
Personal mastery
Team learning
Sistem thinking
Shared vision
Empowerment of leadership
Op
p. Id
enti
fica
tion Self perceived opportunity
BIG
BIE
Team-level predictors of innovation
Tea
m-l
ev
el
pred
icto
rs
of
inn
ov
ati
on
Inp
ut
Team
Pro
cess
Pearson correlations
Organizational learning
Org
an
izati
on
al
learn
ing
- 4
I
Intuiting
Interpreting
Integrating
Institutionalizing
Pro
-lea
rnin
gA
nti
-lea
rnin
g
Leadership - Secondary style
En
vir
on
men
t
Personal mastery
Team learning
Sistem thinking
Shared vision
Empowerment of leadership
Op
p. Id
enti
fica
tion Self perceived opportunity
BIG
BIE
Team-level predictors of innovation
Tea
m-l
ev
el
pred
icto
rs
of
inn
ov
ati
on
Inp
ut
Team
Pro
cess
Pearson correlations
Organizational learningO
rgan
izati
on
al
learn
ing
- 4
IIntuiting
Interpreting
Integrating
Institutionalizing
Pro
-lea
rnin
gA
nti
-lea
rnin
g
30 31 32 33 34 35 36 37 38 39
1
.242 1
.419 .334 1
.428 .478 .495* 1
-.14 .131 -.352 .13 1
-.194 .119 -.041 .008 .449 1
.464 .331 .29 .307 -.414 -.264 1
-.296 -.1 .047 -.188 -.207 -.129 -.129 1
.142 .266 .098 .229 -.126 -.249 .216 -.164 1
.247 .322 .452 .408 .116 -.297 .224 -.268 .393 1
Table 4.4. Continuation Pearson correlations for sub-sections, constructs and frameworks.
*Correlation is significant at the 0.05 level (2-tailed).
**Correlation is significant at the 0.01 level (2-tailed).
*Correlation is significant at the 0.05 level (2-tailed).
**Correlation is significant at the 0.01 level (2-tailed).
Master Thesis Business, Management & Organization August 2019
5. Conclusion
For the conclusion, first the sub questions will be answered, followed by the main research
question.
I. What is the relationship between variables of Opportunity identification and
Organizational learning?
For the teams evaluated, the variables that together comprehend opportunity
identification and Organizational learning showed strong relationships, especially
those in which teams that possess experienced entrepreneurs, and in which the
environment empowers leadership. Variables such as Business idea evaluation –
Experienced entrepreneur, have a clear connection with Intuiting (0.729**),
Interpreting (0.554*) and Integrating (0.492*). All subsections of organizational
learning, connecting the 4I framework section of exploitation. So there is an strong
possibility that teams, which possess experienced entrepreneurs will perform well
in exploitation.
Based on this research it can be concluded that teams which performed well in
organizational learning capabilities, together with the proper environment and
orientation, will perform in terms of exploration (He, 2012). higher than the mean,
which also showed better levels for opportunity identification proved to score
higher in most of the Team-level predictors of innovation, such as Support for
innovation (0.740**), Participation safety (0.526*) and Task orientation
(0.746**). This shows that the construct for this Team-level predictors of
innovation, is capable to potentiate, in some way Organizational learning and
opportunity identification.
Master Thesis Business, Management & Organization August 2019
II. How does Opportunity identification influence organizational AD?
The frameworks and its subsections used in this report were unsuccessful to
correlate or explain AD in any level. This indicates that the way of evaluating AD
might not be adequate, or some other explanatory variables should be included.
Main research question: What is the relationship between the variables responsible for
organizational AD?
The results on this report are not strong enough to answer the main reseach question,
because it lacks AD parameters based on perceived team AD. The team chosen as
ambidextrous, showed no direct indications of ambidexterity, and thus the modeling failed to
show significative results. However, this tool shows to be powerful to evaluate capacities
such as opportunity identification and Organizational learning individually.

Master Thesis Business, Management & Organization August 2019
6. Discussion
This report, which was design as a quantitative and qualitative research, attempted to design
controls in advance, to deal with both anticipated and unanticipated threats to validity. The
results and conclusions based on constructs here discussed, are not transposable or applicable
to all the organizations in the same segment, however, aims to present a clear methodology for
organizations to assess its opportunity identification competence, leadership, environment,
innovation and finally evaluate, in what extent can be considered a learning organization and
thus, an ambidextrous organization.
The teams included team Alpha, and most of the original targeted teams, however, clear
differences were not evident. So perform ambidexterity based on perception might not be
objective enough.
Frameworks based on online surveys are good tools to evaluate organizational learning and
opportunity identification within organizations, showing key points to improve. Each
framework is divided by categories, and if analyzed separately by the managers, improvements
can be achieved within teams, improving general organizational learning and opportunity
identification.
Organizational learning and opportunity identification have clear connections using Team-
level predictors of innovation and Environment assessment frameworks, this results are
consistent with the findings of previous findings of Widmer, Schippers, & West, (2009).
However, in the current report is not able to evaluate Leadership’s connection with
Organizational learning and Opportunity identification, however, might be interesting to test it
in other countries or fields, where Democratic leadership is not suited for the work performed,
i.e. the production section of the organization, where academic level is lower and innovation is

Master Thesis Business, Management & Organization August 2019
often not required. This shows that the construct for this framework is capable to predict, in
some way Organizational learning.

Master Thesis Business, Management & Organization August 2019
7. References
Andriopoulos, C., & Lewis, M. W. (2009). Exploitation-Exploration Tensions and
Organizational Ambidexterity: Managing Paradoxes of Innovation. Organization Science,
20(4), 696–717. https://doi.org/10.1287/orsc.1080.0406
Arbuckle, J. L. (2005). AmosTM 6.0 User’s Guide. In Book. https://doi.org/10.1002/jid.1717
Avolio, B. J., Zhu, W., Koh, W., & Bhatia, P. (2004). Transformational leadership and
organizational commitment: Mediating role of psychological empowerment and
moderating role of structural distance. Journal of Organizational Behavior, 25(8), 951–
968. https://doi.org/10.1002/job.283
Ayd, M. A. (2017). Determining Organizational Learning Capability : A Study in Private
Health Care Organizations Determining Organizational Learning Capability : A Study in
Private Health Care Organizations. International Journal of Research Foundation of
Hospital & Healthcare Administration, 5(December), 1–7. https://doi.org/10.5005/jp-
journals-10035-1069
Baggen, Y. (2017). Opportunity Identification Competence. Explaining Individual and
Exploring Team Opportunity Identification by Employees (Wageningen University and
research). https://doi.org/10.18174/393037
Baron, R. A., & Ensley, M. D. (2006). Opportunity Recognition as the Detection of Meaningful
Patterns: Evidence from Comparisons of Novice and Experienced Entrepreneurs.
Management Science, 52(9), 1331–1344. https://doi.org/10.1287/mnsc.1060.0538
Baxter, P., & Jack, S. (2008). The Qualitative Report Qualitative Case Study Methodology:
Study Design and Implementation for Novice Researchers. The Qualitative
Reportualitative Report.
Beckman, C. M., Eisenhardt, K., Kotha, S., Meyer, A., & Rajagopalan, N. (2012). The Role of
the Entrepreneur in Technology Entrepreneurship. Strategic Entrepreneurship Journal.
https://doi.org/10.1002/sej.1136
Bell, S. T., Brown, S. G., & Weiss, J. A. (2018). A conceptual framework for leveraging team
composition decisions to build human capital. Human Resource Management Review,
28(4), 450–463. https://doi.org/10.1016/J.HRMR.2017.06.003
Berson, Y., Nemanich, L. A., Waldman, D. A., Galvin, B. M., & Keller, R. T. (2006).
Leadership and organizational learning: A multiple levels perspective. Leadership
Quarterly, 17(6), 577–594. https://doi.org/10.1016/j.leaqua.2006.10.003
Blunch, N. J. (2017). Structural Equation Modeling with AMOS. In Introduction to Structural
Equation Modeling using IBM SPSS Statistics and AMOS.
https://doi.org/10.4135/9781526402257.n4
Bocaneanu, S. (2007). Assesment of organizational learning within teams. Retrieved from
https://files.eric.ed.gov/fulltext/EJ805090.pdf
Campbell, I. L. (1998). Transgenic mice and cytokine actions in the brain: bridging the gap
between structural and functional neuropathology1Published on the World Wide Web on
21 October 1997.1. Brain Research Reviews, 26(2–3), 327–336.
https://doi.org/10.1016/S0165-0173(97)00038-6
Cao, Q., Simsek, Z., & Zhang, H. (2010). Modelling the joint impact of the CEO and the TMT
on organizational ambidexterity. Journal of Management Studies, 47(7), 1272–1296.
https://doi.org/10.1111/j.1467-6486.2009.00877.x
Carroll, J. B., & Guilford, J. P. (1968). The Nature of Human Intelligence. American
Master Thesis Business, Management & Organization August 2019
Educational Research Journal, Vol. 5, p. 249. https://doi.org/10.2307/1161820
Chen, Y. (2017). Dynamic ambidexterity: How innovators manage exploration and
exploitation. Business Horizons, 60(3), 385–394.
https://doi.org/10.1016/J.BUSHOR.2017.01.001
Chiva, R., Alegre, J., & Lapiedra, R. (2007). Measuring organisational learning capability
among the workforce. International Journal of Manpower, 28(3–4), 224–242.
https://doi.org/10.1108/01437720710755227
Coffey, A., & Atkinson, P. (1996). Concepts and coding. In Making Sense of Qualitative Data.
Crossan, M. M., Lane, H. W., & White, R. E. (1999). An organizational learning framework:
From intuition to institution. Academy of Management Review, 24(3), 522–537.
https://doi.org/10.5465/AMR.1999.2202135
Dansereau, F., Seitz, S. R., Chiu, C. Y., Shaughnessy, B., & Yammarino, F. J. (2013). What
makes leadership, leadership? Using self-expansion theory to integrate traditional and
contemporary approaches. Leadership Quarterly, 24(6), 798–821.
https://doi.org/10.1016/j.leaqua.2013.10.008
Duncan, R. B. (1976). The ambidextrous organization: Designing dual structures for
innovation. The Management of Organization Design - Strategies and Implementation,
167–189. Retrieved from
http://scholar.google.com/scholar?hl=en&btnG=Search&q=intitle:the+ambidextrous+org
anization:+Desining+dual+structures+for+innovation#0
Dutta, D. K., & Crossan, M. M. (2005). The nature of entrepreneurial Opportunities:
Understanding the process using the 4I organizational learning framework.
Entrepreneurship: Theory and Practice. https://doi.org/10.1111/j.1540-
6520.2005.00092.x
Edmondson, A. C., & Harvey, J.-F. (2018). Cross-boundary teaming for innovation: Integrating
research on teams and knowledge in organizations. Human Resource Management
Review, 28(4), 347–360. https://doi.org/10.1016/J.HRMR.2017.03.002
Garvin, D. A. (1993). Building a Learning Organization. Retrieved from www.hbr.org
He, Z. (2012). Science Organization Exploration vs . Exploitation : An Empirical Test of the
Ambidexterity Hypothesis. Organization Science.
Hébert, R. F., & Link, A. N. (2006). The entrepreneur as innovator. Journal of Technology
Transfer. https://doi.org/10.1007/s10961-006-9060-5
Hodgetts, R. M., Luthans, F., & M. Lee, S. (1994). New paradigm organizations: From total
quality to learning to world-class. Organizational Dynamics, 22(3), 5–19.
https://doi.org/10.1016/0090-2616(94)90044-2
Hülsheger, U. R., Anderson, N., & Salgado, J. F. (2009). Team-Level Predictors of Innovation
at Work: A Comprehensive Meta-Analysis Spanning Three Decades of Research. Journal
of Applied Psychology, 94(5), 1128–1145. https://doi.org/10.1037/a0015978
International Standard Classification of Occupations (ISCO). (2014). In Encyclopedia of
Quality of Life and Well-Being Research. https://doi.org/10.1007/978-94-007-0753-
5_102084
Jansen, J. J. P., Tempelaar, M. P., van den Bosch, F. A. J., & Volberda, H. W. (2009). Structural
Differentiation and Ambidexterity: The Mediating Role of Integration Mechanisms.
Organization Science, 20(4), 797–811. Retrieved from
http://www.jstor.org.ezproxy.library.wur.nl/stable/25614693
Johnson, G., Whittington, R., Scholes, K., Angwin, D., & Regnér, P. (2018). Strategy in action.
In Fundamentals of strategy (4th editio, pp. 208–215). London: Pearson Education
Master Thesis Business, Management & Organization August 2019
Limited.
Judge, T. A., & Piccol, R. F. (2004). Transformational and transactional leadership: A meta-
analytic test of their relative validity. Journal of Applied Psychology, 89(5), 755–768.
https://doi.org/10.1037/0021-9010.89.5.755
Keller, T., & Weibler, J. (2015). What it takes and costs to be an ambidextrous manager:
Linking leadership and cognitive strain to balancing exploration and exploitation. Journal
of Leadership & Organizational Studies, 22(1), 54–71.
https://doi.org/10.1177/1548051814524598
Kitapçi, H., & Çelik, V. (2013). Ambidexterity and Firm Productivity Performance: The
Mediating Effect of Organizational Learning Capacity. Procedia - Social and Behavioral
Sciences, 99, 1105–1113. https://doi.org/10.1016/j.sbspro.2013.10.584
Körner, M., Wirtz, M. A., Bengel, J., & Göritz, A. S. (2015). Relationship of organizational
culture, teamwork and job satisfaction in interprofessional teams. BMC Health Services
Research. https://doi.org/10.1186/s12913-015-0888-y
Leufvén, M., Vitrakoti, R., Bergström, A., Ashish, K. C., & Målqvist, M. (2015). Dimensions
of Learning Organizations Questionnaire (DLOQ) in a low-resource health care setting in
Nepal. Health Research Policy and Systems, 13(1), 6. https://doi.org/10.1186/1478-4505-
13-6
Lis, A., Tomanek, M., & Gulak-lipka, P. (2018). The Concept of the Ambidextrous
Organization: Systematic Literature Review. International Journal of Contemporary
Management, 17(1), 77–97. https://doi.org/10.4467/24498939ijcm.18.005.8384
Lumpkin, G. T., & Lichtenstein, B. B. (2005). The Role of Organisational Learning in the
Opportunity Recognition Process. 555–575.
Manuscript, A., & Study, Q. (2013). Qualitative Study. Designing a Qualitative Study.
https://doi.org/10.1007/s10461-014-0839-3.HIV
Offermann, L. R., & Coats, M. R. (2018). Implicit theories of leadership: Stability and change
over two decades. The Leadership Quarterly, 29(4), 513–522.
https://doi.org/10.1016/J.LEAQUA.2017.12.003
Ojha, D., Acharya, C., & Cooper, D. (2018). Transformational leadership and supply chain
ambidexterity: Mediating role of supply chain organizational learning and moderating role
of uncertainty. International Journal of Production Economics, 197, 215–231.
https://doi.org/10.1016/J.IJPE.2018.01.001
Pertusa-Ortega, E. M., & Molina-Azorín, J. F. (2018). A joint analysis of determinants and
performance consequences of ambidexterity. Cuadernos de Economía y Dirección de La
Empresa, 21, 84–98. https://doi.org/10.1016/j.brq.2018.03.001
Pervaiz K., A., Ann Y. E., L., & Mohamed, Z. (2009). Total Quality Management (10th ed.).
Retrieved from https://doi.org/10.1080/0954412997361
Premex, nutrition for the agricultural industry. (2018). Retrieved September 24, 2018, from
https://www.premex.co/en/company
Raisch, S., & Birkinshaw, J. (2008). Organizational Ambidexterity: Antecedents, Outcomes,
and Moderators †. https://doi.org/10.1177/0149206308316058
Saadat, V., & Saadat, Z. (2016). Organizational Learning as a Key Role of Organizational
Success. Procedia - Social and Behavioral Sciences, 230, 219–225.
https://doi.org/10.1016/j.sbspro.2016.09.028
Senge, P. M. (1990). The fifth discipline. Retrieved from
http://kmcenter.rid.go.th/kmc08/km_59/manual_59/Book6/The-Fifth-Discipline.pdf
Taghipour, A., & Dejban, R. (2013). Job Performance: Mediate Mechanism of Work
Master Thesis Business, Management & Organization August 2019
Motivation. Procedia - Social and Behavioral Sciences.
https://doi.org/10.1016/j.sbspro.2013.06.796
Venkataraman, S. (2000). Shane and Venkataraman 2000. In Academy ol Managemenl fleview
(Vol. 25). Retrieved from
https://entrepreneurscommunicate.pbworks.com/f/Shane%2520%252B%2520Venkat%2
520-%2520Ent%2520as%2520field.pdf
Walker, J. P. (2017). Design , Learn , Repeat : Architecture to Promote Learning Organization
Behavior (University of Cincinnati). Retrieved from
https://etd.ohiolink.edu/pg_10?0::NO:10:P10_ACCESSION_NUM:ucin1490701852171
284
Widmer, P. ., Schippers, M. ., & West, M. (2009). Recent developments in reflexivity research:
A review. In Psychology of Everyday Activity (Vol. 2). Retrieved from
http://eprints.lancs.ac.uk/53195/
Yang, C. C. (2016). Leveraging logistics learning capability to enable logistics service
capabilities and performance for international distribution center operators in Taiwan.
International Journal of Logistics Management, 27(2), 284–308.
https://doi.org/10.1108/IJLM-09-2014-0157